Embed Size (px)
Citation preview

Author's personal copy
Rainfall and cloud-water interception in tropical montane
forests in the eastern Andes of Central Peru
Daniel Gomez-Peralta a,*, Steven F. Oberbauer a,b,Michael E. McClain c, Thomas E. Philippi a
a Department of Biological Sciences, Florida International University, 11200 SW 8th Street, Miami, FL 33199, USAb Fairchild Tropical Botanic Garden, 11935 Old Cutler Road, Miami, FL 33156, USA
c Department of Environmental Studies, Florida International University, Miami, FL 33199, USA
Received 28 June 2006; received in revised form 9 October 2007; accepted 20 October 2007
Abstract
Cloud-water and rainfall interception are hydrological processes of particular interest in Tropical Montane Cloud Forests (TMCF). Studies in
these systems have shown important contributions of cloud/fog water to the hydrological balance. To evaluate the importance of cloud/fog water to
montane forests of the western slope of the Cordillera Yanachaga in the eastern Andes of central Peru, we monitored bulk precipitation (gross
rainfall), cloud water and net precipitation weekly over one year at two elevations, 2468 and 2815 masl. Bulk precipitation was greater at the upper
site (2753 mm) than at the lower site (2222 mm). Annual net precipitation was 92.4% and 70.4% of rainfall at the upper and lower sites,
respectively. Net precipitation was primarily composed of throughfall; stemflow was negligible, contributing less than 0.2% of annual rainfall at
both sites. Apparent annual rainfall interception losses by the canopy were 7.7% and 29.6% of the bulk precipitation at the upper and lower sites,
respectively. Apparent weekly rainfall interception at the upper site was sometimes negative and lower compared to that of the lower site. Apparent
cloud-water interception occurred at least during weeks when negative rainfall interception was recorded, a contribution of 21 mm (0.8% of the
annual rainfall) at the upper site. However, the apparent low rainfall interception losses at the upper site suggest that canopy wetting and subsequent
saturation by cloud/fog water during periods with apparent positive rainfall interception may have contributed a difference of ca. 22% of apparent
rainfall interception losses between sites. These contributions were supported by maximum apparent fog interception recorded by a fog gauge at
the upper site. Although other equally important factors like topography, crown exposure and mossiness were not evaluated, the quantity of
apparent fog interception at the upper site was found related to the canopy leaf area index. This important relationship has been previously
described but mostly overlooked in studies of TMCF.
# 2007 Elsevier B.V. All rights reserved.
Keywords: Cloud-water interception; Rainfall interception; Fog; Tropical montane cloud forests; Tropical montane forests; Cordillera Yanachaga; Peru
1. Introduction
Tropical Montane Cloud Forests (TMCF) occur in humid
tropical upland areas with rugged topography where cloud belts
originating from moist ascending air masses frequently form
fog or mist (Stadtmuller, 1987; Zadroga, 1981). The average
annual rainfall is generally above 2500 mm and humidity
remains near the saturation point (Zadroga, 1981).
TMCF are some of the most endangered and rapidly
disappearing ecosystems as a result of human activities and
climate shifts (Bubb et al., 2004). Conversion of forests to
grazing and agricultural lands and climate warming are among
the strongest pressures affecting TMCF. Considered extremely
fragile ecosystems, the annual deforestation rate in TMCF is
estimated to be at least 1.1% (Doumenge et al., 1995).
Furthermore, the microclimate and hydrology of TMCF can be
negatively affected by global climate change and adjacent
lowland deforestation, which reduce moisture input and
interception of cloud water (Foster, 2001; Lawton et al.,
2001; Loope and Giambelluca, 1998; Nair et al., 2003; Still
et al., 1999). Negative impacts of climate change in TMCF have
already been found among species of epiphytic plants,
amphibians, and bats (La Val, 2004; Lips, 1998; Pounds
et al., 2006; Pounds and Crump, 1994; Pounds et al., 1999).
Consequently, monitoring of TMCF for climate shifts and
changes of indicator species is a high priority.
www.elsevier.com/locate/foreco
Available online at www.sciencedirect.com
Forest Ecology and Management 255 (2008) 1315–1325
* Corresponding author. Tel.: +1 305 348 6047; fax: +1 305 348 1986.
E-mail address: [email protected] (D. Gomez-Peralta).
0378-1127/$ – see front matter # 2007 Elsevier B.V. All rights reserved.
doi:10.1016/j.foreco.2007.10.058
Author's personal copy
The hydrology of TMCF has been of particular recent
interest, initiated by the work of Zadroga (1981). Zadroga
(1981) found a contrast in runoff coefficients of catchments
with and without cloud-water interception, defined as the
movement of cloud or fog water on the surfaces of tree leaves,
stems and epiphytes by direct contact of the water droplets and
subsequent dripping (Bruijnzeel and Proctor, 1995; Doumenge
et al., 1995). Studies have shown that this input of cloud water
significantly enhances the net precipitation beyond rainfall,
possibly adding from two percent to as much as 154% of annual
rainfall (Bruijnzeel, 2001, 2005; Bruijnzeel and Proctor, 1995).
Stadtmuller (1987) included this additional water input in
his definition of cloud forests. However, it is uncertain if all
cloud forests, in the broad sense, receive significant cloud-
water input. To better understand the role of cloud-water
interception in cloud forest hydrology, case studies are
necessary across a series of TMCF, where the different types
of precipitation (gross and net), rainfall interception, and cloud
water are quantified, allowing an accurate calculation of the
quantity of cloud-water interception. Because cloud-water
interception may depend on forest structure, as well as crown
exposure to wind and fog, it should be quantified along with the
components of precipitation.
In Peru, TMCF areas are located within the eastern slopes of
the Andes (a region also known as Andean Amazon), the semi-
isolated mountain ranges east of the Andes, and some areas of
the Andean western slopes (Leo, 1995; Young and Leon, 1995).
Therefore, the term Andean cloud forests has also been used
(Gentry, 1993). In central Peru, the forests of the cordillera
Yanachaga from 2000 to 3900 m have been mapped as cloud
forests (translation of bosques de neblina, from original
classification by Drewes, cited and modified by Brack (1987)).
Given its description, such classification seems to be based on
qualitative forest and climate observational appearance
(‘‘cloudy, mossy, and rainy’’), and in some ways lacks
geographic detail and hydrologic definitions. Even with those
aforementioned drawbacks, Brack’s review (1987) still remains
as the only comprehensive document of the cordillera
Yanachaga, despite its administrative origins rather than
scientific.
The present study offers a further insight in the unknown local
forest hydrology of the cordillera Yanachaga. Our objectives
were to quantify the importance of cloud water as an additional
input of water to the forest, and to quantify the importance of
forest structure on the capture of cloud water in the TMCF of the
cordillera Yanachaga in central Peru, using correlation and
regression analyses as major tools. We hypothesized that:
(1) cloud-water interception provides significant water input to
the cloud forest of the Cordillera Yanachaga,
(2) forest structure affects how much cloud water is inter-
cepted.
2. Methods
2.1. Study site
The study was conducted at Yanachaga-Chemillen National
Park in central Peru, which protects a semi-isolated mountain
range known as the Cordillera Yanachaga (Fig. 1). This
cordillera follows a Northwest-Southeast orientation within the
western Amazon River Basin (Brack, 1987). It has also been
classified as one of the eastern cordilleras of the larger Andes
complex (Brack, 1992; Young, 1991, 1992).
Two study sites were established on the western (leeward)
slope near the crest of the Cordillera Yanachaga at 2815 (upper
Fig. 1. (a) Location of study area in central Peru. Adapted from: Bubb et al. (2004) and Young (1991). (b) Location of sample points within the two elevation sites
(50 m-contour intervals).
D. Gomez-Peralta et al. / Forest Ecology and Management 255 (2008) 1315–13251316
Author's personal copy
site) and 2468 (lower site) masl, corresponding to the forest
types lower montane cloud forest and lower montane rain
forest, respectively (data from this study was used to distinguish
forest types, following classification by Bruijnzeel (2001,
2005)). Diversity of tree species found in the area was 156
spp. ha�1 (dbh � 10 cm, elevation 2450 m (Gomez-Peralta,
2000)). Tree height averaged 14.3 m � 3.7 and 15.5 m � 2.8,
at the upper and lower sites, respectively (n = 20 at each site,
data from this study). Although moss was a conspicuous feature
at both elevations, it appeared to be more prominent at the upper
site (personal obs., D. Gomez-Peralta).
Long-term climatic data were only available from a
meteorological station 13 km west of the study sites at
1800 masl, with annual rainfall averaging 1452 mm (range
from 986 to 1961 mm, from 1963 to 2001). May through
September are markedly drier than the remaining months and
mean temperatures are 10–19 8C, with higher values during the
wet season (Saunders, 2004). The geology of the area is poorly
studied, classified as sedimentary, Paleozoic (Permian-Carbo-
niferous) rocks (Brack, 1987). Hillslopes are generally steep
and unstable, with slopes of 45–908, and soil profiles have a
thick 10–50 cm O-horizon followed by B and C horizons
(Saunders, 2004).
2.2. Rainfall and apparent cloud-water interception
Bulk precipitation, net precipitation and fog-water inputs
were measured at both study sites. Cleared areas provided
sufficient space adjacent to the forest to record gross rainfall
(bulk precipitation). One Tru-Chek manual rain gauge (orifice
size 36.29 cm2, Edwards Manufacturing Co., Albert Lea, MN)
was placed on each open area at approx. 1 m above the ground.
Twenty throughfall and 20 stemflow collectors were placed at
each study site under randomly chosen trees along a fixed
elevation (Fig. 1). Creeks and tree gaps were avoided,
consequently, throughfall is likely underestimated at the stand
level. Throughfall gauges consisted of U-shaped troughs, 1.15 m
long and 10 cm wide, made of split PVC pipes. The troughs were
positioned 308 above the horizontal level, therefore having a
surface area of 0.1 m2, draining into 18.9-l water containers.
Additional throughfall gauges were also positioned within the
open areas to account for splash loss (see data analysis).
Stemflow collectors were gutter-like custom-made plastic collars
attached at approximately 1.30 m above ground level around the
trunk of individual trees and connected to 7.6-l water containers.
Leakage was prevented by scratching the stem bark and
tightening the collars with plastic wrap. Cumulative water input
from each collector and gauge was recorded weekly between 29
July 2003 and 10 August 2004 (54 weeks).
Rainfall interception was calculated as the difference
between bulk and net precipitation, as follows:
rainfall interception
¼ bulk precipitation� ðthroughfallþ stemflowÞ; (1)
where throughfall and stemflow are the components of net
precipitation. Given the admixture of cloud water during
periods of low and negative rainfall interception, the term
‘‘apparent rainfall interception’’ will be preferably used
throughout this study.
Fog-water inputs were estimated within each open area
using an open-ended fog catcher placed above an electronic
tipping-bucket rain gauge (330 cm2 orifice, 0.25 mm per tip,
Rainwise1 Inc., Bar Harbor, ME), which recorded the total
weekly amount of water input using a digital tip counter. These
gauges collected both rainfall and cloud water. The fog catchers
were made of nylon harp cylinders adapted from the design of
Gonzalez (2000). Harp cylinders were 20 cm in diameter and
40 cm tall, employing 0.5 mm diameter vertically strung nylon
that provided a surface interception area of 2327 and 2426 cm2
for the upper and lower study sites, respectively. Electronic
gauges were calibrated with the Tru-Chek gauges before
installation. Differences of water volume between the paired
gauges (tipping-bucket and manual gauges) were divided by the
harp cylinders interception area to give precipitation depth
amounts contributed by clouds. Because the surface area of the
harp cylinders only represent an index of the fog-trapping
ability of the canopy, the term ‘‘apparent fog-water inputs’’ will
be used throughout this study. Fog water was measured during
36 and 35 weeks for the upper and lower elevation sites,
respectively, out of the total 54-week sampling period.
Malfunctioning of equipment prevented fog-water measure-
ments during the remaining weeks.
2.3. Canopy openness and leaf area index
To estimate leaf area index (LAI, the ratio of the total one-
sided leaf area to the projected ground area, Parker, 1995), and
percent canopy openness, hemispherical photos were taken
directly upwards above throughfall and stemflow collectors,
using Nikon 950 and 4500 Coolpix digital cameras and a Nikon
FC-E8 fisheye lens adapter (Nikon USA, Melville, NY). The
images were then downloaded and imported into the program
Gap Light Analyzer (GLA) v. 2.0 (Frazer et al., 1999), to
compute 4-ring LAI and percent canopy openness for the entire
hemispherical views (openness1808). A second analysis of the
fish-eye photos was conducted considering only the projected
area directly above the throughfall collectors. The images were
divided into 108-zenith regions (from 08 to 908) and the central
308-zenith region was re-analyzed with GLA to compute
percent canopy openness (openness308).
2.4. Data analysis
Precipitation recorded by the throughfall collectors placed in
open areas was used to account for weekly splash water losses
by the collectors placed beneath the forest canopy. At the upper
site, during a 7-week period, open-site throughfall trough and
rain gauge weekly recordings were plotted and linearly
regressed as follows:
throughfall collector ðmmÞ ¼ 0:90 rain gauge ðmmÞ;
R2 ¼ 0:99:(1)
D. Gomez-Peralta et al. / Forest Ecology and Management 255 (2008) 1315–1325 1317

Author's personal copy
At the lower site, during a 26-week period, the regression
equation was as follows:
throughfall collector ðmmÞ ¼ 0:94 rain gauge ðmmÞ;
R2 ¼ 0:99:(2)
Hence, recordings from throughfall collectors were corrected
by dividing by 0.90 and 0.94 for the upper and lower sites,
respectively. It is acknowledged that throughfall drops have
higher kinetic energy than rainfall, therefore these corrections
may not fully account for throughfall splash losses. Hall and
Calder (1993) noted that throughfall drops and their subsequent
impact-splash effects differ among tree species. However, we
assume species-dependent splash losses had little effect on the
results of this study.
Monthly rainfall regimes were classified following Richards
(1996). Months recording less than 100 mm were considered
dry; months recording 100–200 mm were considered wet,
whereas months recording more than 200 mm were classified as
very wet.
Absolute amounts and percentages of annual bulk pre-
cipitation, throughfall, stemflow, and apparent rainfall inter-
ception totals were calculated for each site. Linear regressions
were used to evaluate the relationships between weekly
apparent fog interception and apparent rainfall interception
and between weekly bulk precipitation against throughfall,
stemflow, weekly apparent rainfall interception, and percentage
of apparent rainfall interception.
3. Results
3.1. Total rainfall
Over the 54-week observation period, open site bulk
precipitation totals were 2753 mm and 2222 mm at the upper
and lower elevation sites, respectively. A distinctive very wet
season was observed at both elevations from December through
March. At the upper site, all the remaining months were wet
(above 100 mm). At the lower site, wet months were observed
in May–August and November; dry months occurred in
September, October, and April (Fig. 2a). Weekly bulk
precipitation was greater at the upper site during 91% of the
sample weeks (Fig. 2b). Weekly rainfall ranged from 0 to
154 mm at the upper site, and from 0 to 130 mm at the lower
site. At both sites, the greatest weekly amounts occurred from
December to March.
3.2. Apparent fog-water inputs (fog catcher)
At the upper site, apparent fog-water inputs were evaluated
during 36 weeks. Apparent fog-water input values were found
for all 36 weeks, and amounted to 221.0 mm when normalized
by the surface area of the harp cylinder. Absolute (non-
normalized) quantities of fog-water inputs were sometimes
much greater than bulk precipitation; for example, during the
weeks of August 26th and September 2nd, 2003, bulk
precipitation totaled 19 and 3 mm, whereas fog-water catches
Fig. 2. (a) Monthly rainfall during study period at upper and lower study sites
(vertical bars), and long-term average records of rainfall and temperature
(1963–2001) from Ordonez (2001). Thresholds of dry, wet, and very wet
months are indicated. (b) Weekly variation in rainfall at upper and lower study
sites during August 2003–August 2004.
Fig. 3. Weekly rainfall and fog-water inputs: (a) upper site, (b) lower site.
D. Gomez-Peralta et al. / Forest Ecology and Management 255 (2008) 1315–13251318

Author's personal copy
were 29 and 64 mm, respectively. This can be interpreted as a
good evidence of fog inputs above bulk precipitation at the
upper site (Fig. 3a). Apparent fog-water inputs were evaluated
during 35 weeks at the lower elevation site (Fig. 3b). During 19
weeks the rain gauge with the fog catcher collected less water
than the rain gauge due to the fog catcher’s interference with the
normal collection of rainfall. Fog water during the remaining 16
weeks was slightly above bulk precipitation. Weekly bulk
precipitation was linearly related to apparent fog-water inputs
at the upper site (R2 = 0.40, F1,36 = 23.0, P < 0.0001, Fig. 4),
but not at the lower site (R2 = 0.004, F1,35 = 0.139, n.s.).
3.3. Net precipitation (throughfall and stemflow)
At the upper site, average total annual net precipitation was
2542 mm (92.4% of bulk precipitation). At this site, avera-
ge � standard deviation total throughfall was 2540 � 562 mm
(92.3%) and stemflow was 2.1 � 2 mm (0.08%, Table 1). At the
lower site, average total annual net precipitation was 1564 mm
(70.4%), composed of 1561 � 401 mm (70.3%) of throughfall
and 3.3� 4.8 mm (0.15%) of stemflow (Table 1). Both annual
net precipitation amounts and percentages were significantly
greater at the upper site than at the lower site (t38 = 6.34 and
t38 = 3.61, respectively, P < 0.001).
Weekly variation in throughfall and stemflow followed
similar patterns to that of bulk precipitation at both sites
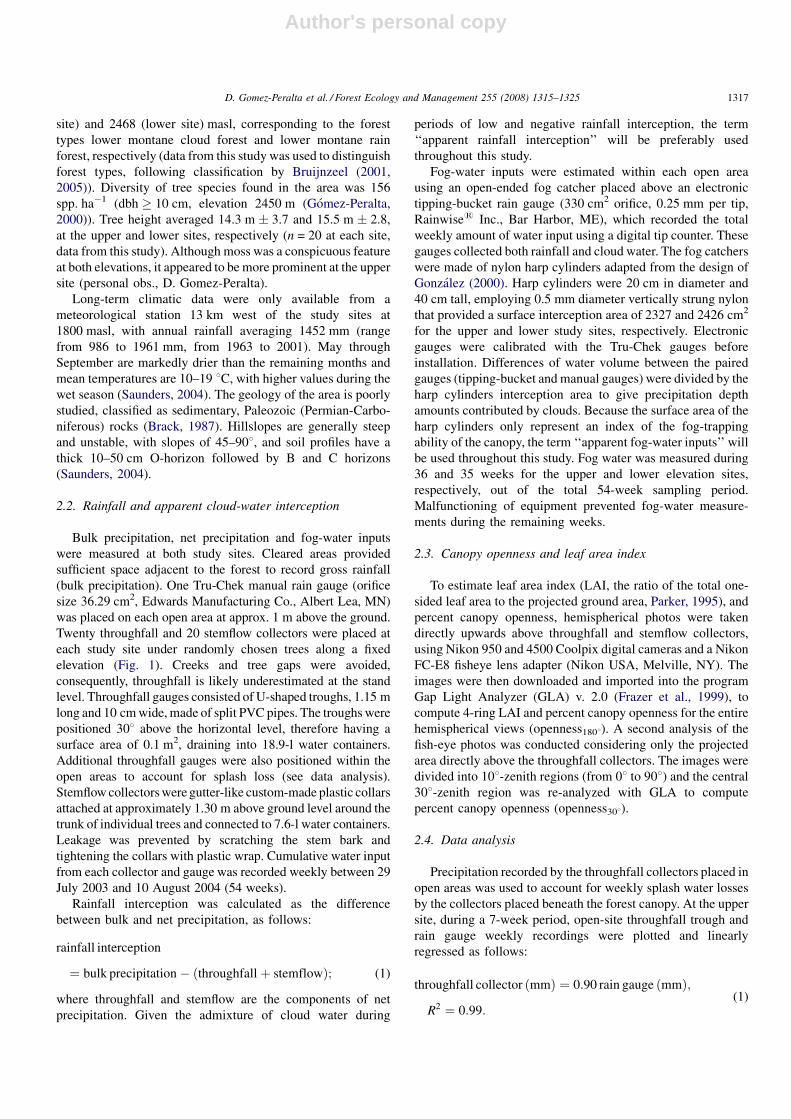
(Fig. 5). Bulk precipitation was strongly related with through-
fall at both the upper (R2 = 0.99) and lower (R2 = 0.98) sites
(Fig. 6a). At the upper site, R2 values for individual throughfall
collectors averaged 0.94 and slopes averaged 1.01 � 0.21
(mean � standard deviation); 11 of 20 collectors had regression
slopes greater than 1.0. At the lower site, regression R2 values
averaged 0.95 and slopes were 0.82 � 0.19. Five of 20
collectors had regression slopes greater than 1.0, indicating
greater throughfall than bulk precipitation.
Mean weekly throughfall averaged 47 mm per collector
(CV = 0.22) at the upper site, and 29 mm per collector
(CV = 0.26) at the lower site. Weekly frequency of throughfall
exceeding bulk precipitation averaged 17 weeks per collector
(31% of events, CV = 0.72) at the upper site, and 5 weeks per
collector (9% of events, CV = 1.13) at the lower site.
The relationships between bulk precipitation and overall
stemflow were also strong at both upper (R2 = 0.88) and
lower (R2 = 0.84) sites (Fig. 6b). Linear regressions for
individual stemflow collectors showed a very small
contribution 0.001 � 0.001 mm of stemflow for every mm
of bulk precipitation at the upper site. At the lower site, those
Fig. 4. Relationship between weekly bulk precipitation and fog-water inputs at
upper site.
Fig. 5. Weekly distribution of bulk precipitation, throughfall, and stemflow. (a)
Upper site, (b) lower site.
Table 1
Calculated annual water balance for the two working sites
Working site (elevation) Bulk
precipitation
Throughfall Stemflow Rainfall
interception
mm % mm % CV (%) mm % CV (%) mm %
Upper (2815 m) 2753 100 2540 � 562 92.3 22.1 2.1 � 2.0 0.08 93.3 211 7.7
Lower (2468 m) 2222 100 1561 � 401 70.3 25.7 3.3 � 4.8 0.15 142.1 658 29.6
Percentages are relative to bulk precipitation. Throughfall and stemflow averages �1 S.D.
D. Gomez-Peralta et al. / Forest Ecology and Management 255 (2008) 1315–1325 1319
Author's personal copy
contributions were slightly greater, 0.002 � 0.003 mm. This
indicates not only very small contributions from stemflow to
net precipitation, but also high variability, especially at the
lower site.
3.4. Apparent canopy rainfall interception
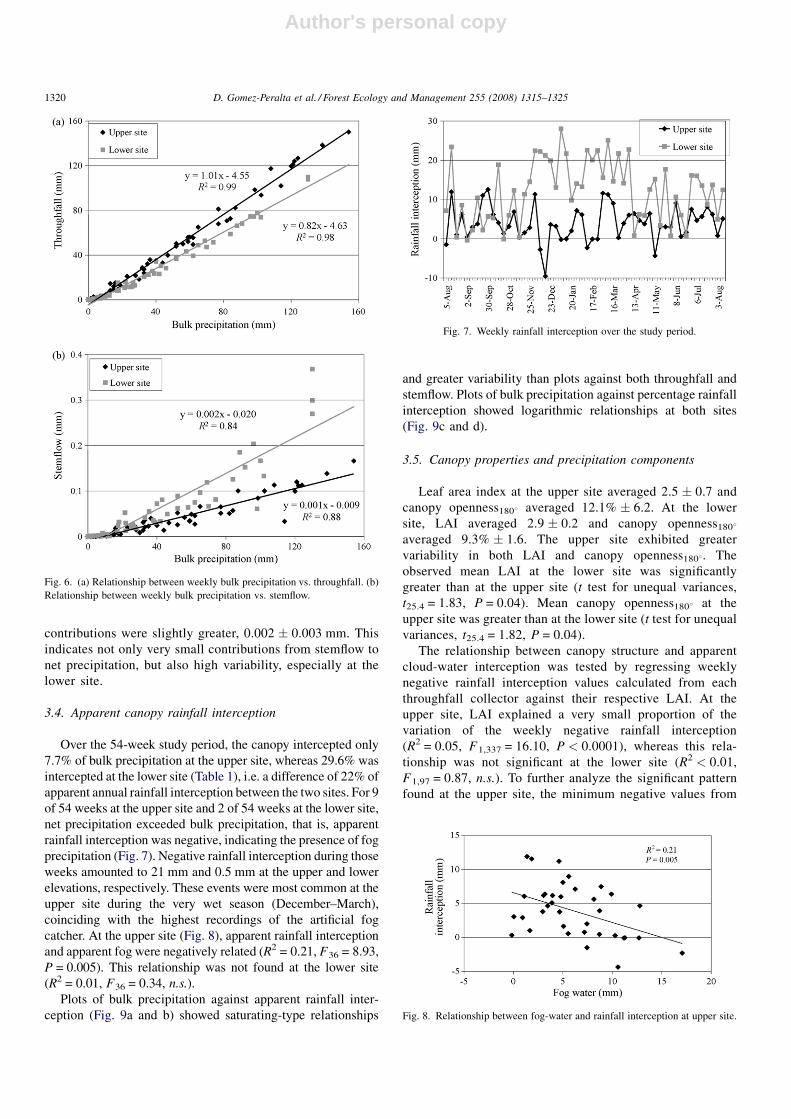
Over the 54-week study period, the canopy intercepted only
7.7% of bulk precipitation at the upper site, whereas 29.6% was
intercepted at the lower site (Table 1), i.e. a difference of 22% of
apparent annual rainfall interception between the two sites. For 9
of 54 weeks at the upper site and 2 of 54 weeks at the lower site,
net precipitation exceeded bulk precipitation, that is, apparent
rainfall interception was negative, indicating the presence of fog
precipitation (Fig. 7). Negative rainfall interception during those
weeks amounted to 21 mm and 0.5 mm at the upper and lower
elevations, respectively. These events were most common at the
upper site during the very wet season (December–March),
coinciding with the highest recordings of the artificial fog
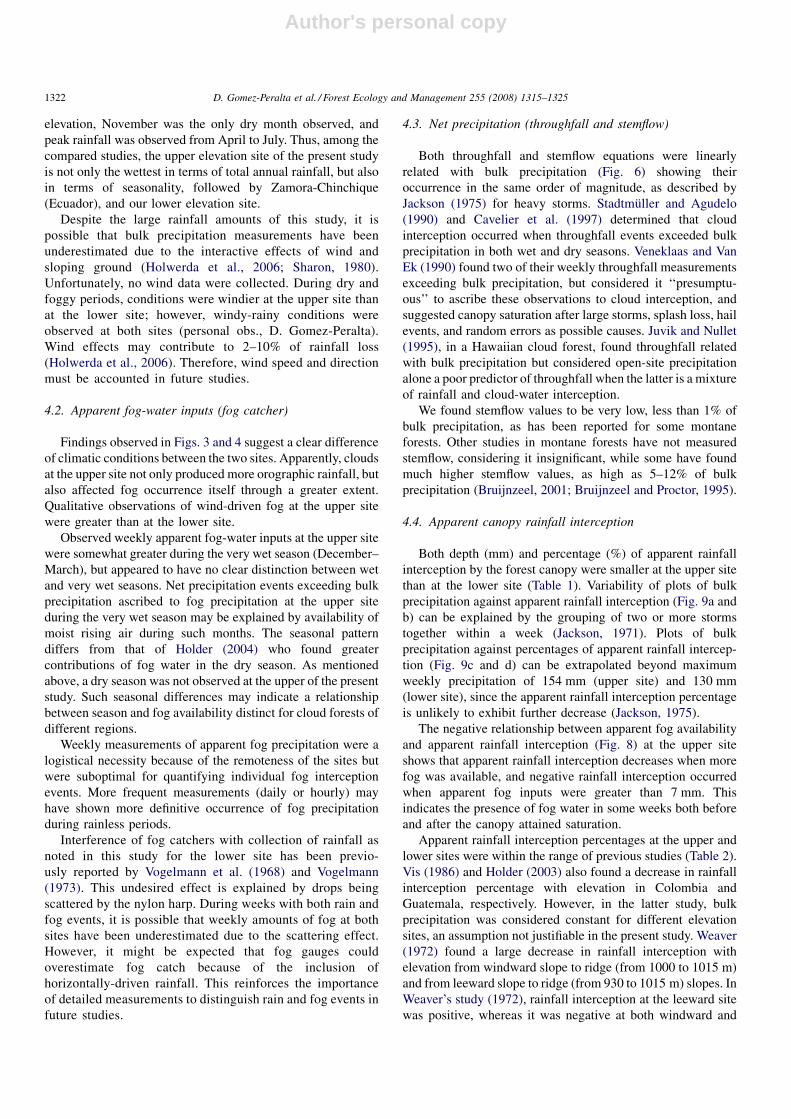
catcher. At the upper site (Fig. 8), apparent rainfall interception
and apparent fog were negatively related (R2 = 0.21, F36 = 8.93,
P = 0.005). This relationship was not found at the lower site
(R2 = 0.01, F36 = 0.34, n.s.).
Plots of bulk precipitation against apparent rainfall inter-
ception (Fig. 9a and b) showed saturating-type relationships
and greater variability than plots against both throughfall and
stemflow. Plots of bulk precipitation against percentage rainfall
interception showed logarithmic relationships at both sites
(Fig. 9c and d).
3.5. Canopy properties and precipitation components
Leaf area index at the upper site averaged 2.5 � 0.7 and
canopy openness1808 averaged 12.1% � 6.2. At the lower
site, LAI averaged 2.9 � 0.2 and canopy openness1808
averaged 9.3% � 1.6. The upper site exhibited greater
variability in both LAI and canopy openness1808. The
observed mean LAI at the lower site was significantly
greater than at the upper site (t test for unequal variances,
t25.4 = 1.83, P = 0.04). Mean canopy openness1808 at the
upper site was greater than at the lower site (t test for unequal
variances, t25.4 = 1.82, P = 0.04).
The relationship between canopy structure and apparent
cloud-water interception was tested by regressing weekly
negative rainfall interception values calculated from each
throughfall collector against their respective LAI. At the
upper site, LAI explained a very small proportion of the
variation of the weekly negative rainfall interception
(R2 = 0.05, F1,337 = 16.10, P < 0.0001), whereas this rela-
tionship was not significant at the lower site (R2 < 0.01,
F1,97 = 0.87, n.s.). To further analyze the significant pattern
found at the upper site, the minimum negative values from
Fig. 6. (a) Relationship between weekly bulk precipitation vs. throughfall. (b)
Relationship between weekly bulk precipitation vs. stemflow.
Fig. 7. Weekly rainfall interception over the study period.
Fig. 8. Relationship between fog-water and rainfall interception at upper site.
D. Gomez-Peralta et al. / Forest Ecology and Management 255 (2008) 1315–13251320

Author's personal copy
each throughfall collector (as a surrogate of maximum
amount of intercepted fog) were plotted against their
respective LAI (Fig. 10), explaining much more variation
in apparent interception (R2 = 0.43, F1,17 = 11.5, P = 0.004).
4. Discussion
4.1. Total rainfall
Total annual rainfall and net precipitation increased with
elevation on the western slope of the Cordillera Yanachaga.
Monthly precipitation totals at both sites were much greater
than the existing long-term records at 1800 masl (Fig. 2a). Dry
months were almost nonexistent at both elevations with peak
rainfall occurring from December through March. Long-term
observations from different meteorological stations located
within a 245 km radius from the upper site, between elevations
200 and 1800 masl around Cordillera Yanachaga, showed
similar seasonality (Ordonez, 2001).
Rainfall data from rainfall interception studies in Tropical
Andean Forests were used for comparison of seasonal patterns
(Fig. 11). In Cordillera Central, Colombia (Veneklaas and Van
Ek, 1990), sites at elevations 2550 m and 3370 m, showed a
decrease in total annual precipitation with elevation, from
2115 mm to 1452 mm, respectively. In that study, the upper site
showed two dry seasons, from January to April, and from July
to September; at their lower site, dry months were only
observed in January, March, and August. At their both sites,
peak rainfall was observed in October and June. In Zamora-
Chinchipe, Ecuador (Fleischbein et al., 2005), at 1952 m
Fig. 9. Relationship between bulk precipitation and rainfall interception: (a)
upper site, (b) lower site. Relationship between bulk precipitation and percent
rainfall interception: (c) upper site, (d) lower site.
Fig. 10. Relationship between minimum negative rainfall interception and LAI
above throughfall collectors at upper site.
Fig. 11. Comparison of monthly rainfall with studies of rainfall interception in
Tropical Andean Forests. Legend shows location, elevation, and total annual
rainfall. Data from *1present study and adaptations from *2Veneklaas and Van
Ek (1990) and *3Fleischbein et al. (2005).
D. Gomez-Peralta et al. / Forest Ecology and Management 255 (2008) 1315–1325 1321
Author's personal copy
elevation, November was the only dry month observed, and
peak rainfall was observed from April to July. Thus, among the
compared studies, the upper elevation site of the present study
is not only the wettest in terms of total annual rainfall, but also
in terms of seasonality, followed by Zamora-Chinchique
(Ecuador), and our lower elevation site.
Despite the large rainfall amounts of this study, it is
possible that bulk precipitation measurements have been
underestimated due to the interactive effects of wind and
sloping ground (Holwerda et al., 2006; Sharon, 1980).
Unfortunately, no wind data were collected. During dry and
foggy periods, conditions were windier at the upper site than
at the lower site; however, windy-rainy conditions were
observed at both sites (personal obs., D. Gomez-Peralta).
Wind effects may contribute to 2–10% of rainfall loss
(Holwerda et al., 2006). Therefore, wind speed and direction
must be accounted in future studies.
4.2. Apparent fog-water inputs (fog catcher)
Findings observed in Figs. 3 and 4 suggest a clear difference
of climatic conditions between the two sites. Apparently, clouds
at the upper site not only produced more orographic rainfall, but
also affected fog occurrence itself through a greater extent.
Qualitative observations of wind-driven fog at the upper site
were greater than at the lower site.
Observed weekly apparent fog-water inputs at the upper site
were somewhat greater during the very wet season (December–
March), but appeared to have no clear distinction between wet
and very wet seasons. Net precipitation events exceeding bulk
precipitation ascribed to fog precipitation at the upper site
during the very wet season may be explained by availability of
moist rising air during such months. The seasonal pattern
differs from that of Holder (2004) who found greater
contributions of fog water in the dry season. As mentioned
above, a dry season was not observed at the upper of the present
study. Such seasonal differences may indicate a relationship
between season and fog availability distinct for cloud forests of
different regions.
Weekly measurements of apparent fog precipitation were a
logistical necessity because of the remoteness of the sites but
were suboptimal for quantifying individual fog interception
events. More frequent measurements (daily or hourly) may
have shown more definitive occurrence of fog precipitation
during rainless periods.
Interference of fog catchers with collection of rainfall as
noted in this study for the lower site has been previo-
usly reported by Vogelmann et al. (1968) and Vogelmann
(1973). This undesired effect is explained by drops being
scattered by the nylon harp. During weeks with both rain and
fog events, it is possible that weekly amounts of fog at both
sites have been underestimated due to the scattering effect.
However, it might be expected that fog gauges could
overestimate fog catch because of the inclusion of
horizontally-driven rainfall. This reinforces the importance
of detailed measurements to distinguish rain and fog events in
future studies.
4.3. Net precipitation (throughfall and stemflow)
Both throughfall and stemflow equations were linearly
related with bulk precipitation (Fig. 6) showing their
occurrence in the same order of magnitude, as described by
Jackson (1975) for heavy storms. Stadtmuller and Agudelo
(1990) and Cavelier et al. (1997) determined that cloud
interception occurred when throughfall events exceeded bulk
precipitation in both wet and dry seasons. Veneklaas and Van
Ek (1990) found two of their weekly throughfall measurements
exceeding bulk precipitation, but considered it ‘‘presumptu-
ous’’ to ascribe these observations to cloud interception, and
suggested canopy saturation after large storms, splash loss, hail
events, and random errors as possible causes. Juvik and Nullet
(1995), in a Hawaiian cloud forest, found throughfall related
with bulk precipitation but considered open-site precipitation
alone a poor predictor of throughfall when the latter is a mixture
of rainfall and cloud-water interception.
We found stemflow values to be very low, less than 1% of
bulk precipitation, as has been reported for some montane
forests. Other studies in montane forests have not measured
stemflow, considering it insignificant, while some have found
much higher stemflow values, as high as 5–12% of bulk
precipitation (Bruijnzeel, 2001; Bruijnzeel and Proctor, 1995).
4.4. Apparent canopy rainfall interception
Both depth (mm) and percentage (%) of apparent rainfall
interception by the forest canopy were smaller at the upper site
than at the lower site (Table 1). Variability of plots of bulk
precipitation against apparent rainfall interception (Fig. 9a and
b) can be explained by the grouping of two or more storms
together within a week (Jackson, 1971). Plots of bulk
precipitation against percentages of apparent rainfall intercep-
tion (Fig. 9c and d) can be extrapolated beyond maximum
weekly precipitation of 154 mm (upper site) and 130 mm
(lower site), since the apparent rainfall interception percentage
is unlikely to exhibit further decrease (Jackson, 1975).
The negative relationship between apparent fog availability
and apparent rainfall interception (Fig. 8) at the upper site
shows that apparent rainfall interception decreases when more
fog was available, and negative rainfall interception occurred
when apparent fog inputs were greater than 7 mm. This
indicates the presence of fog water in some weeks both before
and after the canopy attained saturation.
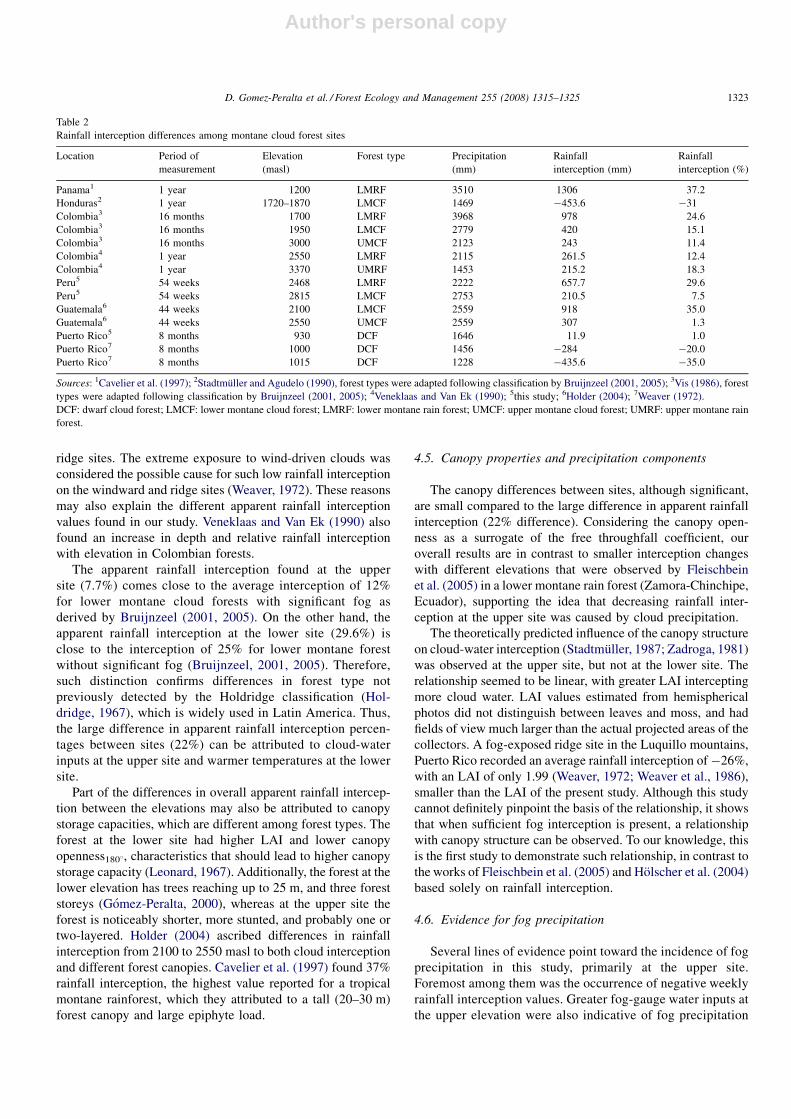
Apparent rainfall interception percentages at the upper and
lower sites were within the range of previous studies (Table 2).
Vis (1986) and Holder (2003) also found a decrease in rainfall
interception percentage with elevation in Colombia and
Guatemala, respectively. However, in the latter study, bulk
precipitation was considered constant for different elevation
sites, an assumption not justifiable in the present study. Weaver
(1972) found a large decrease in rainfall interception with
elevation from windward slope to ridge (from 1000 to 1015 m)
and from leeward slope to ridge (from 930 to 1015 m) slopes. In
Weaver’s study (1972), rainfall interception at the leeward site
was positive, whereas it was negative at both windward and
D. Gomez-Peralta et al. / Forest Ecology and Management 255 (2008) 1315–13251322
Author's personal copy
ridge sites. The extreme exposure to wind-driven clouds was
considered the possible cause for such low rainfall interception
on the windward and ridge sites (Weaver, 1972). These reasons
may also explain the different apparent rainfall interception
values found in our study. Veneklaas and Van Ek (1990) also
found an increase in depth and relative rainfall interception
with elevation in Colombian forests.
The apparent rainfall interception found at the upper
site (7.7%) comes close to the average interception of 12%
for lower montane cloud forests with significant fog as
derived by Bruijnzeel (2001, 2005). On the other hand, the
apparent rainfall interception at the lower site (29.6%) is
close to the interception of 25% for lower montane forest
without significant fog (Bruijnzeel, 2001, 2005). Therefore,
such distinction confirms differences in forest type not
previously detected by the Holdridge classification (Hol-
dridge, 1967), which is widely used in Latin America. Thus,
the large difference in apparent rainfall interception percen-
tages between sites (22%) can be attributed to cloud-water
inputs at the upper site and warmer temperatures at the lower
site.
Part of the differences in overall apparent rainfall intercep-
tion between the elevations may also be attributed to canopy
storage capacities, which are different among forest types. The
forest at the lower site had higher LAI and lower canopy
openness1808, characteristics that should lead to higher canopy
storage capacity (Leonard, 1967). Additionally, the forest at the
lower elevation has trees reaching up to 25 m, and three forest
storeys (Gomez-Peralta, 2000), whereas at the upper site the
forest is noticeably shorter, more stunted, and probably one or
two-layered. Holder (2004) ascribed differences in rainfall
interception from 2100 to 2550 masl to both cloud interception
and different forest canopies. Cavelier et al. (1997) found 37%
rainfall interception, the highest value reported for a tropical
montane rainforest, which they attributed to a tall (20–30 m)
forest canopy and large epiphyte load.
4.5. Canopy properties and precipitation components
The canopy differences between sites, although significant,
are small compared to the large difference in apparent rainfall
interception (22% difference). Considering the canopy open-
ness as a surrogate of the free throughfall coefficient, our
overall results are in contrast to smaller interception changes
with different elevations that were observed by Fleischbein
et al. (2005) in a lower montane rain forest (Zamora-Chinchipe,
Ecuador), supporting the idea that decreasing rainfall inter-
ception at the upper site was caused by cloud precipitation.
The theoretically predicted influence of the canopy structure
on cloud-water interception (Stadtmuller, 1987; Zadroga, 1981)
was observed at the upper site, but not at the lower site. The
relationship seemed to be linear, with greater LAI intercepting
more cloud water. LAI values estimated from hemispherical
photos did not distinguish between leaves and moss, and had
fields of view much larger than the actual projected areas of the
collectors. A fog-exposed ridge site in the Luquillo mountains,
Puerto Rico recorded an average rainfall interception of�26%,
with an LAI of only 1.99 (Weaver, 1972; Weaver et al., 1986),
smaller than the LAI of the present study. Although this study
cannot definitely pinpoint the basis of the relationship, it shows
that when sufficient fog interception is present, a relationship
with canopy structure can be observed. To our knowledge, this
is the first study to demonstrate such relationship, in contrast to
the works of Fleischbein et al. (2005) and Holscher et al. (2004)
based solely on rainfall interception.
4.6. Evidence for fog precipitation
Several lines of evidence point toward the incidence of fog
precipitation in this study, primarily at the upper site.
Foremost among them was the occurrence of negative weekly
rainfall interception values. Greater fog-gauge water inputs at
the upper elevation were also indicative of fog precipitation
Table 2
Rainfall interception differences among montane cloud forest sites
Location Period of
measurement
Elevation
(masl)
Forest type Precipitation
(mm)
Rainfall
interception (mm)
Rainfall
interception (%)
Panama1 1 year 1200 LMRF 3510 1306 37.2
Honduras2 1 year 1720–1870 LMCF 1469 �453.6 �31
Colombia3 16 months 1700 LMRF 3968 978 24.6
Colombia3 16 months 1950 LMCF 2779 420 15.1
Colombia3 16 months 3000 UMCF 2123 243 11.4
Colombia4 1 year 2550 LMRF 2115 261.5 12.4
Colombia4 1 year 3370 UMRF 1453 215.2 18.3
Peru5 54 weeks 2468 LMRF 2222 657.7 29.6
Peru5 54 weeks 2815 LMCF 2753 210.5 7.5
Guatemala6 44 weeks 2100 LMCF 2559 918 35.0
Guatemala6 44 weeks 2550 UMCF 2559 307 1.3
Puerto Rico5 8 months 930 DCF 1646 11.9 1.0
Puerto Rico7 8 months 1000 DCF 1456 �284 �20.0
Puerto Rico7 8 months 1015 DCF 1228 �435.6 �35.0
Sources: 1Cavelier et al. (1997); 2Stadtmuller and Agudelo (1990), forest types were adapted following classification by Bruijnzeel (2001, 2005); 3Vis (1986), forest
types were adapted following classification by Bruijnzeel (2001, 2005); 4Veneklaas and Van Ek (1990); 5this study; 6Holder (2004); 7Weaver (1972).
DCF: dwarf cloud forest; LMCF: lower montane cloud forest; LMRF: lower montane rain forest; UMCF: upper montane cloud forest; UMRF: upper montane rain
forest.
D. Gomez-Peralta et al. / Forest Ecology and Management 255 (2008) 1315–1325 1323
Author's personal copy
and these values were significantly and negatively related to
the apparent rainfall interception values. The scatter in the
relationship between bulk precipitation and rainfall inter-
ception for the upper site was also indicative of contributions
by fog precipitation. Also, wetting caused by fog and
subsequent canopy drip was observed repeatedly during visits
to the field sites, mostly at the upper site preceding rain
events.
Additional evidence was found in the difference between
apparent rainfall interception percentages between sites. As
both are lower montane forests, this could distinguish the upper
site as cloud-affected and the lower site as cloud-free, and
potentially attribute up to 22% of apparent rainfall interception
differences to fog precipitation at the upper site, during the year
of study.
At the upper site, the maximum magnitude of negative
rainfall interception values were significantly related to canopy
LAI as determined by hemispherical canopy photography,
suggesting that plots with higher leaf surface area intercepted
greater amounts of fog, as predicted by Stadtmuller (1987) and
Zadroga (1981). Wind, exposure, and moss cover are additional
important factors that were unmeasured in this study that may
have contributed to the relationship.
In conclusion, our year-long analysis of the components of
precipitation at two Peruvian montane forests indicate that
only one site, the upper elevation forest, is apparently receiving
significant inputs from fog interception and can actually be
described as a ‘‘cloud forest’’ in the sense that not only is fog
present, but also apparent capture of fog water by the
vegetation occurs. Those inputs were observed mostly as
reduced canopy interception losses (only 7.7%) compared to
the lower site where interception losses were 29.6%, the latter
similar to reported 25% for cloud free sites by Bruijnzeel
(2001, 2005). In the Cordillera Yanachaga, cloud-water input
at forests below 2500 m may be insignificant. These lower-
elevation forests would not fall in the definition of cloud forests
in strict sense, at least during the study period. Canopy
structure was related to apparent fog interception at the upper
site. The results suggest that forest canopies in ‘‘true’’ TMCF
with greater leaf area index will capture more cloud water. The
lower site, probably in a fog-free zone, did not show apparent
fog interception despite greater leaf area index and larger trees
than the upper site, providing further evidence of the
importance of climatic over canopy controls on fog intercep-
tion. This can also be supported by Troll’s altitudinal
classification (Stadtmuller, 1987), where our lower site would
be situated at the bottom of the cloud base.
Lowland deforestation and global climate change has been
reported to cause an upward movement of the cloud belt with
associated consequences in other TMCF (Gandu et al., 2004;
Lawton et al., 2001; Loope and Giambelluca, 1998; Nadkarni
and Solano, 2002; Nair et al., 2003; Still et al., 1999). The
forests of the Cordillera Yanachaga may already have
experienced an upward cloud cover shift, hence the different
apparent cloud-water interception amounts for the upper and
lower sites, although a long-term monitoring will be necessary
to examine such hypothesis.
Acknowledgements
This work was funded by the Andrew W. Mellon
Foundation, the Inter-American Institute for Global Change
Research, and the Graduate Student Association at Florida
International University. We thank Dr. William Anderson at
Florida International University; Dr. Leo Sternberg at
University of Miami; Dr. Carlos Reynel, Dr. Carlos Llerena,
and Carlos Garnica at Universidad Nacional Agraria La
Molina. We also thank the local support of the Andean Amazon
Research Station, Bonnie Hall, Pilar Verde, Jorge Noguera-
Tapia, Guido Casimiro, Gino Arteaga, Jaime Guerovich, Denis
Orihuela, Nilton Bedrinana, the Yanachaga-Chemillen
National Park agency INRENA, and Damien Catchpole. This
paper is contribution 132 of the Tropical Biology Program at
Florida International University.
References
Brack, A., 1987. Parque Nacional Yanachaga-Chemillen, Plan Maestro.
INADE-PEPP, Lima, 176 pp.
Brack, A., 1992. Estrategias nuevas para la conservacion del bosque montano.
Memorias del Museo de Historia Natural, U.N.M.S.M. (Lima) 21, 223–227.
Bruijnzeel, L.A., 2001. Hydrology of tropical montane cloud forests: a reas-
sessment. Land Use Water Resour. Res. 1, 1.1–1.18.
Bruijnzeel, L.A., 2005. Tropical montane cloud forest: a unique hydrological
case. In: Bonell, M., Bruijnzeel, L.A. (Eds.), Forests, Water and People in
the Humid Tropics: Past, Present and Future Hydrological Research for
Integrated Land and Water Management. Cambridge University Press,
Cambridge, UK, pp. 462–489.
Bruijnzeel, L.A., Proctor, J., 1995. Hydrology and biogeochemistry of tropical
montane cloud forests: what do we really know? In: Hamilton, Juvik,
Scatena, (Eds.), Tropical Montane Cloud Forests. Springer, New York, pp.
38–78.
Bubb, P., May, I., Miles, L., Sayer, J., 2004. Cloud Forest Agenda. UNEP-
WCMC, Cambridge, UK, 32 pp.
Cavelier, J., Jaramillo, M., Solis, D., de Leon, D., 1997. Water balance and
nutrient inputs in bulk precipitation in tropical montane cloud forest in
Panama. J. Hydrol. 193 (1–4), 83–96.
Doumenge, C., Gilmour, D., Ruiz, M., Blockhus, J., 1995. Tropical montane
cloud forests: conservation status and management Issues. In: Hamilton,
Juvik, Scatena, (Eds.), Tropical Montane Cloud Forests. Springer, New
York, pp. 24–37.
Fleischbein, K., Wilcke, W., Goller, R., Boy, J., Valarezo, C., Zech, W.,
Knoblich, K., 2005. Rainfall interception in a lower montane forest
in Ecuador: effects of canopy properties. Hydrol. Process. 19 (7), 1355–
1371.
Foster, P., 2001. The potential negative impacts of global climate change on
tropical montane cloud forests. Earth-Sci. Rev. 55, 73–106.
Frazer, G.W., Canham, C.D., Lertzman, K.P., 1999. Gap Light Analyzer (GLA),
Version 2.0: Imaging Software to Extract Canopy Structure and Gap Light
Transmission Indices from True-Colour Fisheye Photographs, Users Man-
ual and Program Documentation. Symon Fraser University; Institute of
Ecosystem Studies, Burnaby, BC; Millbrook, NY. Software available at
http://www.ecostudies.org/gla/.
Gandu, A.W., Cohen, J.C.P., de Souza, J.R.S., 2004. Simulation of deforestation
in eastern Amazonia using a high-resolution model. Theor. Appl. Climatol.
78 (1–3), 123–135.
Gentry, A.H., 1993. Overview of the Peruvian flora. In: Brako, L., Zarucchi,
J.L. (Eds.), Catalogue of the Flowering Plants and Gymnosperms of Peru.
Missouri Botanical Garden, St. Louis, xxix-xl.
Gomez-Peralta, D., 2000. Composicion Florıstica en el Bosque Ribereno de la
Cuenca Alta San Alberto, Peru. Forest Engineer thesis, Universidad Nacio-
nal Agraria La Molina, Lima, Peru, 177 pp.
D. Gomez-Peralta et al. / Forest Ecology and Management 255 (2008) 1315–13251324

Author's personal copy
Gonzalez, J., 2000. Monitoring cloud interception in a tropical montane cloud
forest of the southwestern Colombian Andes. Adv. Environ. Monit. Model.
1 (1), 97–117.
Hall, R.L., Calder, I.R., 1993. Drop size modification by forest canopies –
measurements using a disdrometer. J. Geophys. Res.-Atmos. 98 (D10),
18465–18470.
Holder, C.D., 2003. Fog precipitation in the Sierra de las Minas Biosphere
Reserve, Guatemala. Hydrol. Process. 17 (10), 2001–2010.
Holder, C.D., 2004. Rainfall interception and fog precipitation in a tropical
montane cloud forest of Guatemala. Forest Ecol. Manage. 190 (2–3), 373–
384.
Holdridge, L.R., 1967. Life Zone Ecology. Tropical Science Center, San Jose,
Costa Rica, 206 pp.
Holscher, D., Kohler, L., van Dijk, A.I.J.M., Bruijnzeel, L.A., 2004. The
importance of epiphytes to total rainfall interception by a tropical montane
rain forest in Costa Rica. J. Hydrol. 292 (1–4), 308–322.
Holwerda, F., Burkard, R., Eugster, W., Scatena, F.N., Meesters, A.G.C.A.,
Bruijnzeel, L.A., 2006. Estimating fog deposition at a Puerto Rican elfin
cloud forest site: comparison of the water budget and eddy covariance
methods. Hydrol. Process. 20 (13), 2669–2692.
Jackson, I.J., 1971. Problems of throughfall and interception assessment under
tropical forest. J. Hydrol. 12, 234–254.
Jackson, I.J., 1975. Relationships between rainfall parameters and interception
by tropical forests. J. Hydrol. 24, 215–238.
Juvik, J., Nullet, D., 1995. Relationships between rainfall, cloud-water
interception, and canopy throughfall in a Hawaiian montane forest. In:
Hamilton, Juvik, Scatena, (Eds.), Tropical Montane Cloud Forests.
Springer, New York, pp. 165–182.
La Val, R.K., 2004. Impact of global warming and locally changing climate on
tropical cloud forest bats. J. Mammal. 85 (2), 237–244.
Lawton, R.O., Nair, U.S., Pielke, R.A., Welch, R.M., 2001. Climatic impact of
tropical lowland deforestation on nearby montane cloud forests. Science
294 (5542), 584–587.
Leo, M., 1995. The importance of tropical montane cloud forest for preserving
vertebrate endemism in Peru: the Rıo Abiseo National Park as a case study.
In: Hamilton, Juvik, Scatena, (Eds.), Tropical Montane Cloud Forests.
Springer, New York, pp. 198–211.
Leonard, R.E., 1967. Mathematical theory of interception. In: Sopper, W.E.,
Lull, H.W. (Eds.), Forest Hydrology. Pergamon Press Ltd., Oxford, pp.
131–136.
Lips, K.R., 1998. Decline of a tropical montane amphibian fauna. Conserv.
Biol. 12 (1), 106–117.
Loope, L.L., Giambelluca, T.W., 1998. Vulnerability of island tropical montane
cloud forests to climate change, with special reference to East Maui,
Hawaii. Climatic Change 39, 503–517.
Nadkarni, N.M., Solano, R., 2002. Potential effects of climate change on canopy
communities in a tropical cloud forest: an experimental approach. Oeco-
logia 131, 580–586.
Nair, U.S., Lawton, R.O., Welch, R.M., Pielke, R.A., 2003. Impact of land use
on Costa Rican tropical montane cloud forests: sensitivity of cumulus cloud
field characteristics to lowland deforestation. J. Geophys. Res.-Atmos. 108
(D7) ACL4_1-13.
Ordonez, J.J., 2001. Analisis Hidrometeorologico y Aplicacion del Modelo de
Simulacion IPH-MEN en la Cuenca del Rıo Pachitea. Master of Science
thesis, Universidad Nacional Agraria La Molina, UNALM, Lima, 221 pp.
Parker, G.G., 1995. Structure and microclimate of forest canopies. In: Lowman,
M.D., Nadkarni, N.M. (Eds.), Forest Canopies. Academic Press, San Diego,
CA, pp. 73–106.
Pounds, J.A., Bustamante, M.R., Coloma, L.A., Consuegra, J.A., Fogden,
M.P.L., Foster, P.N., La Marca, E., Masters, K.L., Merino-Viteri, A.,
Puschendorf, R., Ron, S.R., Sanchez-Azofeifa, G.A., Still, C.J., Young,
B.E., 2006. Widespread amphibian extinctions from epidemic disease
driven by global warming. Nature 439 (7073), 161–167.
Pounds, J.A., Crump, M.L., 1994. Amphibian declines and climate disturbance:
the case of the Golden Toad and the Harlequin Frog. Conserv. Biol. 8 (1),
72–85.
Pounds, J.A., Fogden, M.P.L., Campbell, J.H., 1999. Biological response to
climate change on a tropical mountain. Nature 398, 611–615.
Richards, P.W., 1996. The Tropical Rain Forest; an Ecological Study, xxiii.
Cambridge University Press, Cambridge, UK, 575 pp.
Saunders, T.J., 2004. The biogeochemistry of surface and subsurface runoff in a
small montane catchment of the Peruvian Amazon. Master of Science
thesis, Florida International University, Miami, 73 pp.
Sharon, D., 1980. The distribution of hydrologically effective rainfall incident
on sloping ground. J. Hydrol. 46, 165–188.
Stadtmuller, T., 1987. Cloud forests in the humid tropics: a bibliographic
review. The United Nations University, Tokyo, 81 pp.
Stadtmuller, T., Agudelo, N., 1990. Amount and variability of cloud moisture
input in a tropical cloud forest. In: Lang, H., Musy, A. (Eds.), Hydrology in
mountainous regions. I. Hydrological measurements: the water cycle.
International Association of Hydrological Sciences Publication, Walling-
ford, UK, pp. 25–32.
Still, C.J., Foster, P.N., Schneider, S.H., 1999. Simulating the effects of climate
change on tropical montane cloud forests. Nature 398 (6728), 608–610.
Veneklaas, E.J., Van Ek, R., 1990. Rainfall interception in two tropical montane
rain forests, Colombia. Hydrol. Process. 4, 311–326.
Vis, M., 1986. Interception, drop size distributions and rainfall kinetic energy in
four Colombian forest ecosystems. Earth Surf. Process. Landforms 11 (6),
591–603.
Vogelmann, V.H., 1973. Fog precipitation in the cloud forests of Eastern
Mexico. Bioscience 23 (2), 96–100.
Vogelmann, V.H., Siccama, T., Leedy, D., Ovitt, D.C., 1968. Precipitation from
fog moisture in the green mountains of Vermont. Ecology 49 (6), 1205–1207.
Weaver, P.L., 1972. Cloud moisture interception in the Luquillo Mountains of
Puerto Rico. Caribbean J. Sci. 12 (3–4), 129–144.
Weaver, P.L., Medina, E., Pool, D., Dugger, K., Gonzales-Liboy, J., Cuevas, E.,
1986. Ecological observations in the dwarf cloud forest of the Luquillo
Mountains in Puerto Rico. Biotropica 18 (1), 79–85.
Young, K.R., 1991. Floristic diversity on the eastern slopes of the Peruvian
Andes. Candollea 46, 125–143.
Young, K.R., 1992. Biogeography of the montane forest zone of the Eastern
slopes of Peru. Memorias del Museo de Historia Natural, U.N.M.S.M.
(Lima) 21, 119–154.
Young, K., Leon, B., 1995. Distribution of Peru’s montane forests: interac-
tions between the biota and human society. In: Hamilton, Juvik, Scatena,
(Eds.), Tropical Montane Cloud Forests. Springer, New York, pp. 363–
376.
Zadroga, F., 1981. The hydrological importance of a montane cloud forest area
of Costa Rica. In: Lal, R., Russell, E.W. (Eds.), Tropical Agricultural
Hydrology. J Wiley & Sons, New York, pp. 59–73.
D. Gomez-Peralta et al. / Forest Ecology and Management 255 (2008) 1315–1325 1325