Embed Size (px)
Citation preview
HYDROGEOLOGIC FRAMEWORK OF THE DIABASEAQUIFER AT THE BOARHEAD FARMS SUPERFUNDSITE, BRIDGETON TOWNSHIP, BUCKS COUNTY,PENNSYLVANIA
U.S. GEOLOGICAL SURVEYWater-Resources Investigations Report 96-4090
Prepared in cooperation with the
U.S. ENVIRONMENTAL PROTECTION AGENCY
HYDROGEOLOGIC FRAMEWORK OF THE DIABASEAQUIFER AT THE BOARHEAD FARMS SUPERFUNDSITE, BRIDGETON TOWNSHIP, BUCKS COUNTY,PENNSYLVANIA
by Curtis L. Schreffler
U.S. GEOLOGICAL SURVEYWater-Resources Investigations Report 96-4090
Prepared in cooperation with the
U.S. ENVIRONMENTAL PROTECTION AGENCY
Lemoyne, Pennsylvania1996
ii
U.S. DEPARTMENT OF THE INTERIOR
BRUCE BABBITT, Secretary
U.S. GEOLOGICAL SURVEY
Gordon P. Eaton, Director
For additional information Copies of this report may bewrite to: purchased from:
U.S. Geological SurveyEarth Science Information Center
District Chief Open-File Reports SectionU.S. Geological Survey Box 25286, MS 517840 Market Street Denver Federal CenterLemoyne, Pennsylvania 17043-1586 Denver, Colorado 80225
iii
Abstract . . . . . . . . . . . . . . . . . . . . . . . . . . . . . . . . . . . . . . . . . . . . . . . . . . . . . . . . . . . . . . . . . . . . . . . . . . . . . . . . . . . . 1Introduction . . . . . . . . . . . . . . . . . . . . . . . . . . . . . . . . . . . . . . . . . . . . . . . . . . . . . . . . . . . . . . . . . . . . . . . . . . . . . . . . 1
Purpose and scope . . . . . . . . . . . . . . . . . . . . . . . . . . . . . . . . . . . . . . . . . . . . . . . . . . . . . . . . . . . . . . . . . . . . . 1Geologic setting. . . . . . . . . . . . . . . . . . . . . . . . . . . . . . . . . . . . . . . . . . . . . . . . . . . . . . . . . . . . . . . . . . . . . . . . 3Hydrologic setting . . . . . . . . . . . . . . . . . . . . . . . . . . . . . . . . . . . . . . . . . . . . . . . . . . . . . . . . . . . . . . . . . . . . . 3Borehole network description. . . . . . . . . . . . . . . . . . . . . . . . . . . . . . . . . . . . . . . . . . . . . . . . . . . . . . . . . . . . 3Methods of investigation . . . . . . . . . . . . . . . . . . . . . . . . . . . . . . . . . . . . . . . . . . . . . . . . . . . . . . . . . . . . . . . . 3
Hydrogeologic framework of the diabase aquifer . . . . . . . . . . . . . . . . . . . . . . . . . . . . . . . . . . . . . . . . . . . . . . . . 8Fractures. . . . . . . . . . . . . . . . . . . . . . . . . . . . . . . . . . . . . . . . . . . . . . . . . . . . . . . . . . . . . . . . . . . . . . . . . . . . . . 9Determination of hydraulic properties . . . . . . . . . . . . . . . . . . . . . . . . . . . . . . . . . . . . . . . . . . . . . . . . . . . . 9
Slug tests. . . . . . . . . . . . . . . . . . . . . . . . . . . . . . . . . . . . . . . . . . . . . . . . . . . . . . . . . . . . . . . . . . . . . . . . 9Constant-discharge tests in isolated zones . . . . . . . . . . . . . . . . . . . . . . . . . . . . . . . . . . . . . . . . . . 15Open-hole constant-discharge tests . . . . . . . . . . . . . . . . . . . . . . . . . . . . . . . . . . . . . . . . . . . . . . . . 24
Summary and conclusions . . . . . . . . . . . . . . . . . . . . . . . . . . . . . . . . . . . . . . . . . . . . . . . . . . . . . . . . . . . . . . . . . . . 33References cited . . . . . . . . . . . . . . . . . . . . . . . . . . . . . . . . . . . . . . . . . . . . . . . . . . . . . . . . . . . . . . . . . . . . . . . . . . . . 34Appendix 1. Graphs of drawdown plots for slug tests . . . . . . . . . . . . . . . . . . . . . . . . . . . . . . . . . . . . . . . . . . . 35Appendix 2. Graphs of drawdown plots for isolated-zone constant-discharge tests . . . . . . . . . . . . . . . . . . 45Appendix 3. Graphs of drawdown plots for open-hole constant-discharge tests . . . . . . . . . . . . . . . . . . . . . 53
ILLUSTRATIONS
PageFigure 1.—Map showing location of the Boarhead Farms Superfund Site, Bridgeton
Township, Bucks County, Pa. . . . . . . . . . . . . . . . . . . . . . . . . . . . . . . . . . . . . . . . . . . . . . . 2
2.—Map showing borehole locations at the Boarhead Farms site, Bridgeton Township,Bucks County, Pa. . . . . . . . . . . . . . . . . . . . . . . . . . . . . . . . . . . . . . . . . . . . . . . . . . . . . . . . . 4
3.—Generalized sketch of single- and straddle-packer assemblies and pump in aborehole . . . . . . . . . . . . . . . . . . . . . . . . . . . . . . . . . . . . . . . . . . . . . . . . . . . . . . . . . . . . . . . . 7
4.—Map showing location of boreholes geophysically logged to determine the thicknessof the Coffman Hill diabase sheet, Bridgeton and Nockamixon Townships,Bucks County, Pa. . . . . . . . . . . . . . . . . . . . . . . . . . . . . . . . . . . . . . . . . . . . . . . . . . . . . . . . 10
5.—Natural-gamma geophysical logs of boreholes BK-2202, BK-1498, BK-1443, BK-1554,BK-1438, and BK-2347 showing diabase (shale-siltstone) contact, Bridgeton andNockamixon Townships, Bucks County, Pa . . . . . . . . . . . . . . . . . . . . . . . . . . . . . . . . . 11
6.—Geophysical logs and borehole television survey from borehole BK-2642, BoarheadFarms site, Bridgeton Township, Bucks County, Pa. . . . . . . . . . . . . . . . . . . . . . . . . . . 12
7.—Graph showing drawdown versus logarithm of time and corresponding typecurve for slug test of borehole BK-2638, Boarhead Farms site, BridgetonTownship, Bucks County, Pa. . . . . . . . . . . . . . . . . . . . . . . . . . . . . . . . . . . . . . . . . . . . . . 13
8.—Graph showing drawdown versus time in the upper zone of borehole BK-2631for the isolated-zone constant-discharge test, October 6, 1994, BoarheadFarms site, Bridgeton Township, Bucks County, Pa. . . . . . . . . . . . . . . . . . . . . . . . . . . 15
9.—Graph showing drawdown versus time in the lower zone of borehole BK-2632 forisolated-zone constant-discharge test, September 28, 1994, Boarhead Farmssite, Bridgeton Township, Bucks County, Pa. . . . . . . . . . . . . . . . . . . . . . . . . . . . . . . . . 18
CONTENTS
Page
iv
Figure 10.—Map showing boreholes used for open-hole constant-discharge tests, BoarheadFarms site, Bridgeton Township, Bucks County, Pa. . . . . . . . . . . . . . . . . . . . . . . . . . . 25
11.—Graph showing logarithm of drawdown versus logarithm of time andcorresponding type curve with match point for open-hole constant-dischargetest of borehole BK-2632 on October 27, 1994, Boarhead Farms site, BridgetonTownship, Bucks County, Pa. . . . . . . . . . . . . . . . . . . . . . . . . . . . . . . . . . . . . . . . . . . . . . 26
Appendix 1
Figures 1-8.—Graphs showing:
1.—Drawdown versus logarithm of time and corresponding type curve for slugtest of borehole BK-2631, Boarhead Farms site, Bridgeton Township,Bucks County, Pa. . . . . . . . . . . . . . . . . . . . . . . . . . . . . . . . . . . . . . . . . . . . . . . . . . . . 36
2.—Drawdown versus logarithm of time and corresponding type curve for slugtest of borehole BK-2632, Boarhead Farms site, Bridgeton Township,Bucks County, Pa.. . . . . . . . . . . . . . . . . . . . . . . . . . . . . . . . . . . . . . . . . . . . . . . . . . . . 37
3.—Drawdown versus logarithm of time and corresponding type curve for slugtest of borehole BK-2636, Boarhead Farms site, Bridgeton Township,Bucks County, Pa.. . . . . . . . . . . . . . . . . . . . . . . . . . . . . . . . . . . . . . . . . . . . . . . . . . . . 38
4.—Drawdown versus logarithm of time and corresponding type curve for slugtest of borehole BK-2639, Boarhead Farms site, Bridgeton Township,Bucks County, Pa.. . . . . . . . . . . . . . . . . . . . . . . . . . . . . . . . . . . . . . . . . . . . . . . . . . . . 39
5.—Drawdown versus logarithm of time and corresponding type curve for slugtest of borehole BK-2640, Boarhead Farms site, Bridgeton Township,Bucks County, Pa.. . . . . . . . . . . . . . . . . . . . . . . . . . . . . . . . . . . . . . . . . . . . . . . . . . . . 40
6.—Drawdown versus logarithm of time and corresponding type curve for slugtest of borehole BK-2641, Boarhead Farms site, Bridgeton Township,Bucks County, Pa.. . . . . . . . . . . . . . . . . . . . . . . . . . . . . . . . . . . . . . . . . . . . . . . . . . . . 41
7.—Drawdown versus logarithm of time and corresponding type curve for slugtest of borehole BK-2642, Boarhead Farms site, Bridgeton Township,Bucks County, Pa.. . . . . . . . . . . . . . . . . . . . . . . . . . . . . . . . . . . . . . . . . . . . . . . . . . . . 42
8.—Drawdown versus logarithm of time and corresponding type curve for slugtest of borehole BK-2643, Boarhead Farms site, Bridgeton Township,Bucks County, Pa.. . . . . . . . . . . . . . . . . . . . . . . . . . . . . . . . . . . . . . . . . . . . . . . . . . . . 43
Appendix 2
Figures 1-7.—Graphs showing:
1.—Drawdown versus time in the upper zone of borehole BK-2632 for theisolated-zone constant-discharge test, September 27, 1994, BoarheadFarms site, Bridgeton Township, Bucks County, Pa. . . . . . . . . . . . . . . . . . . . . . . 46
2.—Drawdown versus time in the upper zone of borehole BK-2636 for theisolated-zone constant-discharge test, September 22, 1994, BoarheadFarms site, Bridgeton Township, Bucks County, Pa. . . . . . . . . . . . . . . . . . . . . . . 47
3.—Drawdown versus time in the upper zone of borehole BK-2639 for theisolated-zone constant-discharge test, September 29, 1994, BoarheadFarms site, Bridgeton Township, Bucks County, Pa. . . . . . . . . . . . . . . . . . . . . . . 48
ILLUSTRATIONS—Continued
Page
v
Appendix 2—Continued
Figure 4.—Drawdown versus time in the upper and lower zones of borehole BK-2640for the isolated-zone constant-discharge test, September 27, 1994,Boarhead Farms site, Bridgeton Township, Bucks County, Pa.. . . . . . . . . . . . . . 49
5.—Drawdown versus time in the upper zone of blrehole BK-2641 for theisolated-zone constant-discharge test, September 28, 1994, BoarheadFarms site, Bridgeton, Pa. . . . . . . . . . . . . . . . . . . . . . . . . . . . . . . . . . . . . . . . . . . . . . 50
6.—Drawdown versus time in the upper zone of borehole BK-2642 for theisolated-zone constant-discharge test, October 4, 1994, BoarheadFarms site, Bridgeton Township, Bucks County, Pa. . . . . . . . . . . . . . . . . . . . . . . 51
7.—Drawdown versus time in the lower zone of borehole BK-2643 for theisolated-zone constant-discharge test, October 5, 1994, BoarheadFarms site, Bridgeton Township, Bucks County, Pa. . . . . . . . . . . . . . . . . . . . . . . 52
Appendix 3
Figures 1-5.—Graphs showing:
1.—Logarithm of drawdown versus logarithm of time and corresponding typecurve with match point for open-hole constant-discharge test ofborehole BK-2636 on October 26, 1994, Boarhead Farms site,Bridgeton Township, Bucks County, Pa. . . . . . . . . . . . . . . . . . . . . . . . . . . . . . . . . 54
2.—Logarithm of drawdown versus logarithm of time and corresponding typecurve with match point for open-hole constant-discharge test ofborehole BK-2639 on October 19, 1994, Boarhead Farms site,Bridgeton Township, Bucks County, Pa. . . . . . . . . . . . . . . . . . . . . . . . . . . . . . . . . 55
3.—Logarithm of drawdown versus logarithm of time and corresponding typecurve with match point for open-hole constant-discharge test ofborehole BK-2640 on October 17, 1994, Boarhead Farms site,Bridgeton Township, Bucks County, Pa. . . . . . . . . . . . . . . . . . . . . . . . . . . . . . . . . 56
4.—Logarithm of drawdown versus logarithm of time for open-holeconstant-discharge test of borehole BK-2641 on October 28, 1994,Boarhead Farms site, Bridgeton Township, Bucks County, Pa. . . . . . . . . . . . . . 57
5.—Logarithm of drawdown versus logarithm of time and corresponding typecurve with match point for open-hole constant-discharge test ofborehole BK-2643 on October 20, 1994, Boarhead Farms site,Bridgeton Township, Bucks County, Pa. . . . . . . . . . . . . . . . . . . . . . . . . . . . . . . . . 58
ILLUSTRATIONS—Continued
Page

vi
Table 1.—Summary of borehole data for the Boarhead Farms site, Bridgeton Township,Bucks County, Pa. . . . . . . . . . . . . . . . . . . . . . . . . . . . . . . . . . . . . . . . . . . . . . . . . . . . . . . . . . . 5
2.—Summary of borehole geophysical logging done by U.S. Geological Survey andfractures at the Boarhead Farms site, Bridgeton Township, Bucks County, Pa. . . . . . 14
3.—Transmissivity determined by slug tests, Boarhead Farms site, Bridgeton Township,Bucks County, Pa. . . . . . . . . . . . . . . . . . . . . . . . . . . . . . . . . . . . . . . . . . . . . . . . . . . . . . . . . . 14
4.—Specific capacity determined by isolated-zone constant-discharge tests, BoarheadFarms site, Bridgeton Township, Bucks County, Pa. . . . . . . . . . . . . . . . . . . . . . . . . . . . . 16
5.—Drawdown in the lower zone of borehole BK-2631, October 6, 1994, BoarheadFarms site, Bridgeton Township, Bucks County, Pa. . . . . . . . . . . . . . . . . . . . . . . . . . . . . 17
6.—Drawdown in the upper and lower zones of borehole BK-2636 during upper-isolated-zone test on September 22, 1994, Boarhead Farms site, Bridgeton Township,Bucks County, Pa. . . . . . . . . . . . . . . . . . . . . . . . . . . . . . . . . . . . . . . . . . . . . . . . . . . . . . . . . . 19
7.—Drawdown in the upper and lower zones of borehole BK-2636 during lower-isolated-zone test on September 22, 1994, Boarhead Farms site, Bridgeton Township,Bucks County, Pa. . . . . . . . . . . . . . . . . . . . . . . . . . . . . . . . . . . . . . . . . . . . . . . . . . . . . . . . . . 20
8.—Drawdown in the lower zone of borehole BK-2640, September 27, 1994, BoarheadFarms site, Bridgeton Township, Bucks County, Pa. . . . . . . . . . . . . . . . . . . . . . . . . . . . . 22
9.—Drawdown in the lower zone of borehole BK-2641, September 29, 1994, BoarheadFarms site, Bridgeton Township, Bucks County, Pa. . . . . . . . . . . . . . . . . . . . . . . . . . . . . 22
10.—Pumping rate, pumping duration, and transmissivity for open-hole constant-dischargetests, Boarhead Farms site, Bridgeton Township, Bucks County, Pa. . . . . . . . . . . . . . . 24
11.—Water-level measurements in observation boreholes BK-2631, BK-2633, BK-2643, andBK-2707 during open-hole constant-discharge test of borehole BK-2632,October 27, 1994, Boarhead Farms site, Bridgeton Township, Bucks County, Pa. . . . 27
12.—Water-level measurements in observation boreholes BK-2706, BK-2635, BK-2637,BK-2638 and BK-2708 during open-hole constant-discharge test of boreholeBK-2636, October 26, 1994, Boarhead Farms site, Bridgeton Township, BucksCounty, Pa. . . . . . . . . . . . . . . . . . . . . . . . . . . . . . . . . . . . . . . . . . . . . . . . . . . . . . . . . . . . . . . . 28
13.—Water-level measurements in observation boreholes BK-2635, BK-2636, BK-2639, andBK-2640 during open-hole constant-discharge test of borehole BK-2638,October 24, 1994, Boarhead Farms site, Bridgeton Township, Bucks County, Pa. . . . 29
14.—Water-level measurements in boreholes BK-2638 and BK-2640 during open-holeconstant-discharge test of borehole BK-2639, October 19, 1994, BoarheadFarms site, Bridgeton Township, Bucks County, Pa. . . . . . . . . . . . . . . . . . . . . . . . . . . . . 29
15.—Water-level measurements in observation boreholes BK-2639, BK-2641, and BK-2642during open-hole constant-discharge test of borehole BK-2640, October 18, 1994,Boarhead Farms site, Bridgeton Township, Bucks County, Pa. . . . . . . . . . . . . . . . . . . . 30
16.—Water-level measurements in observation boreholes BK-2640 and BK-2642 duringopen-hole constant-discharge test of borehole BK-2641, October 28, 1994,Boarhead Farms site, Bridgeton Township, Bucks County, Pa. . . . . . . . . . . . . . . . . . . . 31
17.—Water-level measurements in observation boreholes BK-2632, BK-2633, BK-2634,BK-2644 and BK-2709 during open-hole constant-discharge test of boreholeBK-2643, October 20, 1994, Boarhead Farms site, Bridgeton Township,Bucks County, Pa. . . . . . . . . . . . . . . . . . . . . . . . . . . . . . . . . . . . . . . . . . . . . . . . . . . . . . . . . . 32
TABLES
Page
vii
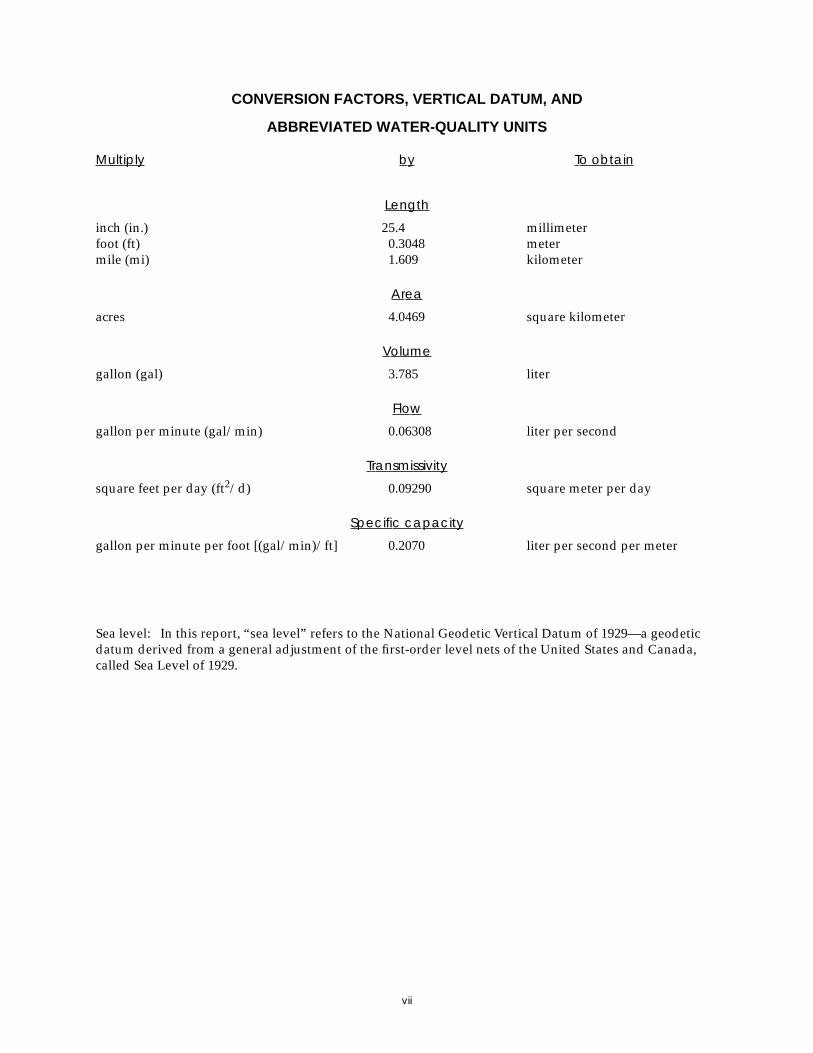
Multiply by To obtain
Length
inch (in.) 25.4 millimeterfoot (ft) 0.3048 metermile (mi) 1.609 kilometer
Area
acres 4.0469 square kilometer
Volume
gallon (gal) 3.785 liter
Flow
gallon per minute (gal/min) 0.06308 liter per second
Transmissivity
square feet per day (ft2/d) 0.09290 square meter per day
Specific capacity
gallon per minute per foot [(gal/min)/ft] 0.2070 liter per second per meter
Sea level: In this report, “sea level” refers to the National Geodetic Vertical Datum of 1929—a geodeticdatum derived from a general adjustment of the first-order level nets of the United States and Canada,called Sea Level of 1929.
CONVERSION FACTORS, VERTICAL DATUM, AND
ABBREVIATED WATER-QUALITY UNITS

Water-Resources Investigations Report 96-4090 1
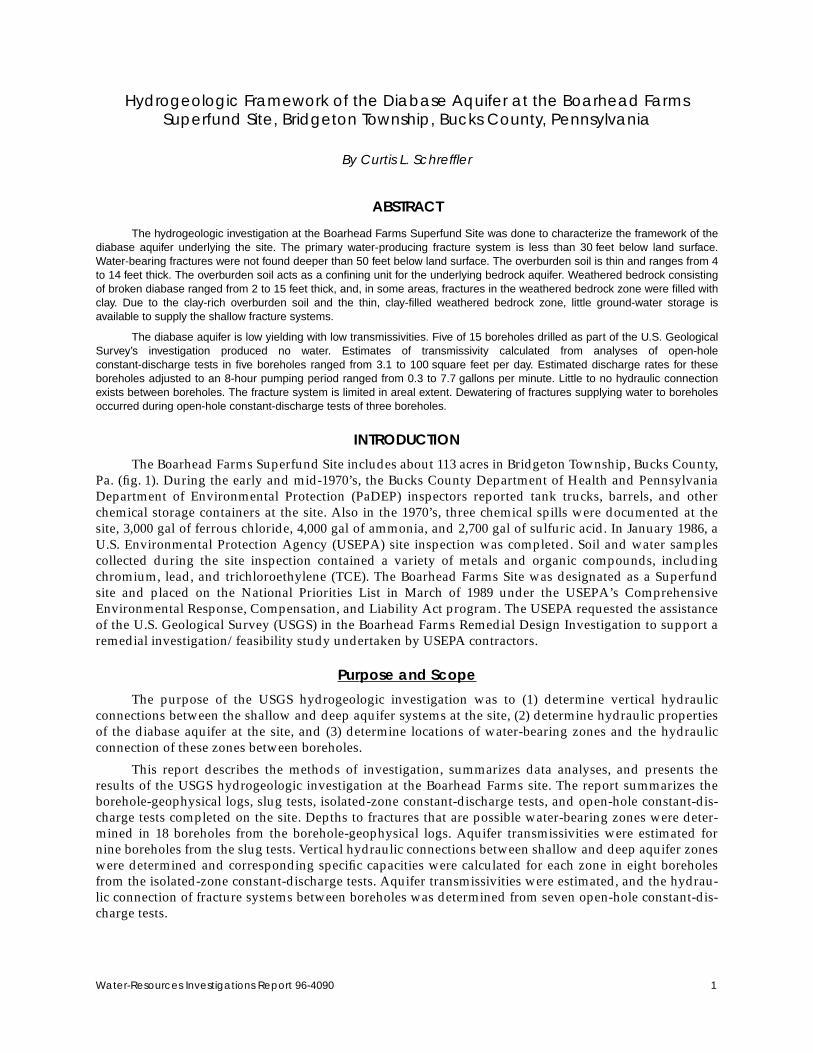
Hydrogeologic Framework of the Diabase Aquifer at the Boarhead FarmsSuperfund Site, Bridgeton Township, Bucks County, Pennsylvania
By Curtis L. Schreffler
ABSTRACT
The hydrogeologic investigation at the Boarhead Farms Superfund Site was done to characterize the framework of thediabase aquifer underlying the site. The primary water-producing fracture system is less than 30 feet below land surface.Water-bearing fractures were not found deeper than 50 feet below land surface. The overburden soil is thin and ranges from 4to 14 feet thick. The overburden soil acts as a confining unit for the underlying bedrock aquifer. Weathered bedrock consistingof broken diabase ranged from 2 to 15 feet thick, and, in some areas, fractures in the weathered bedrock zone were filled withclay. Due to the clay-rich overburden soil and the thin, clay-filled weathered bedrock zone, little ground-water storage isavailable to supply the shallow fracture systems.
The diabase aquifer is low yielding with low transmissivities. Five of 15 boreholes drilled as part of the U.S. GeologicalSurvey’s investigation produced no water. Estimates of transmissivity calculated from analyses of open-holeconstant-discharge tests in five boreholes ranged from 3.1 to 100 square feet per day. Estimated discharge rates for theseboreholes adjusted to an 8-hour pumping period ranged from 0.3 to 7.7 gallons per minute. Little to no hydraulic connectionexists between boreholes. The fracture system is limited in areal extent. Dewatering of fractures supplying water to boreholesoccurred during open-hole constant-discharge tests of three boreholes.
INTRODUCTION
The Boarhead Farms Superfund Site includes about 113 acres in Bridgeton Township, Bucks County,Pa. (fig. 1). During the early and mid-1970’s, the Bucks County Department of Health and PennsylvaniaDepartment of Environmental Protection (PaDEP) inspectors reported tank trucks, barrels, and otherchemical storage containers at the site. Also in the 1970’s, three chemical spills were documented at thesite, 3,000 gal of ferrous chloride, 4,000 gal of ammonia, and 2,700 gal of sulfuric acid. In January 1986, aU.S. Environmental Protection Agency (USEPA) site inspection was completed. Soil and water samplescollected during the site inspection contained a variety of metals and organic compounds, includingchromium, lead, and trichloroethylene (TCE). The Boarhead Farms Site was designated as a Superfundsite and placed on the National Priorities List in March of 1989 under the USEPA’s ComprehensiveEnvironmental Response, Compensation, and Liability Act program. The USEPA requested the assistanceof the U.S. Geological Survey (USGS) in the Boarhead Farms Remedial Design Investigation to support aremedial investigation/feasibility study undertaken by USEPA contractors.
Purpose and Scope
The purpose of the USGS hydrogeologic investigation was to (1) determine vertical hydraulicconnections between the shallow and deep aquifer systems at the site, (2) determine hydraulic propertiesof the diabase aquifer at the site, and (3) determine locations of water-bearing zones and the hydraulicconnection of these zones between boreholes.
This report describes the methods of investigation, summarizes data analyses, and presents theresults of the USGS hydrogeologic investigation at the Boarhead Farms site. The report summarizes theborehole-geophysical logs, slug tests, isolated-zone constant-discharge tests, and open-hole constant-dis-charge tests completed on the site. Depths to fractures that are possible water-bearing zones were deter-mined in 18 boreholes from the borehole-geophysical logs. Aquifer transmissivities were estimated fornine boreholes from the slug tests. Vertical hydraulic connections between shallow and deep aquifer zoneswere determined and corresponding specific capacities were calculated for each zone in eight boreholesfrom the isolated-zone constant-discharge tests. Aquifer transmissivities were estimated, and the hydrau-lic connection of fracture systems between boreholes was determined from seven open-hole constant-dis-charge tests.

2W
ate
r-Re
sou
rce
s Inve
stiga
tion
s Re
po
rt 96-4090
75°08’ 75°06’75°07’75°09’
Boarhead FarmsSuperfund Site
Base from U.S. Geological Survey Riegelsville, PA-N.J. 1:24,000 1990 and Frenchtown, N.J.-PA. 1:24,000 1977
Figure 1. Location of the Boarhead Farms Superfund Site, Bridgeton Township, Bucks County, Pa.
40°33’
40°32’

Water-Resources Investigations Report 96-4090 3
Geologic Setting
The Boarhead Farms site is in the Gettysburg-Newark Lowland Section of the PiedmontPhysiographic Province. The site is on a topographic high about 3.5 mi west of the Delaware River andabout 2 mi southwest of Upper Black Eddy in Bucks County, Pa. (fig. 1).
The site is underlain by early Jurassic-age diabase that was intruded under high temperature andlow pressure into sedimentary rocks of the Brunswick Group. Diabase is a dark-gray to black, fine- tocoarse-grained, crystalline rock composed largely of calcic plagioclase and augite (Lyttle and Epstein,1987). The diabase has been exposed by weathering of the softer intruded rocks. Diabase is massive andweathers to large, spheroidal boulders. Diabase boulders weather to a buff-colored, granular sand. Thesand, in turn, breaks down into a sticky, red, montmorillonite-type swelling clay.
Diabase sheets in northern Bucks County generally form prominent hills and are discordant sheetswith oval or ring-like outcrop patterns (Hotz, 1952; Froelich and Gottfried, 1985). The Boarhead Farms siteis underlain by the Coffman Hill diabase sheet. The Coffman Hill sheet is about 3.8 mi wide and 5 mi longand covers a large area in Bridgeton, Tinicum, and Nockamixon Townships in Bucks County and ranges inthickness.
Hydrologic Setting
Diabase has no primary porosity, and ground water moves through a network of interconnectingfractures. The ground-water flow paths are short, and ground water flows from areas of higher elevationto adjacent streams. Nearly all ground-water storage is in the weathered bedrock zone. Where theweathered bedrock zone is absent, little ground-water storage is available.
Some residential boreholes near the site are drilled through the diabase sheet and penetrateunderlying shale and siltstone units of the Brunswick Group. These boreholes generally derive some or allof their water from the underlying shale and siltstone units. In all cases, the underlying shale and siltstoneunits have a lower hydraulic head, and water from fractures in the diabase penetrated by the borehole willflow downward through the borehole to the underlying units.
Borehole Network Description
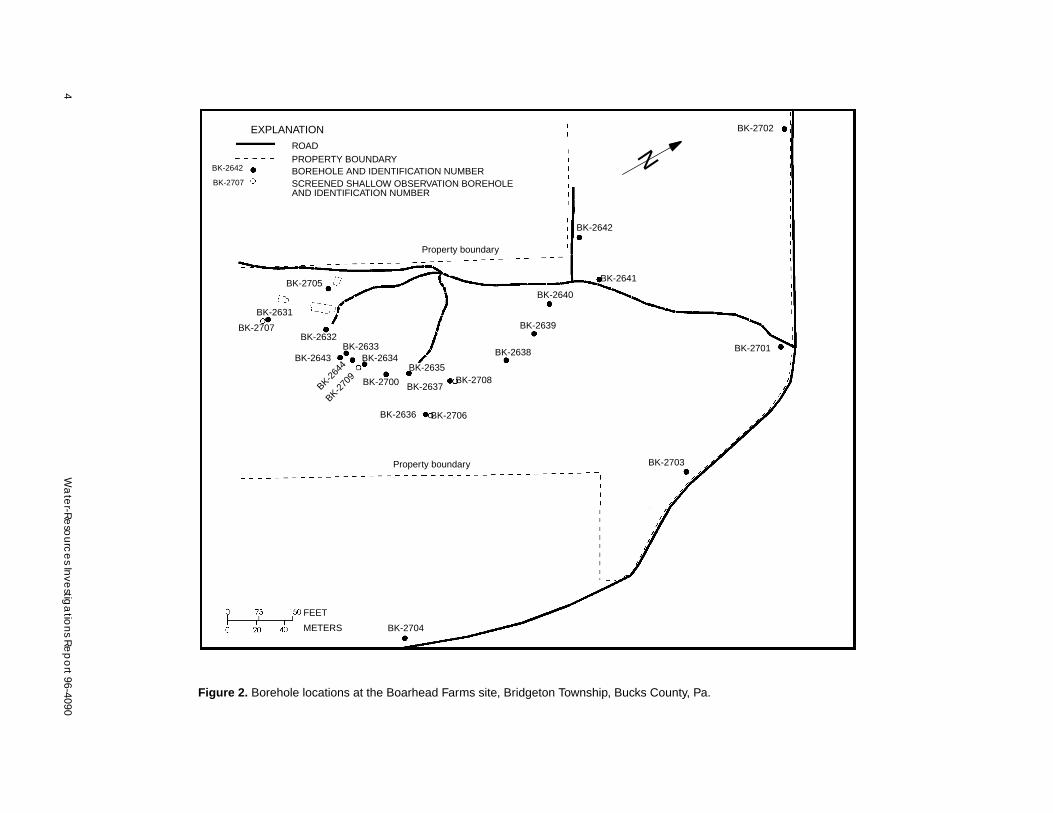
The USEPA Emergency Response contractor for the site drilled 15 boreholes as part of theinvestigation conducted by the USGS. In addition, prior to this study, the USEPA Remedial Investigationscontractor for the site made soil borings to characterize the overburden soil and the weathered bedrockzone. Four of these borings, BK-2706, BK-2707, BK-2708, and BK-2709, which were completed andscreened in the overburden soil or weathered bedrock zone, were used as observation boreholes duringopen-hole constant-discharge tests. The site remedial contractor also drilled five deep on-site boreholes inwhich geophysical logs were run. The borehole network is shown in figure 2. The USGS identificationnumber, site identification number, depth, driller estimated yield, and screened interval, where applicable,for all boreholes used in this investigation are listed in table 1. Boreholes BK-2633, BK-2634, BK-2635,BK-3637, and BK-2644 had a driller reported yield of less than 1 gal/min but yielded no water and werenot tested. Borehole BK-2700 was only drilled to a depth of 24 ft below land surface datum (LSD) and wasnot tested. BK-2700 was screened with 4-in. polyvinyl chloride pipe (PVC) from 4 to 24 ft below LSDbecause of difficulties during drilling.
Methods of Investigation
Borehole geophysical logging, borehole television surveys, slug tests, isolated-zoneconstant-discharge tests, and open-hole constant-discharge tests were used in the investigation tocharacterize the hydrogeologic framework and to determine hydraulic properties of the diabase aquifer.Borehole-geophysical logging and borehole television surveys are effective methods for defininglithostratigraphy, locating potential water-bearing fractures, and locating potential areas of boreholevertical fluid movement. Caliper, natural-gamma, single-point resistance, fluid-resistivity, andfluid-temperature geophysical logs were used at the Boarhead Farms site.
4W
ate
r-Re
sou
rce
s Inve
stiga
tion
s Re
po
rt 96-4090
BK-2702
N
Property boundary
Property boundary
PROPERTY BOUNDARYROAD
EXPLANATION
BOREHOLE AND IDENTIFICATION NUMBER
BK-2631
BK-2632BK-2633
BK-2634BK-2643
BK-264
4
BK-2705
BK-2707
BK-270
9
BK-2635
BK-2636
BK-2637
BK-2639
BK-2640
BK-2700
BK-2704
BK-2706
BK-2708
BK-2638
BK-2642
BK-2703
BK-2641
BK-2701
FEET
METERS
BK-2642
SCREENED SHALLOW OBSERVATION BOREHOLEAND IDENTIFICATION NUMBER
BK-2707
Figure 2. Borehole locations at the Boarhead Farms site, Bridgeton Township, Bucks County, Pa.
Water-Resources Investigations Report 96-4090 5
Caliper logs provide a continuous record of average borehole diameter, which is related to fractures,lithology, and drilling technique. The tool is calibrated at land surface after each caliper log is run. Caliperlogs are used to help correlate lithostratigraphy, to identify fractures that are possible water-bearing zones,and to qualitatively correct other geophysical logs for changes in borehole diameter. Correlation of caliperlogs with single-point resistance, fluid-resistivity, and fluid-temperature logs is useful in identifyingfractures that are either water-producing or water-receiving zones.
Natural-gamma logs, also called gamma-ray logs, record the natural-gamma radiation emitted fromrocks penetrated by the borehole. Uranium-238, thorium-232, and the progeny of their decay series andpotassium-40 are the most common emitters of natural-gamma radiation. These radioactive elements maybe concentrated in clay by adsorption and ion exchange, and fine-grained sediments, such as theunderlying shales and siltstones, typically emit more gamma radiation than diabase. Gamma radiation
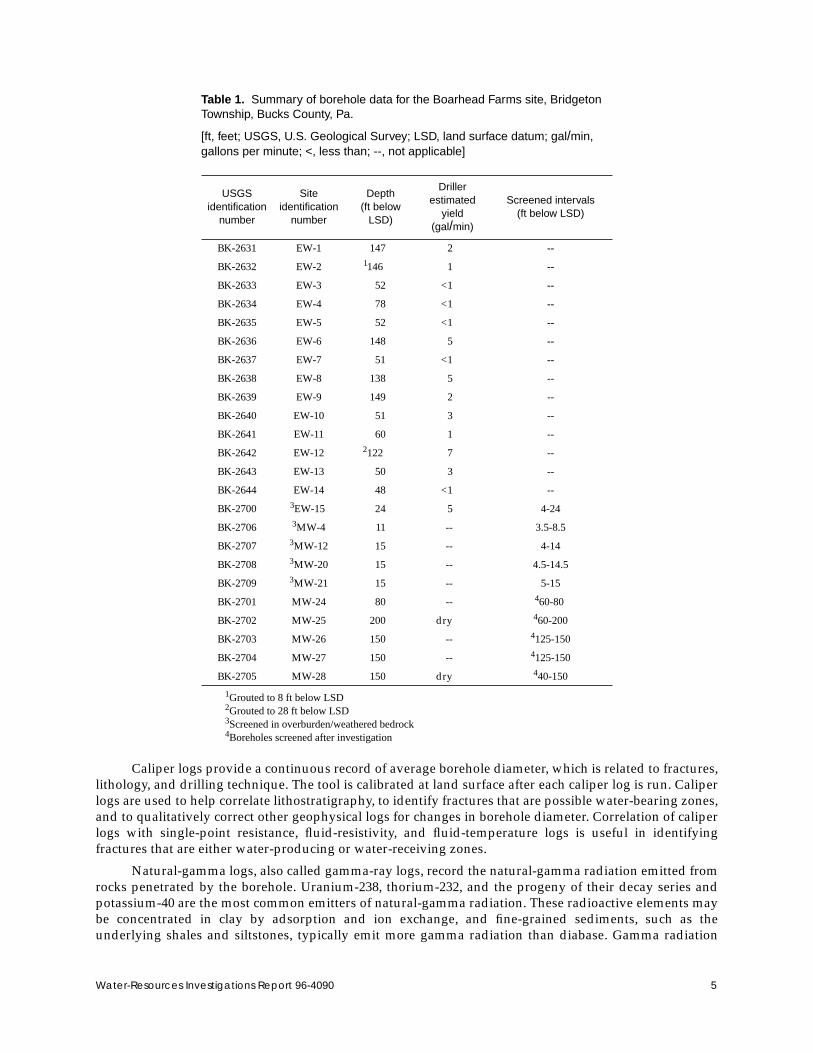
Table 1. Summary of borehole data for the Boarhead Farms site, BridgetonTownship, Bucks County, Pa.
[ft, feet; USGS, U.S. Geological Survey; LSD, land surface datum; gal/min,gallons per minute; <, less than; --, not applicable]
USGSidentification
number
Siteidentification
number
Depth(ft below
LSD)
Drillerestimated
yield(gal/min)
Screened intervals(ft below LSD)
BK-2631 EW-1 147 2 --
BK-2632 EW-2 1146 1 --
BK-2633 EW-3 52 <1 --
BK-2634 EW-4 78 <1 --
BK-2635 EW-5 52 <1 --
BK-2636 EW-6 148 5 --
BK-2637 EW-7 51 <1 --
BK-2638 EW-8 138 5 --
BK-2639 EW-9 149 2 --
BK-2640 EW-10 51 3 --
BK-2641 EW-11 60 1 --
BK-2642 EW-12 2122 7 --
BK-2643 EW-13 50 3 --
BK-2644 EW-14 48 <1 --
BK-2700 3EW-15 24 5 4-24
BK-2706 3MW-4 11 -- 3.5-8.5
BK-2707 3MW-12 15 -- 4-14
BK-2708 3MW-20 15 -- 4.5-14.5
BK-2709 3MW-21 15 -- 5-15
BK-2701 MW-24 80 -- 460-80
BK-2702 MW-25 200 dry 460-200
BK-2703 MW-26 150 -- 4125-150
BK-2704 MW-27 150 -- 4125-150
BK-2705 MW-28 150 dry 440-150
1Grouted to 8 ft below LSD2Grouted to 28 ft below LSD3Screened in overburden/weathered bedrock4Boreholes screened after investigation

6 Water-Resources Investigations Report 96-4090
can be measured through casing, but the gamma response is dampened. The natural-gamma logs are usedto correlate lithostratigraphy. The natural-gamma log was used principally to indicate if a boreholepenetrated the diabase sheet into the underlying shale.
Single-point-resistance logs record the electrical resistance between the borehole and an electricalground at land surface. In general, resistance increases with grain size and decreases with boreholediameter, density of water-bearing fractures, and increasing concentration of dissolved solids in theborehole fluid. A fluid-filled borehole is required for single-point-resistance logs, and logs are run only forthe saturated part of the formation below the casing. Single-point-resistance logs are used to correlatelithostratigraphy and to help identify the location of water-bearing zones.
Fluid-resistivity logs measure the electrical resistivity of fluid in the borehole. Fluid-resistivity logsreflect changes in the concentration of dissolved solids of the borehole fluid. Fluid-resistivity logs are usedto identify water-producing and water-receiving zones and to aid in determining intervals of verticalborehole flow. Water-producing and water-receiving zones commonly are identified by sharp changes influid resistivity. A low resistivity gradient may indicate an interval of borehole flow betweenwater-producing and water-receiving zones.
Fluid-temperature logs provide a continuous record of the temperature of the fluid in the borehole.Temperature logs are used to identify water-producing and water-receiving zones and to determineintervals of vertical borehole flow. Intervals of vertical borehole flow are identified by little or notemperature gradient.
Borehole television surveys are done by lowering a waterproof video camera with a wide angle lensdown the borehole and recording the results on videotape. Television surveys are useful for locatingfractures including vertical fractures that may not be detected by the caliper log. Television surveys can beused to find relatively competent areas of the borehole, which are good places to set packers.
Slug tests were used to determine hydraulic properties of the aquifer near the well bore. Theduration of slug tests are very short and the estimated transmissivity determined from the tests will berepresentative only of water-bearing material close to the borehole (Ferris and others, 1962). The slugapparatus was 3.5 ft long, 4-in. PVC pipe, filled with grout and capped on both ends. The slug apparatuswas quickly submerged in the borehole to displace a finite volume of water. The subsequent water-levelresponse was measured with a downhole pressure transducer. Measurements from the transducer wererecorded with a data logger at the surface.
Data from all slug tests were analyzed with the analytical solution developed by Cooper,Bredehoeft, and Papadopulos (1967). The solution assumes a homogeneous, isotropic, areally extensive,confined aquifer. The method involves normalizing the drawdown data to the highest peak or height ofthe displaced water column and plotting the normalized drawdown as a function of the logarithm of time.Standard-curve matching techniques were used to match the test data to a theoretical type curvedeveloped by Cooper, Bredehoeft, and Papadopulos (1967). For all slug-test analyses, the theoreticaldrawdown curve was matched with the observed drawdown curve for late-time data. Because drillcuttings can fill fractures near the well bore and decrease permeability, which can effect the early-timedata, the early-time data were not used in the curve match analyses. A software package was used toadjust the type curve and calculate transmissivity for each test (Duffield and Rumbaugh, 1991).
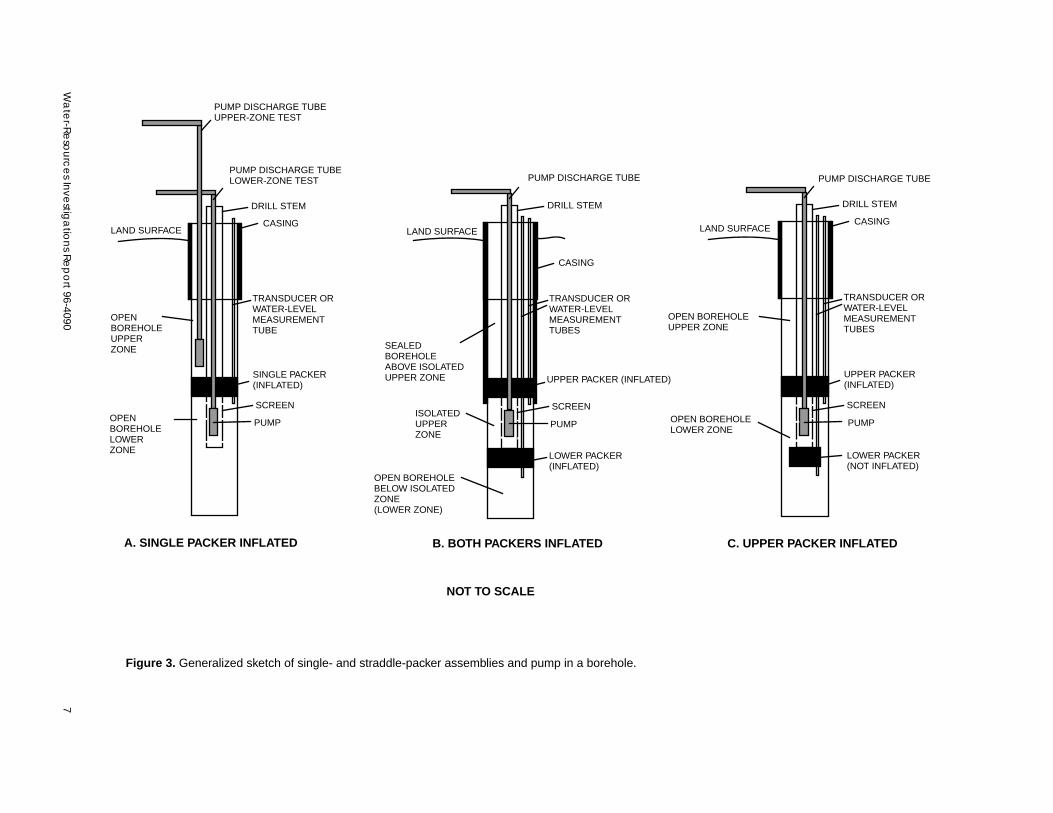
Isolated-zone constant-discharge tests were used to separate shallow and deep aquifer systems anddetermine the hydraulic connection between the two systems. For boreholes BK-2632 and BK-2636, astraddle-packer system was used to isolate fractures just below the bottom of the casing (fig. 3B). Forboreholes BK-2631, BK-2639, BK-2640, BK-2641, BK-2642, and BK-2643, a single-packer system was used toseparate the upper and lower parts of the borehole (fig. 3A).
For the isolated-zone constant-discharge tests of boreholes using the straddle-packer system bothpackers were inflated (fig. 3B). The distance from the center of the upper packer to the center of the lowerpacker was 18.6 ft. The upper packer was inflated just above the bottom of the steel casing. After inflationof the packers, water levels were measured with electric tapes in the isolated upper zone and the lowerzone below the lower packer. After the water levels in the two zones stabilized, a pressure transducer wassuspended in the isolated upper zone. The pressure transducer was calibrated by measuring pressure attwo different known depths. Measurements from the transducer were recorded by a data logger. Asubmersible pump was lowered into the isolated upper zone, and the borehole was pumped for about60 minutes.
Wa
ter-R
eso
urc
es In
vestig
atio
ns R
ep
ort 96-4090
7
LAND SURFACE
PUMP DISCHARGE TUBELOWER-ZONE TEST
DRILL STEM
CASING
TRANSDUCER ORWATER-LEVELMEASUREMENTTUBE
SCREEN
OPENBOREHOLEUPPERZONE
SINGLE PACKER(INFLATED)
PUMPOPENBOREHOLELOWERZONE
A. SINGLE PACKER INFLATED
NOT TO SCALE
LAND SURFACE
PUMP DISCHARGE TUBE
DRILL STEM
CASING
TRANSDUCER ORWATER-LEVELMEASUREMENTTUBES
SCREEN
OPEN BOREHOLEUPPER ZONE
UPPER PACKER(INFLATED)
PUMPOPEN BOREHOLELOWER ZONE
LOWER PACKER(NOT INFLATED)
C. UPPER PACKER INFLATED
LAND SURFACE
PUMP DISCHARGE TUBE
DRILL STEM
CASING
TRANSDUCER ORWATER-LEVELMEASUREMENTTUBES
SCREEN
OPEN BOREHOLEBELOW ISOLATEDZONE(LOWER ZONE)
SEALEDBOREHOLEABOVE ISOLATEDUPPER ZONE UPPER PACKER (INFLATED)
PUMPISOLATEDUPPERZONE
LOWER PACKER(INFLATED)
B. BOTH PACKERS INFLATED
PUMP DISCHARGE TUBEUPPER-ZONE TEST
Figure 3. Generalized sketch of single- and straddle-packer assemblies and pump in a borehole.
8 Water-Resources Investigations Report 96-4090
After the isolated upper zone test was completed, the packer string was lowered in the borehole andonly the upper packer was inflated (fig. 3C). Pressure transducers were suspended in the lower and upperzones after water levels in the two zones stabilized. Both transducers were re-calibrated. A submersiblepump was lowered into the lower zone, and the zone was pumped for about 60 minutes or until the zonewas dewatered.
For the isolated-zone constant-discharge tests of boreholes using a single-packer system, a singlepacker was used to separate the upper and lower parts of the boreholes (fig. 3A). After inflation of thepacker, water levels were measured with electric tapes above and below the packer. Pressure transducerswere suspended in the upper and lower zones after the water levels in the two zones stabilized. Bothtransducers were calibrated by measuring pressure at two different depths in their respective zones.Measurements from the transducers were recorded by a data logger A submersible pump was loweredinto the upper zone until it rested on the packer, and the zone was pumped for about 60 minutes. Thewater-level changes were recorded by the data logger. For the constant-discharge test of the lower zone,the packer and transducers were left in place (fig. 3A). A submersible pump lowered into the lower zone,and the zone was pumped for about 60 minutes or until the zone was dewatered. The water-level changeswere recorded by the data logger. For both the upper and lower isolated-zone constant-discharge tests,specific capacities were determined at the end of the pumping period. Specific capacity is determined bydividing drawdown, in feet, by the pumping rate, in gallons per minute.
Open-hole constant-discharge tests were used to determine aquifer transmissivity and the hydraulicconnections between adjacent boreholes. For all tests, a pressure transducer was installed in the pumpedborehole. The transducer was calibrated by measuring pressure at two different known depths.Measurements from the transducer were recorded by a data logger at the surface. Water-level changes innearby observation boreholes were measured with pressure transducers or electric tapes. Electric-tapemeasurements also were taken in boreholes equipped with pressure transducers at irregular time intervalsto verify transducer performance.
For the open-hole constant-discharge tests, the only equipment suspended in the borehole was apump, a discharge line, and a transducer. All discharge water was pumped to holding tanks. All boreholeswere open to the atmosphere.
Because the boreholes were 8-in. in diameter and the boreholes were pumped at a low rate, waterderived from well-bore storage had to be eliminated to estimate transmissivity. This was done by using theanalytical solution developed by Papadopulos and Cooper (1967). The method involves plotting thelogarithm of drawdown as a function of the logarithm of time overlain by type curves developed byPapadopulos and Cooper (1967) and presented in Reed (1980). Standard curve-matching techniques wereused to match the test data to a theoretical type curve. A match point was chosen, and transmissivity wascalculated with the equation presented in Reed (1980, p. 40). This analytical method assumes an extensive,homogeneous, isotropic, fully confined aquifer. An extensive aquifer can be assumed because of the shorttest duration and low withdrawal rates that spatially affect only a small part of the aquifer.
Discharge rates adjusted for a common 8-hour pumping period were estimated for boreholes inwhich open-hole constant-discharge tests were completed. The discharge rates were estimated from dataon transmissivity, storage coefficient, maximum available drawdown, well radius, and the 8-hour timeperiod. A storage coefficient of 0.0001 was assumed, and maximum available drawdown was defined asthe difference in depth between static water level and the depth of the first water-bearing fracture. Theestimated discharge rates were calculated by rearranging the Theis (1935) equation presented in Reed(1980, p. 6) and solving for the pumping rate.
HYDROGEOLOGIC FRAMEWORK OF THE DIABASE AQUIFER
On the basis of USEPA remedial contractor boring logs from 21 shallow boreholes, the overburdensoil was characterized as a clayey-silt loam with some sand. Clay also filled the weathered bedrock zone.The clay in the soil and in the weathered bedrock zone is considered a confining unit. The overburden soilcontained no water. The thickness of the overburden soil ranged from 4 to 14 ft. Because of the clay-richsoil and the thin weathered bedrock zone, little ground-water storage is available to supply the shallow
Water-Resources Investigations Report 96-4090 9
fracture system. The thickness of weathered bedrock ranged from 2 to 15 ft with some clay filling theopenings of the broken rock. The first water-bearing zone penetrated during boring was in the weatheredzone.
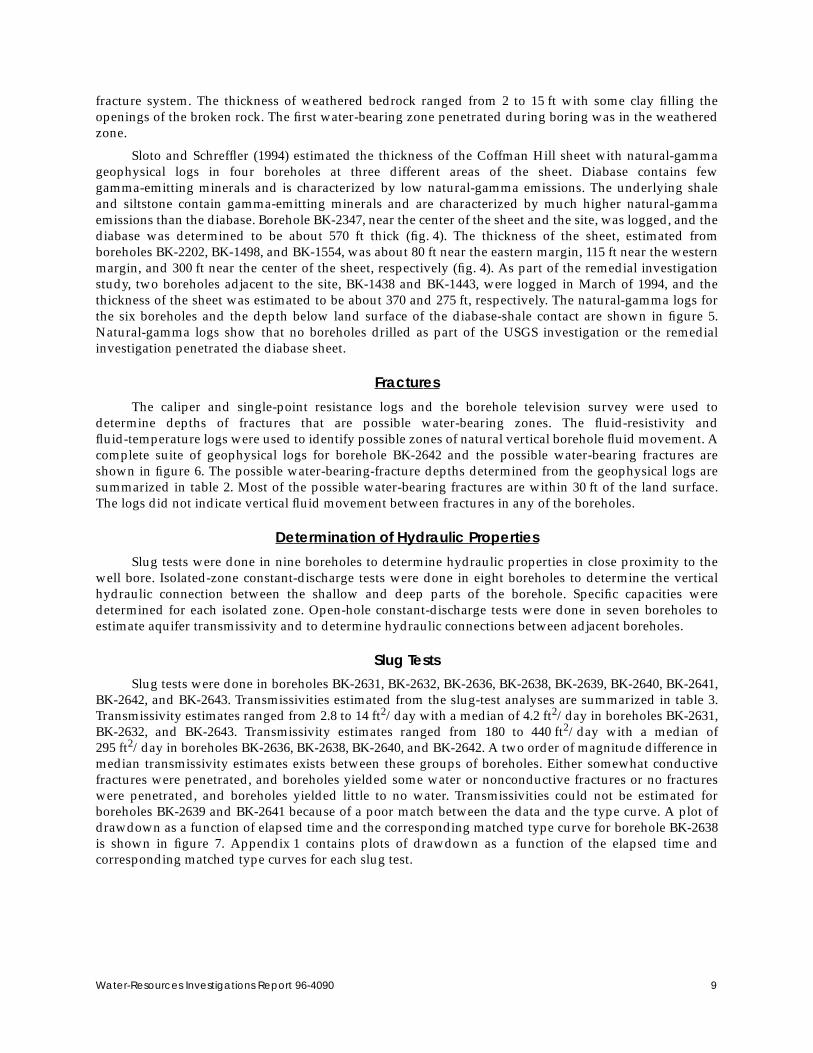
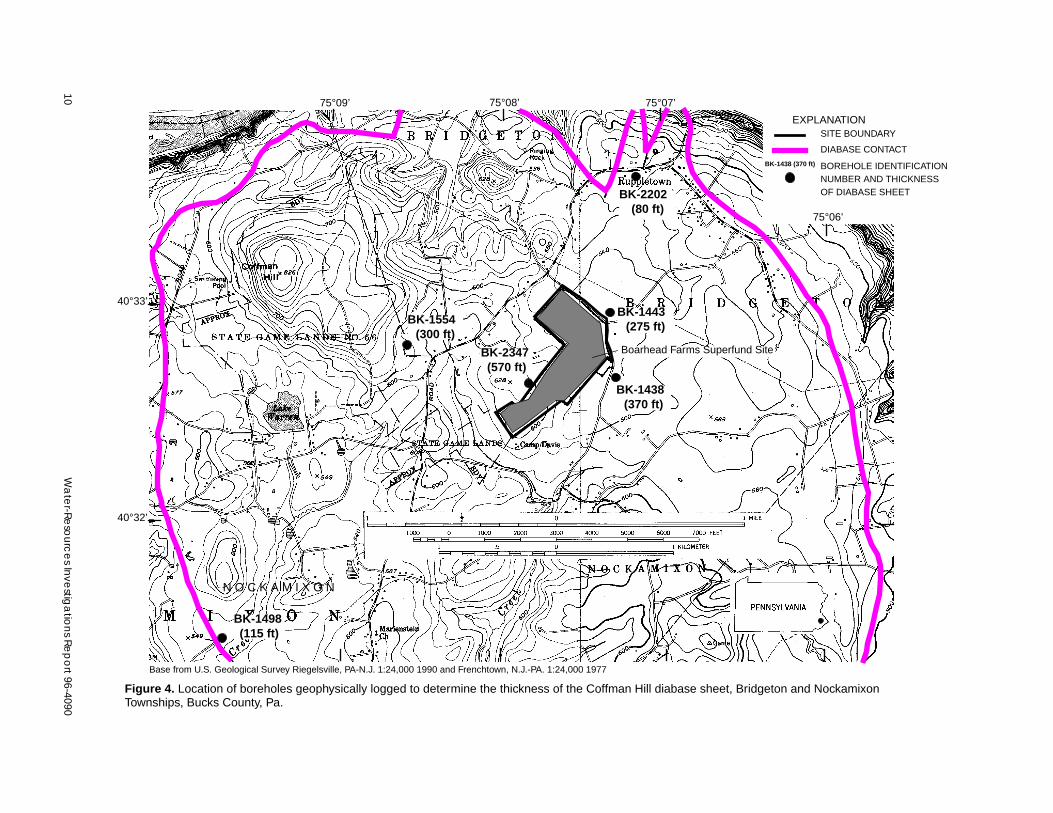
Sloto and Schreffler (1994) estimated the thickness of the Coffman Hill sheet with natural-gammageophysical logs in four boreholes at three different areas of the sheet. Diabase contains fewgamma-emitting minerals and is characterized by low natural-gamma emissions. The underlying shaleand siltstone contain gamma-emitting minerals and are characterized by much higher natural-gammaemissions than the diabase. Borehole BK-2347, near the center of the sheet and the site, was logged, and thediabase was determined to be about 570 ft thick (fig. 4). The thickness of the sheet, estimated fromboreholes BK-2202, BK-1498, and BK-1554, was about 80 ft near the eastern margin, 115 ft near the westernmargin, and 300 ft near the center of the sheet, respectively (fig. 4). As part of the remedial investigationstudy, two boreholes adjacent to the site, BK-1438 and BK-1443, were logged in March of 1994, and thethickness of the sheet was estimated to be about 370 and 275 ft, respectively. The natural-gamma logs forthe six boreholes and the depth below land surface of the diabase-shale contact are shown in figure 5.Natural-gamma logs show that no boreholes drilled as part of the USGS investigation or the remedialinvestigation penetrated the diabase sheet.
Fractures
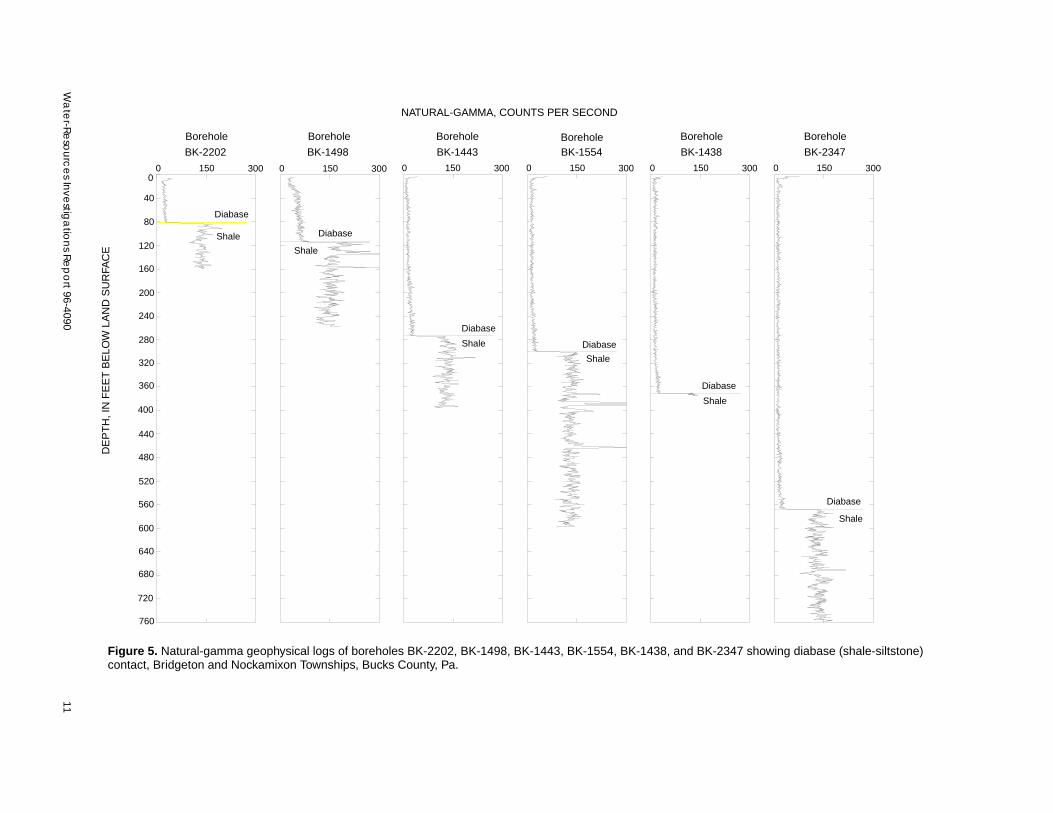
The caliper and single-point resistance logs and the borehole television survey were used todetermine depths of fractures that are possible water-bearing zones. The fluid-resistivity andfluid-temperature logs were used to identify possible zones of natural vertical borehole fluid movement. Acomplete suite of geophysical logs for borehole BK-2642 and the possible water-bearing fractures areshown in figure 6. The possible water-bearing-fracture depths determined from the geophysical logs aresummarized in table 2. Most of the possible water-bearing fractures are within 30 ft of the land surface.The logs did not indicate vertical fluid movement between fractures in any of the boreholes.
Determination of Hydraulic Properties
Slug tests were done in nine boreholes to determine hydraulic properties in close proximity to thewell bore. Isolated-zone constant-discharge tests were done in eight boreholes to determine the verticalhydraulic connection between the shallow and deep parts of the borehole. Specific capacities weredetermined for each isolated zone. Open-hole constant-discharge tests were done in seven boreholes toestimate aquifer transmissivity and to determine hydraulic connections between adjacent boreholes.
Slug TestsSlug tests were done in boreholes BK-2631, BK-2632, BK-2636, BK-2638, BK-2639, BK-2640, BK-2641,
BK-2642, and BK-2643. Transmissivities estimated from the slug-test analyses are summarized in table 3.Transmissivity estimates ranged from 2.8 to 14 ft2/day with a median of 4.2 ft2/day in boreholes BK-2631,BK-2632, and BK-2643. Transmissivity estimates ranged from 180 to 440 ft2/day with a median of295 ft2/day in boreholes BK-2636, BK-2638, BK-2640, and BK-2642. A two order of magnitude difference inmedian transmissivity estimates exists between these groups of boreholes. Either somewhat conductivefractures were penetrated, and boreholes yielded some water or nonconductive fractures or no fractureswere penetrated, and boreholes yielded little to no water. Transmissivities could not be estimated forboreholes BK-2639 and BK-2641 because of a poor match between the data and the type curve. A plot ofdrawdown as a function of elapsed time and the corresponding matched type curve for borehole BK-2638is shown in figure 7. Appendix 1 contains plots of drawdown as a function of the elapsed time andcorresponding matched type curves for each slug test.
10W
ate
r-Re
sou
rce
s Inve
stiga
tion
s Re
po
rt 96-4090
BK-1438(370 ft)
BK-1443(275 ft)
BK-2347(570 ft)
BK-2202(80 ft)
BK-1554(300 ft)
BK-1498(115 ft)
EXPLANATION
DIABASE CONTACT
SITE BOUNDARY
75°09’ 75°08’ 75°07’
75°06’
Boarhead Farms Superfund Site
40°33’
40°32’
BK-1438 (370 ft)
NUMBER AND THICKNESS
N O C K A M I X O N
OF DIABASE SHEET
Figure 4. Location of boreholes geophysically logged to determine the thickness of the Coffman Hill diabase sheet, Bridgeton and NockamixonTownships, Bucks County, Pa.
Base from U.S. Geological Survey Riegelsville, PA-N.J. 1:24,000 1990 and Frenchtown, N.J.-PA. 1:24,000 1977
BOREHOLE IDENTIFICATION
Wa
ter-R
eso
urc
es In
vestig
atio
ns R
ep
ort 96-4090
11
0 150 300 0 150 300 0 150 3000 150 300 0 150 3000 150 3000
40
80
120
DE
PT
H, I
N F
EE
T B
ELO
W L
AN
D S
UR
FAC
E
160
200
240
280
320
360
400
440
480
520
560
600
640
680
720
760
BK-2202 BK-1498 BK-1443 BK-1554 BK-1438 BK-2347
NATURAL-GAMMA, COUNTS PER SECOND
Borehole Borehole Borehole
Diabase
Shale
DiabaseShale
Borehole Borehole Borehole
Diabase
Diabase
Diabase
Diabase
Shale
Shale
Shale
Shale
Figure 5. Natural-gamma geophysical logs of boreholes BK-2202, BK-1498, BK-1443, BK-1554, BK-1438, and BK-2347 showing diabase (shale-siltstone)contact, Bridgeton and Nockamixon Townships, Bucks County, Pa.
12W
ate
r-Re
sou
rce
s Inve
stiga
tion
s Re
po
rt 96-4090
DE
PT
H, I
N F
EE
T B
ELO
W L
AN
D S
UR
FAC
EHOLE DIAMETER,
IN INCHES IN COUNTS PER SECONDSINGLE-POINT RESISTANCE,
IN OHMSFLUID TEMPERATURE,DEGREES CELSIUS
FLUID RESISTIVITY,IN OHM-METERS
NATURAL-GAMMA,
7 8 9 0 40 80 18,00011,0004,000 9 10.5 12 100 120
Possiblewater-bearing
fractures
Possiblewater-bearing
fractures
0
10
20
30
40
50
60
70
80
90
100
110
120
130
80
BOREHOLE TVSURVEY
Horizontal fractures
Figure 6. Geophysical logs and borehole television survey from borehole BK-2642, Boarhead Farms site, Bridgeton Township, Bucks County, Pa.

Wa
ter-R
eso
urc
es In
vestig
atio
ns R
ep
ort 96-4090
13
0
1.0
0
0.2
0.4
0.6
0.8
DR
AW
DO
WN
, IN
FE
ET
0.00001 0.10.0001 0.001 0.01
TIME, IN DAYS
NORMALIZED SLUG DATA POINT
1.0
0
0.2
0.4
0.6
0.8
H/H
O
0.00001 0.10.0001 0.001 0.01
TYPE CURVE
TIME, IN DAYS
Figure 7. Drawdown versus logarithm of time and corresponding type curve for slug test of borehole BK-2638, Boarhead Farms site,Bridgeton Township, Bucks County, Pa.

14 Water-Resources Investigations Report 96-4090
Table 2. Summary of borehole geophysical logging done by U.S. Geological Survey and fractures at theBoarhead Farms site, Bridgeton Township, Bucks County, Pa.
[USGS, U.S. Geological Survey; C, caliper log; G, natural-gamma log; S, single-point-resistancelog; F, fluid- resistivity log; T, fluid-temperature log; L, borehole television survey; ft, feet; LSD,land surface datum; --, no apparent water-bearing zones]
USGSidentification
number
Date boreholelogged
Geophysical logsand televisionsurveys run
Maximum depthlogged
(ft below LSD)
Depth of casing(ft below LSD)
Depth of fractures(ft below LSD)
BK-2631 August 9, 1994 C, G, S, F, T, L 147 11 15, 22
BK-2632 August 9, 1994 C, G, S, F, T, L 148 16 18, 19.5, 22.5, 29
BK-2634 October 11, 1994 C, G, S, F, T, L 78 13 17.5, 19, 23
BK-2635 August 8, 1994 C, G, S, F, T, L 52 13 --
BK-2636 August 8, 1994 C, G, S, F, T, L 148 18 18
BK-2637 August 8, 1994 C, G 52 19 --
BK-2638 August 9, 1994 C, G, S, F, T 138 14 14.5
BK-2639 August 8, 1994 C, G, S, F, T, L 149 10 12
BK-2640 October 7, 1994 C, G, S, F, T, L 51 13 25, 35, 51
BK-2641 August 8, 1994 C, G, S, F, T, L 60 13 16.5, 18
BK-2642 October 12, 1994 C, G, S, F, T, L 122 9 13, 21, 23, 25.5, 63
BK-2643 October 11, 1994 C, G, S, F, T, L 50 16 28
BK-2644 October 11, 1994 C, G, S, F, T, L 49 13 --
BK-2701 October 7, 1994 C, G, S, F, T 188 30 --
BK-2702 October 11, 1994 C, G 199 33 --
BK-2703 October 11, 1994 C, G, S, F, T 149 30 --
BK-2704 October 11, 1994 C, G, S, F, T 147 30 --
BK-2705 October 12, 1994 C, G 148 29 --
Table 3. Transmissivity determined by slug tests,Boarhead Farms site, Bridgeton Township, BucksCounty, Pa.
[USGS, U.S. Geological Survey; ft2/day, square feetper day: --, not determined]
USGSidentification
numberDate of test
Transmissivityestimates(ft2/day)
BK-2631 September 7, 1994 4.2
BK-2632 September 7, 1994 2.8
BK-2636 September 6, 1994 320
BK-2638 September 7, 1994 270
BK-2639 September 7, 1994 --1
BK-2640 September 7, 1994 180
BK-2641 September 6, 1994 --1
BK-2642 September 6, 1994 440
BK-2643 September 7, 1994 14
1No acceptable curve matches were obtained.
Water-Resources Investigations Report 96-4090 15
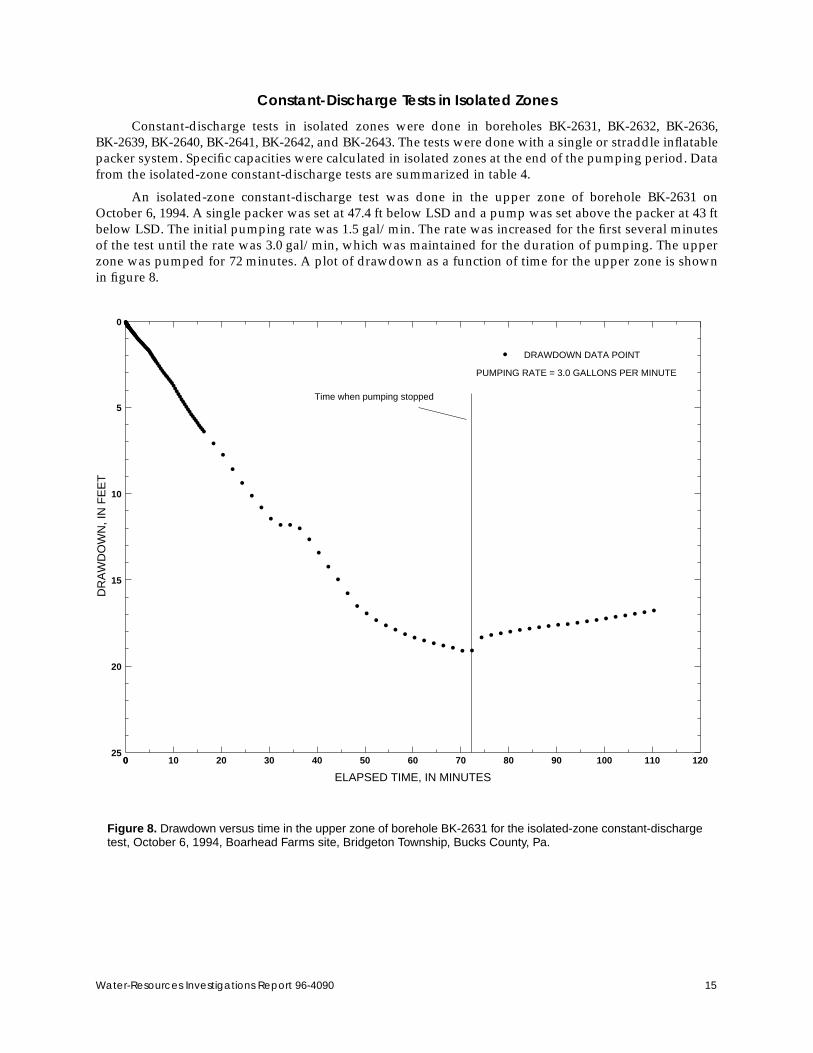
Constant-Discharge Tests in Isolated Zones
Constant-discharge tests in isolated zones were done in boreholes BK-2631, BK-2632, BK-2636,BK-2639, BK-2640, BK-2641, BK-2642, and BK-2643. The tests were done with a single or straddle inflatablepacker system. Specific capacities were calculated in isolated zones at the end of the pumping period. Datafrom the isolated-zone constant-discharge tests are summarized in table 4.
An isolated-zone constant-discharge test was done in the upper zone of borehole BK-2631 onOctober 6, 1994. A single packer was set at 47.4 ft below LSD and a pump was set above the packer at 43 ftbelow LSD. The initial pumping rate was 1.5 gal/min. The rate was increased for the first several minutesof the test until the rate was 3.0 gal/min, which was maintained for the duration of pumping. The upperzone was pumped for 72 minutes. A plot of drawdown as a function of time for the upper zone is shownin figure 8.
0
25
5
10
15
20
DR
AW
DO
WN
, IN
FE
ET
0 1200 10 20 30 40 50 60 70 80 90 100 110
ELAPSED TIME, IN MINUTES
DRAWDOWN DATA POINT
Time when pumping stopped
PUMPING RATE = 3.0 GALLONS PER MINUTE
Figure 8. Drawdown versus time in the upper zone of borehole BK-2631 for the isolated-zone constant-dischargetest, October 6, 1994, Boarhead Farms site, Bridgeton Township, Bucks County, Pa.

16W
ate
r-Re
sou
rce
s Inve
stiga
tion
s Re
po
rt 96-4090
Table 4. Specific capacity determined by isolated-zone constant-discharge tests, Boarhead Farms site, Bridgeton Township, Bucks County, Pa.
[USGS, U.S. Geological Survey; ft, feet; LSD, land surface datum; gal/min, gallons per minute; min, minutes; gal/min/ft, gallons per minute per foot ofdrawdown; < less than; --, not determined]
USGSidentification
numbersDate of test
Packer setting(ft below LSD)
Pumping rate (gal/min) Pumping duration (min) Specific Capacity (gal/min/ft)Remarks
Upper zone Lower zone Upper zone Lower zone Upper zone Lower zone
BK-2631 October 6, 1994 47.4 3.0 1.5 72 16 0.16 -- Lower zone pumped dry
BK-2632(Upper Zone)
September 27, 1994 115.6/34.2 1.3 -- 47 -- .06 --
BK-2632(Lower Zone)
September 28, 1994 57.6 -- 1.3 -- 14 -- -- Lower zone pumped dry
BK-2636(Upper Zone)
September 22, 1994 216.5/35.1 4.1 -- 60 -- .89 --
BK-2636(Lower Zone)
September 22, 1994 58.0 -- <1.0 -- 12 -- -- Lower zone pumped dry
BK-2639 September 29, and October 4, 1994
47.4 3.5 2.0 50 11 .10 -- Lower zone pumped dry
BK-2640 September 27, 1994 27.3 3.3 -- 54 -- .60 --
BK-2641 September 28 and 29,1994
27.0 0.5 1.5 68 19 .02 -- Lower zone pumped dry
BK-2642 October 4 and 5, 1994 67.9 4.5 3.0 72 5 1.1 -- Lower zone pumped dry
BK-2643 October 5, 1994 26.6 1.7 2.8 35 68 -- 0.11 Upper zone pumped dry
1Upper packer set at 15.6 feet below LSD; lower packer set at 34.2 feet below LSD2Upper packer set at 16.5 feet below LSD; lower packer set at 35.1 feet below LSD
Water-Resources Investigations Report 96-4090 17
Maximum drawdown in the upper zone was 19.10 ft, and maximum drawdown in the lower zonewas 0.49 ft. However, the pressurization of the packer caused the 0.49 ft water-level decline in the lowerzone. Packer pressurization displaces a finite volume of water and causes the water levels in both zones torise. Because of the low permeability of the lower zone, the displaced water did not have sufficient time toenter the formation for the water level to stabilize. After 46 minutes of stabilization time and beforepumping began, the water level in the lower zone was 3.10 ft higher than the water level in the upperzone. The water level in the lower zone continued to decline throughout the duration of the pumping andrecovery periods of the upper-zone test, which also indicates the water level in the lower zone had notstabilized. Therefore, the water level in the lower zone was not at static conditions when pumping began.
No vertical hydraulic connection between the upper and lower zones was apparent. Specificcapacity of the upper zone was 0.16 (gal/min)/ft after 72 minutes of pumping.
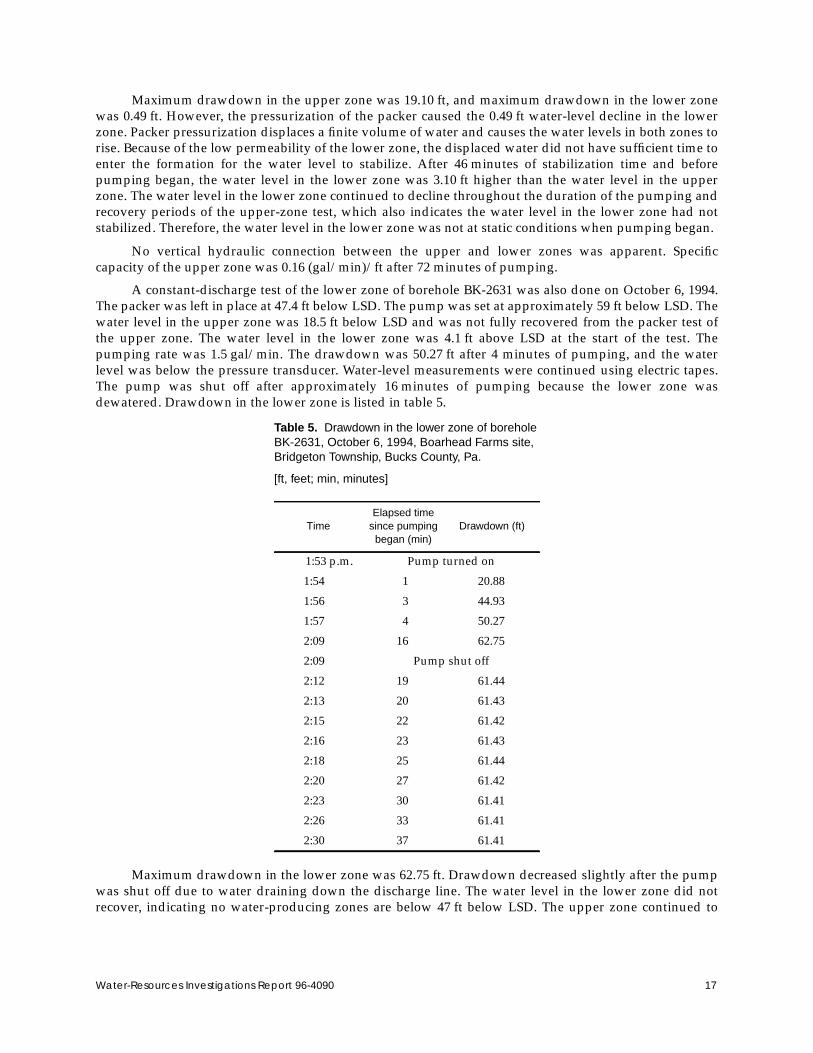
A constant-discharge test of the lower zone of borehole BK-2631 was also done on October 6, 1994.The packer was left in place at 47.4 ft below LSD. The pump was set at approximately 59 ft below LSD. Thewater level in the upper zone was 18.5 ft below LSD and was not fully recovered from the packer test ofthe upper zone. The water level in the lower zone was 4.1 ft above LSD at the start of the test. Thepumping rate was 1.5 gal/min. The drawdown was 50.27 ft after 4 minutes of pumping, and the waterlevel was below the pressure transducer. Water-level measurements were continued using electric tapes.The pump was shut off after approximately 16 minutes of pumping because the lower zone wasdewatered. Drawdown in the lower zone is listed in table 5.
Maximum drawdown in the lower zone was 62.75 ft. Drawdown decreased slightly after the pumpwas shut off due to water draining down the discharge line. The water level in the lower zone did notrecover, indicating no water-producing zones are below 47 ft below LSD. The upper zone continued to
Table 5. Drawdown in the lower zone of boreholeBK-2631, October 6, 1994, Boarhead Farms site,Bridgeton Township, Bucks County, Pa.
[ft, feet; min, minutes]
TimeElapsed time
since pumpingbegan (min)
Drawdown (ft)
1:53 p.m. Pump turned on
1:54 1 20.88
1:56 3 44.93
1:57 4 50.27
2:09 16 62.75
2:09 Pump shut off
2:12 19 61.44
2:13 20 61.43
2:15 22 61.42
2:16 23 61.43
2:18 25 61.44
2:20 27 61.42
2:23 30 61.41
2:26 33 61.41
2:30 37 61.41

18 Water-Resources Investigations Report 96-4090
recover while the lower zone was being pumped, which suggests no vertical hydraulic connectionbetween the lower and upper zones. Specific capacity of the lower zone was not determined because thedrawdown could be attributed to only withdrawing water from borehole storage.
An isolated-zone constant-discharge test was done in the upper zone of borehole BK-2632 onSeptember 27, 1994. A straddle packer was set with the center of the upper packer at 15.6 ft below LSD,which was above the bottom of the steel casing. The center of the lower packer was set at 34.2 ft belowLSD. A pump was set at 27 ft below LSD. The initial pumping rate was 2.5 gal/min. The rate was loweredto 1.3 gal/min after 8 minutes of pumping, which was maintained for the duration of the test. The upperzone was pumped for 47 minutes. A plot of drawdown as a function of time for the upper zone is shownin figure 1 of appendix 2.
Maximum drawdown in the upper zone was 20.35 ft. No water-level change was measured in thelower zone. No vertical hydraulic connection between the upper and lower zone was apparent. Specificcapacity of the upper zone was 0.06 (gal/min)/ft after 47 minutes of pumping.
On September 28, 1994, the packer string was lowered in borehole BK-2632. The upper packer wasinflated with the center of the packer set at 57.6 ft below LSD. A pump was set below the packer at a depthof approximately 69 ft below LSD. The initial pumping rate was 1.3 gal/min. Drawdown was 50.29 ft after10 minutes of pumping and discharge from the zone stopped. The pump was shut off after 14 minutes ofpumping because the lower zone was dewatered. A plot of drawdown as a function of time for the lowerzone in borehole BK-2632 is shown in figure 9.
0
60
10
20
30
40
50
DR
AW
DO
WN
, IN
FE
ET
0 300 5 10 15 20 25
ELAPSED TIME, IN MINUTES
DRAWDOWN DATA POINT
Time when pumping stopped
PUMPING RATE = 1.3 GALLONS PER MINUTE
Discharge from lower zonestopped
Figure 9. Drawdown versus time in lower zone of borehole BK-2632 for isolated-zone constant-discharge test,September 28, 1994, Boarhead Farms site, Bridgeton Township, Bucks County, Pa.

Water-Resources Investigations Report 96-4090 19
Maximum drawdown in the lower zone was 50.29 ft. The water level of the lower zone did notrecover, indicating no significant water-producing zones are below 58 ft below LSD. Maximum drawdownin the upper zone was 0.13 ft, which was probably because of a small leak in the seal of the packer. Novertical hydraulic connection between the lower and upper zones was apparent. Specific capacity of thelower zone was not determined because the drawdown could be attributed to only withdrawing waterfrom borehole storage.
An isolated-zone constant-discharge test was done in the upper zone of borehole BK-2636 onSeptember 22, 1994. A straddle packer was set with the center of the upper packer at 16.5 ft below LSD,which was above the bottom of the steel casing. The center of the lower packer was set at 35.1 ft belowLSD. A pump was set at approximately 28 ft below LSD. The pumping rate was 4.1 gal/min. The upperzone was pumped for 60 minutes. Because of pressure transducer malfunctions, water-levelmeasurements in borehole BK-2636 were made with electric tapes. A plot of drawdown as a function oftime for the upper zone is shown in figure 2 of appendix 2.
Maximum drawdown in the upper zone was 4.62 ft. The lower zone had a static water level of 4.38 ftbelow the top of the riser pipe just before the start of pumping. At the end of pumping, the water level inthe lower zone was 4.92 ft below the top of the riser pipe. Pressurization of the packer caused the 0.54 ftwater-level decline in the lower zone during the test. The water level in the upper zone recovered towithin 0.32 ft of initial static level 10 minutes after the pump was shut off. The water level in the lowerzone continued to decline, which indicates the lower zone was not at static conditions when the test began.
No vertical hydraulic connection between the upper and lower zone was apparent. Drawdown inthe upper and lower zones are listed in table 6. Specific capacity of the upper zone was 0.89 (gal/min)/ftafter 60 minutes of pumping.
Table 6. Drawdown in the upper and lower zones of borehole BK-2636 during upper-isolated-zone test onSeptember 22, 1994, Boarhead Farms site, Bridgeton Township, Bucks County, Pa.
[ft, feet; min, minutes; --, measurement not taken]
TimeElapsed time
since pumpingbegan (min)
Drawdown (ft)Time
Elapsed timesince pumping
began (min)
Drawdown (ft)
Upper Zone Lower Zone Upper Zone Lower Zone
1:28 p.m. Pump turned on 2:08 p.m. 40 4.52 0.37
1:29 1 3.88 0.01 2:13 45 4.55 --
1:30 2 3.92 -- 2:18 50 4.58 --
1:31 3 4.04 .01 2:23 55 4.61 --
1:32 4 4.08 -- 2:28 Pump shut off 4.62 .54
1:33 5 4.10 -- 2:29 61 .60 --
1:34 6 4.15 .02 2:30 62 .55 --
1:36 8 4.20 .07 2:31 63 .50 .55
1:38 10 4.24 .10 2:32 64 .47 --
1:40 12 4.29 -- 2:33 65 .43 --
1:42 14 4.31 -- 2:34 66 .40 .58
1:46 18 4.36 .18 2:35 67 .39 --
1:48 20 4.38 -- 2:36 68 .37 --
1:53 25 4.42 .26 2:37 69 .35 --
1:58 30 4.48 .29 2:38 70 .32 --
2:03 35 4.49 -- 2:39 71 .30 --
20 Water-Resources Investigations Report 96-4090
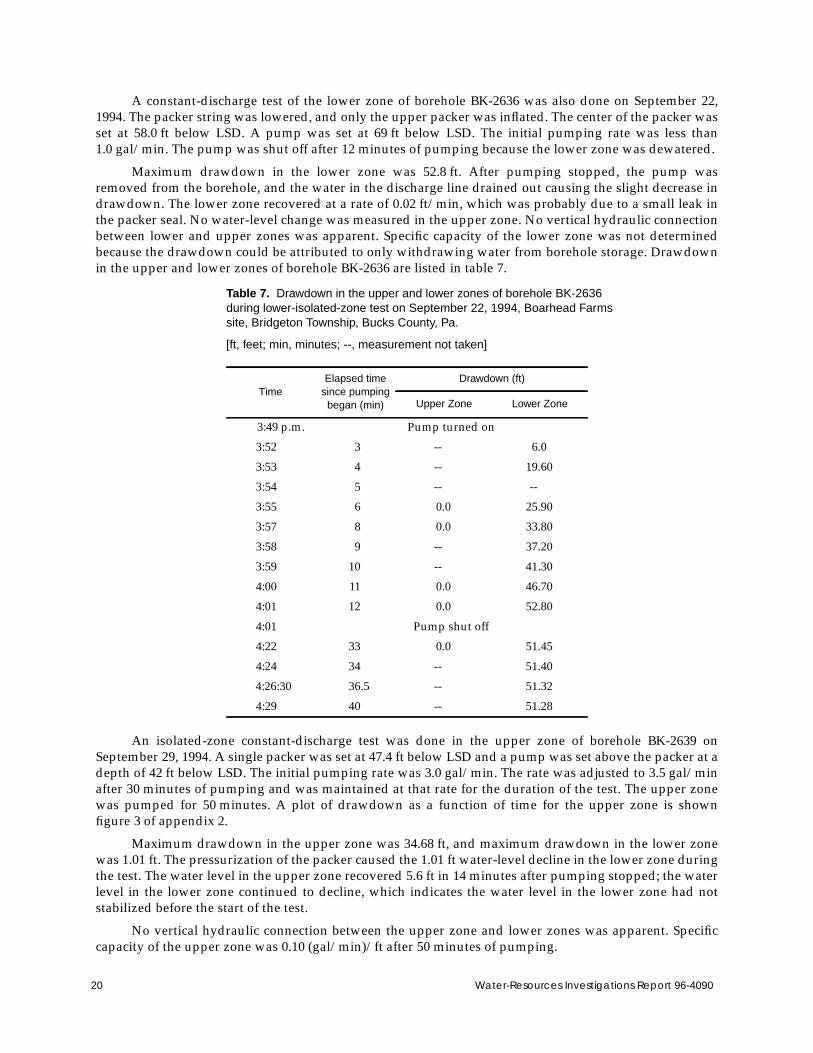
A constant-discharge test of the lower zone of borehole BK-2636 was also done on September 22,1994. The packer string was lowered, and only the upper packer was inflated. The center of the packer wasset at 58.0 ft below LSD. A pump was set at 69 ft below LSD. The initial pumping rate was less than1.0 gal/min. The pump was shut off after 12 minutes of pumping because the lower zone was dewatered.
Maximum drawdown in the lower zone was 52.8 ft. After pumping stopped, the pump wasremoved from the borehole, and the water in the discharge line drained out causing the slight decrease indrawdown. The lower zone recovered at a rate of 0.02 ft/min, which was probably due to a small leak inthe packer seal. No water-level change was measured in the upper zone. No vertical hydraulic connectionbetween lower and upper zones was apparent. Specific capacity of the lower zone was not determinedbecause the drawdown could be attributed to only withdrawing water from borehole storage. Drawdownin the upper and lower zones of borehole BK-2636 are listed in table 7.
An isolated-zone constant-discharge test was done in the upper zone of borehole BK-2639 onSeptember 29, 1994. A single packer was set at 47.4 ft below LSD and a pump was set above the packer at adepth of 42 ft below LSD. The initial pumping rate was 3.0 gal/min. The rate was adjusted to 3.5 gal/minafter 30 minutes of pumping and was maintained at that rate for the duration of the test. The upper zonewas pumped for 50 minutes. A plot of drawdown as a function of time for the upper zone is shownfigure 3 of appendix 2.
Maximum drawdown in the upper zone was 34.68 ft, and maximum drawdown in the lower zonewas 1.01 ft. The pressurization of the packer caused the 1.01 ft water-level decline in the lower zone duringthe test. The water level in the upper zone recovered 5.6 ft in 14 minutes after pumping stopped; the waterlevel in the lower zone continued to decline, which indicates the water level in the lower zone had notstabilized before the start of the test.
No vertical hydraulic connection between the upper zone and lower zones was apparent. Specificcapacity of the upper zone was 0.10 (gal/min)/ft after 50 minutes of pumping.
Table 7. Drawdown in the upper and lower zones of borehole BK-2636during lower-isolated-zone test on September 22, 1994, Boarhead Farmssite, Bridgeton Township, Bucks County, Pa.
[ft, feet; min, minutes; --, measurement not taken]
TimeElapsed time
since pumpingbegan (min)
Drawdown (ft)
Upper Zone Lower Zone
3:49 p.m. Pump turned on
3:52 3 -- 6.0
3:53 4 -- 19.60
3:54 5 -- --
3:55 6 0.0 25.90
3:57 8 0.0 33.80
3:58 9 -- 37.20
3:59 10 -- 41.30
4:00 11 0.0 46.70
4:01 12 0.0 52.80
4:01 Pump shut off
4:22 33 0.0 51.45
4:24 34 -- 51.40
4:26:30 36.5 -- 51.32
4:29 40 -- 51.28

Water-Resources Investigations Report 96-4090 21
An isolated-zone constant-discharge test of the lower zone of borehole BK-2639 was done onOctober 4, 1994. The packer was left in place at the same depth as for the upper zone test. The pump wasset at 58 ft below LSD. The pumping rate was 2.0 gal/min. The drawdown was 35.5 ft after 3 minutes ofpumping. The pump was shut off after 3 minutes of pumping because discharge from the lower zonestopped. The water level recovered 6.5 ft in 13 minutes. Pumping was started for a second period at a rateof 3.0 gal/min. The drawdown was approximately 48 ft below LSD after 11 minutes of pumping and thepump shut off because the lower zone was dewatered.
Maximum drawdown in the lower zone at the end of the first pumping period was 35.56 ft. Adrawdown of 0.02 ft was measured in the upper zone at the end of this period, which was probablybecause of a small leak in the seal of the packer. The recovery of the water level in the lower zone wasprobably caused by a combination of the small leak in the packer seal and water draining down thedischarge hose. Maximum drawdown in the lower zone at the end of the second pumping period was48.3 ft. An additional 0.04 ft of water-level decline in the upper zone during the second pumping periodwas probably caused by a small leak in the packer seal. The water level in the lower zone did not recoverafter the end of the second pumping period, indicating no significant water-producing zones are below47.4 ft below LSD. No vertical hydraulic connection between the lower and upper zones was apparent.Specific capacity of the lower zone was not determined because the drawdown could be attributed to onlywithdrawing water from borehole storage.
An isolated-zone constant-discharge test was done in the upper zone of borehole BK-2640 onSeptember 27, 1994. A single packer was set at 27.3 ft below LSD on September 26, 1994, and left inflatedovernight. The initial pumping rate was 3.75 gal/min. The rate was adjusted to 3.3 gal/min after9 minutes of pumping and was maintained at that rate for the duration of the test. The upper zone waspumped for 54 minutes. A plot of drawdown as a function of time of the upper and lower zones is shownin figure 4 of appendix 2.
Maximum drawdown in the upper zone was 5.48 ft, and maximum drawdown in the lower zonewas 4.9 ft. The drawdown in the lower zone was caused by the pumping, which indicates a verticalhydraulic connection between the upper and lower parts of the borehole. Specific capacity of the upperzone was 0.60 (gal/min)/ft after 54 minutes of pumping. Drawdown in the lower zone before, during, andafter pumping are listed in table 8. The lower zone was not tested because of a vertical connection betweenthe upper and lower parts of the borehole was established by the previous test.
An isolated-zone constant-discharge test was done in the upper zone of borehole BK-2641 onSeptember 28, 1994. A single packer was set at 27.0 ft below LSD and a pump was set at 22 ft below LSD.The initial pumping rate was 1.3 gal/min. The rate was increased to 3.0 gal/min after 6 minutes ofpumping. The drawdown rate increased, and the pumping rate was continually decreased to a rate of0.5 gal/min, which was maintained for the duration of the test. The upper zone was pumped for68 minutes. A plot of drawdown as a function of the time of the upper zone is shown in figure 5 ofappendix 2.
Maximum drawdown in the upper zone was 21.55 ft, and maximum drawdown in the lower zonewas 1.92 ft. The pressurization of the packer caused the 1.92 ft water-level decline in the lower zone duringthe tests. The water level in the lower zone was 2.9 ft higher than the water level in the upper zone after38 minutes of stabilization time. The water level in the lower zone continued to decline throughout theduration of the test, which indicates that the water level in the lower zone had not stabilized.
No vertical hydraulic connection between the upper and lower zones was apparent. Specificcapacity of the upper zone was 0.02 (gal/min)/ft after 68 minutes of pumping.
A constant-discharge test of the lower zone of borehole BK-2641 was done on September 29, 1994.The packer was left in place at 27.0 ft below LSD. The pump was set at 38.6 ft below LSD. The pumpingrate was 1.5 gal/min. The pump was shut off after 19 minutes of pumping because the lower zone wasdewatered.
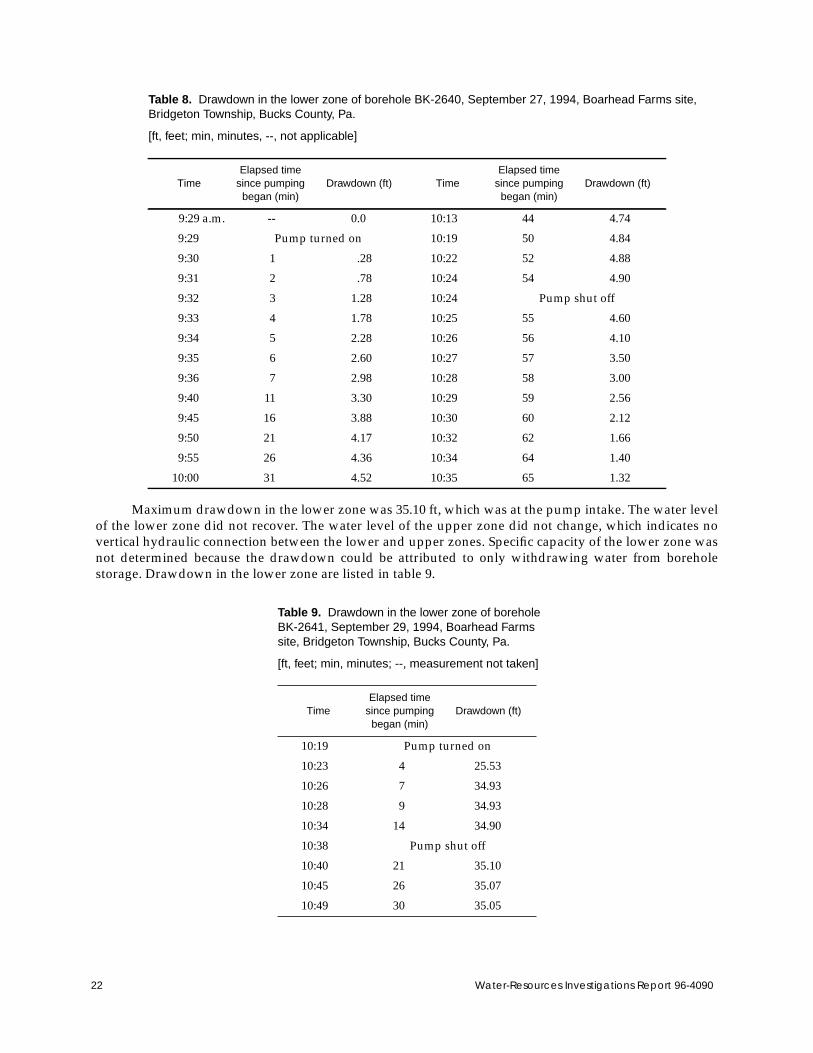
22 Water-Resources Investigations Report 96-4090
Maximum drawdown in the lower zone was 35.10 ft, which was at the pump intake. The water levelof the lower zone did not recover. The water level of the upper zone did not change, which indicates novertical hydraulic connection between the lower and upper zones. Specific capacity of the lower zone wasnot determined because the drawdown could be attributed to only withdrawing water from boreholestorage. Drawdown in the lower zone are listed in table 9.
Table 8. Drawdown in the lower zone of borehole BK-2640, September 27, 1994, Boarhead Farms site,Bridgeton Township, Bucks County, Pa.
[ft, feet; min, minutes, --, not applicable]
TimeElapsed time
since pumpingbegan (min)
Drawdown (ft) TimeElapsed time
since pumpingbegan (min)
Drawdown (ft)
9:29 a.m. -- 0.0 10:13 44 4.74
9:29 Pump turned on 10:19 50 4.84
9:30 1 .28 10:22 52 4.88
9:31 2 .78 10:24 54 4.90
9:32 3 1.28 10:24 Pump shut off
9:33 4 1.78 10:25 55 4.60
9:34 5 2.28 10:26 56 4.10
9:35 6 2.60 10:27 57 3.50
9:36 7 2.98 10:28 58 3.00
9:40 11 3.30 10:29 59 2.56
9:45 16 3.88 10:30 60 2.12
9:50 21 4.17 10:32 62 1.66
9:55 26 4.36 10:34 64 1.40
10:00 31 4.52 10:35 65 1.32
Table 9. Drawdown in the lower zone of boreholeBK-2641, September 29, 1994, Boarhead Farmssite, Bridgeton Township, Bucks County, Pa.
[ft, feet; min, minutes; --, measurement not taken]
TimeElapsed time
since pumpingbegan (min)
Drawdown (ft)
10:19 Pump turned on
10:23 4 25.53
10:26 7 34.93
10:28 9 34.93
10:34 14 34.90
10:38 Pump shut off
10:40 21 35.10
10:45 26 35.07
10:49 30 35.05
Water-Resources Investigations Report 96-4090 23
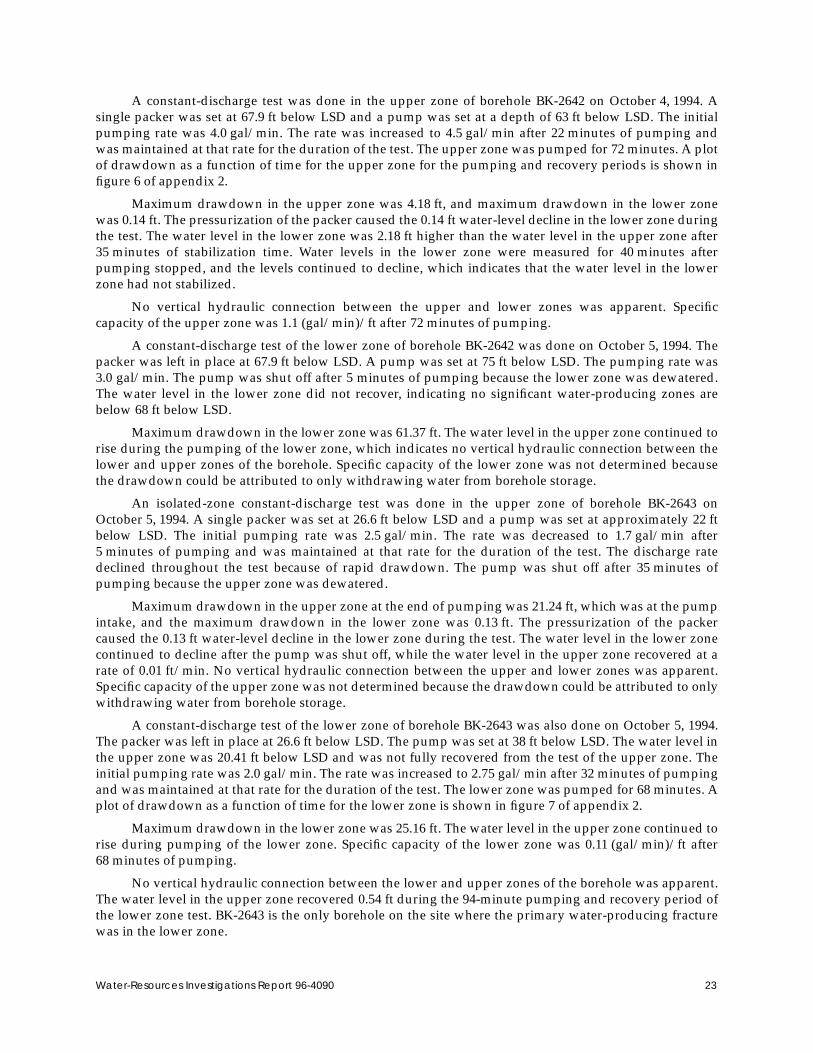
A constant-discharge test was done in the upper zone of borehole BK-2642 on October 4, 1994. Asingle packer was set at 67.9 ft below LSD and a pump was set at a depth of 63 ft below LSD. The initialpumping rate was 4.0 gal/min. The rate was increased to 4.5 gal/min after 22 minutes of pumping andwas maintained at that rate for the duration of the test. The upper zone was pumped for 72 minutes. A plotof drawdown as a function of time for the upper zone for the pumping and recovery periods is shown infigure 6 of appendix 2.
Maximum drawdown in the upper zone was 4.18 ft, and maximum drawdown in the lower zonewas 0.14 ft. The pressurization of the packer caused the 0.14 ft water-level decline in the lower zone duringthe test. The water level in the lower zone was 2.18 ft higher than the water level in the upper zone after35 minutes of stabilization time. Water levels in the lower zone were measured for 40 minutes afterpumping stopped, and the levels continued to decline, which indicates that the water level in the lowerzone had not stabilized.
No vertical hydraulic connection between the upper and lower zones was apparent. Specificcapacity of the upper zone was 1.1 (gal/min)/ft after 72 minutes of pumping.
A constant-discharge test of the lower zone of borehole BK-2642 was done on October 5, 1994. Thepacker was left in place at 67.9 ft below LSD. A pump was set at 75 ft below LSD. The pumping rate was3.0 gal/min. The pump was shut off after 5 minutes of pumping because the lower zone was dewatered.The water level in the lower zone did not recover, indicating no significant water-producing zones arebelow 68 ft below LSD.
Maximum drawdown in the lower zone was 61.37 ft. The water level in the upper zone continued torise during the pumping of the lower zone, which indicates no vertical hydraulic connection between thelower and upper zones of the borehole. Specific capacity of the lower zone was not determined becausethe drawdown could be attributed to only withdrawing water from borehole storage.
An isolated-zone constant-discharge test was done in the upper zone of borehole BK-2643 onOctober 5, 1994. A single packer was set at 26.6 ft below LSD and a pump was set at approximately 22 ftbelow LSD. The initial pumping rate was 2.5 gal/min. The rate was decreased to 1.7 gal/min after5 minutes of pumping and was maintained at that rate for the duration of the test. The discharge ratedeclined throughout the test because of rapid drawdown. The pump was shut off after 35 minutes ofpumping because the upper zone was dewatered.
Maximum drawdown in the upper zone at the end of pumping was 21.24 ft, which was at the pumpintake, and the maximum drawdown in the lower zone was 0.13 ft. The pressurization of the packercaused the 0.13 ft water-level decline in the lower zone during the test. The water level in the lower zonecontinued to decline after the pump was shut off, while the water level in the upper zone recovered at arate of 0.01 ft/min. No vertical hydraulic connection between the upper and lower zones was apparent.Specific capacity of the upper zone was not determined because the drawdown could be attributed to onlywithdrawing water from borehole storage.
A constant-discharge test of the lower zone of borehole BK-2643 was also done on October 5, 1994.The packer was left in place at 26.6 ft below LSD. The pump was set at 38 ft below LSD. The water level inthe upper zone was 20.41 ft below LSD and was not fully recovered from the test of the upper zone. Theinitial pumping rate was 2.0 gal/min. The rate was increased to 2.75 gal/min after 32 minutes of pumpingand was maintained at that rate for the duration of the test. The lower zone was pumped for 68 minutes. Aplot of drawdown as a function of time for the lower zone is shown in figure 7 of appendix 2.
Maximum drawdown in the lower zone was 25.16 ft. The water level in the upper zone continued torise during pumping of the lower zone. Specific capacity of the lower zone was 0.11 (gal/min)/ft after68 minutes of pumping.
No vertical hydraulic connection between the lower and upper zones of the borehole was apparent.The water level in the upper zone recovered 0.54 ft during the 94-minute pumping and recovery period ofthe lower zone test. BK-2643 is the only borehole on the site where the primary water-producing fracturewas in the lower zone.
24 Water-Resources Investigations Report 96-4090
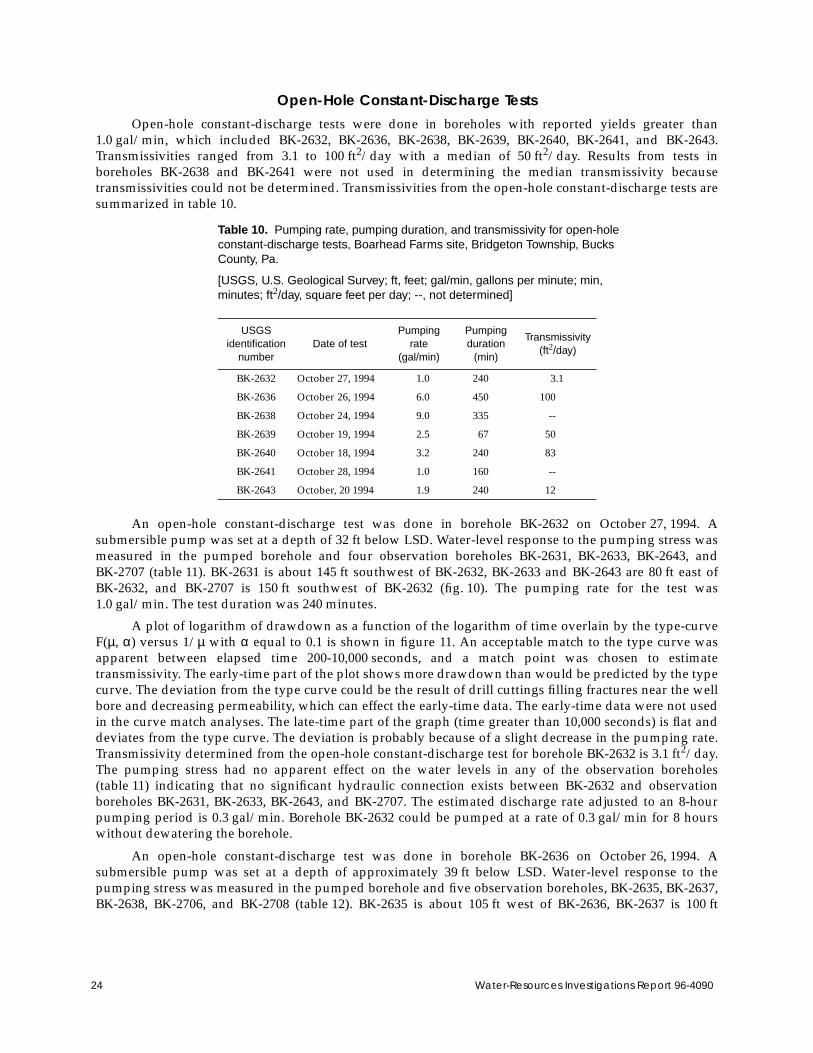
Open-Hole Constant-Discharge TestsOpen-hole constant-discharge tests were done in boreholes with reported yields greater than
1.0 gal/min, which included BK-2632, BK-2636, BK-2638, BK-2639, BK-2640, BK-2641, and BK-2643.Transmissivities ranged from 3.1 to 100 ft2/day with a median of 50 ft2/day. Results from tests inboreholes BK-2638 and BK-2641 were not used in determining the median transmissivity becausetransmissivities could not be determined. Transmissivities from the open-hole constant-discharge tests aresummarized in table 10.
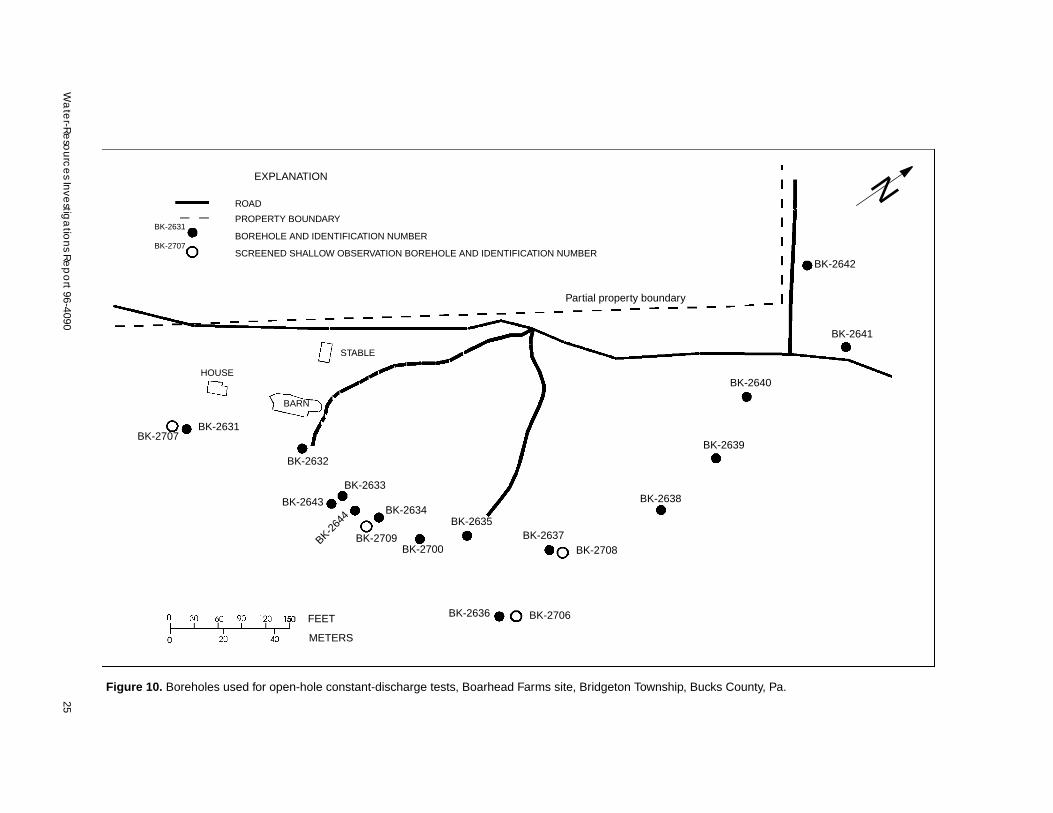
An open-hole constant-discharge test was done in borehole BK-2632 on October 27, 1994. Asubmersible pump was set at a depth of 32 ft below LSD. Water-level response to the pumping stress wasmeasured in the pumped borehole and four observation boreholes BK-2631, BK-2633, BK-2643, andBK-2707 (table 11). BK-2631 is about 145 ft southwest of BK-2632, BK-2633 and BK-2643 are 80 ft east ofBK-2632, and BK-2707 is 150 ft southwest of BK-2632 (fig. 10). The pumping rate for the test was1.0 gal/min. The test duration was 240 minutes.
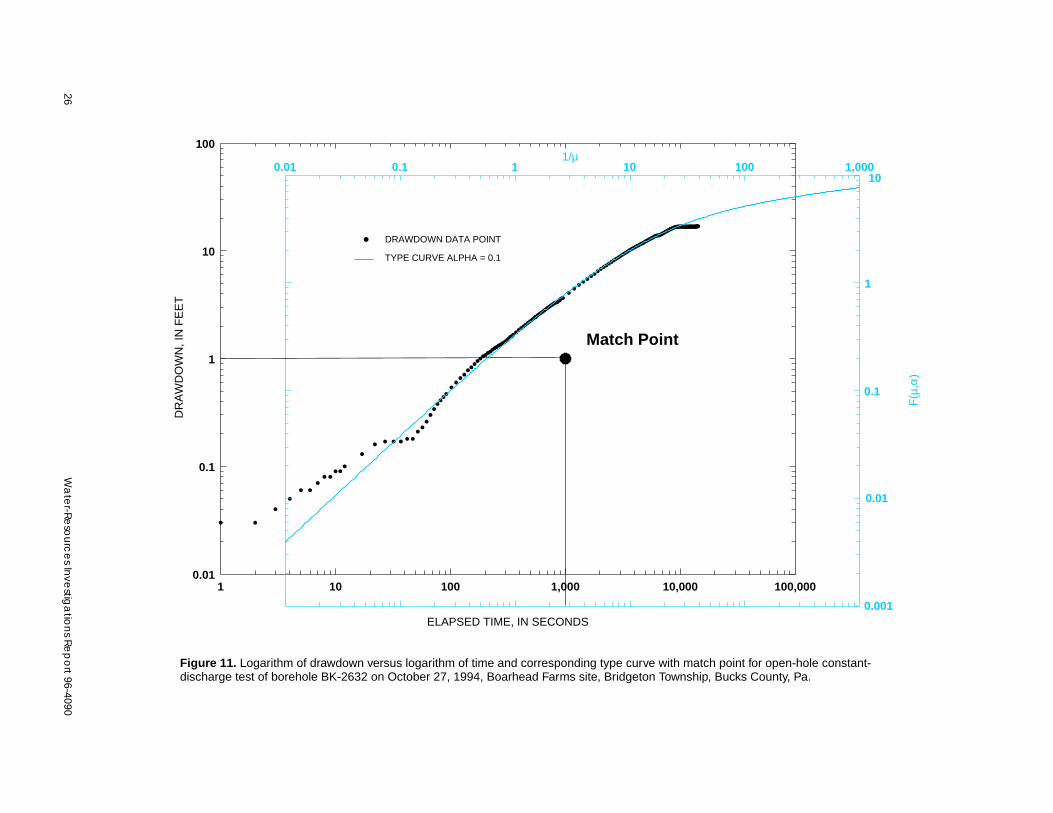
A plot of logarithm of drawdown as a function of the logarithm of time overlain by the type-curveF(µ, α) versus 1/µ with α equal to 0.1 is shown in figure 11. An acceptable match to the type curve wasapparent between elapsed time 200-10,000 seconds, and a match point was chosen to estimatetransmissivity. The early-time part of the plot shows more drawdown than would be predicted by the typecurve. The deviation from the type curve could be the result of drill cuttings filling fractures near the wellbore and decreasing permeability, which can effect the early-time data. The early-time data were not usedin the curve match analyses. The late-time part of the graph (time greater than 10,000 seconds) is flat anddeviates from the type curve. The deviation is probably because of a slight decrease in the pumping rate.Transmissivity determined from the open-hole constant-discharge test for borehole BK-2632 is 3.1 ft2/day.The pumping stress had no apparent effect on the water levels in any of the observation boreholes(table 11) indicating that no significant hydraulic connection exists between BK-2632 and observationboreholes BK-2631, BK-2633, BK-2643, and BK-2707. The estimated discharge rate adjusted to an 8-hourpumping period is 0.3 gal/min. Borehole BK-2632 could be pumped at a rate of 0.3 gal/min for 8 hourswithout dewatering the borehole.
An open-hole constant-discharge test was done in borehole BK-2636 on October 26, 1994. Asubmersible pump was set at a depth of approximately 39 ft below LSD. Water-level response to thepumping stress was measured in the pumped borehole and five observation boreholes, BK-2635, BK-2637,BK-2638, BK-2706, and BK-2708 (table 12). BK-2635 is about 105 ft west of BK-2636, BK-2637 is 100 ft
Table 10. Pumping rate, pumping duration, and transmissivity for open-holeconstant-discharge tests, Boarhead Farms site, Bridgeton Township, BucksCounty, Pa.
[USGS, U.S. Geological Survey; ft, feet; gal/min, gallons per minute; min,minutes; ft2/day, square feet per day; --, not determined]
USGSidentification
numberDate of test
Pumpingrate
(gal/min)
Pumpingduration
(min)
Transmissivity(ft2/day)
BK-2632 October 27, 1994 1.0 240 3.1
BK-2636 October 26, 1994 6.0 450 100
BK-2638 October 24, 1994 9.0 335 --
BK-2639 October 19, 1994 2.5 67 50
BK-2640 October 18, 1994 3.2 240 83
BK-2641 October 28, 1994 1.0 160 --
BK-2643 October, 20 1994 1.9 240 12
Wa
ter-R
eso
urc
es In
vestig
atio
ns R
ep
ort 96-4090
25
BK-2640
BK-2641
BK-2642
N
BK-2707BK-2631
HOUSE
BARN
STABLE
BK-2632
BK-2633
BK-2643
BK-264
4
BK-2709
BK-2634
BK-2700
BK-2635
BK-2636 BK-2706
BK-2708BK-2637
BK-2639
BK-2638
FEET
METERS
EXPLANATION
Partial property boundary
ROAD
PROPERTY BOUNDARY
BOREHOLE AND IDENTIFICATION NUMBER
SCREENED SHALLOW OBSERVATION BOREHOLE AND IDENTIFICATION NUMBER
BK-2631
BK-2707
Figure 10. Boreholes used for open-hole constant-discharge tests, Boarhead Farms site, Bridgeton Township, Bucks County, Pa.
26W
ate
r-Re
sou
rce
s Inve
stiga
tion
s Re
po
rt 96-4090
0.01
100
0.1
1
10
DR
AW
DO
WN
, IN
FE
ET
1 100,00010 100 1,000 10,000
ELAPSED TIME, IN SECONDS0.001
10
0.01
0.1
1
F(µ
,α)
0.01 1,0000.1 1 10 100
TYPE CURVE ALPHA = 0.1
Match Point
DRAWDOWN DATA POINT
1/µ
Figure 11. Logarithm of drawdown versus logarithm of time and corresponding type curve with match point for open-hole constant-discharge test of borehole BK-2632 on October 27, 1994, Boarhead Farms site, Bridgeton Township, Bucks County, Pa.
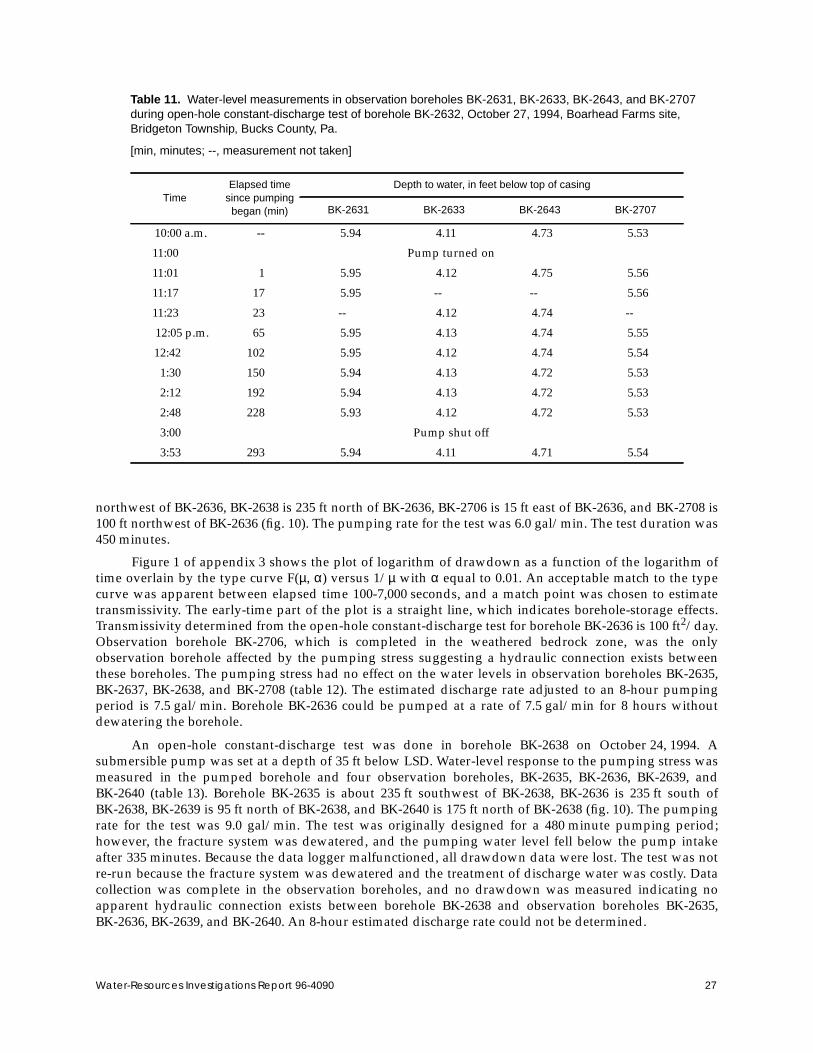
Water-Resources Investigations Report 96-4090 27
northwest of BK-2636, BK-2638 is 235 ft north of BK-2636, BK-2706 is 15 ft east of BK-2636, and BK-2708 is100 ft northwest of BK-2636 (fig. 10). The pumping rate for the test was 6.0 gal/min. The test duration was450 minutes.
Figure 1 of appendix 3 shows the plot of logarithm of drawdown as a function of the logarithm oftime overlain by the type curve F(µ, α) versus 1/µ with α equal to 0.01. An acceptable match to the typecurve was apparent between elapsed time 100-7,000 seconds, and a match point was chosen to estimatetransmissivity. The early-time part of the plot is a straight line, which indicates borehole-storage effects.Transmissivity determined from the open-hole constant-discharge test for borehole BK-2636 is 100 ft2/day.Observation borehole BK-2706, which is completed in the weathered bedrock zone, was the onlyobservation borehole affected by the pumping stress suggesting a hydraulic connection exists betweenthese boreholes. The pumping stress had no effect on the water levels in observation boreholes BK-2635,BK-2637, BK-2638, and BK-2708 (table 12). The estimated discharge rate adjusted to an 8-hour pumpingperiod is 7.5 gal/min. Borehole BK-2636 could be pumped at a rate of 7.5 gal/min for 8 hours withoutdewatering the borehole.
An open-hole constant-discharge test was done in borehole BK-2638 on October 24, 1994. Asubmersible pump was set at a depth of 35 ft below LSD. Water-level response to the pumping stress wasmeasured in the pumped borehole and four observation boreholes, BK-2635, BK-2636, BK-2639, andBK-2640 (table 13). Borehole BK-2635 is about 235 ft southwest of BK-2638, BK-2636 is 235 ft south ofBK-2638, BK-2639 is 95 ft north of BK-2638, and BK-2640 is 175 ft north of BK-2638 (fig. 10). The pumpingrate for the test was 9.0 gal/min. The test was originally designed for a 480 minute pumping period;however, the fracture system was dewatered, and the pumping water level fell below the pump intakeafter 335 minutes. Because the data logger malfunctioned, all drawdown data were lost. The test was notre-run because the fracture system was dewatered and the treatment of discharge water was costly. Datacollection was complete in the observation boreholes, and no drawdown was measured indicating noapparent hydraulic connection exists between borehole BK-2638 and observation boreholes BK-2635,BK-2636, BK-2639, and BK-2640. An 8-hour estimated discharge rate could not be determined.
Table 11. Water-level measurements in observation boreholes BK-2631, BK-2633, BK-2643, and BK-2707during open-hole constant-discharge test of borehole BK-2632, October 27, 1994, Boarhead Farms site,Bridgeton Township, Bucks County, Pa.
[min, minutes; --, measurement not taken]
TimeElapsed time
since pumpingbegan (min)
Depth to water, in feet below top of casing
BK-2631 BK-2633 BK-2643 BK-2707
10:00 a.m. -- 5.94 4.11 4.73 5.53
11:00 Pump turned on
11:01 1 5.95 4.12 4.75 5.56
11:17 17 5.95 -- -- 5.56
11:23 23 -- 4.12 4.74 --
12:05 p.m. 65 5.95 4.13 4.74 5.55
12:42 102 5.95 4.12 4.74 5.54
1:30 150 5.94 4.13 4.72 5.53
2:12 192 5.94 4.13 4.72 5.53
2:48 228 5.93 4.12 4.72 5.53
3:00 Pump shut off
3:53 293 5.94 4.11 4.71 5.54
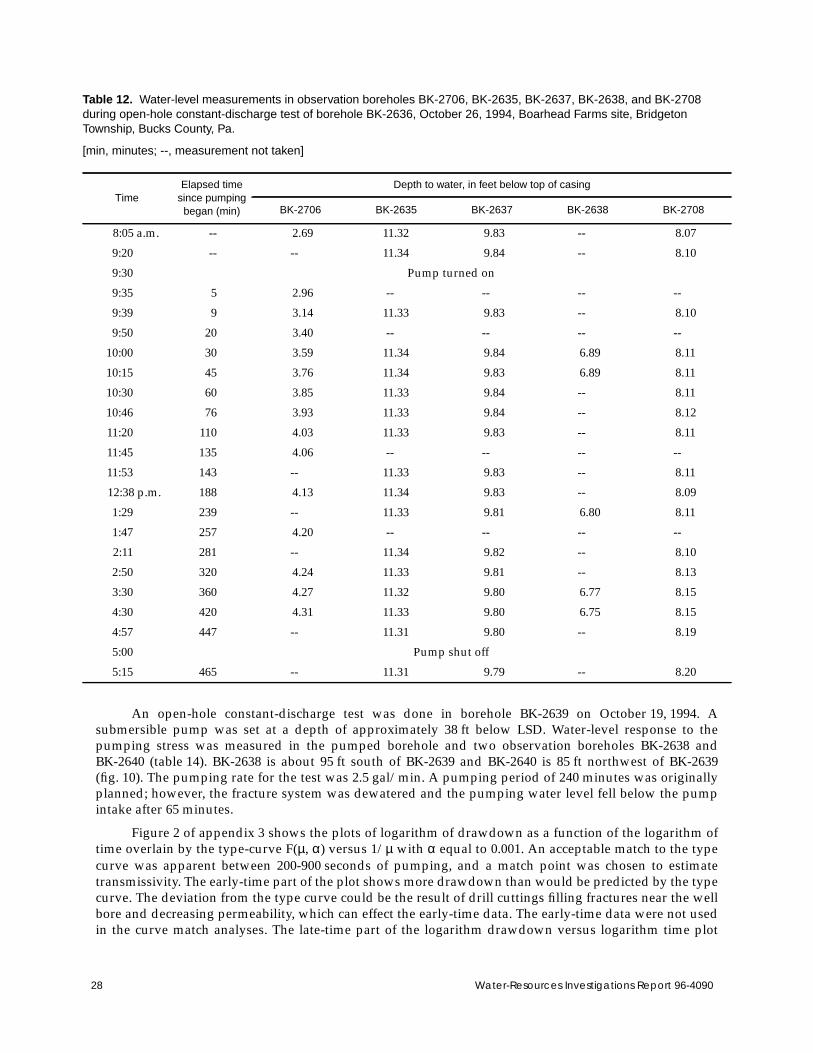
28 Water-Resources Investigations Report 96-4090
An open-hole constant-discharge test was done in borehole BK-2639 on October 19, 1994. Asubmersible pump was set at a depth of approximately 38 ft below LSD. Water-level response to thepumping stress was measured in the pumped borehole and two observation boreholes BK-2638 andBK-2640 (table 14). BK-2638 is about 95 ft south of BK-2639 and BK-2640 is 85 ft northwest of BK-2639(fig. 10). The pumping rate for the test was 2.5 gal/min. A pumping period of 240 minutes was originallyplanned; however, the fracture system was dewatered and the pumping water level fell below the pumpintake after 65 minutes.
Figure 2 of appendix 3 shows the plots of logarithm of drawdown as a function of the logarithm oftime overlain by the type-curve F(µ, α) versus 1/µ with α equal to 0.001. An acceptable match to the typecurve was apparent between 200-900 seconds of pumping, and a match point was chosen to estimatetransmissivity. The early-time part of the plot shows more drawdown than would be predicted by the typecurve. The deviation from the type curve could be the result of drill cuttings filling fractures near the wellbore and decreasing permeability, which can effect the early-time data. The early-time data were not usedin the curve match analyses. The late-time part of the logarithm drawdown versus logarithm time plot
Table 12. Water-level measurements in observation boreholes BK-2706, BK-2635, BK-2637, BK-2638, and BK-2708during open-hole constant-discharge test of borehole BK-2636, October 26, 1994, Boarhead Farms site, BridgetonTownship, Bucks County, Pa.
[min, minutes; --, measurement not taken]
TimeElapsed time
since pumpingbegan (min)
Depth to water, in feet below top of casing
BK-2706 BK-2635 BK-2637 BK-2638 BK-2708
8:05 a.m. -- 2.69 11.32 9.83 -- 8.07
9:20 -- -- 11.34 9.84 -- 8.10
9:30 Pump turned on
9:35 5 2.96 -- -- -- --
9:39 9 3.14 11.33 9.83 -- 8.10
9:50 20 3.40 -- -- -- --
10:00 30 3.59 11.34 9.84 6.89 8.11
10:15 45 3.76 11.34 9.83 6.89 8.11
10:30 60 3.85 11.33 9.84 -- 8.11
10:46 76 3.93 11.33 9.84 -- 8.12
11:20 110 4.03 11.33 9.83 -- 8.11
11:45 135 4.06 -- -- -- --
11:53 143 -- 11.33 9.83 -- 8.11
12:38 p.m. 188 4.13 11.34 9.83 -- 8.09
1:29 239 -- 11.33 9.81 6.80 8.11
1:47 257 4.20 -- -- -- --
2:11 281 -- 11.34 9.82 -- 8.10
2:50 320 4.24 11.33 9.81 -- 8.13
3:30 360 4.27 11.32 9.80 6.77 8.15
4:30 420 4.31 11.33 9.80 6.75 8.15
4:57 447 -- 11.31 9.80 -- 8.19
5:00 Pump shut off
5:15 465 -- 11.31 9.79 -- 8.20
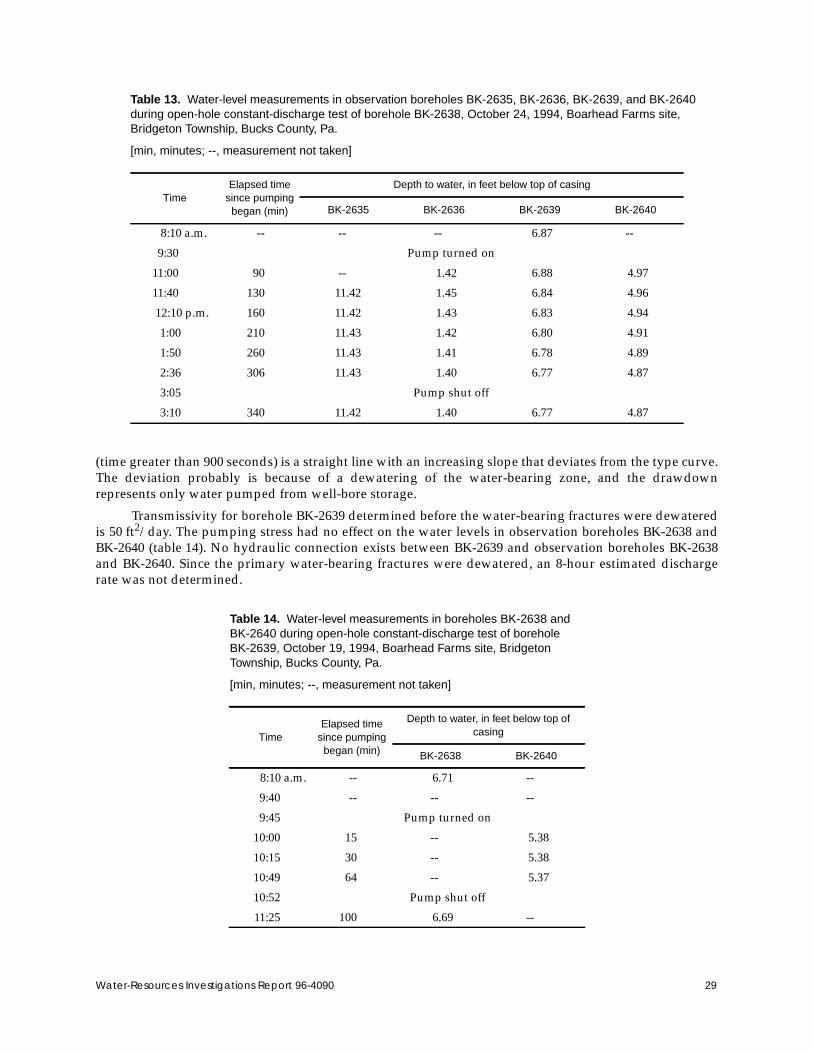
Water-Resources Investigations Report 96-4090 29
(time greater than 900 seconds) is a straight line with an increasing slope that deviates from the type curve.The deviation probably is because of a dewatering of the water-bearing zone, and the drawdownrepresents only water pumped from well-bore storage.
Transmissivity for borehole BK-2639 determined before the water-bearing fractures were dewateredis 50 ft2/day. The pumping stress had no effect on the water levels in observation boreholes BK-2638 andBK-2640 (table 14). No hydraulic connection exists between BK-2639 and observation boreholes BK-2638and BK-2640. Since the primary water-bearing fractures were dewatered, an 8-hour estimated dischargerate was not determined.
Table 13. Water-level measurements in observation boreholes BK-2635, BK-2636, BK-2639, and BK-2640during open-hole constant-discharge test of borehole BK-2638, October 24, 1994, Boarhead Farms site,Bridgeton Township, Bucks County, Pa.
[min, minutes; --, measurement not taken]
TimeElapsed time
since pumpingbegan (min)
Depth to water, in feet below top of casing
BK-2635 BK-2636 BK-2639 BK-2640
8:10 a.m. -- -- -- 6.87 --
9:30 Pump turned on
11:00 90 -- 1.42 6.88 4.97
11:40 130 11.42 1.45 6.84 4.96
12:10 p.m. 160 11.42 1.43 6.83 4.94
1:00 210 11.43 1.42 6.80 4.91
1:50 260 11.43 1.41 6.78 4.89
2:36 306 11.43 1.40 6.77 4.87
3:05 Pump shut off
3:10 340 11.42 1.40 6.77 4.87
Table 14. Water-level measurements in boreholes BK-2638 andBK-2640 during open-hole constant-discharge test of boreholeBK-2639, October 19, 1994, Boarhead Farms site, BridgetonTownship, Bucks County, Pa.
[min, minutes; --, measurement not taken]
TimeElapsed time
since pumpingbegan (min)
Depth to water, in feet below top ofcasing
BK-2638 BK-2640
8:10 a.m. -- 6.71 --
9:40 -- -- --
9:45 Pump turned on
10:00 15 -- 5.38
10:15 30 -- 5.38
10:49 64 -- 5.37
10:52 Pump shut off
11:25 100 6.69 --

30 Water-Resources Investigations Report 96-4090
An open-hole constant-discharge test was done in borehole BK-2640 on October 18, 1994. Asubmersible pump was set at a depth of approximately 29 ft below LSD. Water-level response to thepumping stress was measured in the pumped borehole and three observation boreholes, BK-2639, BK-2641and BK-2642 (table 15). BK-2639 is about 85 ft southeast of BK-2640, BK-2641 is 135 ft north of BK-2640,and BK-2642 is 180 ft northwest of BK-2640 (fig. 10). The pumping rate for the test was 3.2 gal/min. Thetest duration was 240 minutes.
Figure 3 of appendix 3 shows the plot of logarithm of drawdown versus logarithm of time overlainby the type-curve F(µ, α) versus 1/µ with α equal to 0.01. An acceptable match to the type curve wasapparent between elapsed time 200-2,000 seconds, and a match point was chosen to estimatetransmissivity. The slope of the graph for the late-time part of the logarithm drawdown versus logarithmtime plot (time greater than 10,000 seconds) is increasing and may indicate the dewatering of the fracturesystem supplying water to the borehole. Transmissivity determined from the open-holeconstant-discharge test for borehole BK-2640 is 83 ft2/day. The pumping stress had no effect on the waterlevels in any of the observation boreholes (table 15). No apparent hydraulic connection exists betweenBK-2640 and observation boreholes BK-2639, BK-2641, and BK-2642. The estimated discharge rate adjustedto an 8-hour pumping period is 7.7 gal/min. Borehole BK-2640 could be pumped at a rate of 7.7 gal/minfor 8 hours without dewatering the borehole.
An open-hole constant-discharge test was done in borehole BK-2641 on October 28, 1994. Asubmersible pump was set at a depth of approximately 32 ft below LSD. Water-level response to thepumping stress was measured in the pumped borehole and two observation boreholes BK-2640 andBK-2642 (table 16). BK-2640 is 135 ft south of BK-2641, and BK-2642 is 115 ft west of BK-2641 (fig. 10). The
Table 15. Water-level measurements in observation boreholes BK-2639, BK-2641,and BK-2642 during open-hole constant-discharge test of borehole BK-2640,October 18, 1994, Boarhead Farms site, Bridgeton Township, Bucks County, Pa.
[min, minutes; --, measurement not taken]
TimeElapsed time
since pumpingbegan (min)
Depth to water, in feet below top of casing
BK-2639 BK-2641 BK-2642
8:30 a.m. -- 7.03 5.20 --
8:59 -- 7.03 5.20 --
9:00 Pump turned on
9:15 15 7.03 5.20 --
9:30 30 7.03 5.20 5.22
10:00 60 7.03 5.19 5.21
10:20 80 7.03 5.20 5.22
10:40 100 7.02 5.20 5.21
11:00 120 7.02 5.19 5.21
11:25 145 7.01 5.19 5.20
11:40 160 7.01 5.19 5.19
12:00 p.m. 180 7.01 5.18 5.19
12:45 225 7.01 5.17 5.17
1:00 Pump shut off
1:04 244 7.00 5.17 5.16
1:50 290 6.98 -- 5.14
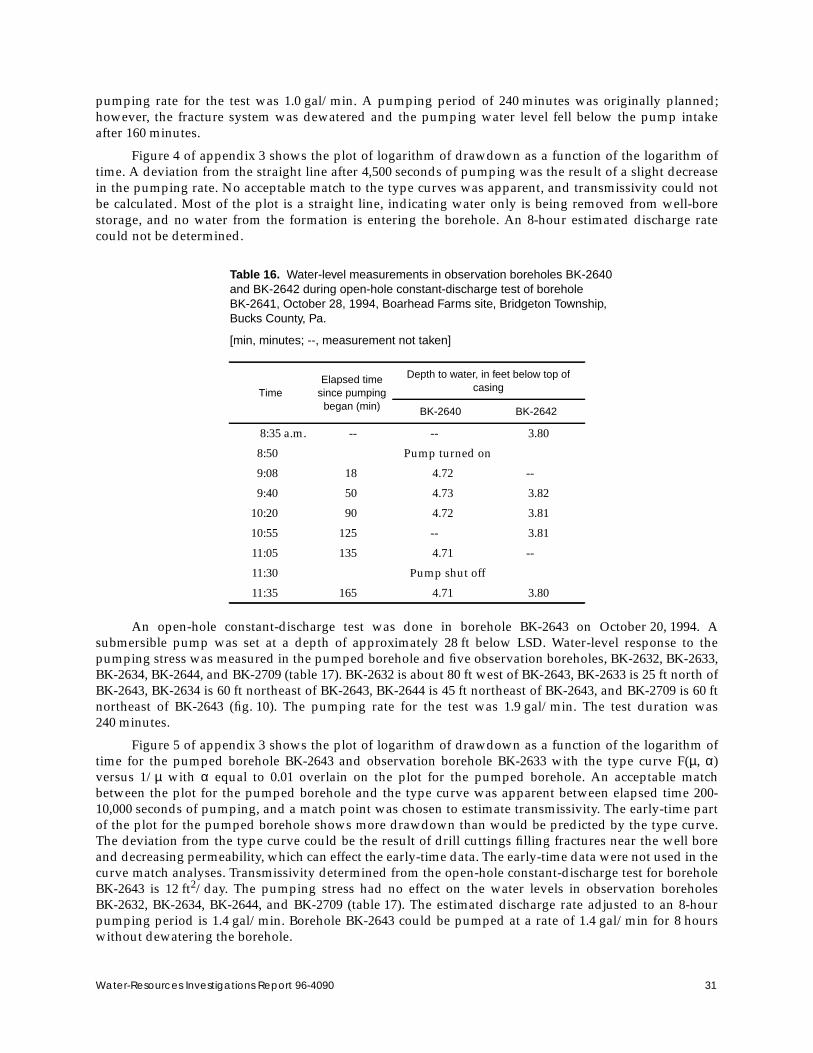
Water-Resources Investigations Report 96-4090 31
pumping rate for the test was 1.0 gal/min. A pumping period of 240 minutes was originally planned;however, the fracture system was dewatered and the pumping water level fell below the pump intakeafter 160 minutes.
Figure 4 of appendix 3 shows the plot of logarithm of drawdown as a function of the logarithm oftime. A deviation from the straight line after 4,500 seconds of pumping was the result of a slight decreasein the pumping rate. No acceptable match to the type curves was apparent, and transmissivity could notbe calculated. Most of the plot is a straight line, indicating water only is being removed from well-borestorage, and no water from the formation is entering the borehole. An 8-hour estimated discharge ratecould not be determined.
An open-hole constant-discharge test was done in borehole BK-2643 on October 20, 1994. Asubmersible pump was set at a depth of approximately 28 ft below LSD. Water-level response to thepumping stress was measured in the pumped borehole and five observation boreholes, BK-2632, BK-2633,BK-2634, BK-2644, and BK-2709 (table 17). BK-2632 is about 80 ft west of BK-2643, BK-2633 is 25 ft north ofBK-2643, BK-2634 is 60 ft northeast of BK-2643, BK-2644 is 45 ft northeast of BK-2643, and BK-2709 is 60 ftnortheast of BK-2643 (fig. 10). The pumping rate for the test was 1.9 gal/min. The test duration was240 minutes.
Figure 5 of appendix 3 shows the plot of logarithm of drawdown as a function of the logarithm oftime for the pumped borehole BK-2643 and observation borehole BK-2633 with the type curve F(µ, α)versus 1/µ with α equal to 0.01 overlain on the plot for the pumped borehole. An acceptable matchbetween the plot for the pumped borehole and the type curve was apparent between elapsed time 200-10,000 seconds of pumping, and a match point was chosen to estimate transmissivity. The early-time partof the plot for the pumped borehole shows more drawdown than would be predicted by the type curve.The deviation from the type curve could be the result of drill cuttings filling fractures near the well boreand decreasing permeability, which can effect the early-time data. The early-time data were not used in thecurve match analyses. Transmissivity determined from the open-hole constant-discharge test for boreholeBK-2643 is 12 ft2/day. The pumping stress had no effect on the water levels in observation boreholesBK-2632, BK-2634, BK-2644, and BK-2709 (table 17). The estimated discharge rate adjusted to an 8-hourpumping period is 1.4 gal/min. Borehole BK-2643 could be pumped at a rate of 1.4 gal/min for 8 hourswithout dewatering the borehole.
Table 16. Water-level measurements in observation boreholes BK-2640and BK-2642 during open-hole constant-discharge test of boreholeBK-2641, October 28, 1994, Boarhead Farms site, Bridgeton Township,Bucks County, Pa.
[min, minutes; --, measurement not taken]
TimeElapsed time
since pumpingbegan (min)
Depth to water, in feet below top ofcasing
BK-2640 BK-2642
8:35 a.m. -- -- 3.80
8:50 Pump turned on
9:08 18 4.72 --
9:40 50 4.73 3.82
10:20 90 4.72 3.81
10:55 125 -- 3.81
11:05 135 4.71 --
11:30 Pump shut off
11:35 165 4.71 3.80
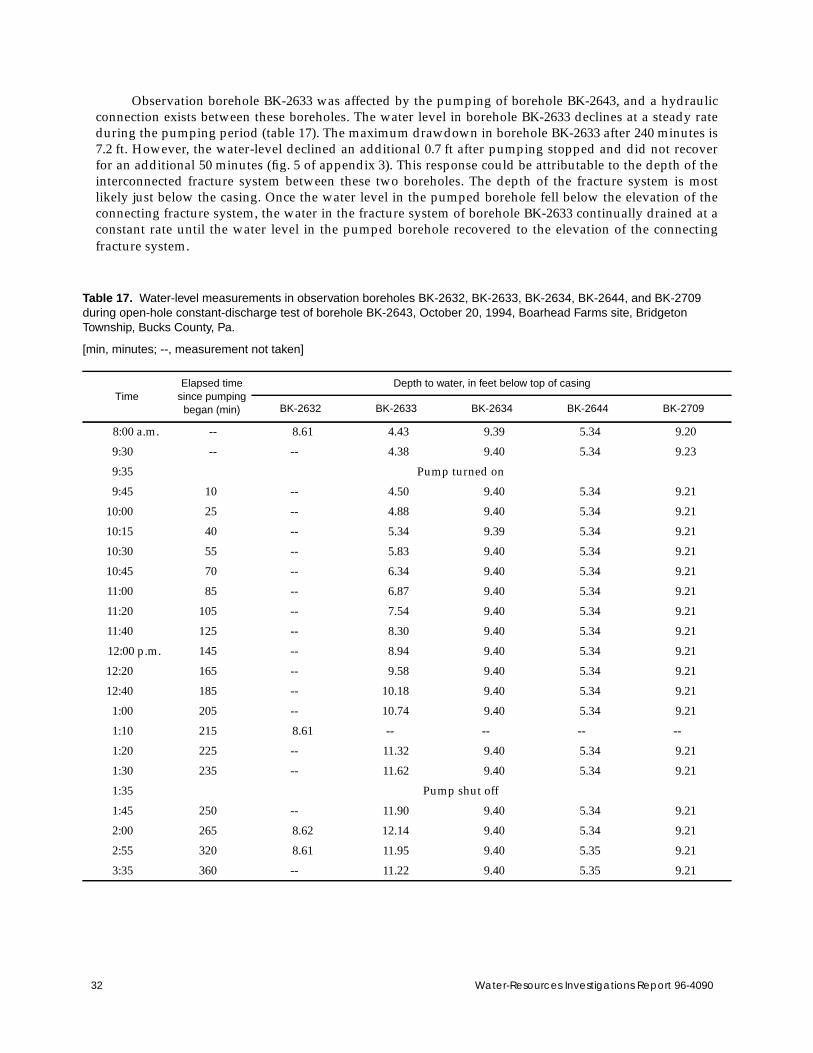
32 Water-Resources Investigations Report 96-4090
Observation borehole BK-2633 was affected by the pumping of borehole BK-2643, and a hydraulicconnection exists between these boreholes. The water level in borehole BK-2633 declines at a steady rateduring the pumping period (table 17). The maximum drawdown in borehole BK-2633 after 240 minutes is7.2 ft. However, the water-level declined an additional 0.7 ft after pumping stopped and did not recoverfor an additional 50 minutes (fig. 5 of appendix 3). This response could be attributable to the depth of theinterconnected fracture system between these two boreholes. The depth of the fracture system is mostlikely just below the casing. Once the water level in the pumped borehole fell below the elevation of theconnecting fracture system, the water in the fracture system of borehole BK-2633 continually drained at aconstant rate until the water level in the pumped borehole recovered to the elevation of the connectingfracture system.
Table 17. Water-level measurements in observation boreholes BK-2632, BK-2633, BK-2634, BK-2644, and BK-2709during open-hole constant-discharge test of borehole BK-2643, October 20, 1994, Boarhead Farms site, BridgetonTownship, Bucks County, Pa.
[min, minutes; --, measurement not taken]
TimeElapsed time
since pumpingbegan (min)
Depth to water, in feet below top of casing
BK-2632 BK-2633 BK-2634 BK-2644 BK-2709
8:00 a.m. -- 8.61 4.43 9.39 5.34 9.20
9:30 -- -- 4.38 9.40 5.34 9.23
9:35 Pump turned on
9:45 10 -- 4.50 9.40 5.34 9.21
10:00 25 -- 4.88 9.40 5.34 9.21
10:15 40 -- 5.34 9.39 5.34 9.21
10:30 55 -- 5.83 9.40 5.34 9.21
10:45 70 -- 6.34 9.40 5.34 9.21
11:00 85 -- 6.87 9.40 5.34 9.21
11:20 105 -- 7.54 9.40 5.34 9.21
11:40 125 -- 8.30 9.40 5.34 9.21
12:00 p.m. 145 -- 8.94 9.40 5.34 9.21
12:20 165 -- 9.58 9.40 5.34 9.21
12:40 185 -- 10.18 9.40 5.34 9.21
1:00 205 -- 10.74 9.40 5.34 9.21
1:10 215 8.61 -- -- -- --
1:20 225 -- 11.32 9.40 5.34 9.21
1:30 235 -- 11.62 9.40 5.34 9.21
1:35 Pump shut off
1:45 250 -- 11.90 9.40 5.34 9.21
2:00 265 8.62 12.14 9.40 5.34 9.21
2:55 320 8.61 11.95 9.40 5.35 9.21
3:35 360 -- 11.22 9.40 5.35 9.21

Water-Resources Investigations Report 96-4090 33
SUMMARY AND CONCLUSIONS
The Boarhead Farms site is underlain by a diabase aquifer that is comprised of a shallow and areallylimited fracture system that is poorly connected and low yielding with little to no ground-water storage ina thin overburden soil and weathered bedrock zone. The thickness of the overburden soil ranges from 4 to14 ft. The overburden soil has a high clay content and acts as a confining unit for the underlying bedrockaquifer. A weathered bedrock zone that consists of broken diabase ranged from 2 to 15 ft thick. Theopenings in the weathered bedrock zone were filled with clay. Because of the clay-rich overburden soil andthe thin, clay filled weathered bedrock zone, little ground-water storage is available to supply the shallowfracture systems. No water-producing fractures were penetrated at depths greater than about 50 ft belowland surface.
In seven of the eight boreholes in which isolated-zone constant-discharge tests were completed, novertical connections existed between the upper and lower zones of the boreholes. A hydraulic connectionexists between the upper and lower zones of borehole BK-2640.
Little or no hydraulic connection exists between adjacent boreholes. A hydraulic connection ispresent between boreholes BK-2636 and BK-2706, which are 15 ft apart. A hydraulic connection is presentbetween boreholes BK-2643 and BK-2633, which are 25 ft apart. No drawdown was measured in anyobservation borehole that was 45 ft or more from a pumping borehole during the open-holeconstant-discharge tests. No hydraulic connection was observed between boreholes BK-2632, BK-2638,BK-2639, BK-2640, and BK-2641 and nearby observation boreholes during open-hole constant-dischargetests.
Transmissivities determined from five open-hole constant-discharge tests ranged from 3.1 to100 ft2/day with a median of 50 ft2/day. Estimated discharge rates adjusted to a common 8-hour pumpingperiod are 0.3, 7.5, 7.7, and 1.4 gal/min for boreholes BK-2632, BK-2636, BK-2640, and BK-2643,respectively. These boreholes could be pumped at these rates for an 8-hour period without dewatering.
During open-hole constant-discharge tests of boreholes BK-2638, BK-2639, and BK-2641, the fracturesystems were dewatered, which indicates the fracture systems supplying water to these boreholes arelimited in areal extent. Estimated 8-hour discharge rates for these boreholes were not determined.
34 Water-Resources Investigations Report 96-4090
REFERENCES CITED
Cooper, H.H., Jr., Bredehoeft, J.D., and Papadopulos, I.S., 1967, Response of a finite-diameter well to aninstantaneous charge of water: Water Resources Research, v. 3, no.1, p. 263-269.
Duffield, G.M., and Rumbaugh, J.O., III, 1991, AQTESOLVTM Aquifer test solver documentation: Geraghtyand Miller, Inc., vers. 1.1, 135 p.
Ferris, J.G., Knowles, D.B., Brown, R.H., and Stallman, R.W., 1962, Theory of aquifer tests: U.S. GeologicalSurvey Water-Supply Paper 1536-E, p. 69-171.
Froelich, A.J., and Gottfried, David, 1985, Early Jurassic diabase sheets of the eastern United States-apreliminary overview: U.S. Geological Survey Circular 946, p. 79-86.
Hotz, P.E., 1952, Form of diabase sheets in southeastern Pennsylvania: American Journal of Science, v. 250,p. 375-388.
Lyttle, P.T., and Epstein, J.B., 1987, Geologic map of the Newark 1° x 2° quadrangle, New Jersey,Pennsylvania, and New York: U.S. Geological Survey Miscellaneous Investigations Series I-1715, 2plates, scale 1:250,000.
Papadopulos, I.S., and Cooper, H.H., Jr., 1967, Drawdown in a well of large diameter: Water ResourcesResearch, v. 3, no.1, p. 241-244.
Reed, J.E., 1980, Type curves for selected problems of flow to wells in confined aquifers: U.S. GeologicalSurvey Techniques of Water-Resource Investigations, Book 3, Chap. B1, 106 p.
Sloto, R.A., and Schreffler, C.L., 1994, Hydrogeology and ground-water quality of northern Bucks County,Pennsylvania: U.S. Geological Survey Water-Resources Investigations Report 94-4109, 85 p.
Theis, C.V., 1935, The relation between the lowering of the piezometric surface and the rate and durationof discharge of a well using ground-water storage: Am. Geophy. Union Trans., v. 16, p. 519-524.
Willard, D.B., Freedman, Jacob, McLaughlin, D.B., Peltier, L.C., Gault H.R., 1959, Geology and mineralresources of Bucks County, Pennsylvania: Pennsylvania Geological Survey, 4th ser., Bulletin C9,243 p.

Water-Resources Investigations Report 96-4090 35
APPENDIX 1. GRAPHS OF DRAWDOWN PLOTS FOR SLUG TESTS

36W
ate
r-Re
sou
rce
s Inve
stiga
tion
s Re
po
rt 96-4090
AP
PE
ND
IX1.G
RA
PH
SO
FD
RA
WD
OW
NP
LOT
SF
OR
SLU
GT
ES
TS
0
1.0
0
0.2
0.4
0.6
0.8
DR
AW
DO
WN
, IN
FE
ET
0.00001 0.10.0001 0.001 0.01
TIME, IN DAYS
NORMALIZED SLUG DATA POINT
1.0
0
0.2
0.4
0.6
0.8
H/H
O
0.00001 0.10.0001 0.001 0.01
TYPE CURVE
TIME, IN DAYS
Figure 1. Drawdown versus logarithm of time and corresponding type curve for slug test of borehole BK-2631, BoarheadFarms site, Bridgeton Township, Bucks County, Pa.
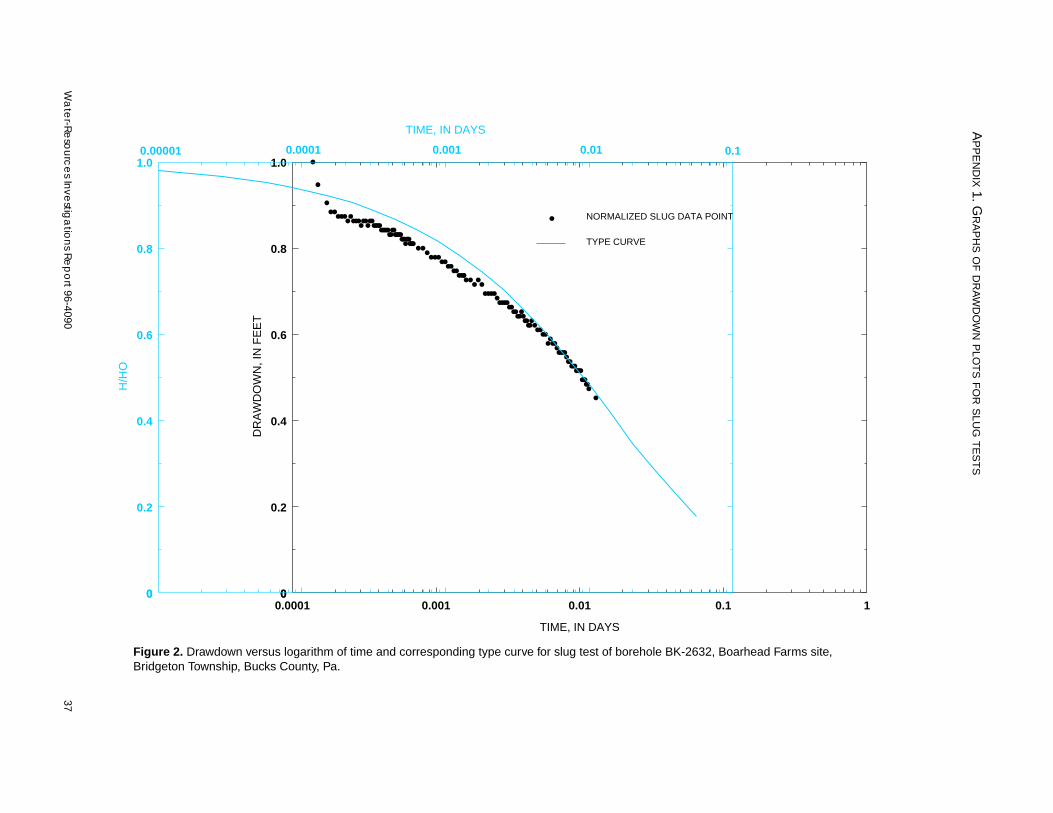
Wa
ter-R
eso
urc
es In
vestig
atio
ns R
ep
ort 96-4090
37
AP
PE
ND
IX1.G
RA
PH
SO
FD
RA
WD
OW
NP
LOT
SF
OR
SLU
GT
ES
TS
0
1.0
0
0.2
0.4
0.6
0.8D
RA
WD
OW
N, I
N F
EE
T
0.0001 10.001 0.01 0.1
TIME, IN DAYS
NORMALIZED SLUG DATA POINT
0
1.0
0
0.2
0.4
0.6
0.8
H/H
O
0.00001 0.10.0001 0.001 0.01
TIME, IN DAYS
TYPE CURVE
Figure 2. Drawdown versus logarithm of time and corresponding type curve for slug test of borehole BK-2632, Boarhead Farms site,Bridgeton Township, Bucks County, Pa.
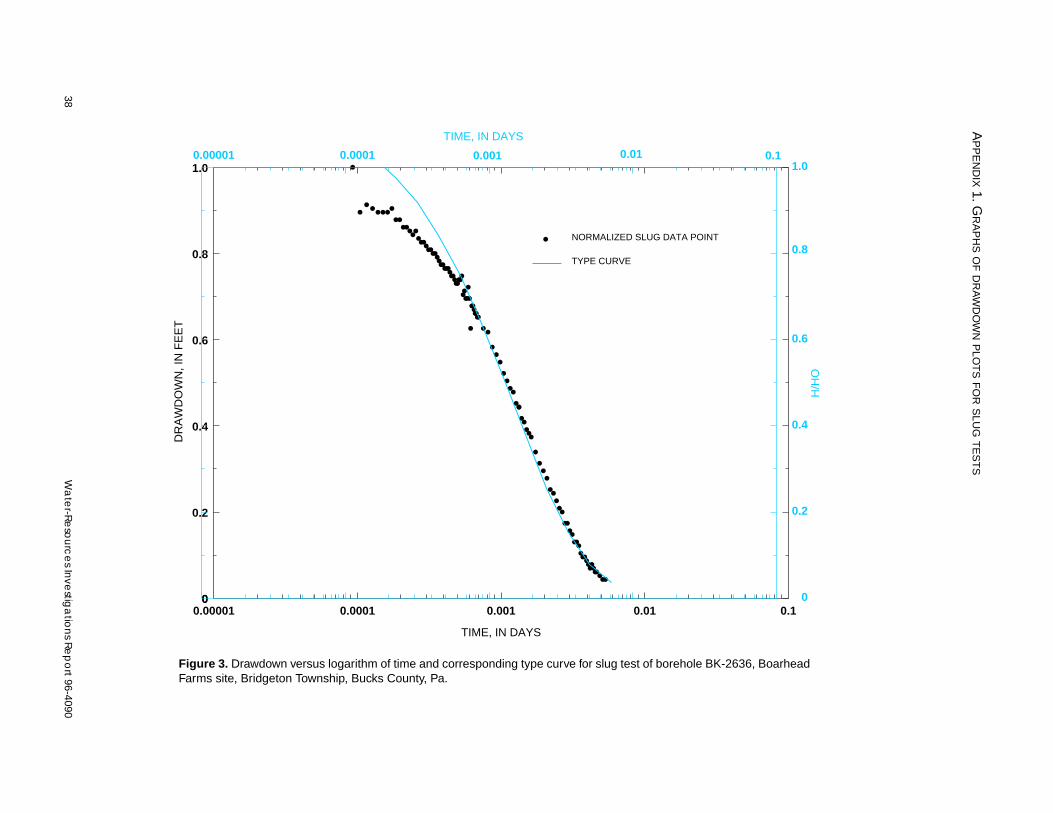
38W
ate
r-Re
sou
rce
s Inve
stiga
tion
s Re
po
rt 96-4090
AP
PE
ND
IX1.G
RA
PH
SO
FD
RA
WD
OW
NP
LOT
SF
OR
SLU
GT
ES
TS
0
1.0
0
0.2
0.4
0.6
0.8
DR
AW
DO
WN
, IN
FE
ET
0.00001 0.10.0001 0.001 0.01
TIME, IN DAYS
NORMALIZED SLUG DATA POINT
1.0
0
0.2
0.4
0.6
0.8
H/H
O
0.00001 0.10.0001 0.001 0.01
TYPE CURVE
TIME, IN DAYS
Figure 3. Drawdown versus logarithm of time and corresponding type curve for slug test of borehole BK-2636, BoarheadFarms site, Bridgeton Township, Bucks County, Pa.
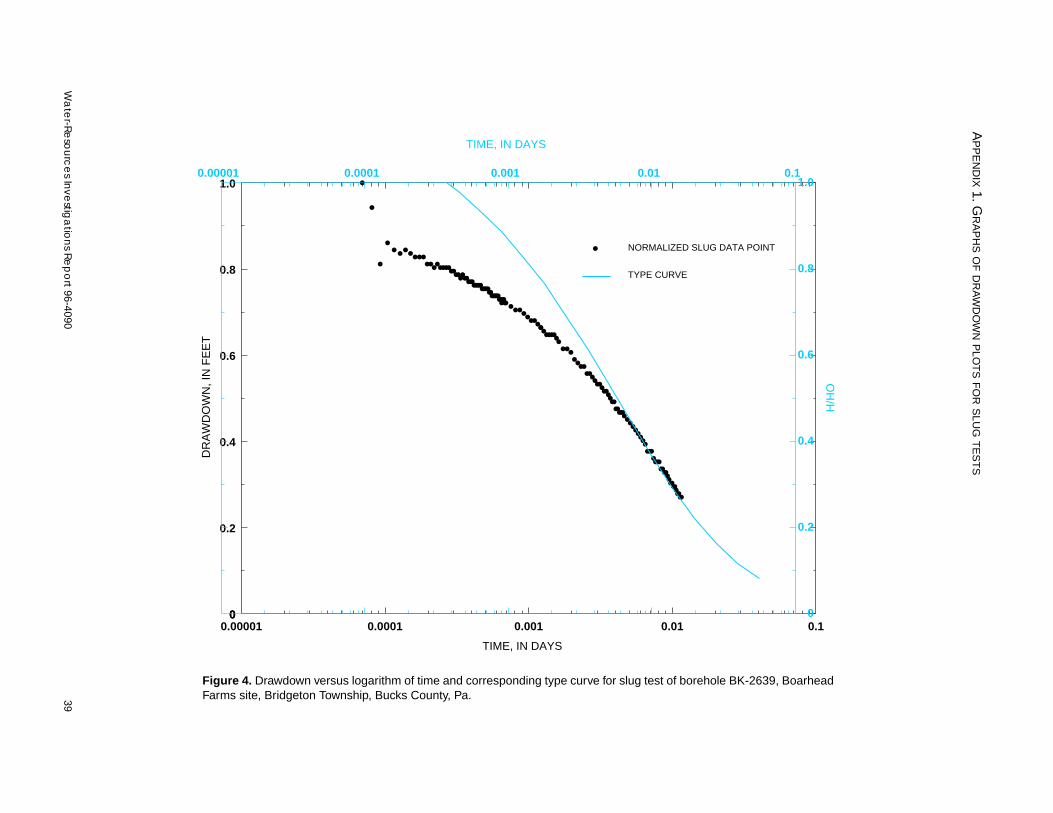
Wa
ter-R
eso
urc
es In
vestig
atio
ns R
ep
ort 96-4090
39
AP
PE
ND
IX1.G
RA
PH
SO
FD
RA
WD
OW
NP
LOT
SF
OR
SLU
GT
ES
TS
0
1.0
0
0.2
0.4
0.6
0.8
DR
AW
DO
WN
, IN
FE
ET
0.00001 0.10.0001 0.001 0.01
NORMALIZED SLUG DATA POINT
1.0
0
0.2
0.4
0.6
0.8
H/H
O
0.00001 0.10.0001 0.001 0.01
TIME, IN DAYS
TYPE CURVE
TIME, IN DAYS
Figure 4. Drawdown versus logarithm of time and corresponding type curve for slug test of borehole BK-2639, BoarheadFarms site, Bridgeton Township, Bucks County, Pa.
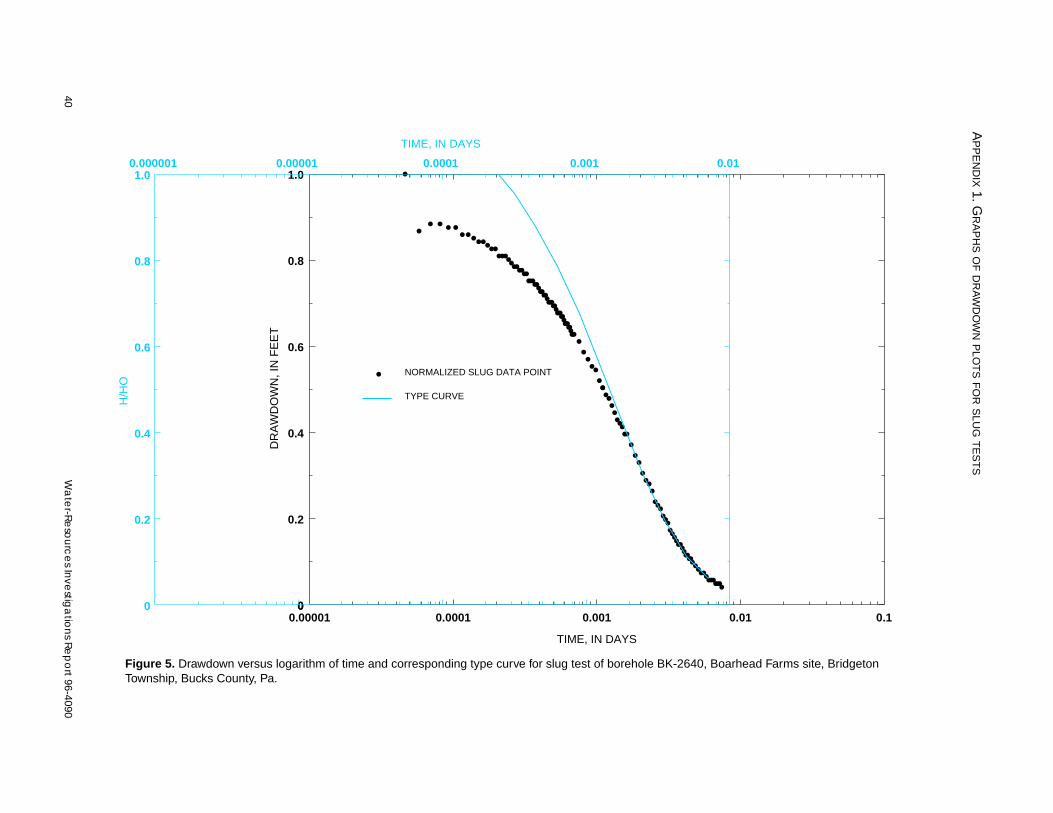
40W
ate
r-Re
sou
rce
s Inve
stiga
tion
s Re
po
rt 96-4090
AP
PE
ND
IX1.G
RA
PH
SO
FD
RA
WD
OW
NP
LOT
SF
OR
SLU
GT
ES
TS
0
1.0
0
0.2
0.4
0.6
0.8D
RA
WD
OW
N, I
N F
EE
T
0.00001 0.10.0001 0.001 0.01
TIME, IN DAYS
NORMALIZED SLUG DATA POINT
1.0
0
0.2
0.4
0.6
0.8
H/H
O
0.000001 0.010.00001 0.0001 0.001
TIME, IN DAYS
TYPE CURVE
Figure 5. Drawdown versus logarithm of time and corresponding type curve for slug test of borehole BK-2640, Boarhead Farms site, BridgetonTownship, Bucks County, Pa.
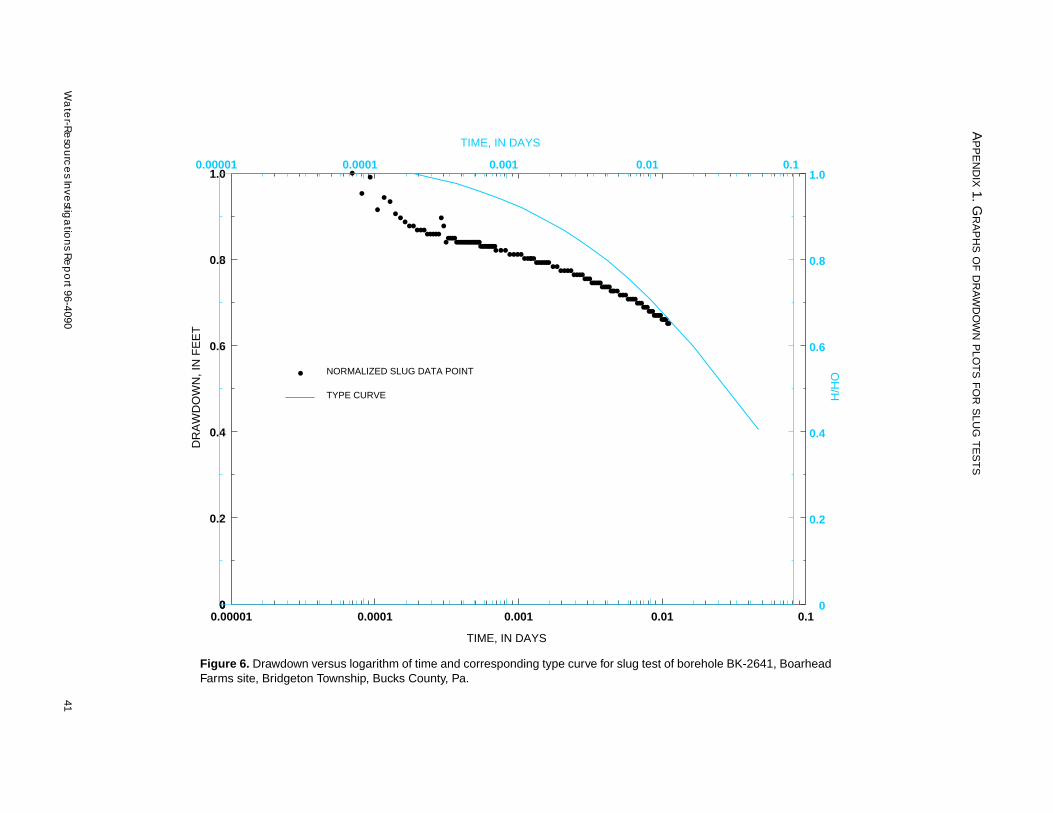
Wa
ter-R
eso
urc
es In
vestig
atio
ns R
ep
ort 96-4090
41
AP
PE
ND
IX1.G
RA
PH
SO
FD
RA
WD
OW
NP
LOT
SF
OR
SLU
GT
ES
TS
0
1.0
0
0.2
0.4
0.6
0.8
DR
AW
DO
WN
, IN
FE
ET
0.00001 0.10.0001 0.001 0.01
NORMALIZED SLUG DATA POINT
1.0
0
0.2
0.4
0.6
0.8
H/H
O
0.00001 0.10.0001 0.001 0.01
TIME, IN DAYS
TYPE CURVE
TIME, IN DAYS
Figure 6. Drawdown versus logarithm of time and corresponding type curve for slug test of borehole BK-2641, BoarheadFarms site, Bridgeton Township, Bucks County, Pa.

42W
ate
r-Re
sou
rce
s Inve
stiga
tion
s Re
po
rt 96-4090
AP
PE
ND
IX1.G
RA
PH
SO
FD
RA
WD
OW
NP
LOT
SF
OR
SLU
GT
ES
TS
0
1.0
0
0.2
0.4
0.6
0.8
DR
AW
DO
WN
, IN
FE
ET
0.0001 0.10.001 0.01
TIME, IN DAYS
NORMALIZED SLUG DATA POINT
0
1.0
0
0.2
0.4
0.6
0.8
H/H
O
0.00001 0.010.0001 0.001TIME, IN DAYS
TYPE CURVE
Figure 7. Drawdown versus logarithm of time and corresponding type curve for slug test of borehole BK-2642, Boarhead Farms site, BridgetonTownship, Bucks County, Pa.

Wa
ter-R
eso
urc
es In
vestig
atio
ns R
ep
ort 96-4090
43
AP
PE
ND
IX1.G
RA
PH
SO
FD
RA
WD
OW
NP
LOT
SF
OR
SLU
GT
ES
TS
.
0
1.0
0
0.2
0.4
0.6
0.8
DR
AW
DO
WN
, IN
FE
ET
0.00001 0.10.0001 0.001 0.01
TIME, IN DAYS
NORMALIZED SLUG DATA POINT
1.0
0
0.2
0.4
0.6
0.8
H/H
O
0.00001 0.10.0001 0.001 0.01
TYPE CURVE
TIME, IN DAYS
Figure 8. Drawdown versus logarithm of time and corresponding type curve for slug test of borehole BK-2643,Boarhead Farms site, Bridgeton Township, Bucks County, Pa.

Water-Resources Investigations Report 96-4090 44

Water-Resources Investigations Report 96-4090 45
APPENDIX 2. GRAPHS OF DRAWDOWN PLOTS FOR ISOLATED-ZONE
CONSTANT-DISCHARGE TESTS
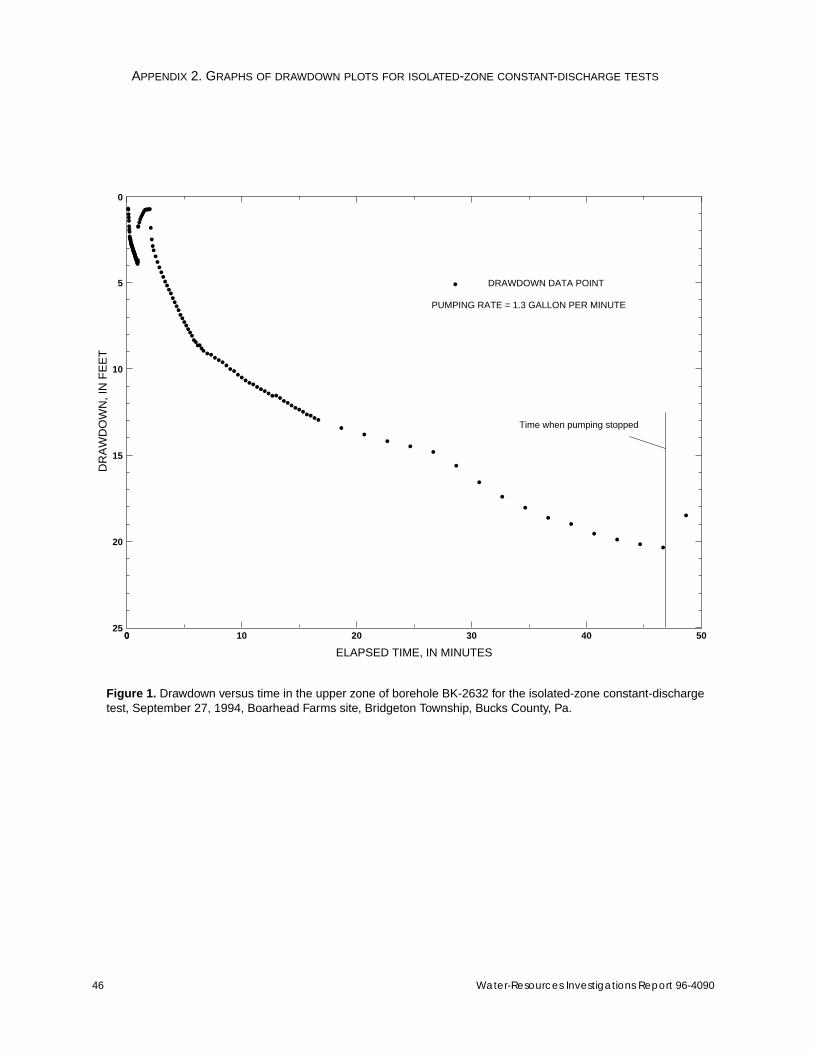
APPENDIX 2. GRAPHS OF DRAWDOWN PLOTS FOR ISOLATED-ZONE CONSTANT-DISCHARGE TESTS
46 Water-Resources Investigations Report 96-4090
0
25
5
10
15
20
DR
AW
DO
WN
, IN
FE
ET
0 500 10 20 30 40
ELAPSED TIME, IN MINUTES
DRAWDOWN DATA POINT
PUMPING RATE = 1.3 GALLON PER MINUTE
Time when pumping stopped
Figure 1. Drawdown versus time in the upper zone of borehole BK-2632 for the isolated-zone constant-dischargetest, September 27, 1994, Boarhead Farms site, Bridgeton Township, Bucks County, Pa.

Water-Resources Investigations Report 96-4090 47
APPENDIX 2. GRAPHS OF DRAWDOWN PLOTS FOR ISOLATED-ZONE CONSTANT-DISCHARGE TESTS
0
10
2
4
6
8
DR
AW
DO
WN
, IN
FE
ET
0 800 10 20 30 40 50 60 70
ELAPSED TIME, IN MINUTES
DRAWDOWN DATA POINT
Time when pumping stopped
PUMPING RATE = 4.1 GALLON PER MINUTE
Figure 2. Drawdown versus time in the upper zone of borehole BK-2636 for the isolated-zone constant-dischargetest, September 22, 1994, Boarhead Farms site, Bridgeton Township, Bucks County, Pa.
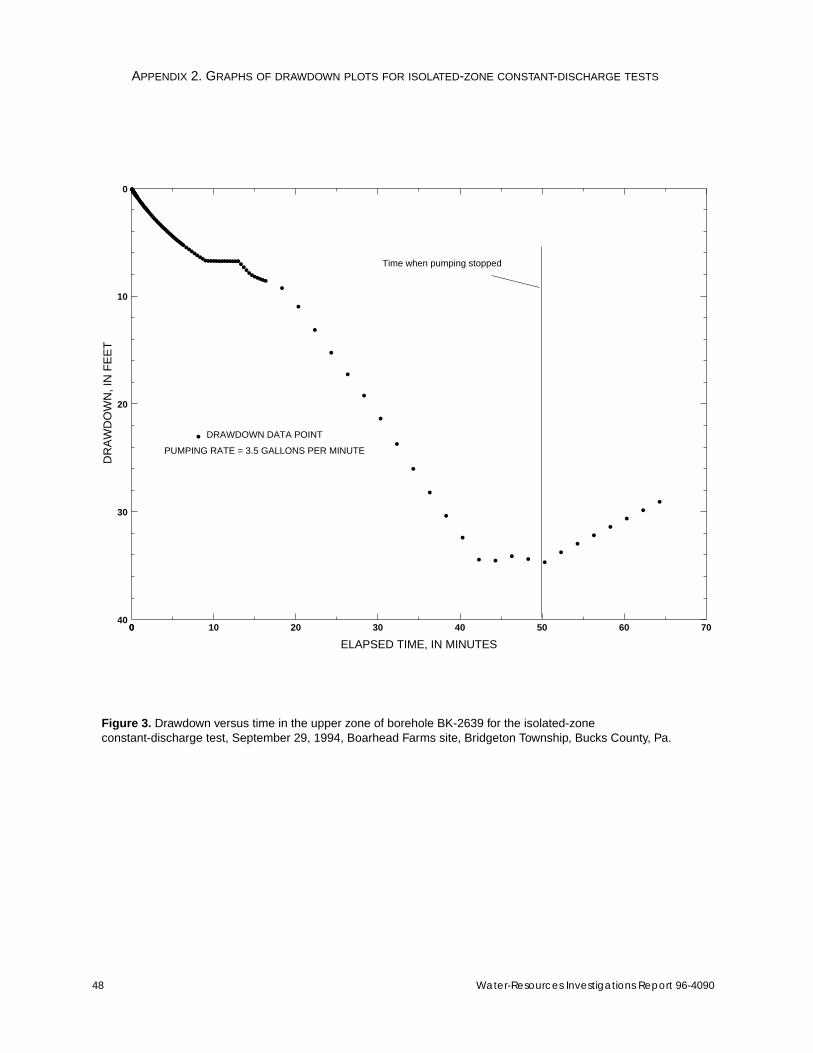
APPENDIX 2. GRAPHS OF DRAWDOWN PLOTS FOR ISOLATED-ZONE CONSTANT-DISCHARGE TESTS
48 Water-Resources Investigations Report 96-4090
0
40
10
20
30
DR
AW
DO
WN
, IN
FE
ET
0 700 10 20 30 40 50 60
ELAPSED TIME, IN MINUTES
DRAWDOWN DATA POINT
Time when pumping stopped
PUMPING RATE = 3.5 GALLONS PER MINUTE
Figure 3. Drawdown versus time in the upper zone of borehole BK-2639 for the isolated-zoneconstant-discharge test, September 29, 1994, Boarhead Farms site, Bridgeton Township, Bucks County, Pa.
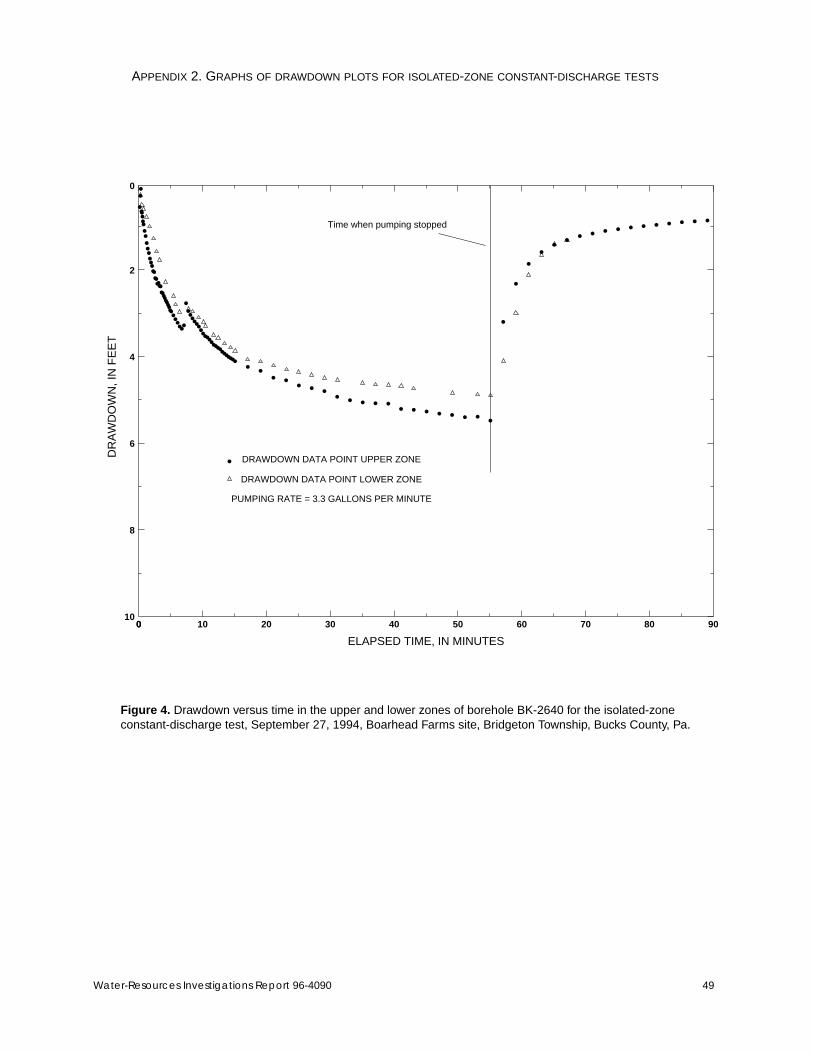
Water-Resources Investigations Report 96-4090 49
APPENDIX 2. GRAPHS OF DRAWDOWN PLOTS FOR ISOLATED-ZONE CONSTANT-DISCHARGE TESTS
0
10
2
4
6
8
DR
AW
DO
WN
, IN
FE
ET
0 900 10 20 30 40 50 60 70 80
ELAPSED TIME, IN MINUTES
DRAWDOWN DATA POINT UPPER ZONE
DRAWDOWN DATA POINT LOWER ZONE
Time when pumping stopped
PUMPING RATE = 3.3 GALLONS PER MINUTE
Figure 4. Drawdown versus time in the upper and lower zones of borehole BK-2640 for the isolated-zoneconstant-discharge test, September 27, 1994, Boarhead Farms site, Bridgeton Township, Bucks County, Pa.
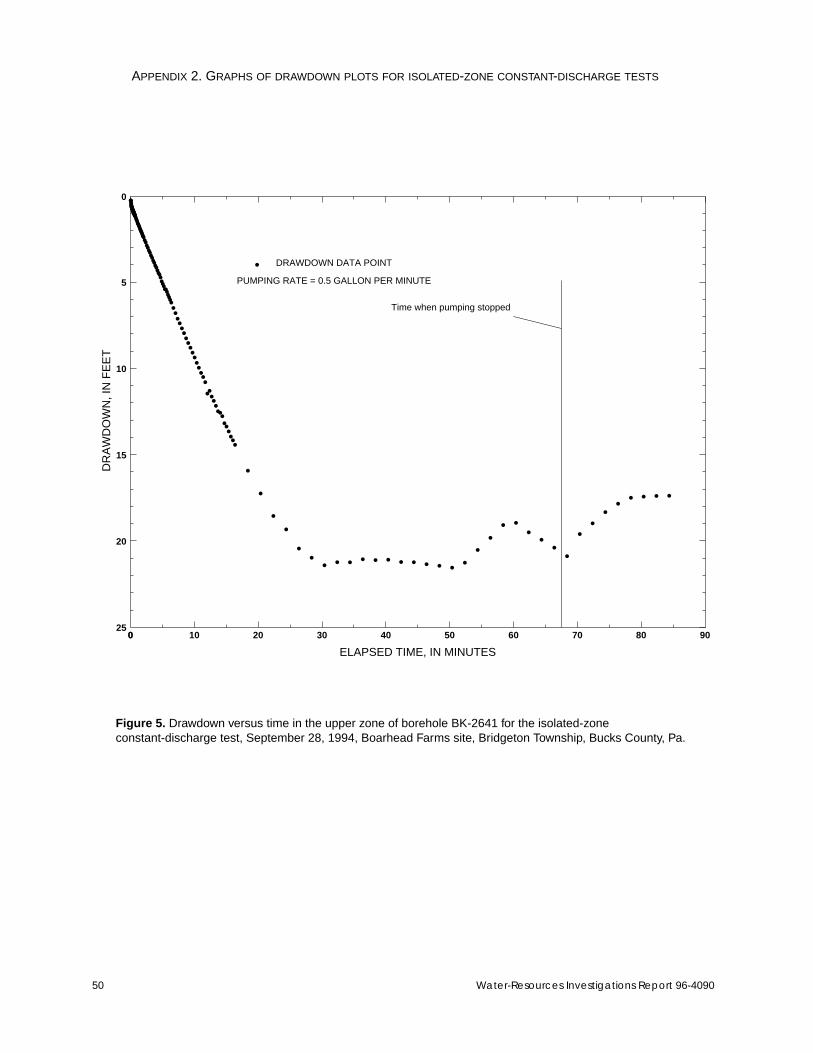
APPENDIX 2. GRAPHS OF DRAWDOWN PLOTS FOR ISOLATED-ZONE CONSTANT-DISCHARGE TESTS
50 Water-Resources Investigations Report 96-4090
0
25
5
10
15
20
DR
AW
DO
WN
, IN
FE
ET
0 900 10 20 30 40 50 60 70 80
ELAPSED TIME, IN MINUTES
DRAWDOWN DATA POINT
Time when pumping stopped
PUMPING RATE = 0.5 GALLON PER MINUTE
Figure 5. Drawdown versus time in the upper zone of borehole BK-2641 for the isolated-zoneconstant-discharge test, September 28, 1994, Boarhead Farms site, Bridgeton Township, Bucks County, Pa.
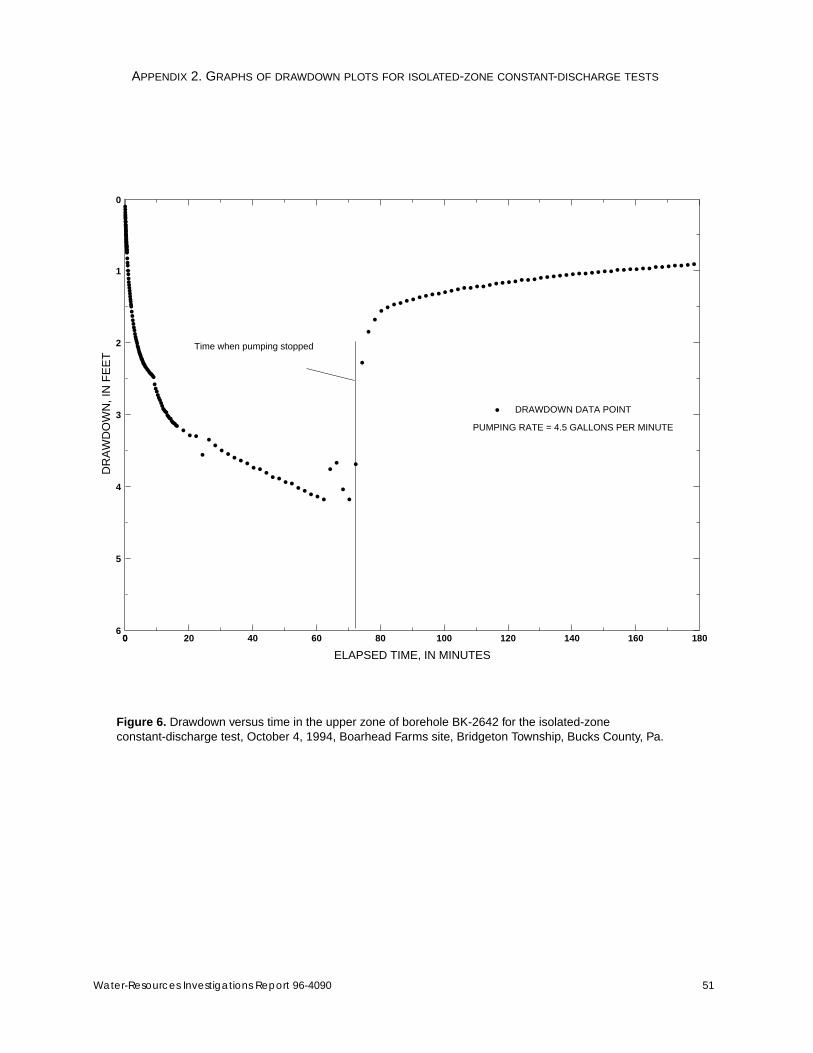
Water-Resources Investigations Report 96-4090 51
APPENDIX 2. GRAPHS OF DRAWDOWN PLOTS FOR ISOLATED-ZONE CONSTANT-DISCHARGE TESTS
0
6
1
2
3
4
5
DR
AW
DO
WN
, IN
FE
ET
0 1800 20 40 60 80 100 120 140 160
ELAPSED TIME, IN MINUTES
DRAWDOWN DATA POINT
Time when pumping stopped
PUMPING RATE = 4.5 GALLONS PER MINUTE
Figure 6. Drawdown versus time in the upper zone of borehole BK-2642 for the isolated-zoneconstant-discharge test, October 4, 1994, Boarhead Farms site, Bridgeton Township, Bucks County, Pa.

APPENDIX 2. GRAPHS OF DRAWDOWN PLOTS FOR ISOLATED-ZONE CONSTANT-DISCHARGE TESTS
52 Water-Resources Investigations Report 96-4090
0
30
5
10
15
20
25
DR
AW
DO
WN
, IN
FE
ET
0 900 10 20 30 40 50 60 70 80
ELAPSED TIME, IN MINUTES
DRAWDOWN DATA POINT
Time when pumping stopped
PUMPING RATE = 2.8 GALLONS PER MINUTE
Figure 7. Drawdown versus time in the lower zone of borehole BK-2643 for the isolated-zone constant-discharge test, October 5, 1994, Boarhead Farms site, Bridgeton Township, Bucks County, Pa.

Water-Resources Investigations Report 96-4062 53
APPENDIX 3. GRAPHS OF DRAWDOWN PLOTS FOR OPEN-HOLE CONSTANT-DISCHARGE TESTS
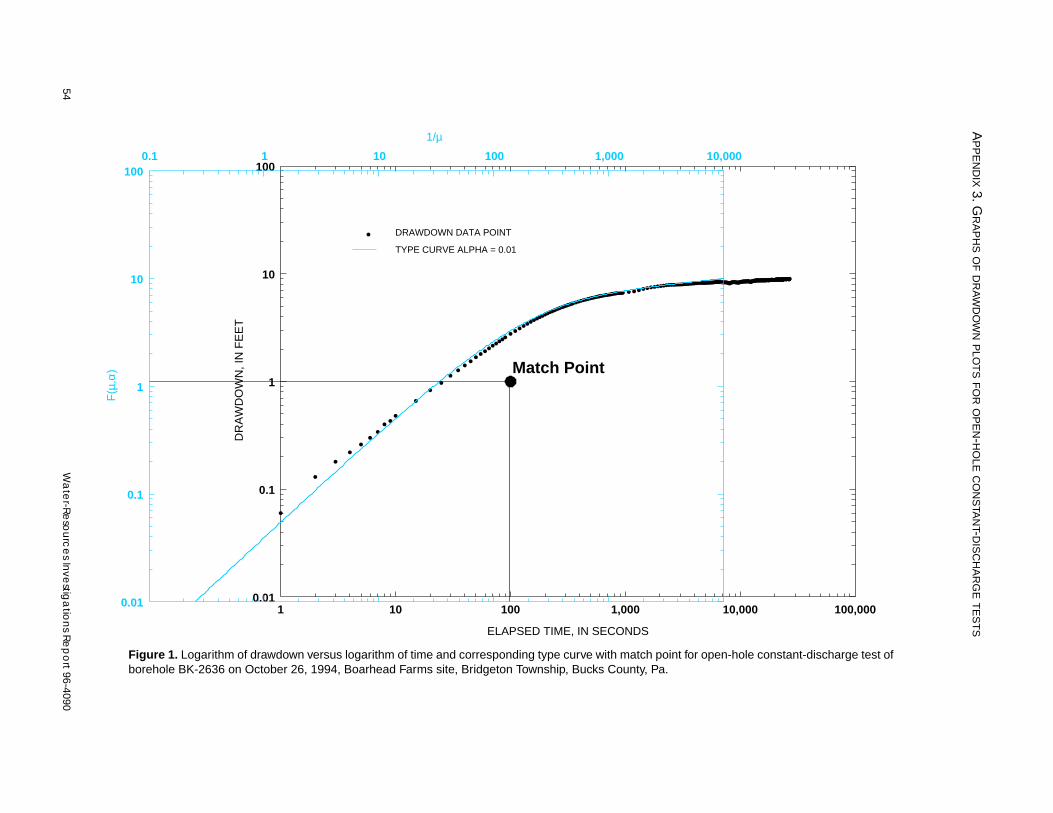
54W
ate
r-Re
sou
rce
s Inve
stiga
tion
s Re
po
rt 96-4090
AP
PE
ND
IX3.G
RA
PH
SO
FD
RA
WD
OW
NP
LOT
SF
OR
OP
EN-H
OLE
CO
NS
TAN
T-DIS
CH
AR
GE
TE
ST
S
0.01
100
0.1
1
10
DR
AW
DO
WN
, IN
FE
ET
1 100,00010 100 1,000 10,000
ELAPSED TIME, IN SECONDS
DRAWDOWN DATA POINT
0.01
100
0.1
1
10
F(µ
,α)
0.1 10,0001 10 100 1,000
1/µ
TYPE CURVE ALPHA = 0.01
Match Point
Figure 1. Logarithm of drawdown versus logarithm of time and corresponding type curve with match point for open-hole constant-discharge test ofborehole BK-2636 on October 26, 1994, Boarhead Farms site, Bridgeton Township, Bucks County, Pa.
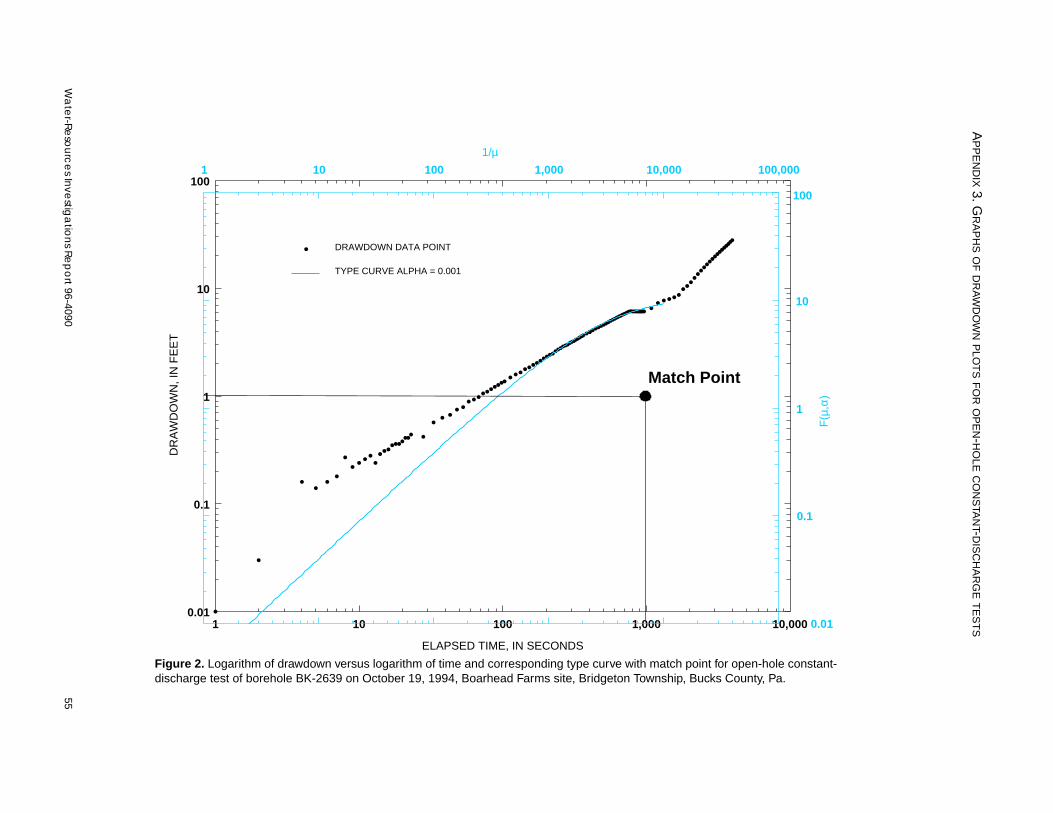
Wa
ter-R
eso
urc
es In
vestig
atio
ns R
ep
ort 96-4090
55
AP
PE
ND
IX3.G
RA
PH
SO
FD
RA
WD
OW
NP
LOT
SF
OR
OP
EN-H
OLE
CO
NS
TAN
T-DIS
CH
AR
GE
TE
ST
S
0.01
100
0.1
1
10
DR
AW
DO
WN
, IN
FE
ET
1 10,00010 100 1,000
ELAPSED TIME, IN SECONDS
DRAWDOWN DATA POINT
0.01
100
0.1
1
10
F(µ
,α)
1 100,00010 100 1,000 10,000
1/µ
TYPE CURVE ALPHA = 0.001
Match Point
Figure 2. Logarithm of drawdown versus logarithm of time and corresponding type curve with match point for open-hole constant-discharge test of borehole BK-2639 on October 19, 1994, Boarhead Farms site, Bridgeton Township, Bucks County, Pa.
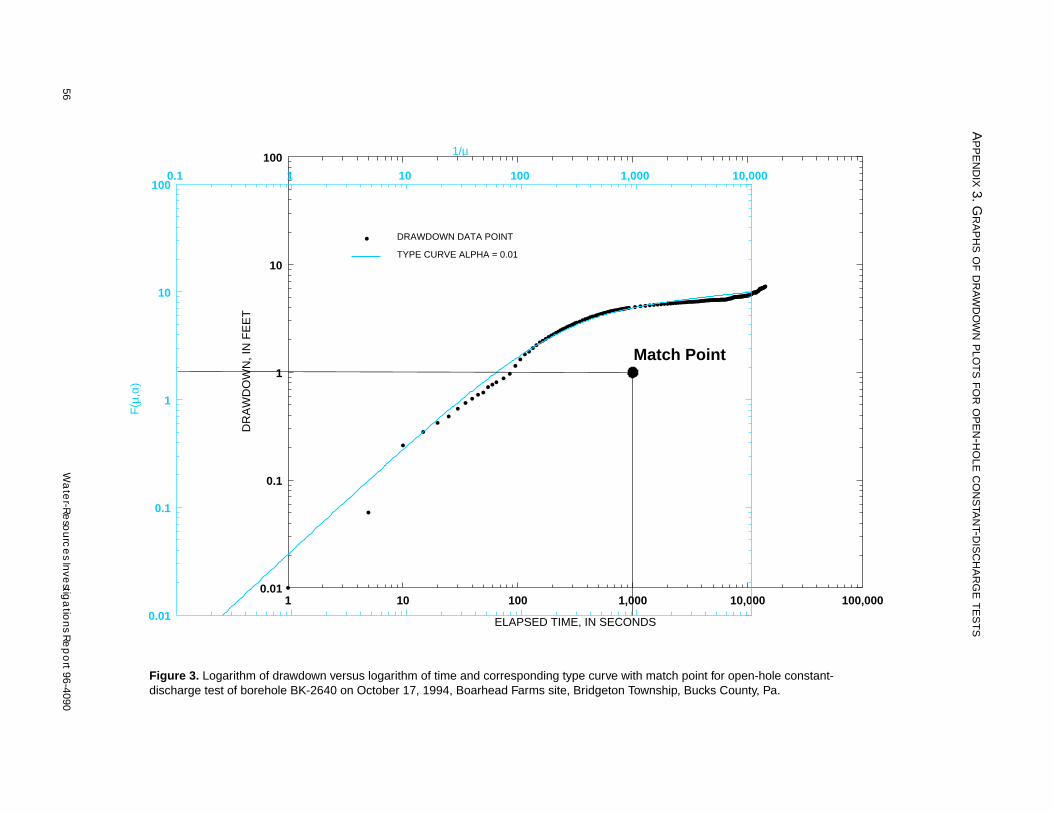
56W
ate
r-Re
sou
rce
s Inve
stiga
tion
s Re
po
rt 96-4090
AP
PE
ND
IX3.G
RA
PH
SO
FD
RA
WD
OW
NP
LOT
SF
OR
OP
EN-H
OLE
CO
NS
TAN
T-DIS
CH
AR
GE
TE
ST
S
0.01
100
0.1
1
10
DR
AW
DO
WN
, IN
FE
ET
1 100,00010 100 1,000 10,000
ELAPSED TIME, IN SECONDS
DRAWDOWN DATA POINT
0.01
100
0.1
1
10
F(µ
,α)
0.1 10,0001 10 100 1,000
1/µ
TYPE CURVE ALPHA = 0.01
Match Point
Figure 3. Logarithm of drawdown versus logarithm of time and corresponding type curve with match point for open-hole constant-discharge test of borehole BK-2640 on October 17, 1994, Boarhead Farms site, Bridgeton Township, Bucks County, Pa.
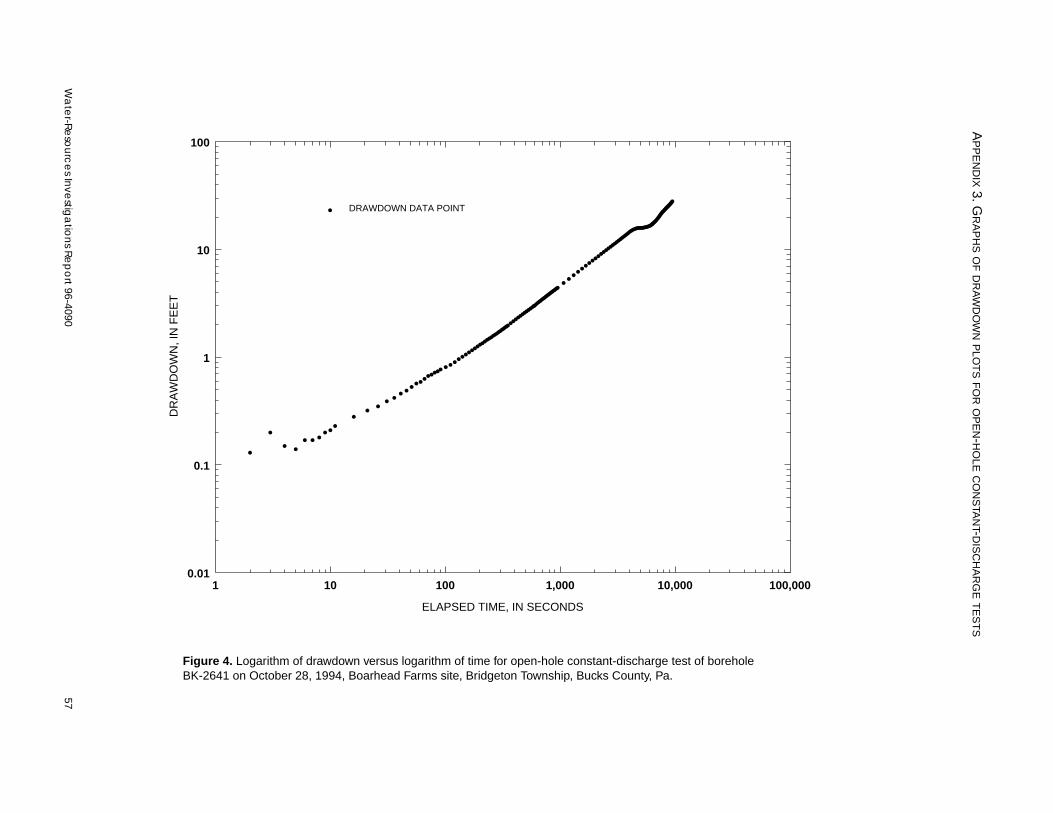
Wa
ter-R
eso
urc
es In
vestig
atio
ns R
ep
ort 96-4090
57
AP
PE
ND
IX3.G
RA
PH
SO
FD
RA
WD
OW
NP
LOT
SF
OR
OP
EN-H
OLE
CO
NS
TAN
T-DIS
CH
AR
GE
TE
ST
S
0.01
100
0.1
1
10
DR
AW
DO
WN
, IN
FE
ET
1 100,00010 100 1,000 10,000
ELAPSED TIME, IN SECONDS
DRAWDOWN DATA POINT
Figure 4. Logarithm of drawdown versus logarithm of time for open-hole constant-discharge test of boreholeBK-2641 on October 28, 1994, Boarhead Farms site, Bridgeton Township, Bucks County, Pa.
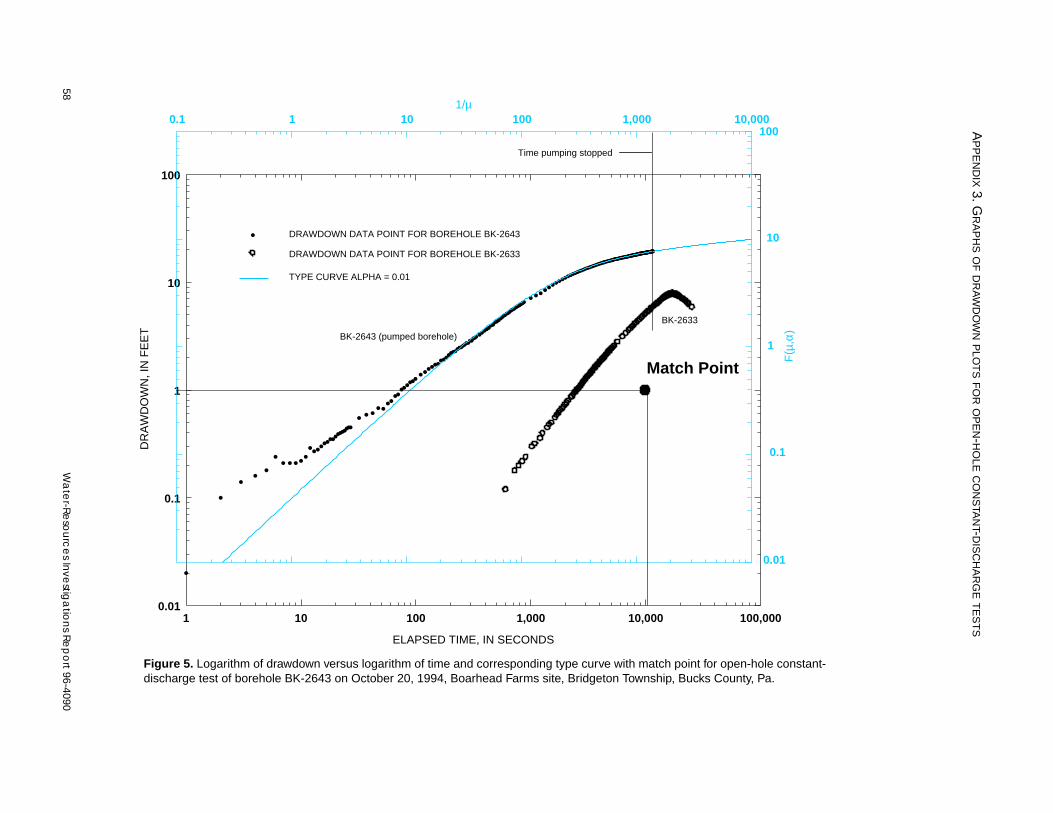
58W
ate
r-Re
sou
rce
s Inve
stiga
tion
s Re
po
rt 96-4090
AP
PE
ND
IX3.G
RA
PH
SO
FD
RA
WD
OW
NP
LOT
SF
OR
OP
EN-H
OLE
CO
NS
TAN
T-DIS
CH
AR
GE
TE
ST
S
0.01
100
0.1
1
10
DR
AW
DO
WN
, IN
FE
ET
1 100,00010 100 1,000 10,000
ELAPSED TIME, IN SECONDS
DRAWDOWN DATA POINT FOR BOREHOLE BK-2643
DRAWDOWN DATA POINT FOR BOREHOLE BK-2633
0.01
100
0.1
1
10
F(µ
,α)
0.1 10,0001 10 100 1,0001/µ
TYPE CURVE ALPHA = 0.01
BK-2643 (pumped borehole)
BK-2633
Match Point
Time pumping stopped
Figure 5. Logarithm of drawdown versus logarithm of time and corresponding type curve with match point for open-hole constant-discharge test of borehole BK-2643 on October 20, 1994, Boarhead Farms site, Bridgeton Township, Bucks County, Pa.