Embed Size (px)
Citation preview
REVIEW OF HYDROGEOLOGIC REVIEW OF HYDROGEOLOGIC AND SOIL CONDITIONS AND SOIL CONDITIONS
INFLUENCING RECLAIMED INFLUENCING RECLAIMED WATER REUSE ON OAHUWATER REUSE ON OAHU
WATER REUSE SPECIALTY CONFERENCEWATER REUSE SPECIALTY CONFERENCEKailuaKailua--KonaKona, Hawaii, HawaiiNovember 3, 2000November 3, 2000
Dr. Steven R. Dr. Steven R. SpenglerSpengler

Water Demand on Oahu
• It is estimated that allocations of groundwater on Oahu will meet the estimated sustainable yield (415 MGD) for the island in about 20 years.
• Only a portion of the water currently allocated is used for drinking purposes (~175 MGD) and the remainder is consumed by activities that do not necessarily require potability.
• Approximately 110 MGD of wastewater is currently generated on Oahu, most of which is disposed of via deep-ocean outfall.

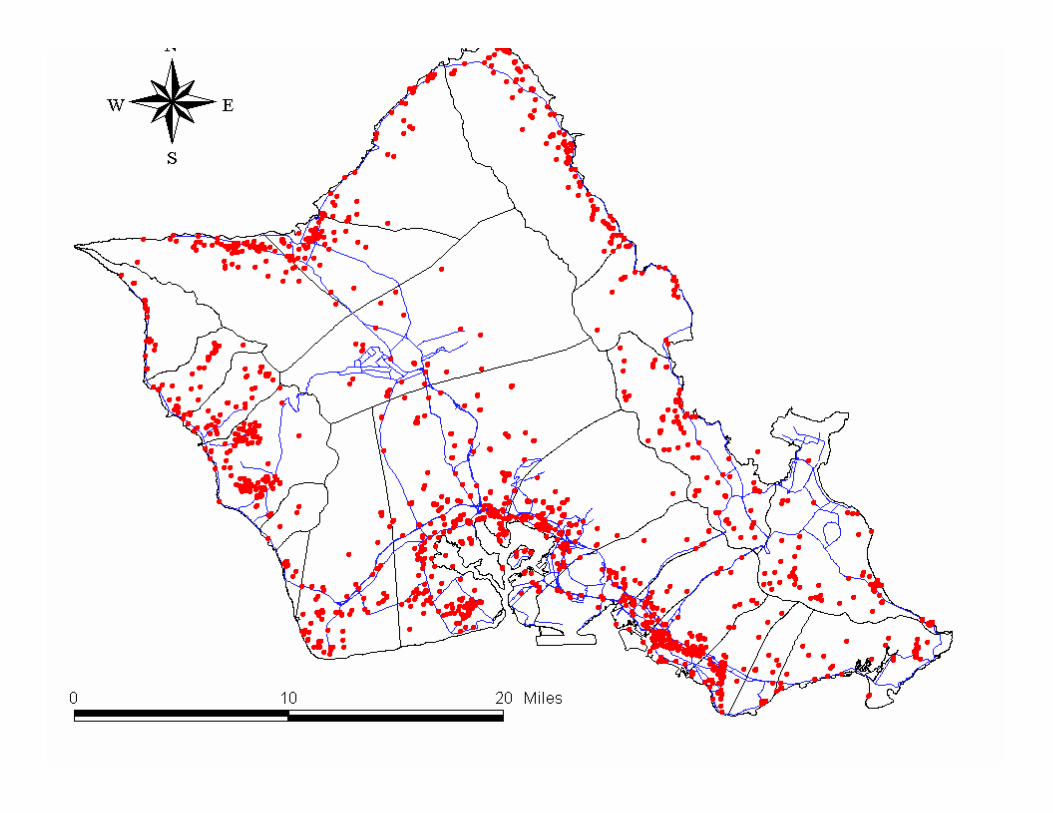
Study Area
• Focused Study on the Central Corridor Region of the Island of Oahu.
• The Central Corridor extends from Wailuain the North to Pearl Harbor in the South.
• This area receives roughly 72 percent of the total groundwater recharge to the island of Oahu and is currently pumped at a rate of approximately 200 MGD.


A Few Technical Considerations Influencing Reclaimed Water Reuse on Oahu
• Surface Soils and Saprolite Characteristics• Location of Wastewater Accumulation
Points on Oahu• Trace Chemical and Microbial Constituents
in Wastewater• Existing Contamination in Vadose Zone• Proximity to Existing Water Supply Wells• Transport and Physical Properties of Basal
Aquifers

Vadose Zone Stratigraphy in Central Oahu
• A soil and subsoil layer ranging in thickness from less than a meter to two is typically encountered in Central Oahu.
• Beneath the surface soil layer is a section of highly weathered basalt known as saprolitethat still retains recognizable textural features of the parent rock.
• Underlying these two upper layers are tens to hundreds of meters of unweathered, unsaturated basaltic rock.


Surface Soils• The near-surface soil is composed of clays and silts
resulting from the complete chemical and textural breakdown of the parent rock.
• Organic matter dominates the colloidal surfaces in surface soils in Hawaii contributing significantly to the cationexchange capacity of these soils.
• The upland areas of Central Oahu are dominated by Oxisols and Inceptisols while the lowland areas are covered by Vertisols and Mollisols.
• Oxisols and Inceptisols have relatively high water percolation rates and are well suited for agriculture.


Saprolite• Saprolite is weathered basalt that has retained the original
textural features of the parent rock.• Discontinuous perched water bodies within the saprolite can
play an important control on the vertical migration of pesticides, fertilizers and wastewater solutes to the underlying basal groundwater lens in Central Oahu.
• The saprolite profiles in wetter areas on Oahu reflect the impact of intense weathering and contain large amounts of iron oxides and hydroxides which have a net positive charge at low pH.
• These positively charged surfaces attract negatively charged ions, resulting in sorption of ions such as nitrate and chloride.

Intrinsic Susceptibility Definition
• Intrinsic Susceptibility is a measure of the vulnerability of a groundwater aquifer being negatively impacted by surface releases of contaminants based upon the physical characteristics of the land within an assessment area.


Intrinsic Susceptibility
• Land areas characterized by 1) low annual rainfall; 2) a deep groundwater table; and 3) surface soils with high organic carbon content will be quantified as low susceptibility areas (low calculated IS value).
• Land areas characterized by 1) high annual rainfall; 2) a shallow groundwater table; and 3) surface soils with low organic carbon content will be quantified as high susceptibility areas (high calculated IS value).

Variable Index = VI = R/C [1]where R is annual rainfall in inches and C is the median
organic carbon content of the top meter of soil, expressedas a percentage on an oven-dried basis.
Depth to Groundwater (feet) Weighting Factor (D)<50 1.050 to 100 0.9101 to 300 0.8> 300 0.7
Intrinsic Susceptibility is then calculated as follows:IS = (R/C) * D [2]

Intrinsic Susceptibility Map for Kauai

Review of Surface Soil and Saprolite Properties
• The optimal siting of an effluent reuse program requires gathering data on the spatial variation in thickness, organic matter content, mineralogy and chemical content of the shallow surface soils and underlying saprolite.
• The shallow soil layer can attenuate the downward migration of viruses and small organic molecules such as pesticides via sorption to the natural organic carbon present in this layer.
• Saprolite can attenuate nitrate due to the presence of variably charged clay minerals within this weathered layer.

Location of Wastewater Accumulation Points in Central Oahu
• Honouliuli: 25 mgd• Schofield Barracks: 4.2 mgd• Wahiawa/Whitmore: 2.0 mgd

Trace Chemical and Microbial Constituents in Wastewater
• Nitrogen• Phosphorous• Chloride• Bacteria• Viruses• Synthetic and Natural Hormones


Mean of Detected Values (Percent of Samples above Detection Limit) Analyte Caprock Groundwater Near-Shore Marine Water Secondary Effluent
Fecal Coliform (CFU per 100 ml) 13.9 (16%) 10.8 (72%) 1,269,422 (100%)
Enterococci (CFU per 100 ml) 24.0 (27%) 6.3 (91%) 297,096 (100%)
Clostridium perfringens (CFU per 100 ml) 4.3 (4%) 3.3 (67%) 4,185 (100%) Heterotrophic Bacteria (CFU per 100 ml) 139 (99%) 80.6 (100%) 3,811,037 (100%) Total Dissolved Solids (mg L-1) 1,675 (100%) 36,498 (100%) 694 (100%) Total Suspended Solids (mg L-1) 2.9 (73%) 31.6 (100%) 11.1 (100%) Turbidity (mg L-1) 1.91 (100%) 4.85 (100%) 6.89 (100%)
Non-Purgeable Organic Carbon (mg L-1) 1.10 (100%) 1.23 (100%) 9.04 (100%)
Biochemical Oxygen Demand (mg L-1) 1.73 (3%) 1.77 (17%) 26.9 (100%) Nitrate/Nitrite (mg-N L-1) 6.2 (93%) 0.0031 (15%) 2.2 (50%)
Ammonia (mg-N L-1) 1.53 (25%) 0.013 (10%) 12.6 (100%)
Total Kjeldahl Nitrogen (mg L-1) 1.37 (20%) 1.77 (6%) 18.18 (100%) Total Phosphorus (mg-P L-1) 0.07 (77%) 0.04 (44%) 2.52 (100%)
Boron (mg L-1) 401 (100%) 3,874 (100%) 230 (100%) Chloride (mg L-1) 611 (100%) 25,162 (100%) 199 (100%) Silica (mg L-1) 40.4 (100%) 0.32 (29%) 49 (100%)
Monthly Water Quality Monitoring Data Results 1998:135 Groundwater, 54 Marine Water and 9 Effluent Samples

Synthetic and Natural Hormones• Natural human estrogens such as 17beta-estradiol have
been detected at levels of up to 100 ng/L in wastewater treatment plant effluents.
• Synthetic and natural hormones may mimic natural hormones and bind with endocrine receptors leading to “unnatural” outcomes.
• Feminization in fish has been observed to occur at concentrations as low as 2 ng/L in laboratory studies.
• Experiments have shown that Oahu soils are ineffective at retarding the downward migration of higher molecular weight organics such as steroids.
• The levels of natural and synthetic hormones in Oahu wastewater streams have never been measured.

Existing Contaminants in Vadose Zone
• A recent study has found that between 3.5 to 11 tons per hectacre of nitrate-N is present in subsoils and the deep saprolitic vadose zone in Central Oahu.
• Areas formerly and actively used to cultivate pineapple contain residual levels of pesticides and nematocides such as EDB, DBCP, and TCP.
• Areas formerly used to cultivate sugarcane contain residual levels of various herbicides including ametryn and atrazine.

Kunia II Well 2402-01: DBCP
0
0.01
0.02
0.03
0.04
0.05
0.06
0.07
5/25/79 2/18/82 11/14/84 8/11/87 5/7/90 1/31/93 10/28/95
Date Sampled
DBC
P C
once
ntra
tion
(ppb
)
Kunia II Well 2402-01: TCP
0.00
0.20
0.40
0.60
0.80
1.00
1.20
1.40
2/18/82 7/3/83 11/14/84 3/29/86 8/11/87 12/23/88 5/7/90 9/19/91 1/31/93 6/15/94 10/28/95
Date Sampled
TCP
Con
cent
ratio
n (p
pb)

Potential Leaching of Contaminants• Residual contaminants may move more rapidly toward
groundwater when either the amount of infiltrated water is increased substantially, and/or the chemistry and biology of the added effluent contribute to changes in surface chemistry of soil/saprolite colloids in such a way as to desorb contaminants which were previously sorbed.
• The capacity of the soil column to sorb contaminants may be limited, so that eventually the soil column becomes “overloaded” with respect to specific contaminants, thus diminishing the effectiveness of the protective buffer above the groundwater. Recent small rises in groundwater nitrate levels in the Pearl Harbor area may reflect this phenomena.

Proximity to Existing Water Supply Wells
• The siting of future reuse programs need to take into consideration the zones of capture of nearby water supply wells.
• Two and ten-year capture zones for public water supply wells will be generated as part of the Source Water Assessment Program.
• Reuse projects should be sited outside the ten-year capture zone of all water supply wells.


10-Year Capture Zones for Water Supply Wells Tapping the Schofield High Level Water Body

Transport and Physical Properties of Basal Aquifers
• Irrigation water is estimated to reach the underlying basal aquifer in Central Oahu between 7 to 17 years after application under normal agricultural irrigation conditions.
• Transport times are reduced to between 20 to 120 days under conditions of continual saturation.
• Rapid groundwater flow velocities between 0.4 to 15 feet/day occur within the basal aquifers.
• Reclaimed water recharge will not mix with the entire basal lens volume. Effective mixing will be restricted to a 240 to 400 foot thick layer of water chemically degraded by irrigation return water.
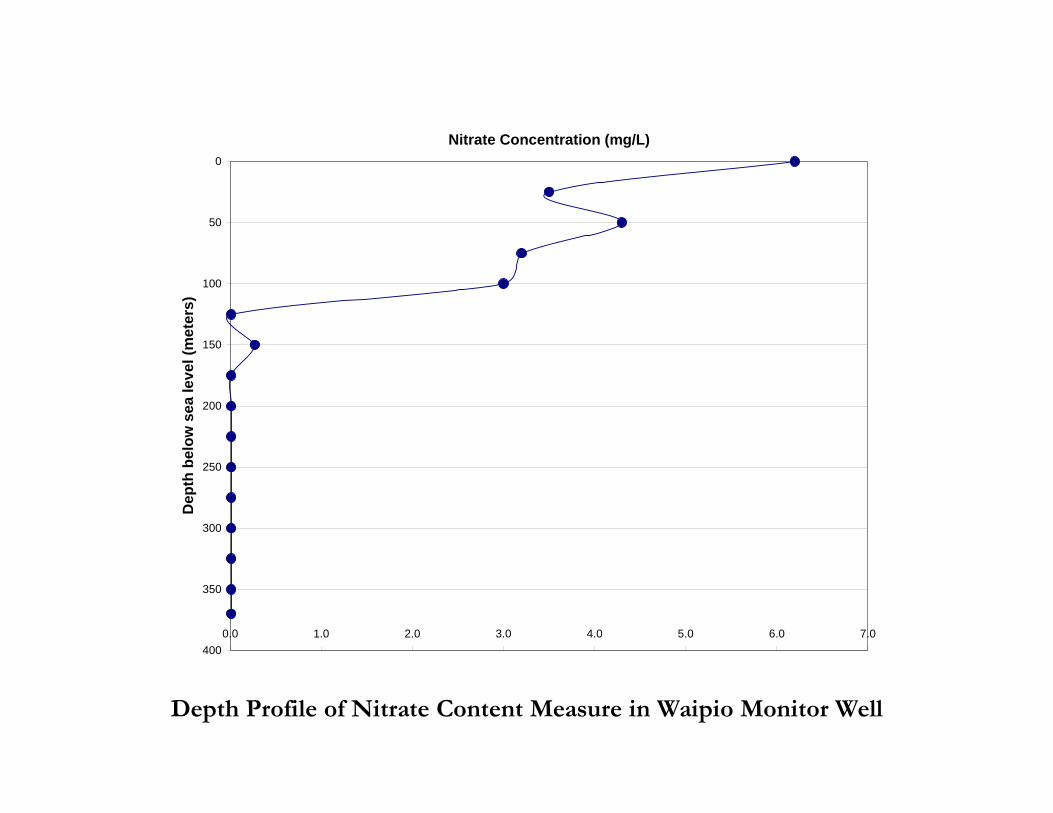
0
50
100
150
200
250
300
350
4000.0 1.0 2.0 3.0 4.0 5.0 6.0 7.0
Nitrate Concentration (mg/L)
Dep
th b
elow
sea
leve
l (m
eter
s)
Depth Profile of Nitrate Content Measure in Waipio Monitor Well

0
50
100
150
200
250
300
350
40019 20 21 22 23 24
Temperature (C)D
epth
bel
ow s
ea le
vel (
met
ers)
Depth Profile of Fluid Temperature in Waipio Monitor Well

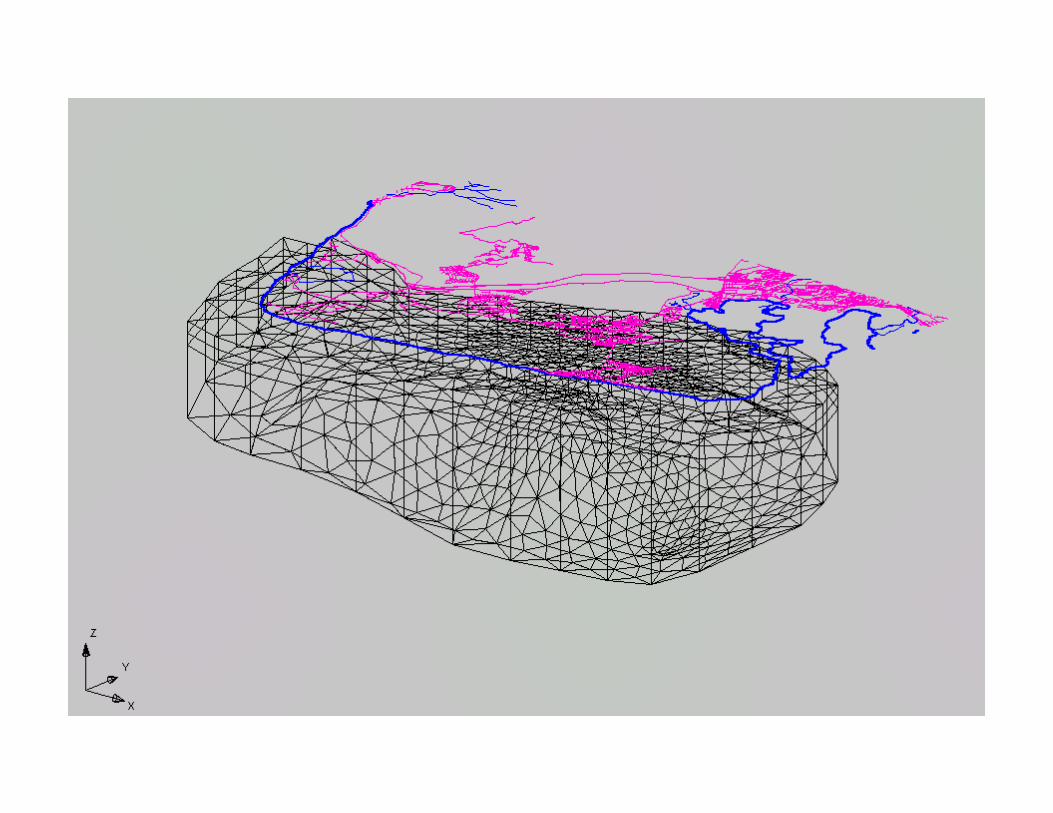
Modeling Simulation Results of Nitrogen Plume Resulting from Injection of
Wastewater in Ewa Plain
• Constructed a three-dimensional, density dependent finite element model of the EwaPlain to simulate the migration of chemical and microbial constituents resulting from infiltration of up to 10 MDG of secondary effluent on the grounds of the HonouliuliWastewater Treatment Plant.

Enteromorpha


0
200
400
600
800
1000
1200
1400
1600
1970 1972 1974 1976 1978 1980 1982 1984 1986 1988 1990 1992 1994 1996 1998 2000 2002 2004 2006
Tota
l Nitr
ogen
Mas
s Fl
ux (k
g da
y-1)
0
0.02
0.04
0.06
0.08
0.1
0.12
0.14
0.16
0.18
0.2
Tota
l Pho
spha
te (m
g-P
L-1
)
Furrow Irrigation Period= 1,424 kg day-1
Drip Irrigation Period= 846 kg day-1
Current Land Use= 690 kg day-1
Future Land Use(5 mgd Injection)= 1,057 kg day-1
Individual total phosphatemeasurements at near-shore
monitoring stations in the 'Ewa Plain