Embed Size (px)
Citation preview
HYDROGEOLOGIC DATA FROM A TEST WELL AT KATHRYN ABBEY HANNA
PARK, CITY OF JACKSONVILLE, FLORIDA
By David P. Brown, U.S. Geological Survey, and Richard A. Johnson and
Jerry S. Baker, St. Johns River Water Management District
U.S. GEOLOGICAL SURVEY
Open-File Report 84-143
Prepared in cooperation with the
ST. JOHNS RIVER WATER MANAGEMENT DISTRICT and the
CITY OF JACKSONVILLE, FLORIDA
Tallahassee, Florida
1984
UNITED STATES DEPARTMENT OF THE INTERIOR
WILLIAM P. CLARK, Secretary
GEOLOGICAL SURVEY
Dallas L. Peck, Director
For additional information write to:
District ChiefU.S. Geological SurveySuite 3015227 North Bronough StreetTallahassee, Florida 32301
Copies of the report can be purchased from:
Open-File Services Section Western Distribution Branch U.S. Geological Survey Box 25425, Federal Center Denver, Colorado 80225 (Telephone: (303) 234-5888)
CONTENTS
Page
Abstract 1Introduction 1
Purpose and scope 1Acknowledgments 2
Well construction 2Geologic data 5Hydrologic data 5
Water levels 5Artesian flow 28Water chemistry 34
Selected references 41
ILLUSTRATIONS
Page
Figure 1. Map showing location of test well 32. Schematic diagram of well construction 43. Diagram showing lithologic columnar section at
test well 194. Electric log; long and short normal resistivity, and
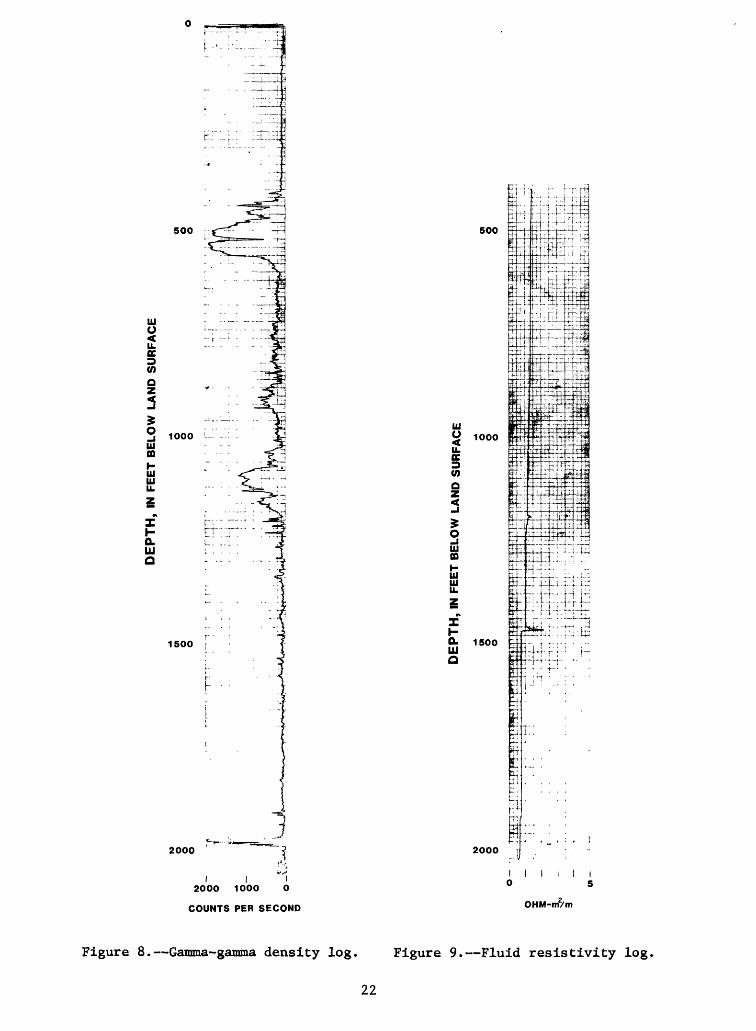
spontaneous potential 205. Electric log (focused resistivity) 206. Caliper and natural gamma logs 217. Neutron porosity log 218. Gamma-gamma density log 229. Fluid resistivity log 22
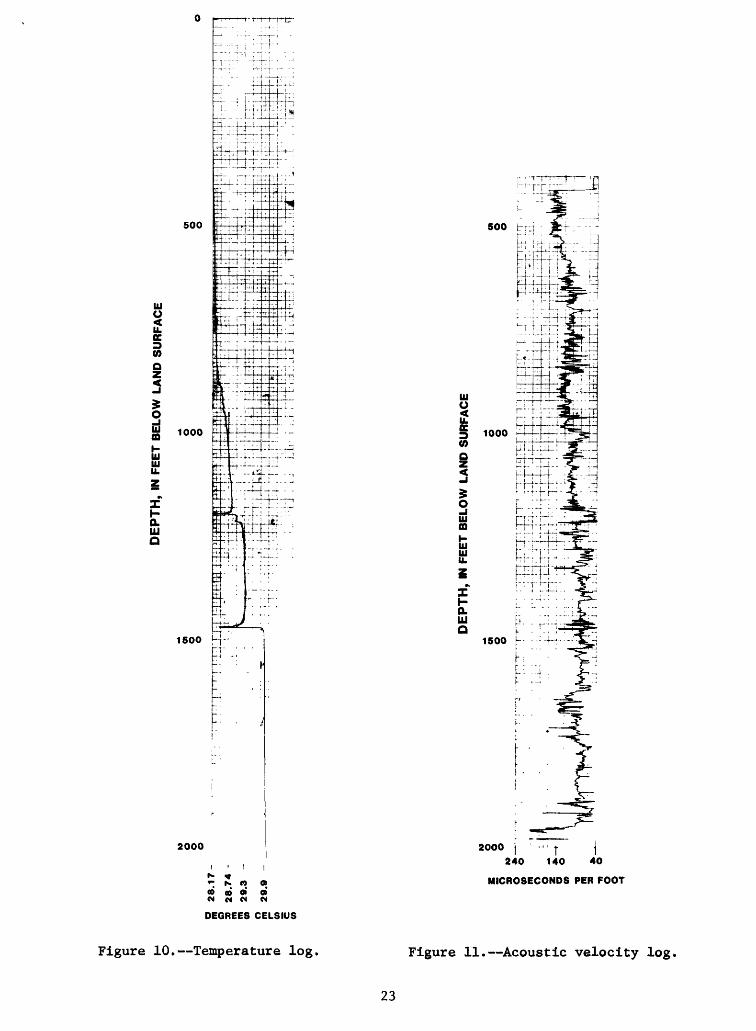
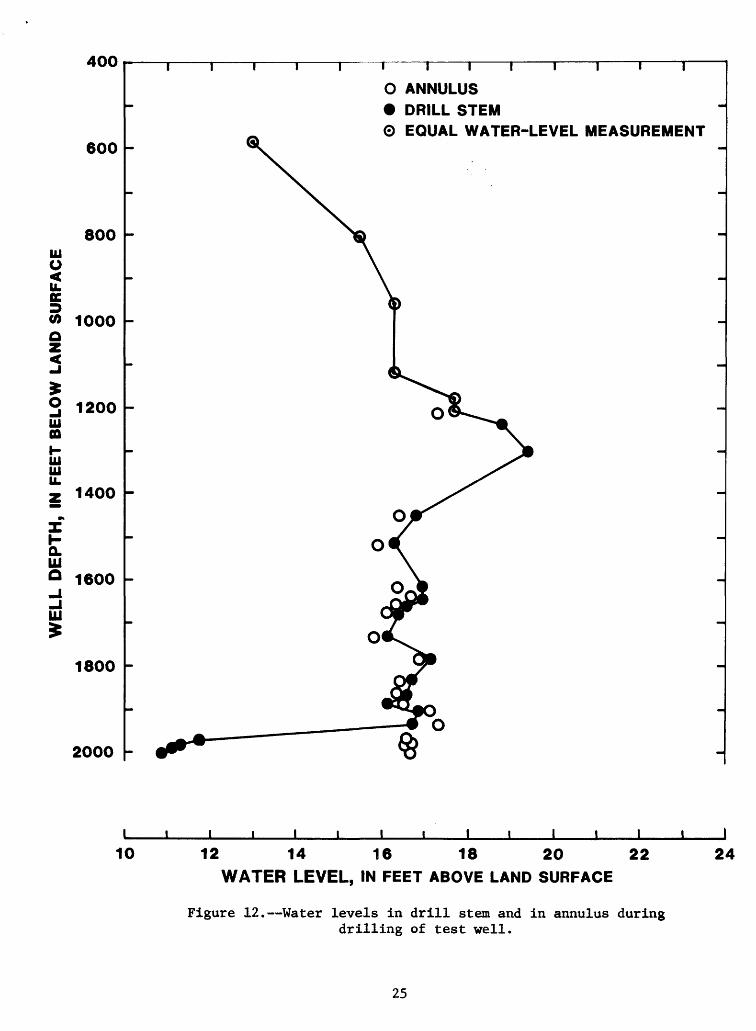
10. Temperature log 2311. Acoustic velocity log 2312. Graph showing water levels in drill stem and in
annulus during drilling of test well 2513. Graph showing water level in test well, open-hole
interval 1,892 to 2,026 feet below land surface, January to August 1982 26
14.-19. Graphs showing:14. Water level in the test well and predicted
tides at Mayport, Florida, August 1 and 2,1982 27
15. Artesian flow of test well during drilling 2916. Flow-meter traverses in test well, open-hole
interval 429 to 1,378 feet below land surface, February 22, 1981 31
17. Flow-meter traverses in test well, open-hole interval 429 to 2,026 feet below land surface, July 27, 1981 33
18. Chloride concentrations of water obtained from the drill stem and the annulus as the test well was drilled from 691 to 2,024 feet 38
19. Specific conductance of water from the drill stem as the test well was drilled from 691 to 2,024 feet 39
iii
TABLES
Page
Table 1. Lithologic log of test well 62. Water levels in drill stem and in annulus
during drilling of test well 243. Flow-meter traverses in test well, open-hole
interval 429 to 1,378 feet below land surface, February 22, 1981 30
4. Flow-meter traverses in test well, open-holeinterval 429 to 2,026 feet below land surface,July 27, 1981 32
5. Specific conductance and chloride concentrations of water obtained from the drill stem and the annulus as the test well was drilled from 691 to 2,024 feet 35
6. Selected chemical and physical constituents ofwater from test well, open-hole interval 1,892to 2,026 feet 40
IV
HYDROGEOLOGIC DATA FROM A TEST WELL AT KATHRYN ABBEY HANNA PARK, CITY OF JACKSONVILLE, FLORIDA
By David P. Brown, Richard A. Johnson, and Jerry S. Baker
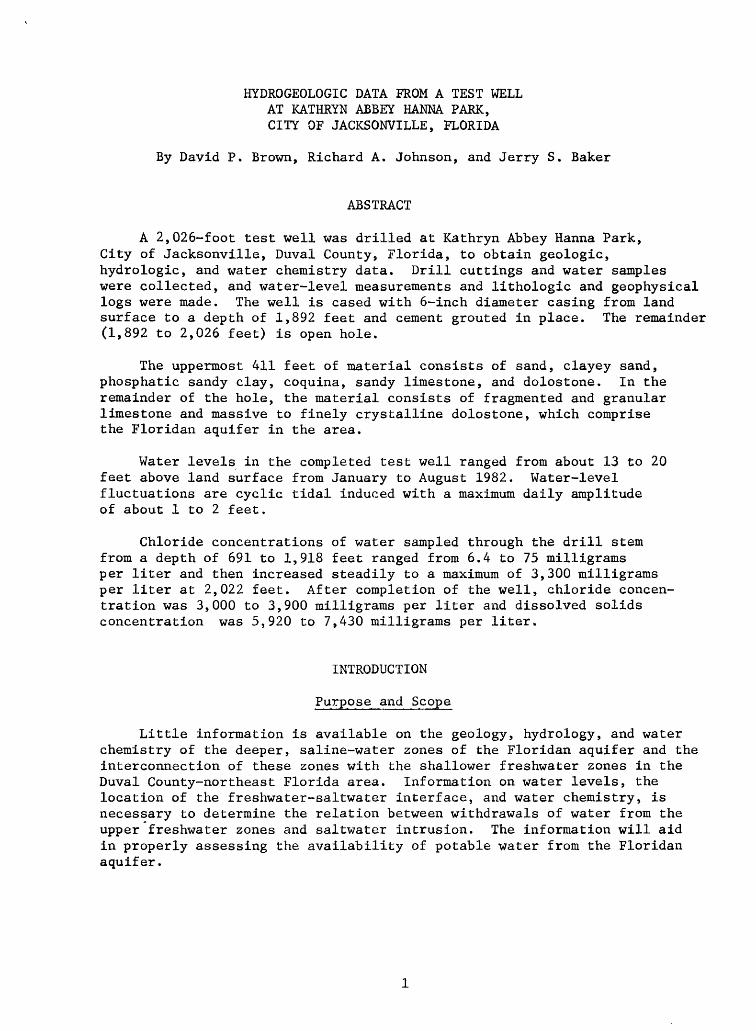
.ABSTRACT
A 2,026-foot test well was drilled at Kathryn Abbey Hanna Park, City of Jacksonville, Duval County, Florida, to obtain geologic, hydrologic, and water chemistry data. Drill cuttings and water samples were collected, and water-level measurements and lithologic and geophysical logs were made. The well is cased with 6-inch diameter casing from land surface to a depth of 1,892 feet and cement grouted in place. The remainder (1,892 to 2,026 feet) is open hole.
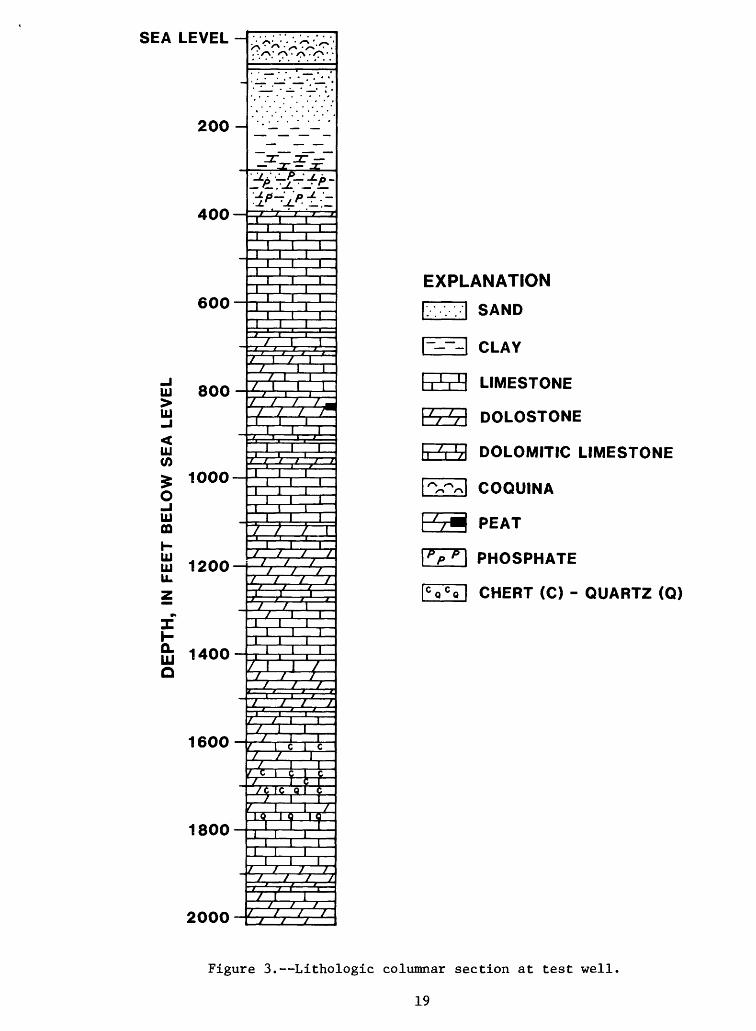
The uppermost 411 feet of material consists of sand, clayey sand, phosphatic sandy clay, coquina, sandy limestone, and dolostone. In the remainder of the hole, the material consists of fragmented and granular limestone and massive to finely crystalline dolostone, which comprise the Floridan aquifer in the area.
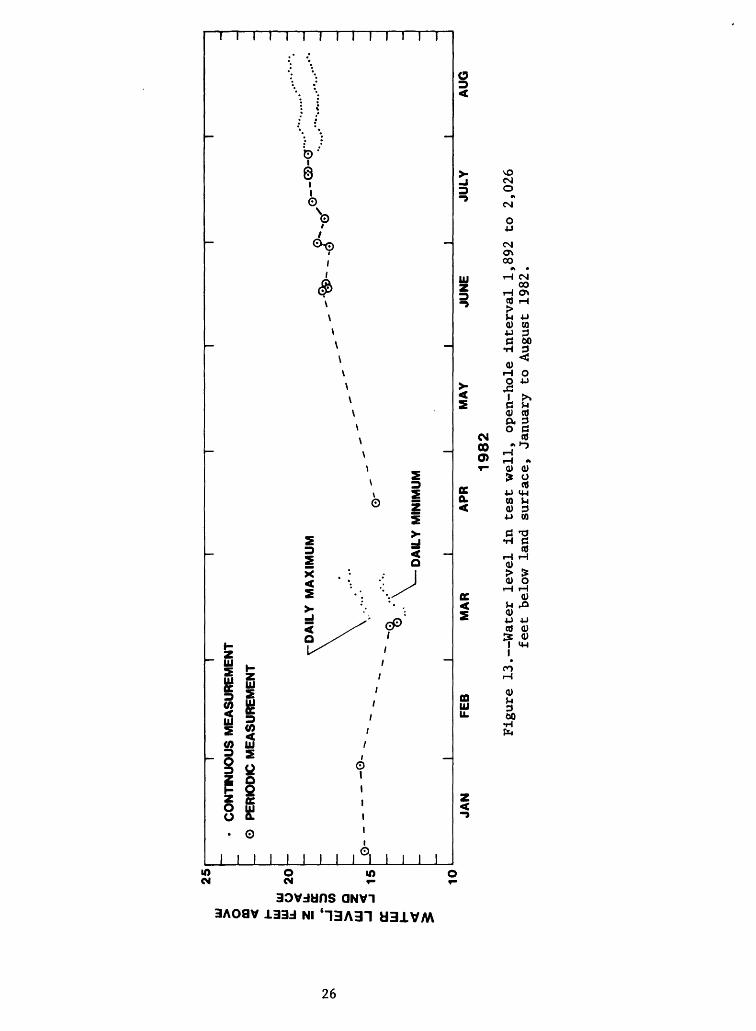
Water levels in the completed test well ranged from about 13 to 20 feet above land surface from January to August 1982. Water-level fluctuations are cyclic tidal induced with a maximum daily amplitude of about 1 to 2 feet.
Chloride concentrations of water sampled through the drill stem from a depth of 691 to 1,918 feet ranged from 6.4 to 75 milligrams per liter and then increased steadily to a maximum of 3,300 milligrams per liter at 2,022 feet. After completion of the well, chloride concen tration was 3,000 to 3,900 milligrams per liter and dissolved solids concentration was 5,920 to 7,430 milligrams per liter.
INTRODUCTION
Purpose and Scope
Little information is available on the geology, hydrology, and water chemistry of the deeper, saline-water zones of the Floridan aquifer and the interconnection of these zones with the shallower freshwater zones in the Duval County-northeast Florida area. Information on water levels, the location of the freshwater-saltwater interface, and water chemistry, is necessary to determine the relation between withdrawals of water from the upper freshwater zones and saltwater intrusion. The information will aid in properly assessing the availability of potable water from the Floridan aquifer.
The U.S. Geological Survey, in cooperation with the St. Johns River Water Management District and the City of Jacksonville is investigating the hydrogeology and water chemistry of the deeper zones of the Floridan aquifer. An essential part of this investigation is the drilling, testing, and instrumentation of a deep test well network of 5 to 7 wells in northeast Florida.
This report presents the hydrogeologic and water chemistry data collected during construction and after completion of a test well at the City of Jacksonville's Kathryn Abbey Hanna Park.
This well will be used to monitor changes in water level and water chemistry. It will also aid in determining the depth to the freshwater- saltwater interface and the possible movement of saline water.
Acknowledgments
The authors wish to express their appreciation to the Chairman, the Governing Board, and staff of the St. Johns River Water Management District, and the Mayor, City Council, and staff of the City of Jacksonville for their support of this investigation. Particular acknowledgment is given to Douglas Munch, Director, Resource Evaluation Division, St. Johns River Water Management District, and Gary Weise, Bio-Environmental Services, City of Jacksonville, for their assistance during the drilling and testing of the test well. The authors also wish to thank Cecil Butler, Park Ranger, Kathryn Abbey Hanna Park, for his help during all phases of drilling and testing of the well.
WELL CONSTRUCTION
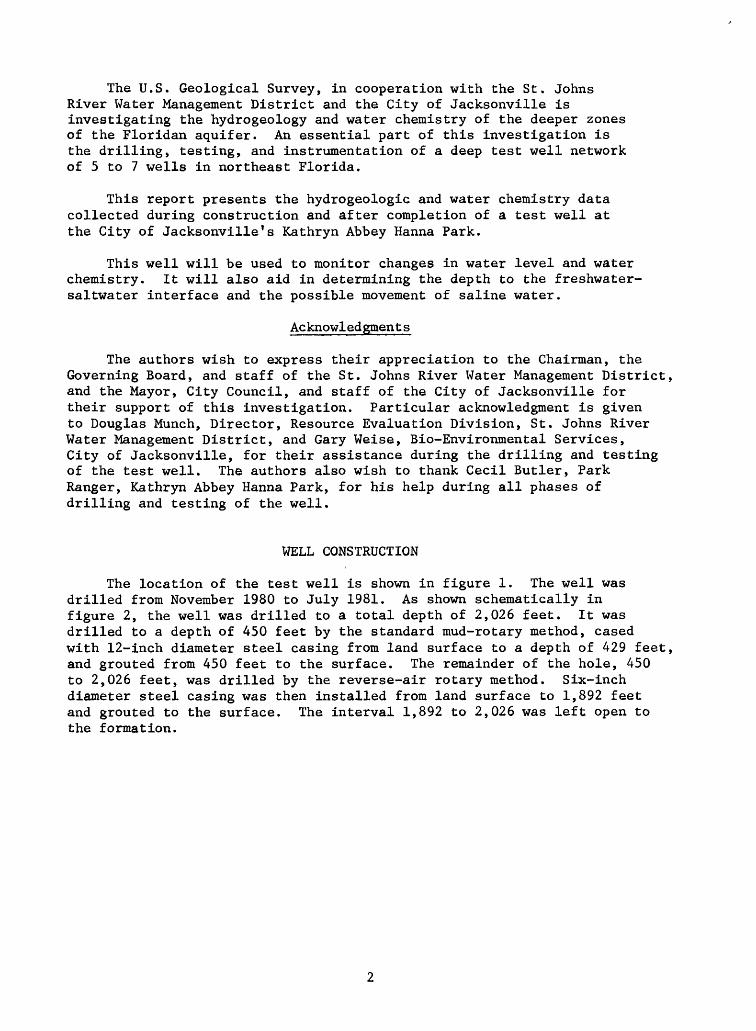
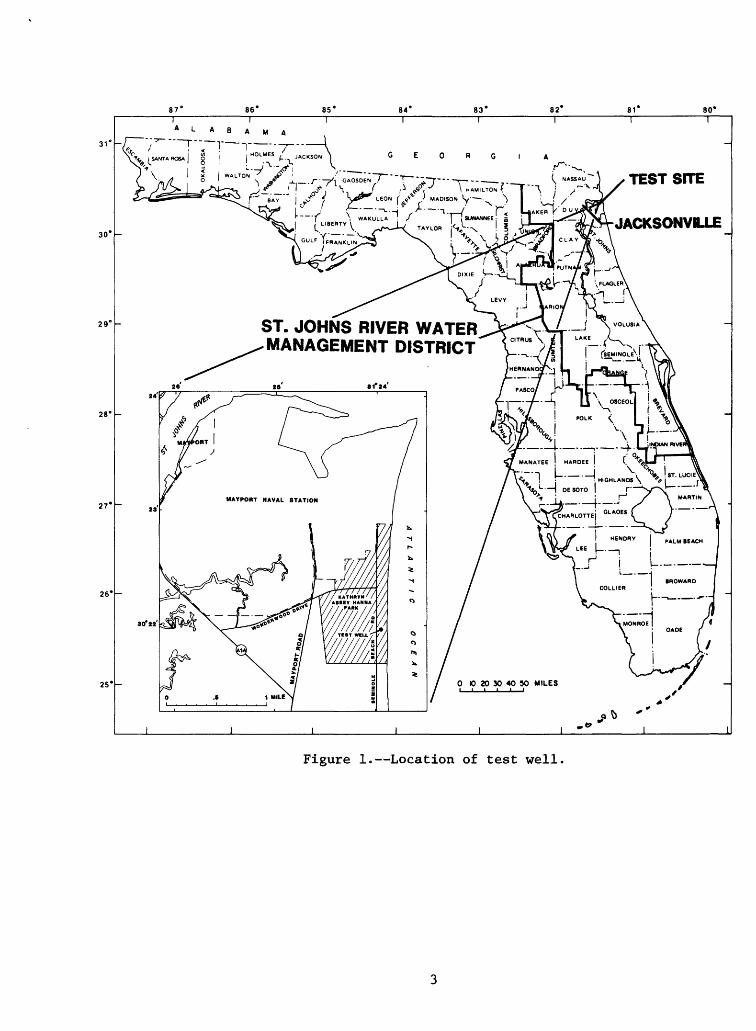
The location of the test well is shown in figure 1. The well was drilled from November 1980 to July 1981. As shown schematically in figure 2, the well was drilled to a total depth of 2,026 feet. It was drilled to a depth of 450 feet by the standard mud-rotary method, cased with 12-inch diameter steel casing from land surface to a depth of 429 feet, and grouted from 450 feet to the surface. The remainder of the hole, 450 to 2,026 feet, was drilled by the reverse-air rotary method. Six-inch diameter steel casing was then installed from land surface to 1,892 feet and grouted to the surface. The interval 1,892 to 2,026 was left open to the formation.
87° 86* 85* 84" 83* 81* 80°
31°
30*
29°
28°
27'
26*
G E 0 R G I
TEST SITE
JACKSONVILLE
25'
^, WAKULLA ! / ; =
LIBERTV V ^ TAVUOR kK ! 1
ST. JOHNS RIVER WATER MANAGEMENT DISTRICT
30'2 2'
Figure 1. Location of test well.
DIAMETER, IN INCHES
30 20 10 0 10 20 30
LAND SURFACE
Si
200-
400 -
600 -UJ 0
u. ocw 800 - OZ
_l
2 1000 -UJffi1-UJ UJu. Z 1200 -
X
Q. UJ
° 1400 -
1600 -
1800 -
2000 -
ii?
wi
: : '. : : ;/:-:
U
11
|^P PIT CASING
11 CEMENT GROUT
^-1 19-INPH niAMFTFR
HI SURFACE CASING
DRILLED HOLE
6-INCH DIAMETER CASING
CEMENT GROUT
( OPEN HOI F INTFRVAL
TOTAL DEPTH 2026 FEET
Figure 2. Schematic diagram of well construction.
GEOLOGIC DATA
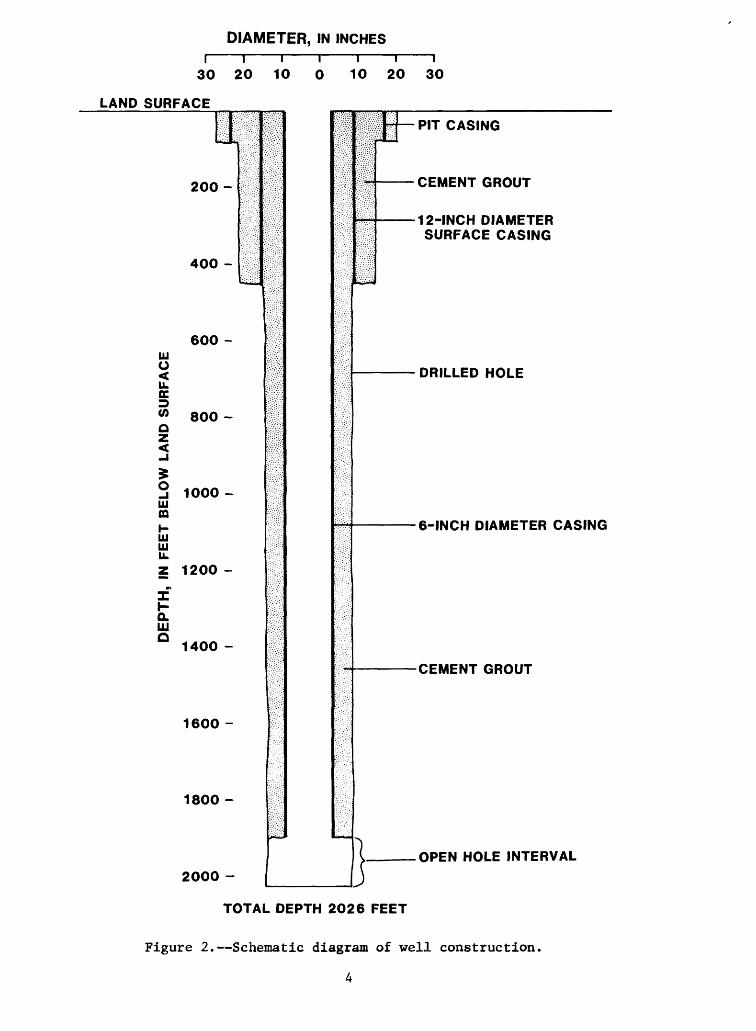
Drill cuttings were collected at intervals of about 10 feet and at changes in lithology. The lithologic log (table 1) is based on an examination of the cuttings. The uppermost 411 feet of material penetrated by the test well consists of sand, clayey sand, phosphatic sandy clay, coquina, sandy limestone, and dolostone (fig. 3). These materials range in age from Miocene (Hawthorn Formation) to Holocene. The remaining material consists of fragmented and granular limestone and massive to finely crystalline dolostone of Paleocene to Eocene (?) age. The formations, which comprise the Floridan aquifer in northeast Florida, in ascending order are the Cedar Keys (?), Oldsmar, Lake City, Avon Park, and Ocala Limestones. A core of rock was taken during drilling from 1,194 to 1,216 feet below land surface (10 feet of core recovered).
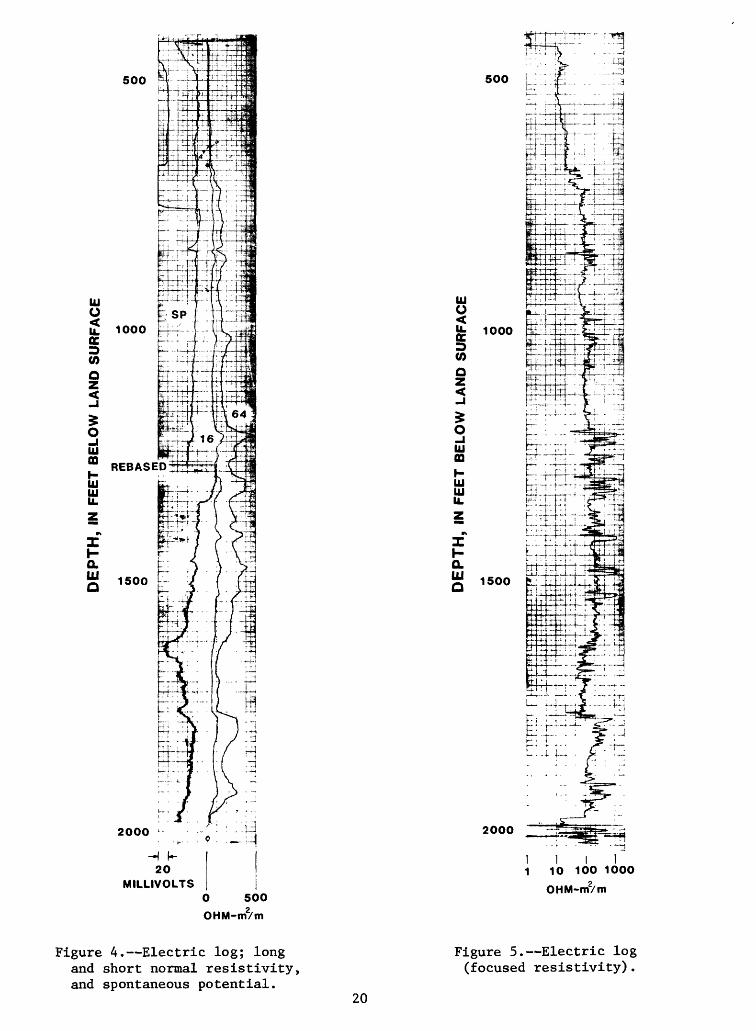
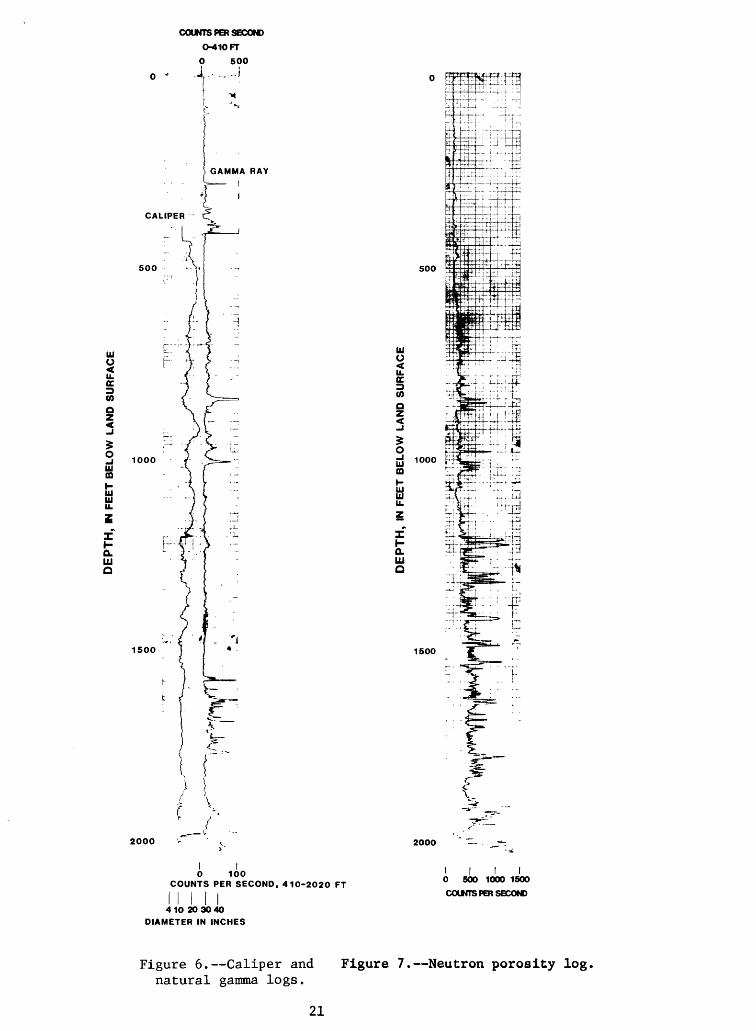
Geophysical logs were made during construction of the well, and selected logs are included in this report as figures 4 through 11.
HYDROLOGIC DATA
Water Levels
Water levels were measured in the drill stem near or at the bottom of the drill hole and in the annular space between the drilled hole and the drill stem as the test well was drilled from 600 to 2,021 feet below land surface (table 2 and fig. 12). Water-levels were all above land surface and were measured in feet. The altitude of land surface at the test site was about 18 feet above sea level.
When the well was drilled to a depth of 1,378 feet, a mechanically inflatable packer was installed in the test well at a depth of 1,205 feet. The interval, 1,205 to 1,378 feet, was thereby isolated, and the water level in the interval was measured continuously for about 39 hours. During this period, the water level ranged from 20.5 to 21.5 feet above land surface (fig. 12). At the same time, water level in the interval 429 to 1,205 feet, ranged from about 15 to 16 feet above land surface.
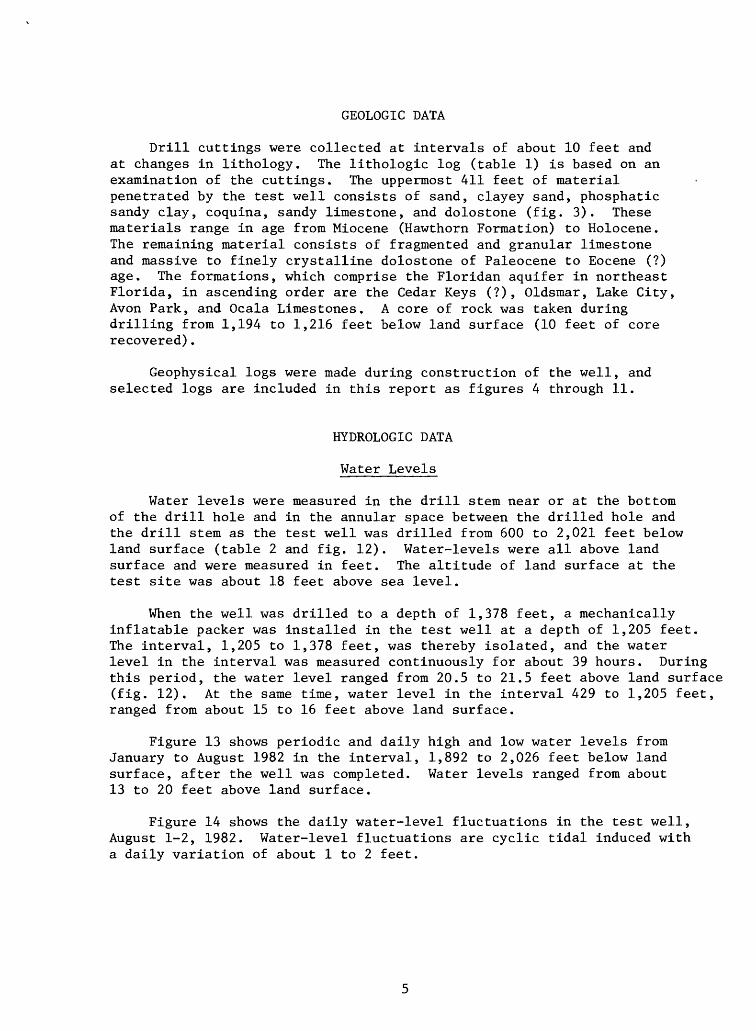
Figure 13 shows periodic and daily high and low water levels from January to August 1982 in the interval, 1,892 to 2,026 feet below land surface, after the well was completed. Water levels ranged from about 13 to 20 feet above land surface.
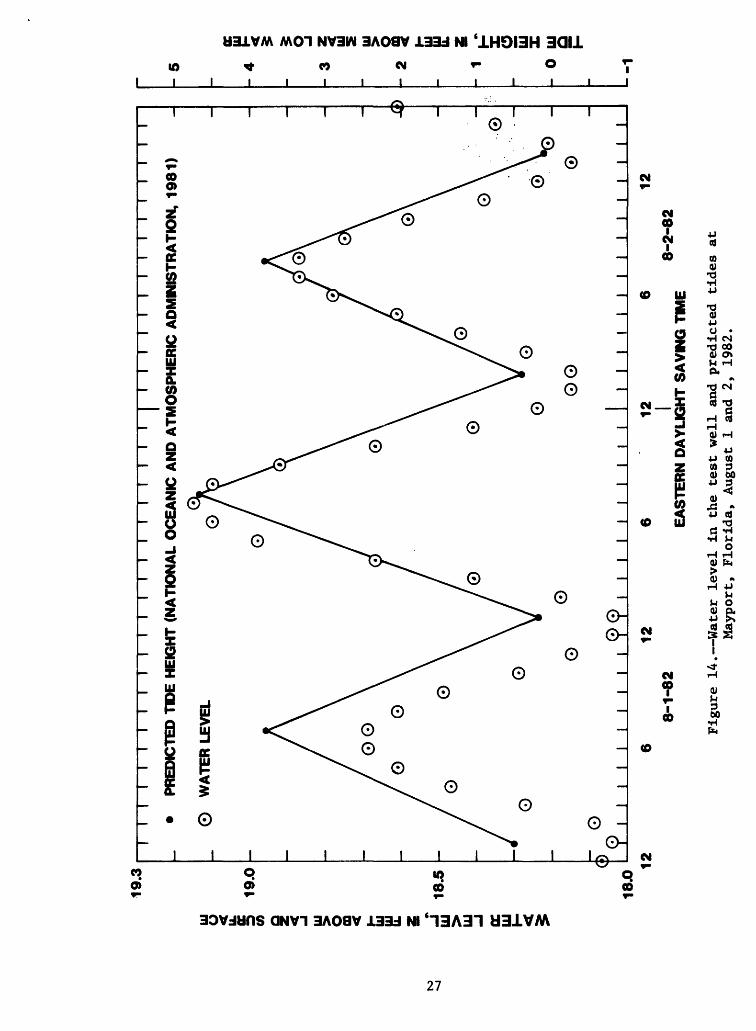
Figure 14 shows the daily water-level fluctuations in the test well, August 1-2, 1982. Water-level fluctuations are cyclic tidal induced with a daily variation of about 1 to 2 feet.
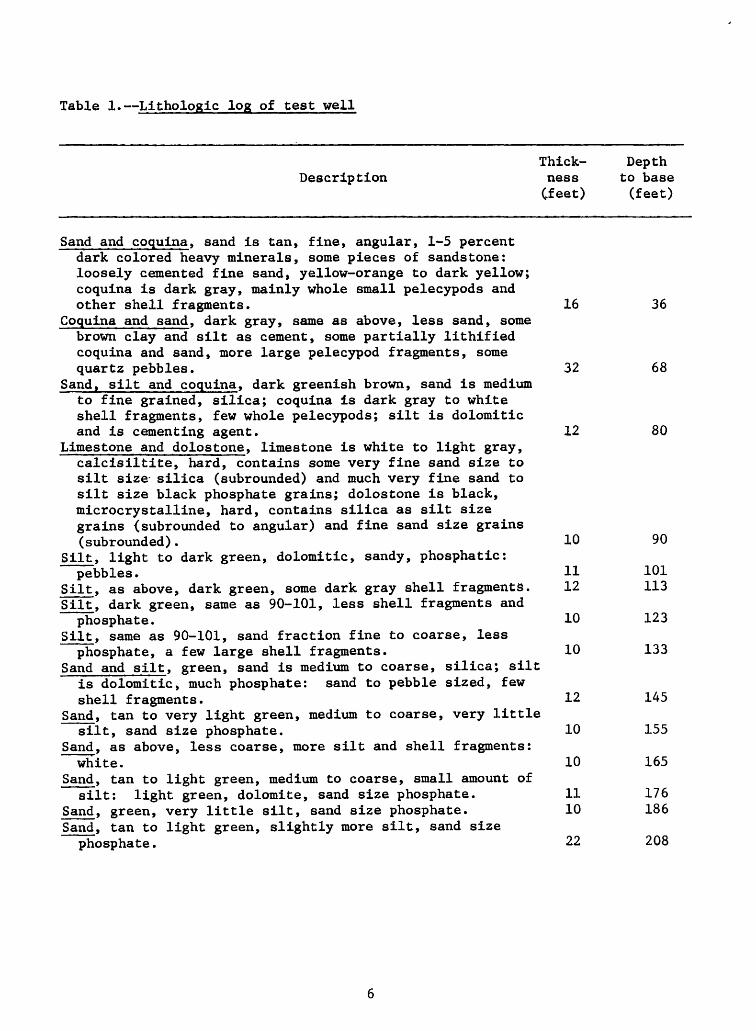
Table 1. Lithologic log of test well
DescriptionThickness
Cfeet)
Depthto base(feet)
Sand and coquina, sand is tan, fine, angular, 1-5 percentdark colored heavy minerals, some pieces of sandstone:loosely cemented fine sand, yellow-orange to dark yellow;coquina is dark gray, mainly whole small pelecypods andother shell fragments. 16 36
Coquina and sand, dark gray, same as above, less sand, somebrown clay and silt as cement, some partially lithifiedcoquina and sand, more large pelecypod fragments, somequartz pebbles. 32 68
Sand, silt and coquina, dark greenish brown, sand is mediumto fine grained, silica; coquina is dark gray to whiteshell fragments, few whole pelecypods; silt is dolomiticand is cementing agent. 12 80
Limestone and dolostone, limestone is white to light gray,calcisiltite, hard, contains some very fine sand size tosilt size silica (subrounded) and much very fine sand tosilt size black phosphate grains; dolostone is black,microcrystalline, hard, contains silica as silt sizegrains {subrounded to angular) and fine sand size grains(subrounded). 10 90
Silt, light to dark green, dolomitic, sandy, phosphatic:pebbles. 11 101
Silt, as above, dark green, some dark gray shell fragments. 12 113 Silt, dark green, same as 90-101, less shell fragments andphosphate. 10 123
Silt, same as 90-101, sand fraction fine to coarse, lessphosphate, a few large shell fragments. 10 133
Sand and silt, green, sand is medium to coarse, silica; siltis dolomitic, much phosphate: sand to pebble sized, fewshell fragments. 12 145
Sand, tan to very light green, medium to coarse, very littlesilt, sand size phosphate. 10 155
Sand, as above, less coarse, more silt and shell fragments:white. 10 165
Sand, tan to light green, medium to coarse, small amount ofsilt: light green, dolomite, sand size phosphate. 11 176
Sand, green, very little silt, sand size phosphate. 10 186 Sand, tan to light green, slightly more silt, sand size
phosphate. 22 208
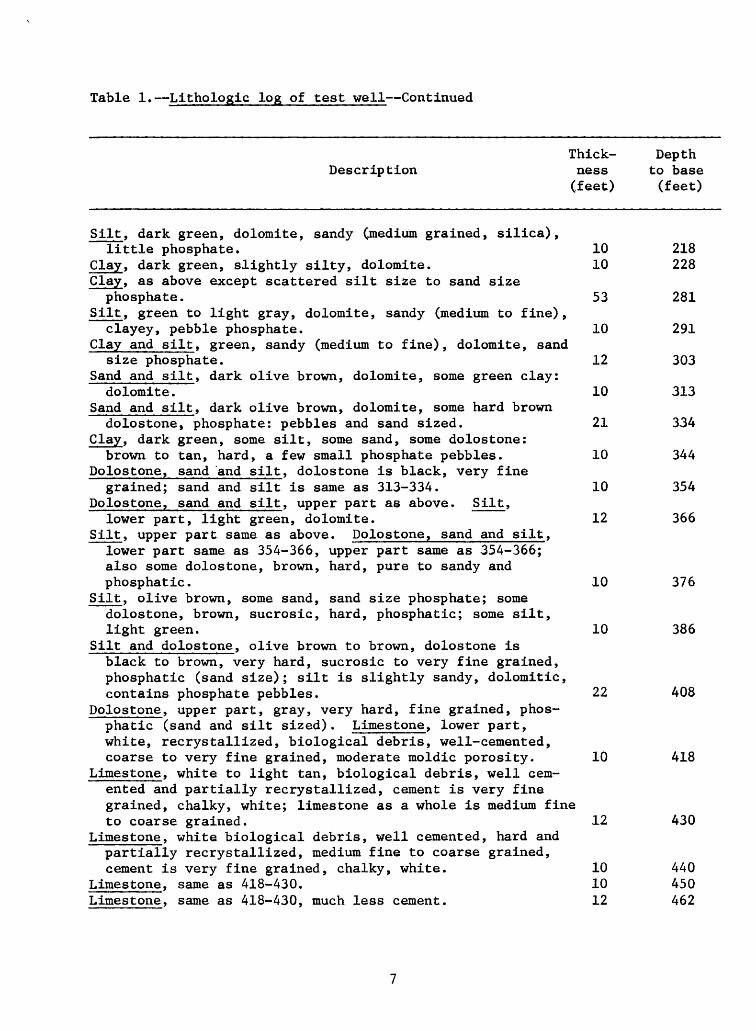
Table 1. Lithologic log of test well Continued
DescriptionThickness(feet)
Depthto base(feet)
Silt, dark green, dolomite, sandy (medium grained, silica),little phosphate. 10 218
Clay, dark green, slightly silty, dolomite. 10 228Clay, as above except scattered silt size to sand size
phosphate. 53 281Silt, green to light gray, dolomite, sandy (medium to fine),
clayey, pebble phosphate. 10 291Clay and silt, green, sandy (medium to fine), dolomite, sand
size phosphate. 12 303Sand and silt, dark olive brown, dolomite, some green clay:
dolomite. 10 313Sand and silt, dark olive brown, dolomite, some hard brown
dolostone, phosphate: pebbles and sand sized. 21 334Clay, dark green, some silt, some sand, some dolostone:
brown to tan, hard, a few small phosphate pebbles. 10 344Dolostone, sand and silt, dolostone is black, very fine
grained; sand and silt is same as 313-334. 10 354Dolostone, sand and silt, upper part as above. Silt,
lower part, light green, dolomite. 12 366Silt, upper part same as above. Dolostone, sand and silt,
lower part same as 354-366, upper part same as 354-366; also some dolostone, brown, hard, pure to sandy and phosphatic. 10 376
Silt, olive brown, some sand, sand size phosphate; some dolostone, brown, sucrosic, hard, phosphatic; some silt, light green. 10 386
Silt and dolostone, olive brown to brown, dolostone is black to brown, very hard, sucrosic to very fine grained, phosphatic (sand size); silt is slightly sandy, dolomitic, contains phosphate pebbles. 22 408
Dolostone, upper part, gray, very hard, fine grained, phos phatic (sand and silt sized). Limestone, lower part, white, recrystallized, biological debris, well-cemented, coarse to very fine grained, moderate moldic porosity. 10 418
Limestone, white to light tan, biological debris, well cem ented and partially recrystallized, cement is very fine grained, chalky, white; limestone as a whole is medium fine to coarse grained. 12 430
Limestone, white biological debris, well cemented, hard and partially recrystallized, medium fine to coarse grained, cement is very fine grained, chalky, white. 10 440
Limestone, same as 418-430. 10 450Limestone, same as 418-430, much less cement. 12 462
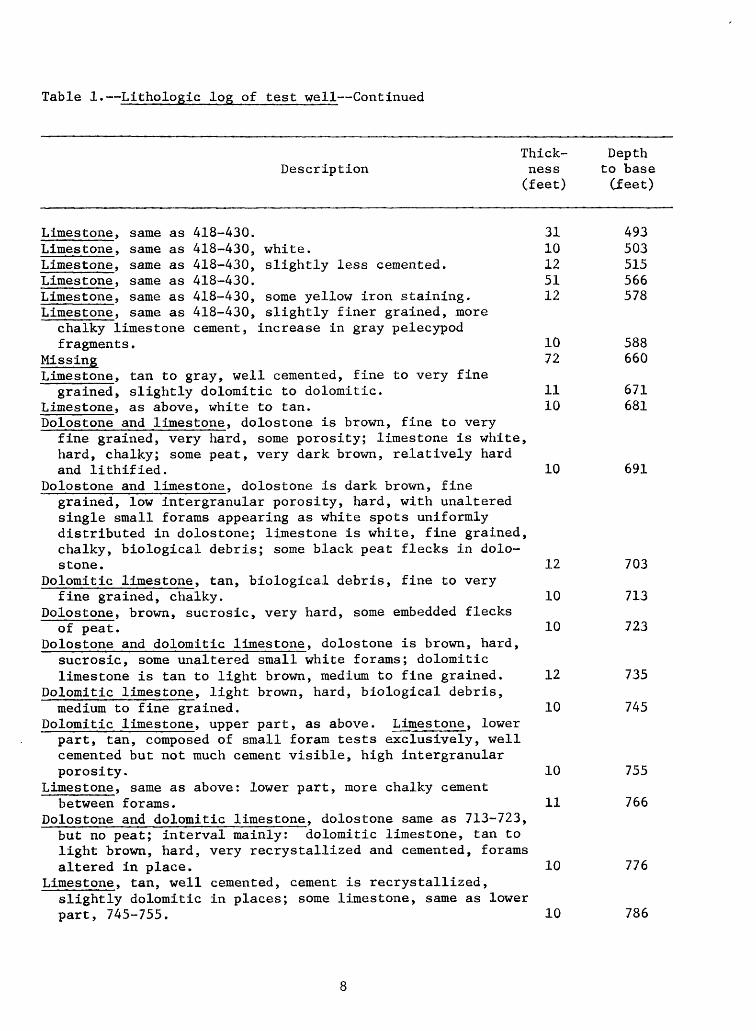
Table 1. Lithologic log of test well Continued
DescriptionThickness
(feet)
Depthto base
Cfeet)
Limestone, same as 418-430.Limestone, same as 418-430,Limestone, same as 418-430,Limestone, same as 418-430.Limestone, same as 418-430,Limestone, same as 418-430,
white.slightly less cemented.
some yellow iron staining._______ slightly finer grained, more
chalky limestone cement, increase in gray pelecypod fragments.
MissingLimestone, tan to gray, well cemented, fine to very fine
grained, slightly dolomitic to dolomitic.Limestone, as above, white to tan.Dolostone and limestone, dolostone is brown, fine to very
fine grained, very hard, some porosity; limestone is white, hard, chalky; some peat, very dark brown, relatively hard and lithified.
Dolostone and limestone, dolostone is dark brown, finegrained, low intergranular porosity, hard, with unaltered single small forams appearing as white spots uniformly distributed in dolostone; limestone is white, fine grained, chalky, biological debris; some black peat flecks in dolo stone.
Dolomitic limestone, tan, biological debris, fine to very fine grained, chalky.
Dolostone, brown, sucrosic, very hard, some embedded flecks of peat.
Dolostone and dolomitic limestone, dolostone is brown, hard, sucrosic, some unaltered small white forams; dolomitic limestone is tan to light brown, medium to fine grained.
Dolomitic limestone, light brown, hard, biological debris, medium to fine grained.
Dolomitic limestone, upper part, as above. Limestone, lower part, tan, composed of small foram tests exclusively, well cemented but not much cement visible, high intergranular porosity.
Limestone, same as above: lower part, more chalky cement between forams.
Dolostone and dolomitic limestone, dolostone same as 713-723, but no peat; interval mainly: dolomitic limestone, tan to light brown, hard, very recrystallized and cemented, forams altered in place.
Limestone, tan, well cemented, cement is recrystallized,slightly dolomitic in places; some limestone, same as lower part, 745-755.
3110125112
1072
1110
10
12
10
10
12
10
10
11
10
10
493503515566578
588660
671681
691
703
713
723
735
745
755
766
776
786
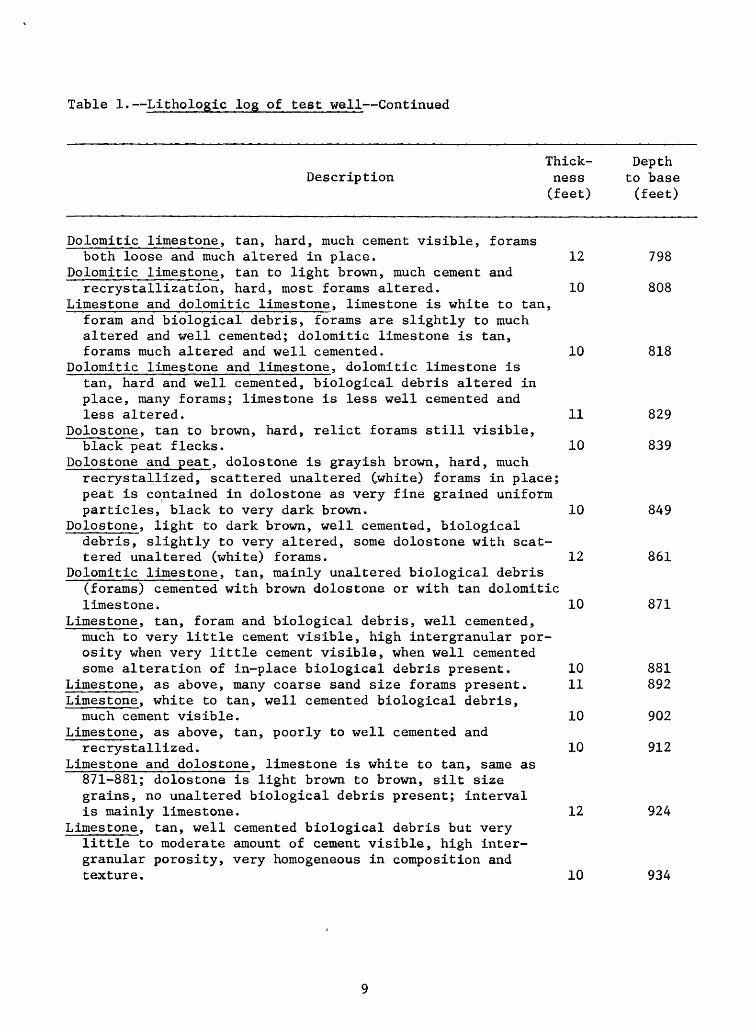
Table 1. Lithologic log of test well Continued
Thick- DepthDescription ness to base
(feet) (feet)
Dolomit ic 1 ime stone, tan, hard, much cement visible, foramsboth loose and much altered in place. 12 798
Dolomitic limestone, tan to light brown, much cement andrecrystallization, hard, most forams altered. 10 808
Limestone and dolomitic limestone, limestone is white to tan, foram and biological debris, forams are slightly to much altered and well cemented; dolomitic limestone is tan, forams much altered and well cemented. 10 818
Dolomitic limestone and limestone, dolomitic limestone is tan, hard and well cemented, biological debris altered in place, many forams; limestone is less well cemented and less altered. 11 829
Dolostone, tan to brown, hard, relict forams still visible,black peat flecks. 10 839
Dolostone and peat, dolostone is grayish brown, hard, much recrystallized, scattered unaltered (.white) forams in place; peat is contained in dolostone as very fine grained uniform particles, black to very dark brown. 10 849
Dolostone, light to dark brown, well cemented, biological debris, slightly to very altered, some dolostone with scat tered unaltered (white) forams. 12 861
Dolomitic limestone, tan, mainly unaltered biological debris (forams) cemented with brown dolostone or with tan dolomitic limestone. 10 871
Limestone, tan, foram and biological debris, well cemented, much to very little cement visible, high intergranular por osity when very little cement visible, when well cemented some alteration of in-place biological debris present. 10 881
Limestone, as above, many coarse sand size forams present. 11 892Limestone, white to tan, well cemented biological debris,much cement visible. 10 902
Limestone, as above, tan, poorly to well cemented andrecrystallized. 10 912
Limestone and dolostone, limestone is white to tan, same as 871-881; dolostone is light brown to brown, silt size grains, no unaltered biological debris present; interval is mainly limestone. 12 924
Limestone, tan, well cemented biological debris but very little to moderate amount of cement visible, high inter- granular porosity, very homogeneous in composition and texture. 10 934
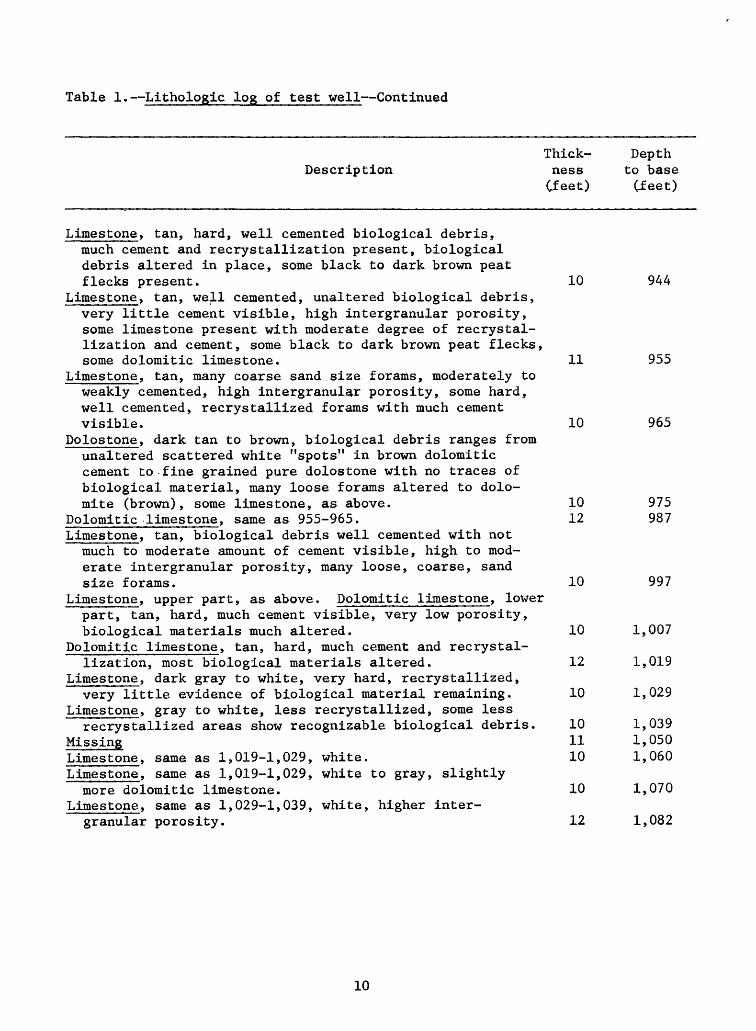
Table 1. Lithologic log of test veil Continued
DescriptionThickness
Cfeet)
Depthto base
Cfeet)
Limestone, tan, hard, well cemented biological debris, much cement and recrystallization present, biological debris altered in place, some black to dark brown peat flecks present. 10 944
Limestone, tan, well cemented, unaltered biological debris, very little cement visible, high intergranular porosity, some limestone present with moderate degree of recrystal lization and cement, some black to dark brown peat flecks, some dolomitic limestone. 11 955
Limestone, tan, many coarse sand size forams, moderately to weakly cemented, high intergranular porosity, some hard, well cemented, recrystallized forams with much cement visible. 10 965
Dolostone, dark tan to brown, biological debris ranges from unaltered scattered white "spots" in brown dolomitic cement to fine grained pure dolostone with no traces of biological material, many loose forams altered to dolo mite (brown), some limestone, as above. 10 975
Dolomitic limestone, same as 955-965. 12 987Limestone, tan, biological debris well cemented with not
much to moderate amount of cement visible, high to mod erate intergranular porosity, many loose, coarse, sand size forams. 10 997
Limestone, upper part, as above. Dolomitic limestone, lower part, tan, hard, much cement visible, very low porosity, biological materials much altered. 10 1,007
Dolomit ic 1imestone, tan, hard, much cement and recrystal lization, most biological materials altered. 12 1,019
Limestone, dark gray to white, very hard, recrystallized,very little evidence of biological material remaining. 10 1,029
Limestone, gray to white, less recrystallized, some lessrecrystallized areas show recognizable biological debris. 10 1,039
Missing 11 1,050Limestone, same as 1,019-1,029, white. 10 1,060Limestone, same as 1,019-1,029, white to gray, slightlymore dolomitic limestone. 10 1,070
Limestone, same as 1,029-1,039, white, higher inter granular porosity. 12 1,082
10
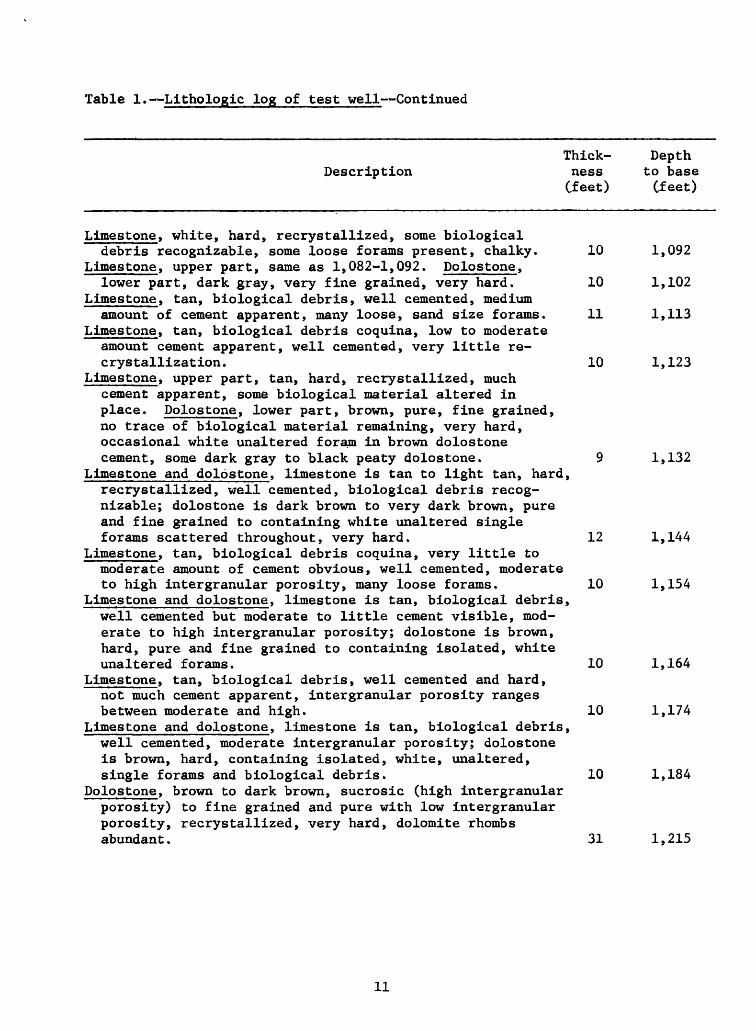
Table 1. Lithologic log of test well Continued
DescriptionThickness
(.feet)
Depthto base
Cfeet)
Limestone, white, hard, recrystallized, some biologicaldebris recognizable, some loose forams present, chalky. 10 1,092
Limestone, upper part, same as 1,082-1,092. Dolostone,lower part, dark gray, very fine grained, very hard. 10 1,102
Limestone, tan, biological debris, well cemented, mediumamount of cement apparent, many loose, sand size forams. 11 1,113
Limestone, tan, biological debris coquina, low to moderate amount cement apparent, well cemented, very little re- crystallization. 10 1,123
Limestone, upper part, tan, hard, recrystallized, much cement apparent, some biological material altered in place. Dolostone, lower part, brown, pure, fine grained, no trace of biological material remaining, very hard, occasional white unaltered foram in brown dolostone cement, some dark gray to black peaty dolostone. 9 1,132
Limestone and dolostone, limestone is tan to light tan, hard, recrystallized, well cemented, biological debris recog nizable; dolostone is dark brown to very dark brown, pure and fine grained to containing white unaltered single forams scattered throughout, very hard. 12 1,144
Limestone, tan, biological debris coquina, very little to moderate amount of cement obvious, well cemented, moderate to high intergranular porosity, many loose forams. 10 1,154
Limestone and dolostone, limestone is tan, biological debris, well cemented but moderate to little cement visible, mod erate to high intergranular porosity; dolostone is brown, hard, pure and fine grained to containing isolated, white unaltered forams. 10 1,164
Limestone, tan, biological debris, well cemented and hard, not much cement apparent, intergranular porosity ranges between moderate and high. 10 1,174
Limestone and dolostone, limestone is tan, biological debris, well cemented, moderate intergranular porosity; dolostone is brown, hard, containing isolated, white, unaltered, single forams and biological debris. 10 1,184
Dolostone, brown to dark brown, sucrosic (high intergranular porosity) to fine grained and pure with low intergranular porosity, recrystallized, very hard, dolomite rhombs abundant. 311,215
11
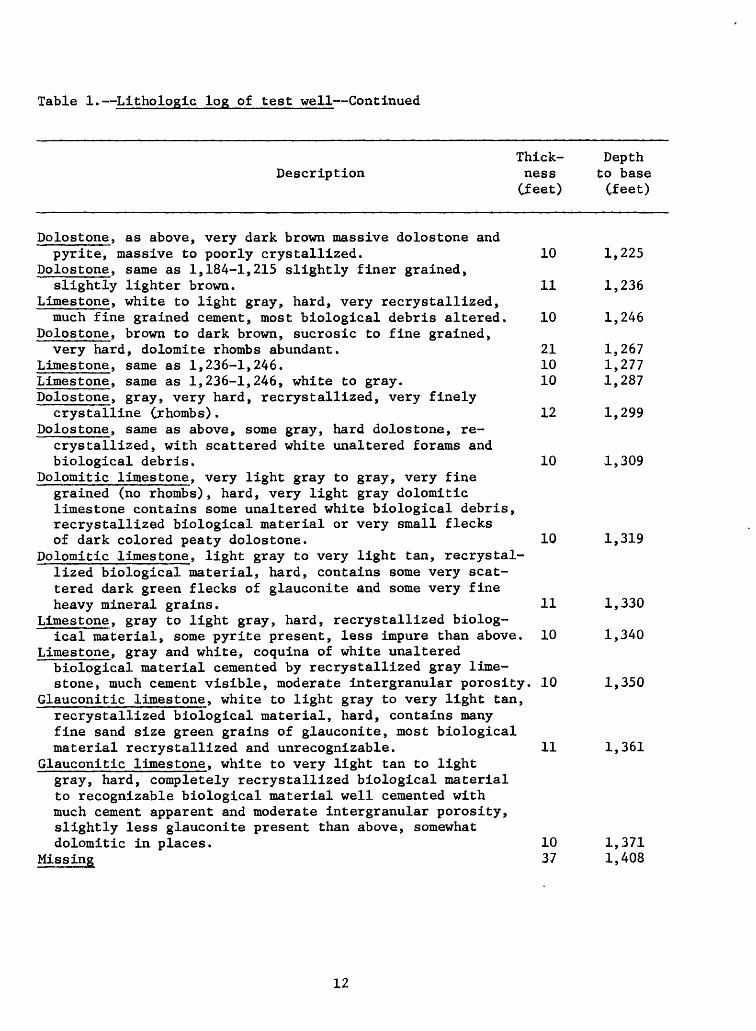
Table 1. Lithologic log of test well Continued
Thick- DepthDescription ness to base
Cfeet) Cfeet)
Dolostone, as above, very dark brown massive dolostone andpyrite, massive to poorly crystallized. 10 1,225
Dolostone, same as 1,184-1,215 slightly finer grained,slightly lighter brown. 11 1,236
Limestone, white to light gray, hard, very recrystallized,much fine grained cement, most biological debris altered. 10 1,246
Dolostone, brown to dark brown, sucrosic to fine grained,very hard, dolomite rhombs abundant. 21 1,267
Limestone, same as 1,236-1,246. 10 1,277Limestone, same as 1,236-1,246, white to gray. 10 1,287Dolostone, gray, very hard, recrystallized, very finely
crystalline (ihombs). 12 1,299Dolostone, same as above, some gray, hard dolostone, re-
crystallized, with scattered white unaltered forams and biological debris. 10 1,309
Dolomitic limestone, very light gray to gray, very fine grained (no rhombs), hard, very light gray dolomitie limestone contains some unaltered white biological debris, recrystallized biological material or very small flecks of dark colored peaty dolostone. 10 1,319
Dolomitic limestone, light gray to very light tan, recrystal lized biological material, hard, contains some very scat tered dark green flecks of glauconite and some very fine heavy mineral grains. 11 1,330
Limestone, gray to light gray, hard, recrystallized biolog ical material, some pyrite present, less impure than above. 10 1,340
Limestone, gray and white, coquina of white unalteredbiological material cemented by recrystallized gray lime stone, much cement visible, moderate intergranular porosity. 10 1,350
Glauconitic limestone, white to light gray to very light tan, recrystallized biological material, hard, contains many fine sand size green grains of glauconite, most biological material recrystallized and unrecognizable. 11 1,361
Glauconitic limestone, white to very light tan to light gray, hard, completely recrystallized biological material to recognizable biological material well cemented with much cement apparent and moderate intergranular porosity, slightly less glauconite present than above, somewhat dolomitie in places. 10 1,371
Missing 37 1,408
12
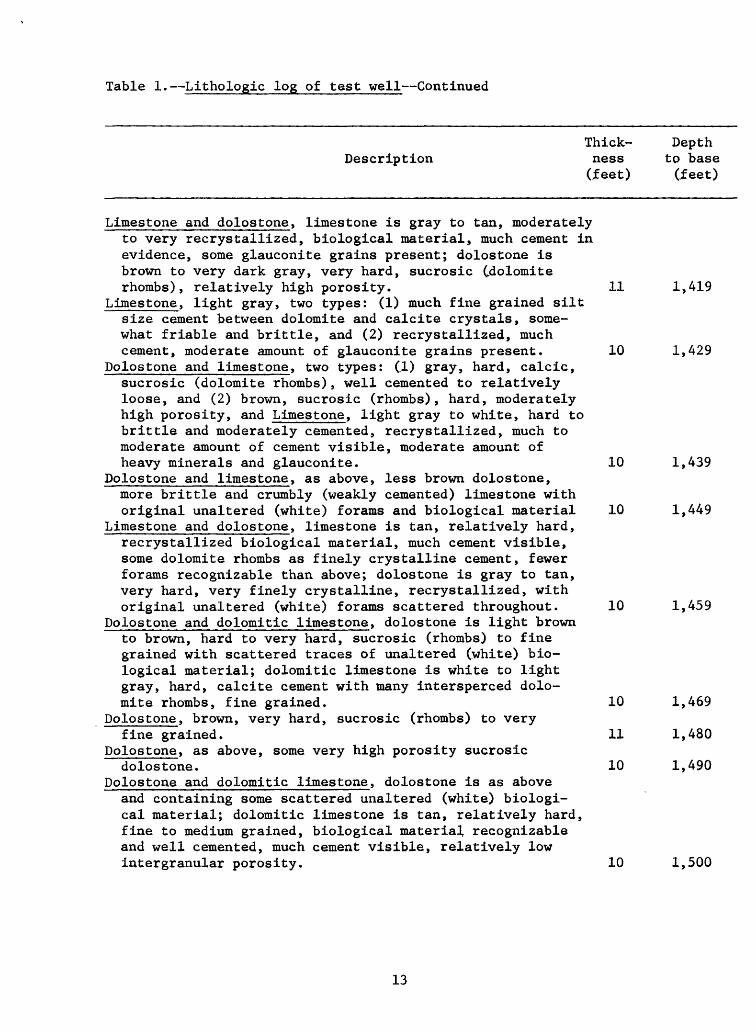
Table 1. Lithologic log of test well Continued
Thick- DepthDescription ness to base
(feet) (feet)
Limestone and dolostone, limestone is gray to tan, moderately to very recrystallized, biological material, much cement in evidence, some glauconite grains present; dolostone is brown to very dark gray, very hard, sucrosic Cdolomite rhombs), relatively high porosity. 11 1,419
Limestone, light gray, two types: (1) much fine grained silt size cement between dolomite and calcite crystals, some what friable and brittle, and (2) recrystallized, much cement, moderate amount of glauconite grains present. 10 1,429
Dolostone and limestone, two types: (1) gray, hard, calcic, sucrosic (dolomite rhombs), well cemented to relatively loose, and (2) brown, sucrosic (rhombs), hard, moderately high porosity, and Limestone, light gray to white, hard to brittle and moderately cemented, recrystallized, much to moderate amount of cement visible, moderate amount of heavy minerals and glauconite. 10 1,439
Dolostone and limestone, as above, less brown dolostone, more brittle and crumbly (weakly cemented) limestone with original unaltered (white) forams and biological material 10 1,449
Limestone and dolostone, limestone is tan, relatively hard, recrystallized biological material, much cement visible, some dolomite rhombs as finely crystalline cement, fewer forams recognizable than above; dolostone is gray to tan, very hard, very finely crystalline, recrystallized, with original unaltered (white) forams scattered throughout. 10 1,459
Dolostone and dolomitic limestone, dolostone is light brown to brown, hard to very hard, sucrosic (rhombs) to fine grained with scattered traces of unaltered (white) bio logical material; dolomitic limestone is white to light gray, hard, calcite cement with many intersperced dolo mite rhombs, fine grained. 10 1,469
Dolostone, brown, very hard, sucrosic (rhombs) to veryfine grained. 11 1,480
Dolostone, as above, some very high porosity sucrosicdolostone. 10 1,490
Dolostone and dolomitic limestone, dolostone is as above and containing some scattered unaltered (white) biologi cal material; dolomitic limestone is tan, relatively hard, fine to medium grained, biological material recognizable and well cemented, much cement visible, relatively low intergranular porosity. 10 1,500
13
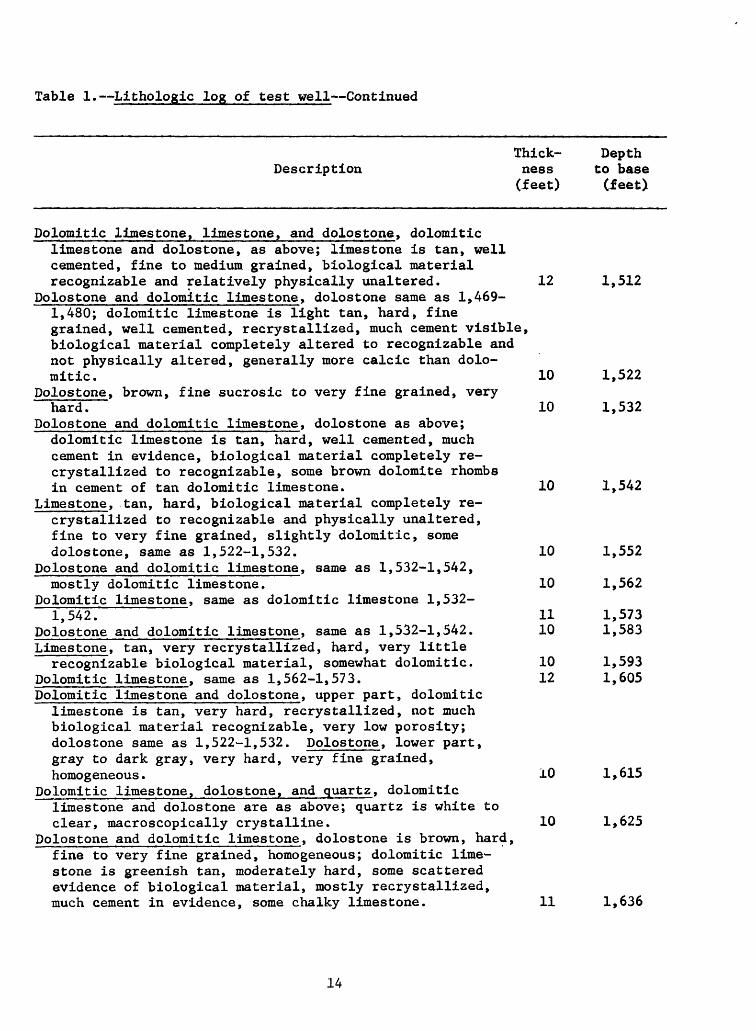
Table 1. Lithologic log of test well Continued
Thick- DepthDescription ness to base
Cfeet) Cfeet)
Dolomitic limestone, limestone, and dolostone, dolomitic limestone and dolostone, as above; limestone is tan, well cemented, fine to medium grained, biological material recognizable and relatively physically unaltered. 12 1,512
Dolostone and dolomitic limestone, dolostone same as 1,469- 1,480; dolomitic limestone is light tan, hard, fine grained, well cemented, recrystallized, much cement visible, biological material completely altered to recognizable and not physically altered, generally more calcic than dolo mitic. 10 1,522
Dolostone, brown, fine sucrosic to very fine grained, veryhard. 10 1,532
Dolostone and dolomitic limestone, dolostone as above; dolomitic limestone is tan, hard, well cemented, much cement in evidence, biological material completely re- crystallized to recognizable, some brown dolomite rhombs in cement of tan dolomitic limestone. 10 1,542
Limestone, tan, hard, biological material completely re- crystallized to recognizable and physically unaltered, fine to very fine grained, slightly dolomitic, some dolostone, same as 1,522-1,532. 10 1,552
Dolostone and dolomitic limestone, same as 1,532-1,542,mostly dolomitic limestone. 10 1,562
Dolomitic limestone, same as dolomitic limestone 1,532-1,542. 11 1,573
Dolostone and dolomitic limestone, same as 1,532-1,542. 10 1,583Limestone, tan, very recrystallized, hard, very little
recognizable biological material, somewhat dolomitic. 10 1,593Dolomitic limestone, same as 1,562-1,573. 12 1,605Dolomitic limestone and dolostone, upper part, dolomitic
limestone is tan, very hard, recrystallized, not much biological material recognizable, very low porosity; dolostone same as 1,522-1,532. Dolostone, lower part, gray to dark gray, very hard, very fine grained, homogeneous. 10 1,615
Dolomitic limestone, dolostone, and quartz, dolomiticlimestone and dolostone are as above; quartz is white toclear, macroscopically crystalline. 10 1,625
Dolostone and dolomitic limestone, dolostone is brown, hard, fine to very fine grained, homogeneous; dolomitic lime stone is greenish tan, moderately hard, some scattered evidence of biological material, mostly recrystallized, much cement in evidence, some chalky limestone. 11 1,636
14
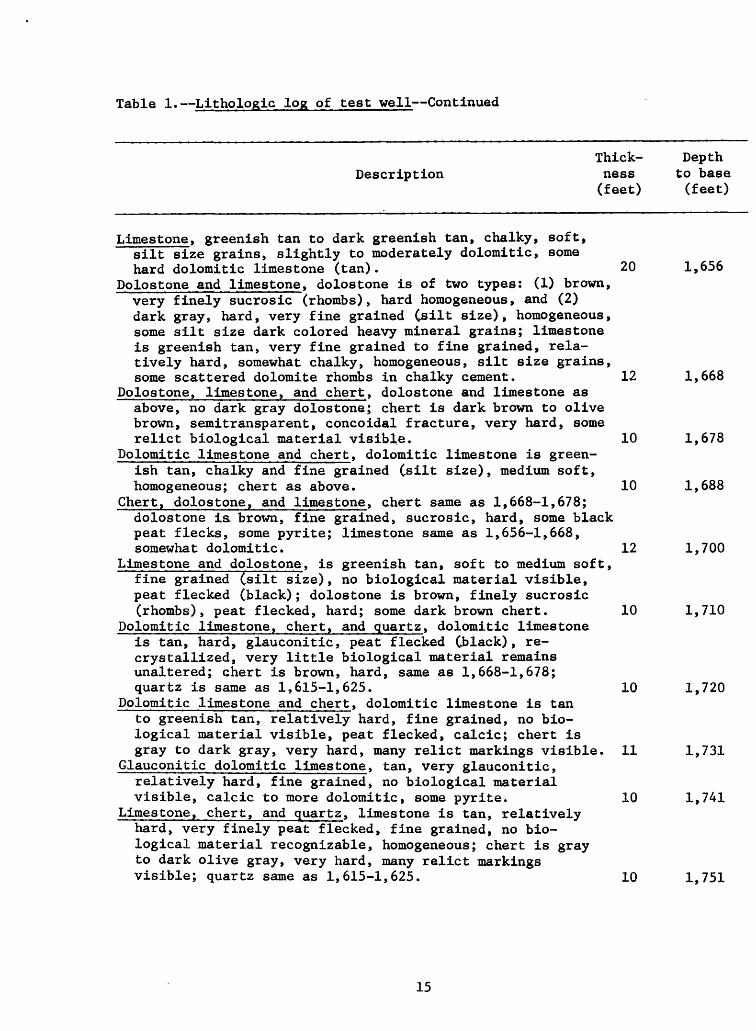
Table 1. Lithologic log of test well Continued
Thick- DepthDescription ness to base
(feet) (feet)
Limestone, greenish tan to dark greenish tan, chalky, soft, silt size grains, slightly to moderately dolomitic, some hard dolomitic limestone (tan). 20 1,656
Dolostone and limestone, dolostone is of two types: (1) brown, very finely sucrosic (rhombs), hard homogeneous, and (2) dark gray, hard, very fine grained (silt size), homogeneous, some silt size dark colored heavy mineral grains; limestone is greenish tan, very fine grained to fine grained, rela tively hard, somewhat chalky, homogeneous, silt size grains, some scattered dolomite rhombs in chalky cement. 12 1,668
Dolostone, limestone, and chert, dolostone and limestone as above, no dark gray dolostone; chert is dark brown to olive brown, semitransparent, concoidal fracture, very hard, some relict biological material visible. 10 1,678
Dolomitic limestone and chert, dolomitic limestone is green ish tan, chalky and fine grained (.silt size), medium soft, homogeneous; chert as above. 10 1,688
Chert, dolostone, and limestone, chert same as 1,668-1,678; dolostone is. brown, fine grained, sucrosic, hard, some black peat flecks, some pyrite; limestone same as 1,656-1,668, somewhat dolomitic. 12 1,700
Limestone and dolostone, is greenish tan, soft to medium soft, fine grained Csilt size), no biological material visible, peat flecked (black); dolostone is brown, finely sucrosic (rhombs), peat flecked, hard; some dark brown chert. 10 1,710
Dolomitic limestone, chert, and quartz, dolomitic limestone is tan, hard, glauconitic, peat flecked (black), re- crystallized, very little biological material remains unaltered; chert is brown, hard, same as 1,668-1,678; quartz is same as 1,615-1,625. 10 1,720
Dolomitic limestone and chert, dolomitic limestone is tan to greenish tan, relatively hard, fine grained, no bio logical material visible, peat flecked, calcic; chert is gray to dark gray, very hard, many relict markings visible. 11 1,731
Glauconitic dolomitic limestone, tan, very glauconitic, relatively hard, fine grained, no biological material visible, calcic to more dolomitic, some pyrite. 10 1,741
Limestone, chert, and quartz, limestone is tan, relatively hard, very finely peat flecked, fine grained, no bio logical material recognizable, homogeneous; chert is gray to dark olive gray, very hard, many relict markings visible; quartz same as 1,615-1,625. 10 1,751
15
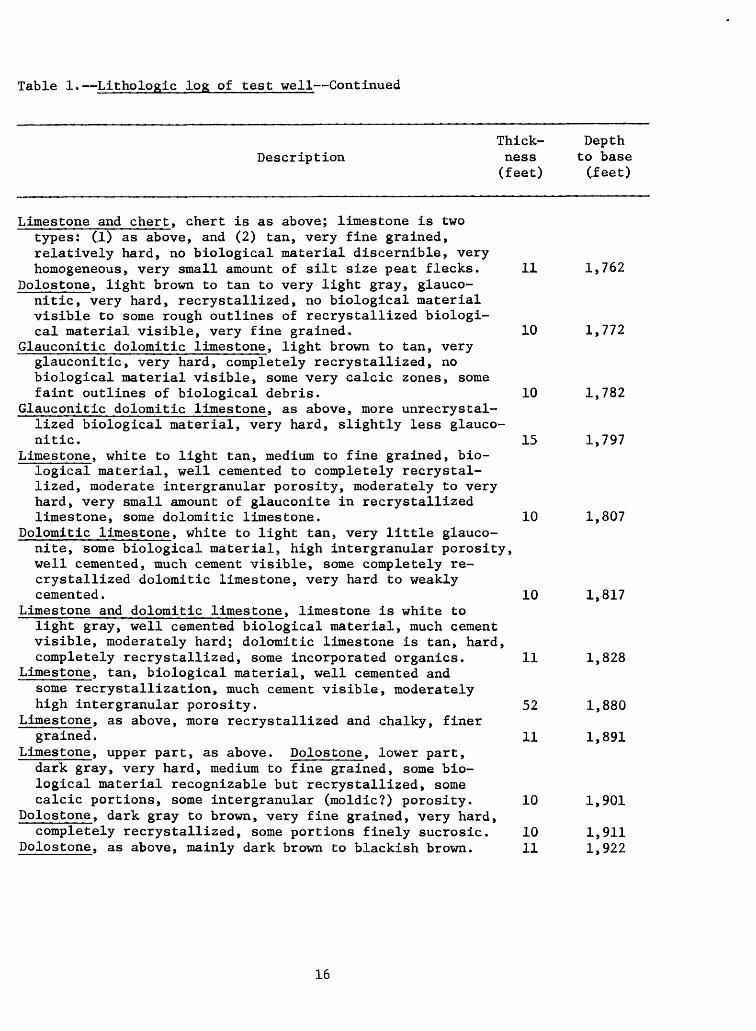
Table 1. Lithologic log of test well Continued
DescriptionThick ness (feet)
Depth to base Cfeet)
Limestone and chert, chert is as above; limestone is two types: (.1) as above, and (2) tan, very fine grained, relatively hard, no biological material discernible, very homogeneous, very small amount of silt size peat flecks. 11 1,762
Dolostone, light brown to tan to very light gray, glauco- nitic, very hard, recrystallized, no biological material visible to some rough outlines of recrystallized biologi cal material visible, very fine grained. 10 1,772
Glauconitic dolomitic limestone, light brown to tan, very glauconitic, very hard, completely recrystallized, no biological material visible, some very calcic zones, some faint outlines of biological debris. 10 1,782
Glauconitic dolomitic limestone, as above, more unrecrystal- lized biological material, very hard, slightly less glauco nitic. 15 1,797
Limestone, white to light tan, medium to fine grained, bio logical material, well cemented to completely recrystal lized, moderate intergranular porosity, moderately to very hard, very small amount of glauconite in recrystallized limestone, some dolomitic limestone. 10 1,807
Dolomitic limestone, white to light tan, very little glauco nite, some biological material, high intergranular porosity, well cemented, much cement visible, some completely re- crystallized dolomitic limestone, very hard to weakly cemented. 10 1,817
Limestone and dolomitic limestone, limestone is white to light gray, well cemented biological material, much cement visible, moderately hard; dolomitic limestone is tan, hard, completely recrystallized, some incorporated organics. 11 1,828
Limestone, tan, biological material, well cemented and some recrystallization, much cement visible, moderately high intergranular porosity. 52 1,880
Limestone, as above, more recrystallized and chalky, finergrained. 11 1,891
Limestone, upper part, as above. Dolostone, lower part, dark gray, very hard, medium to fine grained, some bio logical material recognizable but recrystallized, some calcic portions, some intergranular (moldic?) porosity. 10 1,901
Dolostone, dark gray to brown, very fine grained, very hard,completely recrystallized, some portions finely sucrosic. 10 1,911
Dolostone, as above, mainly dark brown to blackish brown. 11 1,922
16
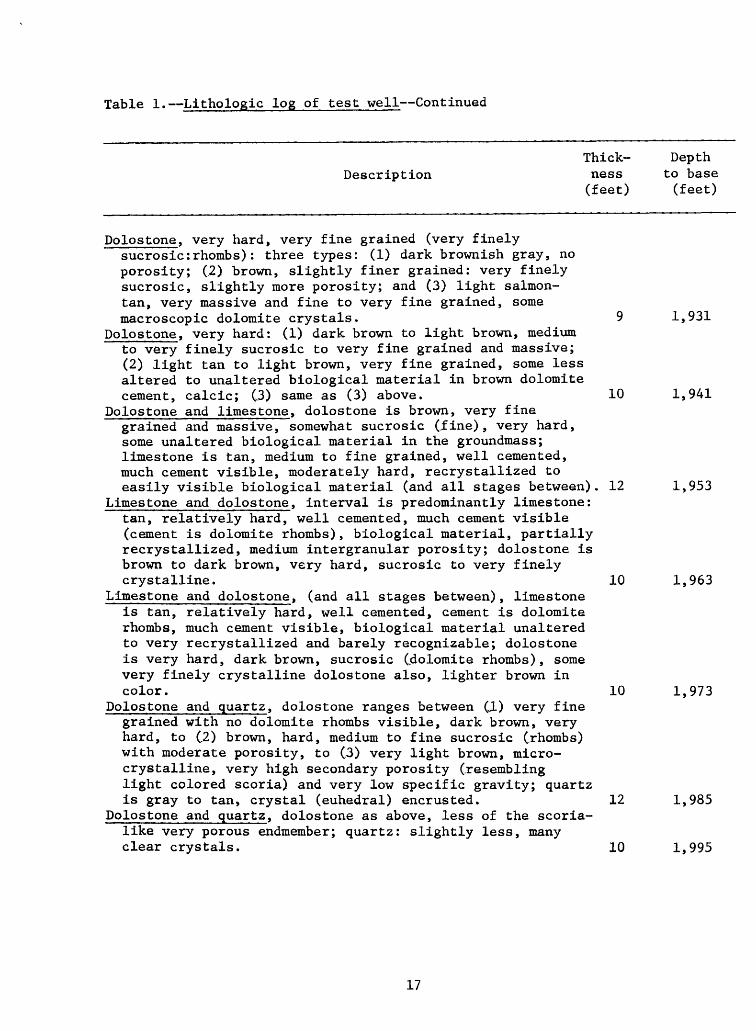
Table 1. Lithologic log of test well Continued
DescriptionThickness(feet)
Depthto base(feet)
Polostone, very hard, very fine grained (very finelysucrosic:rhombs): three types: (1) dark brownish gray, no porosity; (2) brown, slightly finer grained: very finely sucrosic, slightly more porosity; and (3) light salmon- tan, very massive and fine to very fine grained, some macroscopic dolomite crystals. 9 1,931
Dolostone, very hard: (1) dark brown to light brown, medium to very finely sucrosic to very fine grained and massive; (2) light tan to light brown, very fine grained, some less altered to unaltered biological material in brown dolomite cement, calcic; (3) same as (3) above. 10 1,941
Dolostone and limestone, dolostone is brown, very finegrained and massive, somewhat sucrosic (jfine), very hard,some unaltered biological material in the groundmass;limestone is tan, medium to fine grained, well cemented,much cement visible, moderately hard, recrystallized toeasily visible biological material (and all stages between). 12 1,953
Limestone and dolostone, interval is predominantly limestone: tan, relatively hard, well cemented, much cement visible (cement is dolomite rhombs), biological material, partially recrystallized, medium intergranular porosity; dolostone is brown to dark brown, very hard, sucrosic to very finely crystalline. 10 1,963
Limestone and dolostone, (and all stages between), limestone is tan, relatively hard, well cemented, cement is dolomite rhombs, much cement visible, biological material unaltered to very recrystallized and barely recognizable; dolostone is very hard, dark brown, sucrosic (.dolomite rhombs), some very finely crystalline dolostone also, lighter brown in color. 10 1,973
Dolostone and quartz, dolostone ranges between (J.) very fine grained with no dolomite rhombs visible, dark brown, very hard, to (.2) brown, hard, medium to fine sucrosic (rhombs) with moderate porosity, to (3) very light brown, micro- crystalline, very high secondary porosity (.resembling light colored scoria) and very low specific gravity; quartz is gray to tan, crystal (euhedral) encrusted. 12 1,985
Dolostone and quartz, dolostone as above, less of the scoria- like very porous endmember; quartz: slightly less, many clear crystals. 10 1,995
17
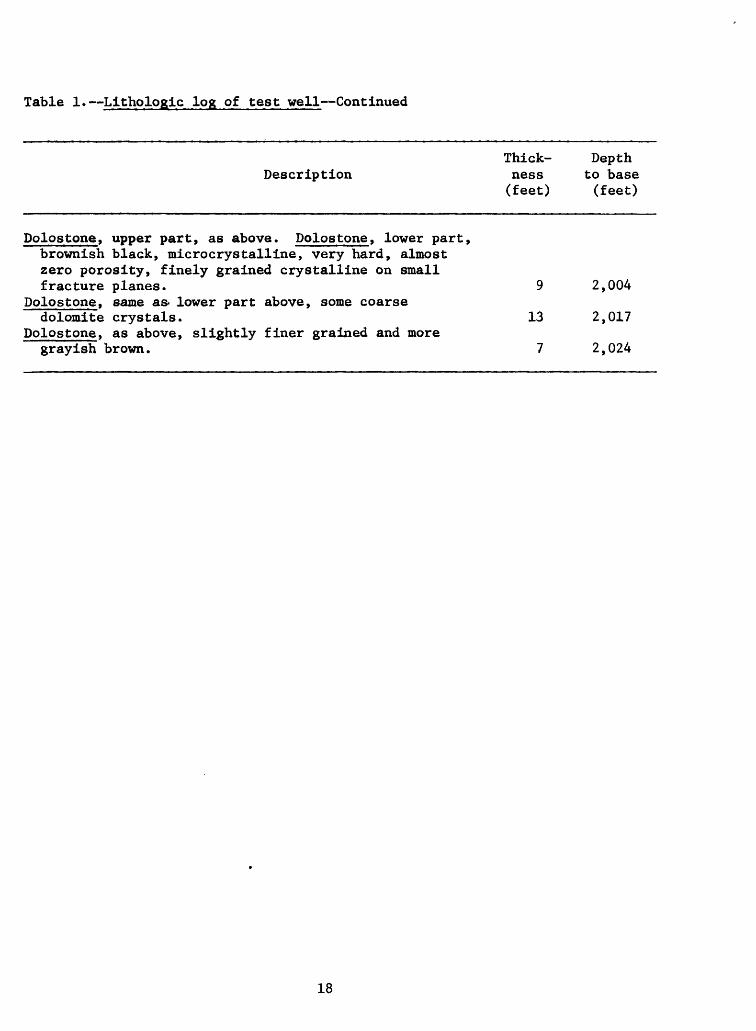
Table 1. Lithologic log of test well Continued
Thick- DepthDescription ness to base
(feet) (feet)
Polostone, upper part, as above. Polostone, lower part,brownish black, microcrystalline, very hard, almostzero porosity, finely grained crystalline on smallfracture planes. 9 2,004
Polostone, same as* lower part above, some coarsedolomite crystals. 13 2,017
Polostone, as above, slightly finer grained and moregrayish brown. 7 2,024
18
SEA LEVEL -
200-
400
600
HI>HI-1<LLJ
HI CD
H 111 HI LL
Q.LLJ 0
800
1000
1200
1400
1600
1800
2000
* * . * . ~i t \ t/i i
/nili , \ , t
A -i-f . *.CZJ-
/ / / / /
»~T±~_L
I I 1'/ ) )
i . i jf t / /
i i/. /. i.
i . ii . ir ir. i ~r-++
T , f, I . II . Ir^r^
/ /'.c ic
c i
/C 1C Q
sr^F^
i . T rTTl
/ / / / / ./ ( '^
/ / /
EXPLANATION
7^ SAND
I--""-I CLAY
hrh-H LIMESTONE
DOLOSTONE
11 'i '/I DOLOMITIC LIMESTONE
CHERT (C) - QUARTZ (Q)
Figure 3. Lithologic columnar section at test well.
19
500 500 L
-i ! -4-
SP
64
16
REBASED
1500
~r-*-iw
u o<
I(0o
oUJffi
UJ UJu.
XI-CL UJ O
1000
1500
si t JT[] I : .
fcrt-h t'iS
X!
RI- ;rfn
2000
0 500 OHM-m2/m
2000
1 1 I1 10 100 1000
OHM-mVm
Figure 4. Electric log; long and short normal resistivity, and spontaneous potential.
Figure 5. Electric log (focused resistivity).
20
oc wQ
I- Q. UJO
COUNTS PER SECOND
O^41O FT
O 500
GAMMA RAY
CALIPER
500
1000
500
I-O. UJO
"tl
1000
lit
1500 1500
2000 2000
0 100 COUNTS PER SECOND,410-2020 FT
410 203040 DIAMETER IN INCHES
I I I I 0 500 1000 1500
COUNTS PER SECOND
Figure 6. Caliper and natural gamma logs.
Figure 7. Neutron porosity log,
21
OQ C n (D
00
'l O OQ (X § 0)
11 5 o
DE
PT
H,
IN F
EE
T B
EL
OW
LA
ND
SU
RF
AC
E
to
to
O
OQ OQ (D
VO
DE
PT
H,
IN F
EE
T B
EL
OW
LA
ND
SU
RF
AC
E
H«
0) n H-
<
H-
rt
o-
O
00
500
UJ O
SiocCO
OUJmUJ UJu.
0.UJO
1000
isoo H
2000
1500
2000 | - | ]
240 140 40
MICROSECONDS PER FOOT
DEGREES CELSIUS
Figure 10. Temperature log, Figure 11. Acoustic velocity log,
23
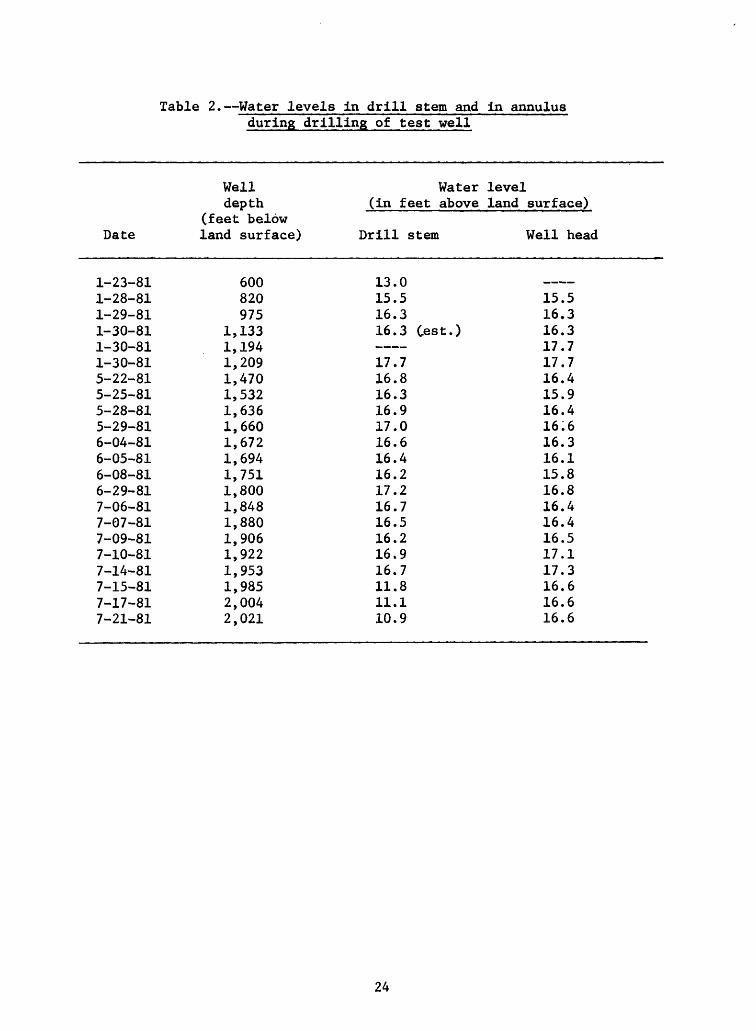
Table 2. Water levels in drill stem and in annulus during drilling of test well
Well depth
Water level (in feet above land surface)
Date
1-23-811-28-811-29-811-30-811-30-811-30-815-22-815-25-815-28-815-29-816-04-816-05-816-08-816-29-817-06-817-07-817-09-817-10-817-14-817-15-817-17-817-21-81
(.feet below land surface)
600820975
1,1331,1941,2091,4701,5321,6361,6601,6721,6941,7511,8001,8481,8801,9061,9221,9531,9852,0042,021
Drill stem
13.015.516.316.3 Cest.) 17.716.816.316.917.016.616.416.217.216.716.516.216.916.711.811.110.9
Well head
_ ,_^~^_,
15.516.316.317.717.716.415.916.416.616.316.115.816.816.416.416.517.117.316.616.616.6
24
400
600
800iuo< u. flC
o <
1000
1200iuCD
IU IU U.
1400
Q. IU0 1600-I
UJ
1800
2000
T TI 1 I I I
O ANNULUS DRILL STEM0 EQUAL WATER-LEVEL MEASUREMENT
10 12 14 16 18 20 22
WATER LEVEL, IN FEET ABOVE LAND SURFACE
Figure 12. Water levels in drill stem and in annulus duringdrilling of test well.
24
25
fO
ON
zaU
J O ffl h- K 0
20
z i
t
> g
-« 3
15
QC UJ I- ^
m
II II II
I
CO
NT
IGU
OU
S M
EA
SU
RE
ME
NT
_
_
0
P
ER
IOD
IC M
EA
SU
RE
ME
NT
-
....
..-
. -
^-D
AIL
Y M
AX
IMU
M
G--
GE
)-G
"-'
. ...
-
~
: \
..-.. ^^^.-
'* 4
r'«
- :
^ ^
" ^
- ^
.-.-..
°'
" '
~" ti
*"\
...
\
^ D
AIL
Y M
INIM
UM
II
II II
I
JAN
FE
BM
AR
AP
RM
AY
JUN
EJU
LY
1982
AU
G
Fig
ure
1
3.
Wate
r le
vel
in te
st w
ell
, o
pen
-ho
le in
terv
al
1,8
92
to
2
,02
6
feet
belo
w la
nd su
rface,
Jan
uar
y
to A
ugus
t 19
82.
19.3
NJ
-s
j
III o 2 C
0)
19
.0
o ffi s e 2 UJ CC
UJ
18.5
18.0
1 I
I I
I I
I I
I I
I I
I I
I I
I I
I I
1 I
I I
I I
I I
I I
I I
I I
I I
I I
T
P
RE
DIC
TED
TD
E H
EIG
HT
(NA
TIO
NA
L O
CE
AN
IC A
ND
AT
MO
SP
HE
RIC
AD
MIN
IST
RA
TIO
N,
1981)
0
WA
TER
LE
VE
L
12
0 _l_l
l
I I
I i
l I
l
- 5
- 3
- 2
O ill I-
1
O
UJ x0
UJ o
I I
I I
I I
I I
I I
I I
I I
I I
I I
I I
I I
1 I
I I
612
612
612
8-1
-82
EA
STE
RN
DA
YLI
GH
T S
AV
MG
TIM
E8-2-82
Figure 14. Water level
in the
test
well an
d predicted
tides
at
Mayp
ort,
Fl
orid
a, Au
gust
1
and
2, 19
82.
Water-level data presented in this section have not been adjusted for density differences between freshwater and the mineralized water found in the monitored zone.
The water level or static head measured in the annulus or drill stem is the sum of the elevation head and the pressure head (Lohman and others, 1972). The pressure head depends on fluid density; thus, water level measurements for wells containing salty water can be adjusted to equivalent freshwater heads in order to compare with the head in wells containing freshwater. Adjustments are made as described in Cooper and others, 1964, p. C28:
Where 1. « equivalent length of freshwater column; p « density of saltwater column; p- « density of freshwater;1 « measured length of saltwater column. s
For example, if a water-level measurement made in a well containing salty water having a salinity of about 7,100 mg/L (a density of 1.0046 gm/cm^) indicates a pressure head of about 15 feet above the top of the well casing,and the casing length is 1,892 feet, then 1 - 1,907 feet ands
lf - * 1,907 feet - 1,916 feet
Therefore, the equivalent freshwater level would be 1,916 feet above the base of the casing or 24 feet above the top of the casing, a difference in water level of 9 feet.
Artesian Flow
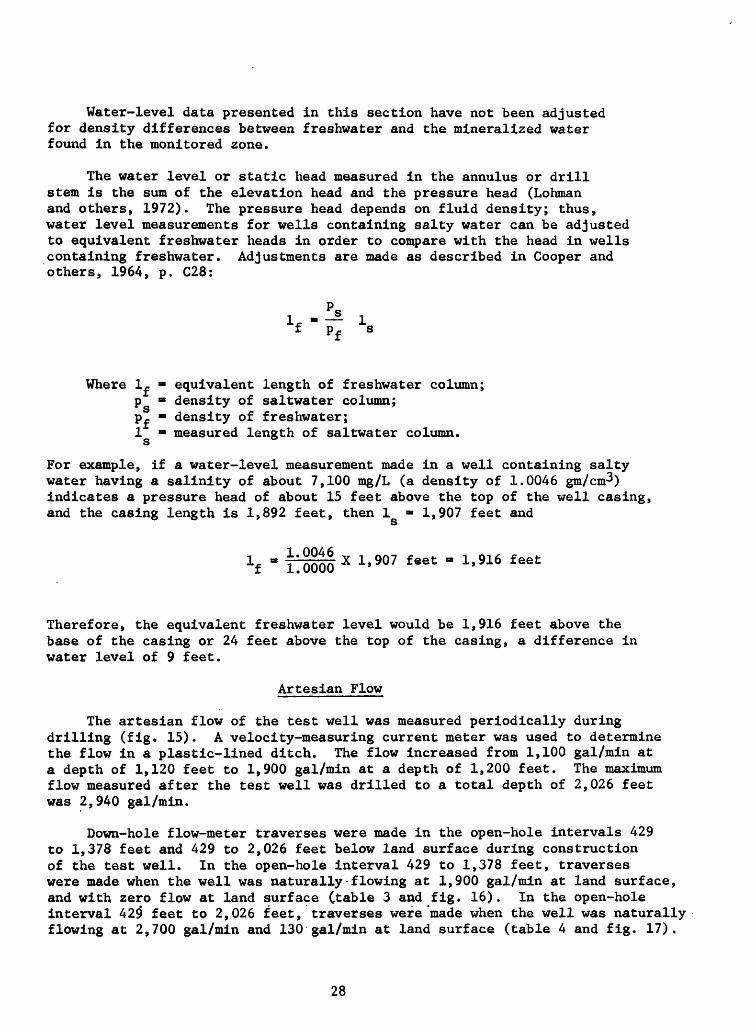
The artesian flow of the test well was measured periodically during drilling (fig. 15). A velocity-measuring current meter was used to determine the flow in a plastic-lined ditch. The flow increased from 1,100 gal/min at a depth of 1,120 feet to 1,900 gal/min at a depth of 1,200 feet. The maximum flow measured after the test well was drilled to a total depth of 2,026 feet was 2,940 gal/min.
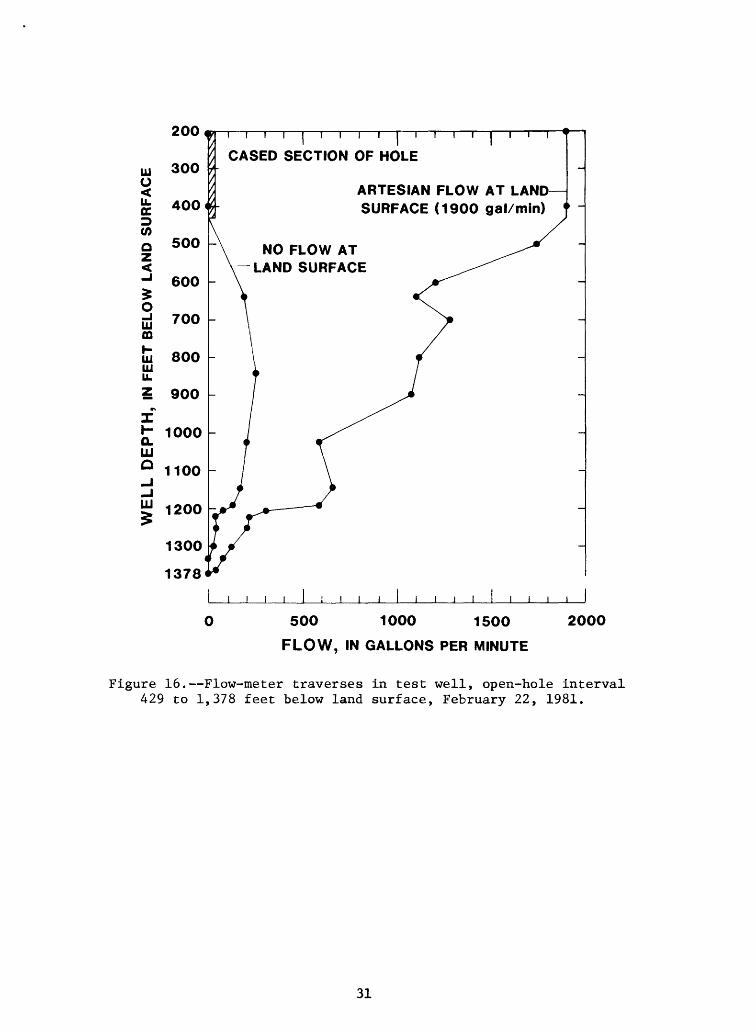
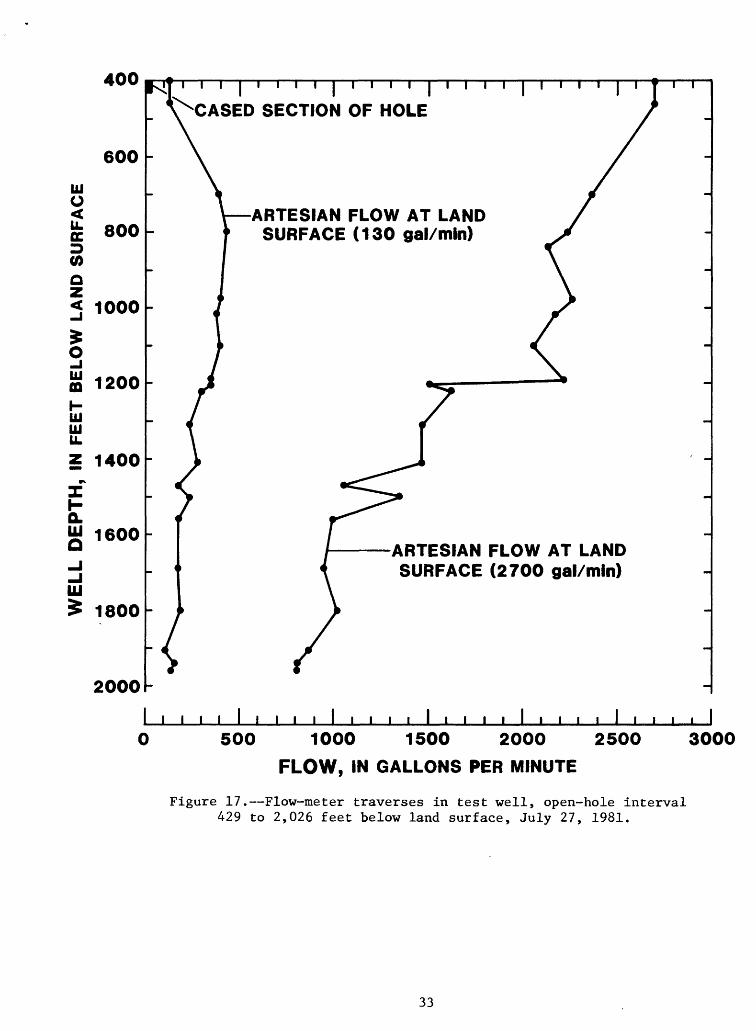
Down-hole flow-meter traverses were made in the open-hole intervals 429 to 1,378 feet and 429 to 2,026 feet below land surface during construction of the test well. In the open-hole interval 429 to 1,378 feet, traverses were made when the well was naturally flowing at 1,900 gal/min at land surface, and with zero flow at land surface (.table 3 and fig. 16). In the open-hole interval 429 feet to 2,026 feet, traverses were made when the well was naturally flowing at 2,700 gal/min and 130 gal/min at land surface (table 4 and fig. 17).
28
400
600
u O<LLoc
800
o< 1000
ouCD
u uLL
Q. 111 O
1200
1400
1600
1800
2000
1000 2000 FLOW, IN GALLONS PER MINUTE
Figure 15. Artesian flow of test well during drilling
3000
29
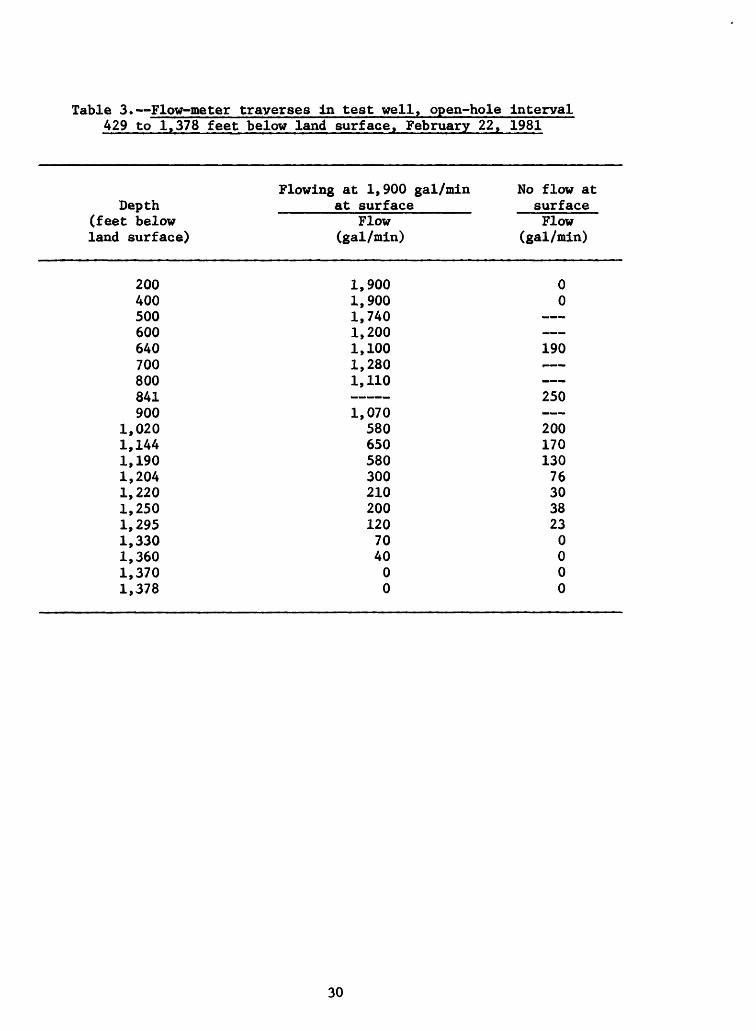
Table 3. Flow-meter traverses in test well, open-hole interval 429 to 1.378 feet below land surface, February 22, 1981
Flowing at 1,900 gal/min No flow atDepth _____at surface_____ surface
(feet below Flow Flowland surface) (gal/min) (gal/min)
200 1,900 0400 1,900 0500 1,740600 1,200640 1,100 190700 1,280800 1,110841 250900 1,070
1,020 580 2001,144 650 1701,190 580 1301,204 300 761,220 210 301,250 200 381,295 120 231,330 70 01,360 40 01,370 0 01,378 0 0
30
HIO
200
300
400
1 i i i i i i i i
CASED SECTION OF HOLE
ARTESIAN FLOW AT LAND- SURFACE (1900 gal/min)
NO FLOW AT LAND SURFACE
I _L I I I I
500 1000 1500
FLOW, IN GALLONS PER MINUTE
2000
Figure 16. Flow-meter traverses in test well, open-hole interval 429 to 1,378 feet below land surface, February 22, 1981.
31
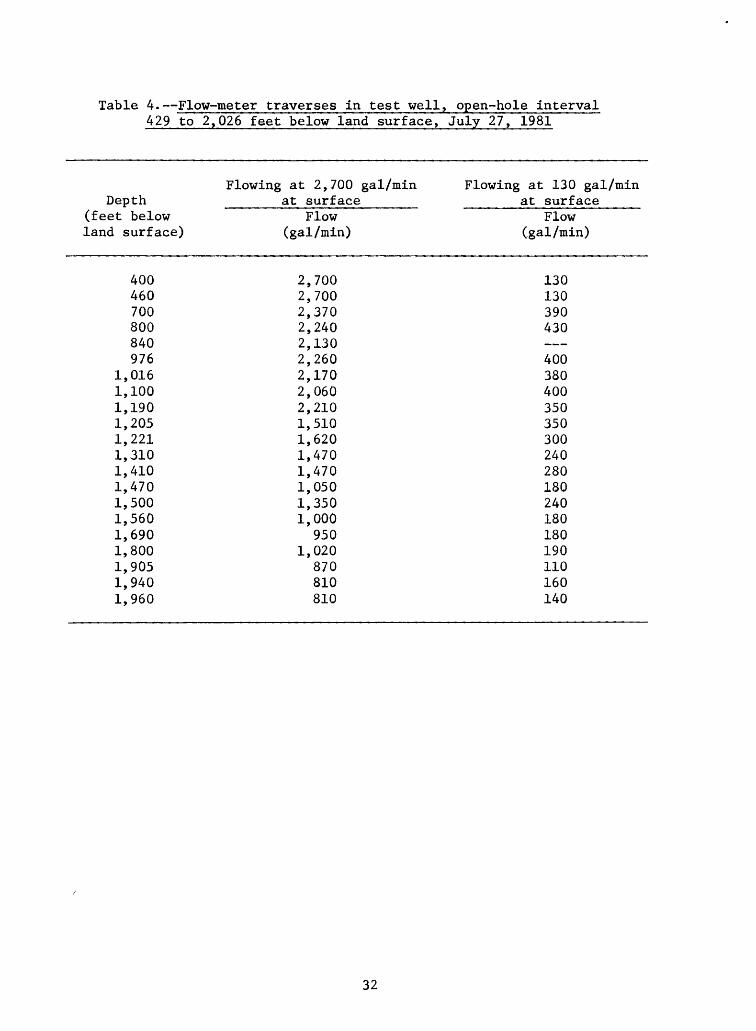
Table 4. Flow-meter traverses in test well, open-hole interval429 to 2,026 feet below land surface, July 27, 1981
Depth(feet belowland surface)
400460700800840976
1,0161,1001,1901,2051,2211,3101,4101,4701,5001,5601,6901,8001,9051,9401,960
Flowing at 2,700 gal/minat surface
Flow(gal/min)
2,7002,7002,3702,2402,1302,2602,1702,0602,2101,5101,6201,4701,4701,0501,3501,000
9501,020
870810810
Flowing at 130 gal/minat surface
Flow(gal/min)
130130390430 400380400350350300240280180240180180190110160140
32
400
CASED SECTION OF HOLE
2000
ARTESIAN FLOW AT LAND SURFACE (130 gal/min)
I
ARTESIAN FLOW AT LAND SURFACE (2700 gal/min)
i i I I
500 1000 1500 2000 2500
FLOW, IN GALLONS PER MINUTE
3000
Figure 17. Flow-meter traverses in test well, open-hole interval 429 to 2,026 feet below land surface, July 27, 1981.
33
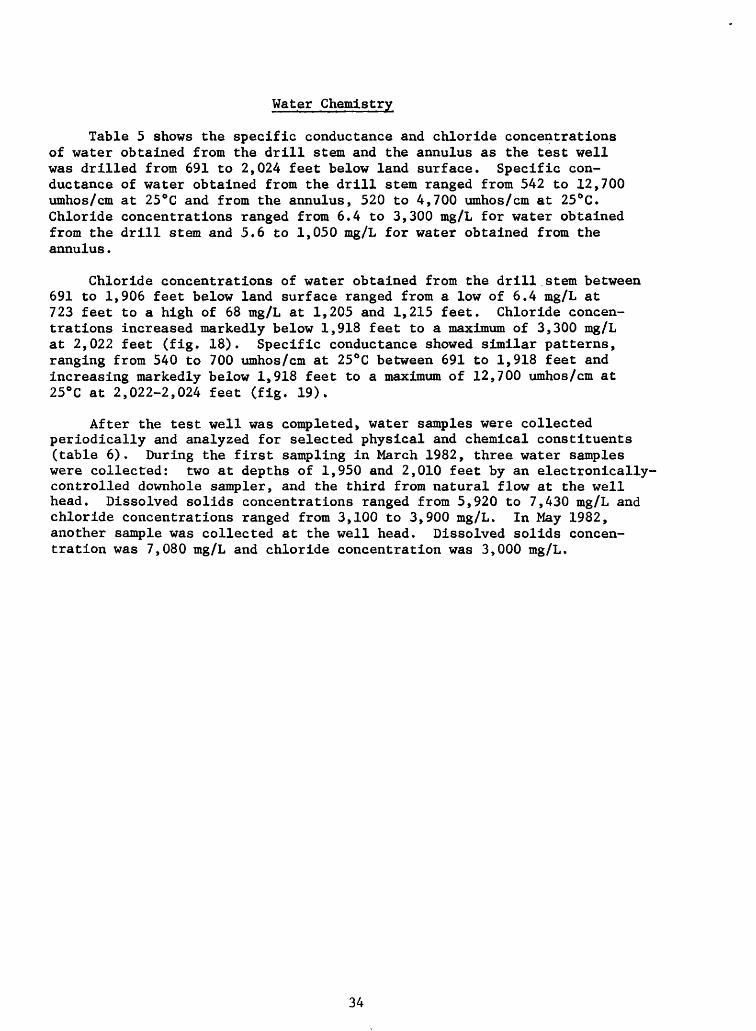
Water Chemistry
Table 5 shows the specific conductance and chloride concentrations of water obtained from the drill stem and the annulus as the test well was drilled from 691 to 2,024 feet below land surface. Specific con ductance of water obtained from the drill stem ranged from 542 to 12,700 umhos/cm at 25°C and from the annulus, 520 to 4,700 umhos/cm at 25°C. Chloride concentrations ranged from 6.4 to 3,300 mg/L for water obtained from the drill stem and 5.6 to 1,050 mg/L for water obtained from the annulus.
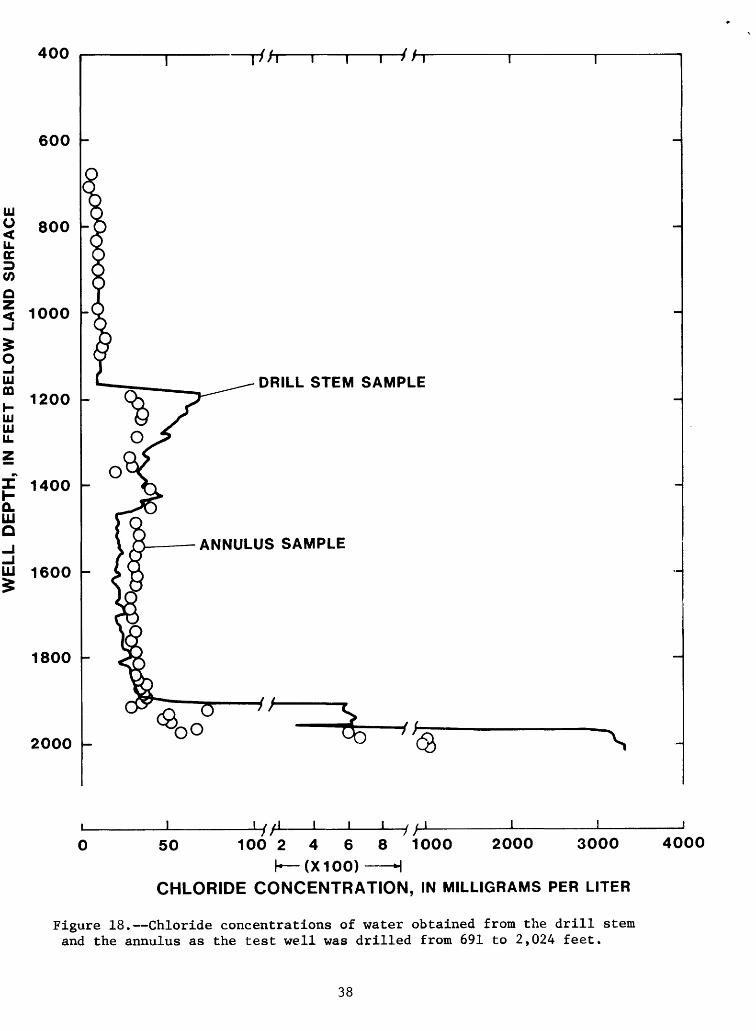
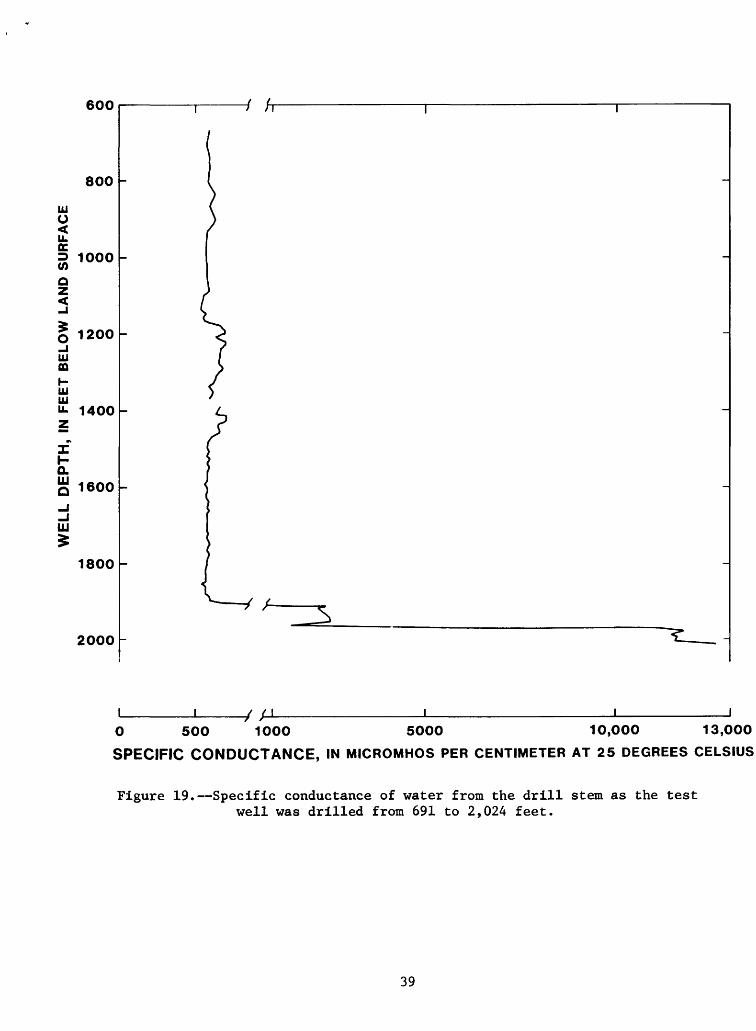
Chloride concentrations of water obtained from the drill stem between 691 to 1,906 feet below land surface ranged from a low of 6.4 mg/L at 723 feet to a high of 68 mg/L at 1,205 and 1,215 feet. Chloride concen trations increased markedly below 1,918 feet to a maximum of 3,300 mg/L at 2,022 feet (fig. 18). Specific conductance showed similar patterns, ranging from 540 to 700 umhos/cm at 25°C between 691 to 1,918 feet and increasing markedly below 1,918 feet to a maximum of 12,700 umhos/cm at 25°C at 2,022-2,024 feet (fig. 19).
After the test well was completed, water samples were collected periodically and analyzed for selected physical and chemical constituents (table 6). During the first sampling in March 1982, three water samples were collected: two at depths of 1,950 and 2,010 feet by an electronically- controlled downhole sampler, and the third from natural flow at the well head. Dissolved solids concentrations ranged from 5,920 to 7,430 mg/L and chloride concentrations ranged from 3,100 to 3,900 mg/L. In May 1982, another sample was collected at the well head. Dissolved solids concen tration was 7,080 mg/L and chloride concentration was 3,000 mg/L.
34
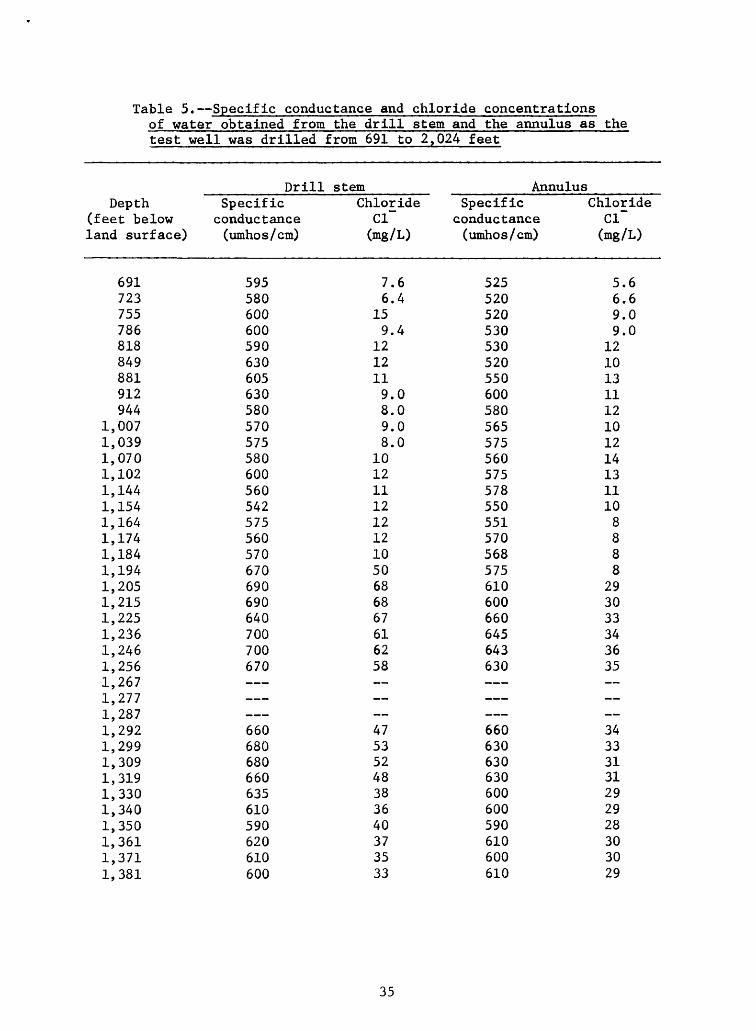
Table 5. Specific conductance and chloride concentrationsof water obtained fromtest well was drilled
the drill stem and the annulus as thefrom 691 to 2, 024 feet
Depth(feet belowland surface)
691723755786818849881912944
1,0071,0391,0701,1021,1441,1541,1641,1741,1841,1941,2051,2151,2251,2361,2461,2561,2671,2771,2871,2921,2991,3091,3191,3301,3401,3501,3611,3711,381
DrillSpecificconductance(umhos/cm)
595580600600590630605630580570575580600560542575560570670690690640700700670 660680680660635610590620610600
stemChlorideCl~
(mg/L)
7.66.4
159.4
1212119.08.09.08.0
1012111212121050686867616258 47535248383640373533
AnnulusSpecific
conductance(umhos/cm)
525520520530530520550600580565575560575578550551570568575610600660645643630 660630630630600600590610600610
ChlorideCl~
(mg/L)
5.66.69.09.0
12101311121012141311108888
293033343635 34333131292928303029
35
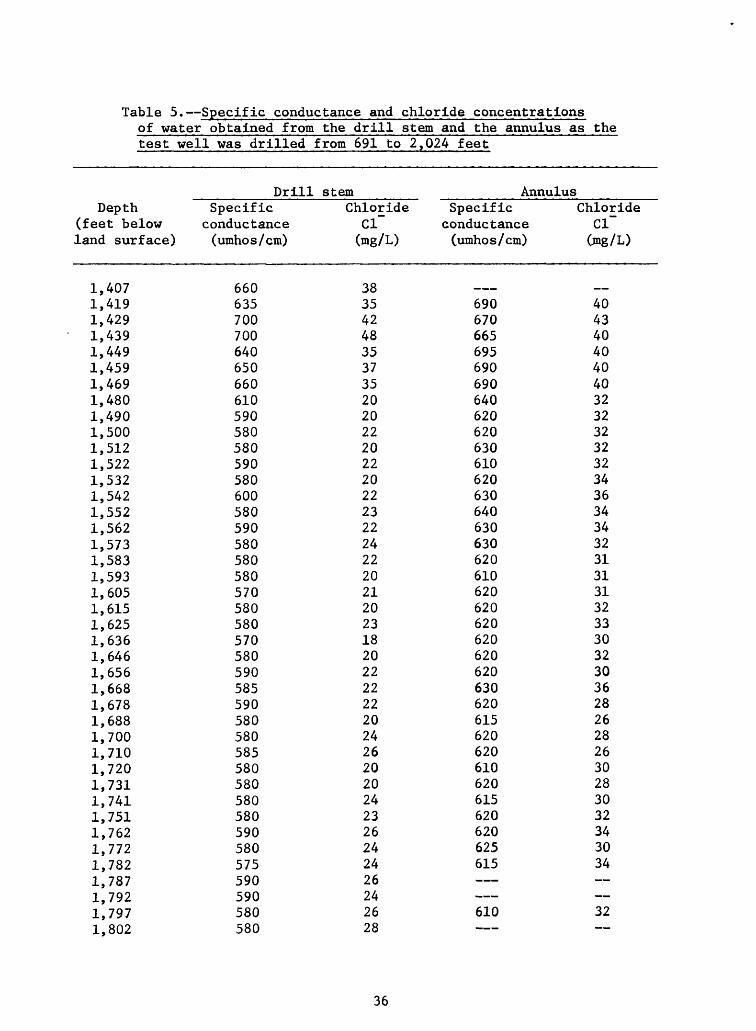
Table 5. Specific conductance and chloride concentrationsof water obtained fromtest well was drilled
the drill stem and the annulus as thefrom 691 to 2 ,024 feet
Depth(feet belowland surface)
1,4071,4191,4291,4391,4491,4591,4691,4801,4901,5001,5121,5221,5321,5421,5521,5621,5731,5831,5931,6051,6151,6251,6361,6461,6561,6681,6781,6881,7001,7101,7201,7311,7411,7511,7621,7721,7821,7871,7921,7971,802
DrillSpecific
conductance(umhos/cm)
660635700700640650660610590580580590580600580590580580580570580580570580590585590580580585580580580580590580575590590580580
stemChloride
Cl(mg/L)
3835424835373520202220222022232224222021202318202222222024262020242326242426242628
AnnulusSpecific
conductance(umhos/cm)
... i- ...
690670665695690690640620620630610620630640630630620610620620620620620620630620615620620610620615620620625615 610
ChlorideCl(mg/L)
. .
404340404040323232323234363434323131313233303230362826282630283032343034 32
36
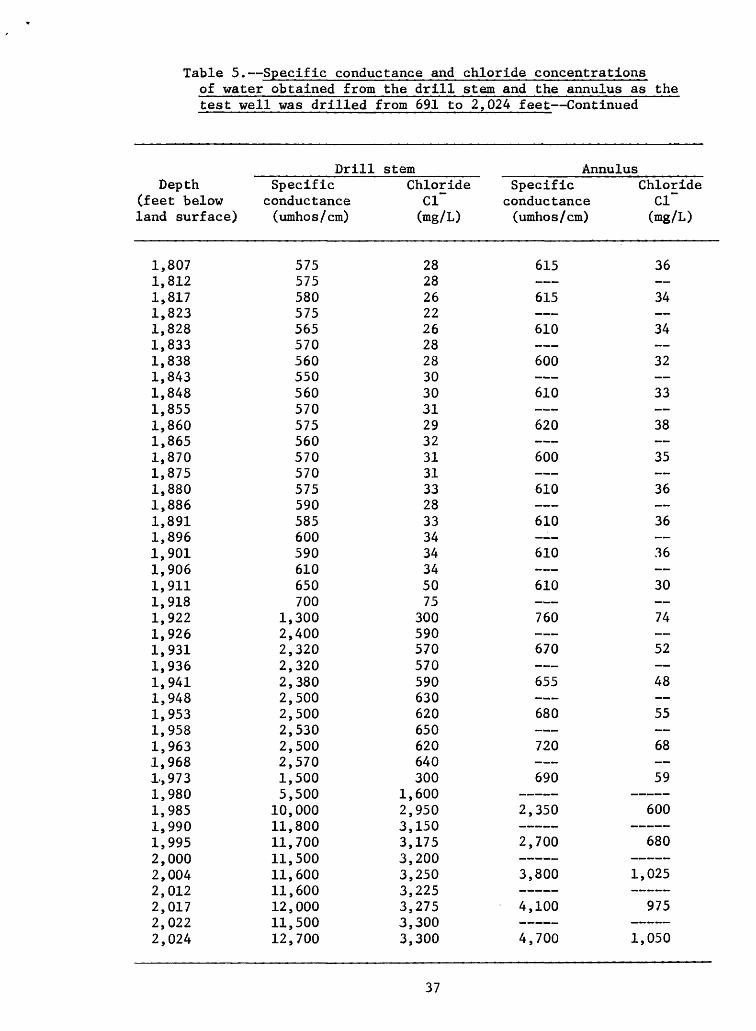
Table 5. Specific conductance and chloride concentrationsof water obtained fromtest well was drilled
the drill stem and the annulus as thefrom 691 to 2, 024 feet Continued
DepthCfeet belowland surface)
1,8071,8121,8171,8231,8281,8331,8381,8431,8481,8551,8601,8651,8701,8751,8801,8861,8911,8961,9011,9061,9111,9181,9221,9261,9311,9361,9411,9481,9531,9581,9631,9681,9731,9801,9851,9901,9952,0002,0042,0122,0172,0222,024
DrillSpecific
conductance(umhos/cm)
575575580575565570560550560570575560570570575590585600590610650700
1,3002,4002,3202,3202,3802,5002,5002,5302,5002,5701,5005,500
10,00011,80011,70011,50011,60011,60012,00011,50012,700
stemChlorideCl"~
(mg/L)
28282622262828303031293231313328333434345075
300590570570590630620650620640300
1,6002,9503,1503,1753,2003,2503,2253,2753,3003,300
AnnulusSpecific
conductance(umhos/cm)
615 615 610 600 610 620 600 610 610___610 610 760 670 655 680 720 690
2,350
2,700
3,800 1
4,100
4,700 1
ChlorideCl"~
(mg/L)
36 34 34 32 33 38 35 36 36 36 30 74 52 48 55 68 59
600
680
,025
975
,050
37
400
600
UJ^LL OCZ)
800
Q
< 1000
UJ CO
UJ UJu.
QL HI O
1200
1400
1600
1800
2000
-tf-
DRILL STEM SAMPLE
-ANNULUS SAMPLE
-ft -ih50 2000 3000100 2468 1000
k (X100) H
CHLORIDE CONCENTRATION, IN MILLIGRAMS PER LITER
Figure 18. Chloride concentrations of water obtained from the drill stem and the annulus as the test well was drilled from 691 to 2,024 feet.
4000
38
u O
QZ
600
800
1000
§ 1200_i uCD
H Ul Uu. 1400
Z
Q.1600
LU
1800
2000
-y0 500 1000 5000 10,000 13,000
SPECIFIC CONDUCTANCE, IN MICROMHOS PER CENTIMETER AT 25 DEGREES CELSIUS
Figure 19. Specific conductance of water from the drill stem as the test well was drilled from 691 to 2,024 feet.
39
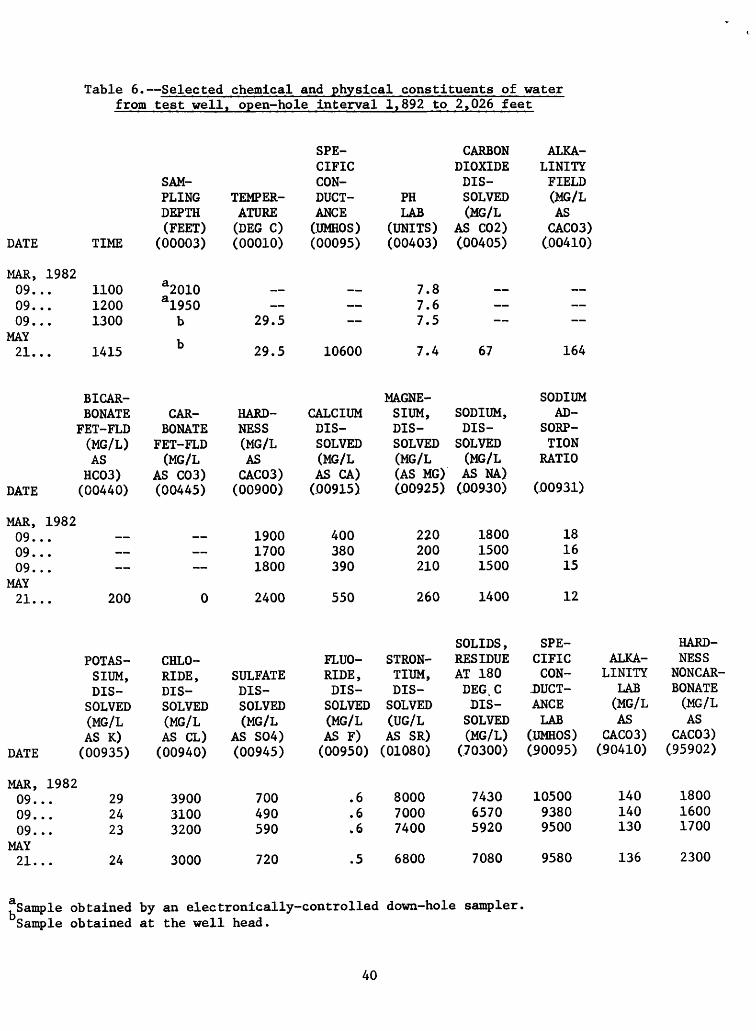
Table 6. Selected chemical and physical constituents of waterfrom test well, open-hole interval 1,892 to
DATE
MAR,09.09.09.
MAY21.
DATE
MAR,09.09.09.
MAY21.
DATE
MAR,09.09.09.
MAY21.
TIME
1982110012001300
1415
BICARBONATEFET-FLD(MG/L)AS
HC03)(00440)
1982
^^
200
POTASSIUM,DISSOLVED(MG/LAS K)(00935)
1982292423
24
SAM PLING DEPTH(FEET)
(00003)
a2010a!950
b
b
CARBONATE
FET-FLD(MG/L
AS C03)(00445)
0
CHLORIDE,DISSOLVED(MG/LAS CL)(00940)
390031003200
3000
TEMPER ATURE(DEC C)(00010)
__
29.5
29.5
HARDNESS(MG/LASCAC03)(00900)
190017001800
2400
SULFATEDISSOLVED(MG/L
AS S04)(00945)
700490590
720
SPE CIFIC CON DUCT ANCECUMHOS)(00095)
__
10600
CALCIUMDISSOLVED(MG/LAS CA)(.00915)
400380390
550
FLUO-RIDE,DISSOLVED(MG/LAS F)(00950)
.6
.6
.6
.5
PH LAB
(UNITS)(00403)
7.87.67.5
7.4
MAGNESIUM,DISSOLVED(MG/L(AS MG)000925)
220200210
260
STRONTIUM,DISSOLVED(UG/LAS SR)(01080)
800070007400
6800
2,026 feet
CARBON DIOXIDE DIS SOLVED (MG/L
AS C02)(.00405)
__
67
SODIUM,DISSOLVED(MG/LAS NA)(00930)
180015001500
1400
SOLIDS ,RESIDUEAT 180DEG.CDISSOLVED(MG/L)
(70300)
743065705920
7080
ALKA LINITY FIELD (MG/L ASCAC03)(.00410)
_
164
SODIUMAD
SORPTION
RATIO
(.00931)
181615
12
SPECIFIC ALKA-CON- LINITY
DUCT- LABANCE (MG/LLAB AS
(UMHOS) CAC03)C90095) (50410)
10500 1409380 1409500 130
9580 136
HARDNESS
NONCAR-BONATE(MG/LAS
CAC03)C95902)
180016001700
2300
^Sample obtained by an electronically-controlled down-hole sampler, Sample obtained at the well head.
40
SELECTED REFERENCES
Cooper, H. H., Jr., Kohout, F. A., Henry, H. R., and Glover, R. E., 1964, Sea water in coastal aquifers: U.S. Geological Survey Water-Supply Paper 1613-C, p. C1-C84.
Lohman, S. W., and others, 1972, Definitions of selected ground-water terms - revisions and conceptual refinements: U.S. Geological Survey Water-Supply Paper 1988, 21 p.
National Oceanic and Atmospheric Administration (NOAA), 1981, Tide tables 1982, high and low predictions east coast of North and South America including Greenland: U.S. Department of Commerce, U.S. Printing Office.
41