Embed Size (px)
Citation preview
DRILLING AND HYDROGEOLOGIC EVALUATION OF A
DEEP MONITORING WELL IN THE CHIMACUM VALLEY
NOVEMBER, 2007
DRILLING AND HYDROGEOLOGIC CHARACTERIZATION OF A DEEP MONITORING WELL IN THE CHIMACUM VALLEY
Prepared by:
Pacific Groundwater Group 2377 Eastlake Avenue East, Suite 200
Seattle, Washington 98102 206.329.0141
www.pgwg.com
and: Public Utilities District #1 of Jefferson County
230 Chimacum Road Port Hadlock, WA 98339
360.385.5800 http://pud.co.jefferson.wa.us/
November 7, 2007 JZ0701
DeepWellReport.doc

TABLE OF CONTENTS
1.0 INTRODUCTION.........................................................................................................................................1 1.1 PURPOSE AND INTENT ......................................................................................................................................1 1.2 FUNDING..........................................................................................................................................................2 1.3 ACKNOWLEDGMENTS.......................................................................................................................................2
2.0 WELL CONSTRUCTION ...........................................................................................................................2 2.1 SITE LOCATION ................................................................................................................................................2 2.2 WELL DRILLING...............................................................................................................................................2 2.3 WELL INSTALLATION AND COMPLETED DESIGN..............................................................................................4 2.4 WELL DEVELOPMENT ......................................................................................................................................5
3.0 HYDROGEOLOGY .....................................................................................................................................5 3.1 GEOLOGIC HISTORY.........................................................................................................................................5 3.2 HYDROGEOLOGIC FRAMEWORK.......................................................................................................................6 3.3 INTERPRETATION OF AQUIFERS AND AQUITARDS ............................................................................................9
4.0 RECOMMENDATIONS ............................................................................................................................10 4.1 AQUIFER TESTING..........................................................................................................................................11 4.2 WATER QUALITY SAMPLING..........................................................................................................................12 4.3 WATER-LEVEL MONITORING.........................................................................................................................13
5.0 REFERENCES............................................................................................................................................14
FIGURES
Figure 1: Surficial Geology and Cross Section Traces Figure 2: Geologic Log and As-Built for Well DW-1 Figure 3: Cross-Section A-A’
APPENDICES
Appendix A: Photographs from Well Drilling
SIGNATURE
This report, and Pacific Groundwater Group’s work contributing to this report, were reviewed by the undersigned and approved for release.
Peter Schwartzman Hydrogeologist Washington State Hydrogeologist No. 2461

CHIMACUM VALLEY DEEP WELL 1 NOVEMBER 7, 2007
1.0 INTRODUCTION Pacific Groundwater Group (PGG) and the Public Utility District #1 of Jefferson County (“the PUD”) worked cooperatively to oversee drilling of a 600-foot well in the Chimacum Valley. PUD hydrogeologist Bill Graham managed drilling activities and contracting, observed the drilling process, assisted the driller in collecting continuous core samples from the borehole, and oversaw well development. Together, Bill Graham and PGG hydrogeologist Peter Schwartzman logged the core sample, assembled a geologic log, and selected the final design of the completed monitoring well. PGG interpreted the geology encountered in the well with respect to hydrogeologic conditions in the Chimacum Basin, with review and final input from the PUD. This report includes sections describing: the reason for drilling the 600-foot well, funding and acknowledgements, well drilling and construction, hydrogeologic interpretation, and recommendations for additional study. While the bulk of this report was written by PGG, the PUD described the project purpose/intent, drilling conditions and well development. This work was performed, and this report prepared, in accordance with hydrogeologic practices generally accepted at this time in this area, for the exclusive use of the PUD and their agents, for specific application to the referenced project. No other warranty, express or implied, is made.
1.1 Purpose and Intent The purpose of the project was to drill and assess the full thickness of the glacio-fluvial sediments near the mouth of the Chimacum valley in East Jefferson County, Washington. The well is located within the Quilcene –Snow Water Resource Inventory Area 17, or “WRIA 17”. Much is unknown about the deeper sediments beneath the Chimacum Valley, an approximately 35-square-mile basin where rapid growth is anticipated in the future. Jefferson County planners are grooming the lower basin for an urban growth area which will include a new sewer system within the next 20 years. Competition for water resources is high and will continue in the context of recovering ESA listed Hood Canal summer chum and other salmonids in Chimacum Creek. The need to understand the valley’s complex hydrology and hydrogeology will be instrumental in developing management strategies and alternatives that will minimize impact to streamflows and meet the demands of future growth. This project endeavors to answer some basic questions about how thick the sediments are, where groundwater might be withdrawn, and where it could be stored for seasonal use using aquifer storage and recovery (ASR). Our attempt to gather this information required drilling deeper in the valley than any local well been drilled to date. The PUD’s review of logs from wells completed in the valley lowland suggests no other wells deeper than 225 feet in the general area. In order to obtain high quality well log, the “sonic” drilling method was used; a method that preserves the integrity of the core during drilling allowing for highly detailed logging and long term preservation of the core. The data gathered from this study is intended for use in two on-going Department of Ecology (DOE) sponsored studies: 1) determining the feasibility of aquifer storage and recovery in the Chimacum Valley (DOE Grant #G0800072), and; 2) a ground water model of the basin being conducted by the US Geological Survey that will assess the hydrogeologic impacts of anticipated development (DOE Grant #). Another outcome of this project is the capability to measure and monitor water levels from a deep aquifer and sample various water-quality parameters.
CHIMACUM VALLEY DEEP WELL 2 NOVEMBER 7, 2007
1.2 Funding The project originated from a DOE budget surplus grant. In November 2006, Ecology announced a surplus of funding available for projects so long as the work could be completed by the end of the fiscal year (June 30, 2007). The PUD submitted the deep well project to the Planning Unit for their approval which was then selected by the Ecology. The majority of the project was funded by Ecology administered through the Shorelands and Environmental Assistance Program. During the course of the project, the PUD requested additional funds to drill deeper when the driller was in favorable formation at 600 ft and not yet penetrated the entire valley sediments. Due to further unanticipated cost overruns, the PUD paid the remainder of the costs and finished the project in November 2007.
1.3 Acknowledgments Thanks to the many hands to who helped make this project possible. They include, first and foremost, the WRIA 17 Planning Unit members for their decision to stand behind the project and the Department of Ecology for their generous funding, support and patience, especially longtime WRIA 17 Watershed Liaison Phil Wiatrak and Grant Administrator Cathy Hubbard from the Shorelands and Environmental Assistance Program. Also deserving of thanks were USGS hydrologist Joseph Jones and intern Wendy Welch who were not afraid to get their hands dirty (and backs sore) in the logging of over 600 feet of core including. Many thanks go out to the Dave Foreman and Trevor Contreras of the Washington Department of Natural Resources for shipping and storing the core for future analysis. And a hearty “thank you” to Boart Longyear’s Matt Winfield, Dale Abernathy and especially well driller Dave Donnelly and his crew who drilled and recovered perhaps the deepest continuous soft-sediment core in the Pacific Northwest to date. Without their skills and know-how, this project would not have been possible. Finally, special thanks to retired State geologists (and Port Townsend residents) Gerry Thorson, for offering his knowledge regarding local glacial history, and Katherine Reed, for her impeccable editorial review of this document.
2.0 WELL CONSTRUCTION
2.1 Site Location Well DW-1 is located along the north side of HJ Carroll Park near the town of Chimacum, Jefferson County, Washington (Figure 1). The well is located in the NW quarter of the SW quarter of Section 11, Township 29 North, Range 1 West (29N/1W-11SWNW). The elevation of the site is approximately 102 feet NAVD88 based on LiDAR coverage presented on the Jefferson County website (http://www.co.jefferson.wa.us/). The site is located in the northeast portion of WRIA 17 within the Chimacum Creek drainage basin, approximately 1250 ft due west-southwest of the confluence of Chimacum Creek with the East Fork of Chimacum Creek.
2.2 Well Drilling Drilling of Well DW-1 began on May 3rd and was concluded on May 29, 2007. Boart Longyear of Portland, Oregon, drilled the hole to a depth of 620 feet with the rotosonic (“sonic”) method. A 7-in.-diameter temporary casing was first advanced to a depth of 350 feet below land surface (bls), followed by 6-inch temporary casing to a depth of 607 feet bls. Although the driller was

CHIMACUM VALLEY DEEP WELL 3 NOVEMBER 7, 2007
able to extend the sampling barrel down to 620 feet bls, the 6-inch casing could not be advanced farther than 607 feet. Drilling runs and core sampling was performed almost exclusively in 20 ft increments. The 6 inch sampling barrel is advanced by threading 20 ft rods together above the well, lowering the rod assembly to a brace where rods are held to both advance and withdraw the sample barrel. When at the bottom of the casing, the sampling barrel is advanced sonically into the substrate up to 20 ft below the casing to obtain the sample. The casing is then advanced to the bottom of the barrel, and the sample is then retrieved by pulling and unthreading the rods and once out of the well hole is sonically extruded into 3 ft clear plastic bags and placed on a slide to be collected and moved away from the rig. Each sample was about 5 inches in diameter and 2-2.5 ft long. The sample bags were laid on the ground end to end to maintain continuity in columns about 40 feet long. During drilling, continuous core samples were collected by Bill Graham of the PUD and Dave Donnelly of Boart Longyear. A geologic log of the sediments retrieved during drilling is presented in Figure 2. Logging of the continuous core samples was performed by Peter Schwartzman of PGG, Bill Graham of JCPUD, and Joseph Jones and Wendy Welch of the USGS (Tacoma Branch Office). The samples were cut in half along their long axis, inspected, described, recorded, and placed in wooden boxes that typically held 10 feet of core. The boxes were put in storage by the Division of Geology and Earth Resources of WDNR. Based on inspection of the continuous core, the geologic log shows fairly permeable materials in the upper 22 feet. These materials were composed of easily penetrated gray, slightly silty sand and gravelly sand and were water bearing, most likely associated with nearby Chimacum Creek. The sandy sediments were underlain by gray silty fine sand from 22 to 47 feet bls. Beneath these sands, gravelly sands and silty sands were 15 feet of variably dense gray till (47-62 feet bls) (Photo 1 in Appendix A) underlain by 11 feet of gray sand and gravel (62-73 feet bls). Fine materials dominated the core samples between 73 and 206 feet bls. Thirteen feet of dense gray clay (73-86 feet bls) were underlain by 86 feet of gray clay with interbeds of sand and silt (86-172 feet bls). The interbedded zone exhibited sand/silt layers about 0.5 to 2 feet thick, along with occurrences of brown organic fibers (Photo 2), a possible paleosol, and vivianite (a bright blue mineral typically associated with loess deposits) (Photo 3). The interbedded zone was underlain by about 10 feet of gray sand (172-182 feet bls) before transitioning back to silty clay with interbeds of silt/sand and traces of wood and vivianite (182-206 feet bls). More resistance was encountering when drilling within the clay layers. The 133-foot-thick sequence (73-206 feet bls) was underlain by 51 feet of sandy materials (206-257 feet bls). This sandy sequence fined downward from gray medium sand to silty fine sand, included trace wood throughout, minor gravel in the upper 36 feet and shells in the lower 15 feet. Several large shells were seen within this sequence including a pelecypod (bivalve mollusk) at 253 ft (Photo 4). Static water level was not measured within these sandy materials; however, the driller noted that water was present and that he thought this sandy zone would be the most favorable for use as a water supply well.

CHIMACUM VALLEY DEEP WELL 4 NOVEMBER 7, 2007
The 51 feet of sandy materials was underlain by a 331-foot-thick sequence of silt and clay between 257-588 feet bls. Very sparse occurrence of pebbles and shells was observed over much of this sequence, along with some mottling and laminations. Much of the sequence was densely compacted, such that samples had to be split with a hammer and chisel. The sparse occurrence of pebbles and an isolated cobble suggested the possibility of ice rafting. The shells, observed only above 474 feet bls, suggested a marine, glaciomarine environment. Sand stringers were observed between 390 and 392 feet bls and 562 and 566 feet bls. This thick sequence of fines was underlain by about 17 feet of coarser materials. Gray fine sand transitioned to gravelly silt between 588 and 597 feet bls. Water bearing gray sand and gravel with minor silty zones was penetrated between 597 and 614.5 feet bls (Photo 5). The coarser materials transitioned again to finer sandy silt and silty sand, and the hole bottomed out in 1 foot of clay between 619 and 620 feet bls. Refusal occurred once the casing could be driven no further. As discussed below, the well was completed in the lowermost sand/gravel zone. The static water level for this zone was 12 feet bls.
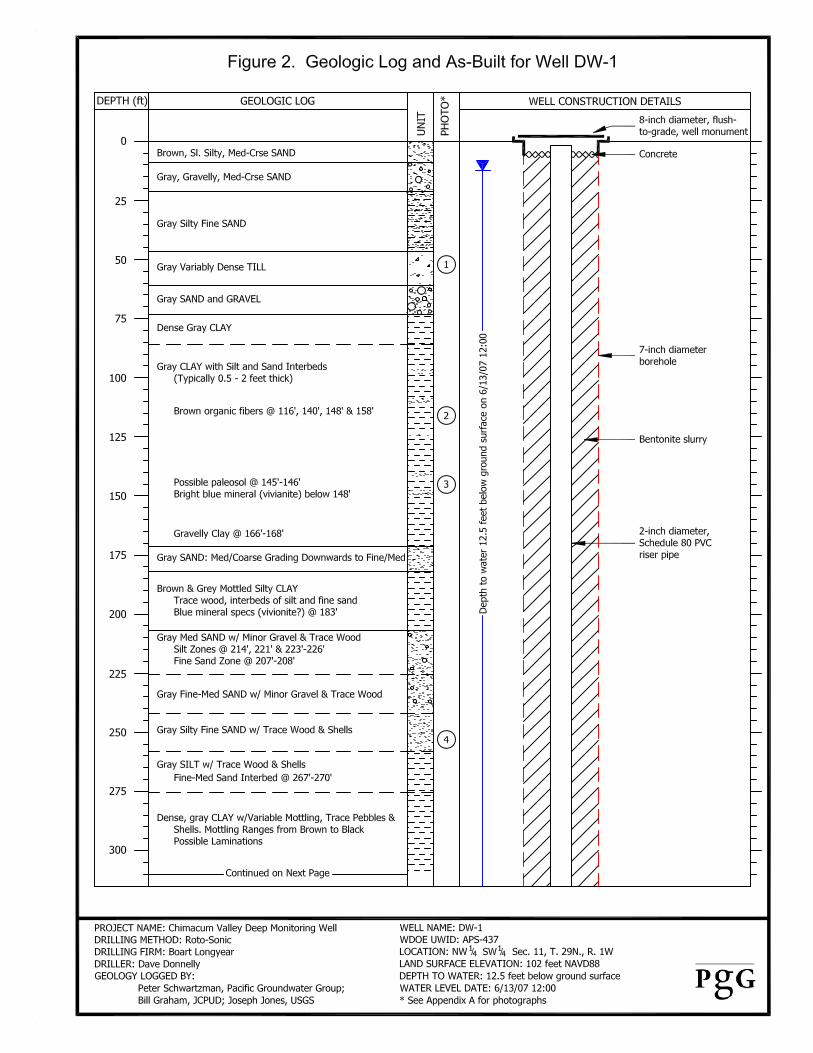
2.3 Well Installation and Completed Design Well DW-1 was completed as a 2-inch-diameter monitoring well with Schedule 80 PVC casing from land surface to a depth of 590 feet, 0.020-inch slot stainless steel screen from 590 to 605 feet bls, and a stainless-steel tailpipe from 605 to 607 feet bls. An as-built of the well is shown on Figure 2. The monitoring well screen was fully assembled before it was lowered into the borehole. Centralizers were positioned immediately above and below the well screen. Before lowering the monitoring well down the borehole, several feet of bentonite pellets were added atop the collapsed native materials that occupied the excavation below the bottom of the 6-inch temporary casing (from 607 to 620 feet bls). Once the monitoring well was suspended within the borehole, annular materials (sand pack and bentonite) were installed while pulling back the temporary casing. To do this, the monitoring well was suspended in the borehole, with the bottom of the tailpipe just above the top of the bentonite pellets. Sand pack was installed within a portion of the 6-inch temporary casing, and the casing was vibrated and pulled back. This procedure was repeated, with sand pack maintained in the annular space between the monitoring well and the temporary casing, until the sand pack was fully in place. Grade 10-20 Colorado Silica Sand was installed to 5 feet above the top of the screen (585 feet bls), and 3 feet of (finer) 20-40 sand was installed to a depth of 582 feet bls. Bentonite grout was installed in the annular space between the monitoring well and the borehole wall with a tremie tube. Bentonite was tremied to a depth of 300 feet bls prior to removing the 6-inch casing and was then tremied to land surface before removing the 7-inch casing. The wellhead was completed with an 8-inch diameter, flush-to-grade monument and a concrete pad at the land surface. Well access is secured by 2 inch locking cap plug and bolted plate.
CHIMACUM VALLEY DEEP WELL 5 NOVEMBER 7, 2007
2.4 Well Development Well development was accomplished by air lifting by pumping. Development by air lifiting lasted approximately 6 hours. After approximately 3000 gallons was discharged, a submersible Grundfos pump was installed with a bypass into a Horiba multimeter for analysis of eH (a measure of oxidation-reduction potential), dissolved oxygen, specific conductance and temperature. The water discharged during well development frothed excessively during the first day of development. Parameters never stabilized likely due to the excessive frothing, which is thought to be due to residual deflocculant used during the well installation. The well was pumped a second day for approximately 3 hours at which time it stopped frothing, however no samples were collected or physical parameters measured.
3.0 HYDROGEOLOGY A key outcome of drilling Well DW-1 was defining a continuous stratigraphic profile of sediments within the Chimacum Valley. It was originally hoped that the well would reach the deep bedrock that underlies the Chimacum Valley sediments. Bedrock was believed to occur at a depth of 500 to 600 feet at the well location (Simonds et al., 2004). The sonic drilling technique provides high quality samples of subsurface sediments; however, drilling depths are currently limited to about 600 feet1. While DW-1 did not penetrate bedrock at its maximum depth of 620 feet, it did provide new information about deep hydrostratigraphic units in the Chimacum Valley.
3.1 Geologic History The unconsolidated sediments of the Quimper Peninsula and the Chimacum Valley were deposited primarily during the Pleistocene (“ice-age”) and Holocene (recent) geologic periods. The Pleistocene period included multiple glaciations, three of which left sediments at this latitude. Sediments of Canadian Cordilleran (Vancouver Island and the Coast Ranges) and North Cascades provenance were transported into the area and deposited. The oldest Pleistocene sediment in the area is thought to be the Double Bluff Drift, which was likely deposited about 185 to 125 thousand years before present (ka)2. The Double Bluff Glaciation was followed by the Whidbey nonglacial interval, which likely occurred between about 125 and 80 ka. During the next glacial period, the Possession Drift was deposited atop the Whidbey Formation, probably between 80 and 60 ka. Deposition of Possession Drift was followed by the Olympia nonglacial interval, estimated to have occurred from about 60 to about 20 ka. The Olympia nonglacial interval ended when advance outwash sand and gravel of the Vashon Stade of the Fraser Glaciation began to expand into the Puget Lowland. During this stade, the ice likely reached thicknesses of 3,900 to 4,200 feet on the Quimper Peninsula, where it carved out drumlins and deposited till on most surfaces. As the climate warmed at the end of the Vashon Stade, the Puget lobe retreated northward, depositing recessional outwash sands and gravels. This retreat is summarized by Schasse and Slaughter (2005) as follows:
1 Boart Longyear report that Well DW-1 is the second deepest well drilled with the sonic technique in Washington State. 2 All dates cited in this geologic history are referenced by Schasse and Slaughter (2005).

CHIMACUM VALLEY DEEP WELL 6 NOVEMBER 7, 2007
Thorson (1981) offered a possible deglaciation sequence for this area. The retreat of the Puget lobe was marked by ice stagnation and the accumulation of ice-contact stratified drift; associated landforms in the map area are eskers and kettles. Elsewhere the retreat was characterized by an active ice margin resulting in a thin layer of ablation till over the pre-existing lodgment till. Ablation till in the project area shows considerable evidence of reworking by meltwater, characterized by small-scale channel erosion resulting in a patchwork of lodgment till, ablation till, and outwash. As the Puget lobe retreated northward, marine waters invaded the Puget Lowland, initiating the Everson Interstade. Ice collapse across Admiralty Inlet marks the beginning of deposition of Everson Glaciomarine Drift in the map area. The oldest nearby radiocarbon date from glaciomarine drift (at the Whidbey Island Naval Air Station, 14 mi north-northeast of Point Wilson) is 13,650 ±350 14C yr B.P. (Dethier and others, 1995), although Polenz and others (2005) believe that ice collapse across Admiralty Inlet may have occurred significantly earlier than Dethier’s radiocarbon date suggests. The Everson Interstade ended locally when the rate of post-glacial crustal rebound exceeded global sea level rise, causing the land in the map area to emerge. We agree with Swanson (1994) that his radiocarbon date of 12,690 14C yr B.P. likely provides the best estimate for the end of the Everson Interstade in the map area, but others have favored other dates (Dethier and others, 1995; Easterbrook, 1966).
3.2 Hydrogeologic Framework Most of the geologic information for the Chimacum Valley is derived from relatively shallow wells (<300 feet deep) and surficial exposures. A search of well logs on file with Ecology identified only two existing wells deeper than 500 feet: one completed in shallow bedrock just southeast of Anderson Lake (29N/1W-15SWSE), and the other completed in glacial sediments north of Chimacum Valley at Courtesy Ford on Airport Cutoff Road near Port Townsend (30N/1W-21SWSW). Surficial geologic information has been recently compiled by the USGS (Simonds et al., 2004) and WDNR (Schasse and Slaughter, 2005). Figure 1 presents the surficial geology mapped by the USGS. The following text summarizing geologic units of the Chimacum Valley is excerpted from the USGS report, and refers to the distribution of geologic units shown on Figure 1.
Quaternary Alluvium The youngest deposits in the study area are Holocene-age alluvial deposits (Qa) that include silt, sand, and peat deposits in flat valley bottoms and small lake basins, dune and beach sands along the Puget Sound shoreline, and small landslide deposits. The most notable Holocene deposits are the alluvial sediments through which Chimacum Creek flows which consist of very poorly drained, organic rich soil known as the Semiahmoo Muck (U.S. Department of Agriculture, 1975). These deposits form fertile agricultural lands adjoining Chimacum Creek and the East Fork of Chimacum Creek, although they typically need to be drained of saturated water before they can be used for agricultural purposes. Many of the tributaries to Chimacum Creek and parts of Chimacum Creek itself have been modified by dredging to improve drainage for the adjacent bottom land. Although they may be saturated for much of the year, the alluvial deposits are not a good source of water. The soils are either too fine-grained to yield water or too rich in organic matter to be useful for household use. The peat deposits in the Chimacum and Valley are essentially impermeable (or transmit water at a very slow rate), therefore they act as a barrier to surface-water and ground-water exchange. Groundwater recharge through these organic-rich alluvial materials is very limited. Vashon Recessional Outwash Sediments that were deposited as the Pleistocene-age Vashon ice sheet retreated include a variety of materials collectively known as the Vashon Recessional Outwash (Qvr). The Qvr consists of sorted and stratified sands and gravels with relatively good porosity and permeability. These materials were deposited by high-energy streams that eroded and re-deposited till and other materials; they were not
CHIMACUM VALLEY DEEP WELL 7 NOVEMBER 7, 2007
compacted by subsequent ice sheets. Some of the fine-grained sediments were deposited in a lake that formed as the retreating ice margin blocked drainage to the north. The resulting large lake, known as Lake Leland, filled much of Puget Sound, including both forks of Chimacum Creek, until the ice dam was breached and the water drained. The Qvr deposits are found partly filling the bottom of the Chimacum Creek drainage, and isolated remnants also occur in depressions or low areas on the till surface. The Qvr generally is less than 50 ft thick but may exceed 100 ft north of the community of Chimacum. The coarse-grained layers generally are water-bearing and may form an unconfined water-table aquifer when not overlain by fine-grained impermeable layers. Because the main surface-water drainages in eastern Jefferson County occupy valleys underlain by Qvr, there is a strong tendency for surface water to interact with ground water from this unit. Because Qvr contains highly permeable materials, the unit can be recharged from multiple sources, including the direct infiltration of precipitation onto the surface of the unit, through lateral flow from underlying units, and from seepage of surface water along losing reaches of creeks that cross the unit. Discharge from Qvr occurs along gaining reaches of creeks that cross the unit and through the bottom of the unit into the underlying materials. Vashon Lodgement Till Vashon Lodgement Till (Qvt) is a poorly sorted mixture of sand, gravel, and boulders representing eroded materials smeared at the base of the Pleistocene-age Vashon ice sheet. This material was compressed as nearly 4,000 ft of ice moved over it. In some places, the material is highly compacted and very resistant and commonly is referred to by drillers as “hard pan.” In other places, the till has been reworked and is not compacted. Drillers’ logs sometimes do not distinguish till from other materials. The Qvt is widely exposed in the study area and forms the distinctive fluted surface consisting of narrow, regularly spaced parallel ridges and grooves oriented in a north-south direction. The till is not present in areas where ice was in direct contact with bedrock or in the main river valleys, where recessional outwash streams eroded the till away. The Qvt is not a significant producer of water because the unit generally lies above the water table. In addition, its primary porosity and permeability have been reduced by the effects of compaction. The low hydraulic conductivity of the till acts to retard the infiltration of precipitation, causing lakes or wetlands to form in depressions on the Qvt surface. The thickness of Qvt ranges from 40 ft or less to as much as 100 ft across the study area. Ranges in thickness are due in part to erosion but also to inconsistent descriptions of the material in drillers’ logs. Vashon Advance Outwash The Vashon Advance Outwash (Qva) is a stratified sequence of silts, clays, and peat deposits that interfinger with well-sorted sands, gravels, and cobbles. The sequence was deposited by melt-water streams preceding the advancing Pleistocene-age Vashon ice sheet. This material is found in outcrops beneath till on the west side of the Chimacum Valley and in isolated outcrops near the coastlines of Oak Bay and Port Ludlow Bay. The Qva is notably absent beneath the till on the east side of the Chimacum Valley (Grimstad and Carson, 1981). The absence of these deposits beneath till in these areas suggests that the unit either never was deposited or was subsequently scraped off by the advancing Vashon ice sheet. The Qva is the most prolific water-bearing unit in the area because of its lateral continuity and favorable primary porosity and permeability. The thickness of the unit ranges from 0 to a little more than 200 ft. On the east side of Chimacum Valley, limited exposures indicate that Qva may be present but it is not clear if the unit is laterally continuous. West of Chimacum Creek, copious amounts of ground water are produced from coarse-grained layers within Qva for both domestic and public-supply uses. Some layers within the unit are estimated to be capable of producing more than 1,000 gal/min (CH2M Hill, 1996). The Jefferson County PUD #1 currently withdraws water at a rate of about 555 gal/min from a highly transmissive layer known as the Sparling Aquifer to supply the communities of Chimacum, Irondale, and Port Hadlock. Recharge to Qva is primarily through the overlying till or by direct infiltration of precipitation on exposed areas. Because some layers of Qva are highly transmissive, lateral ground-water velocities may be high. Ground-water discharge is evident in springs and seeps at the base of valley slopes where the unit is exposed. Water also may discharge where Qva is in lateral contact with overlapping recessional outwash materials (Qvr)3.
3 PGG Note: Qva may also discharge to marine waters where it occurs at the surface or at depth along coastlines, such as immediately north of the mouth of Chimacum Creek.
CHIMACUM VALLEY DEEP WELL 8 NOVEMBER 7, 2007
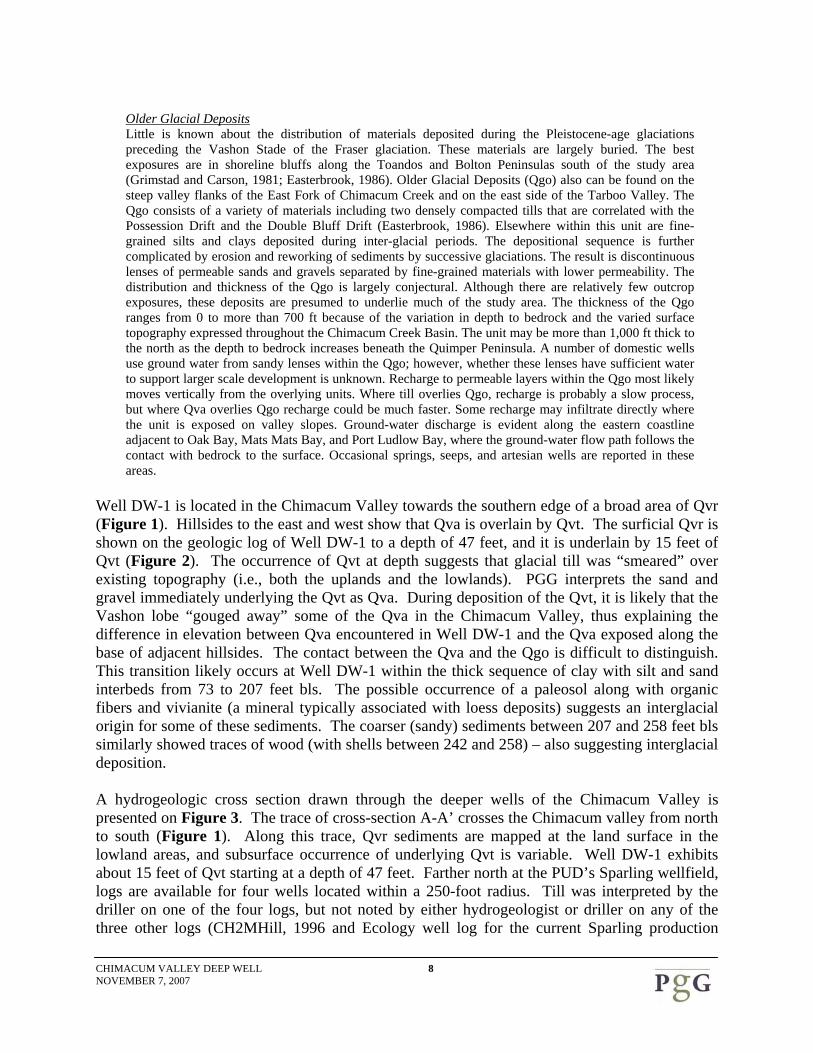
Older Glacial Deposits Little is known about the distribution of materials deposited during the Pleistocene-age glaciations preceding the Vashon Stade of the Fraser glaciation. These materials are largely buried. The best exposures are in shoreline bluffs along the Toandos and Bolton Peninsulas south of the study area (Grimstad and Carson, 1981; Easterbrook, 1986). Older Glacial Deposits (Qgo) also can be found on the steep valley flanks of the East Fork of Chimacum Creek and on the east side of the Tarboo Valley. The Qgo consists of a variety of materials including two densely compacted tills that are correlated with the Possession Drift and the Double Bluff Drift (Easterbrook, 1986). Elsewhere within this unit are fine-grained silts and clays deposited during inter-glacial periods. The depositional sequence is further complicated by erosion and reworking of sediments by successive glaciations. The result is discontinuous lenses of permeable sands and gravels separated by fine-grained materials with lower permeability. The distribution and thickness of the Qgo is largely conjectural. Although there are relatively few outcrop exposures, these deposits are presumed to underlie much of the study area. The thickness of the Qgo ranges from 0 to more than 700 ft because of the variation in depth to bedrock and the varied surface topography expressed throughout the Chimacum Creek Basin. The unit may be more than 1,000 ft thick to the north as the depth to bedrock increases beneath the Quimper Peninsula. A number of domestic wells use ground water from sandy lenses within the Qgo; however, whether these lenses have sufficient water to support larger scale development is unknown. Recharge to permeable layers within the Qgo most likely moves vertically from the overlying units. Where till overlies Qgo, recharge is probably a slow process, but where Qva overlies Qgo recharge could be much faster. Some recharge may infiltrate directly where the unit is exposed on valley slopes. Ground-water discharge is evident along the eastern coastline adjacent to Oak Bay, Mats Mats Bay, and Port Ludlow Bay, where the ground-water flow path follows the contact with bedrock to the surface. Occasional springs, seeps, and artesian wells are reported in these areas.
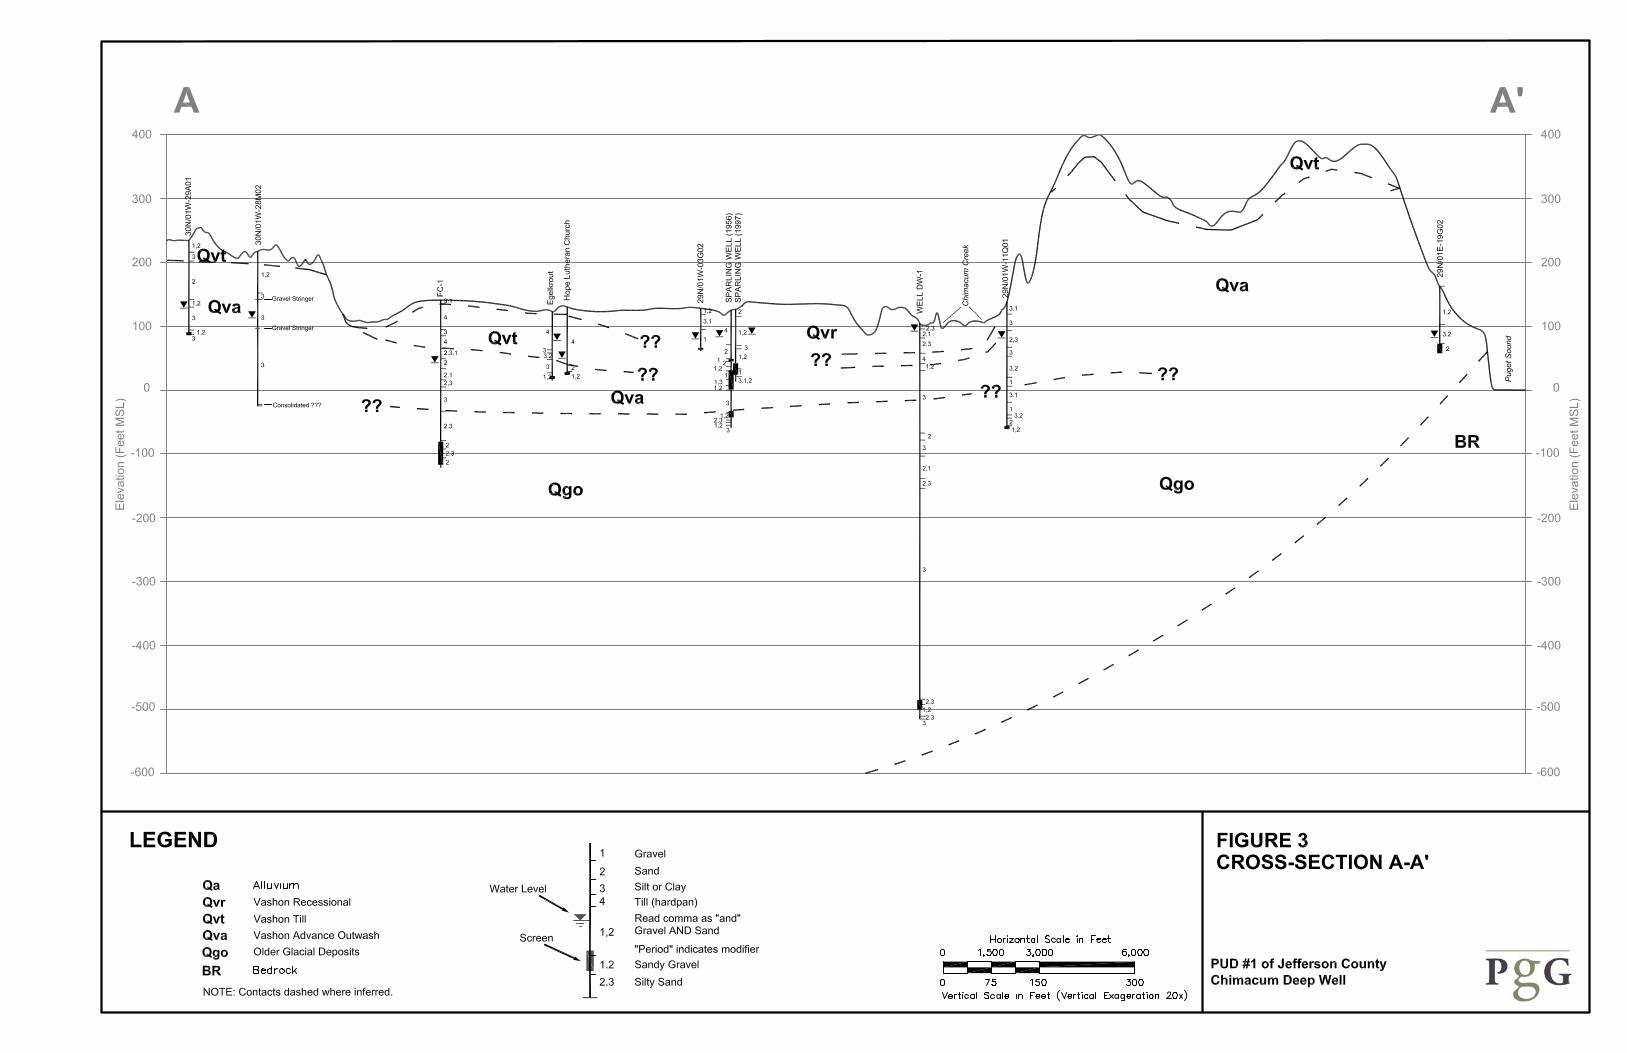
Well DW-1 is located in the Chimacum Valley towards the southern edge of a broad area of Qvr (Figure 1). Hillsides to the east and west show that Qva is overlain by Qvt. The surficial Qvr is shown on the geologic log of Well DW-1 to a depth of 47 feet, and it is underlain by 15 feet of Qvt (Figure 2). The occurrence of Qvt at depth suggests that glacial till was “smeared” over existing topography (i.e., both the uplands and the lowlands). PGG interprets the sand and gravel immediately underlying the Qvt as Qva. During deposition of the Qvt, it is likely that the Vashon lobe “gouged away” some of the Qva in the Chimacum Valley, thus explaining the difference in elevation between Qva encountered in Well DW-1 and the Qva exposed along the base of adjacent hillsides. The contact between the Qva and the Qgo is difficult to distinguish. This transition likely occurs at Well DW-1 within the thick sequence of clay with silt and sand interbeds from 73 to 207 feet bls. The possible occurrence of a paleosol along with organic fibers and vivianite (a mineral typically associated with loess deposits) suggests an interglacial origin for some of these sediments. The coarser (sandy) sediments between 207 and 258 feet bls similarly showed traces of wood (with shells between 242 and 258) – also suggesting interglacial deposition. A hydrogeologic cross section drawn through the deeper wells of the Chimacum Valley is presented on Figure 3. The trace of cross-section A-A’ crosses the Chimacum valley from north to south (Figure 1). Along this trace, Qvr sediments are mapped at the land surface in the lowland areas, and subsurface occurrence of underlying Qvt is variable. Well DW-1 exhibits about 15 feet of Qvt starting at a depth of 47 feet. Farther north at the PUD’s Sparling wellfield, logs are available for four wells located within a 250-foot radius. Till was interpreted by the driller on one of the four logs, but not noted by either hydrogeologist or driller on any of the three other logs (CH2MHill, 1996 and Ecology well log for the current Sparling production

CHIMACUM VALLEY DEEP WELL 9 NOVEMBER 7, 2007
well). Till was also noted by the same hydrogeologist in a monitoring well located about 1200 feet east of the Sparling Wellfield (MW-3). Based on these interpretations, the occurrence of till near the Sparling Wellfield appears to be spotty rather than geographically extensive4. A new well, to be drilled by the PUD at the Sparling site, will help to further define the occurrence of till. Farther north along the cross-section, substantial thicknesses of till are observed in logs from the Hope Lutheran Church Well, the Egelkrout Well, and the PUD’s “Four Corner’s Well” (FC-1). As noted above, Qvt is exposed at higher elevations on the north and south ends of the cross section. Beneath the Qvt (or the Qvr where Qvt is absent), distinction between Qva and Qgo is difficult, and the contacts shown on Figure 3 are tentative. Figure 3 suggests that the texture of the sediments inferred to be Qva beneath the lowlands may grade from sandy in the north (at Well FC-1), to variable silt, sand and gravel at the Sparling Site, to more silty in the south (at Well DW-1). At Well DW-1, PGG inferred the contact between Qva and Qgo to lie near the first occurrence of organic fibers in the drill core (116 feet). Simmonds et al (2004) interpret the current Sparling Production Well to be completed within the Qva. Both wells FC-1 and DW-1 show water-bearing materials at elevations of around -70 to -130 feet. These water bearing materials are referred to as the “middle aquifer” for the purposes of this report. The (tentative) stratigraphic interpretation on Figure 3 suggests that the middle aquifer occurs in Qgo sediments. A lack of deep wells between these two wells prevents assessment of the lateral extent of these moderately deep water-bearing sediments The middle aquifer is underlain by 331 feet of silt and clay in Well DW-1. Traces of wood in the upper 34 feet of this sequence (Figure 2) suggest a possible interglacial origin, and traces of shells in the upper 217 feet of this sequence suggest possible glaciomarine deposition. The bottom 114 feet of the sequence contained neither wood nor shells. A thin sand-and-gravel aquifer between 596 and 614 feet bls will be referred to as the “deep aquifer” for the purposes of this report.
3.3 Interpretation of Aquifers and Aquitards A “shallow aquifer” is tapped by the current Sparling Production Well and in the upper 22 feet bls at Well DW-1. The proximity of both these wells to Chimacum Creek (both wells are within 700 to 900 feet of the creek), the coarse texture of the aquifer, and the fact that the creek is gaining in this vicinity5 suggests there may be some degree of hydraulic connection with the Creek. A similar shallow aquifer is absent at Well FC-1. The “middle aquifer” in Well DW-1 could be correlated to the completion aquifer in Well FC-1 based on elevation alone. However, additional moderately deep wells would be required along the 3-mile distance between the two referenced wells to assess whether this aquifer is laterally extensive. The middle aquifer is separated from the shallow aquifer by a substantial thickness of 4 While the log from the “original” Sparling Well (drilled in 1956) shows 54 feet of till just beneath the land surface, the current Sparling Production Well (just 100 feet away) shows predominantly clean, coarse materials from the land surface to 105 feet, underlain by 8 feet of dense gravelly, sandy silt to a total depth of 113 feet. Monitoring wells MW-1 and MW-2 show predominantly silty gravels within the top 40-50 feet, predominantly coarse materials to 112 feet, immediately underlain by silt. Monitoring Well MW-3 (1200 feet to the east) notes till from 40-55 feet. 5 See seepage study results for reaches 1 and 2 of Chimacum Creek in Simons et al., 2004.

CHIMACUM VALLEY DEEP WELL 10 NOVEMBER 7, 2007
silt and clay in Well DW-1; however, sediments in the same depth range in more northern wells (FC-1 and the Sparling wells) show more varied textures, with a combined sequence of water-bearing, sandy Qva and underlying silt observed at Well FC-1. Thus, the regional character of the aquitard separating the shallow and middle aquifers is not well established. Nevertheless, the occurrence of some fine sediment above the middle aquifer suggests less relative hydraulic continuity with Chimacum Creek. In general, a well pumped in a deeper aquifer with less hydraulic continuity to the creek will have a greater impact on groundwater discharge to marine bodies and a lesser impact to baseflows in the creek. The middle aquifer in Well DW-1 is underlain by a 331-foot-thick silt/clay aquitard. The thickness of this sequence suggests that it might be regionally extensive; however, glacial deposition and non-glacial deposition within glacial terrain can result in significant textural changes over short distances. (This is particularly true where “troughs” in glacial terrain are filled in by fine, low-energy sediments such as current deposition in the Puget Sound). Nevertheless, this substantial silt/clay aquitard implies that the deep aquifer is highly confined at Well DW-1. Given that the deep aquifer is penetrated only by Well DW-1, its geographic extent is unknown. Pumping from the deep aquifer would cause drawdown to spread throughout its geographic extent, and groundwater would flow toward the aquifer from overlying (and possibly laterally adjacent) sediments. Pumping from the deep aquifer would likely capture a portion of the shallower groundwater currently discharging to marine bodies and to Chimacum Creek. If the deep aquifer is highly confined, it could be “recharge limited”, such that pumping the aquifer would not induce sufficient inflow to stabilize associated drawdowns. Hydraulic testing would be needed to assess the degree of confinement and geographic extent of the deep aquifer. Although the drilling of Well DW-1 identified three aquifers, drilling constraints only afforded the opportunity to measure groundwater level in the deep aquifer (12 feet bls). Thus, the vertical gradients (indicating upward or downward flow) and the head differences (potentially indicating degree of confinement) between the three aquifers are currently unknown.
4.0 RECOMMENDATIONS Considerable interest has been expressed by JCPUD and other interested parties regarding the capability of the deep aquifer to function as an aquifer storage and recovery (ASR) repository and as a possible source of supply. Both aquifer testing and groundwater sampling are recommended to assess these possibilities. Aquifer testing is typically performed to estimate the hydraulic properties of the aquifer, evaluate whether the aquifer is localized (bounded) or geographically extensive, and evaluate whether the aquifer is recharge limited or “leaky”. Testing of Well DW-1 can provide only limited information, however, as the small diameter of the well cannot accommodate a production-scale pump. Sampling is typically performed to assess water-quality conditions relevant to both ASR operations and groundwater withdrawal in general. PGG also recommends a water-level monitoring program to evaluate the extent that the deep aquifer responds to various stresses (climatic, pumping) and its hydraulic connection to other overlying aquifers.

CHIMACUM VALLEY DEEP WELL 11 NOVEMBER 7, 2007
The middle aquifer could also be a favorable source of groundwater supply and could be considered for ASR. Installation and testing of a well in the middle aquifer would be needed to evaluate this potential. If used for water supply, any new well would require a water right or a state-approved transfer of an existing water right. (Transfers to wells completed in deeper aquifers can reduce impacts on baseflow in surficial streams.) ASR has its own permitting and water-right processes and can provide a net benefit to both available water supply and seasonally low baseflows on streams. The following sections provide recommendations for aquifer testing in Well DW-1, water-quality sampling, and water-level monitoring.
4.1 Aquifer Testing Improved understanding of the hydraulic properties of the deep aquifer is needed to assess its potential for ASR and groundwater withdrawals in general. Testing Well DW-1 will permit estimation of aquifer properties only in the immediate vicinity of the well, not farther out into the completion aquifer. This is because the small-diameter well can provide only limited stresses on the completion aquifer during testing. Relevant testing approaches include:
• slug tests;
• pumping tests; and,
• injection tests. Slug tests are performed by instantaneously displacing the water level in the well (e.g., by compressed air) and observing the aquifer response to the displacement. However, data obtained from slug testing can be less reliable than data from pumping and injection tests. Pumping tests could be performed with a small-diameter sampling pump which, given the relatively low required lift (<50 feet), would likely yield several gallons per minute. This pumping rate, however, is low and, depending on actual aquifer properties, may not sufficiently stress the aquifer to yield good hydraulic information. (That is, low aquifer transmissivity values could be estimated, but a high transmissivity aquifer would not yield accurate estimates.) The stress on the aquifer could be increased by injecting water rather than pumping water. A disadvantage to injection testing is the introduction of “foreign” water to the aquifer. Any water-quality sampling should be conducted prior to injection testing. Despite their limitations, all three methods can be performed at relatively low cost. If the testing results suggest relatively high aquifer transmissivity close to the well, and if there is serious interest in using the aquifer for ASR or water supply, a more comprehensive testing program may be warranted. Such testing would require more stress on the aquifer, which in turn requires a larger diameter well. Installing a deep (600 feet), large-diameter (≥ 12 inches) well would likely cost several hundred thousand dollars. Thus, obtaining more extensive aquifer property information comes at considerable cost. A test well installed in the completion aquifer should be ideally located within several hundred feet of Well DW-1, so that Well DW-1 can be used as a
CHIMACUM VALLEY DEEP WELL 12 NOVEMBER 7, 2007
monitoring well during testing. The test well would ideally be pumped at rates in excess of several hundred gallons per minute for at least 24 hours, and water-level responses would be measured in both the test well and Well DW-1 during both the drawdown and recovery phases of the test. Such an aquifer test of would help to assess whether the deep aquifer is geographically extensive, bounded (e.g., by subsurface bedrock), and determine its hydraulic connection with overlying aquifers. One potential complication is the disposal of discharge water during the test. Surficial soils are relatively coarse and may infiltrate limited quantities of pumped water. The depth of the completion aquifer precludes concerns regarding recirculation of pumped water during the test. However, PGG noted low rates of infiltration in the immediate vicinity of Well DW-1 – likely due to soils compacted by heavy machinery during well drilling. During well development, several six-inch deep trenches approximately 30 ft long were dug in fill around the well site to accommodate infiltration. For large-scale pumping of a test well, or as a second option for testing Well DW-1, flexible tubing could be used to deliver the discharge water to Chimacum Creek. This would require temporary reinforcement of the streambed (e.g., plywood) to avoid erosion and would likely require a discharge permit from WDNR. At this time, we recommend either slug testing or pumping testing of Well DW-1. The results of this testing, along with interest/funding for further ASR studies, will dictate whether more comprehensive testing is warranted.
4.2 Water Quality Sampling Sampling is recommended to characterize the native water quality in the completion aquifer. As noted above (Section 2.4), considerable water (with dissolved drilling “soap”) was injected into the aquifer during the drilling process. However, during well development, about 3 times the estimated injection quality was removed from the well, and observed the water cleared of foam after about 8 hours of development6. This may indicate that most of the water injected during drilling has been removed from the aquifer. Any remaining injection water would migrate away from the well at the ambient rate of movement within the deep aquifer, which is unknown. Therefore, it is difficult to predict whether any remaining injection water would have migrated away from the well’s zone of capture during the sampling event. Laboratory analysis of the groundwater sample could be used to assess the presence of the constituents of drillers “soap”. A water-quality sample can be obtained from Well DW-1 in two manners:
1. low-flow sampling within the well screen; or,
2. sampling closer to the land surface with a sampling pump or a suction pump In the first case, a small sampling device would be lowered 600 feet into the screened interval of the well. Ambient groundwater flow through the well screen is introduced to the sampling device at low rate so as not disturb the water column in the well and inadvertently obtain
6 The driller estimated that 3,000 gallons of soapy water were used during drilling, and 10,000 gallons were removed during development.
CHIMACUM VALLEY DEEP WELL 13 NOVEMBER 7, 2007
“stagnant” water from higher in the well casing. The cost of procuring a deep sampling assembly and placing the assembly at depth may make this approach cost prohibitive. A less costly approach is to install a sampling pump closer to the land surface (e.g., within 50 feet) and pump sufficient water to purge the well casing and therefore obtain a representative sample from the completion aquifer. At the relatively low rates associated with a sampling pump (several gallons per minute) and the volume of the well casing (97 gallons), purging the well may take about 2 to 3 hours to evacuate a standard 3 casing volumes for sampling. During pumping, physical water properties such as temperature, pH, specific conductance (SC), dissolved oxygen (DO), and oxidation-reduction potential (ORP or eH) should be measured, preferably using a flow-through cell such as those made by Horiba or YSI. Pumping should continue (potentially beyond 2 to 3 hours) until the physical parameter values stabilize. Samples should be drawn and sent to a state certified laboratory to be analyzed for the following parameters:
• Inorganic contaminants (IOC) drinking water suite;
• Major cations and anions (Ca, Mg, Na, K, SO4, HCO3, Cl)
• Measures of organic carbon: TOC, BOD, CBOD
• Detectable metals such as Fe, Mn, As (also included on IOC list) and other metals on the Safe Drinking Water Act list.
We recommend that the sampling be performed as late as possible while still fulfilling the need for water-quality characterization. This will allow remaining water injected in the aquifer during drilling to dissipate more fully prior to drawing as sample.
4.3 Water-Level Monitoring Water levels in Well DW-1 should be measured on a regular basis to observe short-term and seasonal variations in groundwater level. Optimally, the well could be fitted with a pressure transducer for at least several months so short-term variations can be observed (e.g., barometric efficiency, tidal influences, etc.). After this time, weekly or bi-weekly water-level measurements will be sufficient to capture seasonal variations over the first year of monitoring. After the first year, review of the data may suggest that monthly measurements may be sufficient to capture seasonal and long-term trends. Along with gaining information about water-level variations in the deep completion aquifer, it is highly desirable to gather information about the hydraulic connections among the deep completion aquifer, the intermediate aquifer, and the shallow surficial aquifer. The degree of connection among aquifers can often be inferred by monitoring all aquifers of interest in nearby wells. To meet this goal, we recommend either: 1) installation of a dual completion monitoring well in the shallow and intermediate aquifers, or 2) installation of a test well in the middle aquifer and a piezometer in the shallow aquifer. If a dual completion monitoring well is used, the well could be designed so that a small-diameter (e.g., 1-inch) piezometer is set in the shallow aquifer, and only one piece of casing need penetrate the aquitard between the shallow and intermediate aquifers (thus permitting a good seal between the aquifers). Based on Ecology’s

CHIMACUM VALLEY DEEP WELL 14 NOVEMBER 7, 2007
well construction standards (Chapter 173-160 WAC), a variance would be needed for a dual completion design. Once nearby monitoring points are installed in the middle and shallow aquifers, all three wells should be instrumented with pressure transducers to obtain an overlapping period of high-resolution water-level data. Short-term variations recorded with this technique may yield information about how a variety of stresses (such as rainfall events, variations in Chimacum Creek stage, variations in pumping, barometric and tidal variations) affect and are transmitted among all three aquifers. Given the larger variety of short-term events likely to influence the shallow and intermediate aquifers, a 6- to 12-month period of transducer monitoring is recommended. Based on review of the transducer data, a lower-resolution (possibly manual measurement) monitoring regime may be developed.
5.0 REFERENCES CH2M Hill. 1996. Tri-Area ground-water study, summary report: Port Townsend, Washington,
CH2M Hill, prepared for the City of Port Townsend, September 3, 1996. Available from Public Utility #1 of Jefferson County.
Schasse, H. W. and S. L. Slaughter. 2005. Geologic map of the Port Townsend South and part of the
Port Townsend North 7.5-minute quadrangles, Jefferson County, Washington. Washington Division of Geology and Earth Resources Geologic map 57, 1 sheet, scale 1:24,000.
Simonds, William, C. I. Longpre and G. B. Justin. 2004. Ground-water system in the Chimacum
Creek Basin and surface water/ground water interaction in Chimacum and Tarboo Creeks and the Big and Little Quilcene Rivers, eastern Jefferson County, Washington. U.S. Geological Survey Scientific Investigations Report 2004-5058, 49 p. (http://pubs.water.usgs.gov/sir2004-5058)
Thorson, R. M. 1980. Ice-sheet glaciation of the Puget Lowland, Washington, during the Vashon
Stade (late Pleistocene). Quaternary Research, Volume 13, pp. 303-321.

Figures

JeffersonCounty
InternationalAirport
Irondale
Discovery Bay
Port Townsend Bay
Oak BayKilisut Harbor
Chimacum
Valley
West Valley
PortHadlock
FourCorners
Indian IslandAdelmaBeach
Chimacum Creek
Marrow
stone
Island
A'
A
AndersonLake
GibbsLake
SparlingWell
WellFC-1
Well DW-1
BrBr
Br
Br
Br
Br
Br
Br
Br
Br
Br
Br
Br
Br
Br
Br
BrBrBr
Br
Qvr
Qvt
Qvt
Qvt
Qa
Qvt
Qva
Qvt
Qva
Qvr
Qgo
Qva
Qva
Qvt
Qvt
Qgo
Qvt
Qvt
Qvr
Qvr
Qva
Qvt
Qvr
Qa
Qva
QvrQva
Qvt
Qa
Qgo
Qa
Qa
Qa
Qva
Qa
Qa
Qa
Qa
Qa
Qvr
Qva
Qa
Qvr
Qvt
Qa
Qa
Qa
9
4 32 6
11
24
13
20 21
12
14
29
22
15
10
33
28
23
34
16
8
30
27
31
29 28 27 26
1919
25
21
30
30
20
17
19
1
30
5
32
18
8
2
5
12
7
1922
25
13
20
7
24
1
24
36
24
1
35
29
35
25
7
26
6
31
32
18
1
29
6
19
36
7
36
18
25
35
5
20
0 1Miles
FIGURE 1
PUD #1 of Jefferson CountyChimacum Deep Well
SURFICIAL GEOLOGY ANDCROSS SECTION TRACES
Cross Section Wells
Cross Sections
Sections
Roads
Rivers
USGS Surficial Geology
Qa - Recient Alluvium
Qvr - Vashon Recessional Outwash
Qvt - Vashon Lodgement Till
Qva - Vashon Advance Outwash
Qgo - Older Glacier Deposits
Br - Bedrock
K:\P
eter
\JC
-PU
D\G
IS\m
xd\D
eepW
ell\F
ig_1
_Sur
ficia
lGeo
logy
.mxd
- 11
/200
7


CHIMACUM VALLEY DEEP WELL A-1 NOVEMBER 7, 2007
Appendix A:
Photographs from Well Drilling

CHIMACUM VALLEY DEEP WELL A-2 NOVEMBER 7, 2007
Photograph 1 – Glacial Till Between 51 and 54 feet bls
Photograph 2 – Organic Fibers at 116 feet bls

CHIMACUM VALLEY DEEP WELL A-3 NOVEMBER 7, 2007
Photograph 3 – Vivianite at 148 feet bls

CHIMACUM VALLEY DEEP WELL A-4 NOVEMBER 7, 2007
Photograph 4 – Pelecypod at 253 feet bls

CHIMACUM VALLEY DEEP WELL A-5 NOVEMBER 7, 2007
Photograph 5 – Sand and Gravel between 597 and 614.5 feet bls
Photograph 6 – Logging Core