Embed Size (px)
Citation preview
Research ArticleHydrogeochemical Characteristics and Water–RockInteractions of Coalbed-Produced Water Derived from the DafosiBiogenic Gas Field in the Southern Margin of Ordos Basin, China
Yuan Bao ,1,2 Chao An,1 Chaoyong Wang ,2 Chen Guo,1 and Wenbo Wang1
1Geological Research Institute for Coal Green Mining, College of Geology and Environment, Xi’an University of Scienceand Technology, Xi’an 710054, China2Key Laboratory of CBM Resource and Reservoir Formation Process, Ministry of Education, School of Resources and Geosciences,China University of Mining and Technology, Xuzhou 221008, China
Correspondence should be addressed to Yuan Bao; [email protected] and Chaoyong Wang; [email protected]
Received 12 April 2021; Accepted 21 May 2021; Published 8 June 2021
Academic Editor: Yanjun Meng
Copyright © 2021 Yuan Bao et al. This is an open access article distributed under the Creative Commons Attribution License, whichpermits unrestricted use, distribution, and reproduction in any medium, provided the original work is properly cited.
The hydrogeochemical characteristics of coalbed-produced water can provide insights into the sources of ions and water, thegroundwater environments, hydrodynamic conditions, and water-rock interactions of depositional basins. To study the water-rock reaction process and reveal whether there is a microbial activity in the groundwater, a case of the Dafosi biogenic gas fieldwas chosen by testing the ionic concentrations and hydrogen and oxygen isotopic compositions of coalbed-produced water andemploying R-type cluster and principal component analyses. The results showed that Na+, Cl−, and HCO3
- are the principalions in the coalbed-produced water, while the water type is mainly a Na–Cl. Due to the hydrolysis of HCO3
-, the pH in thisregion was controlled primarily by HCO3
-. As the main cation in water, Na+ contributed substantially to the total dissolvedsolids. Na+ is also related to the exchange between rock-bound Na+ and Ca2+ and Mg2+ in water or surrounding rocks. Thecoalbed-produced water’s oxygen isotopes displayed a characteristic 18O drift and enrichment, indicating that the 16O isotope inthe water was preferentially exchanged with the coal organic matter. Early evaporation is also contributed to the enrichment ofTDS (total dissolved solids) and 18O in the water. The central part of the study area, including the Qijia anticline, was affectedby the Yanshanian uplift and denudation and subsequently developed a water-conducting fissure zone and was rechargedatmospheric precipitation; these conditions were conducive to the formation of secondary biogenic gas.
1. Introduction
Coalbed methane (CBM), as a cleaner unconventional natu-ral gas resource [1–3], has been widely prioritized develop-ment in major coal-producing countries (e.g., China, theUnited States, Canada, and Australia) [4–6]. The UnitedStates was the first to begin commercially developing CBM;China, Canada, and Australia are also entering the initialindustrial CBM development stages [7]. In the mining ofCBM, it is necessary to desorb the gas from the coal poresvia drainage and reductions in pressure, which results inthe discharge of coalbed-produced water. Important in thisis that coalbed-produced water contains abundant geologicalinformation, which can positively impact CBM development.
Understanding the storage, migration, and development ofCBM by identifying trends across strata and analyzing thewater sources is of great value. Thus, in recent years, the geo-chemical characteristics of water produced from coalbedhave attracted extensive attention worldwide [8–11].
Since Craig [12] first proposed the linear relationshipbetween the hydrogen and oxygen isotopes in global precip-itation (δD = 8δ18O + 10) as the global meteoric water line(GMWL), hydrogen and oxygen isotopic compositions havebeen widely used in hydrogeochemical research [13], primar-ily to determine the sources of water and the types of andmechanisms underlying water-rock interactions [14, 15].The main types of water-rock interactions include ionexchange, calcite and dolomite precipitation, and the
HindawiGeofluidsVolume 2021, Article ID 5972497, 13 pageshttps://doi.org/10.1155/2021/5972497
dissolution of silicates, gypsum, CO2, and evaporites [16–18].Guo et al. [8] found that coalbed-produced waters in theBide-Santang basin of western Guizhou exhibit a D driftindicative of hydrogen content in the coalbed that is higherthan that of oxygen and established a template for identifyingwater sources. Wu et al. [19] analyzed the hydrogen and oxy-gen isotopes of the water produced by CBM wells. Theyshowed that it was mainly derived from atmospheric precip-itation (i.e., meteoric water) and was subject to water-rockinteractions and evaporation.
Various statistical methods (e.g., cluster analysis [20],canonical analysis [21], discriminant analysis [22], and prin-cipal component analysis [9, 23]) have been adopted to studythe relationships among groundwater ion concentrations,total dissolved solids (TDS), and pH. Chemical changes thatcontrol coalbed-produced water have also been widely usedfor inference in different basins [24–26]. For example, Zhanget al. [9] studied the relationship between ions and suggestedthat the Na+ and HCO3
- concentrations in the Qinshui basinmight be related to ion exchange and silicate weathering. Liet al. [21] analyzed the relationship between anions and cat-ions in the Guohua phosphate mine of Guizhou provinceusing cluster analysis. They asserted that natural effects, suchas carbonate dissolution and rock weathering, were the mainmechanisms affecting the mine’s water chemistry. Redwanet al. [26] also studied the influence of the chemical charac-teristics of the water and water-rock interactions on thechemical elements of coal-bearing rocks and combined sta-tistical methods to identify and evaluate water-rock reactionprocess. Thus, it has been demonstrated that analyses of therelationships between different ions in water can reveal thetypes of water-rock interactions occurring in a basin andthe ion exchange processes. It is essential for exploring theprimary ion sources of groundwater and CBM storage andmigration.
The Dafosi gas field is located in the Binchang miningarea of the Huanglong coal field along the Ordos basin’ssouthern margin. The development potential of CBMresources is enormous, and its gas origin is biogenic gas[27]. Much research has been conducted on the occur-rence and exploitation of CBM in this area. For example,favorable areas of CBM prospecting were identified byanalyzing the thickness of coalbeds, hydrogeological condi-tions, CBM content, apex, and floor characteristics [28].Ma et al. [2] stated that CO2-enhanced coalbed methanetechnologies are feasible and improve the recovery ofCBM, while Lin et al. [29] studied the pores of Dafosi coalsamples and established a gas drainage model to enhancethe efficiency of CBM drainage. Bao et al. [27] analyzedthe genetic types and distributions of gas in this areabased on gas and stable isotope data, recognizing thatthe gas is mainly biogenic CBM. However, there are fewstudies focused on the water-rock interaction mechanismof the study area.
The ionic characteristics of coalbed-produced water andthe water sources have an important influence on predictingareas enriched in CBM. Therefore, in this study, we collectednine water samples from different CBM drainage wells in theBinchang mining area of the Dafosi biogenic gas field and
tested their main ionic and hydrogen and oxygen isotopecompositions to analyze the compositional characteristicsof ions, water type, and water source. The correlations amongthe main influencing factors of various hydrochemicalparameters were examined through Pearson correlationanalysis, cluster analysis, and principal component analysis.The ion source and groundwater environment of coalbedgroundwater were also explored. These analyses enabled usto determine the mechanisms underlying the water-rockreaction process and reveal whether there is a microbialactivity in the groundwater if the water comes from meteoricprecipitation.
2. Geological Setting
The stratigraphic sequence in the study area is as follows:Upper Triassic Hujiacun Formation (T3h), Lower JurassicFuxian Fm. (J1f), Middle Jurassic Yan’an Fm. (J2y), ZhiluoFm. (J2z), Anding Fm. (J2a), Lower Cretaceous Yijun Fm.(K1y), Luohe Fm. (K1l), Huachi Fm. (K1h), Neogene (N),and Quaternary (Q). The principal aquifer of the K1l isrecharged by Quaternary phreatic water and surface waterinfiltration. Although the mudstone layer of the K1h causesvertical recharge to be very weak, the K1h is missing in someareas, which provides the conditions necessary for the infil-tration of water into the Luohe Fm. The site is rich in coalresources, the surface is covered by loess spanning a largearea, and the strata are relatively flat. The deep Jurassic hasa monoclinic structure with an N60°–70° E strick and anNW–NNW tendency inherited from the Triassic basement.
The Ordos basin, in which the study area is located, isvast and complex. It may be divided into five water-bearingsystems according to their hydrogeological structures andwater-bearing media types [30]. These systems are the Cam-brian-Ordovician, Cretaceous, Carboniferous-Jurassic, Cai-nozoic, and bedrock water systems (Figure 1(a)). TheDafosi gas field is located in the southern Binchang miningarea of the Ordos basin (Figure 1(b)) and belongs to a Creta-ceous clastic fissure-pore aquifer system.
The only coal-bearing strata in the Dafosi biogenic gasfield is the Jurassic Yan’an Fm. The thickness of the strataranges ~40.05–168.57m (average: 75.57m). There are unsta-ble, thickly bedded sandstones at the bottom, limestoneintercalated thick coalbeds in the lower layers, andmedium-fine-grained sandstones in the middle. Sandstonesand mudstones are interbedded with thin coalbeds, and theupper sandstones and mudstones interbedded with coal con-tain many plant fossils. The main coalbeds are nos. 4 and4upper coals, with the 4upper coal being a bifurcated coalbedof the no. 4 coal, of which the average coal thickness is17m, meaning that it is the most mineable. The averagethickness of the no. 4 coal is 11.6m, and it is a mineablecoalbed throughout the area. The Dafosi gas field is a specificbiogenic gas mining area based on the gas component and itsstable isotopes analysis [27].
CBM resources are rich in the Dafosi biogenic gas field.The coalbed permeability is 0.11-6.84mD, and the coal struc-ture is primary-cataclastic. Figure 1(c) shows the favorablearea for CBM exploration and development. The fold
2 Geofluids
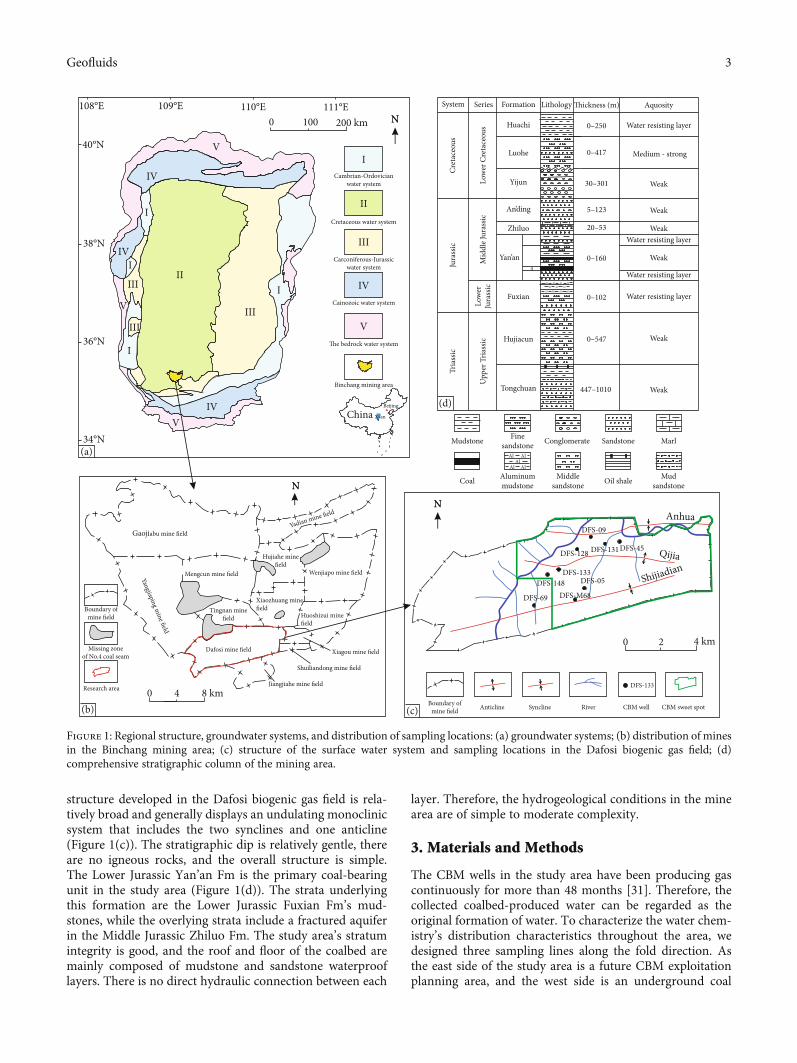
structure developed in the Dafosi biogenic gas field is rela-tively broad and generally displays an undulating monoclinicsystem that includes the two synclines and one anticline(Figure 1(c)). The stratigraphic dip is relatively gentle, thereare no igneous rocks, and the overall structure is simple.The Lower Jurassic Yan’an Fm is the primary coal-bearingunit in the study area (Figure 1(d)). The strata underlyingthis formation are the Lower Jurassic Fuxian Fm’s mud-stones, while the overlying strata include a fractured aquiferin the Middle Jurassic Zhiluo Fm. The study area’s stratumintegrity is good, and the roof and floor of the coalbed aremainly composed of mudstone and sandstone waterprooflayers. There is no direct hydraulic connection between each
layer. Therefore, the hydrogeological conditions in the minearea are of simple to moderate complexity.
3. Materials and Methods
The CBM wells in the study area have been producing gascontinuously for more than 48 months [31]. Therefore, thecollected coalbed-produced water can be regarded as theoriginal formation of water. To characterize the water chem-istry’s distribution characteristics throughout the area, wedesigned three sampling lines along the fold direction. Asthe east side of the study area is a future CBM exploitationplanning area, and the west side is an underground coal
II
IIIVI
V
I
IIV
IV
V
IV
III
III
I
Gaojiabu mine field
Yangjiaping mine field
Yadian mine field
Huoshizui minefield
Wenjiapo mine fieldMengcun mine field
Xiaozhuang minefield
Dafosi mine field
Shuiliandong mine field
Xiagou mine field
Tingnan minefield
Hujiahe minefield
Shijiadian Qijia
Anhua DFS-09
DFS-131DFS-45DFS-128
DFS-69 DFS-M68
DFS-05DFS-148DFS-133
NN
Jiangjiahe mine field
River
DFS-133
CBM well
Conglomerate FinesandstoneMudstone
Coal
Sandstone Marl
AlAl
AlAl
Al
Aluminummudstone Oil shale Mud
sandstoneMiddle
sandstone
0–250
Aquosity
0–417
30–301
Water resisting layer
Weak
Medium - strong
4
5–123
20–53
0–160
0–547
0–102
447–1010
Huachi
Cret
aceo
us
System Series Formation Lithology Thickness (m)
Jura
ssic
Tria
ssic
Low
er C
reta
ceou
sM
iddl
e Jur
assic
Low
erJu
rass
icU
pper
Tria
ssic
Luohe
Yijun
An’ding
Zhiluo
Yan’an
Fuxian
Tongchuan
Hujiacun
Weak
WeakWater resisting layer
Weak
Water resisting layer
Water resisting layer
Weak
Weak
(b)
Cambrian-Ordovicianwater system
Cretaceous water system
Carconiferous-Jurassicwater system
Cainozoic water system
The bedrock water system
II
I
Boundary ofmine field
III
IV
V
Missing zoneof No.4 coal seam
Binchang mining area
Beijing
China Xi’an
0 100 200 km109°E 110°E
40°N
38°N
36°N
34°N
108°E 111°E
4 8 km0
0 2 4 km
(c)
(a)
(d)
NN
Anticline Syncline
NN
Research area
Boundary ofmine field CBM sweet spot
Figure 1: Regional structure, groundwater systems, and distribution of sampling locations: (a) groundwater systems; (b) distribution of minesin the Binchang mining area; (c) structure of the surface water system and sampling locations in the Dafosi biogenic gas field; (d)comprehensive stratigraphic column of the mining area.
3Geofluids
mining area without CBMwells, our coalbed-produced watersamples were mainly concentrated in the central study area.After sampling, the 10 L buckets were sealed and sent to thelaboratory for testing immediately. The sampling locationsare shown in Figure 1(c).
Ions of K+, Na+, Mg2+, Ca2+, Cl-, and SO42- in coalbed-
produced water were detected by dual system ion chromatog-raphy (ICS-2000, Thermo Fisher Scientific, USA); Fe2+ wasdetected according to the coal industry-standard (MT/T) bycolorimetry; HCO3
-, CO32-, and pH values were detected by
corresponding titration and electrode methods according tothe same standard. The pH was measured using a PP-50-p11 meter (Sartorius, Germany), and a DDSJ-308A conduc-tivity meter (Yantain Stark Instrument, Co., Ltd., China)was employed to measure TDS. The water’s hydrogen andoxygen isotopic compositions were tested by LGR 912-0032liquid water isotope analyzer (Los Gatos Research, USA) atthe key laboratory of water disaster prevention and controlin Shaanxi province. The Vienna standard mean ocean water(V-SMOW) standard was employed for stable isotopic anal-ysis, and the analytical accuracies were δD < ±0:5‰ andδ18O < ±0:2‰, respectively.
4. Results and Discussion
4.1. Ionic Compositions and pH Values. Table 1 shows themain ion contents, pH values, TDS, and other basic geo-chemical data of the coalbed-produced water in the Dafosibiogenic gas field. The study area’s pH ranges from 7.7 to9.0 (average: 8.1), showing weak alkalinity. The concentra-tion of TDS ranges from 7601.9 to 16505.6mg/L. The miningarea is relatively enriched in Na+, Cl-, and HCO3
- and poor inCa2+, Mg2+, and SO4
2-. The trends are similar to thoseobserved in previous studies, such as the Zhijin block andDingji coal mine [32, 33]. The order of cation content is asfollows: Na+>Ca2+>Mg2+>K+>NH4
+. Sodium contentsrange from 2968 to 6367.6mg/L and account for >96% ofall cations. The order of anion content is Cl->HCO3
-> -
SO42->NO3
-, in which the Cl- content ranges from 4096.6to 8441.8mg/L and accounts for 60–97% of all anions.
The lowest HCO3- concentration was 285.5mg/L, and
the highest was 4092.2mg/L, accounting for 3–40% of allanions. The difference in the HCO3
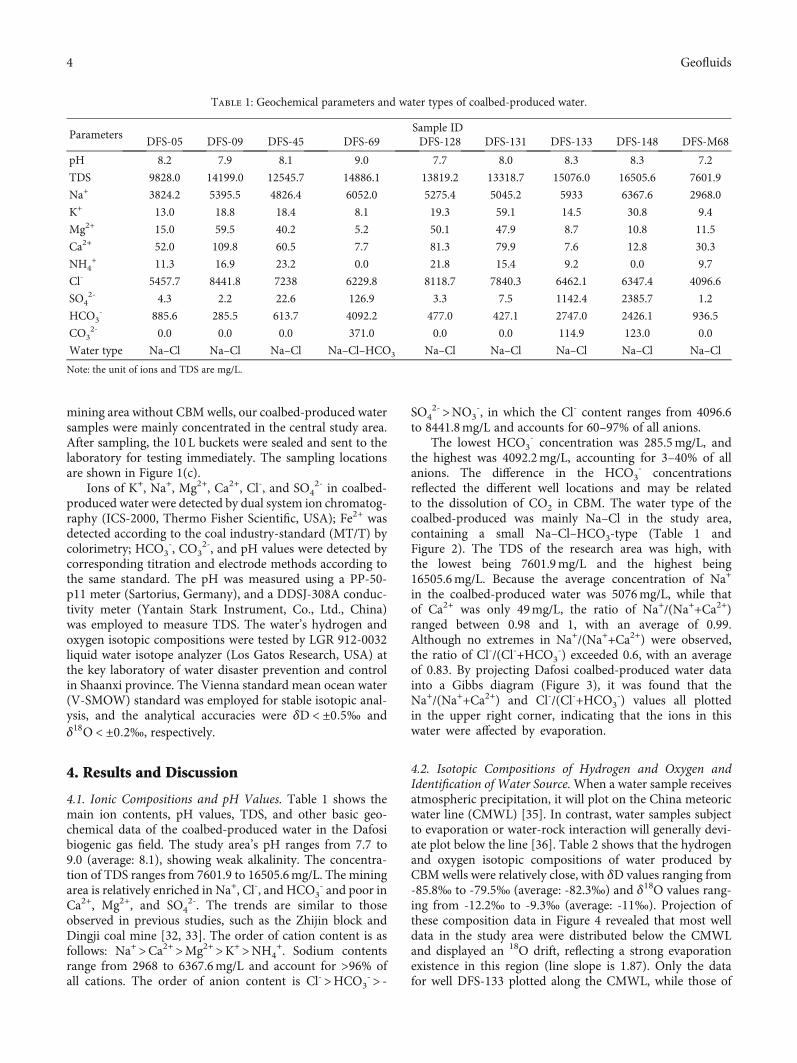
- concentrationsreflected the different well locations and may be relatedto the dissolution of CO2 in CBM. The water type of thecoalbed-produced was mainly Na–Cl in the study area,containing a small Na–Cl–HCO3-type (Table 1 andFigure 2). The TDS of the research area was high, withthe lowest being 7601.9mg/L and the highest being16505.6mg/L. Because the average concentration of Na+
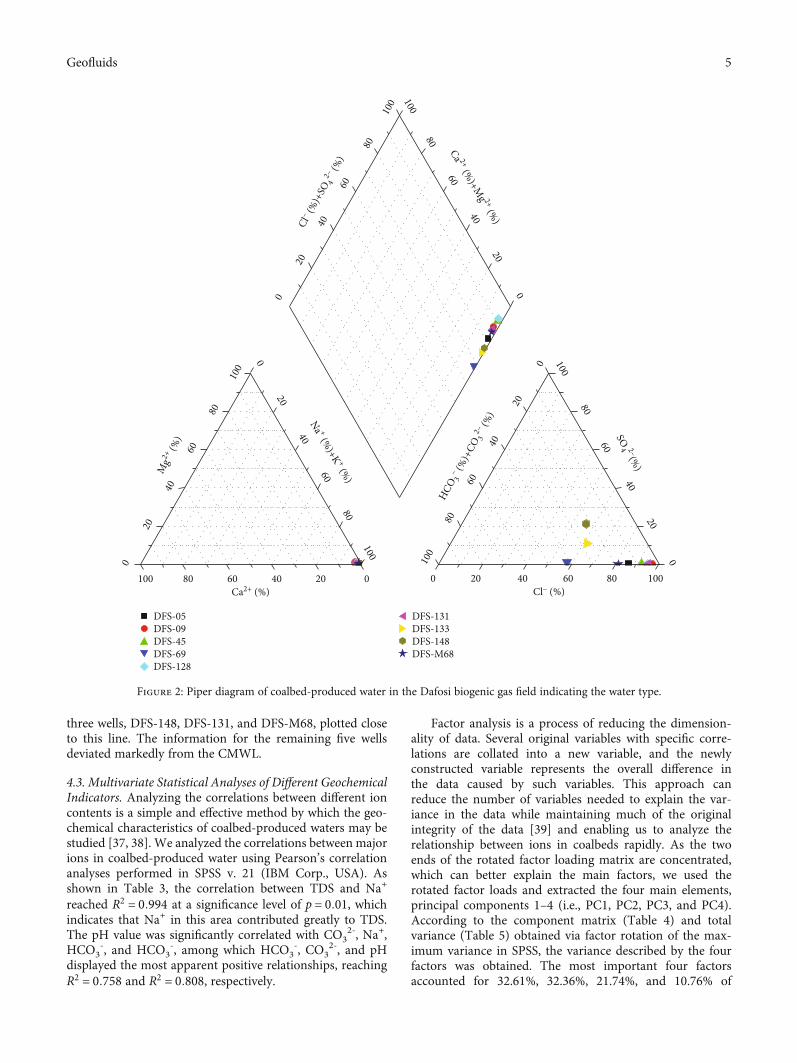
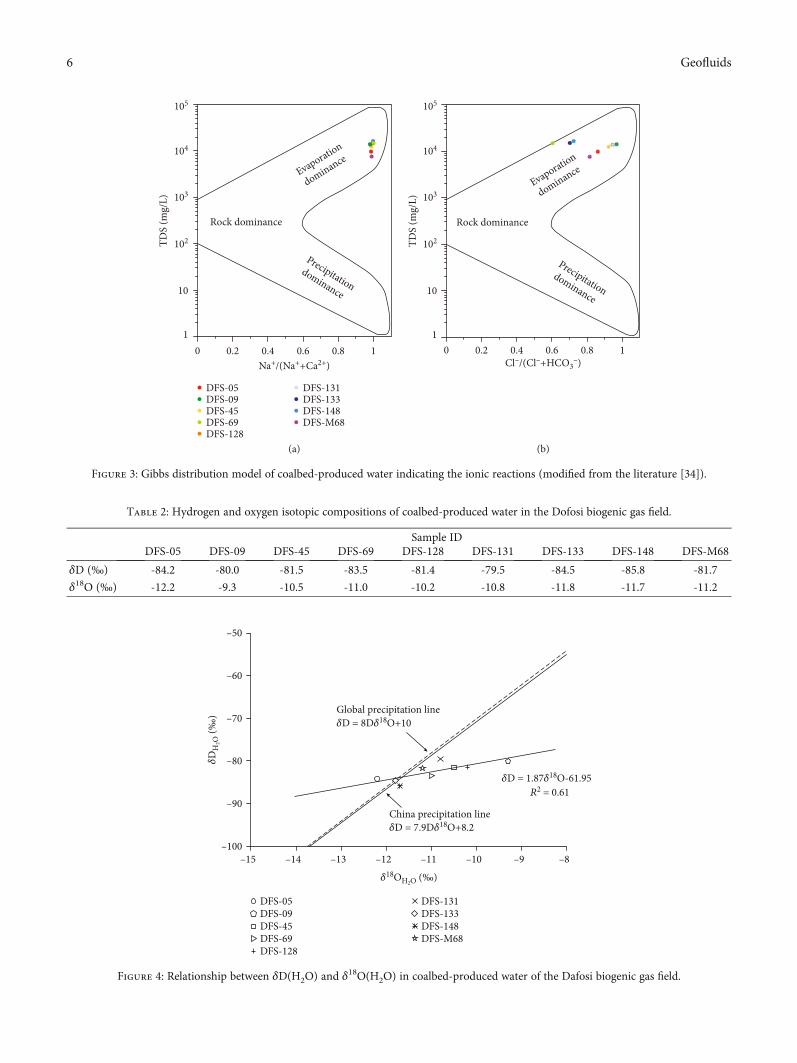
in the coalbed-produced water was 5076mg/L, while thatof Ca2+ was only 49mg/L, the ratio of Na+/(Na++Ca2+)ranged between 0.98 and 1, with an average of 0.99.Although no extremes in Na+/(Na++Ca2+) were observed,the ratio of Cl-/(Cl-+HCO3
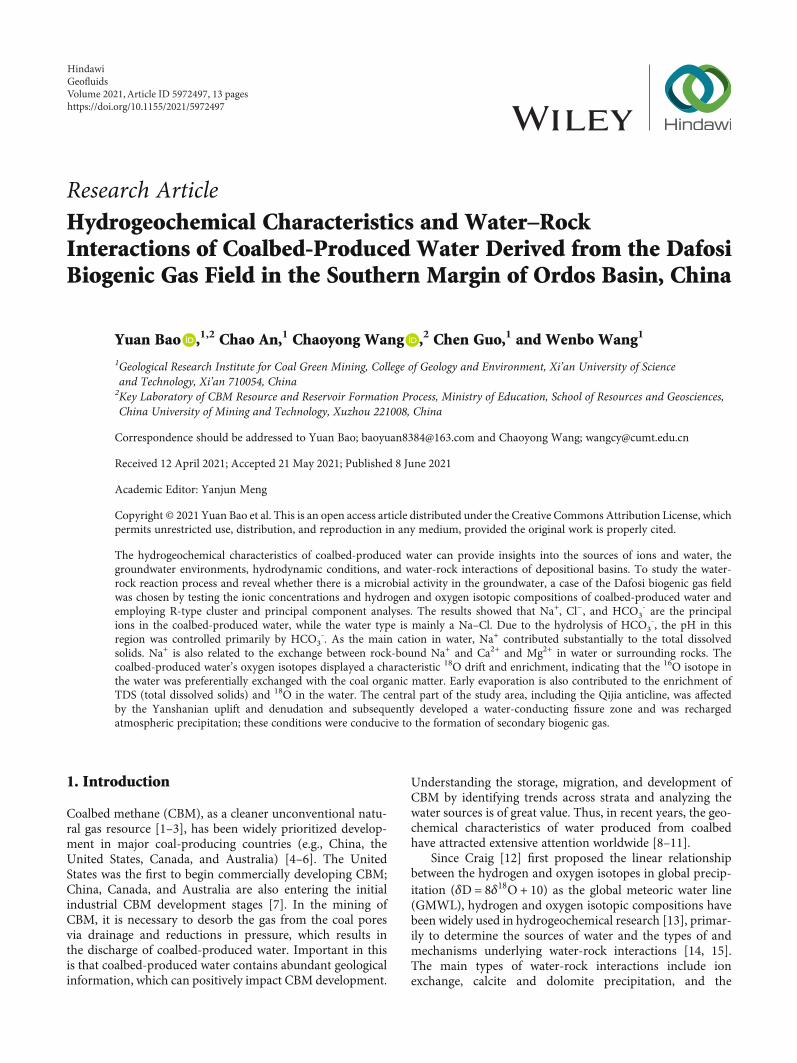
-) exceeded 0.6, with an averageof 0.83. By projecting Dafosi coalbed-produced water datainto a Gibbs diagram (Figure 3), it was found that theNa+/(Na++Ca2+) and Cl-/(Cl-+HCO3
-) values all plottedin the upper right corner, indicating that the ions in thiswater were affected by evaporation.
4.2. Isotopic Compositions of Hydrogen and Oxygen andIdentification of Water Source.When a water sample receivesatmospheric precipitation, it will plot on the China meteoricwater line (CMWL) [35]. In contrast, water samples subjectto evaporation or water-rock interaction will generally devi-ate plot below the line [36]. Table 2 shows that the hydrogenand oxygen isotopic compositions of water produced byCBM wells were relatively close, with δD values ranging from-85.8‰ to -79.5‰ (average: -82.3‰) and δ18O values rang-ing from -12.2‰ to -9.3‰ (average: -11‰). Projection ofthese composition data in Figure 4 revealed that most welldata in the study area were distributed below the CMWLand displayed an 18O drift, reflecting a strong evaporationexistence in this region (line slope is 1.87). Only the datafor well DFS-133 plotted along the CMWL, while those of
Table 1: Geochemical parameters and water types of coalbed-produced water.
ParametersSample ID
DFS-05 DFS-09 DFS-45 DFS-69 DFS-128 DFS-131 DFS-133 DFS-148 DFS-M68
pH 8.2 7.9 8.1 9.0 7.7 8.0 8.3 8.3 7.2
TDS 9828.0 14199.0 12545.7 14886.1 13819.2 13318.7 15076.0 16505.6 7601.9
Na+ 3824.2 5395.5 4826.4 6052.0 5275.4 5045.2 5933 6367.6 2968.0
K+ 13.0 18.8 18.4 8.1 19.3 59.1 14.5 30.8 9.4
Mg2+ 15.0 59.5 40.2 5.2 50.1 47.9 8.7 10.8 11.5
Ca2+ 52.0 109.8 60.5 7.7 81.3 79.9 7.6 12.8 30.3
NH4+ 11.3 16.9 23.2 0.0 21.8 15.4 9.2 0.0 9.7
Cl- 5457.7 8441.8 7238 6229.8 8118.7 7840.3 6462.1 6347.4 4096.6
SO42- 4.3 2.2 22.6 126.9 3.3 7.5 1142.4 2385.7 1.2
HCO3- 885.6 285.5 613.7 4092.2 477.0 427.1 2747.0 2426.1 936.5
CO32- 0.0 0.0 0.0 371.0 0.0 0.0 114.9 123.0 0.0
Water type Na–Cl Na–Cl Na–Cl Na–Cl–HCO3 Na–Cl Na–Cl Na–Cl Na–Cl Na–Cl
Note: the unit of ions and TDS are mg/L.
4 Geofluids
three wells, DFS-148, DFS-131, and DFS-M68, plotted closeto this line. The information for the remaining five wellsdeviated markedly from the CMWL.
4.3. Multivariate Statistical Analyses of Different GeochemicalIndicators. Analyzing the correlations between different ioncontents is a simple and effective method by which the geo-chemical characteristics of coalbed-produced waters may bestudied [37, 38]. We analyzed the correlations between majorions in coalbed-produced water using Pearson’s correlationanalyses performed in SPSS v. 21 (IBM Corp., USA). Asshown in Table 3, the correlation between TDS and Na+
reached R2 = 0:994 at a significance level of p = 0:01, whichindicates that Na+ in this area contributed greatly to TDS.The pH value was significantly correlated with CO3
2-, Na+,HCO3
-, and HCO3-, among which HCO3
-, CO32-, and pH
displayed the most apparent positive relationships, reachingR2 = 0:758 and R2 = 0:808, respectively.
Factor analysis is a process of reducing the dimension-ality of data. Several original variables with specific corre-lations are collated into a new variable, and the newlyconstructed variable represents the overall difference inthe data caused by such variables. This approach canreduce the number of variables needed to explain the var-iance in the data while maintaining much of the originalintegrity of the data [39] and enabling us to analyze therelationship between ions in coalbeds rapidly. As the twoends of the rotated factor loading matrix are concentrated,which can better explain the main factors, we used therotated factor loads and extracted the four main elements,principal components 1–4 (i.e., PC1, PC2, PC3, and PC4).According to the component matrix (Table 4) and totalvariance (Table 5) obtained via factor rotation of the max-imum variance in SPSS, the variance described by the fourfactors was obtained. The most important four factorsaccounted for 32.61%, 32.36%, 21.74%, and 10.76% of
100
80
60
40
20
0
10080
60
40
20
0
Cl– (%
)+SO
42– (%
)Ca 2+ (%)+M
g 2+ (%)
020406080100
0
20
40
60
80
100
0
20
40
60
80
100
0 20 40 60 80 100
0
20
40
60
80
1000
20
40
60
80
100
SO4 2–(%)
HCO3
– (%)+
CO3
2– (%)
Cl– (%)
Mg2
+ (%)
Ca2+ (%)
Na + (%)+K + (%)
DFS-09DFS-05
DFS-45
DFS-128DFS-69 DFS-M68
DFS-131
DFS-148DFS-133
Figure 2: Piper diagram of coalbed-produced water in the Dafosi biogenic gas field indicating the water type.
5Geofluids
Na+/(Na++Ca2+)
TDS
(mg/
L)
Precipitationdominance
Evaporation
dominance
Rock dominance
0.2 0.4 0.6 0.8 10
10
102
103
104
105
1
DFS-09DFS-05
DFS-45
DFS-128DFS-69 DFS-M68
DFS-131
DFS-148DFS-133
Cl–/(Cl–+HCO3–)
TDS
(mg/
L)
Precipitationdominance
Evaporation
dominance
Rock dominance
0.2 0.4 0.6 0.8 10
10
102
103
104
105
1
(a) (b)
Figure 3: Gibbs distribution model of coalbed-produced water indicating the ionic reactions (modified from the literature [34]).
Table 2: Hydrogen and oxygen isotopic compositions of coalbed-produced water in the Dofosi biogenic gas field.
Sample IDDFS-05 DFS-09 DFS-45 DFS-69 DFS-128 DFS-131 DFS-133 DFS-148 DFS-M68
δD (‰) -84.2 -80.0 -81.5 -83.5 -81.4 -79.5 -84.5 -85.8 -81.7
δ18O (‰) -12.2 -9.3 -10.5 -11.0 -10.2 -10.8 -11.8 -11.7 -11.2
𝛿18OH2O (‰)
𝛿D
H2O
(‰)
–50
–15 –14 –13 –12 –11 –10 –9 –8
–90
–100
–80
–70
–60
DFS-05DFS-09DFS-45DFS-69DFS-128
DFS-131DFS-133DFS-148DFS-M68
China precipitation line𝛿D = 7.9D𝛿18O+8.2
Global precipitation line𝛿D = 8D𝛿18O+10
𝛿D = 1.87𝛿18O-61.95R2 = 0.61
Figure 4: Relationship between δD(H2O) and δ18O(H2O) in coalbed-produced water of the Dafosi biogenic gas field.
6 Geofluids
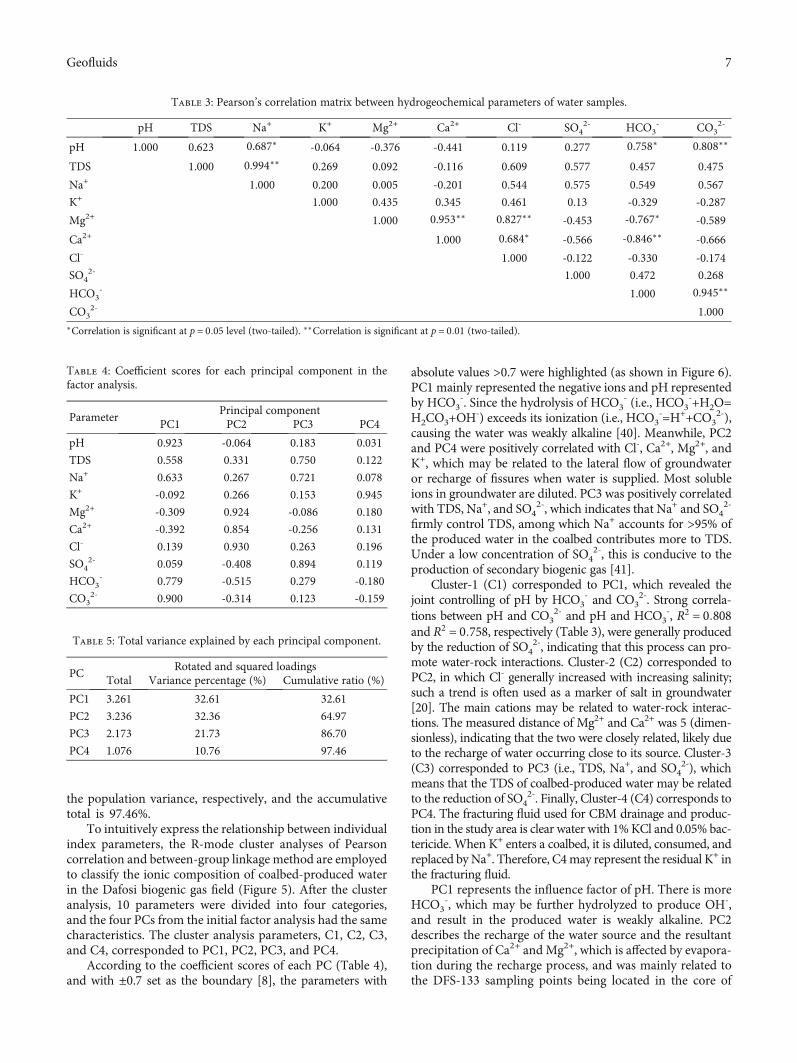
the population variance, respectively, and the accumulativetotal is 97.46%.
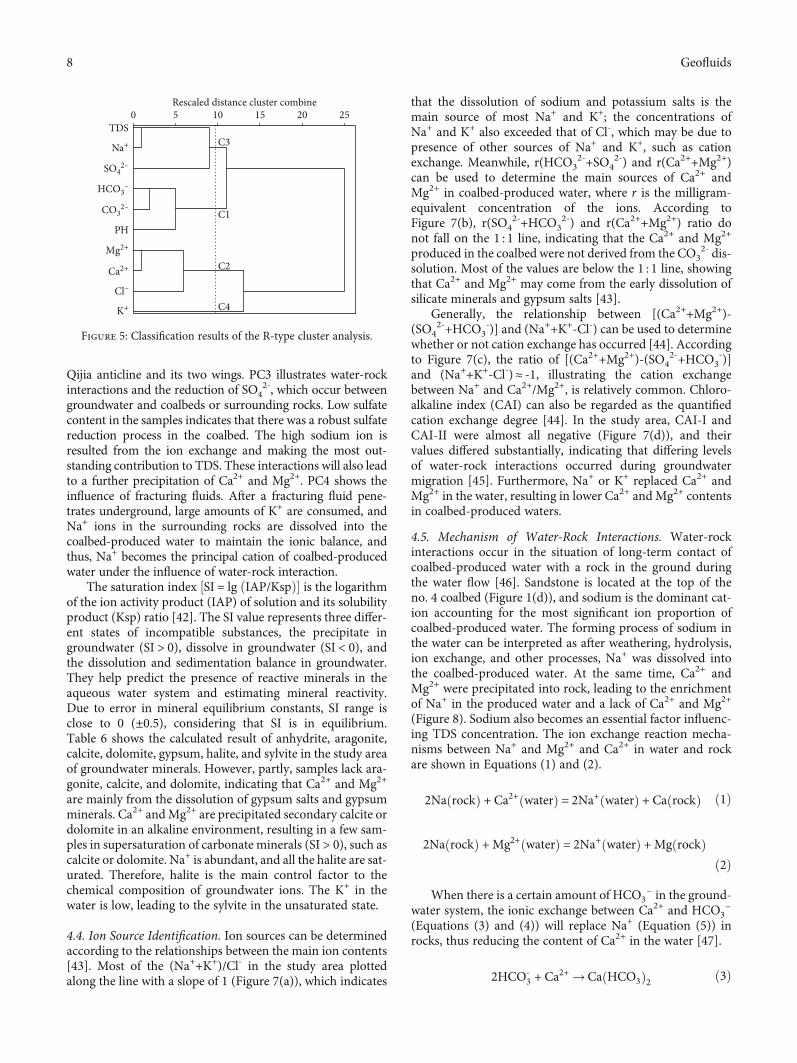
To intuitively express the relationship between individualindex parameters, the R-mode cluster analyses of Pearsoncorrelation and between-group linkage method are employedto classify the ionic composition of coalbed-produced waterin the Dafosi biogenic gas field (Figure 5). After the clusteranalysis, 10 parameters were divided into four categories,and the four PCs from the initial factor analysis had the samecharacteristics. The cluster analysis parameters, C1, C2, C3,and C4, corresponded to PC1, PC2, PC3, and PC4.
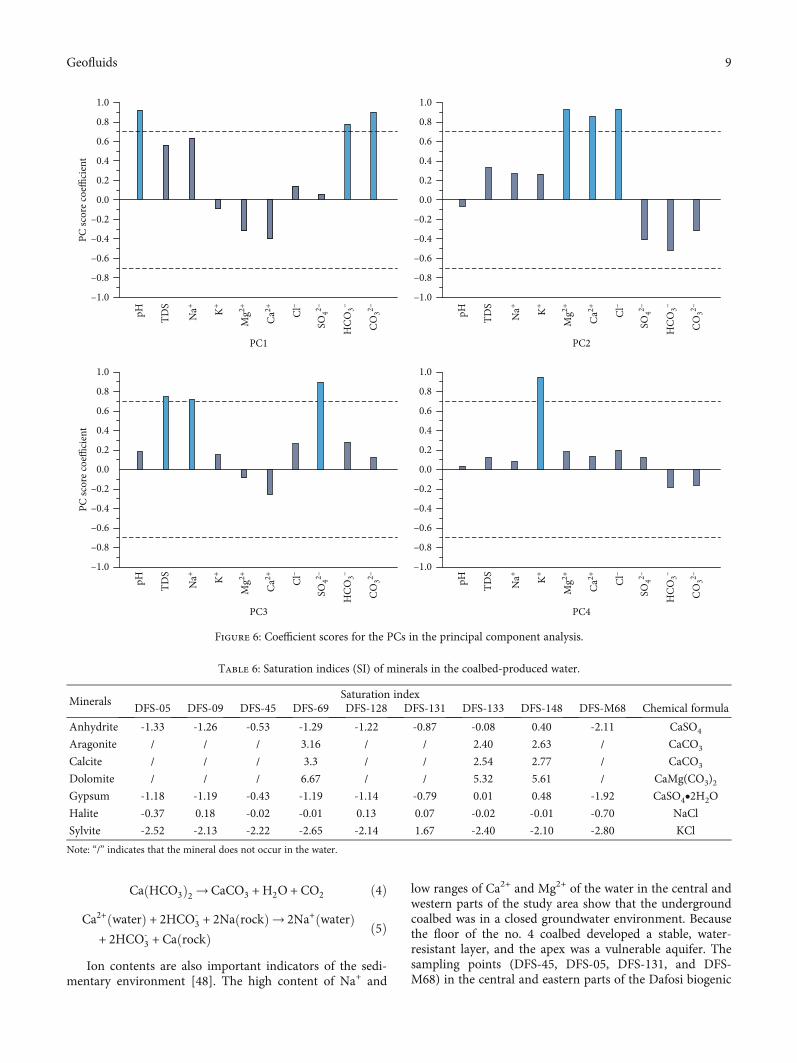
According to the coefficient scores of each PC (Table 4),and with ±0.7 set as the boundary [8], the parameters with
absolute values >0.7 were highlighted (as shown in Figure 6).PC1 mainly represented the negative ions and pH representedby HCO3
-. Since the hydrolysis of HCO3- (i.e., HCO3
-+H2O=H2CO3+OH
-) exceeds its ionization (i.e., HCO3-=H++CO3
2-),causing the water was weakly alkaline [40]. Meanwhile, PC2and PC4 were positively correlated with Cl-, Ca2+, Mg2+, andK+, which may be related to the lateral flow of groundwateror recharge of fissures when water is supplied. Most solubleions in groundwater are diluted. PC3 was positively correlatedwith TDS, Na+, and SO4
2-, which indicates that Na+ and SO42-
firmly control TDS, among which Na+ accounts for >95% ofthe produced water in the coalbed contributes more to TDS.Under a low concentration of SO4
2-, this is conducive to theproduction of secondary biogenic gas [41].
Cluster-1 (C1) corresponded to PC1, which revealed thejoint controlling of pH by HCO3
- and CO32-. Strong correla-
tions between pH and CO32- and pH and HCO3
-, R2 = 0:808and R2 = 0:758, respectively (Table 3), were generally producedby the reduction of SO4
2-, indicating that this process can pro-mote water-rock interactions. Cluster-2 (C2) corresponded toPC2, in which Cl- generally increased with increasing salinity;such a trend is often used as a marker of salt in groundwater[20]. The main cations may be related to water-rock interac-tions. The measured distance of Mg2+ and Ca2+ was 5 (dimen-sionless), indicating that the two were closely related, likely dueto the recharge of water occurring close to its source. Cluster-3(C3) corresponded to PC3 (i.e., TDS, Na+, and SO4
2-), whichmeans that the TDS of coalbed-produced water may be relatedto the reduction of SO4
2-. Finally, Cluster-4 (C4) corresponds toPC4. The fracturing fluid used for CBM drainage and produc-tion in the study area is clear water with 1%KCl and 0.05% bac-tericide. When K+ enters a coalbed, it is diluted, consumed, andreplaced byNa+. Therefore, C4may represent the residual K+ inthe fracturing fluid.
PC1 represents the influence factor of pH. There is moreHCO3
-, which may be further hydrolyzed to produce OH-,and result in the produced water is weakly alkaline. PC2describes the recharge of the water source and the resultantprecipitation of Ca2+ and Mg2+, which is affected by evapora-tion during the recharge process, and was mainly related tothe DFS-133 sampling points being located in the core of
Table 3: Pearson’s correlation matrix between hydrogeochemical parameters of water samples.
pH TDS Na+ K+ Mg2+ Ca2+ Cl- SO42- HCO3
- CO32-
pH 1.000 0.623 0.687∗ -0.064 -0.376 -0.441 0.119 0.277 0.758∗ 0.808∗∗
TDS 1.000 0.994∗∗ 0.269 0.092 -0.116 0.609 0.577 0.457 0.475
Na+ 1.000 0.200 0.005 -0.201 0.544 0.575 0.549 0.567
K+ 1.000 0.435 0.345 0.461 0.13 -0.329 -0.287
Mg2+ 1.000 0.953∗∗ 0.827∗∗ -0.453 -0.767∗ -0.589
Ca2+ 1.000 0.684∗ -0.566 -0.846∗∗ -0.666
Cl- 1.000 -0.122 -0.330 -0.174
SO42- 1.000 0.472 0.268
HCO3- 1.000 0.945∗∗
CO32- 1.000
∗Correlation is significant at p = 0:05 level (two-tailed). ∗∗Correlation is significant at p = 0:01 (two-tailed).
Table 4: Coefficient scores for each principal component in thefactor analysis.
ParameterPrincipal component
PC1 PC2 PC3 PC4
pH 0.923 -0.064 0.183 0.031
TDS 0.558 0.331 0.750 0.122
Na+ 0.633 0.267 0.721 0.078
K+ -0.092 0.266 0.153 0.945
Mg2+ -0.309 0.924 -0.086 0.180
Ca2+ -0.392 0.854 -0.256 0.131
Cl- 0.139 0.930 0.263 0.196
SO42- 0.059 -0.408 0.894 0.119
HCO3- 0.779 -0.515 0.279 -0.180
CO32- 0.900 -0.314 0.123 -0.159
Table 5: Total variance explained by each principal component.
PCRotated and squared loadings
Total Variance percentage (%) Cumulative ratio (%)
PC1 3.261 32.61 32.61
PC2 3.236 32.36 64.97
PC3 2.173 21.73 86.70
PC4 1.076 10.76 97.46
7Geofluids
Qijia anticline and its two wings. PC3 illustrates water-rockinteractions and the reduction of SO4
2-, which occur betweengroundwater and coalbeds or surrounding rocks. Low sulfatecontent in the samples indicates that there was a robust sulfatereduction process in the coalbed. The high sodium ion isresulted from the ion exchange and making the most out-standing contribution to TDS. These interactions will also leadto a further precipitation of Ca2+ and Mg2+. PC4 shows theinfluence of fracturing fluids. After a fracturing fluid pene-trates underground, large amounts of K+ are consumed, andNa+ ions in the surrounding rocks are dissolved into thecoalbed-produced water to maintain the ionic balance, andthus, Na+ becomes the principal cation of coalbed-producedwater under the influence of water-rock interaction.
The saturation index ½SI = lg ðIAP/KspÞ� is the logarithmof the ion activity product (IAP) of solution and its solubilityproduct (Ksp) ratio [42]. The SI value represents three differ-ent states of incompatible substances, the precipitate ingroundwater (SI > 0), dissolve in groundwater (SI < 0), andthe dissolution and sedimentation balance in groundwater.They help predict the presence of reactive minerals in theaqueous water system and estimating mineral reactivity.Due to error in mineral equilibrium constants, SI range isclose to 0 (±0.5), considering that SI is in equilibrium.Table 6 shows the calculated result of anhydrite, aragonite,calcite, dolomite, gypsum, halite, and sylvite in the study areaof groundwater minerals. However, partly, samples lack ara-gonite, calcite, and dolomite, indicating that Ca2+ and Mg2+
are mainly from the dissolution of gypsum salts and gypsumminerals. Ca2+ andMg2+ are precipitated secondary calcite ordolomite in an alkaline environment, resulting in a few sam-ples in supersaturation of carbonate minerals (SI > 0), such ascalcite or dolomite. Na+ is abundant, and all the halite are sat-urated. Therefore, halite is the main control factor to thechemical composition of groundwater ions. The K+ in thewater is low, leading to the sylvite in the unsaturated state.
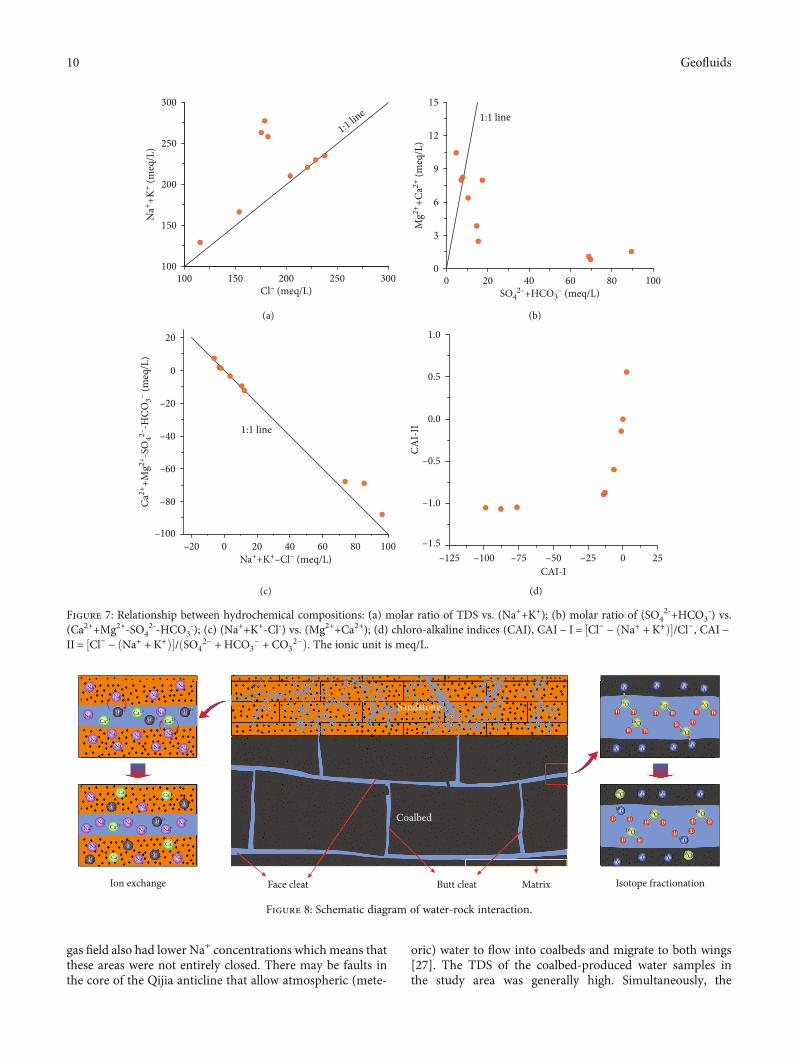
4.4. Ion Source Identification. Ion sources can be determinedaccording to the relationships between the main ion contents[43]. Most of the (Na++K+)/Cl- in the study area plottedalong the line with a slope of 1 (Figure 7(a)), which indicates
that the dissolution of sodium and potassium salts is themain source of most Na+ and K+; the concentrations ofNa+ and K+ also exceeded that of Cl-, which may be due topresence of other sources of Na+ and K+, such as cationexchange. Meanwhile, r(HCO3
2-+SO42-) and r(Ca2++Mg2+)
can be used to determine the main sources of Ca2+ andMg2+ in coalbed-produced water, where r is the milligram-equivalent concentration of the ions. According toFigure 7(b), r(SO4
2-+HCO32-) and r(Ca2++Mg2+) ratio do
not fall on the 1 : 1 line, indicating that the Ca2+ and Mg2+
produced in the coalbed were not derived from the CO32- dis-
solution. Most of the values are below the 1 : 1 line, showingthat Ca2+ and Mg2+ may come from the early dissolution ofsilicate minerals and gypsum salts [43].
Generally, the relationship between [(Ca2++Mg2+)-(SO4
2-+HCO3-)] and (Na++K+-Cl-) can be used to determine
whether or not cation exchange has occurred [44]. Accordingto Figure 7(c), the ratio of [(Ca2++Mg2+)-(SO4
2-+HCO3-)]
and (Na++K+-Cl-)≈ -1, illustrating the cation exchangebetween Na+ and Ca2+/Mg2+, is relatively common. Chloro-alkaline index (CAI) can also be regarded as the quantifiedcation exchange degree [44]. In the study area, CAI-I andCAI-II were almost all negative (Figure 7(d)), and theirvalues differed substantially, indicating that differing levelsof water-rock interactions occurred during groundwatermigration [45]. Furthermore, Na+ or K+ replaced Ca2+ andMg2+ in the water, resulting in lower Ca2+ and Mg2+ contentsin coalbed-produced waters.
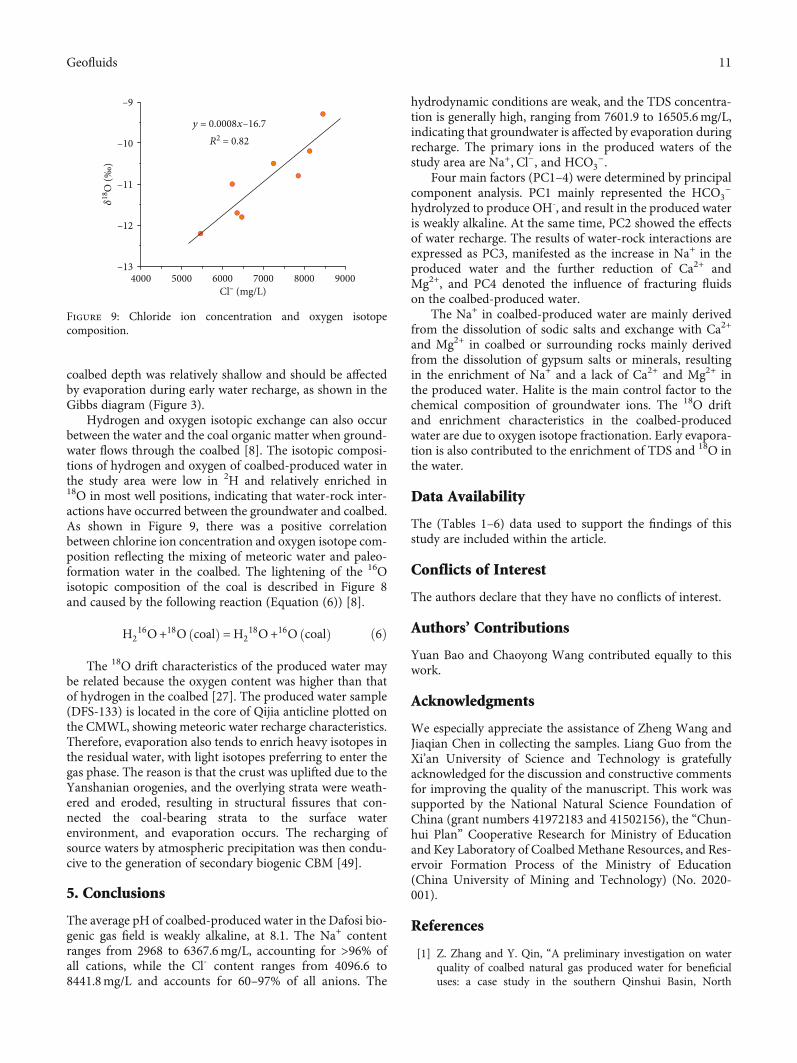
4.5. Mechanism of Water-Rock Interactions. Water-rockinteractions occur in the situation of long-term contact ofcoalbed-produced water with a rock in the ground duringthe water flow [46]. Sandstone is located at the top of theno. 4 coalbed (Figure 1(d)), and sodium is the dominant cat-ion accounting for the most significant ion proportion ofcoalbed-produced water. The forming process of sodium inthe water can be interpreted as after weathering, hydrolysis,ion exchange, and other processes, Na+ was dissolved intothe coalbed-produced water. At the same time, Ca2+ andMg2+ were precipitated into rock, leading to the enrichmentof Na+ in the produced water and a lack of Ca2+ and Mg2+
(Figure 8). Sodium also becomes an essential factor influenc-ing TDS concentration. The ion exchange reaction mecha-nisms between Na+ and Mg2+ and Ca2+ in water and rockare shown in Equations (1) and (2).
2Na rockð Þ + Ca2+ waterð Þ = 2Na+ waterð Þ + Ca rockð Þ ð1Þ
2Na rockð Þ +Mg2+ waterð Þ = 2Na+ waterð Þ +Mg rockð Þð2Þ
When there is a certain amount ofHCO3− in the ground-
water system, the ionic exchange between Ca2+ and HCO3−
(Equations (3) and (4)) will replace Na+ (Equation (5)) inrocks, thus reducing the content of Ca2+ in the water [47].
2HCO‐3 + Ca2+ → Ca HCO3ð Þ2 ð3Þ
TDS
Na+
SO42–
HCO3–
CO32–
PH
Mg2+
Ca2+
Cl–
K+
1550 20 2510Rescaled distance cluster combine
C1
C2
C3
C4
Figure 5: Classification results of the R-type cluster analysis.
8 Geofluids
Ca HCO3ð Þ2 → CaCO3 + H2O + CO2 ð4Þ
Ca2+ waterð Þ + 2HCO‐3 + 2Na rockð Þ→ 2Na+ waterð Þ
+ 2HCO‐3 + Ca rockð Þ ð5Þ
Ion contents are also important indicators of the sedi-mentary environment [48]. The high content of Na+ and
low ranges of Ca2+ and Mg2+ of the water in the central andwestern parts of the study area show that the undergroundcoalbed was in a closed groundwater environment. Becausethe floor of the no. 4 coalbed developed a stable, water-resistant layer, and the apex was a vulnerable aquifer. Thesampling points (DFS-45, DFS-05, DFS-131, and DFS-M68) in the central and eastern parts of the Dafosi biogenic
–0.8
0.2
0.4
0.6
0.8
1.0
–0.2
–0.4
–0.6
–1.0
0.0
PC1
PC sc
ore c
oeffi
cien
t
pH TDS
Na+ K+
Mg2+
Ca2+ Cl
–
SO42–
HCO
3–
CO32–
–0.8
0.2
0.4
0.6
0.8
1.0
–0.2
–0.4
–0.6
–1.0
0.0
PC2
pH TDS
Na+ K+
Mg2+
Ca2+ Cl
–
SO42–
HCO
3–
CO32–
–0.8
0.2
0.4
0.6
0.8
1.0
–0.2
–0.4
–0.6
–1.0
0.0
PC sc
ore c
oeffi
cien
t
PC3
pH TDS
Na+ K+
Mg2+
Ca2+ Cl
–
SO42–
HCO
3–
CO32–
–0.8
0.2
0.4
0.6
0.8
1.0
–0.2
–0.4
–0.6
–1.0
0.0
PC4
pH TDS
Na+ K+
Mg2+
Ca2+ Cl
–
SO42–
HCO
3–
CO32–
Figure 6: Coefficient scores for the PCs in the principal component analysis.
Table 6: Saturation indices (SI) of minerals in the coalbed-produced water.
MineralsSaturation index
DFS-05 DFS-09 DFS-45 DFS-69 DFS-128 DFS-131 DFS-133 DFS-148 DFS-M68 Chemical formula
Anhydrite -1.33 -1.26 -0.53 -1.29 -1.22 -0.87 -0.08 0.40 -2.11 CaSO4
Aragonite / / / 3.16 / / 2.40 2.63 / CaCO3
Calcite / / / 3.3 / / 2.54 2.77 / CaCO3
Dolomite / / / 6.67 / / 5.32 5.61 / CaMg(CO3)2Gypsum -1.18 -1.19 -0.43 -1.19 -1.14 -0.79 0.01 0.48 -1.92 CaSO4•2H2O
Halite -0.37 0.18 -0.02 -0.01 0.13 0.07 -0.02 -0.01 -0.70 NaCl
Sylvite -2.52 -2.13 -2.22 -2.65 -2.14 1.67 -2.40 -2.10 -2.80 KCl
Note: “/” indicates that the mineral does not occur in the water.
9Geofluids
gas field also had lower Na+ concentrations which means thatthese areas were not entirely closed. There may be faults inthe core of the Qijia anticline that allow atmospheric (mete-
oric) water to flow into coalbeds and migrate to both wings[27]. The TDS of the coalbed-produced water samples inthe study area was generally high. Simultaneously, the
Na+ +K
+ (meq
/L)
Cl– (meq/L)100 150 200 250 300
100
150
200
250
300
1:1 line
(a)
SO42–+HCO3
– (meq/L)
Mg2+
+Ca2+
(meq
/L)
0 20 40 60 80 100
3
0
6
9
12
151:1 line
(b)
Na++K+–Cl– (meq/L)
–20
–20 0 20 40 60 80 100–100
–40
–60
–80
20
0
Ca2+
+Mg2+
-SO
42–-H
CO3– (m
eq/L
)
1:1 line
(c)
0.5
–125 –100 –75 –50 –25 0 25–1.5
0.0
–0.5
–1.0
1.0
CAI-
II
CAI-I
(d)
Figure 7: Relationship between hydrochemical compositions: (a) molar ratio of TDS vs. (Na++K+); (b) molar ratio of (SO42-+HCO3
-) vs.(Ca2++Mg2+-SO4
2--HCO3-); (c) (Na++K+-Cl-) vs. (Mg2++Ca2+); (d) chloro-alkaline indices (CAI), CAI − I = ½Cl− − ðNa+ + K+Þ�/Cl−, CAI −
II = ½Cl− − ðNa+ + K+Þ�/ðSO42− + HCO3
− + CO32−Þ. The ionic unit is meq/L.
Coalbed
H H
H H
H H
HH
H H
H H
16O
16O 16O
16O
16O
18O 18O
16O
16O
18O
18O
18O18O 18O
18O
HH
H H
Face cleat MatrixButt cleat
H H
H H
Ion exchange Isotope fractionation
Sandstone
Figure 8: Schematic diagram of water-rock interaction.
10 Geofluids
coalbed depth was relatively shallow and should be affectedby evaporation during early water recharge, as shown in theGibbs diagram (Figure 3).
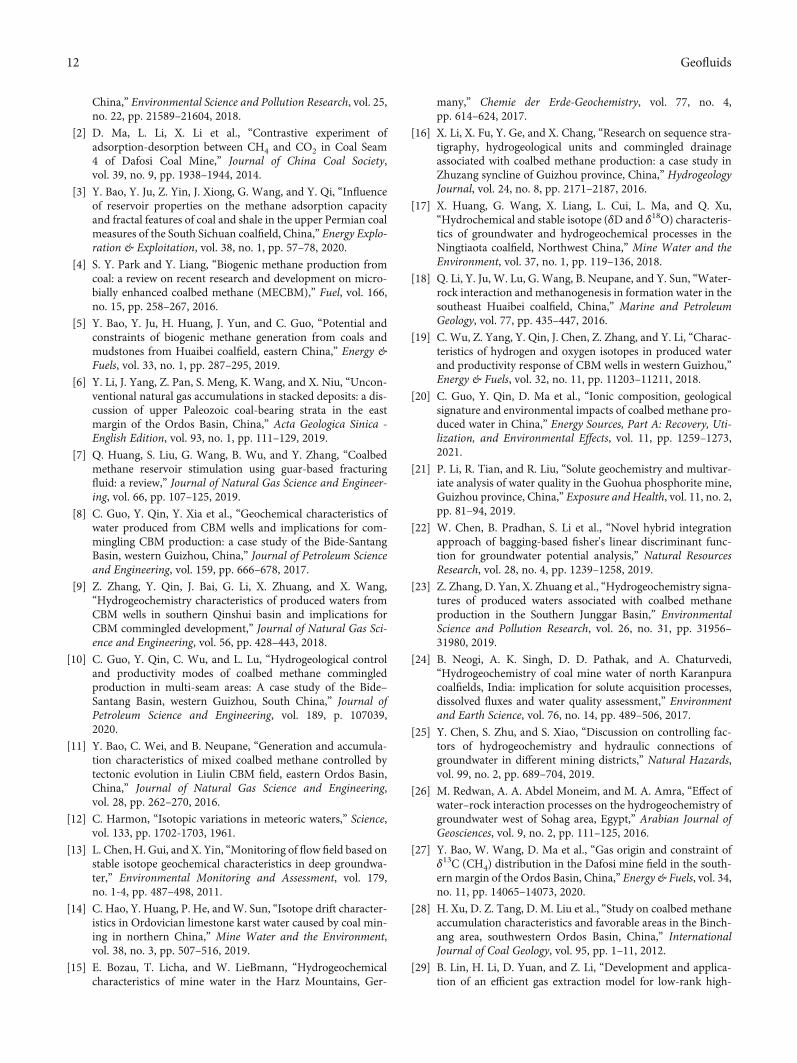
Hydrogen and oxygen isotopic exchange can also occurbetween the water and the coal organic matter when ground-water flows through the coalbed [8]. The isotopic composi-tions of hydrogen and oxygen of coalbed-produced water inthe study area were low in 2H and relatively enriched in18O in most well positions, indicating that water-rock inter-actions have occurred between the groundwater and coalbed.As shown in Figure 9, there was a positive correlationbetween chlorine ion concentration and oxygen isotope com-position reflecting the mixing of meteoric water and paleo-formation water in the coalbed. The lightening of the 16Oisotopic composition of the coal is described in Figure 8and caused by the following reaction (Equation (6)) [8].
H216O+18O coalð Þ =H2
18O+16O coalð Þ ð6Þ
The 18O drift characteristics of the produced water maybe related because the oxygen content was higher than thatof hydrogen in the coalbed [27]. The produced water sample(DFS-133) is located in the core of Qijia anticline plotted onthe CMWL, showing meteoric water recharge characteristics.Therefore, evaporation also tends to enrich heavy isotopes inthe residual water, with light isotopes preferring to enter thegas phase. The reason is that the crust was uplifted due to theYanshanian orogenies, and the overlying strata were weath-ered and eroded, resulting in structural fissures that con-nected the coal-bearing strata to the surface waterenvironment, and evaporation occurs. The recharging ofsource waters by atmospheric precipitation was then condu-cive to the generation of secondary biogenic CBM [49].
5. Conclusions
The average pH of coalbed-produced water in the Dafosi bio-genic gas field is weakly alkaline, at 8.1. The Na+ contentranges from 2968 to 6367.6mg/L, accounting for >96% ofall cations, while the Cl- content ranges from 4096.6 to8441.8mg/L and accounts for 60–97% of all anions. The
hydrodynamic conditions are weak, and the TDS concentra-tion is generally high, ranging from 7601.9 to 16505.6mg/L,indicating that groundwater is affected by evaporation duringrecharge. The primary ions in the produced waters of thestudy area are Na+, Cl−, and HCO3
−.Four main factors (PC1–4) were determined by principal
component analysis. PC1 mainly represented the HCO3−
hydrolyzed to produce OH-, and result in the produced wateris weakly alkaline. At the same time, PC2 showed the effectsof water recharge. The results of water-rock interactions areexpressed as PC3, manifested as the increase in Na+ in theproduced water and the further reduction of Ca2+ andMg2+, and PC4 denoted the influence of fracturing fluidson the coalbed-produced water.
The Na+ in coalbed-produced water are mainly derivedfrom the dissolution of sodic salts and exchange with Ca2+
and Mg2+ in coalbed or surrounding rocks mainly derivedfrom the dissolution of gypsum salts or minerals, resultingin the enrichment of Na+ and a lack of Ca2+ and Mg2+ inthe produced water. Halite is the main control factor to thechemical composition of groundwater ions. The 18O driftand enrichment characteristics in the coalbed-producedwater are due to oxygen isotope fractionation. Early evapora-tion is also contributed to the enrichment of TDS and 18O inthe water.
Data Availability
The (Tables 1–6) data used to support the findings of thisstudy are included within the article.
Conflicts of Interest
The authors declare that they have no conflicts of interest.
Authors’ Contributions
Yuan Bao and Chaoyong Wang contributed equally to thiswork.
Acknowledgments
We especially appreciate the assistance of Zheng Wang andJiaqian Chen in collecting the samples. Liang Guo from theXi’an University of Science and Technology is gratefullyacknowledged for the discussion and constructive commentsfor improving the quality of the manuscript. This work wassupported by the National Natural Science Foundation ofChina (grant numbers 41972183 and 41502156), the “Chun-hui Plan” Cooperative Research for Ministry of Educationand Key Laboratory of CoalbedMethane Resources, and Res-ervoir Formation Process of the Ministry of Education(China University of Mining and Technology) (No. 2020-001).
References
[1] Z. Zhang and Y. Qin, “A preliminary investigation on waterquality of coalbed natural gas produced water for beneficialuses: a case study in the southern Qinshui Basin, North
–12
–11
–10
–9
Cl– (mg/L)
𝛿18
O (‰
)
–134000 5000 6000 7000 8000 9000
y = 0.0008x–16.7R2 = 0.82
Figure 9: Chloride ion concentration and oxygen isotopecomposition.
11Geofluids
China,” Environmental Science and Pollution Research, vol. 25,no. 22, pp. 21589–21604, 2018.
[2] D. Ma, L. Li, X. Li et al., “Contrastive experiment ofadsorption-desorption between CH4 and CO2 in Coal Seam4 of Dafosi Coal Mine,” Journal of China Coal Society,vol. 39, no. 9, pp. 1938–1944, 2014.
[3] Y. Bao, Y. Ju, Z. Yin, J. Xiong, G. Wang, and Y. Qi, “Influenceof reservoir properties on the methane adsorption capacityand fractal features of coal and shale in the upper Permian coalmeasures of the South Sichuan coalfield, China,” Energy Explo-ration & Exploitation, vol. 38, no. 1, pp. 57–78, 2020.
[4] S. Y. Park and Y. Liang, “Biogenic methane production fromcoal: a review on recent research and development on micro-bially enhanced coalbed methane (MECBM),” Fuel, vol. 166,no. 15, pp. 258–267, 2016.
[5] Y. Bao, Y. Ju, H. Huang, J. Yun, and C. Guo, “Potential andconstraints of biogenic methane generation from coals andmudstones from Huaibei coalfield, eastern China,” Energy &Fuels, vol. 33, no. 1, pp. 287–295, 2019.
[6] Y. Li, J. Yang, Z. Pan, S. Meng, K. Wang, and X. Niu, “Uncon-ventional natural gas accumulations in stacked deposits: a dis-cussion of upper Paleozoic coal-bearing strata in the eastmargin of the Ordos Basin, China,” Acta Geologica Sinica -English Edition, vol. 93, no. 1, pp. 111–129, 2019.
[7] Q. Huang, S. Liu, G. Wang, B. Wu, and Y. Zhang, “Coalbedmethane reservoir stimulation using guar-based fracturingfluid: a review,” Journal of Natural Gas Science and Engineer-ing, vol. 66, pp. 107–125, 2019.
[8] C. Guo, Y. Qin, Y. Xia et al., “Geochemical characteristics ofwater produced from CBM wells and implications for com-mingling CBM production: a case study of the Bide-SantangBasin, western Guizhou, China,” Journal of Petroleum Scienceand Engineering, vol. 159, pp. 666–678, 2017.
[9] Z. Zhang, Y. Qin, J. Bai, G. Li, X. Zhuang, and X. Wang,“Hydrogeochemistry characteristics of produced waters fromCBM wells in southern Qinshui basin and implications forCBM commingled development,” Journal of Natural Gas Sci-ence and Engineering, vol. 56, pp. 428–443, 2018.
[10] C. Guo, Y. Qin, C. Wu, and L. Lu, “Hydrogeological controland productivity modes of coalbed methane commingledproduction in multi-seam areas: A case study of the Bide–Santang Basin, western Guizhou, South China,” Journal ofPetroleum Science and Engineering, vol. 189, p. 107039,2020.
[11] Y. Bao, C. Wei, and B. Neupane, “Generation and accumula-tion characteristics of mixed coalbed methane controlled bytectonic evolution in Liulin CBM field, eastern Ordos Basin,China,” Journal of Natural Gas Science and Engineering,vol. 28, pp. 262–270, 2016.
[12] C. Harmon, “Isotopic variations in meteoric waters,” Science,vol. 133, pp. 1702-1703, 1961.
[13] L. Chen, H. Gui, and X. Yin, “Monitoring of flow field based onstable isotope geochemical characteristics in deep groundwa-ter,” Environmental Monitoring and Assessment, vol. 179,no. 1-4, pp. 487–498, 2011.
[14] C. Hao, Y. Huang, P. He, andW. Sun, “Isotope drift character-istics in Ordovician limestone karst water caused by coal min-ing in northern China,” Mine Water and the Environment,vol. 38, no. 3, pp. 507–516, 2019.
[15] E. Bozau, T. Licha, and W. LieBmann, “Hydrogeochemicalcharacteristics of mine water in the Harz Mountains, Ger-
many,” Chemie der Erde-Geochemistry, vol. 77, no. 4,pp. 614–624, 2017.
[16] X. Li, X. Fu, Y. Ge, and X. Chang, “Research on sequence stra-tigraphy, hydrogeological units and commingled drainageassociated with coalbed methane production: a case study inZhuzang syncline of Guizhou province, China,” HydrogeologyJournal, vol. 24, no. 8, pp. 2171–2187, 2016.
[17] X. Huang, G. Wang, X. Liang, L. Cui, L. Ma, and Q. Xu,“Hydrochemical and stable isotope (δD and δ18O) characteris-tics of groundwater and hydrogeochemical processes in theNingtiaota coalfield, Northwest China,” Mine Water and theEnvironment, vol. 37, no. 1, pp. 119–136, 2018.
[18] Q. Li, Y. Ju, W. Lu, G. Wang, B. Neupane, and Y. Sun, “Water-rock interaction and methanogenesis in formation water in thesoutheast Huaibei coalfield, China,” Marine and PetroleumGeology, vol. 77, pp. 435–447, 2016.
[19] C. Wu, Z. Yang, Y. Qin, J. Chen, Z. Zhang, and Y. Li, “Charac-teristics of hydrogen and oxygen isotopes in produced waterand productivity response of CBM wells in western Guizhou,”Energy & Fuels, vol. 32, no. 11, pp. 11203–11211, 2018.
[20] C. Guo, Y. Qin, D. Ma et al., “Ionic composition, geologicalsignature and environmental impacts of coalbed methane pro-duced water in China,” Energy Sources, Part A: Recovery, Uti-lization, and Environmental Effects, vol. 11, pp. 1259–1273,2021.
[21] P. Li, R. Tian, and R. Liu, “Solute geochemistry and multivar-iate analysis of water quality in the Guohua phosphorite mine,Guizhou province, China,” Exposure and Health, vol. 11, no. 2,pp. 81–94, 2019.
[22] W. Chen, B. Pradhan, S. Li et al., “Novel hybrid integrationapproach of bagging-based fisher's linear discriminant func-tion for groundwater potential analysis,” Natural ResourcesResearch, vol. 28, no. 4, pp. 1239–1258, 2019.
[23] Z. Zhang, D. Yan, X. Zhuang et al., “Hydrogeochemistry signa-tures of produced waters associated with coalbed methaneproduction in the Southern Junggar Basin,” EnvironmentalScience and Pollution Research, vol. 26, no. 31, pp. 31956–31980, 2019.
[24] B. Neogi, A. K. Singh, D. D. Pathak, and A. Chaturvedi,“Hydrogeochemistry of coal mine water of north Karanpuracoalfields, India: implication for solute acquisition processes,dissolved fluxes and water quality assessment,” Environmentand Earth Science, vol. 76, no. 14, pp. 489–506, 2017.
[25] Y. Chen, S. Zhu, and S. Xiao, “Discussion on controlling fac-tors of hydrogeochemistry and hydraulic connections ofgroundwater in different mining districts,” Natural Hazards,vol. 99, no. 2, pp. 689–704, 2019.
[26] M. Redwan, A. A. Abdel Moneim, and M. A. Amra, “Effect ofwater–rock interaction processes on the hydrogeochemistry ofgroundwater west of Sohag area, Egypt,” Arabian Journal ofGeosciences, vol. 9, no. 2, pp. 111–125, 2016.
[27] Y. Bao, W. Wang, D. Ma et al., “Gas origin and constraint ofδ13C (CH4) distribution in the Dafosi mine field in the south-ern margin of the Ordos Basin, China,” Energy & Fuels, vol. 34,no. 11, pp. 14065–14073, 2020.
[28] H. Xu, D. Z. Tang, D. M. Liu et al., “Study on coalbed methaneaccumulation characteristics and favorable areas in the Binch-ang area, southwestern Ordos Basin, China,” InternationalJournal of Coal Geology, vol. 95, pp. 1–11, 2012.
[29] B. Lin, H. Li, D. Yuan, and Z. Li, “Development and applica-tion of an efficient gas extraction model for low-rank high-
12 Geofluids
gas coal beds,” International Journal of Coal Science & Tech-nology, vol. 2, no. 1, pp. 76–83, 2015.
[30] G. Hou, M. Zhang, and F. Liu, Groundwater Exploration inOrdos Basin, Geo. Publ. House, 2008.
[31] Z. Li, S. Tang, X. Wang et al., “Relationship between waterchemical composition and production of coalbed methanewells, Qinshui basin,” Zhongguo Kuangye Daxue Xuebao(Jour-nal of China University of Mining & Technology), vol. 40, no. 3,pp. 424–429, 2011.
[32] J. Qian, L. Wang, L. Ma, Y. H. Lu, W. Zhao, and Y. Zhang,“Multivariate statistical analysis of water chemistry in evaluat-ing groundwater geochemical evolution and aquifer connec-tivity near a large coal mine, Anhui, China,” EnvironmentalEarth Sciences, vol. 75, no. 9, pp. 747–757, 2016.
[33] B. Zhou, Y. Qin, and Z. Yang, “Ion composition of producedwater from coalbed methane wells in western Guizhou, China,and associated productivity response,” Fuel, vol. 265,p. 116939, 2020.
[34] R. J. Gibbs, “Mechanisms controlling world water chemistry,”Science, vol. 170, no. 3962, pp. 1088–1090, 1970.
[35] S. Zheng, G. Hou, and B. Ni, “Study on hydrogen and oxygenstable isotopes of meteoric water in China,” Chinese ScienceBulletin, vol. 13, pp. 801–806, 1983.
[36] S. D. Golding, C. J. Boreham, and J. S. Esterle, “Stable isotopegeochemistry of coal bed and shale gas and related productionwaters: a review,” International Journal of Coal Geology,vol. 120, pp. 24–40, 2013.
[37] R. K. Steinhorst and R. E. Williams, “Discrimination ofgroundwater sources using cluster analysis, MANOVA,canonical analysis and discriminant analysis,” WaterResources Research, vol. 21, no. 8, pp. 1149–1156, 1985.
[38] T. Helstrup, N. O. Jørgensen, and B. Banoeng-Yakubo, “Inves-tigation of hydrochemical characteristics of groundwater fromthe Cretaceous-Eocene limestone aquifer in southern Ghanaand southern Togo using hierarchical cluster analysis,”Hydro-geology Journal, vol. 15, no. 5, pp. 977–989, 2007.
[39] J. E. Cortes, L. F. Muñoz, C. A. Gonzalez et al., “Hydrogeo-chemistry of the formation waters in the San Francisco field,UMV basin, Colombia - a multivariate statistical approach,”Journal of Hydrology, vol. 539, pp. 113–124, 2016.
[40] H. Huang, S. Sang, Y. Miao, Z. Dong, and H. Zhang, “Trendsof ionic concentration variations in water coproduced withcoalbed methane in the Tiefa Basin,” International Journal ofCoal Geology, vol. 182, pp. 32–41, 2017.
[41] V. Voast and A. Wayne, “Geochemical signature of formationwaters associated with coalbed methane,” AAPG Bulletin,vol. 87, no. 4, pp. 667–676, 2003.
[42] Y. Guo, J. Wei, H. Gui, Z. Zhang, and M. Hu, “Evaluation ofchanges in groundwater quality caused by a water inrush eventin Taoyuan coal mine, China,” Environmental Earth Sciences,vol. 79, no. 24, p. 528, 2020.
[43] E. Lakshmanan, R. Kannan, and M. S. Kumar, “Major ionchemistry and identification of hydrogeochemical processesof ground water in a part of Kancheepuram district, TamilNadu, India,” Environmental Geosciences, vol. 10, no. 4,pp. 157–166, 2003.
[44] Y. Li, S. Tang, S. Zhang, Z. Xi, and P. Wang, “Biogeochemistryand water–rock interactions of coalbed methane co-producedwater in the Shizhuangnan block of the southern Qinshuibasin, China,” Water, vol. 12, no. 1, pp. 130–148, 2020.
[45] P. Li, H. Qian, J. Wu, Y. Zhang, and H. Zhang, “Major ionchemistry of shallow groundwater in the Dongsheng coalfield,Ordos basin, China,” Mine Water and the Environment,vol. 32, no. 3, pp. 195–206, 2013.
[46] P. Liu, N. Hoth, C. Drebenstedt, Y. Sun, and Z. Xu, “Hydro-geochemical paths of multi-layer groundwater system in coalmining regions – using multivariate statistics and geochemicalmodeling approaches,” Science of The Total Environment,vol. 601-602, pp. 1–14, 2017.
[47] K. Zhang, J. Gao, B. Jiang, J. Han, and M. Chen, “Experimentalstudy on the mechanism of water-rock interaction in the coalmine underground reservoir,” Journal of China Coal Society,vol. 44, no. 12, pp. 3760–3772, 2019.
[48] C. Song, Y. Zeng, M. Yan et al., “Sedimentary conditions ofevaporites in the late Jurassic Xiali formation, QiangtangBasin: evidence from geochemistry records,” Acta GeologicaSinica - English Edition, vol. 91, no. 1, pp. 156–174, 2017.
[49] Q. Li, Y. Ju, Y. Bao, Z. Yan, X. Li, and Y. Sun, “Composition,origin, and distribution of coalbed methane in the HuaibeiCoalfield, China,” Energy & Fuels, vol. 29, no. 2, pp. 546–555,2015.
13Geofluids