Embed Size (px)
Citation preview

Research ArticleRock-Arch Instability Characteristics of the SandstonePlate under Different Loading Conditions
Shuren Wang,1,2 Paul Hagan,3 Baowen Hu,4 Kanchana Gamage,3
Cheng Yan,3 and Dianfu Xu1
1 School of Civil Engineering and Mechanics, Yanshan University, Qinhuangdao 066004, China2Opening Laboratory for Deep Mine Construction, Henan Polytechnic University, Jiaozuo 454003, China3 School of Mining Engineering, University of New South Wales, Sydney, NSW 2052, Australia4Civil and Environmental Engineering Institute, University of Science and Technology, Beijing 100083, China
Correspondence should be addressed to Shuren Wang; [email protected]
Received 23 February 2014; Accepted 21 April 2014; Published 19 May 2014
Academic Editor: Juan Jose del Coz Dıaz
Copyright © 2014 Shuren Wang et al. This is an open access article distributed under the Creative Commons Attribution License,which permits unrestricted use, distribution, and reproduction in any medium, provided the original work is properly cited.
Under the concentrated loading and the uniform loading, the tests on the brittle fracture and the hinged arching until the rock-archinstability of the sandstone plate were conducted using self-developed loading device, and the sensitivity of influent factors on therock-arch failure was analyzed by numerical test based on the particle flow code (PFC). The results showed that sandstone plateinstability presented four phases: small deformation elastic stage, brittle fracture arching stage, rock-arch bearing stage, and rock-arch instability stage. Under the uniform loading, themaximumvertical force of the rock-arch instability wasmuch higher than thatunder the concentrated loading condition, but the maximum lateral force was almost the same. The number of acoustic emission(AE) and its positioning results of the sandstone plate showed that the extent of the plate damage under the uniform loading washigher than that under the concentrated loading condition. The friction coefficient effect, size effect, loading rate effect, and theinitial horizontal force effect on the rock-arch instability were analyzed by the PFC3D numerical experiment.
1. Introduction
Over the past years in China, there are numerous shallowmined-out areas left due to the disordered mining by theprivate coal mines. It is of important theoretical and practicalvalue for the roof stability evaluation and disaster forecastingto research on the deformation rupture, instability mecha-nism, and failure mode of the rock roof in the mined-outareas.
The studies on the instability of the rock roof in themining field have been the main topic all the time for homeand abroad scholars. For example, according to elastic thinplate theory, Wang et al. analyzed the fracture instabilitycharacteristics of the roof under different mining distancesin the mining work face [1]. Wang et al. analyzed therheological failure characteristics of the roof in the mined-out areas through combining the thin plate and rheologytheories [2–4]. Pan had conducted the analytical analysis
of the variation trend of the bending moment, the deflec-tion, and the shear force of the hard roof in the miningfield [5]. These researches mentioned above are inclined toadopted traditional analytic methods to probe into the roofstability. There are also new theories and methods used inrecent years. Zhao et al. utilized the catastrophe theory toset up vertical deformation model of the overlapping roofin the mined-out areas and put forward the criteria forevaluating the roof stability [6]. Wang et al. analyzed thechaos and stochastic resonance phenomenon produced inthe roof during the evolutionary process of the rock beamdeformation [7]. Meanwhile, some numerical computationmethods were applied in discussing the mechanical responseof rock plate or beam. Wang et al. analyzed the blast-inducedstress wave propagation and the spalling damage in a rockplate by using the finite-difference code [8]. Nomikos etal. researched the mechanical response of the multijointedroof beams using two-dimensional distinct element code
Hindawi Publishing CorporationAdvances in Materials Science and EngineeringVolume 2014, Article ID 950870, 9 pageshttp://dx.doi.org/10.1155/2014/950870

2 Advances in Materials Science and Engineering
[9]. Bakun-Mazor et al. examined the arching mechanismof the blocky rock mass deformation after the undergroundtunnel was excavated using the discrete element method[10]. Cravero and Iabichino discussed the flexural failure ofa gneiss slab from a quarry face by virtue of linear elasticfracture mechanics (LEFM), finite element method (FEM)[11], and so forth [12–14].
In summary, though many research achievements havebeen made, the results that the rock plate was supposed tobe the thin plate or beam were lacking laboratory test to beverified. In addition, some numerical calculations were basedon the continuum mechanics, which could not reflect thespatial heterogeneity and the anisotropic effect of the roof inthe mining field. Only a few researchers utilized the discreteelement methods to study the macromechanical response ofthe rock plate and did not further explore the microscopicdamage of the rock plate.Therefore, a new loading device wasdeveloped to study the rock-arch instability characteristics ofthe plate, and particle flow code was used to further probeinto the microscopic damage of the rock plate under theconcentrated and the uniform loading, respectively.
2. Loading Experiment of Rock Plate
2.1. Sample of Rock Plate. The rock plate samples in the testwere Hawkesbury sandstone, obtained from Gosford Quarryin Sydney, Australia. The quartz sandstones were formed inmarine sedimentary basin of the Mid-Triassic and located onthe top of the coal-bearing strata, which contained a smallquantity of feldspars, siderite, and clay minerals. The surfaceof the specimen exhibited local red rather than usual whitebecause of the content and distribution of the iron oxide.According to the definition of the thin plate and thick platein elastic mechanics, the specimen size of the thick plate wasdesigned to be 190mm × 75mm × 24mm (length, width,and thickness) and that of the thin plate was designed to be190mm × 75mm × 14mm (length, width, and thickness).Each kind of rock plate was prepared for at least three plates.
2.2. Loading Equipment. The MTS-851 rock mechanics test-ing machine was selected as loading equipment, the loadwas controlled by vertical displacement, and loading rate wasset 1 × 10⁻²mm/s [15]. The vertical force and displacementoccurring in the process of test were automatically recordedin real time by data acquisition system.
As shown in Figure 1, the concentrated and the uniformloading test sets were designed to mainly consist of threeparts. The top was a point loading for the concentratedloading or an assembly of the steel balls for the uniformloading. The middle was loading framework which includedfour bolts with nuts connecting the steel plates on bothsides, and the lateral pressure cell was placed between thedeformable steel plate and the thick steel plate so as tomonitor the horizontal force. The capacity of the lateralpressure cell LPX was 1000 kg. The bottom was a rectanglesteel foundation, and the rotatable hinge supports were set onboth sides of the loading framework to maintain connectionwith the steel plates.
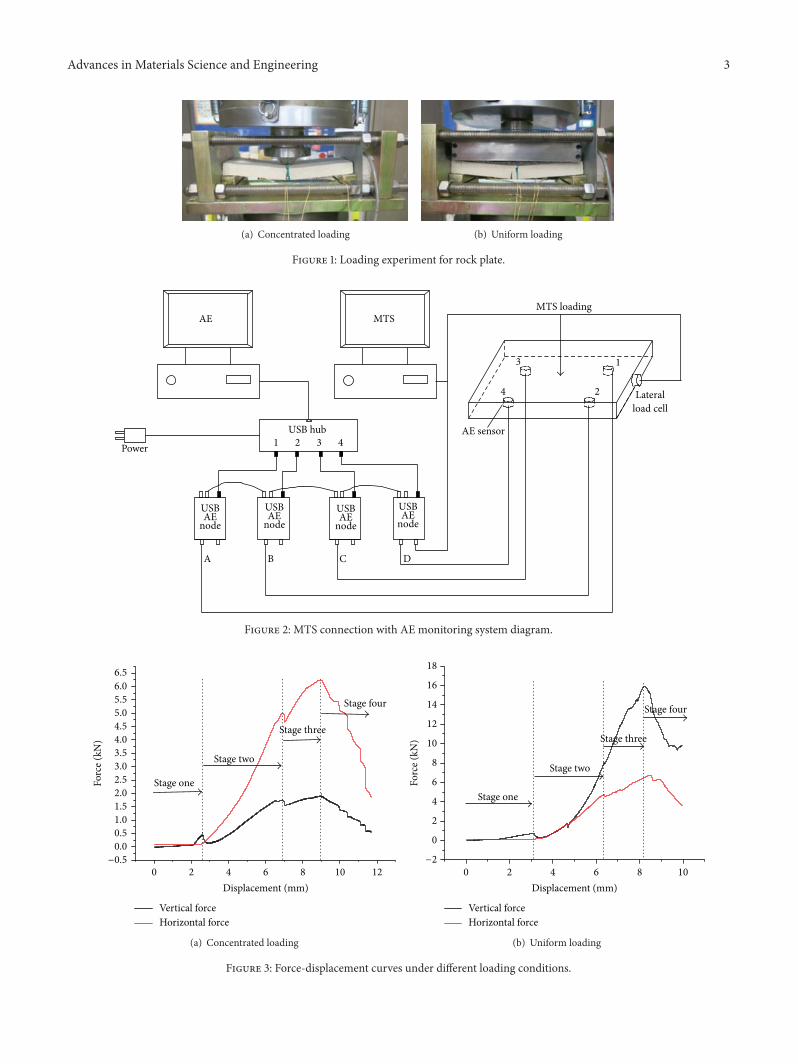
2.3. Acoustic Equipment and Data Acquisition System. Inorder to monitor the cracks initiate and identify the failurelocation of the rock plate, and the USB AE nodes were usedin the test. The USB AE node is a single channel acousticemission (AE) digital signal processor with full AE hit andtime based features. In the test there were four USB AE nodesbeing connected to a USB hub for multichannel operation(Figure 2). All these AE nodes were made in MISTRASGroup, Inc., USA.
3. Experiment Results and Analysis
3.1. Characteristic of Force-Displacement Curve. As shown inFigure 3, the vertical force-displacement curves appeared twopeaks under both the concentrated loading and the uniformloading, and the second peak value is higher than the firstone. The thin rock plate showed the similarity cases in thetest with the thick plate; only the peak values of the verticaland the horizontal force were lower than that of the thickone. In general, the curves of the force-displacement couldbe classified as four mechanical response stages as follows(Figure 1(a)).
Stage One.The rock plate was in the small deformation elasticstage. With the vertical force slowly increasing, the verticaldisplacement grew gradually. On the contrary, the horizontalforce showed the slight decrease, which was mainly causedby the slight horizontal shrink of the rock plate during theloading process.
Stage Two. The rock plate produced brittle rupture andformed the rock-arch structure. As the vertical displacementwent to about 2.5mm, the vertical force appeared with abruptincrease firstly and then dropped sharply in a small interval,which indicated the rock plate producing brittle rupture.Subsequently, the rock-arch structure was formed under thevertical and the horizontal reaction forces, and the horizontalforce started to increase.
Stage Three. The rock-arch structure began to bear loads andproduced deformation.With the vertical force increasing, themiddle hinge point of the rock-arch structure moved down,and the two flanks of the rock-arch rotated around the hingepoint, respectively. Such kinds of motion would stretch therock-arch structure in the horizontal direction and squeezethe plate in two sides, and the horizontal force showed asignificant growth.
Stage Four. The instability of the hinged rock-arch structurehappened. With the vertical force continuously increasing,the middle hinged point of the rock-arch structure moveddown constantly, and when the hinged point exceeded thehorizontal line formed by the hinged point and two endsof the plate, the rock-arch structure went into instabilitythoroughly.
Under the uniform loading, the damage and fractureextent of the rock plate was more serious than that underthe concentrated loading, especially at the two ends of the
Advances in Materials Science and Engineering 3
(a) Concentrated loading (b) Uniform loading
Figure 1: Loading experiment for rock plate.
AE
A B C D
AE sensorPower
USB hub1
1
2
2
3
3
4
4
MTS
USBAE
node
USBAE
nodeUSBAE
node
USBAE
node
MTS loading
Lateralload cell
Figure 2: MTS connection with AE monitoring system diagram.
6.5
−0.5
0.0
0.5
1.0
1.5
2.0
2.5
3.0
3.5
4.0
4.5
5.0
5.5
6.0
0 2 4 6 8 10 12
Stage four
Stage three
Stage two
Stage one
Vertical forceHorizontal force
Forc
e (kN
)
Displacement (mm)
(a) Concentrated loading
−2
0
2
4
6
8
10
12
14
16
18
Stage four
Stage three
Stage two
Stage one
Vertical forceHorizontal force
0 2 4 6 8 10
Displacement (mm)
Forc
e (kN
)
(b) Uniform loading
Figure 3: Force-displacement curves under different loading conditions.

4 Advances in Materials Science and Engineering
0
1
2
3
4
5
6
7
0
1000
2000
3000
4000
5000
0 200 400 600 800 1000 1200
Forc
e (kN
)
Time (s)
AE
hitsC
B
A
Stage four
Stage three
Stage two
Stage one
A, vertical forceB, lateral forceC, AE hits
(a) Concentrated loading
0
2
4
6
8
10
12
14
16
18
A
B
C
0
1000
2000
3000
4000
5000
0 200 400 600 800 1000
Stage four
Stage three
Stage two
Stage oneForc
e (kN
)
Time (s)
AE
hits
B, vertical forceA, lateral forceC, AE hits
(b) Uniform loading
Figure 4: AE hits and force-displacement curves under different loading conditions.
70
60
50
40
30
20
10
0
−10
−10 0
10
20
30
40
50
60
70
80
90
100
110
120
130
140
150
160
170
180
190
(mm)
(mm
)
(a) Initial crack
70
60
50
40
30
20
10
0
−10
(mm
)
−10 0
10
20
30
40
50
60
70
80
90
100
110
120
130
140
150
160
170
180
190
(mm)
(b) Ultimate cracks
Figure 5: AE location of rock plate under concentrated loading.
rock plate (Figure 1(b)). As shown in Figure 3, the load-displacement curve showed similarity with the concentratedloading, and the peak value of the vertical force was greaterthan that under the concentrated loading, while the maxi-mum value of the horizontal force showed basically the same(about 6.2 kN) with each other.
3.2. Acoustic Characteristic in the Process of the Rock PlateFailure. As shown in Figure 4, in the beginning of stage two,the AE hits under the uniform loading were greater thanthat under the concentrated loading, which were about 5000and 4500, respectively. In stage three and stage four, the AEhits were also greater and more evenly distributed under theuniform loading compared with the concentrated loading,which were about 5000 and 3000, respectively.
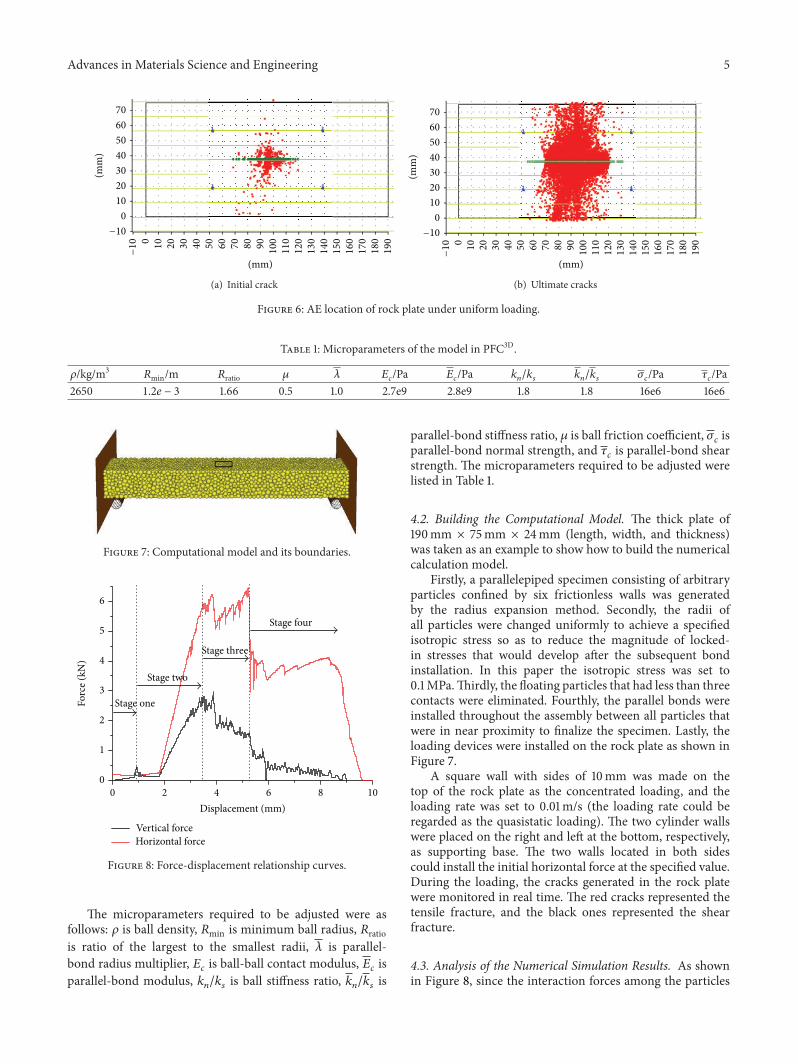
As shown inAE locationmap (Figures 5 and 6), the resultsshowed obvious differences in the initial crack position andthe cracks distribution of the rock plate under differentloading conditions. When the rock-arch structure went intoinstability, the differences in the damage extent and scope
between the two loading methods were shown. All in all, theresults of AE hits and location showed that the over damageextent and scope of the rock plate caused by the uniformloading were more serious than that under the concentratedloading condition.
4. Numerical Simulations of the LoadingTest of the Rock Plate
4.1. Parameters Calibration of the Rock Plate. The rock platewas treated as the porous and solid material that consisted ofparticles and cement bodies. The force-displacement curvewas simulated under the concentrated loading using thePFC3D.
Before the numerical simulation model being built, themicroparameters needed to be adjusted repeatedly and final-ized until the macromechanical parameters calculated wereconsistent with the physical macromechanical parameters[16].
Advances in Materials Science and Engineering 5
70
60
50
40
30
20
10
0
−10
(mm
)
−10 0
10
20
30
40
50
60
70
80
90
100
110
120
130
140
150
160
170
180
190
(mm)
(a) Initial crack
70
60
50
40
30
20
10
0
−10
(mm
)
−10 0
10
20
30
40
50
60
70
80
90
100
110
120
130
140
150
160
170
180
190
(mm)
(b) Ultimate cracks
Figure 6: AE location of rock plate under uniform loading.
Table 1: Microparameters of the model in PFC3D.
𝜌/kg/m3𝑅min/m 𝑅ratio 𝜇 𝜆 𝐸
𝑐
/Pa 𝐸𝑐
/Pa 𝑘𝑛
/𝑘𝑠
𝑘𝑛
/𝑘𝑠
𝜎𝑐
/Pa 𝜏𝑐
/Pa2650 1.2𝑒 − 3 1.66 0.5 1.0 2.7e9 2.8e9 1.8 1.8 16e6 16e6
Figure 7: Computational model and its boundaries.
0
1
2
3
4
5
6
0 2 4 6 8 10
Stage four
Stage three
Stage two
Stage oneForc
e (kN
)
Displacement (mm)
Vertical forceHorizontal force
Figure 8: Force-displacement relationship curves.
The microparameters required to be adjusted were asfollows: 𝜌 is ball density, 𝑅min is minimum ball radius, 𝑅ratiois ratio of the largest to the smallest radii, 𝜆 is parallel-bond radius multiplier, 𝐸
𝑐
is ball-ball contact modulus, 𝐸𝑐
isparallel-bond modulus, 𝑘
𝑛
/𝑘𝑠
is ball stiffness ratio, 𝑘𝑛
/𝑘𝑠
is
parallel-bond stiffness ratio, 𝜇 is ball friction coefficient, 𝜎𝑐
isparallel-bond normal strength, and 𝜏
𝑐
is parallel-bond shearstrength. The microparameters required to be adjusted werelisted in Table 1.
4.2. Building the Computational Model. The thick plate of190mm × 75mm × 24mm (length, width, and thickness)was taken as an example to show how to build the numericalcalculation model.
Firstly, a parallelepiped specimen consisting of arbitraryparticles confined by six frictionless walls was generatedby the radius expansion method. Secondly, the radii ofall particles were changed uniformly to achieve a specifiedisotropic stress so as to reduce the magnitude of locked-in stresses that would develop after the subsequent bondinstallation. In this paper the isotropic stress was set to0.1MPa.Thirdly, the floating particles that had less than threecontacts were eliminated. Fourthly, the parallel bonds wereinstalled throughout the assembly between all particles thatwere in near proximity to finalize the specimen. Lastly, theloading devices were installed on the rock plate as shown inFigure 7.
A square wall with sides of 10mm was made on thetop of the rock plate as the concentrated loading, and theloading rate was set to 0.01m/s (the loading rate could beregarded as the quasistatic loading). The two cylinder wallswere placed on the right and left at the bottom, respectively,as supporting base. The two walls located in both sidescould install the initial horizontal force at the specified value.During the loading, the cracks generated in the rock platewere monitored in real time. The red cracks represented thetensile fracture, and the black ones represented the shearfracture.
4.3. Analysis of the Numerical Simulation Results. As shownin Figure 8, since the interaction forces among the particles

6 Advances in Materials Science and Engineering
(a) Elastic stage (b) Brittle rupture stage
(c) Bearing loading stage (d) Rock-arch instability stage
Figure 9: Rock-arch instability process under the concentrated loading.
0
200
400
600
800
1000
1200
0 2 4 6 8 10
Crac
k
Displacement (mm)
Shear crackTension crack
Figure 10: Crack-displacement curves.
were simplified in PFC3D, there were some differences inthe vertical force-horizontal force-displacement simulatedcurves compared with the physical experimental curves, butthe variation trend of the curves was basically the same fortwo cases, so the physical experimental results confirmed thenumerical credibility.
In the elastic deformation stage (Figure 9(a)), the dis-placement vector field described that a slight elastic deforma-tionwas produced in the rock plate and at the same time therewas no crack generated in this stage. In the brittle rupturestage (Figure 9(b)), there were many tensile cracks producedin the rock plate, and these tensile cracks formed a tensilefailure plane in the rock plate. In the rock-arch bearing load
2
3
4
5
6
7
Forc
e (kN
)
0.0 0.2 0.4 0.6 0.8 1.0
19
18
17
16
15
14
13
Friction coefficient
Com
pres
sive s
treng
th (M
Pa)
Vertical force (kN)Horizontal force (kN)Compressive strength (MPa)
Figure 11: Force-friction coefficient curves.
stage (Figure 9(c)), therewere the shearing and tension cracksemerging in the hinged plane and both ends of the rock plate.In the rock-arch instability stage (Figure 9(d)), the rock-archstructure had a large deformation, and parts of the particlesin the hinged plane of both sides had escaped from the rockplate mainly due to the squeezing fracture.
As shown in Figure 10, the number of shear cracks obeyedthe S-figure curve during thewholemechanical response pro-cess, which was also applicable to the tensile cracks only afterthe brittle rupture. When the vertical displacement reachedaround 1.0mm, the number of the tensile cracks surged to300. As the displacement varied in the interval 1.0–2.5mm,the crack development kept almost unchanged. However,with the displacement continuously increasing, the number

Advances in Materials Science and Engineering 7
2.5
3.0
3.5
4.0
4.5
5.0
5.5
6.0
6.5
180 190 200 210 220
Forc
e (kN
)
Length (mm)
(a) Length effect
60 70 80 90 100 1102
3
4
5
6
7
8
9
Forc
e (kN
)
Width (mm)
(b) Width effect
1
2
3
4
5
6
7
8
9
10 15 20 25 30 35
Forc
e (kN
)
Thickness (mm)
Vertical forceHorizontal force
(c) Thickness effect
Figure 12: The forces variation with the rock plate geometry parameters.
of both shearing and tension cracks kept increasing, thehinged planes and both ends of the rock plate showed themixture of shearing and tensile cracks. As rock-arch structurewent into instability, the number of cracks still kept significantincrease until the displacement reached 6mm.
5. Sensitive Analysis of Influence Factors ofthe Rock-Arch Instability
5.1.Material Parameter Effect. As shown in Figure 11, with thefriction coefficient of the particles increasing, the peak valuesof the vertical force and the horizontal force of the rock-archstructure also increased.This was mainly because the frictiongrowth enhanced the peak strength of the rock material;namely, after breakage of the parallel bond, the strength of therock material was often contributed by the contact friction ofthe particles.
5.2. Geometry Size Effect. As shown in Figure 12, thelength, width, and thickness of the rock plate were changed,respectively, to reveal the size effect on the instability ofthe rock-arch structure. With the length of the rock plateincreasing, the peak values of the vertical and the horizontalforce were gradually decreased, and the whole variationinterval was small. With the width and the thickness ofthe rock plate increasing, the peak values of the verticaland the horizontal force showed obvious growth. In short,the response of the rock-arch structure instability was moresensitive to the width and thickness compared with thelength.
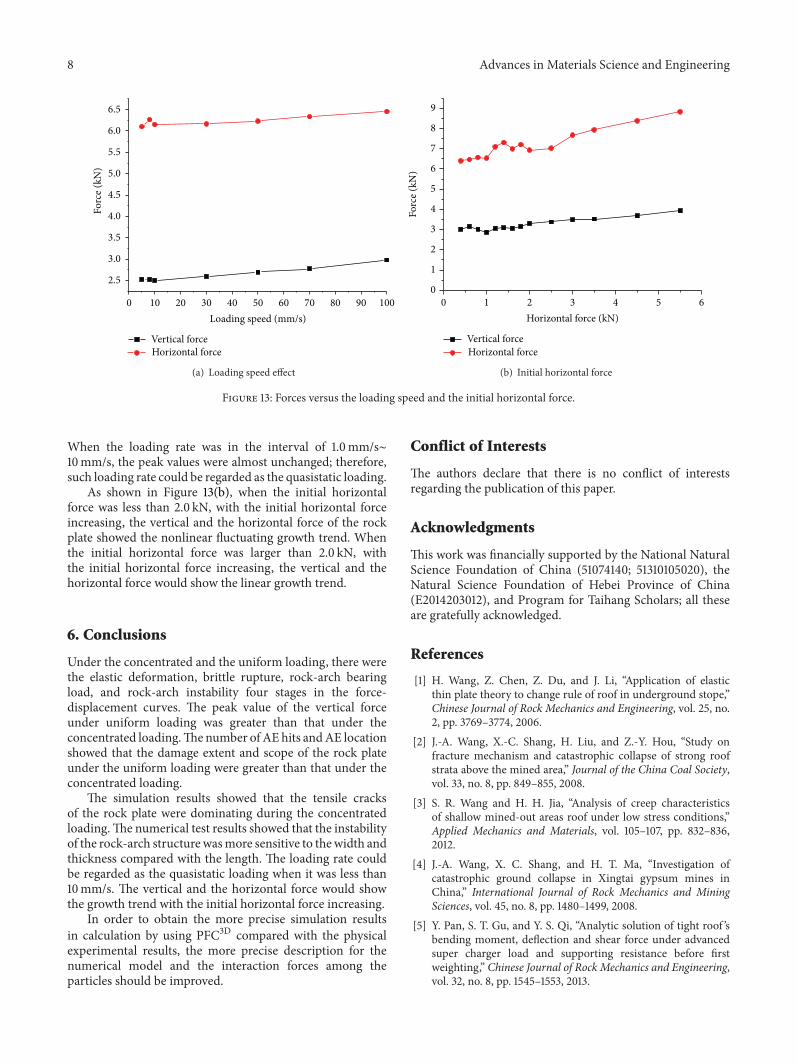
5.3. Loading Rate and Initial Horizontal Force Effect. Asshown in Figure 13(a), when the loading rate exceeded10mm/s, with the loading rate increasing, the peak valuesof the vertical and the horizontal force showed the lineargrowth trend, and the amplitude of that variation was small.
8 Advances in Materials Science and Engineering
2.5
3.0
3.5
4.0
4.5
5.0
5.5
6.0
6.5
0 10 20 30 40 50 60 70 80 90 100
Forc
e (kN
)
Loading speed (mm/s)
Vertical forceHorizontal force
(a) Loading speed effect
0
1
2
3
4
5
6
7
8
9
Forc
e (kN
)
Horizontal force (kN)0 1 2 3 4 5 6
Vertical forceHorizontal force
(b) Initial horizontal force
Figure 13: Forces versus the loading speed and the initial horizontal force.
When the loading rate was in the interval of 1.0mm/s∼10mm/s, the peak values were almost unchanged; therefore,such loading rate could be regarded as the quasistatic loading.
As shown in Figure 13(b), when the initial horizontalforce was less than 2.0 kN, with the initial horizontal forceincreasing, the vertical and the horizontal force of the rockplate showed the nonlinear fluctuating growth trend. Whenthe initial horizontal force was larger than 2.0 kN, withthe initial horizontal force increasing, the vertical and thehorizontal force would show the linear growth trend.
6. Conclusions
Under the concentrated and the uniform loading, there werethe elastic deformation, brittle rupture, rock-arch bearingload, and rock-arch instability four stages in the force-displacement curves. The peak value of the vertical forceunder uniform loading was greater than that under theconcentrated loading.Thenumber of AE hits andAE locationshowed that the damage extent and scope of the rock plateunder the uniform loading were greater than that under theconcentrated loading.
The simulation results showed that the tensile cracksof the rock plate were dominating during the concentratedloading.The numerical test results showed that the instabilityof the rock-arch structurewasmore sensitive to thewidth andthickness compared with the length. The loading rate couldbe regarded as the quasistatic loading when it was less than10mm/s. The vertical and the horizontal force would showthe growth trend with the initial horizontal force increasing.
In order to obtain the more precise simulation resultsin calculation by using PFC3D compared with the physicalexperimental results, the more precise description for thenumerical model and the interaction forces among theparticles should be improved.
Conflict of Interests
The authors declare that there is no conflict of interestsregarding the publication of this paper.
Acknowledgments
This work was financially supported by the National NaturalScience Foundation of China (51074140; 51310105020), theNatural Science Foundation of Hebei Province of China(E2014203012), and Program for Taihang Scholars; all theseare gratefully acknowledged.
References
[1] H. Wang, Z. Chen, Z. Du, and J. Li, “Application of elasticthin plate theory to change rule of roof in underground stope,”Chinese Journal of Rock Mechanics and Engineering, vol. 25, no.2, pp. 3769–3774, 2006.
[2] J.-A. Wang, X.-C. Shang, H. Liu, and Z.-Y. Hou, “Study onfracture mechanism and catastrophic collapse of strong roofstrata above the mined area,” Journal of the China Coal Society,vol. 33, no. 8, pp. 849–855, 2008.
[3] S. R. Wang and H. H. Jia, “Analysis of creep characteristicsof shallow mined-out areas roof under low stress conditions,”Applied Mechanics and Materials, vol. 105–107, pp. 832–836,2012.
[4] J.-A. Wang, X. C. Shang, and H. T. Ma, “Investigation ofcatastrophic ground collapse in Xingtai gypsum mines inChina,” International Journal of Rock Mechanics and MiningSciences, vol. 45, no. 8, pp. 1480–1499, 2008.
[5] Y. Pan, S. T. Gu, and Y. S. Qi, “Analytic solution of tight roof ’sbending moment, deflection and shear force under advancedsuper charger load and supporting resistance before firstweighting,” Chinese Journal of Rock Mechanics and Engineering,vol. 32, no. 8, pp. 1545–1553, 2013.

Advances in Materials Science and Engineering 9
[6] Y. Zhao, Q. Wu, W. Wang, W. Wan, and F. Zhao, “Strengthreduction method to study stability of goaf overlapping roofbased on catastrophe theory,”Chinese Journal of RockMechanicsand Engineering, vol. 29, no. 7, pp. 1424–1434, 2010.
[7] S. R. Wang, H. Wang, and B. W. Hu, “Analysis of catastropheevolution characteristics of the stratified rock roof in shallowmined-out areas,” Disaster Advances, vol. 6, no. 1, pp. 59–64,2013.
[8] Z.-L. Wang, Y.-C. Li, and J. G. Wang, “Numerical analysisof blast-induced wave propagation and spalling damage in arock plate,” International Journal of Rock Mechanics and MiningSciences, vol. 45, no. 4, pp. 600–608, 2008.
[9] P. P. Nomikos, A. I. Sofianos, and C. E. Tsoutrelis, “Structuralresponse of vertically multi-jointed roof rock beams,” Interna-tional Journal of Rock Mechanics and Mining Sciences, vol. 39,no. 1, pp. 79–94, 2002.
[10] D. Bakun-Mazor, Y.H.Hatzor, andW. S.Dershowitz, “Modelingmechanical layering effects on stability of underground open-ings in jointed sedimentary rocks,” International Journal of RockMechanics andMining Sciences, vol. 46, no. 2, pp. 262–271, 2009.
[11] M. Cravero and G. Iabichino, “Analysis of the flexural failureof an overhanging rock slab,” International Journal of RockMechanics and Mining Sciences, vol. 41, supplement 1, pp. 605–610, 2004.
[12] S. R. Wang and M. S. Chang, “Reliability analysis of liningstability for hydraulic tunnel under internal water pressure,”Disaster Advances, vol. 5, no. 4, pp. 166–170, 2012.
[13] J. F. Yin, S. R. Wang, Z. Q. Wang, J. M. Yu, and C. Cao,“Disturbance effects analysis of the coal pillar-roof systemcaused by a sudden instability coal pillar,” Disaster Advances,vol. 6, no. 13, pp. 29–37, 2013.
[14] J. H. Yang, S. R. Wang, C. L. Li, and Y. Li, “Disturbancedeformation effect on the existing tunnel of asymmetric tunnelswith small spacing,” Disaster Advances, vol. 6, no. 13, pp. 269–277, 2013.
[15] R. Ulusay and J. A. Hudson, The Complete ISRM SuggestedMethods for Rock Characterization, Testing and Monitoring:1974–2006, Kozan Ofset, Ankara, Turkey, 2007.
[16] D. O. Potyondy and P. A. Cundall, “A bonded-particle modelfor rock,” International Journal of Rock Mechanics and MiningSciences, vol. 41, no. 8, pp. 1329–1364, 2004.

Submit your manuscripts athttp://www.hindawi.com
ScientificaHindawi Publishing Corporationhttp://www.hindawi.com Volume 2014
CorrosionInternational Journal of
Hindawi Publishing Corporationhttp://www.hindawi.com Volume 2014
Polymer ScienceInternational Journal of
Hindawi Publishing Corporationhttp://www.hindawi.com Volume 2014
Hindawi Publishing Corporationhttp://www.hindawi.com Volume 2014
CeramicsJournal of
Hindawi Publishing Corporationhttp://www.hindawi.com Volume 2014
CompositesJournal of
NanoparticlesJournal of
Hindawi Publishing Corporationhttp://www.hindawi.com Volume 2014
Hindawi Publishing Corporationhttp://www.hindawi.com Volume 2014
International Journal of
Biomaterials
Hindawi Publishing Corporationhttp://www.hindawi.com Volume 2014
NanoscienceJournal of
TextilesHindawi Publishing Corporation http://www.hindawi.com Volume 2014
Journal of
NanotechnologyHindawi Publishing Corporationhttp://www.hindawi.com Volume 2014
Journal of
CrystallographyJournal of
Hindawi Publishing Corporationhttp://www.hindawi.com Volume 2014
The Scientific World JournalHindawi Publishing Corporation http://www.hindawi.com Volume 2014
Hindawi Publishing Corporationhttp://www.hindawi.com Volume 2014
CoatingsJournal of
Advances in
Materials Science and EngineeringHindawi Publishing Corporationhttp://www.hindawi.com Volume 2014
Smart Materials Research
Hindawi Publishing Corporationhttp://www.hindawi.com Volume 2014
Hindawi Publishing Corporationhttp://www.hindawi.com Volume 2014
MetallurgyJournal of
Hindawi Publishing Corporationhttp://www.hindawi.com Volume 2014
BioMed Research International
MaterialsJournal of
Hindawi Publishing Corporationhttp://www.hindawi.com Volume 2014
Nano
materials
Hindawi Publishing Corporationhttp://www.hindawi.com Volume 2014
Journal ofNanomaterials