Embed Size (px)
Citation preview
100%? 99%? Hydrogen? Pumped storage? Something else?
11 November 2021
H2_Flex_Summary_v3.2_txt
Executive summary
• As New Zealand seeks to decarbonise its electricity system, dry year risk management will remain a key problem to solve, even as balancing wind & solar variability will grow in importance as an additional flexibility challenge
• The purpose of this study was to assess the benefit that a flexibly operated green hydrogen facility could provide towards solving New Zealand’s dry year + wind & solar flexibility challenges
• We developed scenarios for 2030 and 2050 and tested their performance against the energy trilemma -security of supply, sustainability, and cost. The scenarios include:
i. Flexible hydrogen (or aluminium if it were possible to operate NZAS with significantly more flexibility).
ii. Retention of a small amount of peakers, with sub-options: a) fuelled by gas; or b) fuelled with biofuel
iii. Retention of the Huntly Coal reserve plant
iv. Overbuilding renewable generation
v. South Island pumped hydro
• The results are that all options can deliver equivalent security of supply and carbon emission outcomes. The key differentiator is cost.
• Of all the options, flexible demand from green hydrogen (or aluminium) – if the flexibility can be provided cheaply – or retaining 1% gas peakers, are the lowest cost for New Zealand.
2
Section 1: What we have modelled, and why
3
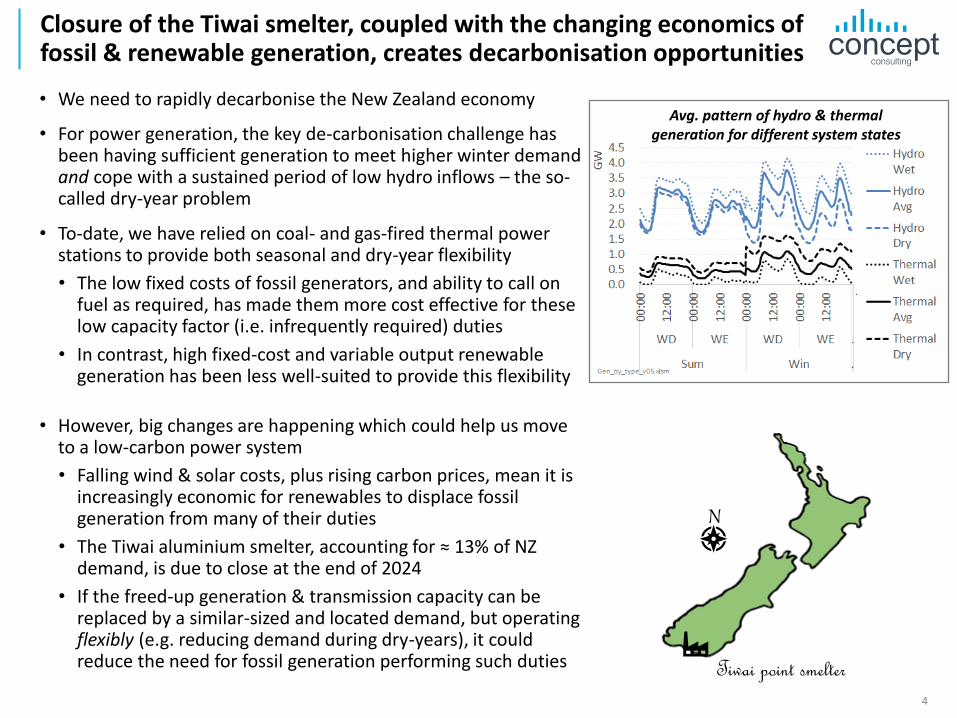
Closure of the Tiwai smelter, coupled with the changing economics of fossil & renewable generation, creates decarbonisation opportunities
• We need to rapidly decarbonise the New Zealand economy
• For power generation, the key de-carbonisation challenge has been having sufficient generation to meet higher winter demand and cope with a sustained period of low hydro inflows – the so-called dry-year problem
• To-date, we have relied on coal- and gas-fired thermal power stations to provide both seasonal and dry-year flexibility
• The low fixed costs of fossil generators, and ability to call on fuel as required, has made them more cost effective for these low capacity factor (i.e. infrequently required) duties
• In contrast, high fixed-cost and variable output renewable generation has been less well-suited to provide this flexibility
• However, big changes are happening which could help us move to a low-carbon power system
• Falling wind & solar costs, plus rising carbon prices, mean it is increasingly economic for renewables to displace fossil generation from many of their duties
• The Tiwai aluminium smelter, accounting for ≈ 13% of NZ demand, is due to close at the end of 2024
• If the freed-up generation & transmission capacity can be replaced by a similar-sized and located demand, but operating flexibly (e.g. reducing demand during dry-years), it could reduce the need for fossil generation performing such duties
4
Tiwai point smelter
N
Avg. pattern of hydro & thermal generation for different system states
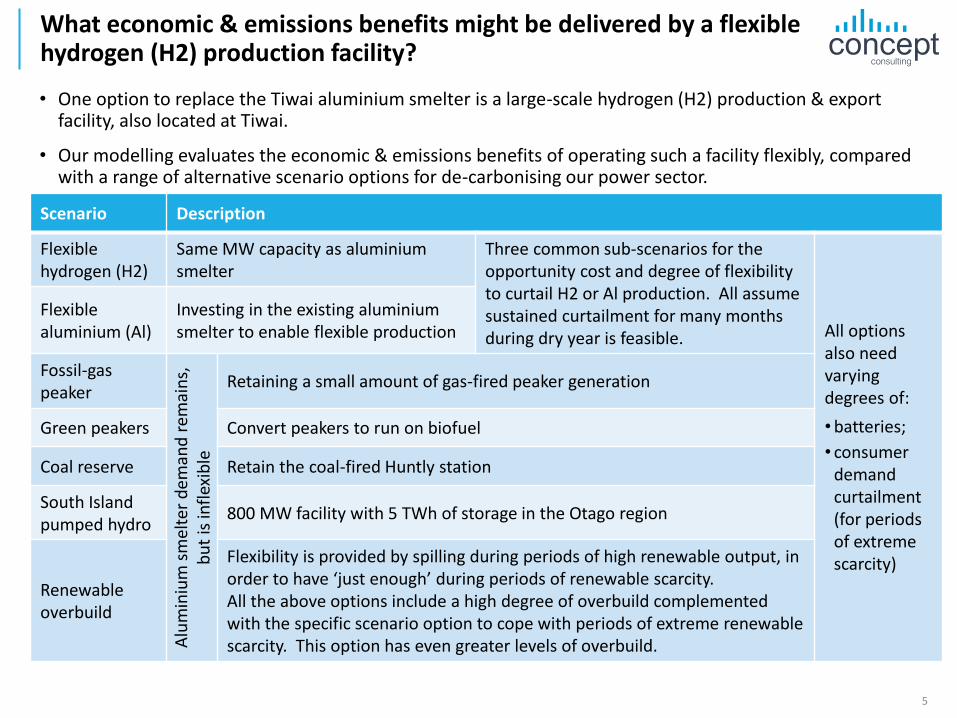
What economic & emissions benefits might be delivered by a flexible hydrogen (H2) production facility?
• One option to replace the Tiwai aluminium smelter is a large-scale hydrogen (H2) production & export facility, also located at Tiwai.
• Our modelling evaluates the economic & emissions benefits of operating such a facility flexibly, compared with a range of alternative scenario options for de-carbonising our power sector.
5
Scenario Description
Flexible hydrogen (H2)
Same MW capacity as aluminium smelter
Three common sub-scenarios for the opportunity cost and degree of flexibility to curtail H2 or Al production. All assume sustained curtailment for many months during dry year is feasible. All options
also need varying degrees of:
•batteries;
• consumer demand curtailment (for periods of extreme scarcity)
Flexible aluminium (Al)
Investing in the existing aluminium smelter to enable flexible production
Fossil-gas peaker
Alu
min
ium
sm
elte
r d
eman
d r
emai
ns,
b
ut
is in
flex
ible
Retaining a small amount of gas-fired peaker generation
Green peakers Convert peakers to run on biofuel
Coal reserve Retain the coal-fired Huntly station
South Island pumped hydro
800 MW facility with 5 TWh of storage in the Otago region
Renewable overbuild
Flexibility is provided by spilling during periods of high renewable output, in order to have ‘just enough’ during periods of renewable scarcity. All the above options include a high degree of overbuild complemented with the specific scenario option to cope with periods of extreme renewable scarcity. This option has even greater levels of overbuild.
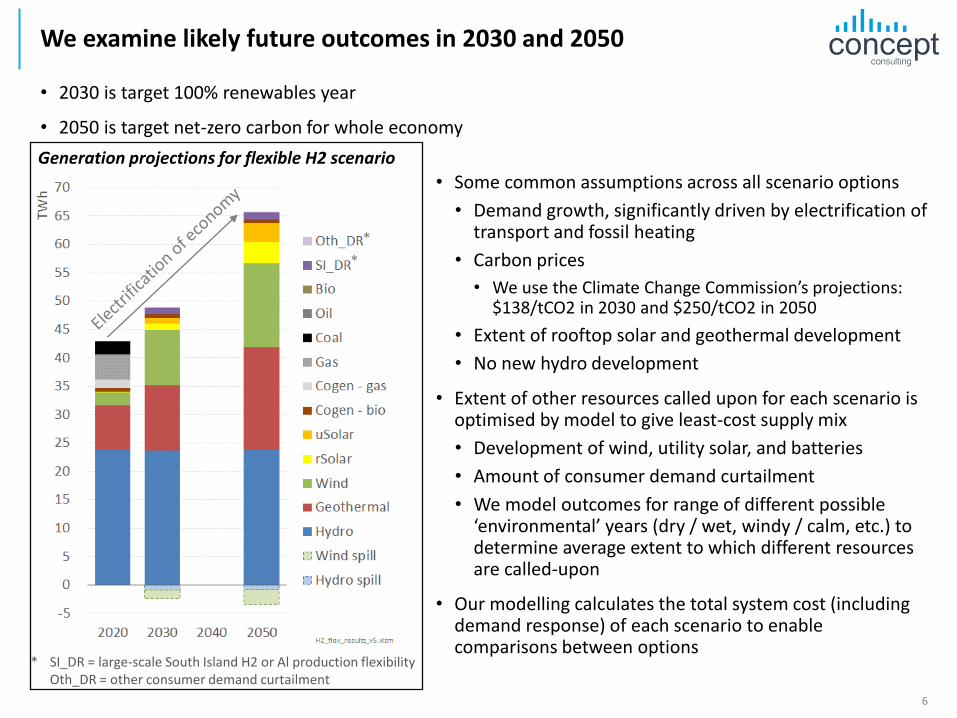
We examine likely future outcomes in 2030 and 2050
• 2030 is target 100% renewables year
• 2050 is target net-zero carbon for whole economy
6
• Some common assumptions across all scenario options
• Demand growth, significantly driven by electrification of transport and fossil heating
• Carbon prices
• We use the Climate Change Commission’s projections: $138/tCO2 in 2030 and $250/tCO2 in 2050
• Extent of rooftop solar and geothermal development
• No new hydro development
• Extent of other resources called upon for each scenario is optimised by model to give least-cost supply mix
• Development of wind, utility solar, and batteries
• Amount of consumer demand curtailment
• We model outcomes for range of different possible ‘environmental’ years (dry / wet, windy / calm, etc.) to determine average extent to which different resources are called-upon
• Our modelling calculates the total system cost (including demand response) of each scenario to enable comparisons between options
* SI_DR = large-scale South Island H2 or Al production flexibilityOth_DR = other consumer demand curtailment
*
*
Generation projections for flexible H2 scenario
Section 2: Results
7
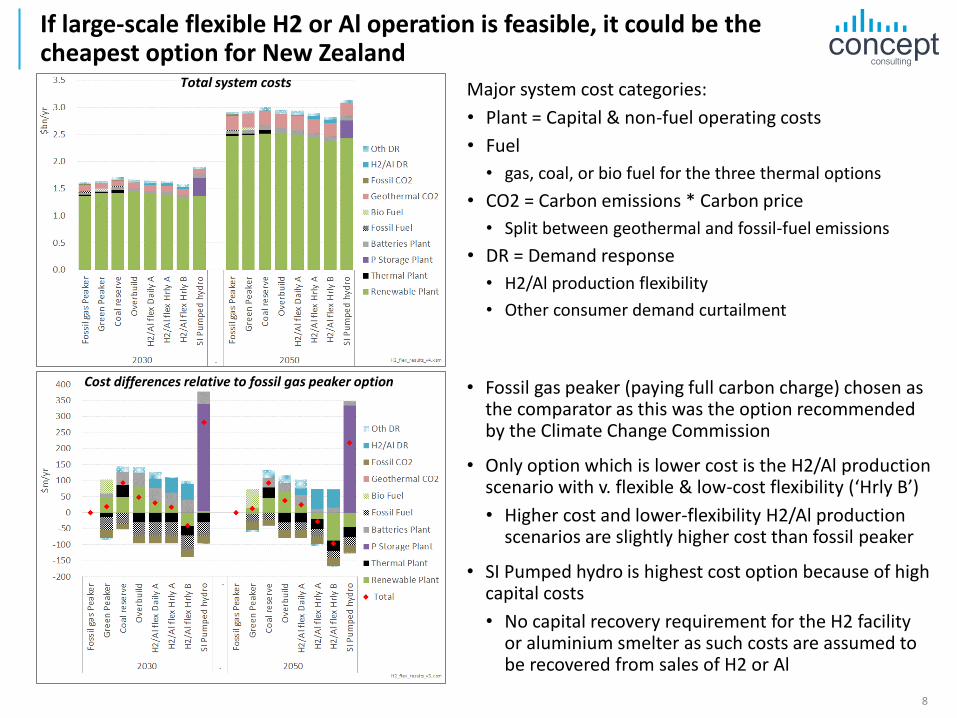
If large-scale flexible H2 or Al operation is feasible, it could be the cheapest option for New Zealand
8
Total system costs Major system cost categories:
• Plant = Capital & non-fuel operating costs
• Fuel
• gas, coal, or bio fuel for the three thermal options
• CO2 = Carbon emissions * Carbon price
• Split between geothermal and fossil-fuel emissions
• DR = Demand response
• H2/Al production flexibility
• Other consumer demand curtailment
Cost differences relative to fossil gas peaker option • Fossil gas peaker (paying full carbon charge) chosen as the comparator as this was the option recommended by the Climate Change Commission
• Only option which is lower cost is the H2/Al production scenario with v. flexible & low-cost flexibility (‘Hrly B’)
• Higher cost and lower-flexibility H2/Al production scenarios are slightly higher cost than fossil peaker
• SI Pumped hydro is highest cost option because of high capital costs
• No capital recovery requirement for the H2 facility or aluminium smelter as such costs are assumed to be recovered from sales of H2 or Al
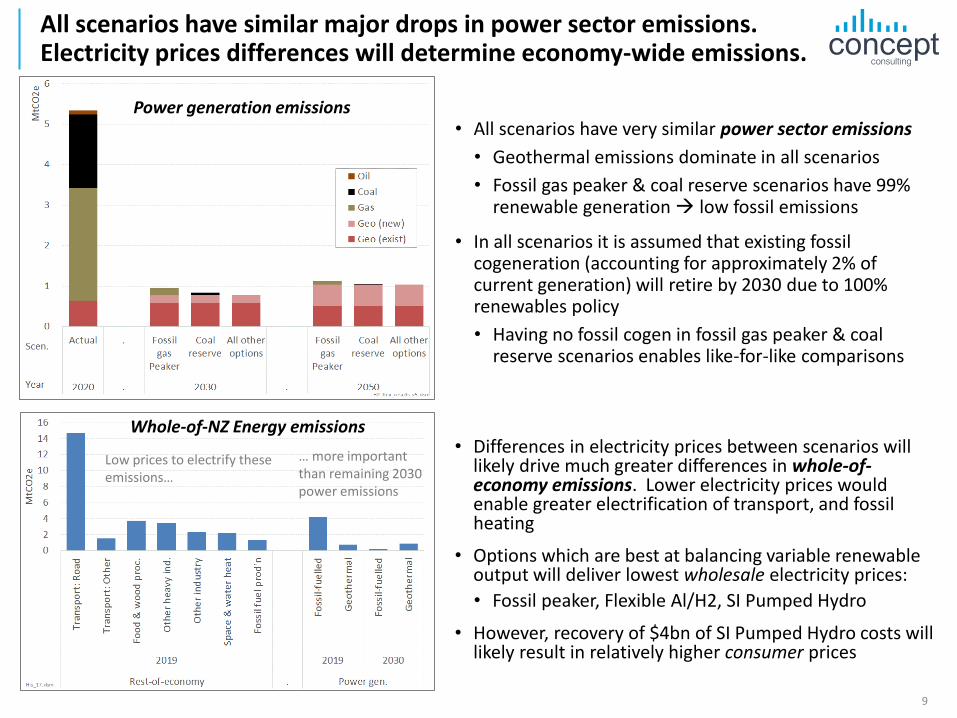
All scenarios have similar major drops in power sector emissions. Electricity prices differences will determine economy-wide emissions.
• All scenarios have very similar power sector emissions
• Geothermal emissions dominate in all scenarios
• Fossil gas peaker & coal reserve scenarios have 99% renewable generation → low fossil emissions
• In all scenarios it is assumed that existing fossil cogeneration (accounting for approximately 2% of current generation) will retire by 2030 due to 100% renewables policy
• Having no fossil cogen in fossil gas peaker & coal reserve scenarios enables like-for-like comparisons
9
Power generation emissions
• Differences in electricity prices between scenarios will likely drive much greater differences in whole-of-economy emissions. Lower electricity prices would enable greater electrification of transport, and fossil heating
• Options which are best at balancing variable renewable output will deliver lowest wholesale electricity prices:
• Fossil peaker, Flexible Al/H2, SI Pumped Hydro
• However, recovery of $4bn of SI Pumped Hydro costs will likely result in relatively higher consumer prices
Low prices to electrify these emissions…
… more important than remaining 2030 power emissions
Whole-of-NZ Energy emissions
Section 3: Discussion and conclusions
10
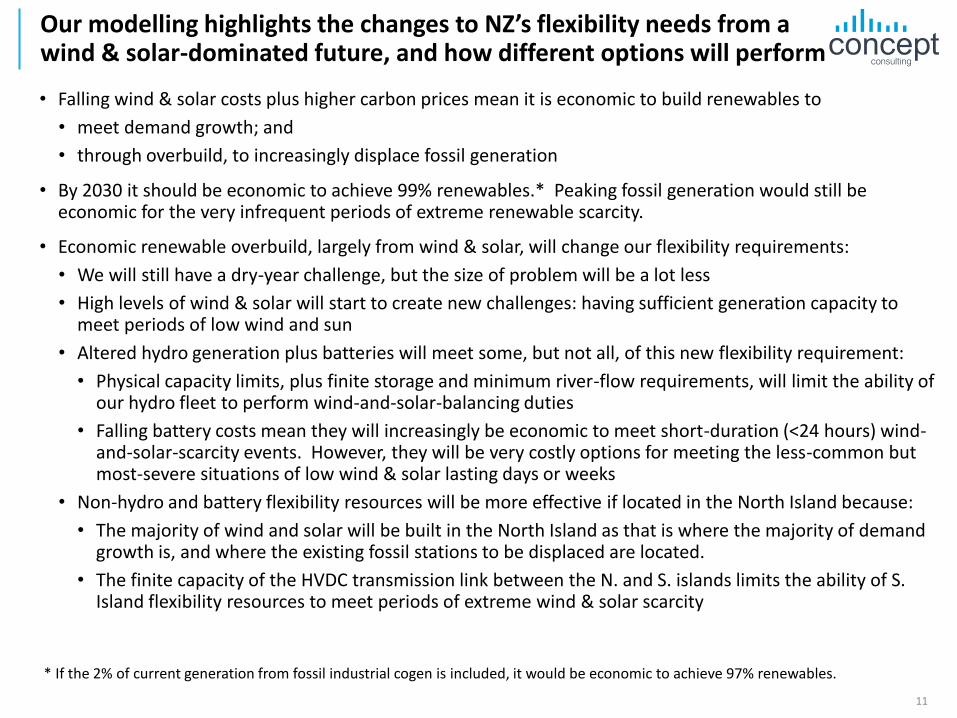
Our modelling highlights the changes to NZ’s flexibility needs from a wind & solar-dominated future, and how different options will perform
• Falling wind & solar costs plus higher carbon prices mean it is economic to build renewables to
• meet demand growth; and
• through overbuild, to increasingly displace fossil generation
• By 2030 it should be economic to achieve 99% renewables.* Peaking fossil generation would still be economic for the very infrequent periods of extreme renewable scarcity.
• Economic renewable overbuild, largely from wind & solar, will change our flexibility requirements:
• We will still have a dry-year challenge, but the size of problem will be a lot less
• High levels of wind & solar will start to create new challenges: having sufficient generation capacity to meet periods of low wind and sun
• Altered hydro generation plus batteries will meet some, but not all, of this new flexibility requirement:
• Physical capacity limits, plus finite storage and minimum river-flow requirements, will limit the ability of our hydro fleet to perform wind-and-solar-balancing duties
• Falling battery costs mean they will increasingly be economic to meet short-duration (<24 hours) wind-and-solar-scarcity events. However, they will be very costly options for meeting the less-common but most-severe situations of low wind & solar lasting days or weeks
• Non-hydro and battery flexibility resources will be more effective if located in the North Island because:
• The majority of wind and solar will be built in the North Island as that is where the majority of demand growth is, and where the existing fossil stations to be displaced are located.
• The finite capacity of the HVDC transmission link between the N. and S. islands limits the ability of S. Island flexibility resources to meet periods of extreme wind & solar scarcity
11
* If the 2% of current generation from fossil industrial cogen is included, it would be economic to achieve 97% renewables.
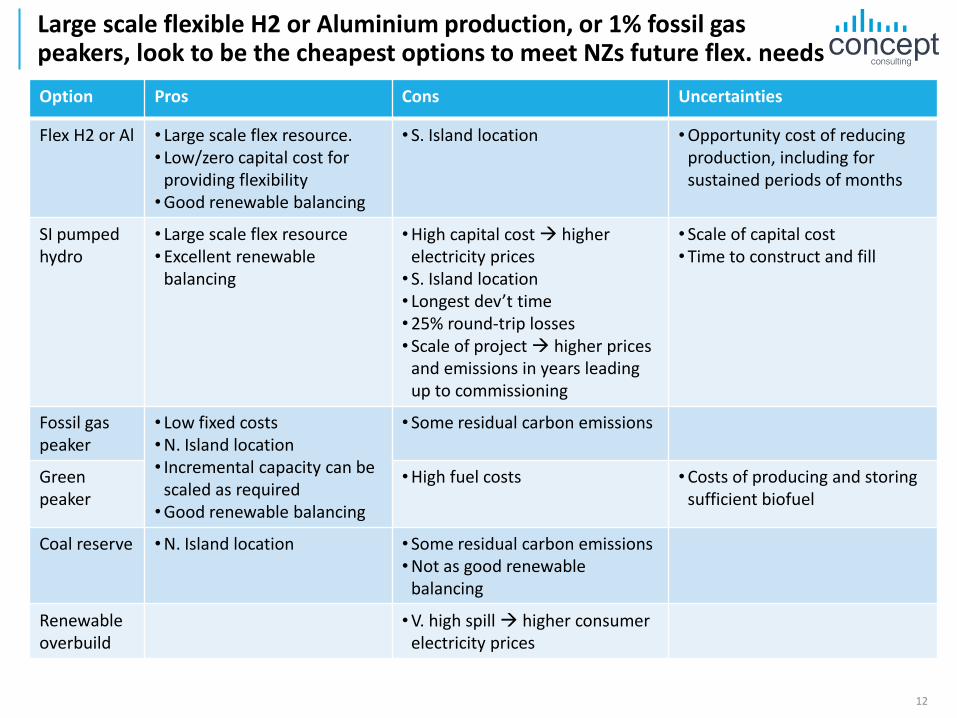
Large scale flexible H2 or Aluminium production, or 1% fossil gas peakers, look to be the cheapest options to meet NZs future flex. needs
Option Pros Cons Uncertainties
Flex H2 or Al • Large scale flex resource. • Low/zero capital cost for
providing flexibility•Good renewable balancing
• S. Island location •Opportunity cost of reducing production, including for sustained periods of months
SI pumped hydro
• Large scale flex resource•Excellent renewable
balancing
•High capital cost → higher electricity prices• S. Island location• Longest dev’t time•25% round-trip losses• Scale of project → higher prices
and emissions in years leading up to commissioning
• Scale of capital cost•Time to construct and fill
Fossil gas peaker
• Low fixed costs•N. Island location• Incremental capacity can be
scaled as required•Good renewable balancing
• Some residual carbon emissions
Green peaker
•High fuel costs •Costs of producing and storing sufficient biofuel
Coal reserve •N. Island location • Some residual carbon emissions•Not as good renewable
balancing
Renewable overbuild
•V. high spill → higher consumer electricity prices
12
Option Pros Cons Uncertainties
Flex H2 or Al • Large scale flex resource. • Low/zero capital cost for
providing flexibility•Good renewable balancing
• S. Island location •Opportunity cost of reducing production, including for sustained periods of months
SI pumped hydro
• Large scale flex resource•Excellent renewable
balancing
•High capital cost → higher electricity prices• S. Island location• Longest dev’t time•25% round-trip losses• Scale of project → higher prices
and emissions in years leading up to commissioning
• Scale of capital cost•Time to construct and fill
Fossil gas peaker
• Low fixed costs•N. Island location• Incremental capacity can be
scaled as required•Good renewable balancing
• Some residual carbon emissions
Green peaker
•High fuel costs •Costs of producing and storing sufficient biofuel
Coal reserve •N. Island location • Some residual carbon emissions•Not as good renewable
balancing
Renewable overbuild
•V. high spill → higher consumer electricity prices
About Concept Consulting Group Ltd (www.concept.co.nz)
Concept is one of New Zealand’s applied economics consultancies. We have been providing high-quality advice and analysis for more than 20 years across the energy sector, and in environmental and resource economics. We have also translated our skills to assignments in telecommunications and water infrastructure.
Our strength is from combining economic & regulatory expertise with deep sector knowledge and leading quantitative analysis.
Our directors have all held senior executive roles in the energy sector, and our team has a breadth of policy, regulatory, economic analysis, strategy, modelling, forecasting, and reporting expertise. Our clients include large users, suppliers, regulators, and governments – both in New Zealand and the wider Asia-Pacific region.
Disclaimer
Except as expressly provided for in our engagement terms, Concept and its staff shall not, and do not, accept any liability for errors or omissions in this report or for any consequences of reliance on its content, conclusions or any material, correspondence of any form or discussions, arising out of or associated with its preparation.
The analysis and opinions set out in this report reflect Concept’s best professional judgement at the time of writing. Concept shall not be liable for, and expressly excludes in advance any liability to update the analysis or information contained in this report after the date of the report, whether or not it has an effect on the findings and conclusions contained in the report.
This report remains subject to any other qualifications or limitations set out in the engagement terms.
No part of this report may be published without prior written approval of Concept.
© Copyright 2021
Concept Consulting Group Limited
All rights reserved
13