Embed Size (px)
Citation preview
19
Hydrodynamic Characterization of Industrial Flotation Machines Using Radioisotopes
Juan Yianatos1 and Francisco Díaz2 1Department of Chemical Engineering, Santa Maria University,
2Nuclear Applications Dept., Chilean Commission of Nuclear Energy, Chile
1. Introduction
1.1 Objective and organization of chapter In order to study the hydrodynamic behaviour of large flotation machines, the radioactive tracer technique has been used to measure a number of internal characteristics such as:
• Residence time distribution (RTD) of liquid, solid and gas, in industrial cells and columns. Actual mean residence time evaluation.
• Mixing regime in single cells, banks of cells and pneumatic columns.
• Froth mean residence time of liquid, floatable and non-floatable solids.
• Mixing time and internal pulp circulation in large industrial self-aerated cells.
• Gas holdup and gas residence time distribution in flotation machines.
• Direct measurement of gangue entrainment.
• Industrial flotation cell scanning with gamma ray.
• Pulp flowrate distribution in parallel flotation banks.
• Flotation rate distribution.
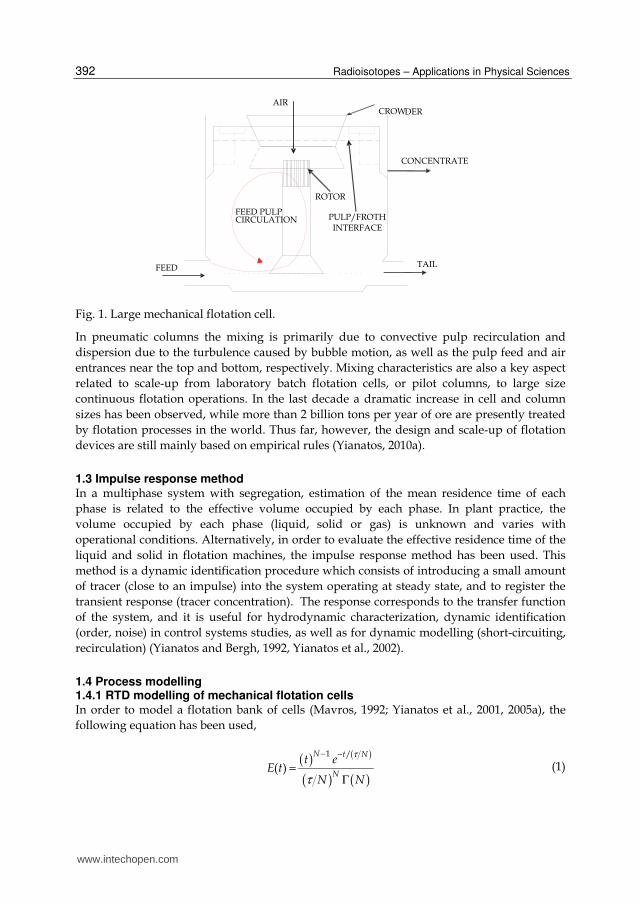
1.2 Relevance to industrial flotation machines Industrial flotation cells need to accomplish several functions such as: air bubble
dispersion, solid suspension as well as to provide the best conditions for bubble-particle
collision, aggregate formation and froth transport. For this reason, cells are typically
provided with mechanical agitation systems which generate well mixed conditions for the
pulp and air bubbles. In an industrial mechanical cell, however, the mixing condition
prevents that particles have the same opportunity to be collected because a significant
fraction of them actually spent a very short time in the cell (in a well-mixed condition
almost 40% of particles stay in the cell for less than a half of the mean residence time).
Because of the large short circuit in single continuous cells, the industrial flotation
operation considers the arrangement of cells in banks. Thus, banks of 5-10 cells in series
are commonly used in plant practice. The largest flotation cells presently used in
industrial flotation operation are 130, 160, 250 and 300 m3. Figure 1 show the main
characteristics of a self-aerated mechanical flotation cell, where the feed pulp circulates
upwards through a draft tube by the rotor. Also, the air is self-aspirated from the upper
part of the cell by the rotor.
www.intechopen.com
Radioisotopes – Applications in Physical Sciences
392
Fig. 1. Large mechanical flotation cell.
In pneumatic columns the mixing is primarily due to convective pulp recirculation and
dispersion due to the turbulence caused by bubble motion, as well as the pulp feed and air
entrances near the top and bottom, respectively. Mixing characteristics are also a key aspect
related to scale-up from laboratory batch flotation cells, or pilot columns, to large size
continuous flotation operations. In the last decade a dramatic increase in cell and column
sizes has been observed, while more than 2 billion tons per year of ore are presently treated
by flotation processes in the world. Thus far, however, the design and scale-up of flotation
devices are still mainly based on empirical rules (Yianatos, 2010a).
1.3 Impulse response method In a multiphase system with segregation, estimation of the mean residence time of each
phase is related to the effective volume occupied by each phase. In plant practice, the
volume occupied by each phase (liquid, solid or gas) is unknown and varies with
operational conditions. Alternatively, in order to evaluate the effective residence time of the
liquid and solid in flotation machines, the impulse response method has been used. This
method is a dynamic identification procedure which consists of introducing a small amount
of tracer (close to an impulse) into the system operating at steady state, and to register the
transient response (tracer concentration). The response corresponds to the transfer function
of the system, and it is useful for hydrodynamic characterization, dynamic identification
(order, noise) in control systems studies, as well as for dynamic modelling (short-circuiting,
recirculation) (Yianatos and Bergh, 1992, Yianatos et al., 2002).
1.4 Process modelling 1.4.1 RTD modelling of mechanical flotation cells In order to model a flotation bank of cells (Mavros, 1992; Yianatos et al., 2001, 2005a), the
following equation has been used,
( ) ( )
( ) ( )
1 /
( )
N t N
N
t eE t
N N
τ
τ
− −
=Γ
(1)
ROTOR
TAIL
PULP/FROTH INTERFACE
FEED
FEED PULPCIRCULATION
AIR CROWDER
CONCENTRATE
www.intechopen.com
Hydrodynamic Characterization of Industrial Flotation Machines Using Radioisotopes
393
which describes the continuous operation of “N” perfect mixed tank in series. For description of the RTD of a single large flotation cell, the LSTS model (large and small tank in series) has been used. This model gives a better fit to the actual flotation process of a single cell, which consists of one large perfect mixer (residence time τL) and one small perfect mixer in series (residence time τS) represented by the following equation,
/ /
( )S Lt t
S L
e eE t
τ τ
τ τ
− −−
=−
(2)
where the overall mean residence time τ is given by,
S Lτ τ τ= + (3)
Both models can be normalized in terms of the dimensionless time (θ=t/τ), as it was described by Yianatos et al. (2008c).
1.4.2 RTD modelling of pneumatic flotation columns A typical approach to describe the mixing condition in column flotation operations is the use of the axial dispersion model (Dobby and Finch, 1985). Also, the liquid RTD of industrial flotation columns can be described using a model of less than two perfect mixers in series. However, a better fit has been obtained using a model of one large perfect mixer (residence
time τL) and two small perfect mixers in series (residence time τS) represented by the following equation (Yianatos et al., 2005b),
( ) / //
( )S Lt t
S
L S
t e eE t
τ ττ α α
τ τ
− −− − +
=−
(4)
where
( )L L Sα τ τ τ= − (5)
1.5 Experimental method The hydrodynamic characteristics of industrial flotation machines have been evaluated from residence time distribution RTD measurements using radioactive tracers. This technique allows for non-invasive tracer detection, and is also adaptable to different kinds of equipment (Goodall and O’Connor, 1991, Niemi, 1995). However, the application of the radioactive tracer technique for industrial flotation characterization is rather scarce (Yianatos and Bergh, 1992, Lelinski et al., 2002). The procedure consists of selecting a liquid or solid tracer that allows on-line RTD data acquisition. The way the tracer is injected into the feed is critical in order to generate a pulse signal (closer to impulse). For this purposes, a pneumatic system of high reliability has been developed in order to introduce a small amount of radioactive tracer (around 100 mL of liquid, pulp with solids, or gas) at the feed pulp entrance (Díaz and Yianatos, 2010). Then, the time response of the radioactive tracer was measured on-line using non-invasive sensors located directly in different points of the cell or cell discharge. Activity (cps) was measured by scintillating crystal sensors of NaI(Tl)
www.intechopen.com
Radioisotopes – Applications in Physical Sciences
394
of 1”x1.5”, Saphymo Srat, thus allowing the simultaneous data acquisition of up to 12 control points, with a minimum period of 50 milliseconds. Br-82 in solution was used as liquid tracer, while mineral gangue was used as non-floatable irradiated solid tracer. The solid tracer was also tested at three size classes (coarse: +150, intermediate: -150+45 and, fine –45 microns) in order to evaluate solids transport and segregation in mechanical cells and pneumatic columns. Floatable irradiated solid tracer was used to evaluate the RTD of floatable minerals recovered into the concentrate. Also, Kripton-85 and Freon 13B1 have been used as gaseous tracers for industrial flotation columns and mechanical cells testing. Liquid, solid and gaseous tracers were irradiated at the nuclear reactor of the Chilean Commission of Nuclear Energy in Santiago, Chile. An advantage of using the radioactive tracer technique is the direct testing of the actual solid particles (similar physical and chemical properties, size distribution, shape, etc.). Tracer injection is almost instantaneous, because only a small amount of radioactive tracer is required. Another advantage is its capability for on-line measurements at various points inside the system without disturbances related to process sampling.
2. Results and applications
Residence time distribution measurements have been developed for flotation cells of 45, 100,
130, 160, 250 and 300 m3; this has allowed the evaluation of the mean residence time for
liquid and solid per size classes. Also, internal properties such as mixing regime, mixing
time, froth mean residence time and mineral entrainment in large industrial flotation cells
have been characterized by using radioactive tracers. The measurement of RTD in parallel
industrial flotation circuits allowed the identification of uneven pulp flowrate distribution.
Applications and results of using radioisotopes to characterize the hydrodynamic behaviour
of industrial flotation machines are presented as follows.
2.1 RTD of liquid, solid and gas, in industrial cells and columns: Actual mean residence time evaluation 2.1.1 Mechanical cells Measurements of RTD using radioactive tracer have been conducted in self-aerated and
forced air mechanical cells, as well as in banks with different number of cells in rougher,
cleaner and scavenger flotation circuits.
2.1.1.1 Liquid and solid tracer tests
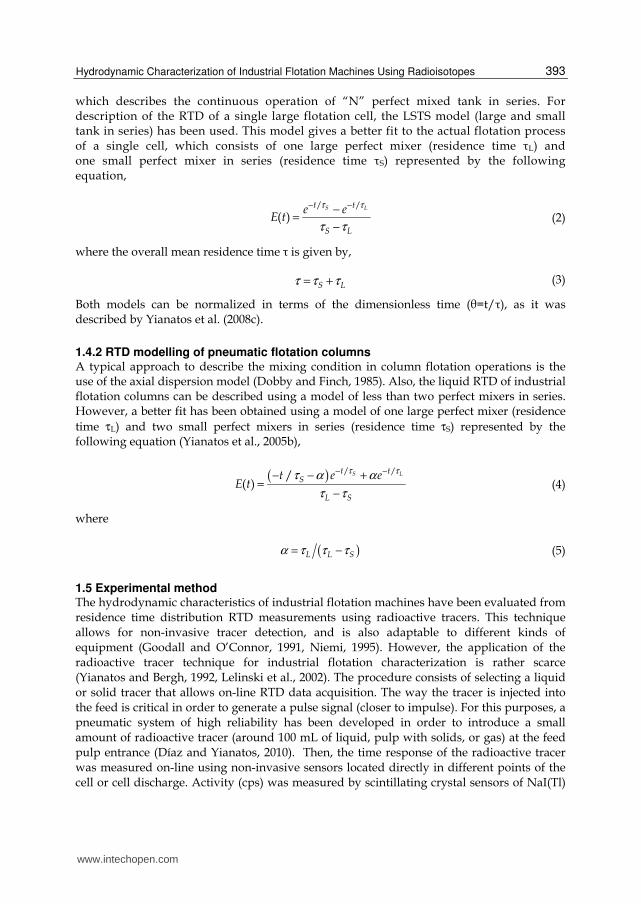
Figure 2 shows an example of the liquid residence time distribution after 1, 3, 5 and 7
cells in a bank of self-aerated flotation cells of 130 m3, at El Teniente, Codelco-Chile.
Here, it can be clearly observed the significant decrease in pulp short-circuiting by
increasing the number of cells in series in the flotation bank arrangement (Diaz and
Yianatos, 2010). Also, the continuous lines show the good agreement between the data
points and the RTD model, described by Eq.(1), for 3, 5 and 7 cells in series. While, for
the first cell the best fit was found using the LSTS model, Eq.(2), which confirmed that
the pulp zone in a single large flotation cell was not perfectly mixed. The mean residence
time calculated from the RTD data was in good agreement with the estimation of the
effective mean time according to the pulp flowrate, froth depth and gas holdup
measurements.
www.intechopen.com
Hydrodynamic Characterization of Industrial Flotation Machines Using Radioisotopes
395
0,0000
0,0005
0,0010
0,0015
0,0020
0,0025
0,0030
0,0035
0 500 1000 1500 2000 2500 3000 3500 4000
Time, s
RT
D,
E(t
)
N=1
N=3
N=5 N=7
Fig. 2. Liquid RTD in a flotation bank after 1, 3, 5 and 7 cells of 130 m3 (Diaz and Yianatos, 2010).
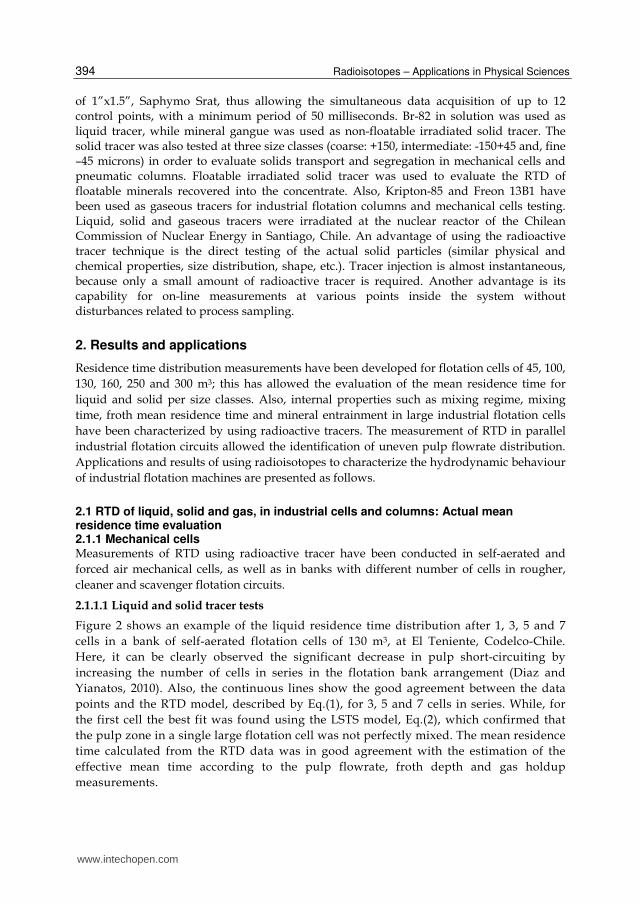
Figure 3(a) shows the experimental results of the solid residence time distribution in a rougher flotation bank at El Salvador, Codelco-Chile, consisting of nine 42.5 m3 self-aerated mechanical cells in series (Yianatos et al., 2002). Activated mineral gangue (final tailing) was used as solid non-floatable tracer. For this operation the tank-in-series model, Eq. (1) in dimensionless form, considering N=9, showed a very good agreement with experimental data.
2.1.1.2 Mineral segregation: Effect of particle size on RTD
Figure 3(b) shows the effect of particle size on the RTD in a rougher flotation circuit, consisting of nine cells in series, 42.5 m3 each, at El Salvador, Codelco-Chile (Yianatos et al., 2003). It can be appreciated that mixing characteristics are similar for the different particle sizes. However, it was found that the mean residence time of solid was approximately 5% lower than liquid, thus showing a minor segregation mainly related with coarser particles (+100µm).
Fig. 3. (a) Solid RTD and (b) Effect of particle size classes in a flotation bank of nine cells (Yianatos et al., 2002).
(a) (b)
www.intechopen.com
Radioisotopes – Applications in Physical Sciences
396
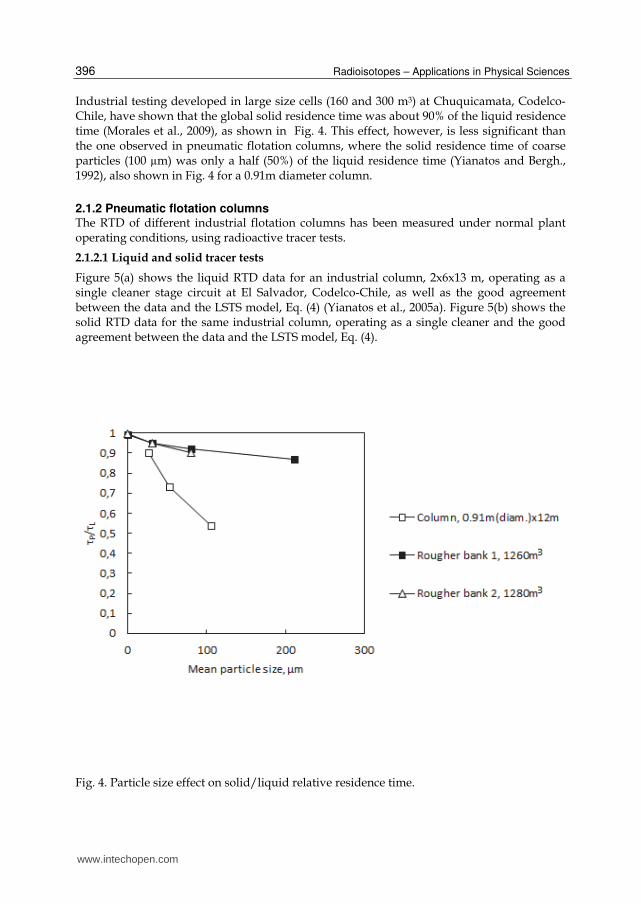
Industrial testing developed in large size cells (160 and 300 m3) at Chuquicamata, Codelco-Chile, have shown that the global solid residence time was about 90% of the liquid residence time (Morales et al., 2009), as shown in Fig. 4. This effect, however, is less significant than the one observed in pneumatic flotation columns, where the solid residence time of coarse particles (100 µm) was only a half (50%) of the liquid residence time (Yianatos and Bergh., 1992), also shown in Fig. 4 for a 0.91m diameter column.
2.1.2 Pneumatic flotation columns The RTD of different industrial flotation columns has been measured under normal plant operating conditions, using radioactive tracer tests.
2.1.2.1 Liquid and solid tracer tests
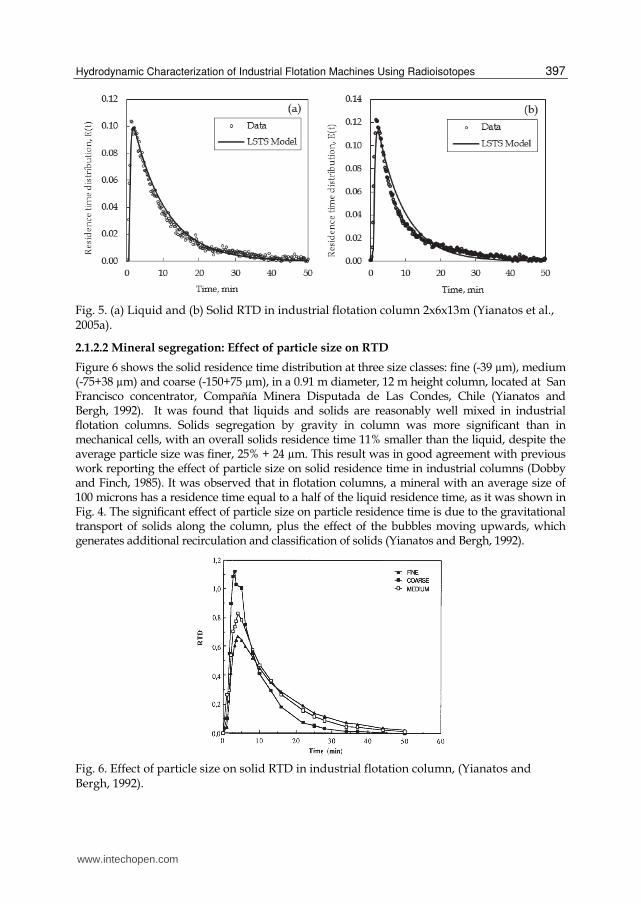
Figure 5(a) shows the liquid RTD data for an industrial column, 2x6x13 m, operating as a single cleaner stage circuit at El Salvador, Codelco-Chile, as well as the good agreement between the data and the LSTS model, Eq. (4) (Yianatos et al., 2005a). Figure 5(b) shows the solid RTD data for the same industrial column, operating as a single cleaner and the good agreement between the data and the LSTS model, Eq. (4).
Fig. 4. Particle size effect on solid/liquid relative residence time.
www.intechopen.com
Hydrodynamic Characterization of Industrial Flotation Machines Using Radioisotopes
397
Fig. 5. (a) Liquid and (b) Solid RTD in industrial flotation column 2x6x13m (Yianatos et al., 2005a).
2.1.2.2 Mineral segregation: Effect of particle size on RTD
Figure 6 shows the solid residence time distribution at three size classes: fine (-39 µm), medium (-75+38 µm) and coarse (-150+75 µm), in a 0.91 m diameter, 12 m height column, located at San Francisco concentrator, Compañía Minera Disputada de Las Condes, Chile (Yianatos and Bergh, 1992). It was found that liquids and solids are reasonably well mixed in industrial flotation columns. Solids segregation by gravity in column was more significant than in mechanical cells, with an overall solids residence time 11% smaller than the liquid, despite the average particle size was finer, 25% + 24 µm. This result was in good agreement with previous work reporting the effect of particle size on solid residence time in industrial columns (Dobby and Finch, 1985). It was observed that in flotation columns, a mineral with an average size of 100 microns has a residence time equal to a half of the liquid residence time, as it was shown in Fig. 4. The significant effect of particle size on particle residence time is due to the gravitational transport of solids along the column, plus the effect of the bubbles moving upwards, which generates additional recirculation and classification of solids (Yianatos and Bergh, 1992).
Fig. 6. Effect of particle size on solid RTD in industrial flotation column, (Yianatos and Bergh, 1992).
www.intechopen.com
Radioisotopes – Applications in Physical Sciences
398
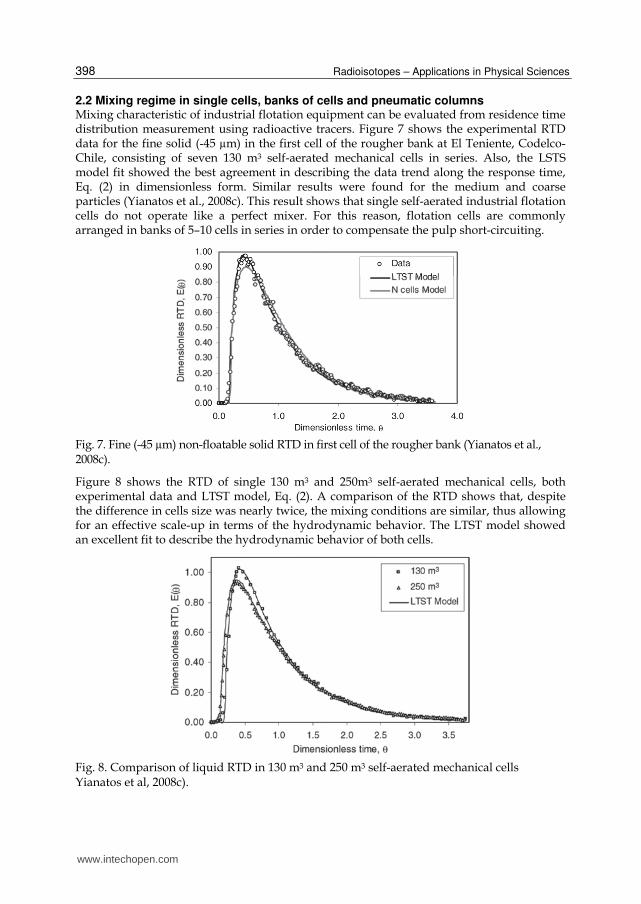
2.2 Mixing regime in single cells, banks of cells and pneumatic columns Mixing characteristic of industrial flotation equipment can be evaluated from residence time distribution measurement using radioactive tracers. Figure 7 shows the experimental RTD data for the fine solid (-45 µm) in the first cell of the rougher bank at El Teniente, Codelco-Chile, consisting of seven 130 m3 self-aerated mechanical cells in series. Also, the LSTS model fit showed the best agreement in describing the data trend along the response time, Eq. (2) in dimensionless form. Similar results were found for the medium and coarse particles (Yianatos et al., 2008c). This result shows that single self-aerated industrial flotation cells do not operate like a perfect mixer. For this reason, flotation cells are commonly arranged in banks of 5–10 cells in series in order to compensate the pulp short-circuiting.
Fig. 7. Fine (-45 µm) non-floatable solid RTD in first cell of the rougher bank (Yianatos et al., 2008c).
Figure 8 shows the RTD of single 130 m3 and 250m3 self-aerated mechanical cells, both experimental data and LTST model, Eq. (2). A comparison of the RTD shows that, despite the difference in cells size was nearly twice, the mixing conditions are similar, thus allowing for an effective scale-up in terms of the hydrodynamic behavior. The LTST model showed an excellent fit to describe the hydrodynamic behavior of both cells.
Fig. 8. Comparison of liquid RTD in 130 m3 and 250 m3 self-aerated mechanical cells Yianatos et al, 2008c).
www.intechopen.com
Hydrodynamic Characterization of Industrial Flotation Machines Using Radioisotopes
399
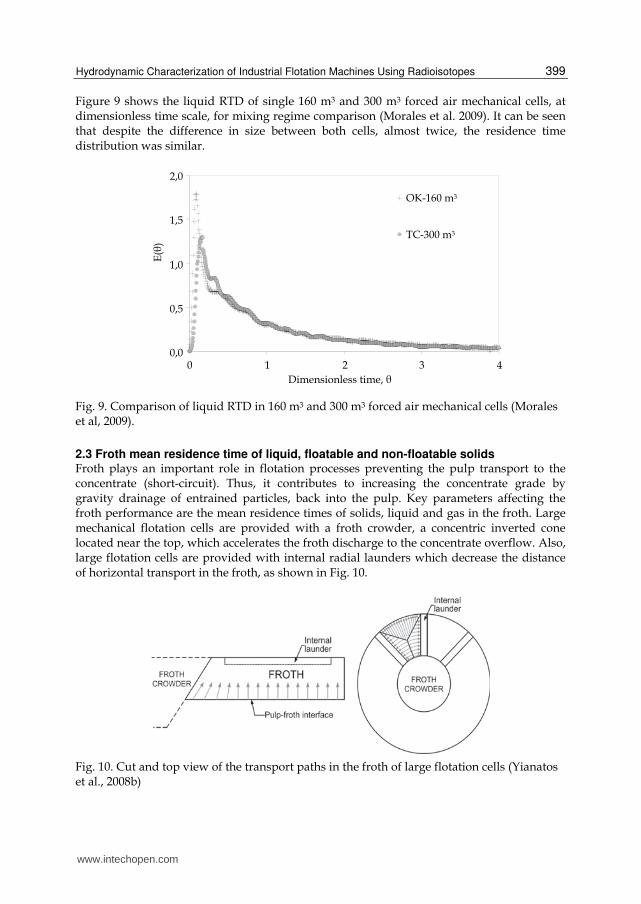
Figure 9 shows the liquid RTD of single 160 m3 and 300 m3 forced air mechanical cells, at dimensionless time scale, for mixing regime comparison (Morales et al. 2009). It can be seen that despite the difference in size between both cells, almost twice, the residence time distribution was similar.
Fig. 9. Comparison of liquid RTD in 160 m3 and 300 m3 forced air mechanical cells (Morales et al, 2009).
2.3 Froth mean residence time of liquid, floatable and non-floatable solids Froth plays an important role in flotation processes preventing the pulp transport to the concentrate (short-circuit). Thus, it contributes to increasing the concentrate grade by gravity drainage of entrained particles, back into the pulp. Key parameters affecting the froth performance are the mean residence times of solids, liquid and gas in the froth. Large mechanical flotation cells are provided with a froth crowder, a concentric inverted cone located near the top, which accelerates the froth discharge to the concentrate overflow. Also, large flotation cells are provided with internal radial launders which decrease the distance of horizontal transport in the froth, as shown in Fig. 10.
Fig. 10. Cut and top view of the transport paths in the froth of large flotation cells (Yianatos et al., 2008b)
0,0
0,5
1,0
1,5
2,0
0 1 2 3 4
Dimensionless time, θ
E(θ
)
OK-160 m3
TC-300 m3
www.intechopen.com
Radioisotopes – Applications in Physical Sciences
400
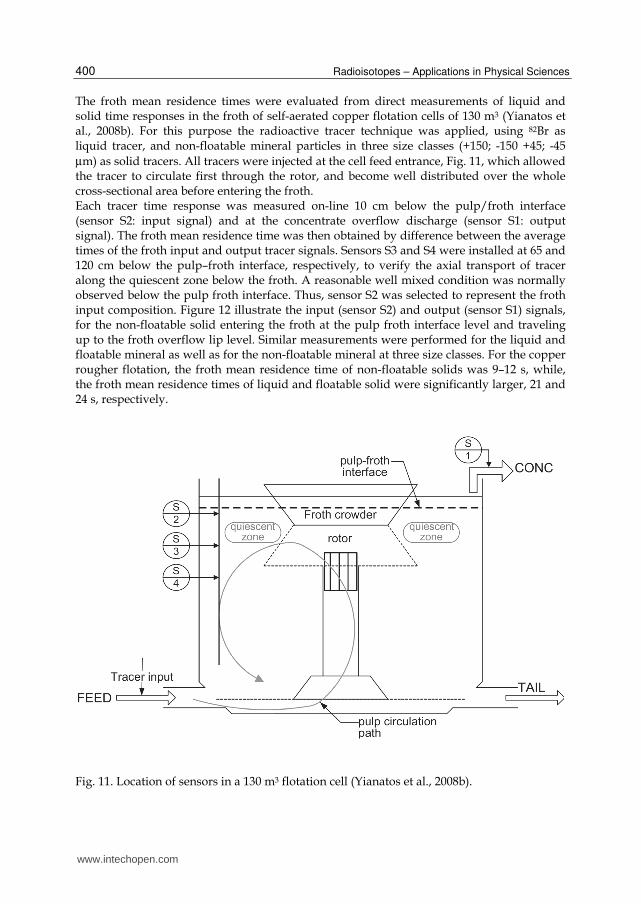
The froth mean residence times were evaluated from direct measurements of liquid and solid time responses in the froth of self-aerated copper flotation cells of 130 m3 (Yianatos et al., 2008b). For this purpose the radioactive tracer technique was applied, using 82Br as liquid tracer, and non-floatable mineral particles in three size classes (+150; -150 +45; -45
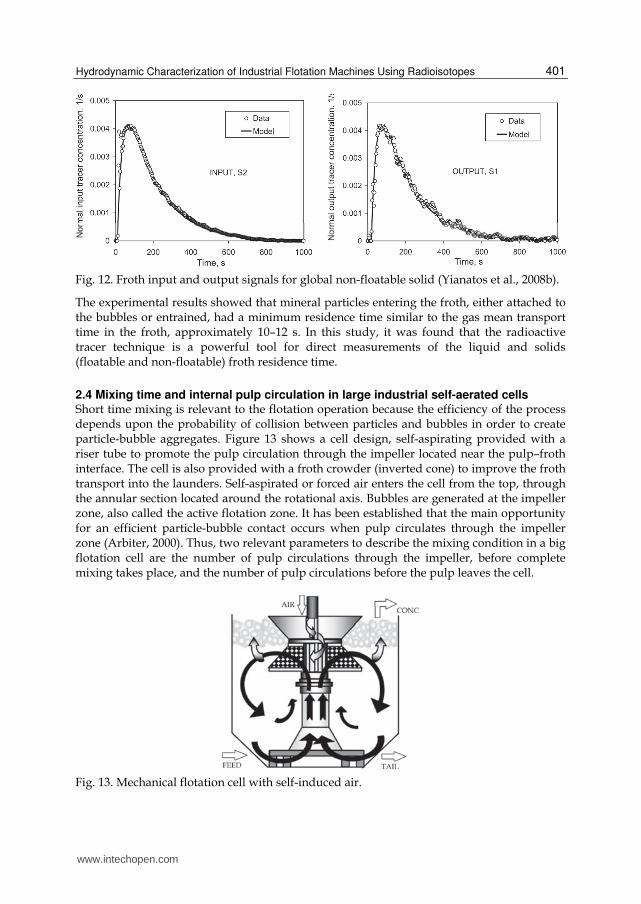
µm) as solid tracers. All tracers were injected at the cell feed entrance, Fig. 11, which allowed the tracer to circulate first through the rotor, and become well distributed over the whole cross-sectional area before entering the froth. Each tracer time response was measured on-line 10 cm below the pulp/froth interface (sensor S2: input signal) and at the concentrate overflow discharge (sensor S1: output signal). The froth mean residence time was then obtained by difference between the average times of the froth input and output tracer signals. Sensors S3 and S4 were installed at 65 and 120 cm below the pulp–froth interface, respectively, to verify the axial transport of tracer along the quiescent zone below the froth. A reasonable well mixed condition was normally observed below the pulp froth interface. Thus, sensor S2 was selected to represent the froth input composition. Figure 12 illustrate the input (sensor S2) and output (sensor S1) signals, for the non-floatable solid entering the froth at the pulp froth interface level and traveling up to the froth overflow lip level. Similar measurements were performed for the liquid and floatable mineral as well as for the non-floatable mineral at three size classes. For the copper rougher flotation, the froth mean residence time of non-floatable solids was 9–12 s, while, the froth mean residence times of liquid and floatable solid were significantly larger, 21 and 24 s, respectively.
Fig. 11. Location of sensors in a 130 m3 flotation cell (Yianatos et al., 2008b).
www.intechopen.com
Hydrodynamic Characterization of Industrial Flotation Machines Using Radioisotopes
401
Fig. 12. Froth input and output signals for global non-floatable solid (Yianatos et al., 2008b).
The experimental results showed that mineral particles entering the froth, either attached to the bubbles or entrained, had a minimum residence time similar to the gas mean transport time in the froth, approximately 10–12 s. In this study, it was found that the radioactive tracer technique is a powerful tool for direct measurements of the liquid and solids (floatable and non-floatable) froth residence time.
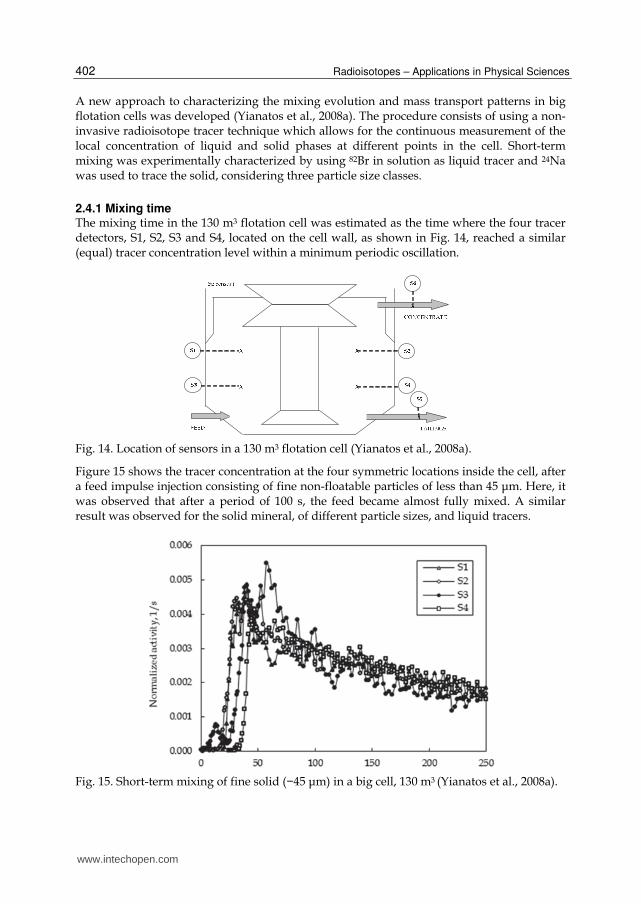
2.4 Mixing time and internal pulp circulation in large industrial self-aerated cells Short time mixing is relevant to the flotation operation because the efficiency of the process depends upon the probability of collision between particles and bubbles in order to create particle-bubble aggregates. Figure 13 shows a cell design, self-aspirating provided with a riser tube to promote the pulp circulation through the impeller located near the pulp–froth interface. The cell is also provided with a froth crowder (inverted cone) to improve the froth transport into the launders. Self-aspirated or forced air enters the cell from the top, through the annular section located around the rotational axis. Bubbles are generated at the impeller zone, also called the active flotation zone. It has been established that the main opportunity for an efficient particle-bubble contact occurs when pulp circulates through the impeller zone (Arbiter, 2000). Thus, two relevant parameters to describe the mixing condition in a big flotation cell are the number of pulp circulations through the impeller, before complete mixing takes place, and the number of pulp circulations before the pulp leaves the cell.
Fig. 13. Mechanical flotation cell with self-induced air.
www.intechopen.com
Radioisotopes – Applications in Physical Sciences
402
A new approach to characterizing the mixing evolution and mass transport patterns in big flotation cells was developed (Yianatos et al., 2008a). The procedure consists of using a non-invasive radioisotope tracer technique which allows for the continuous measurement of the local concentration of liquid and solid phases at different points in the cell. Short-term mixing was experimentally characterized by using 82Br in solution as liquid tracer and 24Na was used to trace the solid, considering three particle size classes.
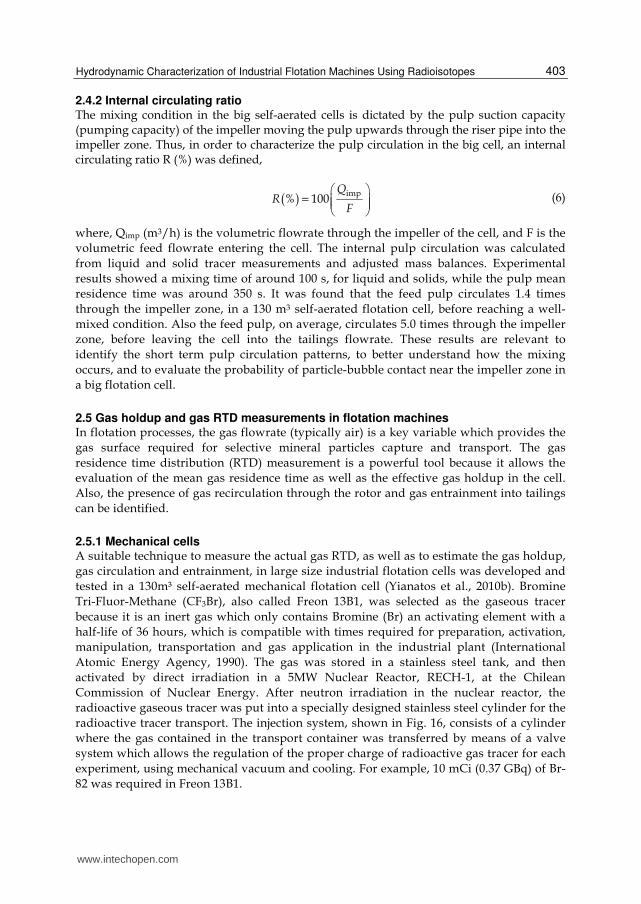
2.4.1 Mixing time The mixing time in the 130 m3 flotation cell was estimated as the time where the four tracer detectors, S1, S2, S3 and S4, located on the cell wall, as shown in Fig. 14, reached a similar (equal) tracer concentration level within a minimum periodic oscillation.
Fig. 14. Location of sensors in a 130 m3 flotation cell (Yianatos et al., 2008a).
Figure 15 shows the tracer concentration at the four symmetric locations inside the cell, after a feed impulse injection consisting of fine non-floatable particles of less than 45 μm. Here, it was observed that after a period of 100 s, the feed became almost fully mixed. A similar result was observed for the solid mineral, of different particle sizes, and liquid tracers.
Fig. 15. Short-term mixing of fine solid (−45 μm) in a big cell, 130 m3 (Yianatos et al., 2008a).
www.intechopen.com
Hydrodynamic Characterization of Industrial Flotation Machines Using Radioisotopes
403
2.4.2 Internal circulating ratio The mixing condition in the big self-aerated cells is dictated by the pulp suction capacity (pumping capacity) of the impeller moving the pulp upwards through the riser pipe into the impeller zone. Thus, in order to characterize the pulp circulation in the big cell, an internal circulating ratio R (%) was defined,
( )imp
% 100Q
RF
= (6)
where, Qimp (m3/h) is the volumetric flowrate through the impeller of the cell, and F is the
volumetric feed flowrate entering the cell. The internal pulp circulation was calculated
from liquid and solid tracer measurements and adjusted mass balances. Experimental
results showed a mixing time of around 100 s, for liquid and solids, while the pulp mean
residence time was around 350 s. It was found that the feed pulp circulates 1.4 times
through the impeller zone, in a 130 m3 self-aerated flotation cell, before reaching a well-
mixed condition. Also the feed pulp, on average, circulates 5.0 times through the impeller
zone, before leaving the cell into the tailings flowrate. These results are relevant to
identify the short term pulp circulation patterns, to better understand how the mixing
occurs, and to evaluate the probability of particle-bubble contact near the impeller zone in
a big flotation cell.
2.5 Gas holdup and gas RTD measurements in flotation machines In flotation processes, the gas flowrate (typically air) is a key variable which provides the
gas surface required for selective mineral particles capture and transport. The gas
residence time distribution (RTD) measurement is a powerful tool because it allows the
evaluation of the mean gas residence time as well as the effective gas holdup in the cell.
Also, the presence of gas recirculation through the rotor and gas entrainment into tailings
can be identified.
2.5.1 Mechanical cells A suitable technique to measure the actual gas RTD, as well as to estimate the gas holdup,
gas circulation and entrainment, in large size industrial flotation cells was developed and
tested in a 130m³ self-aerated mechanical flotation cell (Yianatos et al., 2010b). Bromine
Tri-Fluor-Methane (CF3Br), also called Freon 13B1, was selected as the gaseous tracer
because it is an inert gas which only contains Bromine (Br) an activating element with a
half-life of 36 hours, which is compatible with times required for preparation, activation,
manipulation, transportation and gas application in the industrial plant (International
Atomic Energy Agency, 1990). The gas was stored in a stainless steel tank, and then
activated by direct irradiation in a 5MW Nuclear Reactor, RECH-1, at the Chilean
Commission of Nuclear Energy. After neutron irradiation in the nuclear reactor, the
radioactive gaseous tracer was put into a specially designed stainless steel cylinder for the
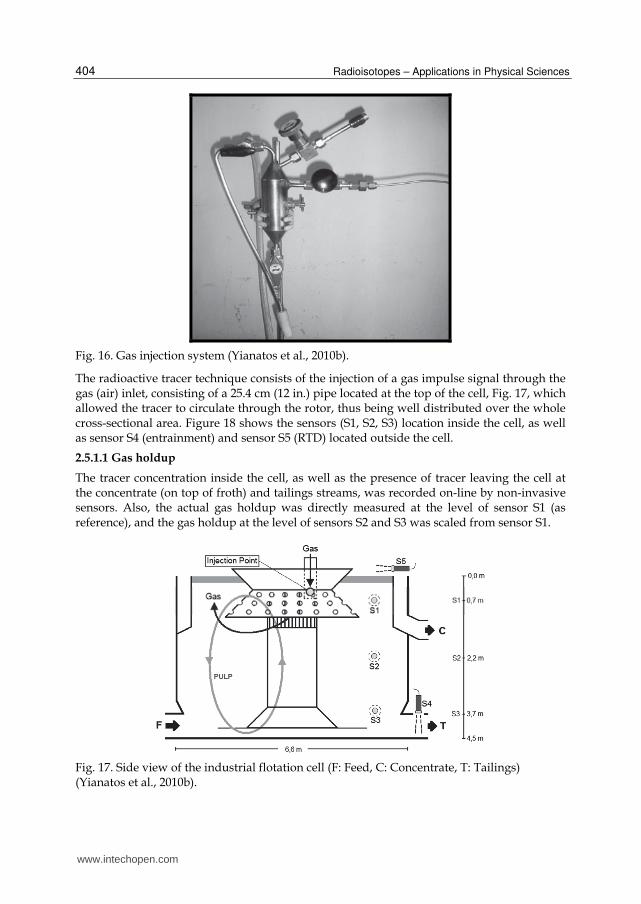
radioactive tracer transport. The injection system, shown in Fig. 16, consists of a cylinder
where the gas contained in the transport container was transferred by means of a valve
system which allows the regulation of the proper charge of radioactive gas tracer for each
experiment, using mechanical vacuum and cooling. For example, 10 mCi (0.37 GBq) of Br-
82 was required in Freon 13B1.
www.intechopen.com
Radioisotopes – Applications in Physical Sciences
404
Fig. 16. Gas injection system (Yianatos et al., 2010b).
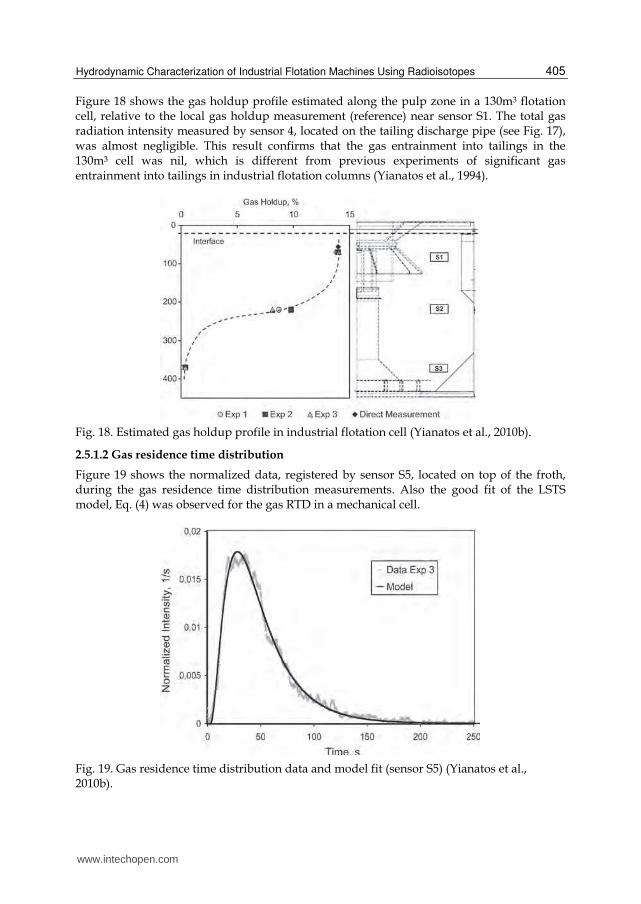
The radioactive tracer technique consists of the injection of a gas impulse signal through the gas (air) inlet, consisting of a 25.4 cm (12 in.) pipe located at the top of the cell, Fig. 17, which allowed the tracer to circulate through the rotor, thus being well distributed over the whole cross-sectional area. Figure 18 shows the sensors (S1, S2, S3) location inside the cell, as well as sensor S4 (entrainment) and sensor S5 (RTD) located outside the cell.
2.5.1.1 Gas holdup
The tracer concentration inside the cell, as well as the presence of tracer leaving the cell at the concentrate (on top of froth) and tailings streams, was recorded on-line by non-invasive sensors. Also, the actual gas holdup was directly measured at the level of sensor S1 (as reference), and the gas holdup at the level of sensors S2 and S3 was scaled from sensor S1.
Fig. 17. Side view of the industrial flotation cell (F: Feed, C: Concentrate, T: Tailings) (Yianatos et al., 2010b).
www.intechopen.com
Hydrodynamic Characterization of Industrial Flotation Machines Using Radioisotopes
405
Figure 18 shows the gas holdup profile estimated along the pulp zone in a 130m3 flotation cell, relative to the local gas holdup measurement (reference) near sensor S1. The total gas radiation intensity measured by sensor 4, located on the tailing discharge pipe (see Fig. 17), was almost negligible. This result confirms that the gas entrainment into tailings in the 130m3 cell was nil, which is different from previous experiments of significant gas entrainment into tailings in industrial flotation columns (Yianatos et al., 1994).
Fig. 18. Estimated gas holdup profile in industrial flotation cell (Yianatos et al., 2010b).
2.5.1.2 Gas residence time distribution
Figure 19 shows the normalized data, registered by sensor S5, located on top of the froth, during the gas residence time distribution measurements. Also the good fit of the LSTS model, Eq. (4) was observed for the gas RTD in a mechanical cell.
Fig. 19. Gas residence time distribution data and model fit (sensor S5) (Yianatos et al., 2010b).
www.intechopen.com
Radioisotopes – Applications in Physical Sciences
406
Once obtained the mean gas residence time, the effective gas volume in the industrial cell can be directly calculated from the gas flowrate measurement.
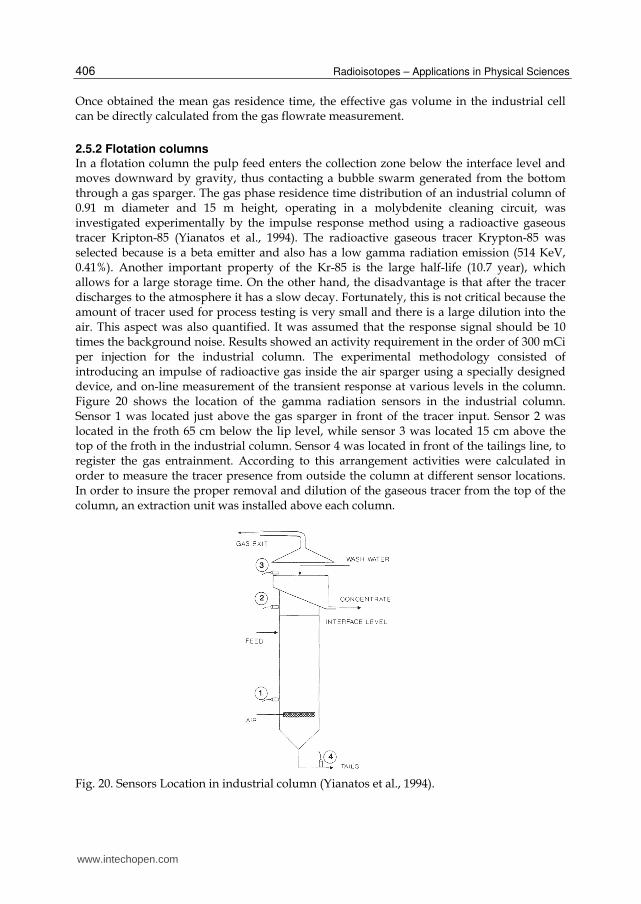
2.5.2 Flotation columns In a flotation column the pulp feed enters the collection zone below the interface level and moves downward by gravity, thus contacting a bubble swarm generated from the bottom through a gas sparger. The gas phase residence time distribution of an industrial column of 0.91 m diameter and 15 m height, operating in a molybdenite cleaning circuit, was investigated experimentally by the impulse response method using a radioactive gaseous tracer Kripton-85 (Yianatos et al., 1994). The radioactive gaseous tracer Krypton-85 was selected because is a beta emitter and also has a low gamma radiation emission (514 KeV, 0.41%). Another important property of the Kr-85 is the large half-life (10.7 year), which allows for a large storage time. On the other hand, the disadvantage is that after the tracer discharges to the atmosphere it has a slow decay. Fortunately, this is not critical because the amount of tracer used for process testing is very small and there is a large dilution into the air. This aspect was also quantified. It was assumed that the response signal should be 10 times the background noise. Results showed an activity requirement in the order of 300 mCi per injection for the industrial column. The experimental methodology consisted of introducing an impulse of radioactive gas inside the air sparger using a specially designed device, and on-line measurement of the transient response at various levels in the column. Figure 20 shows the location of the gamma radiation sensors in the industrial column. Sensor 1 was located just above the gas sparger in front of the tracer input. Sensor 2 was located in the froth 65 cm below the lip level, while sensor 3 was located 15 cm above the top of the froth in the industrial column. Sensor 4 was located in front of the tailings line, to register the gas entrainment. According to this arrangement activities were calculated in order to measure the tracer presence from outside the column at different sensor locations. In order to insure the proper removal and dilution of the gaseous tracer from the top of the column, an extraction unit was installed above each column.
Fig. 20. Sensors Location in industrial column (Yianatos et al., 1994).
www.intechopen.com
Hydrodynamic Characterization of Industrial Flotation Machines Using Radioisotopes
407
The system was arranged like an inverted funnel and was made of polyethylene and provided with a gas extractor to discharge the gaseous tracer outside the building. All the system was on-line monitored with portable radiation sensors during tests.
2.5.2.1 Gas injection system
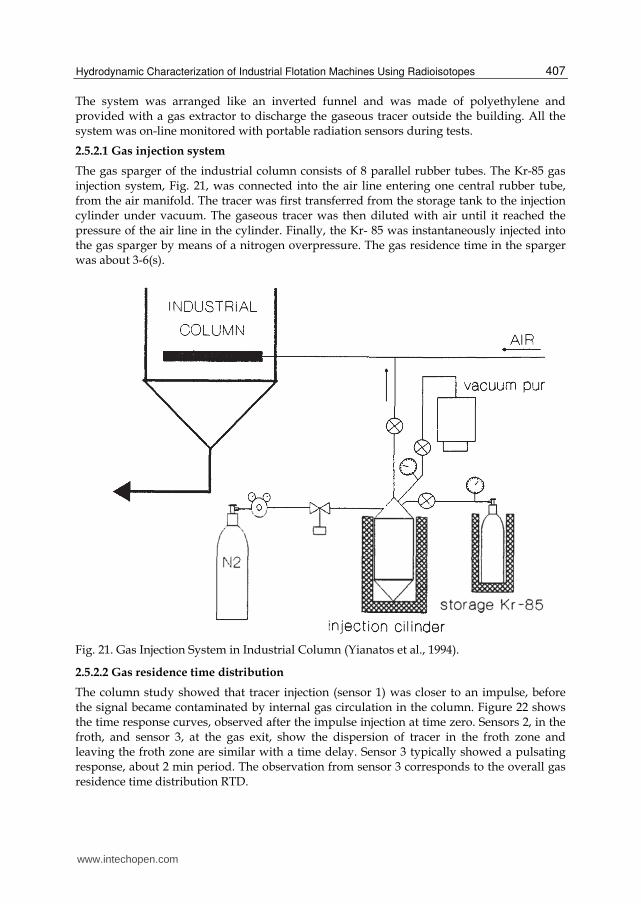
The gas sparger of the industrial column consists of 8 parallel rubber tubes. The Kr-85 gas injection system, Fig. 21, was connected into the air line entering one central rubber tube, from the air manifold. The tracer was first transferred from the storage tank to the injection cylinder under vacuum. The gaseous tracer was then diluted with air until it reached the pressure of the air line in the cylinder. Finally, the Kr- 85 was instantaneously injected into the gas sparger by means of a nitrogen overpressure. The gas residence time in the sparger was about 3-6(s).
Fig. 21. Gas Injection System in Industrial Column (Yianatos et al., 1994).
2.5.2.2 Gas residence time distribution
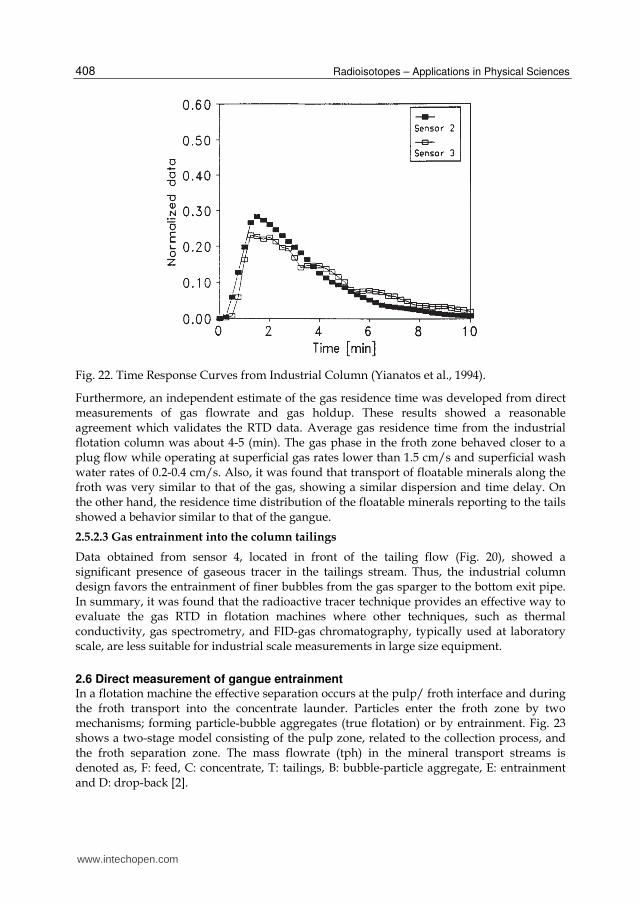
The column study showed that tracer injection (sensor 1) was closer to an impulse, before the signal became contaminated by internal gas circulation in the column. Figure 22 shows the time response curves, observed after the impulse injection at time zero. Sensors 2, in the froth, and sensor 3, at the gas exit, show the dispersion of tracer in the froth zone and leaving the froth zone are similar with a time delay. Sensor 3 typically showed a pulsating response, about 2 min period. The observation from sensor 3 corresponds to the overall gas residence time distribution RTD.
www.intechopen.com
Radioisotopes – Applications in Physical Sciences
408
Fig. 22. Time Response Curves from Industrial Column (Yianatos et al., 1994).
Furthermore, an independent estimate of the gas residence time was developed from direct measurements of gas flowrate and gas holdup. These results showed a reasonable agreement which validates the RTD data. Average gas residence time from the industrial flotation column was about 4-5 (min). The gas phase in the froth zone behaved closer to a plug flow while operating at superficial gas rates lower than 1.5 cm/s and superficial wash water rates of 0.2-0.4 cm/s. Also, it was found that transport of floatable minerals along the froth was very similar to that of the gas, showing a similar dispersion and time delay. On the other hand, the residence time distribution of the floatable minerals reporting to the tails showed a behavior similar to that of the gangue.
2.5.2.3 Gas entrainment into the column tailings
Data obtained from sensor 4, located in front of the tailing flow (Fig. 20), showed a significant presence of gaseous tracer in the tailings stream. Thus, the industrial column design favors the entrainment of finer bubbles from the gas sparger to the bottom exit pipe. In summary, it was found that the radioactive tracer technique provides an effective way to evaluate the gas RTD in flotation machines where other techniques, such as thermal conductivity, gas spectrometry, and FID-gas chromatography, typically used at laboratory scale, are less suitable for industrial scale measurements in large size equipment.
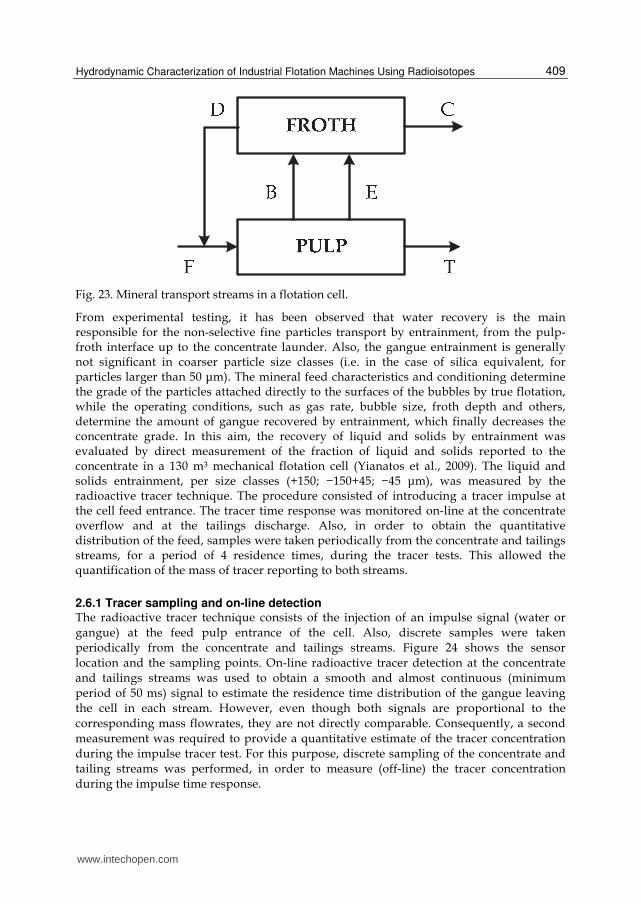
2.6 Direct measurement of gangue entrainment In a flotation machine the effective separation occurs at the pulp/ froth interface and during the froth transport into the concentrate launder. Particles enter the froth zone by two mechanisms; forming particle-bubble aggregates (true flotation) or by entrainment. Fig. 23 shows a two-stage model consisting of the pulp zone, related to the collection process, and the froth separation zone. The mass flowrate (tph) in the mineral transport streams is denoted as, F: feed, C: concentrate, T: tailings, B: bubble-particle aggregate, E: entrainment and D: drop-back [2].
www.intechopen.com
Hydrodynamic Characterization of Industrial Flotation Machines Using Radioisotopes
409
Fig. 23. Mineral transport streams in a flotation cell.
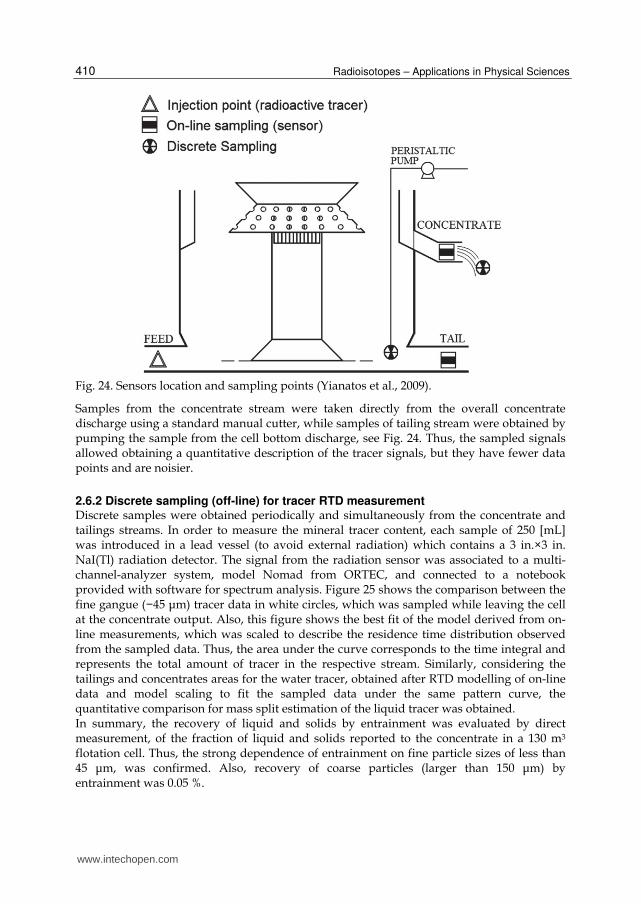
From experimental testing, it has been observed that water recovery is the main responsible for the non-selective fine particles transport by entrainment, from the pulp-froth interface up to the concentrate launder. Also, the gangue entrainment is generally not significant in coarser particle size classes (i.e. in the case of silica equivalent, for particles larger than 50 μm). The mineral feed characteristics and conditioning determine the grade of the particles attached directly to the surfaces of the bubbles by true flotation, while the operating conditions, such as gas rate, bubble size, froth depth and others, determine the amount of gangue recovered by entrainment, which finally decreases the concentrate grade. In this aim, the recovery of liquid and solids by entrainment was evaluated by direct measurement of the fraction of liquid and solids reported to the concentrate in a 130 m3 mechanical flotation cell (Yianatos et al., 2009). The liquid and solids entrainment, per size classes (+150; −150+45; −45 μm), was measured by the radioactive tracer technique. The procedure consisted of introducing a tracer impulse at the cell feed entrance. The tracer time response was monitored on-line at the concentrate overflow and at the tailings discharge. Also, in order to obtain the quantitative distribution of the feed, samples were taken periodically from the concentrate and tailings streams, for a period of 4 residence times, during the tracer tests. This allowed the quantification of the mass of tracer reporting to both streams.
2.6.1 Tracer sampling and on-line detection The radioactive tracer technique consists of the injection of an impulse signal (water or
gangue) at the feed pulp entrance of the cell. Also, discrete samples were taken periodically from the concentrate and tailings streams. Figure 24 shows the sensor
location and the sampling points. On-line radioactive tracer detection at the concentrate and tailings streams was used to obtain a smooth and almost continuous (minimum
period of 50 ms) signal to estimate the residence time distribution of the gangue leaving the cell in each stream. However, even though both signals are proportional to the
corresponding mass flowrates, they are not directly comparable. Consequently, a second measurement was required to provide a quantitative estimate of the tracer concentration
during the impulse tracer test. For this purpose, discrete sampling of the concentrate and tailing streams was performed, in order to measure (off-line) the tracer concentration
during the impulse time response.
www.intechopen.com
Radioisotopes – Applications in Physical Sciences
410
Fig. 24. Sensors location and sampling points (Yianatos et al., 2009).
Samples from the concentrate stream were taken directly from the overall concentrate discharge using a standard manual cutter, while samples of tailing stream were obtained by pumping the sample from the cell bottom discharge, see Fig. 24. Thus, the sampled signals allowed obtaining a quantitative description of the tracer signals, but they have fewer data points and are noisier.
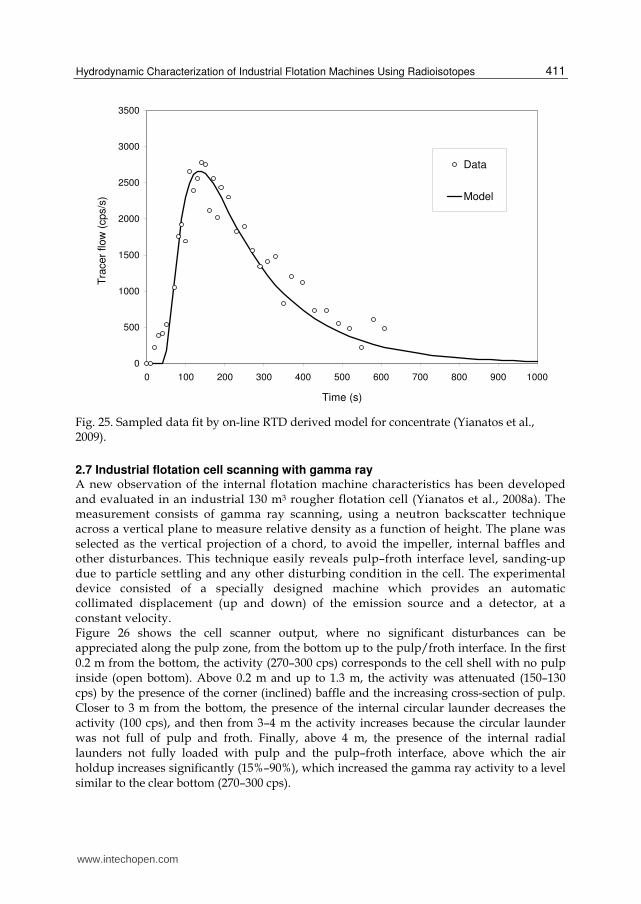
2.6.2 Discrete sampling (off-line) for tracer RTD measurement Discrete samples were obtained periodically and simultaneously from the concentrate and tailings streams. In order to measure the mineral tracer content, each sample of 250 [mL] was introduced in a lead vessel (to avoid external radiation) which contains a 3 in.×3 in. NaI(Tl) radiation detector. The signal from the radiation sensor was associated to a multi-channel-analyzer system, model Nomad from ORTEC, and connected to a notebook provided with software for spectrum analysis. Figure 25 shows the comparison between the fine gangue (−45 μm) tracer data in white circles, which was sampled while leaving the cell at the concentrate output. Also, this figure shows the best fit of the model derived from on-line measurements, which was scaled to describe the residence time distribution observed from the sampled data. Thus, the area under the curve corresponds to the time integral and represents the total amount of tracer in the respective stream. Similarly, considering the tailings and concentrates areas for the water tracer, obtained after RTD modelling of on-line data and model scaling to fit the sampled data under the same pattern curve, the quantitative comparison for mass split estimation of the liquid tracer was obtained. In summary, the recovery of liquid and solids by entrainment was evaluated by direct measurement, of the fraction of liquid and solids reported to the concentrate in a 130 m3 flotation cell. Thus, the strong dependence of entrainment on fine particle sizes of less than 45 μm, was confirmed. Also, recovery of coarse particles (larger than 150 μm) by entrainment was 0.05 %.
www.intechopen.com
Hydrodynamic Characterization of Industrial Flotation Machines Using Radioisotopes
411
0
500
1000
1500
2000
2500
3000
3500
0 100 200 300 400 500 600 700 800 900 1000
Time (s)
Tra
cer
flow
(cps/s
) .
Data
Model
Fig. 25. Sampled data fit by on-line RTD derived model for concentrate (Yianatos et al., 2009).
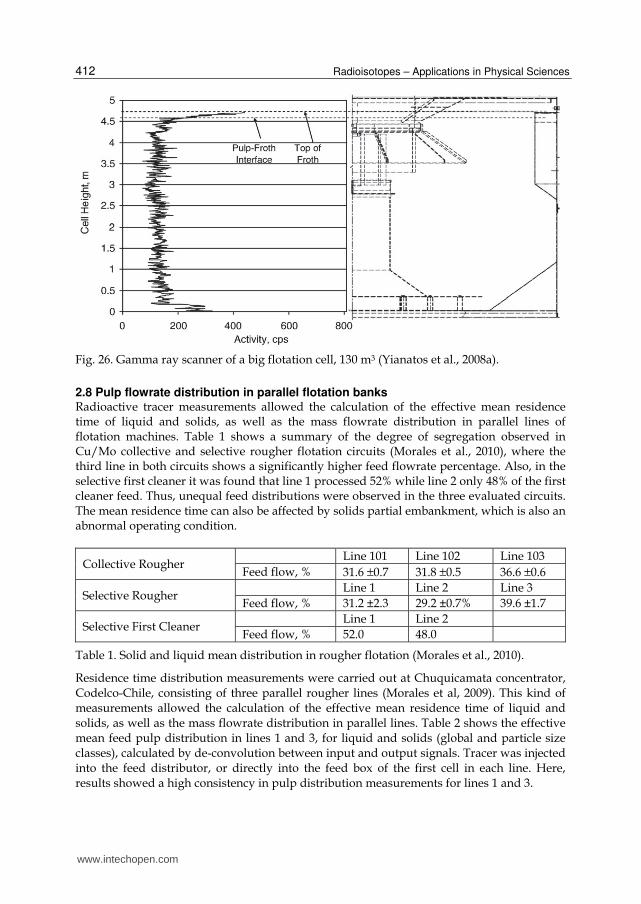
2.7 Industrial flotation cell scanning with gamma ray A new observation of the internal flotation machine characteristics has been developed and evaluated in an industrial 130 m3 rougher flotation cell (Yianatos et al., 2008a). The measurement consists of gamma ray scanning, using a neutron backscatter technique across a vertical plane to measure relative density as a function of height. The plane was selected as the vertical projection of a chord, to avoid the impeller, internal baffles and other disturbances. This technique easily reveals pulp–froth interface level, sanding-up due to particle settling and any other disturbing condition in the cell. The experimental device consisted of a specially designed machine which provides an automatic collimated displacement (up and down) of the emission source and a detector, at a constant velocity. Figure 26 shows the cell scanner output, where no significant disturbances can be appreciated along the pulp zone, from the bottom up to the pulp/froth interface. In the first 0.2 m from the bottom, the activity (270–300 cps) corresponds to the cell shell with no pulp inside (open bottom). Above 0.2 m and up to 1.3 m, the activity was attenuated (150–130 cps) by the presence of the corner (inclined) baffle and the increasing cross-section of pulp. Closer to 3 m from the bottom, the presence of the internal circular launder decreases the activity (100 cps), and then from 3–4 m the activity increases because the circular launder was not full of pulp and froth. Finally, above 4 m, the presence of the internal radial launders not fully loaded with pulp and the pulp–froth interface, above which the air holdup increases significantly (15%–90%), which increased the gamma ray activity to a level similar to the clear bottom (270–300 cps).
www.intechopen.com
Radioisotopes – Applications in Physical Sciences
412
Fig. 26. Gamma ray scanner of a big flotation cell, 130 m3 (Yianatos et al., 2008a).
2.8 Pulp flowrate distribution in parallel flotation banks Radioactive tracer measurements allowed the calculation of the effective mean residence time of liquid and solids, as well as the mass flowrate distribution in parallel lines of flotation machines. Table 1 shows a summary of the degree of segregation observed in Cu/Mo collective and selective rougher flotation circuits (Morales et al., 2010), where the third line in both circuits shows a significantly higher feed flowrate percentage. Also, in the selective first cleaner it was found that line 1 processed 52% while line 2 only 48% of the first cleaner feed. Thus, unequal feed distributions were observed in the three evaluated circuits. The mean residence time can also be affected by solids partial embankment, which is also an abnormal operating condition.
Collective Rougher Line 101 Line 102 Line 103
Feed flow, % 31.6 ±0.7 31.8 ±0.5 36.6 ±0.6
Selective Rougher Line 1 Line 2 Line 3
Feed flow, % 31.2 ±2.3 29.2 ±0.7% 39.6 ±1.7
Selective First Cleaner Line 1 Line 2
Feed flow, % 52.0 48.0
Table 1. Solid and liquid mean distribution in rougher flotation (Morales et al., 2010).
Residence time distribution measurements were carried out at Chuquicamata concentrator, Codelco-Chile, consisting of three parallel rougher lines (Morales et al, 2009). This kind of measurements allowed the calculation of the effective mean residence time of liquid and solids, as well as the mass flowrate distribution in parallel lines. Table 2 shows the effective mean feed pulp distribution in lines 1 and 3, for liquid and solids (global and particle size classes), calculated by de-convolution between input and output signals. Tracer was injected into the feed distributor, or directly into the feed box of the first cell in each line. Here, results showed a high consistency in pulp distribution measurements for lines 1 and 3.
www.intechopen.com
Hydrodynamic Characterization of Industrial Flotation Machines Using Radioisotopes
413
Rougher Line 1 Line 2 Line 3
Feed flow, % 33.6 ±0.4 36.0 30.4 ±1.7
Table 2. Feed pulp distribution in rougher flotation (Morales et al., 2009).
2.8.1 Effective volume of flotation cells Considering simultaneously the mineral treatment (tph), measured in the conventional
grinding plant in Colón, and the pulp mean residence time measured by radioactive tracer
tests in the rougher Metso cells (42.5 m3), an effective pulp volume of 82% of the total cell
volume was determined. This result was similar to that observed for similar cells (78.8-
80.4%), at El Salvador concentrator Codelco-Chile (Yianatos et al., 2001).
2.9 Flotation rate distribution 2.9.1 Introduction The batch flotation process has been commonly characterized assuming a flotation rate
distribution function F(k), e.g.: Dirac delta, Rectangular, Gamma or Weibull functions.
The identification of F(k) for the collection zone of single continuous industrial cells,
larger sizes, is more complex and a novel procedure to estimate the flotation rate
distribution from the collection zone of industrial flotation cells, using the radioactive
tracer technique, was recently described (Yianatos et al., 2010c). The approach consists of
measuring the impulse response of the floatable mineral tracer concentration, and non-
floatable gangue tracer concentration (Residence Time Distribution, RTD), in the cell
tailings. Then, the floatable tracer concentration can be compared with the model
prediction, using the Gamma function and the RTD of the non-floatable tracer. Thus, the
F(k) distribution parameters were obtained by means of the least-square estimation. The
new approach was successfully tested in two industrial rougher flotation cells of large
size using radioactive mineral tracers.
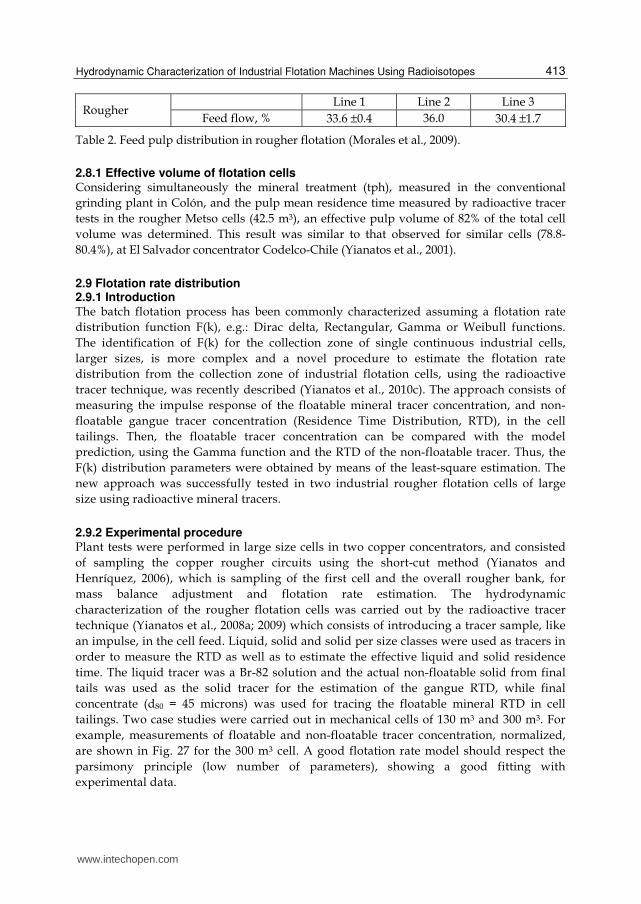
2.9.2 Experimental procedure Plant tests were performed in large size cells in two copper concentrators, and consisted
of sampling the copper rougher circuits using the short-cut method (Yianatos and
Henríquez, 2006), which is sampling of the first cell and the overall rougher bank, for
mass balance adjustment and flotation rate estimation. The hydrodynamic
characterization of the rougher flotation cells was carried out by the radioactive tracer
technique (Yianatos et al., 2008a; 2009) which consists of introducing a tracer sample, like
an impulse, in the cell feed. Liquid, solid and solid per size classes were used as tracers in
order to measure the RTD as well as to estimate the effective liquid and solid residence
time. The liquid tracer was a Br-82 solution and the actual non-floatable solid from final
tails was used as the solid tracer for the estimation of the gangue RTD, while final
concentrate (d80 = 45 microns) was used for tracing the floatable mineral RTD in cell
tailings. Two case studies were carried out in mechanical cells of 130 m3 and 300 m3. For
example, measurements of floatable and non-floatable tracer concentration, normalized,
are shown in Fig. 27 for the 300 m3 cell. A good flotation rate model should respect the
parsimony principle (low number of parameters), showing a good fitting with
experimental data.
www.intechopen.com
Radioisotopes – Applications in Physical Sciences
414
0 500 1000 15000
2
4
6
8
x 10-3
Time, s
Nor
mali
zed
C(t
), s-1
Non-floatable
Floatable
Fig. 27. Normalized mineral tracer concentration (Yianatos et al., 2010c).
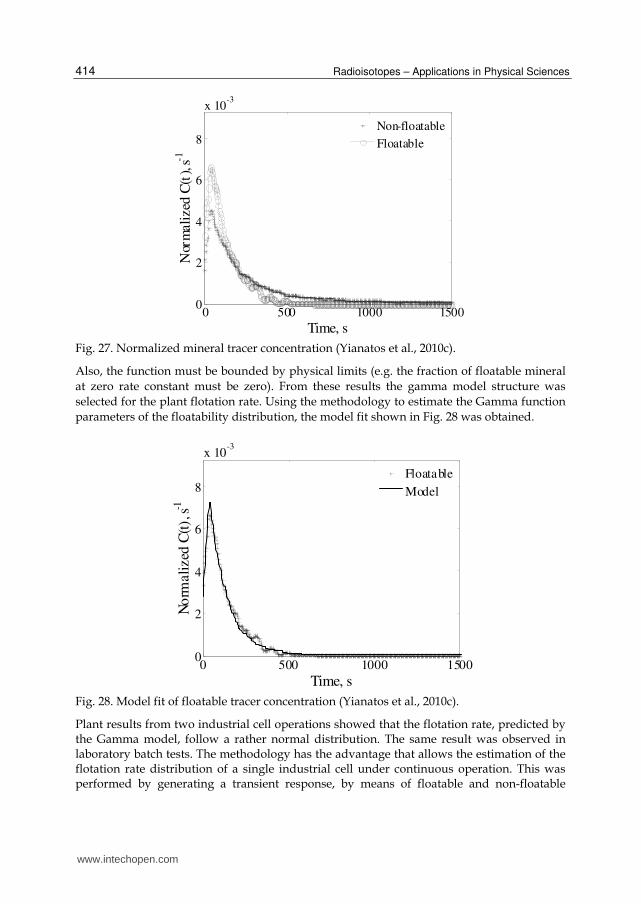
Also, the function must be bounded by physical limits (e.g. the fraction of floatable mineral
at zero rate constant must be zero). From these results the gamma model structure was
selected for the plant flotation rate. Using the methodology to estimate the Gamma function
parameters of the floatability distribution, the model fit shown in Fig. 28 was obtained.
0 500 1000 15000
2
4
6
8
x 10-3
Time, s
No
rmali
zed
C(t
), s-1
Floatable
Model
Fig. 28. Model fit of floatable tracer concentration (Yianatos et al., 2010c).
Plant results from two industrial cell operations showed that the flotation rate, predicted by the Gamma model, follow a rather normal distribution. The same result was observed in laboratory batch tests. The methodology has the advantage that allows the estimation of the flotation rate distribution of a single industrial cell under continuous operation. This was performed by generating a transient response, by means of floatable and non-floatable
www.intechopen.com
Hydrodynamic Characterization of Industrial Flotation Machines Using Radioisotopes
415
radioactive tracers, which allows the identification of the single cell parameters. The method requires additional measurements for mass balance around the cell as well as the froth recovery estimation.
3. Conclusions
The use of radioisotopes has proven to be a powerful tool to study the hydrodynamic behaviour of large flotation machines. Mean residence time in pulp and froth zones were evaluated from RTD measurements for liquid, solids and gas radioactive tracers. Relevant parameters such as mixing regime, mixing time, flow distribution in parallel flotation banks, gangue and gas entrainment, particles segregation, have been evaluated using non-invasive sensors for radiation detection without disturbing the flotation operation. This information is fundamental for improving flotation machines operation, control and optimization.
4. Acknowledgements
Funding for process modeling and control research is provided by CONICYT, Project Fondecyt 1100854, NEIM, Project P07-087-F, ICM-Mideplan, Santa Maria University, Project 271068, and the Chilean Commission of Nuclear Energy, CCHEN.
5. References
Arbiter, N. (2000). Development and scale-up of large flotation cells. Mining Engineering 52 (3), 28–33.
Díaz, F and Yianatos J. (2010). Residence time distribution in large industrial flotation cells. Atoms for Peace - an International Journal, Vol.3, N°1, pp.2-10.
Dobby, G.S. and J.A. Finch (1985). Mixing characteristics of industrial flotation columns. Chemical Engineering Science, 40, Nº7, 1061-1068.
Goodall, C.M. and O’Connor, C.T. (1991). Residence time distribution studies in a flotation column. Part 1: the modelling of residence time distributions in a laboratory column flotation cell. International Journal of Mineral Processing, 31(1-2), 97-113.
International Atomic Energy Agency. Guidebook on Radioisotopes Tracers in Industry. Reports Series Nº 16, Vienna (1990).
Lelinski, D. Allen, J., Redden, L., & Weber, A. (2002). Analysis of the residence time distribution in large flotation machines. Minerals Engineering, 15 (7), 499-505.
Mavros, P. (1992). Mixing and hydrodynamics in flotation cells. In: Mavros, P., Matis, K.A. (Eds.), Innovation in Flotation Technology, NATO Series, vol. E208. Kluwer Academic Publishers, The Netherlands, pp. 211–234.
Morales, P., Elgueta, H., Torres, C., Yianatos, J., Vinnett, L. and Diaz, F. (2010). Hydrodynamic and metalurgical characterization of flotation cells in a molybdenum plant. VII International Mineral Processing Seminar, Procemin 2010, Santiago, Chile.
Morales, P., Coddou, F., Yianatos, J., Contreras, F., Catalán, M., Díaz, F. (2009). Hydrodynamic Performance of the Division Codelco Norte Concentrator’s Large Flotation Cells. in: P. Amenlunxen, W. Kracht, R. Kuyvenhoven (Eds.), Proc. VI International Mineral Processing Seminar, 2-4 Dec., Santiago, Chile, 2009, pp. 385-393.
www.intechopen.com
Radioisotopes – Applications in Physical Sciences
416
Niemi, A.J. (1995). Role of kinetics in modelling and control of flotation plants. Powder Technology, 82, 69-77
Yianatos, J., Contreras, F., Morales, P., Coddou, F., Elgueta, H., Ortíz, J. (2010a). A novel scale-up method for mechanical flotation cells. Minerals Engineering, Vol.23, pp.877-884.
Yianatos J., Contreras F. and Díaz, F. (2010b). Gas holdup and RTD measurement in an industrial flotation cell. Minerals Engineering, Vol.23, pp.125-130.
Yianatos, J., Bergh, L., Vinnett, L., Contreras, F., Díaz, F. (2010c). Flotation rate distribution in the collection zone of industrial cells. Minerals Engineering, Vol.23, pp. 1030-1035.
Yianatos J.B., Contreras F., Díaz, F. and Villanueva, A. (2009). Direct measurement of entrainment in large flotation cells. Powder Technology, Vol.189, pp. 42-47.
Yianatos, J.B., Larenas, J., Moys, M., Díaz, F. (2008a). Short time response in a big flotation cell, International Journal of Mineral Processing, Vol. 89, pp. 1-8.
Yianatos J.B., Bergh, L.G., Tello, K., Díaz. F., Villanueva, A. (2008b). Froth mean residence time measurement in industrial flotation cells. Minerals Engineering, Vol.21, pp.982-988.
Yianatos J.B., Bergh, L.G., Tello, K., Díaz. F., Villanueva, A. (2008c). Residence time distribution in single big industrial flotation cells. Minerals & Metallurgical Processing Journal, Vol.25, Nº1, pp. 46-52.
Yianatos J.B. and Henríquez, F.H. (2006). Short-cut method for flotation rates modelling of industrial flotation banks. Minerals Engineering, Vol.19, pp. 1336-1340.
Yianatos, J.B. , Bergh, L.G., Díaz, F. and J. Rodríguez (2005a). Mixing characteristics of industrial flotation equipments. Chemical Engineering Science. Vol. 60, Nº 8/9, pp. 2273-2282.
Yianatos, J.B., Bucarey, R., Larenas, J., Henríquez, F. and Torres, L. (2005b), Collection zone kinetic model for industrial flotation columns, Minerals Engineering, Vol. 18, pp. 1373–1377.
Yianatos, J.B., Díaz, F., & Rodríguez, J. (2003). Mixing and effective pulp volume in flotation equipments, in : Gomez, C.O. & Barahona, C.A., (Eds.), Proceedings of the 5th International Conference Copper 2003, Vol. 3, Mineral Processing, Santiago, Chile, pp.179-194.
Yianatos, J.B. Díaz, F. and J. Rodríguez (2002). Industrial flotation process modelling: RTD measurement by radioactive tracer technique. XV IFAC World Congress, 21-26 July, Barcelona, Spain.
Yianatos, J.B., Bergh, L.G., Condori P. & Aguilera, J. (2001). Hydrodynamic and metallurgical characterization of industrial flotation banks for control purposes. Minerals Engineering, Vol.14(9), pp. 1033-1046.
Yianatos, J.B., L. G. Bergh, O.U. Durán, F.J. Díaz and N.M. Heresi (1994). Measurement of residence time distribution of the gas phase in flotation columns. Minerals Engineering, Vol.7, Nos 2/3, 333-344
Yianatos, J.B. and L.G. Bergh (1992). RTD studies in an industrial flotation column: Use of radioactive tracer technique. International Journal of Mineral Processing, 36, 81-91
www.intechopen.com
Radioisotopes - Applications in Physical SciencesEdited by Prof. Nirmal Singh
ISBN 978-953-307-510-5Hard cover, 496 pagesPublisher InTechPublished online 19, October, 2011Published in print edition October, 2011
InTech EuropeUniversity Campus STeP Ri Slavka Krautzeka 83/A 51000 Rijeka, Croatia Phone: +385 (51) 770 447 Fax: +385 (51) 686 166www.intechopen.com
InTech ChinaUnit 405, Office Block, Hotel Equatorial Shanghai No.65, Yan An Road (West), Shanghai, 200040, China
Phone: +86-21-62489820 Fax: +86-21-62489821
The book Radioisotopes - Applications in Physical Sciences is divided into three sections namely:Radioisotopes and Some Physical Aspects, Radioisotopes in Environment and Radioisotopes in Power SystemSpace Applications. Section I contains nine chapters on radioisotopes and production and their variousapplications in some physical and chemical processes. In Section II, ten chapters on the applications ofradioisotopes in environment have been added. The interesting articles related to soil, water, environmentaldosimetry/tracer and composition analyzer etc. are worth reading. Section III has three chapters on the use ofradioisotopes in power systems which generate electrical power by converting heat released from the nucleardecay of radioactive isotopes. The system has to be flown in space for space exploration and radioisotopescan be a good alternative for heat-to-electrical energy conversion. The reader will very much benefit from thechapters presented in this section.
How to referenceIn order to correctly reference this scholarly work, feel free to copy and paste the following:
Juan Yianatos and Francisco Diaz (2011). Hydrodynamic Characterization of Industrial Flotation MachinesUsing Radioisotopes, Radioisotopes - Applications in Physical Sciences, Prof. Nirmal Singh (Ed.), ISBN: 978-953-307-510-5, InTech, Available from: http://www.intechopen.com/books/radioisotopes-applications-in-physical-sciences/hydrodynamic-characterization-of-industrial-flotation-machines-using-radioisotopes