Embed Size (px)
Citation preview

HR Wallingfprd
HYDRAULIC ASPECTS OF BRIDGES : ASSESSMENT OF THE RISK OF SCOUR
Report EX 2502 April 1992
Address: Hj'draullcs Research Ltd, Wallingford, Oxfordshire OXIO 8BA, United Kingdom. Telephone: 0491 35381 International+ 44 491 35381 Telex: 848552 HRSWAL G. Facsimile: 049132233 International +44491 32233 Registered in England No. 1622174


Handbook47 Date of Issue 4192
ABSTRACT
This report presents advice and guidelines which will enable British Rail to assess hydraulic aspects of bridges over water. Possible causes of failure are discussed, and guidelines are presented to assess individual structures with respect to scour. The guidelines are based on bridge geometry and river and catchment characteristics. Features of the bridge and river are discussed and quantified where this is feasible. Recommendations are made concerning relevant data which should be recorded and maintained for each bridge. The guidelines have been designed to allow a bridge to be inspected and assessed in a short time and without special equipment.
The report incorporates numerous changes to the original procedure contained in Handbook 47 dated May 1989, The revised procedure is expected to be more accurate over a wider range of circumstances than the original. The main changes incorporated into this procedure are as follows:
1. An addition chapter (Chapter 8) has been added to assist in the inspection and assesssment of parts of a bridge for which appropriate numerical calculation methods are not available. Chapter 7 (numerical assessment) is now used only for parts of the bridge for which the calculation methods are applicable. Guidance is given to identify whether Chapter 7 or Chapter 8 should be used for each part, or element, of the bridge (Section 1.1).
2. An improved method of accounting for the effects of flood plain constriction has been included, and assessments of flood plain and channel constriction have been combined (Section 7.3.1).
3. Modified advice on calculations of foundation depth has been included (Section 7 .4).
4. An optional correction has been included to account for 'residual' scour which may be present at the site, even at low flow conditions (Section 7,5,3),
5. A new procedure has been included to account for local scour at groups of closely spaced columns (Section 7.3.5).
6. The overall marking and classification system has been modified (Sections 7.5.3, 7.6).
7. Additi~nal advice and discussion has been included eg. types of failure (Section 2), flood frequency (Section 7.1), structural aspects of foundations (Section 7.4.1).
8, Increased use has been made of figures and diagrams.


Handbook47
CONTENTS
1 INTRODUCTION
1.1 Outline of assessment procedure
2 TYPES OF FAILURE DUE TO HYDRAULIC CAUSES
2.1 Failure due to scour 2.2 Failure due to bank erosion 2.3 Failure of approach embankments 2.4 Failure due to hydraulic forces on piers 2.5 Failure due to hydraulic forces on the bridge deck 2.6 Failure due to debris 2.7 Failure due to Ice Forces
3 MODIFICATIONS TO THE RIVER OR CATCHMENT
3.1 Introduction 3.2 Modifications in the neighbourhood of the bridge
4
5
6
3.3 Modifications to the river 3.4 Modifications to the catchment
BRIDGES ON ESTUARIES
4.1 4.2 4.3 4.4 4.5
Tidal discharge Reversing flow Sediments Channel pattern Dredging
DATA REQUIREMENTS AND RECOMMENDATIONS
5.1 Data requirements
RIVER AND CATCHMENT CHARACTERISTICS
6.1 6.2
6.3
Introduction The stability of the river
6.2.1 Classification of the type of river 6.2.2 Bank stability
Severity of extreme events
6.3.1 Flashiness of river catchment 6.3.2 Tidal conditions
Date of Iss~ 4192
page
1
4
8
8
10 11 11 12 13 13
14
14 15 16 17
18
19 19 20 20 21
22
22
27
27 28
28 30
31
32 33
6.4 Overall assessment of river and catchment characteristics 34

Handbook47
CONTENTS (CONT'D)
7
8
THE RISK OF SCOUR : Category 1 elements
7.1 7.2
7.3
7.4
7.5
7.6 7.7
Introduction Measurement of main dimensions
7 • 2 • 1 Channel width W, and depth Y, 7.2.2 Channel width w. and depth Y• at the bridge 7.2.3 Flood plain width W, and flood plain flow depth
depth Y, 7.2.4 Pier width w, and length L,
Assessment of features significant in scour
7.3.1 Constriction of channel and flood plain 7.3.2 Additional scour due to river bends 7.3.3 Relative flow depth 7.3.4 Angle of attack and pier thinness 7.3.5 Group of Columns 7.3.6 Pier nose shape 7.3.7 Assessment of bed sediment size and grading 7.3.8 Blockage due to trapped debris
Foundations
7.4.1 Introduction 7.4.2 Measurement of foundation depth
Calculation of scour depth d,
7.5.1 Calculation of general scour 7.5.2 Calculation of depth of local scour 7.5.3 Calculation of total depth of scour 7.5.4 Foundation depth
Assessment of risk due to scour Amendment of priority rating
7.7.1 River type 7.7.2 Load bearing material 7.7.3 Invert on the river bed below the bridge 7.7.4 Stone scour protection measures
ASSESSMENT OF 'CATEGORY 2' ELEMENTS
8.1 8.2
Introduction Bridge pier or abutment founded on flood plain near to the main channel
Date of Issue 4192
page
34
34 37
37 39 39
42
44
44 45 47 47 49 50 51 52
53
53 55
56
56 57 58 60
60 60
60 61 62 63
63
63
64
Handbook47 Date of l«Sue 4192
CONTENTS (CONT'D) page
9
10
8.3
8.4 8.5
Bridge pier or abutment founded on flood plain set well back from main river channel Flood relief arch through approach embankment Earth embankment eg approach embankment
FURTHER ACTION
9.1 Priority 1 bridge 9.2 Priority 2 bridge 9.3 Priority 3 bridge
CONCLUSIONS AND RECOMMENDATIONS
10.1 Conclusions 10.2 Recommendations
LIST OF SYMBOLS
TABLES
1 Elements of river crossing which may be subject to scour
1 2 3
4
FIGURES
Illustration Illustration Illustration main channel Illustration river channel
of of of
of
scour at a pier in the main river channel scour at abutments in the main river channel main risks to pier on the flood plain near to
main risks to abutments on flood plain near to
the
main
5 Illustration of risk to pier on the flood plain well away from the main river channel
6 Illustration of risk to abutment on the flood plain well back from the main river channel
7 Illustration of risk to flood relief arches 8 Illustration of risks to approach embankments 9. Examples of changes in flow conditions 10 Examples of modifications which cause changes in bed level
68 71 73
73
74 75 75
76
76 77
11 Channel constriction abutments encroach into main channel, overbank flow
12
13
Channel constriction overbank flow Channel constriction Overbank flow
14 General scour
abutments encroach into main channel, no
abutments on floodplain close to channel.
15 General scour function, w.;w. 0 16 General scour function, W0 /Wu = 1

Handbook 47 Date of ls.sue 4/92
CONTENTS (CONT'D)
17 ·General scour function, W0/Wu 5
18 General scour function, W0 /Wu = 10 19 Flow around a bend 20 Scour at piers consisting of a group of columns 21 Measurement of foundation depth 22 Foundation depth and adjustment factor AF 23 Priority rating graph
APPENDICES
A Explanation of the method for finding the scour priority rating B Explanation of the scheme for combining features to assess scour c Explanation of the method for the assessment of catchment
characteristics D Blank data sheets for use with the assessment procedure E Examples of completed data sheets
Handbook47
1 INTRODUCTION
Date <:>f lss~ 4192
All bridges and structures associated with
waterways are potentially at risk of failure from
hydraulic causes. British Rail is responsible .for
a large number of such structures, many of which
were built in the nineteenth century.
In 1988, BR asked Hydraulics Research to prepare
guidelines to assess the level of potential risk of
individual structures. The guidelines enabled BR
to assess the frequency and level of inspection
that is appropriate for each individual structure.
In addition, the guidelines identified high
priority structures requiring prompt, more detailed
inspection.
HR Wallingford were later asked to produce a
revised version of the procedure, in order to
improve the assessment procedure and enable its use
over a wider range of circumstances. This report
describes the revised procedure.
An approach has been adopted in this work to
categorise structures based on priority but this
should not encourage complacency and the belief
that particular structures are 'safe'. In reality
there will always be a non-zero probability of
failure. Nor should the risk associated with a
particular structure be regarded as something fixed
in time. Changes may take place, particularly with
regard to the river, which may significantly change
the factors influencing the hydraulics of the
structure. Thus, for example, changes in the
1

Handbook47
alignment of a river channel may radically affect
the risk of failure due to scour.
This report is concerned with erosion to the river
bed and banks which may affect the safety of a
bridge. It does not address questions of
structural weakness. In some cases additional
analysis may be required in order to establish, for
a particular foundation, the critical bed level
below which the foundation becomes structurally
unsafe.
The major cause of bridge failure is undermining of
pier and abutment foundations following scouring or
erosion of the channel bed. Scour at bridges is a
highly complex process and cannot be precisely
predicted. In this report we have highlighted the
main and most easily measurable parameters which
could affect the risk of scour, and have, with the
help of published research findings, established
how scour is affected by each parameter. The
combined effect of all the parameters will give an
indication of the severity of scour, but it is
difficult to accurately predict the maximum scour
depth at the bridge. In assessing the risk of
failure, the depth and structural condition of the
bridge foundations is as important as the depth of
scour, but may not be known with certainty. A
bridge with potential for deep scour relative to
its foundations will be at higher risk than one
which causes little scour and has good deep
foundations. In this report, the two quantities of
scour depth and foundation depth are assessed and
compared. This comparison provides the basis for
categorisation of piers and abutments within the
2

Handbook47 Date of Issue 4/92
main river channel with respect to their risk of
failure due to scour.
For some parts of a bridge, such as abutments
founded on the flood plain, it is more difficult to
assess the risk of scour and so these parts of the
bridge are assessed by inspection and noting
features which indicate scour risk. This is
carried out with the aid of a checklist of features
which can be observed.
The handbook provides an initial assessment of the
potential risk of failure due to scour. It is, by
its nature, a general method which cannot take into
account all the local and particular circumstances.
If the assessment indicates a high priority rating
then this suggests that a more detailed examination
of the structure and the hydraulics should be
carried out. This should concentrate on:
• the reasons for the Handbook assessment
leading to a high priority rating
• detailed consideration of the hydraulics
associated with the structure
• the need for any remedial work
• the need for monitoring flow conditions and
scour
The survey guidelines have been prepared with the
aim of requiring data which can be obtained from
observation, simple site measurements and a small
amount of desk work. For the initial survey, for
example, neither a boat nor a theodolite is needed,
and estimates of flood magnitudes and flow
velocities are not necessary. In some cases, the
3
Handbook47
1.1 Outline of
assessment
procedure
Date of Issuo 4f92
report advises the use of additional data where
this is available, in order to provide. a more
accurate assessment.
Possible causes of bridge failure are discussed in
Section 2. Section 3 includes a discussion of
factors which can change hydraulic conditions at a
bridge site, such as construction of a structure
nearby, or dredging. Section 4 discusses special
factors affecting bridges over tidal waterways.
Section 5 contains recommendations for obtaining
data which may be relevant to hydraulic conditions
at a bridge. Section 6 presents information on the
characteristics of rivers and catchments which may
be relevant to the safety of the bridge.
Sections 7 and 8 present guidelines for making a
preliminary assessment of the risk of scour at a
bridge. This enables bridges to be placed in one
of six categories, based on the priority for
further investigation.
A bridge which crosses a river will generally
comprise several different elements which are
subject to hydraulic action. For example, a
crossing may comprise of earth approach embankments
on the flood plain, abutments which are either
founded on the flood plain or in the main channel,
and piers which are founded on the flood plain or
in the main channel. The risk to different
elements may vary in scale and severity.
4

Handbook47
Furthermore, methods for calculating scour vary
depending on the type of element and its location
in some cases reliable methods are not available.
Table 1 identifies elements of a river crossing
which may be subject to scour due to flowing water.
Examples of these elements are shown in Figures 1
to 8. Table 1 also gives the most likely causes of
scour and erosion problems. For example, a pier in
the main channel is most likely to be at risk from
local scour at the pier and general scour due, for
example, to a narrowing or constriction of the
channel at the bridge site. The column containing
main worsening factors in Table 1 shows factors of
the bridge and river most likely to exacerbate the
primary risks.
In addition to the primary risks, parts of a bridge
crossing may be vulnerable to secondary risks which
are generally less severe. Secondary risks for
each bridge element are shown in Table 1.
For assessment purposes, bridge elements are
assigned to one of two categories as follows:
Category 1
• BriQge pier in main
river channel
• Abutment projecting
Category 2
• Bridge pier on flood
plain near to main river
channel
• Abutment on flood
into main river channel plain near to main river
channel
5

Handbook47 Date of Issue 4192
• Bridge pier on flood
plain set well-back
from main river channel
• Abutment on flood
plan set well back from
main river channel
• Flood relief arch on
flood plain
• Earth embankment
approach embankment
The primary risks associated with 'Category 1'
elements can be assessed numerically, as methods
exist for predicting general and local scour.
However, methods do not exist to calculate scour
and erosion at bridges showing 'Category 2'
elements with sufficient accuracy, so these
elements are assessed by observing and recording
the presence or absence of features which affect
scour.
The following steps illustrate the general
procedure to be followed:
1. Identify the elements of a bridge subject to
hydraulic action.
2. Collect all relevant available data regarding
bridge and upstream and downstream channel. Site
inspection is necessary in most cases to assess
existing conditions at the bridge. Measure main
6
Handbook 47 Dilte or !ssoo 4192
dimensions of the bridge if not available. Chapter
5 outlines the data requirements.
3. Review the history of the bridge and river, with
reference to Chapter 3, to ascertain the likely
effects of changes to the river and bridge, and be
aware of special factors which may influence the
safety of the bridge.
4. Calculate the type of river score, TR, based on
river type, bank stability, flashiness of river.
Chapter 6 outlines the classification of river and
catchment characteristics.
5. Decide into which category, 1 or 2, each element
of the bridge should fall based on information
given in Chapters 1 and 2.
6. For each category 1 element of the bridge,
calculate scores for each feature. Determine
foundation depth, calculate scour depth, calculate
priority rating as explained in Chapter 7.
7. Modify priority rating, if appropriate, for each
category of bridge, Section 7.7.
8. For each category 2 element, use procedure in
Chapter 8 to assess features.
9. Decide on any further action, Chapter 9,
depending on priority rating of bridge.
7

Handbook47
2 TYPES OF FAILURE
DUE TO HYDRAULIC
CAUSES
2.1 Failure due to
scour
Date of Issue 4m
Several possible causes of failure are discussed in
this section. Failure is most likely to occur at
high flows, when the river is in flood. Scour is
the most frequent cause of failure and is the chief
subject of this report.
Most rivers have beds and banks of more or less
mobile material. During a flood, the bed level may
fall as bed material is transported by the moving
water. A bridge across the river can result in
additional lowering of the bed level at the bridge.
Two possible causes of this extra erosion, or
scour, are a general increase in flow velocity due
to a constriction of the channel, and a local
disturbance of the flow due to a bridge pier or
abutment. These two types of scour are called
general and local scour. General scour may affect
the whole width of the river, while local scour
occurs adjacent to piers or abutments. Where both
types of scour occur, the total depth of scour is
the sum of general and local scour. In addition
scour may be increased on navigable waterways, by
the action of vessels causing rapid displacement of
water and high local flow rates. Local scour at a
bridge pier is normally greatest near the upstream
nose of the pier. Due to the local geometry and
flow or the nature of the sediment, however, there
8

Handbook47 Date ()f bsw 4192
may be exceptions where the local scour is greater
in other areas adjoining the pier.
Many features of the bridge and river affect depth
of scour, and the complex nature of the problem
means that accurate prediction of scour is not
possible except in very simple cases. We can
however identify the most important features and
predict trends of how scour depends on each
feature, and assess the expected severity of scour
for a given bridge by combining the effects of the
significant features. This forms the basis
assessment methods in this report.
The depth of the foundations is important in
determining the risk to a bridge from a given
degree of scour. Deep foundations subjected to
severe scour may be safer than a shallow spread
footing in only moderate scour.
A bridge constructed on spread foundations will be
at risk from scour when the adjacent scour reaches
the level of the base of a footing. However if the
substructure member is subject to lateral loads
which are partially or wholly resisted by passive
pressure then the foundation may be at risk before
scour reaches the footing level. These lateral
forces may be increased by hydrodynamic effects.
Scour adjacent to piled foundations may result in a
loss of skin friction and reduction in load bearing
capacity of the piles, even if they have not been
undermined.
9
Handbook47
2.2 Failure due to
bank erosion
Dale of bsue 4192
structural analysis of the bridge foundations may
be required to accurately assess the critical bed
level below which the foundations become unsafe.
There ·are a significant number of bridges where the
flow is affected by tidal action. Depending upon
the location of the bridge, the discharges can be
predominantly fluvial, predominantly tidal or both
tidal and fluvial components can be significant.
In all cases the flow is in at least two
significantly different directions at different
times and the flow patterns may vary significantly.
Therefore a pier which may be well aligned and
subject to little scour during the flood tide may
be poorly aligned and subject to additional scour
during the ebb tide.
Most natural rivers tend to change their course
with time. A mechanism by which this occurs is
bank erosion. A structure such as a pier or
abutment located on a flood plain may be placed at
risk if the main channel moves sufficiently close
to the structure to cause loss of support or
undermining. Bank erosion may occur very slowly in
time, or may be very rapid, particularly during
times of flood. The rate of bank erosion depends
partly on the character of the river: a river with
a steep gradient and high flow velocities will in
general be more active and prone to bank erosion
than a river with a fairly flat slope and lower
velocities.
10

Handbook47
2.3 Failure of
approach
embankments
2.4 Failure due to
hydraulic forces
on piers
llito of Js:;uc. 4192
Overtopping of the approach railway and/or
turbulent flow adjacent to the approach embankments
can lead to erosion and scour to the side slopes
and toes of the embankments. This may lead to
instability of the approach embankments and
possible loss of the railway. Loss of fill
material around and behind the wing walls can lead
to instability and failure of the wing walls.
Water flowing past a bridge pier exerts a force on
the pier. This force can be resolved into two
components one along the axis of the pier, which is
referred to as the drag force and one normal to the
pier, which is referred to as the lift force.
The applied forces depend upon the depth of flow
and the length of the pier, with a marked
dependence upon the flow velocity. If the flow is
aligned with the pier the lift force is zero but as
the angle of attack increases the lift force
increases rapidly. The ability of a pier to
withstand drag forces will depend upon the
structure of the bridge and the foundation details
and may be reduced during a flood if significant
scour around the base of a pier takes place. A
method for evaluating these forces is given in
Farraday and Charlton (1983). The application of
11
Handbook47 Date pf Issue 4192
this method requires a detailed. knowledge of the
flow velocity and direction and so is outside the
scope of this report.
Debris which is caught on piers can result in
increased hydraulic forces by increasing the
effective pier width, while floating debris which
collides with piers can cause dynamic loading.
Both types of loading will probably be most severe
when the river is in flood. If it is necessary to
consider the effects of hydraulic and hydrodynamic
loading, then it is recommended that specialist
advise is sought.
2.5 Failure due to
hydraulic forces
on the bridge deck
If the water level reaches the soffit level of a
bridge, or the springing in the case of an arch,
the flowing water will exert a force on the bridge
deck. The drag on the deck may be calculated in a
similar way to drag on a pier, and is again very
dependent on the flow velocity. A force applied to
the deck of the bridge is potentially more
dangerous due to the large overturning moment about
the pier foundations. If it is known that historic
flood levels have approached the bridge deck, it
may be appropriate to carry out a site-specific
study to assess future flood levels, flow
velocities and hydraulic forces and the resistance
of the bridge to these forces. Estimates should
also be made of possible dynamic loads imposed by
collision of floating debris. These types of study
are outside the scope of this report. For further
12
Handbook47
2.6 Failure due to
debris
2.7 Failure due to
Ice Forces
information consult Farraday and Charlton (1983) or
seek specialist advice.
Build up of trash and debris against bridge
components can significantly affect the hydraulic
performance of bridges. Difficulties are normally
associated with small, single-span bridges which
tend to be more easily blocked than large
multi-span structures. For such single span
bridges the blockage carr be extensive, reaching up
to 90% of the bridge opening. This may result in
large increases in water level and flooding
upstream. Debris may restrict the flow leading to
significant scour around piers or abutments
threatening the safety of the structure.
Debris may also result in additional 'drag' and
'lift' forces on piers, and impact forces may
result from debris colliding with piers.
For inland river structures the critical mode of
ice action is most likely to be the impact of large
sheets of ice with piers or piles as ice break up
occurs. Ice may also result in additional scour
due to blockage of the waterway. Ice problems are
unlikely to occur in most parts of the UK. If it
is thought that ice problems may occur then
speqialist advice should be sought.
13

Handbook47
3 MODIFICATIONS TO
THE RIVER OR
CATCHMENT
3.1 Introduction
Date of Issue 4192
Most rivers naturally change their geometry with
time. Rates of change depend on geological as well
as hydraulic factors, but the stability of the
river which is discussed in Section 6.2 is an
important factor. A very stable channel, such as a
canal, will change very slowly if at all, whereas
many less stable meandering rivers will steadily
change their course as meanders migrate downstream.
In addition to these natural changes, modification
of the hydraulic properties of the catchment or
river tends to cause changes. The sensitivity of
the river to these modifications depends partly on
its stability. In this section several types of
modification are discussed. The indirect nature of
their effects and the complexity of river systems
means that firm general guidelines cannot be given.
Recent modifications may be more dangerous than
older ones - the bridge is less likely to have been
tested by a major flood if new conditions have been
imposed recently.
Section 3.2 discusses modifications which may have
a direct effect on flow conditions at the bridge.
In addition, it is very important that factors
affecting the river regime remote from the bridge
are monitored since those may have a significant
impact on the potential scour as a result of
altering the characteristics of the river. One of
14

Handbook47
3.2 Modifications in
the neighbourhood
of the bridge
lh.tc of Issue 4f92
the hydraulic aspects which can lead to scour and
hence to bridge failure is a change in. channel
pattern. The river can shift laterally after a
flood or after engineering works upstream of
downstream of the bridge. This can cause scour
problems at unprotected parts of the bridge. By
altering the angle of attack of the flow relative
to the structure, existing scour may also be
increased.
• structures constructed later than the bridge.
Another bridge built upstream can affect the
hydraulic conditions at the railway bridge.
Increased turbulence and less uniform approach
velocity can both result in deeper scour depths at
the railway bridge. The upstream structure may
alter the flow direction and cause erosion of
abutments and deeper scour at the bridge piers.
This effect is illustrated in Figure 9.
• Bank protection measures in the neighbourhood
of the bridge.
Work may have been carried out to protect the banks
and stabilise the course of the river. The
presence of bank protection measures which post
date the bridge may indicate that the river has in
the past actively eroded its banks and may have
changed its course and its cross sectional
15

Handb_ook 47
3.3 Modifications
to the river
Date of lss~ 4192
geometry. Both types of change can reduce the
safety of an adjacent bridge.
If water and/or sediment flows in a river are
altered, the equilibrium state of the river may
change. The plan geometry, cross section and
discharges at the bridge site may be affected. The
bridge may be subjected to worse erosion and scour
and higher water levels.
It is not possible to give guidelines on whether
changes due to river works are likely to improve or
worsen the bridge's safety, as the river geometry
depends on complex interaction between discharge
and sediment movement. In general, an unstable
river will be more liable to change than a stable
river.
Changes in flow can be caused by a change in the
river upstream of a bridge. Rivers works can cause
these flow changes, if they are carried out since
the construction of the bridge. Some river works
which could cause these effects are identified
below:
construction of flood embankments;
construction of flood detention basins;
construction or removal of bridges;
construction or removal of bank protection or
river training works;
changes in water abstraction patterns;
schemes for water transfer between river basins.
16
Handbook47
3.4 Modifications to
the catchment
Inte of Issue. 4192
Approach velocities may be increased by: the
construction of flood banks, which eliminate flood
plain storage and increase flows; the construction
or removal of another bridge, which may alter flow
velocities and directions, and by the construction
or removal of bank protection or river training
works. The above effects are illustrated in
Figure 9.
Other river works can cause changes in bed level:
- channel improvement schemes such as dredging for
navigation or gravel abstraction, weed clearance,
realignment;
reservoir impoundment;
construction or removal of weirs.
The above effects are illustrated in Figure 10.
Changes to catchment characteristics can affect
rates of water and sediment supply to a river,
which can result in changes in discharge, water
levels and channel geometry. Changes to a
catchment which have occurred since the bridge was
constructed can therefore affect the safety of the
bridge.
Some examples of catchment changes which may be
significant are given below:
Urbanisation;
De-forestation;
17

Handbook47
4 BRIDGES ON
ESTUARIES
Change in land drainage;
- Change in groundwater regime.
Recent modifications either to the structure or the
river should be recorded and their potential impact
on the hydraulics of the bridge considered. When
modifications are proposed their potential impact
should be assessed (see Section 5.1, paragraphs d)
and e)).
The bulk of this work has considered bridges on
rivers where the flow is uni-directional. There
are, however, a significant number of bridges where
the flow is affected by tides. Because of the
large range of conditions that may prevail at such
bridges it is not possible to characterise them in
the same way that has been done for non-tidal
rivers. In this section we discuss general points
to be considered and also suggest how markings in
some of the other sections could be modified to
take account of tidal effects. We must stress,
however, that this is not complete or exhaustive
and that in cases of concern further investigations
should be made and specialist advice sought.
Most of the assessment for river bridges can be
applied to bridges on estuaries with the exception
of Section 6.3.1 which is based on the slope of the
catchment. It is suggested that in tidally
dominated rivers this is replaced by an assessment
of the tidal velocity, as described in 6.3.2. If
both fluvial floods and tides may be significant
18

Handbook47
4.1 Tidal discharge
4.2 Reversing flow
Dale of Issw 4192
then the worst score of 6.3.1 and 6.3.2 should be
taken. It should be appreciated, however, that in
these cases specialist advice may have to be
sought.
In assessing the shape and alignment of bridge
piers it should be remembered that there will be
two prominent flow directions.
In view of the complexities of tidal estuaries the
final assessment can only be regarded as an
indication of the risk associated with the
structure. In any cases of doubt expert advice
should be sought.
One of the important hydraulic factors is the
magnitude of the discharges through the bridge.
Depending upon the location of the bridge the
discharges can be predominantly fluvial,
predominantly tidal or both tidal and fluvial
components can be significant. The tidal discharge
depends upon the tidal area upstream and upon the
tidal range at the bridge site. If the tidal area
upstream is large or if the tidal range at the site
is large problems are more likely to arise.
In tidal dominated areas at different times the
flow is in at least two significantly different
directions. This should be reflected in the design
of piers and abutments. Thus there will be
requirement to streamline both ends of a pier. It
19
Handbook47
4.3 Sediments
4.4 Channel pattern
Datec of Issue 4192
should be remembered that flood and ebb flow
patterns may vary significantly from one another;
one is not to be regarded as the reverse of the
other. A pier which may be well aligned for the
flood flows may be poorly aligned for ebb flows.
Indeed, flow in channels which dominate in the
flood may not be as significant on the ebb.
In general the strongest ebb currents run at the
surface and the strongest flood currents at the
bed, and this differential flow, accentuated in
plan in a wide estuary, may give different flood
and ebb channels. Worst conditions are likely
during ebb tide with a high freshwater discharge.
Estuaries are frequently, but not always,
characterised by fine sediments consisting of silts
and clays. When first deposited such sediments may
have very low densities, in extreme cases they can
'flow' under gravity. Such sediments may be easily
re-eroded and even in position will not provide any
significant support for foundations. In these
situations care must be taken in interpreting
information from echo sounders and similar devices.
Within an estuary there is usually a pattern of low
flow channels. Depending upon the nature of the
estuary and its sediments this pattern may change
from time to time. Thus while at the moment one
pier may be in a deep channel and another located
on a sand bank the situation might reverse within a
20
Handbook 47 Date of Issue 4/92
4.5 Dredging
few weeks or months. In such circumstances unless
there is strong evidence that the channel pattern
is fixed the foundations of all the piers should be
sufficient to withstand the conditions where the
flow is presently the deepest and fastest.
A number of estuaries are periodically dredged
either for navigation or for flood prevention.
Such dredging, if it is close to a structure may
have a direct impact on the stability of
foundations. Even dredging at some distance, may
have an indirect affect by altering the flow
pattern. If dredging is to take place within lkm
of the structure it would be advisable to ask the
dredging authority for information about the
quantity and location of dredging. The dredging
authority will probably monitor bed levels in the
dredged area for their own purposes and it may be
possible to arrange for them to extend such
monitoring work to the neighbourhood of the
structure to ensure that significant changes do not
take place unnoticed.
Development of the estuary on the landward side of
a bridge may affect the flow conditions at the
bridge. If the total volume is reduced, for
example, by the construction of a barrage the flows
are likely to be reduced. If the tidal volume is
increased, for example, by dredging then flows are
likely to be increased.
21

Handbook47
5 DATA REQUIREMENTS
AND RECOMMENDATIONS
5.1 Data requirements
We recommend that a file of all relevant
information is maintained for bridges which have
been assessed using this procedure. In addition to
providing useful data about the bridge and river
for future reference, some of the information will
be very valuable at a later date in assessing
whether and how quickly important features are
changing with time.
Details of many of the relevant features will be
recorded during the assessment procedure, and this
section describes the additional information which
should be obtained for future reference. The
information is particularly important for bridges
which are shown by the assessment procedure to be
potentially vulnerable.
a) Photographs taken at the time of inspection.
Though of limited immediate value, these can
provide valuable evidence of whether changes have
or have not taken place. A minimum of one
photograph of the river should be taken looking
upstream and one looking downstream from the
bridge, if possible. The positions from which the
photographs were taken should be recorded and where
possible the photographs should include suitable
references, such as trees or other permanent
features near to the river banks. These
photographs should be kept and compared with
22

Handbook47 Date of Issue 4192
similar shots taken during subsequent inspections
to assess if any changes are taking place, and if
so how quickly.
Photographs should also be taken of the bridge and
of piers, abutments and any embankments which are
near to the river. Again, these can be used later
to indicate any visible deterioration which may
have taken place.
b) Photographs, notes and observations of flows
through the bridge during flood can provide
valuable information
These observations can give indications of, for
example, the amount of flow through relief arches
and culverts; flow velocities at different parts of
the bridge, and angle of attack of flow during
flood and the water level.
The NRA may be able to supply estimates of the
magnitude and severity (return period) of the
flood. This can be valuable if further hydraulic
studies of the bridge are carried out.
c) Aerial photographs and Ordnance survey maps
Aerial photographs can very readily give a very
good impression of the nature and stability of the
river channel and its relationship to any
structure. The perspective provided by such
photographs can provide an overall appreciation of
a structure and its surroundings which may not be
obtainable by viewing from the ground. Good air
23

Handbook47 Date of Issue 4192
cover of most of the country is now available.
Possible sources of air photographs are:
The Royal Commission on the Historical Monuments of
England
The Central Register of Air Photography for Wales,
- contact
Air Photographs Officer
Cartographic Services (PS 8), Welsh Office
Room G-003, Crown Offices
Cathays Park, Cardiff, CF1 3NQ
Aerial photographs dating back to about 1940 are
available from RAF Broughton and Cambridge
University.
The Ordnance Survey, Southampton, can supply maps
to 1 11 to the mile scale (or, for recent editions,
1:50,000 scale) for a number of series dating back
to 1897. 1:25,000 sheets are also available.
The National Map Centre (Caxton Street, London SWl)
can supply latest editions only of large scale
plans. These are generally 1:2,500 scale for rural
areas and 1:1,250 scale for urban areas. 6 11 to the
mile (approx 1:10,000 maps are also available,
again from the latest series only.
The British Map Library, part of the British
Library at Great Russell Street, London, keeps
archives of a number of series, including 25" to
the mile dating back to 1871, and 6" to the mile
24
Handbook 47 Date of lssu-. 4192
dating back to 1882. Maps may be viewed and traced
at the library, and a copying service is available.
A scale of at least 1:10,000 would be preferred for
plotting changes to channel plan form for most
British rivers.
d) Alterations to the bridge
structural alterations or repairs to the bridge may
affect its hydraulic performance. Details should
be obtained of any repairs which are proposed, and
an assessment made of whether the temporary or
permanent works will significantly affect the
hydraulic behaviour of the bridge. If worse scour
or greater forces on the piers or deck are expected
as a result of alterations, more detailed hydraulic
investigations may be advisable. Particular
attention should be paid to alterations which
increase the width of piers and abutments, or cause
additional channel constriction. Both of these
changes can result in increased scour.
e) Alterations to the river upstream or
downstream of the bridge.
Consideration should be given to proposed river
engineering works which might affect the flow at
the bridge. Examples are new structures or
earthworks which can alter the approach flow and
scour at a bridge, and flood protection work such
as flood embankments or channel clearance which can
change the regime, or stable form, of the river.
Detailed studies may be required to assess the
effects of changes to the river on the safety of
25

Handbook 47 Date of Iss~ <!m
the bridge. Records of river conditions before the
works should be kept and the river should be
monitored after the works and compared with the
records.
f) The range of water levels, particularly high
water and the frequency of occurrence. This
data may be collected during or immediately
following floods. The presence of nearby
flow gauging stations should be determined.
This is often available from the local
National Rivers Authority office.
Gauging stations on the river will provide
information on the range of discharge and, in
particular on flood discharges. If the NRA office
is approached after a flood event on a gauged
river, they should be able to provide an indication
of the severity of the event in terms of return
period.
g) General geological data is available from the
British Geological Survey. They retain some
borehole data. Other data may be available
from local authorities who have undertaken
site investigation work in the area.
The occurrence of rock as the bed or founding
material does not guarantee the absence of a scour
problem. The following data should be collected:
i) The depth of the rock and its variation over
the site.
26

Handbook47 Date of Issue 4m
ii) The extent and character of the weathered
zone.
iii) The structure of the rock, including bedding
planes, faults, fissures which affect its
erodibility.
Advice should be sought on the susceptibility of
the rock to scour.
h) The structural form of the bridge.
i) Original design calculations.
j) As-built drawings.
In most cases, basic information relating to the
dimensions and form of construction of each bridge
are already available. It appears however that
details of the foundation and founding depth are
often unknown. For an accurate assessment of the
risk of scour, this information should be obtained.
6 RIVER AND CATCHMENT
CHARACTERISTICS
6.1 Introduction
The aim of this section is to assess the degree of
hazard which is inherent in the river at the bridge
site. This inherent hazard depends on the type of
river and the characteristics of the catchment
which it drains. Two features are considered to be
particularly important and are assessed in the
following sections.
27

Handbook47
6.2 The stability of
the river
(a)
Date of hsu:: 4192
The stability of the river. Many rivers
change their plan form and cross. sectional
properties with time. The stability of the
river is an assessment of how quickly these
changes are likely to occur and how
responsive the river will be to changes which
are imposed on it. This feature is therefore
important in determining the required
frequency of inspection of a structure. In
Section 6.2 the stability is assessed by
identifying the river-type and by examining
bank erosion characteristics.
(b) Severity of extreme floods. Most bridge
failures due to hydraulic causes occur during
rare, high flow events. In Section 6.3 the
expected magnitude of a rare flood relative
to the magnitude of a more frequent flood of
longer duration is expressed in terms of the
catchment's slope.
6.2.1 Classification of the type of river
In this section, guidelines are given for
classifying the type of river in terms of its
stability. Most rivers can be placed in one of
three categories: stable, dynamically-stable and
unstable.
Stable channels have inert beds and banks with no
significant scour or erosion. Their plan form and
cross sectional geometry changes very slowly, if at
28

Handbook47 Date of l.ss~ 4192
all, with time, and even interference with the flow
in the channel causes only local changes in channel
geometry.
Dynamically-stable channels continually scour and
deposit bed and bank material during times of
moderate or high flows. Their cross sectional
shape does not change progressively, but their plan
form does change as the channel migrates.
Interference to the flow in the river causes
changes in channel geometry for some distance
upstream and downstream. A meandering river is
usually dynamically stable.
Unstable channels are less common in Britain than
the other types. They are characterised by very
high rates of erosion and bed material transport
during floods, and the main channel can shift to
follow a different course during a flood. Rivers
which are braided, that is, consisting of more than
one channel separated by bars or islands which are
mobile during floods, are usually unstable.
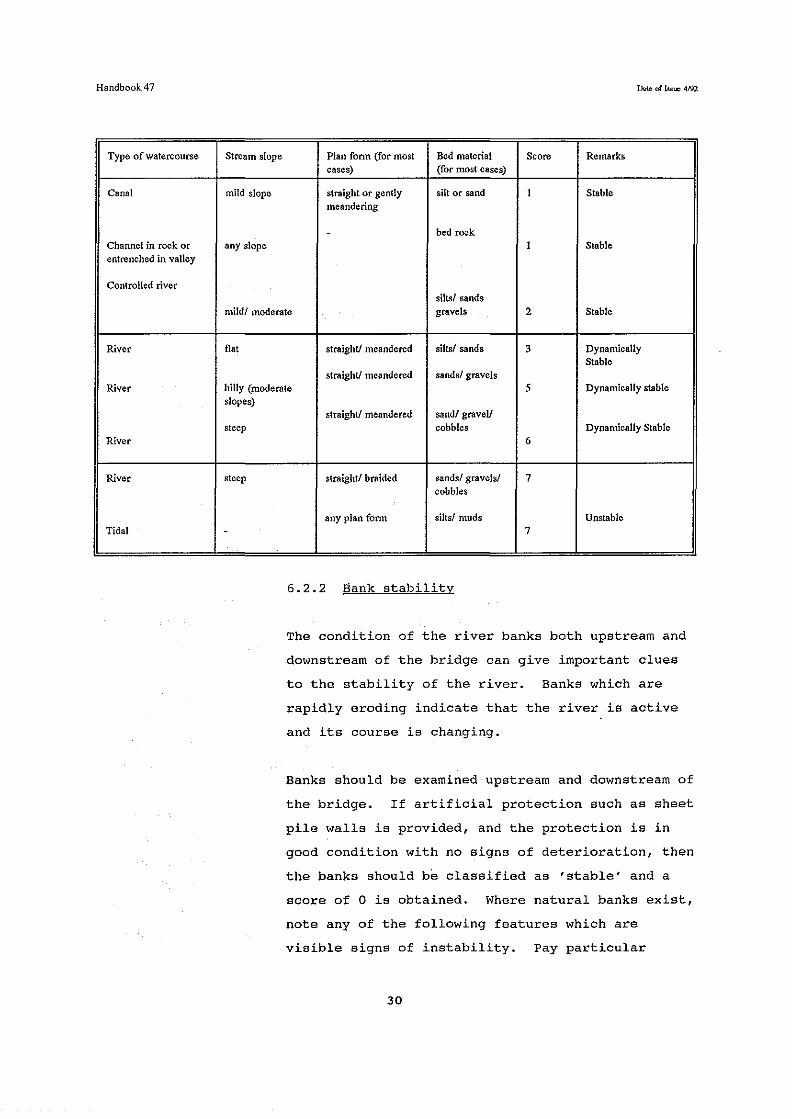
The table below lists some types of channels,
together with an indication of their expected
stability. With the help of this table, categorize
the type of river, and obtain an appropriate score.
Additional information which may be used is the
history of the river and its tendency to change
with time. If no change in course occurs, the
classification is probably 'stable'. If changes
occur gradually, the river is probably dynamically
stable. If changes are rapid and frequent, the
river is probably unstable.
29
Handbook 47 Dale of~~ 4192
Type of watercourse
Canal
Channel in rock or entrenched in valley
Controlled river
River
River
River
River
Tidal
Stream slope Plan form (for most Bed material Score Remarks cases) (for most cases)
mild slope straight or gently silt or sand I Stable meandering
- bed rock any slope I Stable
silts/ sands mild/ moderate gravels 2 Stable
flat straight! meandered silts/ sands 3 Dynamically Stable
straight/ meandered sands/ gravels hilly (moderate 5 Dynamically stable slopes)
steep
steep
-
straight/ meandered sand/ gravel/ cobbles Dynamically Stable
6
straight/ braided sands/ gravels/ 7 cobbles
any plan form silts/ rnuds Unstable 7
6-2-2 Bank stability
The condition of the river banks both upstream and
downstream of the bridge can give important clues
to the stability of the river- Banks which are
rapidly eroding indicate that the river is active
and its course is changing.
Banks should be examined upstream and downstream of
the bridge. If artificial protection such as sheet
pile walls is provided, and the protection is in
good condition with no signs of deterioration, then
the banks should b9 classified as 'stable' and a
score of 0 is obtained. Where natural banks exist,
note any of the following features which are
visible signs of instability. Pay particular
30
Handbook47
6.3 Severity of
extreme events
Dale of Issue 4192
attention to outsides of bends which are often
sites of active erosion.
Visible signs of bank instability:
• Loose, cohesionless bank material exposed
with no vegetation cover;
• Banks showing signs of recent degradation,
such as slumping or undermining;
• Tree roots exposed by erosion of soil;
• Trees, fences etc now within main river
channel due to erosion of banks;
• Towpaths lost or cut off due to erosion
Note the presence of any of these features. Obtain
a score by adding the number of factors present.
For example, if all of the features are present,
obtain a score of 5, indicating a high degree of
instability.
Enter score for bank stability on data sheet:
(From 0 to 5)
Most bridge failures due to hydraulic causes occur
during rare, high flow events. This section
assesses the likely severity of (a) 6.3.1 the
flashiness of the catchment on river bridges or (b)
6.3.2 tidal conditions in estuaries.
31

Handbook 47 DatD- of Iss~ 4192
6.3.1 Flashiness of river catchment
The flashiness of a catchment expresses the
relative magnitudes of an instantaneous flood and a
flood of longer duration but with the same return
period. Flashiness can be represented by the
channel slope.
From suitable contour maps of the catchments, for
example os maps, calculate the slope of the channel
in the catchment upstream of the bridge. The slope
is defined as the average slope between points 10%
and 85% of the length of the main river measured
upstream from the bridge. The slope is thus the
difference in height between these two points
divided by the distance between them measured along
the river. Obtain a score for catchment flashiness
from the table below:
Slope Score
m/km
50.1 1
0.1-1.7 2
1.7-3.3 3
3.3-6.7 4
6.7-14 5
14 -30 6
2:30 7
Enter score on data sheet for either 6.3.1 or
6.3.2, whichever is applicable
32

Handbook 47 Date of Issu:: 4192
6.3.2 Tidal conditions
If no measurement or records of tidal velocity are
available then the velocity can be estimated by
where V is the volume of water upstream of the
bridge location between low and high water levels
at Spring tide (m3 )
A is the cross-sectional area of the waterway
opening below mean sea level (m2)
T is the tidal period, that is, the time interval
between successive low or successive high tides (s)
Tidal velocity Score
(m/s)
,; 0.5 1
0.5 - 0.8 2
0.8 - 1.1 3
1.1 - 1.5 4
1.5 - 2.0 5
2.0 - 2.5 6
" 2.5 7
Enter score on data sheet for either 6.3.1 or 6.3.2
whichever is applicable
33
Handbook47 Date of Issue 4192
6.4 Overall assessment
of river and
catchment
characteristics
Rivers are complex systems which do not lend
themselves to neat classification, and runoff
depends on many factors, some of which are
probabilistic. The results· from this section must
therefore be treated with caution.
The scores from Sections 6.2 and 6.3 should be
combined as described below.
The scores for Sections 6.2.1, 6.2.2 and (6.3.1 or
6.3.2) should be added together. The result should
be divided by 17 and then 1.12 should be
subtracted.
1 17
(Sum of scores from sections 6.2.1, 6.2.2 and
6.3.1 or 6.3.2) - 1.12
The result, which is a measure of the tYpe of river
should lie in the range -1 to 0. This number,
denoted by TR, will be used in Section 7.6.
7 THE RISK OF SCOUR :
Category 1 elements
7.1 Introduction
The table in Section 1.1 shows the different types
of bridge elements and the categories into which
34
I
Handbook 47 Da!e of Wuo 4/92
they fall. This table should be checked before
proceeding with Chapter 7. If the bridge element
falls into Category 2 proceed to Chapter 8.
Elements in Category 1 are bridge piers or
abutments which lie within or project into the main
river channel. They are assessed by combining the
effects of features of the bridge and river which
could be significant in determining the risk of
failure of the bridge due to scour.
Each feature is given a score, and the scores are
combined to give a 'risk number' which reflects the
potential risk to the bridge. The theory behind
this procedure is described in Appendices A and B.
In certain circumstances, eg if the bridge is
founded on bedrock, it may not be necessary to
carry out the full assessment described in this
section. Refer to Sections 7.7.2, 7.7.3 and 7.7.4
for examples where a full assessment is
unnecessary.
This assessment is designed to provide a method for
surveying the hydraulics of bridges. It has been
impossible to include all aspects of the hydraulics
of bridge structures. For example, if a bridge is
immediately downstream of a bend then the geometry
of the river may lead to the formation of large
eddies in the neighbourhood of the bridge. This
can have a dramatic effect on both the magnitude
and direction of the velocities of flow. If it is
suspected that any bridge is peculiar in nature
because of the presence or absence of any feature
35

Handbook47 Date of Issu: 4192
then this should be noted and further advice
sought.
The history of scour at a bridge may give further
indication of the susceptibility to future scour
problems.
There may be significant differences between the
various elements of the bridge. Thus if a bridge
has a number of piers then the size and shape of
the piers or the depth of foundations may differ
significantly. ThUs a number of markings may be
obtained for one structure. The appropriate action
to be taken should then be based on the worst score
obtained.
A new bridge would normally be designed to
withstand a flood of specified magnitude. The
magnitude is normally expressed in terms of return
period. If a given discharge is exceeded, on
average, once every T years then that discharge is
said to have a T year return period. Calculation
of design discharge in rivers is a specialist topic
which is outside the scope of this report. If the
design discharge is known, then methods. are
available for calculating water levels and flow
velocities. These are also outside the scope of
this report.
In order to compare risk at a number of bridges, it
would, strictly, be necessary to calculate flow
conditions at all of the bridges, for the same
return period flows. This would be a major task.
By making some simplifying assumptions, the
procedure in this report avoids the need to
36

Handbook47
7.2 Measurement of
main dimensions
calculate flow conditions for particular return
periods.
Where the procedure refers to 'flood conditions'
this should be taken to mean conditions during a
historically high flood. This could, for example,
be a flood with a selected high return period (eg
50 or 100 years), or alternatively this.could be
the highest recorded flood.
7.2.1 Channel width w.. and depth Y,
{eg Figs 11-141
w. is the bank to bank channel width, measured
upstream of the bridge. Yu is the mean channel
depth upstream of the bridge. on smaller rivers,
the typical bank to bank channel width upstream of
the bridge can be measured directly. Where this is
not practicable, estimate the width as accurately
as possible. Large scale maps may also be used in
some cases. If the width varies significantly then
take the average width in the reach up to a
distance of 10 channel widths upstream of the
bridge.
The mean depth of the channel from the bed to the
bank tops, Yu, should also be determined. Yu is
defined more precisely as the cross sectional area
of flow in the main channel divided by the channel
width Wu• In most cases it will not be possible to
measure this depth directly without taking
soundings from a boat, though in some cases
37
Handbook47
information may be available from previous survey
work. Assuming direct soundings cannot be carried
out, it is recommended that, if the water is
shallow and the bed can be seen, the bank full
depth is estimated directly by estimating the sum
of the mean water depth and the height from the
water surface to the bank tops.
The mean depth of channel from the bed of the river
to the bank tops is relatively easy to determine.
It would be better to use the mean depth of flow
under flood conditions though this is more
difficult to determine unless an approximate
estimate of water levels under flood conditions is
available. If, however, information on flood
levels is available the mean depth of flow should
be substituted for the mean depth of the channel.
If no visual estimate can be made of water depth,
which will often be the case for larger rivers,
then the following formula may be used:
0.185 w: 0 · 7 u
This formula may give an indication of the
approximate bank full depth, but applies only to
alluvial rivers whose dimensions are not controlled
by features such as rock, bank protection or highly
cohesive banks or beds. Other factors such as bank
vegetation may also affect the width/depth
relationship. The above formula should be used
only when no other method for estimating channel
depth can be used.
38

Handbook47
7.2.2
Date of lss!» 4192
Channel width W, and depth Yn at the
bridge
W8 is the width of the main channel under the
bridge, defined as the distance from bank to bank,
minus the width of bridge piers.
Y8 is the mean channel depth at the bridge. This
is defined as the cross seCtional area of flow in
the main channel divided by the channel width W8 •
Note that the same reference level (i.e either bank
top level or, if known, flood water level) should
be used for assessing both Y, and Y8 •
7.2.3 Flood plain width W, and flood plain
flow depth Y, leg Fig 13!
The amount of flow which approaches the bridge on
the flood plain will influence scour conditions at
the bridge. The most accurate estimate will be
obtained if the width of flow on the flood plain,
and the average depth of flow on the flood plain,
can be estimated.
Y, is the average depth of flow over the flood
plain, at a typical cross section approximately 10
river widths upstream of the bridge. This is
equivalent to the cross sectional area of flood
plain flow divided by the total water surface width
of the flood plain w,. Guidelines for estimating Y,
and W0 are given below.
In order to estimate the flood plain flow depth Y.,
the following methods maybe used.
39

Handbook47
i) Hydraulic analysis of the river under design
flood conditions enables Y0 to be calculated.
Detailed description of the method is beyond
the scope of this report. This method should
give a reasonably accurate estimate of the
water level, and hence average flow depth
over the flood plain.
ii) Water levels observed during high flood
events may be estimated to obtain mean flood
plain flow depth. It is useful to sketch the
cross section upstream of the bridge,
including flood plain ground levels, in order
to estimate average flow depth.
iii) The extent of flooding, together with
informationon ground levels, may be used to
estimate flood plain flow depths. The extent
of_ flooding from high floods may have been
recorded or observed.
iv) Anecdotal information or flood records, such
as 'flood levels reach underside of bridge'
or 'flood levels reaching track level or
approach embankment' should be used, if
available, to estimate flood water levels.
Note that high values of Y. will tend to result in
higher estimates of scour.
If no estimate of ¥o can be made, then it is
recommended that the ratio Y./Y. is set to 0.3. If
it is known that flooding does not occur, then Y0 /Yu
should be set to 0 (Section 7.3.1).
40

Handbook47
I I
The flood plain width W0 is the combined width of
the right and left flood plains, measured
perpendicular to the main flow direction.
In order to estimate W0 the following methods
should be used. It should be noted that W0 is the
water surface width of the flooded cross section,
minus the channel width Wu, measured at ·a typical
location within approximately 10 channel widths
upstream of the bridge.
i) The geometry of the river valley may indicate
the extent of the flood plains. For example,
relatively level, flood prone areas may be
bounded by steeper slopes or flood
embankments, giving a clear indication of the
extent of flood water.
ii) Hy.draulic analysis of the river under design
flood conditions enables W0 to be calculated,
Detailed description is beyond the scope of
this document, and signficantly more data may
be required, but this more detailed analysis
will lead to more accurate results.
If no estimate of W0 can be made, it is recommended
that the ratio W0 /W. is set to 5. If it is known
that flooding does not occur, then W0 should be
recorded as zero.
In view of the uncertainties in establishing flood
plain flow depth and width, sensitivity tests can
be carried out to assess the affect on the final
'priority rating' of a range of flood plain depths
and widths.
41

Handbook 47 Date of rss~ 4192
7. 2. 4 Pier width w, and length L,
The effective width of each pier should be measured
and estimated. Use the following notes for
guidance:
• For the simplest case of a single, uniform
pier extending to below the general scoured
bed level, the pier width w, is defined as
the width of the pier, measured perpendicular
to the long axis of the pier if the pier is
elongated.
• If the pier has an enlarged footing or base,
part of which lie above the general scoured
bed level, then the effective pier width w, is taken to be the width of the enlarged
footing or base.
• If an abutment projects into the main river
channel by a width Wa, then its effective
width is wp. wp is calculated from the width
of projection of the abutment Wa:
W, is the width of projection of the abutment
into the main river channel. If the abutment
and river bank are both vertical, then Wa is
simply the distance from the line of the
river bank to the face of the abutment. If
the face of the abutment or river bank are
not vertical, then Wa is the average
projection of the abutment from the river
bank.
42

Handbook47
I
• If the abutment has an enlarged footing or
base, part of which lies above the general
scoured bed level, then the abutment width W,
should be assumed to be equal to the
projection of the footing from the river
bank, w,. If the river bank or face of the
footing are not vertical, then Wr is the
average projection of the footing· from the
river bank.
• If the pier consists of a group of two or
more circular columns, with centre-centre
spacing of less than 5 WP, then measure or
estimate the separation of the columns. If
the columns are aligned approximately with
the flow direction, then measure or estimate
the centre-centre separation c 1 • If the
columns are aligned approximately
perpendicular to the flow direction, then
measure or estimate the centre-centre
separation c,. The pier width WP is the width
of an individual column within the group (Fig
20).
• If a group of columns is founded On a single
base or footing which is partly above the
general scoured bed level, then the effective
pier width WP is equal to the width of the
base or footing.
The length of the pier, LP, is measured along the
long axis of the pier. For a circular pier, LP =
WP. For the case of two adjacent elongated piers,
with one positioned downstream of the other, the
measurement LP depends on the gap between the
43

Handbook47
7.3 Assessment of
features
significant
in scour
Date of Issue 4192
piers. If the gap is greater than 3 w,, then L, is
the length of an individual pier. If the gap is
less than 3 w,, then L, is the sum of the length of
the individual piers.
7.3.1 Constriction of channel and flood plain
A constriction in the width of a channel, for
example by bridge abutments or piers, tends to
result in a decrease in bed level within the
constriction. This reduction in bed level is known
as general scour due to channel constriction, and
depends on the ratio of the channel width at the
constriction, W8 , to the channel width upstream Wu•
These dimensions are estimated in Sections 7.2.1
and 7.2.2.
Approach embankments which cross a flood plain will
force flood water through the bridge opening,
resulting in higher flows in the main channel under
the bridge and a general lowering of the river bed
level at the bridge site. This is known as general
scour due to flood plain constriction, and depends
on the extent to which embankments obstruct or
block the flood plain flow (Figs 11-13).
General scour due to flood plain constriction
depends on the depth of flow over the flood plain
Y,, the width of flow over the flood plain W,, and
the depth and width of the main river channel
44

Handbook 47 Date or Issue 4!92
upstream of the bridge, Yu and W" (Fig 14). These
dimensions were estimated in Sections 7.2.1 and
7.2.3.
Calculate the ratios Enter
values on calculations shee~.
Based on the values of these ratios, use Figures 15
to 18 to obtain a value of d,1 /Y0 • Interpolate
between lines if necessary, and interpolate between
figures if necessary. Alternatively, the following
equation may be used:
Enter the value of
on the calculation sheet.
s/3 l 6/7 ( Wu) o·« _1 WB
in the space provided
7.3.2 Additional scour due to river bends
In this section, t~e risk that a pier or abutment
is exposed to deeper than average depth of scour
due to a bend in the river is assessed. The
assessment should be based upon whether there are
any significant bends and their severity. The
45

Handbook47
rel.evant reach of the river includes the bridge
site and extends approximately 5 channel widths
upstream of the bridge. If this stretch of river
is straight it should be marked accordingly. If
this section of river contains a bend then its
severity should be assessed and marked.
If the channel is straight within this reach the
location of the deepest scour may shift across the
width of the channel unpredictably. A curved
channel will tend to adopt a triangular cross
sectional shape, with the deepest point towards the
outside of the bend (Fig 19).
For each abutment which lies in the river channel,
obtain a score from the following table:
Location of abutment
Bend Inside Outside
sharpness of bend of bend
Straight 4 4
slight 3 5
moderate 2 6
severe 1 7
For each pier which is in the river channel, obtain
a score from the following table:
46
Handbook 47
l
Date of Issue 4192
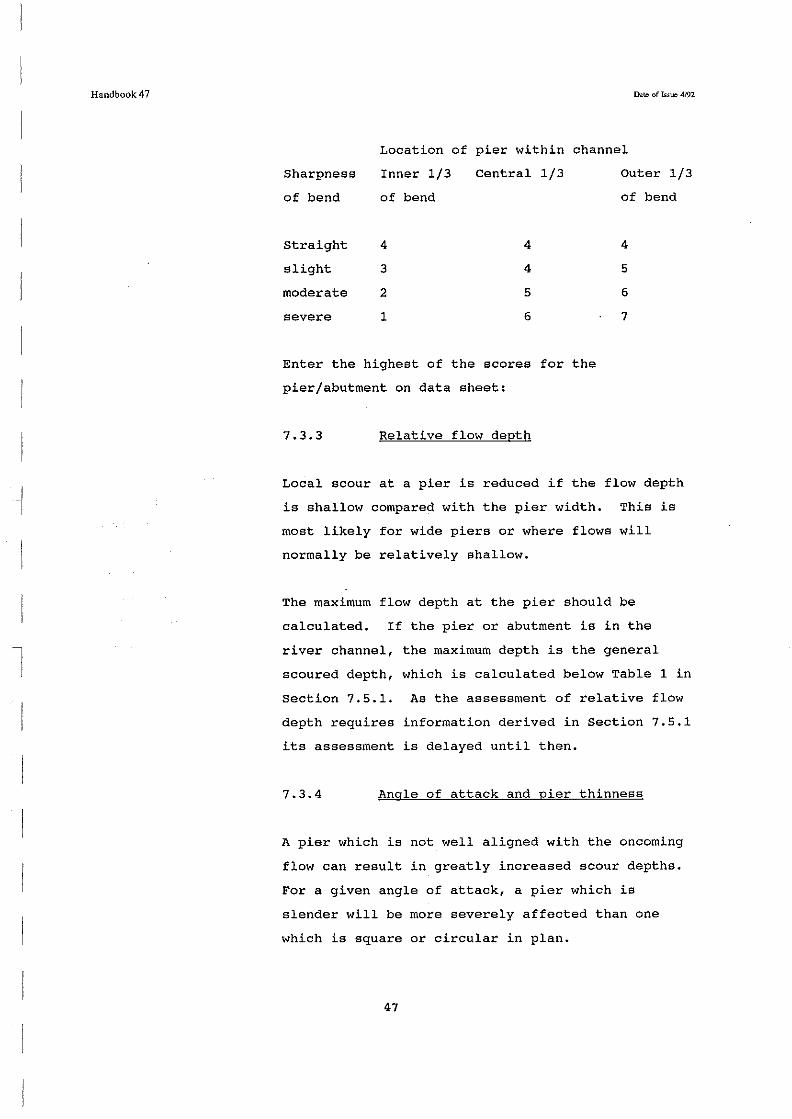
Location of pier within channel
Sharpness Inner 1/3 Central 1/3
of bend of bend
Straight 4 4
slight 3 4
moderate 2 5
severe 1 6
Enter the highest of the scores for the
pier/abutment on data sheet:
7.3.3 Relative flow depth
Outer 1/3
of bend
4
5
6
7
Local scour at a pier is reduced if the flow depth
is shallow compared with the pier width. This is
most likely for wide piers or where flows will
normally be relatively shallow.
The maximum flow depth at the pier should be
calculated. If the pier or abutment is in the
river channel, the maximum depth is the general
scoured depth, which is calculated below Table 1 in
Section 7.5.1. As the assessment of relative flow
depth requires information derived in Section 7.5.1
its assessment is delayed until then.
7.3.4 Angle of attack and pier thinness
A pier which is not well aligned with the oncoming
flow can result in greatly increased scour depths.
For a given angle of attack, a pier which is
slender will be more severely affected than one
which is square or circular in plan.
47

Handbook47 D.!to of Issue 4192
Estimate the angle of attack, which is the angle
between the long axis of the pier and the approach
current, using the following information:
• Observe the direction of current at the
surface, from floating debris etc, just
before it reaches the pier. Estimate the
maximum angle between this approach current
and the pier.
• Estimate the angle between the main channel
direction immediately upstream of the bridge,
and the bridge pier.
• The angle of attack at high flows may be
different to that at low flows. If the river
floods, the flood plain flow may be deflected
by the railway approach embankments,
increasing the angle of attack. Take account
also of any abutments or works upstream of
the bridge which may deflect the current at
high flows to increase the angle of attack.
Estimate the thinness of the pier, defined as
thinness pier length pier width
LP and WP were estimated in Section 7. 2. 4
Find a score for angle of attack and pier thinness
from the following table.
48

Handbook47
I
-1
Interpolate if necessary:
11 Thinness I Dl 1 I 2 I 4 I 6 I 8 I 12 I 16 I
0 1.0 1.0 1.0 1.0 1.0 1.0 1.0
Angle of 5 1.0 1.1 1.2 1.3 1.4 1.6 1.9 Attack (degrees) 10 1.0 1.2 1.4 1.6 1.7 .2. 0 2.5
20 1.0 1.4 1.8 2.0 2.2 2.7 3.5
30 1.0 1.5 2.0 2.3 2.7 3.4 4.2
45 1.0 1.5 2.3 2.8 3.2 4.1 5.1
60 1.0 1.6 2.5 3.1 3.7 4.8 5.8
Enter for angle of attack and pier thinness on data
sheet:
7.3.5 Group of Columns
If a pier consists of a group of circular columns,
with a centre-centre spacing of less than 5 WP,
then the effects of the columns may interact to
increase the depth of scour.
If a pier does not consist of columns, then the
following calculations should be omitted, and a
score of '1' should be entered for 'group of
columns' on the sheet.
Use the following measurements depending on the
arrangement of the columns:
C1: Centre-centre distance of columns which are
arranged approximately parallel to the flow
direction.
C2 : Centre-centre distance of columns which are
arranged approximately perpendicular to the
flow direction
49

Handbook47 Dale of bsuo 4192
width of a column within the group.
Note that if four or more columns are arranged in a
rectangular or square layout, then values for C1
and C, will be obtained.
(If column widths are not all equal, w. should be
the width of the widest column)
a: Angle of attack of flow
(See Fig 20 for definitions of c 1, c, and a)
Calculate the following as appropriate:
Use Fig 20 to obtain scores using the values of
CifWP and a, and/or C,./Wp and (90-a) as appropriate.
If more than one score is obtained, choose the
maximum score.
Enter sc·ore for group of columns on the calculation
sheet:
7.3.6 Pier nose shape
The plan shape of the upstream end of the pier has
a small influence on scour. If the pier is not
well aligned, however, the shape of the pier ceases
to significantly affect the scour.
Match the upstream end of the pier or abutment, or
both ends if tidal conditions prevail, to one of
the following drawings, and obtain a score for pier
nose or abutment shape.
50

Handbook47
Nose shape in plan
Pier
Angle of attack> 5° (see 7.3.5)
- -:A lf'_:;;:';.:·:o--
0 q-~_,,._,,_ .. ,,.-- or );:.:.>: ... , ·
:·
Date of lssw 4192
Score
Abutment
4
1
2
4
7
Enter the highest score of pier nose or abutment
shape on data sheet :
7.3.7 Assessment of bed sediment size and
grading
Probe the bed of the river, and, where possible,
take samples of the bed material at several
locations upstream and downstream of the bridge,
and beneath the bridge. A layer of fine material
(silt) may have been deposited on the bed if the
flow velocity is low at the time of inspection. If
gravel or sand is found beneath a layer-of silt,
ignore the silt and sample the underlying gravel or
sand.
Examine the sampled bed material, and put ticks in
the following table corresponding to material which
is present in significant proportions.
51

Handbook47
Description
Particle size (mm)
Tick if present
i}Jtc. of Issue 4/92
Table for assessing bed sediment size and grading:
clay silt sand gravel
fine-medium coarse
<0.002 0.002- 0.06-2 2-20 >20 0.06
Assess the grading of the bed material using the
following table, and obtain a score for bed
material grading:
Number of ticks Bed material Score in above table grading
1 narrow 7
2 5
3 3
4 2
5 wide 1
Enter score for bed material grading on data sheet:
7.3.8 Blockage due to trapped debris
Scour may increase significantly if debris such as
vegetation becomes trapped on a pier, blocking part
of the waterway opening.
If the bridge has one or more piers in the river
channel or has a single span of less than lOm,
obtain a score for the effect of trapped debris
from the following table:
52

Handbook 47
I Catchment vegetation I heavily wooded fertile, few forested bank trees
vegetation and bushes
catchment steep topography hilly 7 5 4 2
moderate 6 4 3 2 flat
7.4 Foundations
5 3 3 l
4 2 2 l
If debris is present which is causing a significant
blockage to the flow through the bridge, then score
7. If the bridge has a history of debris blockage,
then score 7.
Enter score for trapped debris on data sheet:
7.4.1 Introduction
This section presents guidance for assessing the
foundation depth. The depth of foundations is
important as it partly determines the ability of
the bridge to withstand scour.
Spread foundations are most susceptible to scour.
Safety is increased if the foundation is on bearing
piles or surrounded by a sheet pile curtain which
extends below the base of the foundations.
Pile foundations are inherently safer than spread
foundations, but excessive scouring can result in
loss of skin friction or pile stability. Old piles
may have lost strength due to deterioration.
53

Handbook47
The type of bed material on which the pier or
abutment is founded is important in determining the
integrity of the foundation if it is subjected to
scouring forces.
The critical foundation level is the level to which
the bed level can fall without endangering the
bridge. If the bed level falls below the critical
foundation level, then it is assumed that the
foundation is in danger of failing. For the case
of spread foundations, the critical level may be
the level of the underside of the base. For
abutments, the critical level may be higher than
the underside of the base, if bed material acts to
resist lateral forces on the abutment due to
pressure from the embankment.
The critical level for pile foundations depends on
the type of pile (skin friction, end bearing or
both) and its stability. The critical level will
often be higher than the base of the piles, but
more detailed analysis would be required to
determine this accurately.
In many cases, piers are founded on an enlarged
base which is underpinned by columns. Here again,
more detailed analysis would be needed to
accurately determine the critical level.
The 'foundation depth' is measured from the river
bed to the critical foundation level.
54
Handbook47
7.4.2 Measurement of foundation depth
The foundation depth is taken to be the vertical
distance between the bed of the river and the
critical foundation level. The measurement of the
level of the bed of the river should be taken in
the region surrounding the pier up to a distance of
2Wp away from the centre of the pier (Fig 21). The
minimum bed level within this region should be
taken.
Case (a) in Figure 21 shows a depression in the bed
around a pier and dr is measured at a point close
to the pier.
case (b) in Figure 21 shows that there has been
significant scour away from the pier and in this
case dr is measured from the minimum bed level
within an area of radius 2Wp from the centre of the
pier. In this case {b) the measurement position is
at a distance 2Wp from centre-line of the pier and
the depth of foundation dr is negative ie the bed
level at measurement position is lower than the
lowest part on the foundation.
Based on the estimates of critical foundation level
and river bed level, obtain a best estimate for the
foundation depth d,.
Enter foundation depth dr (m) on data sheet:
55

Handbook47
7.5 Calculation of
scour depth d1
Section Description
7.5.1 Calculation of depth of general scour
In this section a value for general scour depth is
calculated using the value of ca.lculated in
Section 7.3.1.
The following calculation determines which
is dependent upon and factors which relate
scour due to bends and bed material grading. Enter
the scores from appropriate sections into Table I:
Table I
Score Calculation Result Factor s
7.3.2 Scour due to 0.25S+0.25 B bends
7.3.7 Bed material 0.05S+0.65 BMG grading
To determine from Section 7.3.1.
56

Handbook47
To
1)
2)
3)
Add 1
Multiply by B and BMG
Subtract BMG
the result gives a value for
The value of Y. is known (Section 7.2.1)
Multiply d,/Y. by Y. to obtain value for d,
Enter dg on data sheet:
Date of Issue 4192
7.5.2 Calculation of depth of local scour
Calculate the depth of flow at the bridge including
the effect of general scour, Ym:
Ym = Yu + dg
Obtain a score for relative flow depth from the
following table.
Ym/W Score
:5 0.2 1
> 0.2, :5 0.5 2
> o.s, :5 0.8 3
> 0.8, :5 1.2 4
> 1. 2, :5 1.6 5
> 1. 6, < 2.3 6
> 2.3 7
57
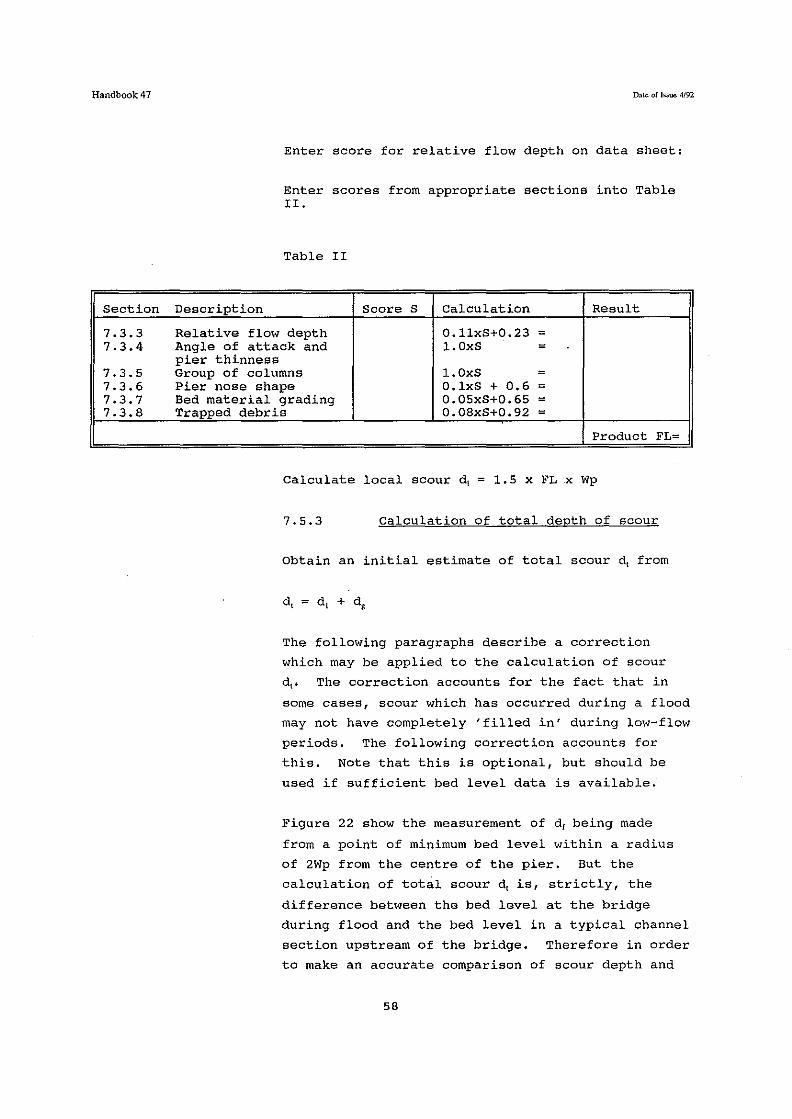
Handbook 47
Section
7.3.3 7.3.4
7.3.5 7.3.6 7.3.7 7.3.8
Description
Date of Issue 4!92
Enter score for relative flow depth on data sheet:
Enter scores from appropriate sections into Table rr.
Table rr
Score s Calculation Result
Relative flow depth O.llxS+0.23 = Angle of attack and l.OxS = pier thinness Group of columns l.OxS = Pier nose shape O.lxS + 0.6 = Bed material grading 0.05xS+0.65 = Trapped debris 0.08xS+0.92 =
Product FL=
Calculate local scour d1 l.SxFLxWp
7.5.3 Calculation of total depth of scour
Obtain an initial estimate of total scour d, from
The following paragraphs describe a correction
which may be applied to the calculation of scour
dt. The correction accounts for the fact that in
some cases, scour which has occurred during a flood
may not have completely 'filled in' during low-flow
periods. The following correction accounts for
this. Note that this is optional, but should be
used if sufficient bed level data is available.
Figure 22 show the measurement of dr being made
from a point of minimum bed level within a radius
of 2Wp from the centre of the pier. But the
calculation of total scour dt is, strictly, the
difference between the bed level at the bridge
during flood and the bed level in a typical channel
section upstream of the bridge. Therefore in order
to make an accurate comparison of scour depth and
58

l
Handbook 47 Date of Issue 4192
foundation depth, a correction may be applied to
the calculated scour depth.
At some bridges, general and local scour may
already exist at the time of inspection, as shown
in Figure 22. During a flood the general and local
scour will increase, lowering the bed level and
then possibly fill in again during lower flow
conditions.
The total calculated scour depth, d., is greater
than in the actual case due to the existing scour
of depth AF. Therefore d, should be adjusted by
subtracting the adjustment factor AF.
This will ensure that a valid comparison of d, and
depth of foundation d, can now be made.
The value AF is the difference between the minimum
bed level at a typical cross section upstream of
the bridge, (preferably beyond any channel
constriction associated with the bridge) and the
bed level from which the foundation depth was
measured. Note that this correction can only be
applied if sufficient knowledge of bed levels is
available, eg from divers' reports or echo sounding
surveys. If insufficient information is available,
then AF should be assumed to be zero.
It is possible that the bed level in the upstream
channel will be lower than the bed level under the
bridge if dredging etc has taken place, in which
case AF should be assumed to be zero.
Enter adjustment factor AF(m) on data sheet:
Calculate revised scour depth
d, d,-AF
59

Handbook 47
7.6 Assessment of
risk due to scour
7.7 Amendment of
priority rating
7.5.4 Foundation depth
The foundation depth dr (m) is calculated in
Section 7.4.2.
The scour depth d, (m) and foundation depth d, (m)
are now combined to give a preliminary priority
rating for the bridge. The priority rating is then
modified to account for other factors such as the
river type, and load bearing material.
Use the graph on Figure 23 to obtain the
preliminary priority rating, based on values of d,
and d, obtained above. Interpolate between curves
where necessary. Alternatively, the following
formula may be used:
preliminary priority rating =
15 + ln ·[ (d, - dr)/dr + 1].
Note that this is valid only when the foundation
depth dr is greater than 0.
A number of additional features may be present
which influence the risk of failure. The
preliminary priority rating should be ammended to
account for these, as described in the following
sections.
7.7.1 River type
The value TR was obtained in Section 6.4. TR can
lie from -1.0 to 0.0. The priority rating is
modified to account for river stability. Value TR
is added to the preliminary priority rating:
60

Handbook47 Date of m= 4/92
priority rating = preliminary priority rating + TR
The priority rating may therefore be either reduced
or remain the same as a result of the correction
for river type.
7.7.2 Load bearing material
The type of bed material on which the pier or
abutment is founded is important in determining the
integrity of the foundation if it is subjected to
scouring forces. The above assessment of scour
assumes that the material on which the pier or
abutment is founded (the load bearing material) is
the same as the material on the surface of the
river bed. If the load bearing material is more
resistant to scour, then the risk from scour will
be reduced.
In the extreme case, a pier may be founded on
bedrock which is highly resistant to scour, while
the bed material visible in the river is sand or
gravel which may be erode.d in flood.
As another example, a pier may be founded in
cohesive clay with significant resistance to scour
which could effectively limit the rate and degree
of scouring.
The material between the river bed and the
foundation level may consist of several strata of
differing strengths, eg a sand and gravel layer
overlying more stiff clay which has a higher
resistance to scour. The effective resistance to
scour is in this case very complex, depending on
the strengths of the different strata, and their
levels relative to scour and foundation depths.
The following guidelines should be used to account
for the type of load bearing material.
61
Handbook 47
* If the load bearing material is not known,
then the priority rating from Section 7.7.1
is unchanged.
* If a pier or abutment is founded on rock
which is highly resistant to erosion, and
scouring of any erodible material down to the
rock layer would not jeopardise the strength
or stability of the foundation, then the
bridge pier/abutment should be classified as
'low priority'
* If a pier or abutment is founded on clay
classified as stiff or very stiff, then
reduce the priority rating (obtained from
Section 7.7.1) by 1.0.
7.7.3 Invert on the river bed below the
bridge
This can be an effective measure against both
general and local scour at a bridge site. The
material. of the invert should be sufficient to
resist scour. Inverts are most commonly
constructed from concrete, masonry or brick. The
following points should be noted.
i) The invert shouldCover a sufficient extent of
the bed around the pier to protect it from
scour. For narrow rivers, an invert should
extend across the width of the river. For
wide rivers, separate inverts may be provided
for each pier. Inverts should cover at least
the extent of any constriction in the
waterway upstream and downstream of the
bridge. An invert which does not fulfil
these requirements may be vulnerable to
general scour.
ii) The upstream edge of the invert should be
toed in to the bed to a sufficient depth, to
prevent scour from undermining the invert.
62

Handbook 47 Date of Issw 4192
8 ASSESSMENT OF
'CATEGORY 2'
ELEMENTS
8.1 Introduction
iii) The invert should not project above the bed,
for this would encourage local scour at the
upstream edge of the invert. This is
particularly important during floods, when
the bed level may fall.
iv) No scouring should be visible at the upstream
or downstream edges of the invert.
If a satisfactory invert exists, then elements of
the bridge protected by the invert should be
classified as 'low priority'.
7.7.4 Stone scour protection measures
Quantities of loose bed protection such as large
stones or grout base may have been placed locally
around piers or abutments, with the aim of
increasing the resistance of the bed to scour.
Unless the site was pre-excavated and the stone
carefully placed in the excavation to lie below the
bed level, the effect of this measure may be to
increase scour depths, particularly if the
available waterway area was reduced or the pier
width increased. Material which has been dumped on
the bed and banks, particularly at a constricted
crossing, will reduce the flow area, and may
increase both general and local scour depths.
If the scour protection is known to have been
designed and constructed to an adequate design
standard, then protected elements should be
classified as 'low priority'.
This section applies to parts of a bridge for which
no appropriate methods exist for calculating scour
63

Handbook47 Date of Issue 4192
or erosion depths. In these cases therefore, the
bridge elements are assessed by observing and
recording features which are known to affect the
susceptibility to scour. The terms labelled 'a)'
indicate lowest risk, 'b)' a higher risk, etc.
8.2 Bridge pier or
abutment founded on
flood plain near to
the main channel
This section applies to piers or abutments founded
on the flood plain, near to the main channel. As a
guideline, this applies to elements located within
a distance equivalent to 10% to 20% of the channel
width from the river bank (eg Figs 3 and 4),
although the appropriate distance from the river
bank depends on factors such as the rate of bank
erosion, and details of structure.
The main risk in this case is undermining of the
foundation or loss of support due to lateral
shiftin~ of the river channel. This can result
from bank erosion during floods. The risk depends
on many factors including the rate of bank erosion,
the severity of the flood, the type of soil, and
the degree of bank protection.
The pier or abutment may also be at risk from local
scour.
The following are designed to characterise the
nature of the river within approximately one to two
kilometres upstream and downstream of the bridge.
Uns~able rivers ~end to be more prone ~o rapid
lateral shift in river course. (For guidance on
river classificatiOn, see Section 6.2):
River (1):
64
a)
b)
Stable
Dynamically stable
c) Unstable

Handbook 47
I
Date of Issue 4192
The channel pattern gives an indication of the
tendency of the river to change course:
River (2): a)
b)
straight
Meandering
c) Braided
Steep rivers tend to be more prone to sudden
changes in course. (For guidance, see
Section 6.3.1 which includes measurement of the
river slope upstream of the bridge):
River (3): a)
b)
Flat (eq less than 0.2m/km)
Moderate (eg between
0.2m/km and 3.0m/km)
c) Steep (eg greater than
3.0m/km)
Canals and controlled rivers tend to be more stable
than natural waterways:
River (4): a)
b)
C)
Canal
Controlled river (ie river
where flows are
significantly controlled by
measures such as wiers)
Natural river
The risk is increased if the river has a history of
erosion problems:
River (5): a) No known bank erosion or
channel shifting
b) History of gradual erosion
and slow channel shifting
c) History of rapid bank
erosion and rapid channel
shifting
The following apply to the river in the vicinity of
the pier:
65

Handbook47 Dale of Issue 4l'J1.
Protected river banks in the vicinity of the bridge
reduce the risk of channel shifting:
Bridge site (1): a) River banks stabilised by
natural vegetation or
artificial measures eg
sheet piling, riprap, etc.
b) River banks not protected
from erosion.
Visible river bank erosion indicates that the river
course may be shifting:
Bridge site (2): a) No signs of bank erosion
visible
b) Localised bank erosion
visible
c) Widespread active bank
erosion visible
A channel will normally shift laterally towards the
outside of a bend, so a pier here will be at higher
risk:
Bridge site (3): a) Bridge pier on inside of
bend
b) Bridge on straight reach of
river
c) Bridge pier on outside of
moderate bend
d) Bridge pier on outside of
sharp bend
A pier very close to the main river channel will be
more susceptible to a smaller shift in the river
course:
Bridge site (4): a)
66
Pier located close to river
the bank ie between a
distance of 10% and 20% of
the river width from the
river bank

Handbook 47
b) Pier located very close to
river bank ie within a
distance equivalent to 10%
of the channel width from
the river channel
Shallow foundations will tend to be undermined or
to loose support if the channel shifts towards the
pier:
Bridge site (5): a) Pier foundations deep
relative to bed level in
river near to pier location
eg pile foundation
b) Pier foundations shallow
relative to bed level in
river near to pier location
eg spread foundation
Drawings or maps may show that the alignment of the
river relative to the bridge has changed with time,
which may indicate a worsening in hydraulic
condi tio_ns:
Bridge site (6): a) No evidence that the
alignment of the river has
changed since construction
of the bridge
b) Evidence that the alignment
of the river has changed
since construction of the
bridge
Visible signs of erosion around the pier or abutment may indicate active scour during floods:
Bridge site (7): a) No signs of erosion around
pier or around base of
abutment
67
b) Signs of erosion around
pier or around base of
abutment
Handbook47
8.3 Bridge pier or abutment
founded on flood plain
set well back from main
river channel
This section applies to piers or abutments founded
on the flood plain, set well back from the main
channel. As a guideline, this applies to elements
located further than a distance equivalent to 10%
to 20% of the channel width from the river bank (eg
Figs 5 and 6). The appropriate distance depends on
factors such as the rate of bank erosion and
details of the structure.
In this case, the pier or abutment is founded on
the flood plain, and set back from the riverbank a
sufficient distance so that the risk of undermining
due to movement of the river channel is remote.
The main risk is now local scour caused by flow
over the flood plain. Flood plain flow is
generally relatively shallow and has lower velocity
than flow in the main channel, and the risk of
scour tends to be lower. It is therefore unlikely
that these elements will fall into the 'high
priority' category.
High velocity flows over the flood plain due to
steep valley gradient will tend to increase scour
at obstructions such as a pier or abutment. (For
guidance, see Section 6.3.1 which includes
measurement of the river slope upstream of the
bridge):
River (1):
68
a) Flat (eq less than
0.2m/km)
b) Moderate (eg between
0.2m/km and 3.0m/km)
c) Steep (eg greater than
3.0m/km)
Handbook47
A flood plain upstream of the bridge which offers
little resistance to the flow will tend to increase
flow velocities and hence the tendency to scour:
River (2): a) Flood offers high
resistance to flow due to
hedges, trees, dense
vegetation etc
b) Flood plain offers moderate
resistance to flow with
some obstruction due to
hedges, trees, etc.
c) Flood plain offers low
resistance to flow, little
or no obstruction from
vegetation, fences etc.
A large depth of flow over the flood plain during
floods will result in worse hydraulic conditions
than a shallow depth:
River (3): a)
b)
Very shallow or shallow
flow depths of flow over
the flood plain at the
location of the bridge
element
Medium flow depths over the
flood plain at the location
of the bridge element
c) Deep flood plain flows over
the flood plain at the
location of the bridge
element
If the element has been subjected to scour during a
previous flood, there may be a visible scour hole
or signs of erosion:
Bridge (1): a)
b)
69
No signs of scour or erosion
visible at bridge element
Signs of minor or localised scour

Handbook47 Dato of Losue 4!92
or erosion visible at bridge
element
c) Widespread or severe scour or
erosion visible at bridge element
The degree of natural or artificial scour
protection around the bridge element should be assessed. A lack of scour protection indicates
greater susceptibility to scour:
Bridge (2): a) Ground adjacent to bridge element
well protected by plentiful
permanent vegetation or
artificial measures - no soil
exposed
b) Ground adjacent to bridge element
protected by some vegetation
c) Ground adjacent to bridge element
unprotected - soil exposed and
prone to scour
The soil type may influence the degree of scouring
which takes place:
Bridge (3): a) Bridge element founded on rock,
or material with high resistance
to scour
b) Bridge element founded in
cohesive soil with moderate
resistance to scour
c) Bridge element founded in
non-cohesive soil eg sand and
gravel, which is readily scoured
Shallow foundations result in higher vulnerability
to scour:
Bridge (4): a) Bridge element founded on deep
foundations eg piled foundations
b) Bridge element founded on shallow
foundations eg spread footings
70

Handbook 47 Da10 of Issue 4192
8.4 Flood relief arch
through approach
embankment (eg Fig 7)
The main risk of scour at a flood relief arch is
general scour caused by flood waters flowing
through the constriction of the relief arch at high
velocity. The risk will be increased if water
levels reach to above the springing of the arch, or
to above the soffit level. A further feature which
can increase scour is partial blockage of the
opening by debris.
River ( 1):
River (2): These are the same as in Section 8.3
above
River (3):
Debris which becomes trapped within the arch can
increase scour at relief arches:
River ( 4): a)
b)
Little chance of relief
arch trapping debris which
could increased scour (eg
open arch, little catchment
vegetation carried with
floods)
Moderate chance of relief
arch trapping debris which
could increased-scour
c) High chance of relief arch
trapping debris which could
increased scour (eg some
existing blockage due to
debris, fence, hedge etc,
catchment vegetation such
as trees and other debris
carried down by flood)
A large constriction of main channel and flood
plain flows will tend to increase flows through the
relief arch, resulting in tendency for greater
71

Handbook 47 Da~ of Issue 4192
scour: The degeree of constriction may be judged
by calculating the ratio d,tfY. , see Section 7.3 .1:
Bridge (1) a) Very little or little
constriction of the channel and
flood plain flows (d,1/Y. less
than 0.3)
b) Moderate constriction of the
channel and flood plain flows
( d81 /Yu between 0. 3 and 1. 5)
c) Severe constriction of channel
and flood plain flows ( d,dYu
greater than 1.5)
If the relief arch has been subjected to scour
during a previous flood, there may be a visible
scour hole or signs of erosion:
Bridge (2): a) No signs of scour or erosion
visible at bridge element
b) Signs of minor or localised scour
or erosion visible at bridge
element
c) Widespread or severe scour or
erosion visible at bridge element
The degree of natural or artificial scour
protection within the relief arch should be
assessed. A lack of scour protection indicates
greater susceptibility to scour:
Bridge ( 3) : a) Ground adjacent to relief arch
well protected by plentiful
permanent vegetation or
artificial measures - no soil
exposed
b) Ground adjacent to relief arch
protected by some vegetation
c) Ground adjacent to relief arch
unprotected - soil exposed and
prone to scour
72
Handbook47
8.5 Earth embankment
Dato of Issue 4fil
The soil type may influence the degree of scouring
which takes place:
Bridge (4) a) Relief arch foundations founded
on rock, or material with high
resistance to scour
b) Relief arch foundations founded
in cohesive soil with moderate
resistance to scour
c) Relief arch foundations founded
in non-cohesive soil eg sand and
gravel, which is readily scoured
Shallow foundations result in higher vulnerability
to scour:
Bridge (5) a) Relief arch founded on deep
foundations eg piled foundations
b) Relief arch founded on shallow
foundations eg spread footings
eg approach embankment
(eg Fig 8)
9 FURTHER ACTION
An earth approach embankment which crosses a flood
plain may be subject to erosive action during
flood. Particular risks include erosion behind
abutments, and erosion to the toe of the
embankment. An embankment may be at particular
risk if the line of the embankment is near to the
main river channel: in this case, erosion of the
river bank may lead to collapse or partial collapse
of the embankment.
The procedures in the Sections 7.1 - 7.7 and
Sections 8 enable the risk of failure of a bridge
due to scour to be assessed. This section outlines
the further action which should be taken. This
depends on the priority category of each part of
73

Handbook47
9.1 High priority
bridge
Date< of Issue 4m
the bridge. It is recommended that, initially, the
priority for action on all parts of the bridge
should be based on the highest priority rating
obtained for the individual elements. Three levels
of investigation are identified and discussed.
NOTE: The categorisation is preliminary at this
stage, awaiting calibration of the method against a
number of test cases. The divisions between the
six categories are provisional. Note also that a
bridge placed in the high priority category
indicates that further study of the bridge is
required to assess the hydraulics and risk of
scour. In some cases it may be found that scour
protection measures are not required.
This section applies to bridges with a high
priority rating. Bridges in this category are
expected to be at greatest risk of failure from
scour, and should be placed under special
observation to ensure the safety of rail ·traffic.
The following action is recommended:
• Arrangements should be made to receive flood
warnings and to act accordingly. Specialist
advice should be sought where necessary to
advise on the likely risk to the bridge from
floods of different severities.
• Consideration should be given to monitoring
of scour at the bridge. This can detect
scour which is not visible during a flood,
and can be used to assess whether scour is
threatening the foundations. Scour
monitoring also provides a direct measurement
of scour, and can be used to improve
estimates of scour depth.
74

1 I
\
Handbook47
9.2 Medium priority
bridge
9.3 Low priority
bridge
•
Date of Issue 4!92
Specialists should be consulted to carry out
more detailed and refined hydrau~ic studies
of bridges in this category.
• Scour protection works may be appropriate,
although implementation of scour protection
works is not recommended on the basis of this
procedure alone.
This section applies to bridges with a medium priority rating. A bridge in this category is not
in immediate risk, but should be monitored
regularly to ensure that it remains safe. The
following studies may be appropriate for bridges
with marginal risk.
• Occasional measurement of bed level during or
immediately following a large flood.
• Regular inspection using this procedure to monitor changes which may be taking place to
the bridge or river.
This section applies to bridges with a low priority
rating. A bridge in this category is at low risk,
but the following studies are recommended.
• Infrequent inspection using this procedure to
monitor changes which may be taking place to the bridge or river
• Infrequent measurement of bed levels, during
or immediately following a large flood.
75


l
Handbook47
10 CONCLUSIONS AND
RECOMMENDATIONS
10.1 Conclusions
Date of Issue 4/92
1. This report describes possible types of
failure due to hydraulic causes, but deals
mainly with the problems of scour. Features
of the bridge, river or catchment which may
affect the risk of hydraulic failure are
discussed. Guidelines are included for
assessing the risk of failure due to scour.
Modifications to the bridge, river or
catchment which can affect the safety of a
bridge are discussed.
2. The guidelines are designed to enable a wide
variety of bridges to be assessed rapidly and
with minimal data requirements and without
specialist equipment or expertise. There are
limits to the accuracy and reliability of
this type of assessment.
3. Many factors combine to make reliable
prediction of hydraulic risk to a bridge very
difficult. Some of these are listed below.
• There is a lack of basic knowledge about the
scour phenomenon particularly in field
conditions.
• Some features of the river or bridge cannot
easily be quantified.
• Bridges and rivers may have complex
geometries which are not covered by existing
prediction techniques.
• Reliable estimates of peak flood flows and
depths cannot be made without a long period
of field monitoring.
76

Handbook47
10.2 Recommendations
•
D .. te of lssu:> 4/92
The underlying geology of the site may be
important, but may not be known unless a
detailed site investigation has been carried
out.
• The depth and condition of the bridge's
foundations may be important, but may not be
accurately known.
1. A number of bridges should be assessed in a
number of regions, in collaboration with HR,
using the guidelines contained in this
report. This will enable calibration of the
method.
2. Once the guidelines are judged to be
satisfactory, bridges should be examined with
the aid of the guidelines to estimate degrees
of risk and to assess levels and frequencies
of future inspections.
3. A database should be set up containing all
available information relevant to hydraulic
conditions at each bridge site.
4. Details of any existing or planned
modifications to the bridge, river or
catchment which are relevant to the hydraulic
safety of the bridge should be obtained. The
effect of modifications on the safety of the
bridge should be assessed. Specialist advice
should be sought when necessary.
5. Further research is needed into scour at
bridges over British rivers. A programme of
research which includes field measurements of
scour at a number of bridge sites during
floods would enable improved methods of scour
prediction to be developed.
77

Handbook47
LIST OF SYMBOLS
A
AF
B
BMG
d,
d,
d,,
d,
d,
FL
LP
T years
T
TR
V
V
W,
w. WO
w. w. Yn
Y.
Yu
a
Cross sectional area of tidal waterway
Adjustment factor to account for 'residual' scour
Factor to account for bends
Factor to account for bed material grading
Depth of foundations
Depth of general scour
Intermediate value of depth of general scour
Depth of local scour
Depth of total scour
Factor for local scour
Length of pier
Return period of flood
Tidal period
Type of river score
Flow velocity
Tidal volume
Width of abutment
Net width of main channel under bridge
Flood plain width
Pier width
Channel width upstream of the bridge
Channel depth (to bank top level or flood level)
under bridge
Flood plain flow depth
Channel depth (to bank top level or flood level)
upstream of bridge
Angle of attack
Date of J,;s..., 4192
Section
6.3.2
7.5.3
7.5.1
7.5.1
7.4.2
7.5.1
7.3.1
7.5.2
7.5.3
7.5.2
7.2.4
7.1
6.3.2
6.4
6.3.2
6.3.2
7.2.4
7.2.2
7.2.3
7.2.4
7.2.1
7.2.2
7.2.3
7.2.1
7.3.5


. I
I
I
I
I
. I
I
~le


Handbook47 Da~ of Issue 4192
Table 1
Bridge element Primary risks Main worstening features Secondary risks Fig No
Bridge pier in main • Local scour • Angle of attack on enlongated • Channel stability (I) river channel • General scour pier • Dredging
• Channel constriction • Changes to river or • River bend at bridge or catchment inunediately upstream • Flood plain constriction • Shallow foundations
Abutment projecting • Local scour • Angle of attack • Channel shifting (2) into main river • General scour • Channel constriction • Dredging channel • Flood plain constriction • Changes to river or
• Abutment on outside of bend catchment • Shallow foundations
Bridge pier on flood • Channel shifting/ • River unstable • General scour (3) plain near to main bank instability • Banks unstable/ river channel • Local scour unprotected
• Outside of bend • Shallow foundations
Abutment on flood • Channel shifting/ • River unstable • Local scour (4) plain near to main bank instability • Banks unstable/ unprotected • Erosion behind abutment river channel • Shallow foundations
• Outside of bend
Bridge pier on flood - - • Local scour (5) plain set well back from main river channel
Abutment on flood - - • Local scour (6) plain set well back • Erosion behind abutment from main river channel
Flood relief arch • General scour and • Large constriction of flood plain - (/) 'culvert' flow o D«p flood plain flows
Earth embankment eg • Erosion • High velocity flood plain flows - (8) approach embankment • Slope failure • Large constriction of flood
exacerbated by high plain. Wave attack pore-water pressure • Erodible embankment soil


Figures

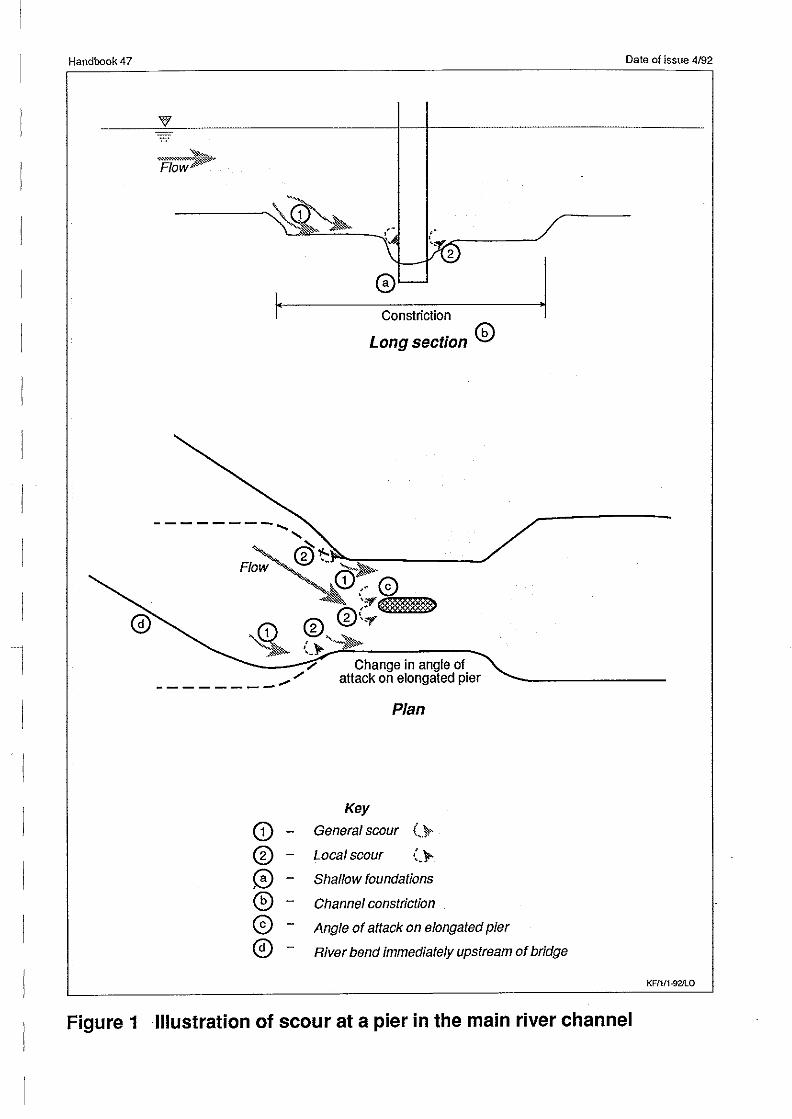
Handbook47
I· Constriction
Long section @
-------- ...... ,
Flo~@~~ \V:- 0 ;;r ~:..:""=:..,.
,(1) ® ®;~ ~ ()-:.,...-'o::;:_ ____ _
----:7 Change in angle of ________ ,.., "" attack on elongated pier
Plan
Key
G) - General scour (\!>
® - Local scour (}-
0 - Shallow foundations
® - Channel constriction
0 - Angle of attack on elongated pier
.I
@) - River bend immediately upstream of bridge
Date of issue 4/92
KF1111-92/LO
Figure 1 Illustration of scour at a pier in the main river channel

Handbook 47
' ' Floodplain
Channel
' ' ' '
I_-~ Channel - .... @ ' constriction @I Cross-section
' ' Floodplain ',
CD®-0-®-0-0-G-
' ' ' ' '
Plan
. Key
General scour ····-> Local scour : ... ,_y-
Channel constriction
Shallow foundations
Flood plain constriction
Abutment on outside of bend
Angle of attack
Date of issue 4/92
KF/2/1-92/LO
Figure 2 Illustration of scour at abutments in the main river channel

Handbook47
/ /
/
/ /
/
Cross-section
-------®C.,@.:_~--------------
---------,........ ........ ---_...-
------ ~-------~
Plan
Key
(!) - Localscour (.~
® - Channel shifting
0 - Banks unstable/unprotected
® - Shallow foundations
----- ----- ----- '- '-
Date of issue 4192
''
KF/311·921l.O
Figure 3 Illustration of main risks to pier on the flood plain near to the main channel

Handbook47
Figure 4
Cross-section
-------
Plan
Key
G) - Local scour Cl>-0 - Channel shifting
0 - Banks unstable/unprotected
® - Shallow foundations
0 - Outside of bend
Date of issue 4/92
KF/411·92/LO
Illustration of main risks to abutments on flood plain near to main river channel

I
I
Handbook47 Date of issue 4192
'--------------
Cross-section
------------- , .. A. -,_, --------Floodplain
Channel
Plan
Key G) - Local scour (_)-
KF/5/1-92fl0
Figure 5 Illustration of risk to pier on the flood plain well away from the main river channel

Handbook47 Date of issue 4/92
,-- (i) I
'--------------------
Cross-section
------------- -------
Floodplain
Channel
Plan
Key
(i) - Local scour (.}-
® - Erosion behind abutments
KF/611-92/LO
Figure 6 Illustration of risk to abutment on the flood plain well back from the main river channel
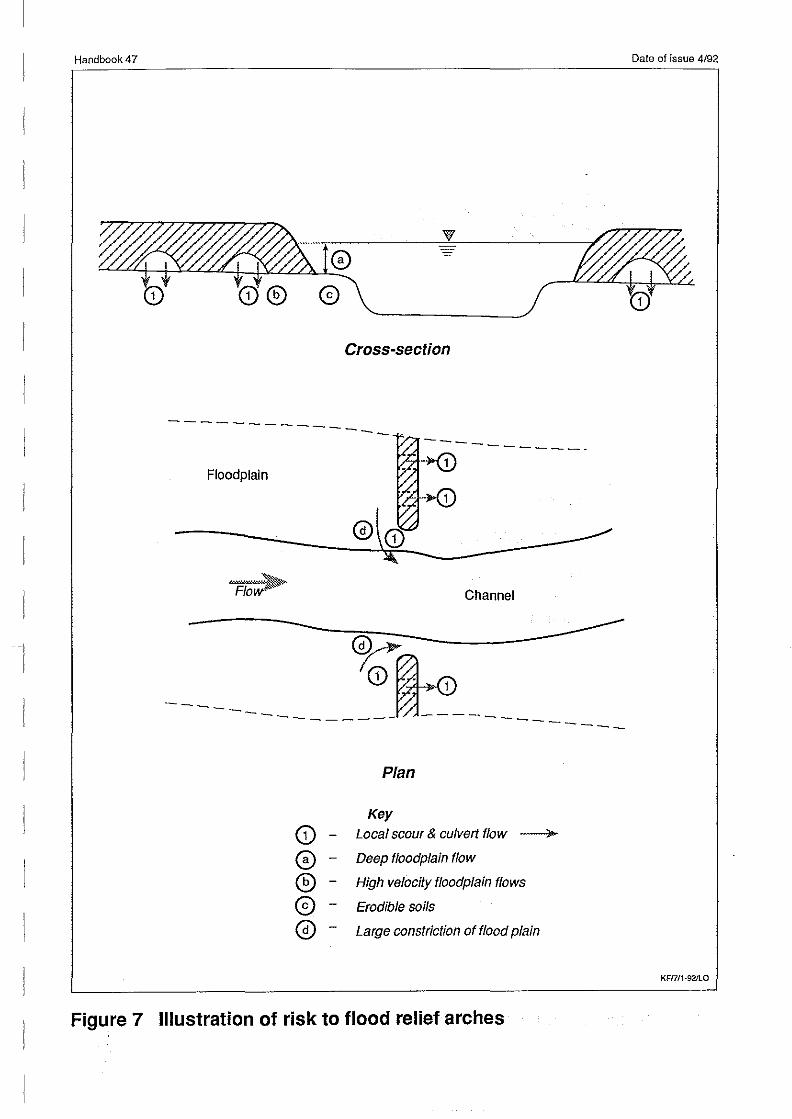
Handbook 47
Cross-section
----------------Floodplain
---··~
- ·-~
------·
--------~0~~~0C~----------Channel
~-~~----------~ -------- 0~-------- -----
Plan
Key
G) - Local scour & culvert flow -
0 - Deep floodplain flow
® - High velocity floodplain flows
0 - Erodible soils
@ - Large constriction of flood plain
---
Figure 7 Illustration of risk to flood relief arches
Date of issue 4/92
KFn/1-92flO

Handbook47
Floodplain
Floodplain
Channel
Cross-section
Plan
Key
G) - Erosion ·:_}>-
0 - Slope failure --~ @ - High velocity floodplain flows
® - Large constriction of floodplain
0 - Erodible embankment soil
Figure 8 Illustration of risks to approach embankments
Date of issue 4/92
KF/811-92/lO

Handbook47 Date of issue 4/92
Floodbank '», Floo~lain ~ ... -.., ../
7///// ///////// 0 · · v /'77777777777#
Time
?777777 ' .
Cross-section
Plan
/ ;.;
I
/ /
/
Groyne
Time
Without floodbanks
KFf9/1-92JLO
Figure 9 Examples of changes in flow conditions

Handbook47 Date of issue 4/92
Pier
Erosion
Removal of weir
Pier Dredging
...... ..............._ .............. ....... __ , .... ,-_, --
............. -1 --- ---\ --L_ -------- ~ -+-----------------
Erosion
Gravel digging Pier
·;;.--;:::;-··------------------···-------~~;.--··--------
~ \ 1-- - I -\ ;----- J--r-\ 1------ I ----- - /
Erosion
KF/10/1-92/LO
Figure 10 Examples of modifications which cause changes in bed level

Handbook47
Figure 11
Date of issue 4/92
dg =
Yu =
Ym =
qo = qoR + qol =
Q
wu =
wb =
Yo
ia y
Ym Yu . ' ~---- -----------~
Cross-section
•• • • . : :--· ~--: . . ·-------· Long profile
depth of general scour
depth of water in upstream channel
depth of water under bridge after general scour
overbank flow
flow in upstream channel
width of channel at expected high water level
width of bridge opening at expected high water level
depth of water on floodplain
Channel constriction: abutments encroach into main channel, overbank flow
KF/11/t-92JLO

Handbook47
Figure 12
Date of issue 4/92
Ym . . '----- ........................ •
Cross-section
Bank level
, .... • ..... , . . . . ·-------· Long profile
dg = depth of general scour
Yu = depth of water in upstream channel
Ym = depth of water under bridge after general scour
Q = flow in upstream channel
wu = width of channel at expected high water level
wb = width of bridge opening at expected high water level
Channel constriction: abutments encroach into main channel, no overbank flow
KF/1211·92/LO

Handbook47 Date of issue 4/92
Ym '>, I I
~---··· ----------------~ ./
Cross-section
__ Y/ ____ _ ·--·· .. __ f ___ _
~ Yo I ----·Yu ----- ------·Bank level Ym
Long profile
dg = depth of general scour
Yu = depth of water in upstream channel
Ym = depth of water under bridge after general scour
Q = flow in upstream channel
<la = qoR + <loL overbank flow
wu = width of channel at expected high water level
wb = width of bridge opening at expected high water level
Yo = depth of water on f/oodplain
n
Wf = r Wfi = width of 'n' flood relief arches i=1
Wo=Wol +WaR width of flow on floodplain
KF/1311-92/LO
Figure 13 Channel constriction: abutments on floodplain close to channel, overbank flow

Handbook47
' ~
r
~
_c O'ffi Eli
"'" xo wg
1 ,.
----~ "" c:~ 'ffi @ :2.c
1 .... ~
"' -t -~;: . t'
,.
~·
...
-vJ\J
-vJ\J
•
/
-vJ\J
-vJ\J
Figure 14 General scour
I L
~
~
..............
..............
~
~
1:: .!l! a:
---.....
\~' 1\
~~ ~
[;;> In
~
Date of issue 4/92
c ~ 0. "0
/~
r--..
Q; c @
.<:: <> E "' i ::J
. .. • : . : :
"' . "0 . . . . .
• • ., /
[;;> lii
/"
KFI14/1·921LO

I
6
5
4
3
2
1
0 1.0
Key
Y/Yu=0.5
YotYu = 0.4
---- Y/Yu=0.3
- - - - Y/Yu=0.2
Y/Yu=0.1
Y/Yu=O.O
.
-2.0
All of these lie on the same line in this case
Figure 15 General scour function, w0/w0 = 0
-------.
3.0 4.0 5.0
KF/15/11-91/lO
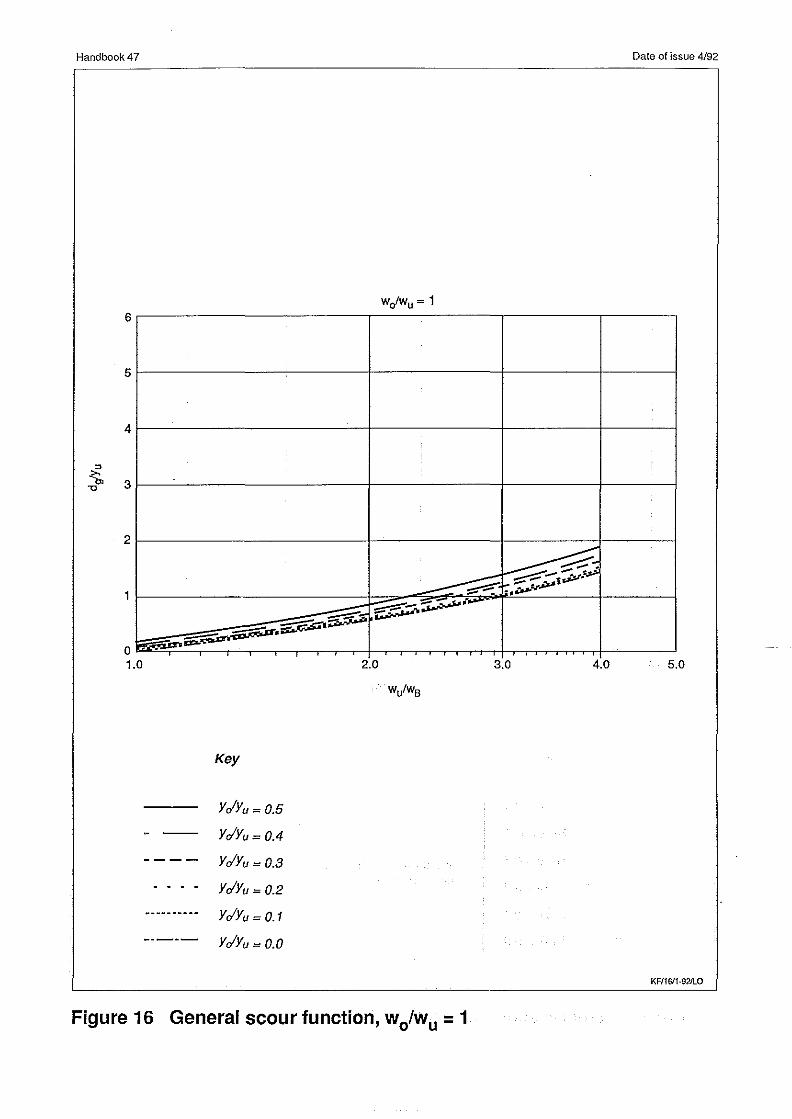
Handbook47 Date of issue 4/92
"4=~H=t= ~ -o"' 3
~~----- -
Figure 1G
Key
Yc/Yu = 0.5
Yc/Yu = 0.4
Yc/Yu = 0.3
Yc!Yu = 0.2
Yc/Yu = 0.1
Yc/Yu = 0.0
' 2.0
General scour function w I ' o Wu = 1
--rr---- I 3.0 4.0 5.0
KFI16/t-921lO

Handbook47
6
5
4
~
~ !-"" _,........
_,........ .... ........ ....
~ ............. - -· - . . . . -- . . :.~ .. --;;:::::.. --- . -- ........ .. ...... ___ .. .. .. .. . .......... .. ____ ..
---- -- .... .. ............ ::::"~-~ .. -- -- ...... --- .......................... :;..... .. ------- .. .. .. .. .............. ;.:.: .. ---... "-_ .. :::_::;;:. .. :-;;:.: ;;:.;." .. "::- .. -·
3
2
1
0 1.0 2.0 3.0 4.0
Key
Yc/Yu=0.5
Yc/Yu = 0.4
Yc/Yu = 0.3
Yc!Yu = 0.2
Yc/Yu = 0.1
Yc/Yu= 0.0
Figure 17 General scour function, w0 /wu = 5
Date of issue 4/92
5.0
KF/17/1-92/LO

Handbook47 Date of issue 4/92
6,----------------------.------------.---------,------,
2-- -__... --~ ---- --1 ~ --
r- -- . . . . .. ............ ...
········· . ..-·.................. ~-~ 1 --~-- .. .. .. .. .. .. .. ............... :.:- .. --·--"
.. ·.: ~-:;.·~: :.::::.:.:::::.:::.::.::::.:.-:.::: -.-· 0~~~-~.-.,--.-,-• .-.--• .-.-.-~ .... -.-. •• -..-.. +,,,.,. .... ~------~ 1.0 2.0 3.0 4.0
Key
Yc/Yu=0.5
Yc/Yu=OA
Yc/Yu=0.3
Yc!Yu=0.2
Yc/Yu=0.1
Yc/Yu=O.O
Figure 18 General scour function, w0 /wu = 10
5.0
KF/1Bff.92JLO

Handbook47 Date of issue 4/92
B
"77-.-... ___________ ':fL ...... ---·-· /
?>-r-.--:."777777/? A-A
.... I
D-D
KM/1911-92/LO
Figure 19 Flow around a bend

., -· CO 1: ; 1\) c
en 0 0 1: .... a
"'C -· (!) .... (/)
0 0 ::l (/) -· (/) --· ::l
CO 0 -I»
CO .... 0
(I)
I ~
1: 0 (.) "'C
rf) 0 -0 Q. 1: 3 ::l (/)
"' ~ ~
Example: ~a= 15"
C2 -r---r-
• c1 el®t e!e
I
C1 - = 3, a= 15" Wp => score1 = 1.23
2.0 -11 ~ = 2,(90- a) = 75" Wp
1.8 -
1.6 -
=> score2 = 1.28
=> score = 1.28 ~ 1.3
Key c1 c2 -or-Wp Wp
1.0 - -- 1.5 ---- 2.0 .•••••••••• 5.0
. ••••••. 10.0
---------- ----~' --~~ --1.4 - ~-- --.,- - .... _...-:;.; - .... ,."" - ....
/ - ' LH // ' 0 - ' V,t/' ········· 0--... -- ._
-"~---·········································· ················-·-·-·-·····-·--·-·-···-···-·······-·-·
~ -- -- -- ·- -- -- -- -- ·- -- -· -- -- -- -- -- -- -- -- -- -- -- -- -- -- -- --1.0 ··········-·-···
0 1 0 20 30 40 50 60 70 80 90
Angle of attack, rt.0
:c ~
5. 8' 0 , "" "
:? a; 2. ~· ~
~
~ "'

I
I
Handbook47 Date of issue 4/92
Case(a)
(negative)
Case(b)
/
Key
WP - Pier width
dr - Depth of foundation
® - Position of minimum bed level within an area of the pier with radius 2WP
KF/2111-92/LO
Fig 21 Measurement of foundation depth

Handbook47 Date of issue 4/92
Constriction Long section
Key
Adjustment factor
Depth of foundation
Total depth of scour (local soour + constriction scour)
Pier width
Scour level after large flood
lnfi/1 material between flood and normal flow condition
Measurement position for dr
Plan
Key
wP Pier width
..- - Pier foundation depth to be measured from inside this area
KFI22f1-92/LO
Figure 22 Foundation depth and adjustment factor AF

Handbook47 Date of issue 4/92
19
Priority 1
18
17
Priority 2 16
Priority 3
en 15 .5 ~ Priority 4 >. ·E .g 14
a. Priority 5
13
12
I 11
Priority 6
10
Total scour depth Dt (m)
Key
-4-- df = 0.5 --1!.- df= 1 ___._ df= 2 -m- df = 5 - df = 10
KF/23!1·92/lO
Figure 23 Priority rating graph


I
1
Handbook47 Date of Issue. 4192
APPENDICES

Handbook47
APPENDIX A
Explanation of the method for finding the scour
priority rating.
Scour at a bridge is in general the sum of two
types of scour - general and local. General scour
is a lowering of the bed level during a flood, and
is increased by any constriction in the width of
the river. Local scour is the erosion of the river
bed adjacent to a structure, and is caused by a
complex three dimensional disturbance of the flow
pattern which increases velocities and turbulence
near the bed. The total scour at a bridge will
typically comprise depth of general scour due to
channel constriction caused by abutments and
embankments, plus a depth of local scour at the
base of each pier and abutment. If the total scour
extends to below a certain critical foundation
level, the bridge will be at risk of failure.
Theoretical basis for the scour assessment
procedure
The two types of scour, local and general are the
result of distinctly different hydraulic phenomena.
They depend on different sets of features and are
calculated separately and finally summed.
The following features could affect general or
local scour:
General scour:
Al
Degree of channel constriction
Degree of flood plain
constriction
Length of constriction
Water depth upstream of bridge
Bed material - size, grading,
cohesiveness, solid rock or
discrete particles.

Handbook47
Local scour:
Date of Issue 4!92
Flow velocity upstream of bridge
Plan shape of channe~ in the
neighbourhood of the bridge
Pier - width, length, shape,
alignment with flow,
footing details,
trapped debris,
interaction between
piers within a group
Flow -velocity, depth, flood duration
Bed material - size, grading,
cohesiveness, solid rock or discrete
particles.
The following sections discuss each feature, and
present the theory behind the assessment procedure
in section 7.
Calculation of general scour
Channel constriction and floodplain constriction
(Section 7.3.11
The method is based on formulae recommended by the
US Federal Highways Administration (FHWA, 1991).
The formulae have been simplified slightly. The
method is equivalent to that given in the May 1989
edition of Handbook 47 for channel constriction,
with a revised value of the exponent. In addition,
flood plain constriction is now included in a
quantitative sense.
Length of constriction
The method used for estimating the depth in a
contracted section assumes that the contracted
reach is long, and the flow is uniform. The flow
in a short contracted section may be non-uniform
and affected by turbulence produced at the
A2

Handbook47 Date of ls.sue 4192
contraction. The turbulence is expected to have a
small influence on depth, and it is not feasible in
the present report to include procedures to deal
with it. It has been assumed for the purposes of
the general scour calculation that any contracted
section at a bridge is long, and that the flow is
uniform within the contracted section.
Water depth upstream of the bridge (Section 7.3.1\
The primary equation for general scour enables the
mean depth at the bridge to be calculated as a
function of the degree of constriction and the
upstream depth (see section on 'Degree of channel
constriction')• The mean depth at the bridge Y8
varies in direct proportion with the upstream depth
Yu for a given bridge site.
It is recommended that the upstream depth is
measured directly, but where this is not possible
the equation given in section 7.2.1 may be used.
This equation is based on a number of regime
equations which have been produced for British
rivers (Lewin (1981)).
Bed material size
It has been assumed that during a flood, the shear
stress on the river bed upstream of the bridge will
exceed the critical shear stress of the bed
material, irrespective of the mean size of the bed
material. This may be a conservative assumption,
because if the critical shear stress is not
reached, the general scour in the contracted
section will be lower than predicted. Due to the
difficulties of estimating velocities and critical
shear stresses, it has been decided to assume that
the critical shear stress is exceeded, and that
general scour is independent of bed material size.
A3

Handbook47 Date of~~ 4192
Bed material grading (Section 7.3.7l
Bed material which is widely graded will be more
resistant to scour than material which is uniform,
but with the same mean grain size. During a flood,
the mean grain size of the graded bed material may
increase and its surface may become armoured by the
larger particles, which are more resistant to
scour. If the bed material is uniform, then no
armouring takes place and scour will be more
severe.
Very little data is available to enable an estimate
to be made of the reduction of scour, both general
and local, due to armouring of a graded bed.
Raudkivi (1986) presents results of laboratory
experiments on local scour at piers under both
clear water and live bed conditions. His results
show that local scour of a non-uniform bed may be
considerably less than scour of a uniform bed, but
the reduction is not as large if the critical shear
stress of the bed is exceeded. In the latter case,
a scour depth approximately 70% of the scour depth
in a uniform bed was recorded.
In view of the fact that armouring is a well
accepted phenomenon the results of Raudkivi's study
have been tentatively extended to make some
allowance for a reduction in general scour. A
maximum reduction of 30% has been assumed, for
widely graded bed material.
Bed material cohesiveness <Section 7.7.2)
A cohesive material such as heavy clay is expected
to have a higher resistance to scour than a
noncohesive bed of sand or gravel. The erodibility
of cohesive materials depends not only on the type
of material, but also on factors such as
weathering, the degree of saturation and the
chemical environment. No accurate procedure can
therefore be recommended to allow for cohesive bed
A4

Handbook47 Date of Issue 4192
materials, particularly in the absence of
laboratory testing of the soil, but it. is
recommended that the score for potential scour
severity, which includes both general and local
scour, is reduced by one if the bed is of heavy
clay.
Bed of solid rock (Section 7.7.2)
Bedrock is highly resistant to scour, and if the
bridge is founded on bedrock then it assumed to be
at low risk.
Flow velocity upstream of the bridge
The basic method for calculating general scour
assumes that the bed shear stress upstream of the
bridge is equal to the critical shear stress of the
bed material. For most British rivers in flood,
velocities are high enough to ensure that the
critical shear stress is exceeded. According to
Peterson, as the shear stress increases above the
critical value, general scour in a long contracted
section decreases slightly. The assumption made in
this report that the approach velocity equals the
critical velocity is therefore likely to lead to
slight over-estimation of general scour.
Plan shape of the channel in the neighbourhood of
the bridge (Section 7.3.2)
If the bridge is located on a bend, the abutments
or piers towards the outside of a bend will be
exposed to greater than average scour depths. This
is because at a bend, secondary flows at the bed
develop which carry bed material from the outside
to the inside of the bend. The cross-sectional
shape tends to become approximately triangular if
the bend is severe. The mean depth, however,
remains similar to that in a straight section of
the river. Factors to account for the increase
maximum in depth are given in Charlton & Farraday.
A5

Handbook47 Date of Issue 4192
These figures have been used in the present
guidelines and extended to cases of pi~rs or
abutments on the insides of bends where the depth
will be less than average.
The factors include a small allowance for the fact
that even in straight reaches the channel shape
tends to be non-rectangular, and the maximum depth
will therefore exceed the mean depth.
Calculation of local scour
Many formulae are available for predicting local
scour at piers. Local scour at a cylindrical pier
in a bed of uniform material can be calculated as a
function of the geometry of the pier and properties
of the flow, but published formulae do not in
general agree on the significant variables. For
example, Laursen & Toch (1956) find that, to a
first approximation, local scour depends only on
the geometry, whereas the equations given by Shen
et al (1969) show scour to depend on the approach
flow velocity and pier width. Neill recommends
that the basic local scour depth is directly
proportional to the pier width only, and that the
factor of proportionality is increased if the depth
of flow exceeds a certain value. Depth of flow
appears in the basic equation for scour in several
methods. It is apparent that no one equation can
be completely satisfactory even for the basic case
of scour of a uniform bed around a cylindrical
pier.
Our approach has instead been to use published
results to establish how each of the significant
features affects local scour, having started from a
basic scour depth which is proportional to the pier
width. The following sections describe how the
basic scour depth and modification factors were
derived.
A6

Handbook47 Date of Issue 4192
Pier width (Section 7.2.41
Neill suggests that for a pier with a circular nose
aligned parallel to the flow, an allowance of d1 = 1.5 wP is made for local scour, where
d 1 = depth of local scour
wP = pier width
If the flow depth is greater then (5 wp) than the
coefficient should be increased to 2.2.
In other studies on local scour, (e.g. Chiew &
Melville (1987), Raudkivi (1986)) the scour depth
is non-dimensionalised with pier width, and the
time averaged scour depth under live bed conditions
is found to lie between 1.4 wP and 2.3 wP
depending on the bed material and the flow
velocity.
Dargahi (1982) presents five sets of flume data and
one field measurement, and for all the data, d1 ~
1.8 Dargahi also compares the relationship between
predicted scour depth and pier width for seven
methods, and all except two predicted that d 1 ~ 2
wP for all flow depths.
Taking these results into account, a basic equation
of
has been adopted for this report. It is assumed
that an abutment which has a width w, in the main
channel has the same scour characteristics as a
pier with effective width w. = 2 w,. This
approximation has been made by assuming the
symmetrical flow about the longitudinal axis of a
pier. It is expected that this procedure is
conservative in that it is likely to over-predict
the scour at an abutment.
A7

Handbook47 Date of lssw. 4192
The above equation gives the scour of a circular
pier in deep water, in a cohesionless ~niform bed,
with the approach velocity equal to the critical
velocity for the bed material. The effects of
deviations from these conditions are discussed
below.
Depth of flow (Section 7.5.2)
If the water depth (before local scour) is shallow
relative to the pier width, local scour will be
less than predicted by the above equation. Factors
to account for this reduction in local scour are
based on laboratory results given by Chiew &
Melville (1987) and May and Willoughby (1990).
Pier length
The length of a pier is of secondary importance for
local scour, provided that the pier is well aligned
with the approach flow. (See section on Angle of
attack in this appendix).
Pier shape (Section 7.3.6)
The plan shape of the upstream nose of a pier has a
small effect on local scour. The basic equation
for depth of scour assumes that the pier has a
semi-circular nose. A square nose will result in
slightly greater scour and an elongated nose will
cause less scour. The factors used in this report
are based on those published by Laursen & Toch
(1956) and adopted by Charlton & Farraday.
If a pier is not well aligned with the approach
flow, no allowance should be made for pier nose
shape, as its effect is small in comparison with
the effects of pier alignment.
Alignment of pier with approach flow (Section
7.3.5)
AB
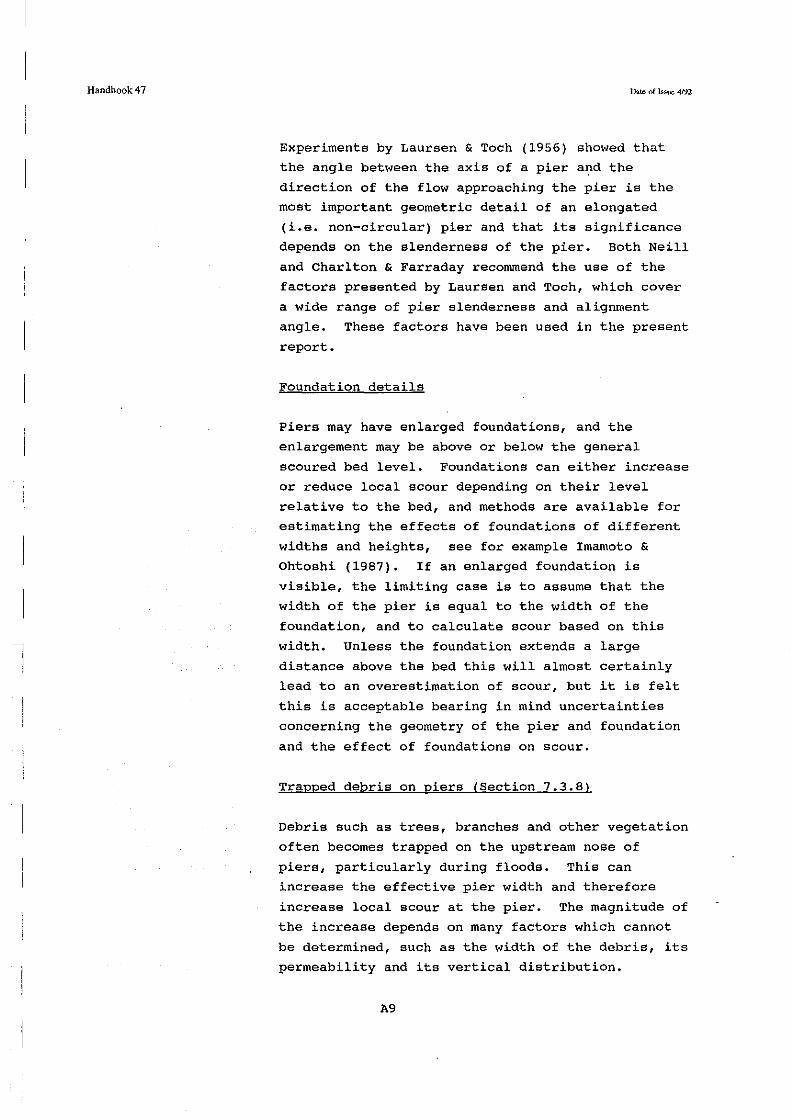
Handbook47 Date of Issue 4192
Experiments by Laursen & Toch (1956) showed that
the angle between the axis of a pier and the
direction of the flow approaching the pier is the
most important geometric detail of an elongated
(i.e. non-circular} pier and that its significance
depends on the slenderness of the pier. Both Neill
and Charlton & Farraday recommend the use of the
factors presented by Laursen and Toch, which cover
a wide range of pier slenderness and alignment
angle. These factors have been used in the present
report.
Foundation details
Piers may have enlarged foundations, and the
enlargement may be above or below the general
scoured bed level. Foundations can either increase
or reduce local scour depending on their level
relative to the bed, and methods are available for
estimating the effects of foundations of different
widths and heights, see for example Imamoto & Ohtoshi (1987). If an enlarged foundation is
visible, the limiting case is to assume that the
width of the pier is equal to the width of the
foundation, and to calculate scour based on this
width. Unless the foundation extends a large
distance above the bed this will almost certainly
lead to an overestimation of scour, but it is felt
this is acceptable bearing in mind uncertainties
concerning the geometry of the pier and foundation
and the effect of foundations on scour.
Trapped debris on piers (Section 7.3.8)
Debris such as trees, branches and other vegetation
often becomes trapped on the upstream nose of
piers, particularly during floods. This can
increase the effective pier width and therefore
increase local scour at the pier. The magnitude of
the increase depends on many factors which cannot
be determined, such as the width of the debris, its
permeability and its vertical distribution.
A9
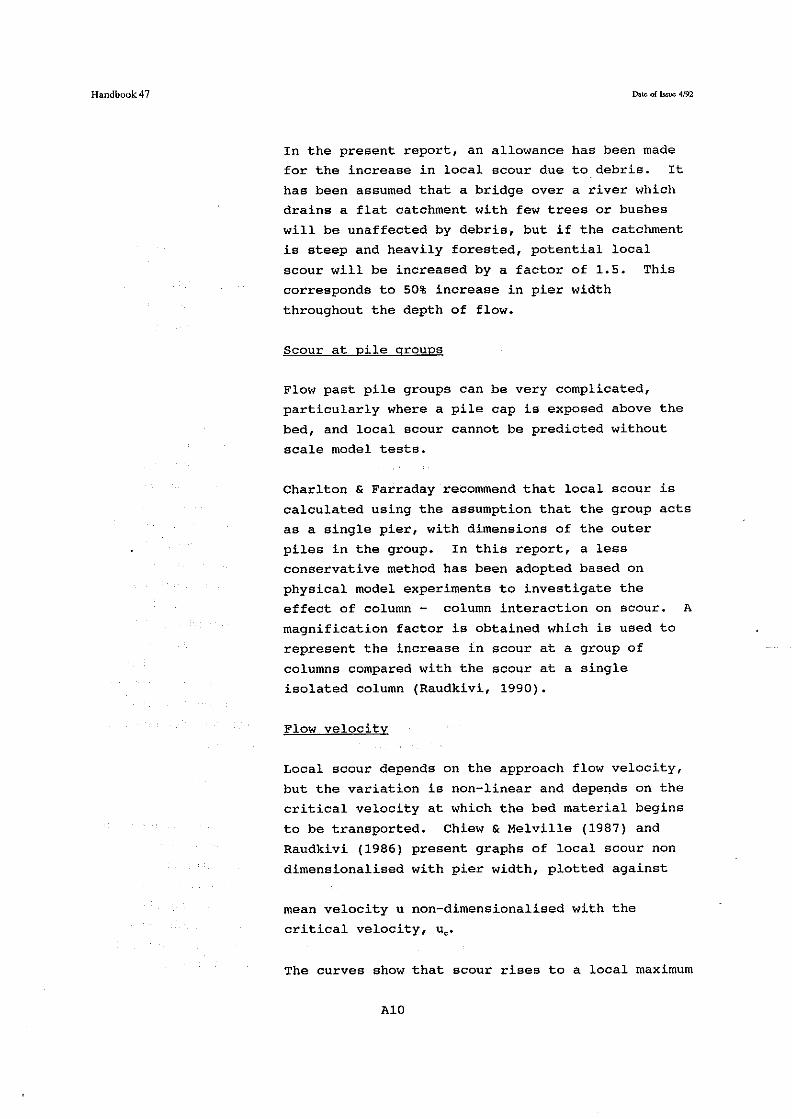
Handbook47 Date of L<sue 4f92
In the present report, an allowance has been made
for the increase in local scour due to debris. It
has been assumed that a bridge over a river which
drains a flat catchment with few trees or bushes
will be unaffected by debris, but if the catchment
is steep and heavily forested, potential local
scour will be increased by a factor of 1.5. This
corresponds to 50% increase in pier width
throughout the depth of flow.
Scour at pile groups
Flow past pile groups can be very complicated,
particularly where a pile cap is exposed above the
bed, and local scour cannot be predicted without
scale model tests.
Charlton & Farraday recommend that local scour is
calculated using the assumption that the group acts
as a single pier, with dimensions of the outer
piles in the group. In this report, a less
conservative method has been adopted based on
physical model experiments to investigate the
effect of column - column interaction on scour. A
magnification factor is obtained which is used to
represent the increase in scour at a group of
columns compared with the scour at a single
isolated column (Raudkivi, 1990).
Flow velocity
Local scour depends on the approach flow velocity,
but the variation is non-linear and depe~ds on the
critical velocity at which the bed material begins
to be transported. Chiew & Melville (1987) and
Raudkivi (1986) present graphs of local scour non
dimensionalised with pier width, plotted against
mean velocity u non-dimensionalised with the
critical velocity, uc.
The curves show that scour rises to a local maximum
AlO

Handbook47
at u = u,, and then falls slightly at higher
velocities.
Date. of Issue 4!92
As the velocity increases further, scour gradually
increases to another local maximum. It is expected
that during floods, the velocity will exceed the
critical velocity, and the curves show that
variation in local scour at this·stage is small
over a wide range of velocity, from u = U 0 to u =
4uc and above ..
This report does not include recommendations for
calculating flow velocities, and it has been
assumed that local scour is independant of
velocity.
Flood duration
Very little research has been carried out into
rates of scour, and almost all experiments on local
scour have been concerned only with the maximum
equilibrium scour. This is the depth of scour
which is approached if steady conditions are
imposed for a long period of time.
Due to the lack of any general method for
predicting rates of scour, and in order to avoid
the complication of deriving design flow
hydrographs for each site, the conservative
approach has been adopted of assuming that a flood
has a sufficient duration to cause the maximum
(i.e. equilibrium) local scour.
Bed material size
If the bed material is fine enough to be
transported during a flood, the size of the bed
material has no significant effect on local scour,
provided that the grain size is small relative to
the pier width. Laursen and Toch (1956) gives a
physical explanation for this, and experimental
model results are presented in Chiew & Melville
All
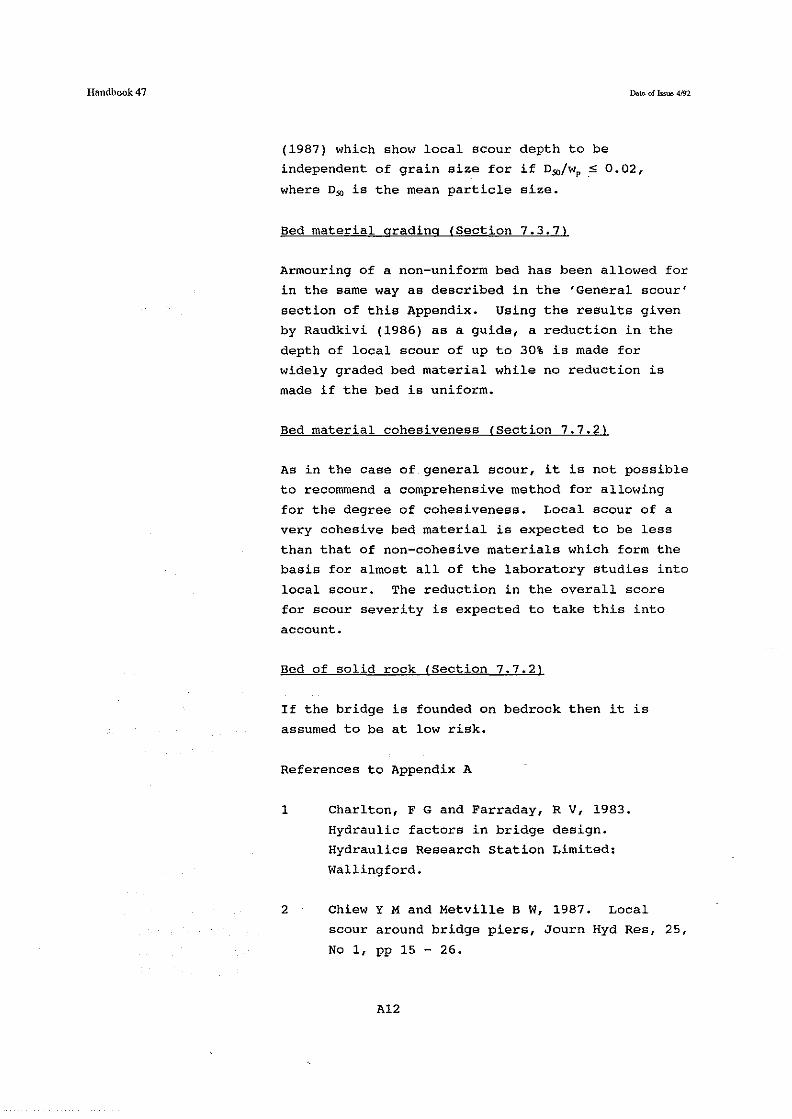
Handbook47 Date of hsu:.:. 4192
(1987) which show local scour depth to be
independent of grain size for if 0~/wp ~ 0.02,
where o~ is the mean particle size.
Bed material grading (Section 7.3.7)
Armouring of a non-uniform bed has been allowed for
in the same way as described in the 'General scour'
section of this Appendix. Using the results given
by Raudkivi (1986) as a guide, a reduction in the
depth of local scour of up to 30% is made for
widely graded bed material while no reduction is
made if the bed is uniform.
Bed material cohesiveness (Section 7.7.2>
As in the case of general scour, it is not possible
to recommend a comprehensive method for allowing
for the degree of cohesiveness. Local scour of a
very cohesive bed material is expected to be less
than that of non-cohesive materials which form the
basis for almost all of the laboratory studies into
local scour. The reduction in the overall score
for scour severity is expected to take this into
account.
Bed of solid rock !Section 7.7.2)
If the bridge is founded on bedrock then it is
assumed to be at low risk.
References to Appendix A
1 Charlton, F G and Farraday, RV, 1983.
Hydraulic factors in bridge design.
Hydraulics Research station Limited:
Wallingford.
2 Chiew Y M and Metville B W, 1987. Local
scour around bridge piers, Journ Hyd Res, 25,
No 1, pp 15 - 26.
A12
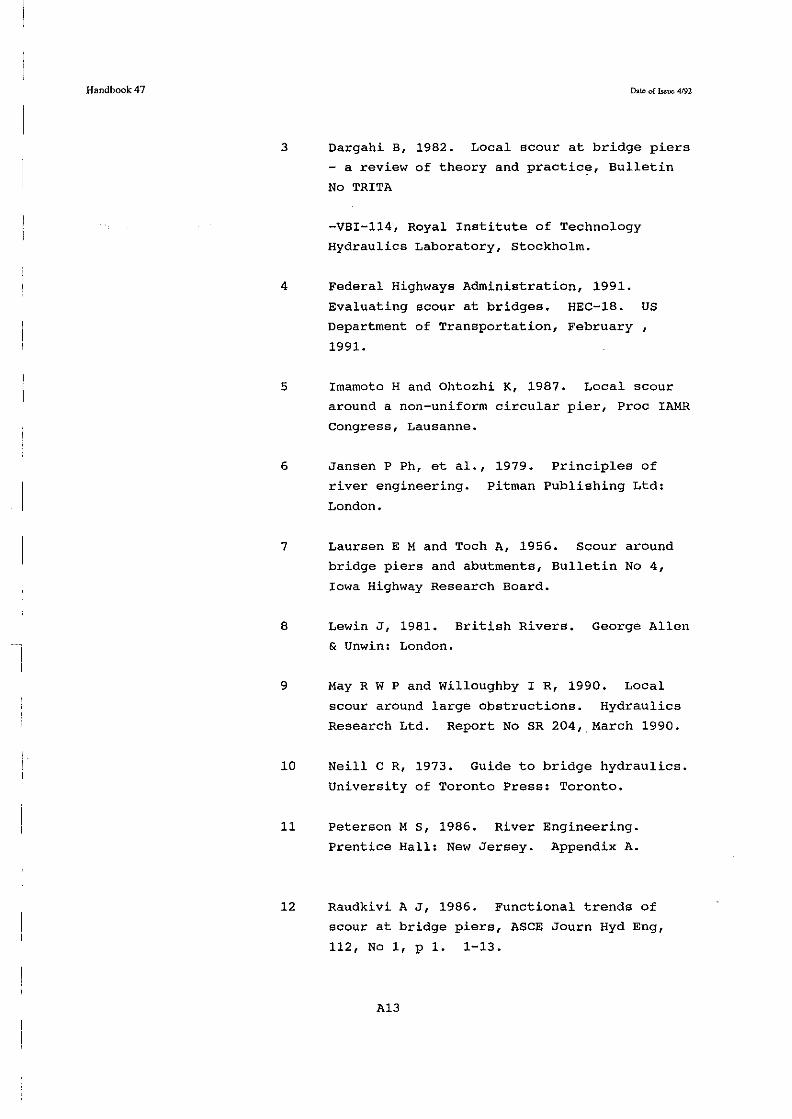
Handbook47
I
3 Dargahi B, 1982. Local scour at bridge piers
- a review of theory and practic~, Bulletin
No TRITA
-VBI-114, Royal Institute of Technology
Hydraulics Laboratory, Stockholm.
4 Federal Highways Administration, 1991.
Evaluating scour at bridges. HEC-18. US
Department of Transportation, February ,
1991.
5 Imamoto Hand Ohtozhi K, 1987. Local scour
around a non-uniform circular pier, Proc IAMR
Congress, Lausanne.
6 Jansen P Ph, et al., 1979. Principles of
river engineering. Pitman Publishing Ltd:
London.
7 Laursen E M and Toch A, 1956. Scour around
bridge piers and abutments, Bulletin No 4,
Iowa Highway Research Board.
8 Lewin J, 1981. British Rivers. George Allen
& Unwin: London.
9 May R W P and Willoughby I R, 1990. Local
scour around large obstructions. Hydraulics
Research Ltd. Report No SR 204,.March 1990.
10 Neill c R, 1973. Guide to bridge hydraulics.
University of Toronto Press: Toronto.
11 Peterson M s, 1986. River Engineering.
Prentice Hall: New Jersey. Appendix A.
12 Raudkivi A J, 1986. Functional trends of
scour at bridge piers, ASCE Journ Hyd Eng,
112, No 1, p 1. 1-13.
Al3

Handbook47
13 Raudkivi A J, 1990. Loose boundary
hydraulics. Pergamon Press.
14 Shen H Wet al., 1969. Local scour around
bridge piers, Proc ASCE Journ Hyd Div, 95, No
HYG.
Al4

Handbook47
APPENDIX B
Explanation of the scheme for combining features to
assess scour
The basic method for calculating scour is to find
estimates for the general scour and local scour and
then add the two together. General scour is found
by estimating the upstream bank full channel depth
and applying factors to this depth to account for
channel and flood plain constriction, the presence
of bends, and bed material grading. Local scour is
estimated by multiplying the pier width by factors
to account for angle of attack and pier thinness,
pier nose shape, column - column interaction, bed
material grading and the effect of trapped debris.
The bases for inclusion of these features and for
selection of suitable values for the factors are
discussed in Appendix A. Section 7.3 of the report
provides the method for assessing each feature and
for assigning a score of 1 to 7. The scores have
been chosen so that factors can be calculated from
scores using appropriate linear formulae. These
formulae are presented in the 'calculation' columns
in Tables 1 and 2 in section 7.5.1. The tables are
arranged so that factors for general scour are
placed in Table 1 and factors for local scour are
placed in Table 2.
A relative depth of general scour resulting from
channel and flood plain constriction, dg1/Yu is
calculated, and adjusted to take account of bends
and bed material grading. The resulting value d,
is assumed to represent general scour.
The depth of local scour below bed level is given
by
Where w. is the pier width and the factor of 1.5
is obtained from the basic scour equation.
Bl
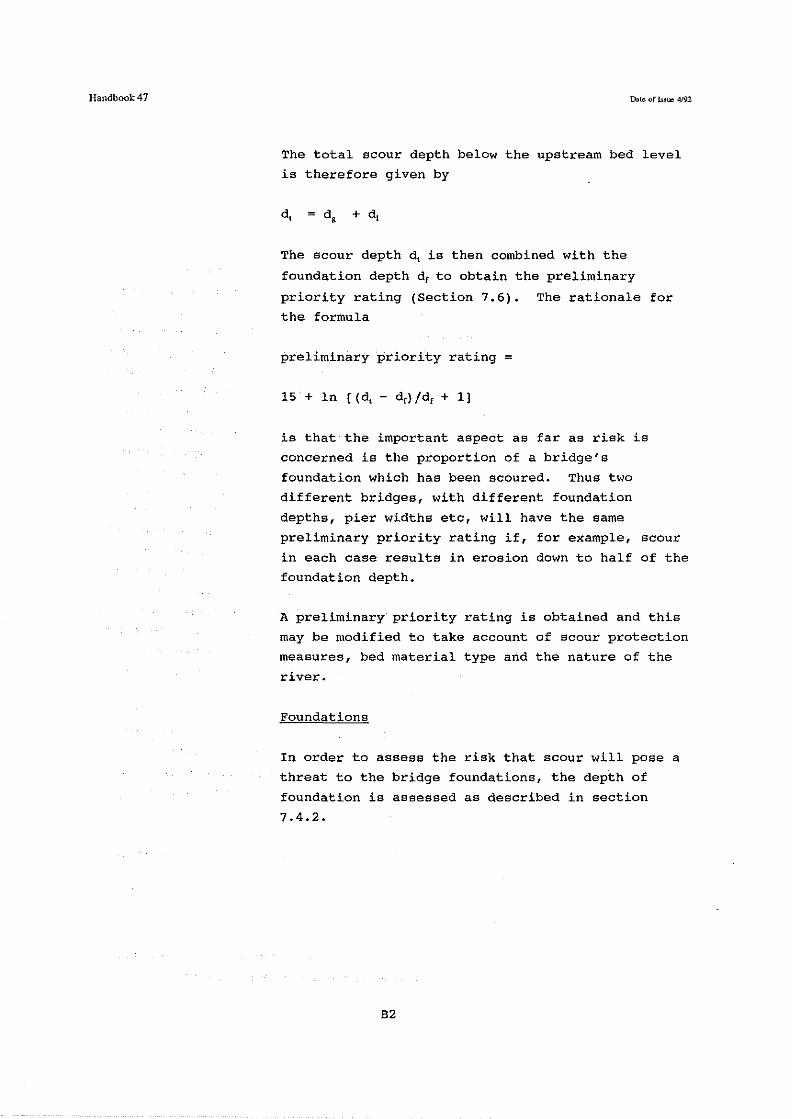
Handbook47 Date <>f Issue 4192
The total scour depth below the upstream bed level
is therefore given by
The scour depth d, is then combined with the
foundation depth dr to obtain the preliminary
priority rating (Section 7.6). The rationale for
the formula
preliminary priority rating =
15 + ln [(d,- dr)/dr + 1]
is that the important aspect as far as risk is
concerned is the proportion of a bridge's
foundation which has been scoured. Thus two
different bridges, with different foundation
depths, pier widths etc, will have the same
preliminary priority rating if, for example, scour
in each case results in erosion down to half of the
foundation depth.
A preliminary priority rating is obtained and this
may be modified to take account of scour protection
measures, bed material type and the nature of the
river.
Foundations
In order to assess the risk that scour will pose a
threat to the bridge foundations, the depth of
foundation is assessed as described in section
7.4.2.
B2

Handbook47
APPENDIX C
Explanation of the method for the assessment of
catchment characteristics
In section 6.3, patchment characteristics are used
to assess the severity of an extreme flood peak.
The Flood Studies Report (FSR) (NERC 1975) contains
a detailed analysis of flood records for UK rivers.
Methods are recommended for determining flow
duration reduction curves and region curves for any
catchment. The former are indicators of the
flashiness of a catchment, while the latter relate
floods with a given return period to the mean
annual flood.
The statistical analysis carried out by NERC showed
that the flow duration reduction curve relating
floods of a given duration to the mean annual
maximum calendar day flood can be defined for a
catchment as a function of channel slope only. The
slope of the channel is defined as the mean channel
slope from 10% to 85% of the main channel length
measured upstream from the site. The function of
slope given in the FSR is used as the basis of the
scoring system used in section 6.3.1.
Reference to Appendix C
NERC. 1975. Flood studies report, London NERC.
Cl


Handbook47 Date. of lssuo 4!92
APPENDIX D


l
Handbook 47 [},.te of l<sw 4/92
HYDROGRAPHIC SURVEY Calculation Sheet (1 of 4)
BRIDGE No. STATION :
I DETAILS
Type of Stream
Bank stability
MILEAGE:
Distance : River source to Bridge L = ..... km
85% Distance upstream : X = 0.85 L X = ..... o.s. Contour line : a a = .....
10% Distance upstream : y = 0.1 L y = ..... o.s. Contour line : b b = .....
Slope (m/km) = (a-b) = (. .... - ..... ) (x-y) ( ..... - ..... )
= ..... m/km
Flashiness
River type :
Tr = (St+Bs+Fs) 17
- 1.12
= ( ••••• + ••••• + •.... ) 17
- 1.12
Main dimensions
Channel width : Wu = ..... Channel depth : Yu = ..... Channel width under bridge : wb = ..... Channel depth under bridge : yb = ..... Floodplain width : WO = ..... Flood plain flow depth : Yo = ..... Pier width : wP = ..... Pier length : LP = .....
Column - Column distance, if appropriate : c, = ..... ~ = .....
ELR:
11 SCORE
St = ..... Bs = .....
km m
km m
Fs = .....
Tr = .....
m m
m m
m m
m m
m m
I

Handbook 47
HYDROGRAPHIC SURVEY
BRIDGE No. STATION :
DETAILS
Size ratios
Wu/Wb Y0 /Yu w.fwu
= ..... = ..... = ......
Scour due to Bends
Pier thinness . Angle of attack
= =
Dale of Js.s~>:o 4f92
Calculation Sheet (2 of 4)
MILEAGE: ELR:
I SCORE
From figs 15 - 18: d.fYu =
Sb = ..... Lp/Wp = ..... a = ..... 0
Angle of Attack and Pier Thinness
A a = ..... Group of columns Gc = ..... Pier I Abutment Nose Shape Ns = ..... Bed Material Grading Bm = ..... Blockage due to Debris Bd = ..... Adjustment factor AF = ..... Foundation Depth dr = .....
Table I
Description Res. s Calculation Res.
Scour due to Bends Sb= ..... 0.25 X s + 0.25 . .... B
Bed Material Grading Bm= . . . . . 0.05 X s + 0.65 ..... BMG
d,, (Section7.3.1) = ..... d,, + 1.0 = ..... (dgl + 1.0) * B * BMG = ..... [ (d,, + 1.0) * B * BMG] - BMG = d,/Yu = ..... Multiply by Yu to give general scour dg = .....
I
..

Handbook47
HYDROGRAPHIC SURVEY
BRIDGE No, STATION I
General scoured depth:
y = m Yu + dg :
Relative flow depth ym
Relative flow depth score Rf
Table II
Description
Relative Flow Depth
y = m
I wP
Rf
Ang of Attack, Pier Thckns A a
Group of columns Gc
Pier/Abutment Nose Shape Ns
Bed Material Grading Bm
Trapped Debris Bd
D~~ of Is$~ 4!92
Calculation Sheet (3 of 4)
MILEAGE: ELRI
..... = .....
Rf = .....
Score s Calculation Result
= ..... 0.11 X s + 0.23 . .... = ..... 1.0 X s . ....
= . . . . . 1.0 X s ..... = ..... 0.1 X s + 0.6 = . ....
= . . . . . 0.05 X s + 0,65 ..... = . . . . . 0.08 X s + 0.92 .....
Product FL ..... =
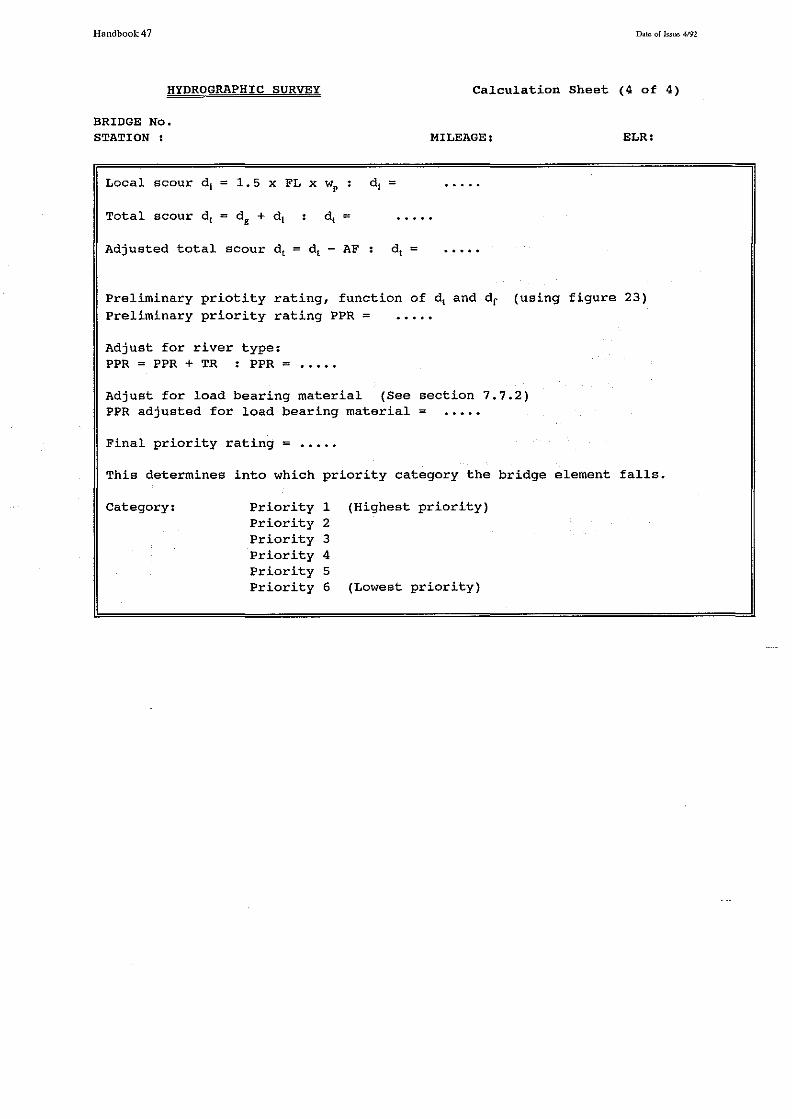
Handbook47
HYDROGRAPHIC SURVEY Calculation Sheet (4 of 4)
BRIDGE No. STATION I
Local scour d1 = 1. 5 x FL x wP : d1 =
Adjusted total scour d 1 = d 1 - AF d1 =
MILEAGE: ELR:
Preliminary priotity rating, function of ~ and dr (using figure 23) Preliminary priority rating PPR =
Adjust for river type: PPR = PPR + TR I PPR =
Adjust for load bearing material (See section 7.7.2) PPR adjusted for load bearing material
Final priority rating =
This determines into which priority category the bridge element falls.
Category: Priority 1 (Highest priority) Priority 2 Priority 3 Priority 4 Priority 5 Priority 6 (Lowest priority)

Handbook47
BRIDGE No. STATION I
River
River
River
River
River
Bridge
Bridge
Bridge
Bridge
Bridge
Bridge
Bridge
CATEGORY
(1)
(2)
( 3)
( 4)
(5)
(1)
( 2)
(3)
(4)
( 5)
(6)
(7)
Dilte of lssm 4f92
HYDROGRAPHIC SURVEY HANDBOOK 47 (section 8)
MILEAGE:
2 ELEMENT - ABUTMENT < 20% FROM CHANNEL
A B c D
------
---------
--- ---
---
--- ------ ------ ---
--- ---

Handbook47
BRIDGE No. STATION:
CATEGORY 2
River (1)
River (2)
River (3)
Bridge (1)
Bridge (2)
Bridge (3)
Bridge (4)
Dato of Issue 4192
HYDROGRAPHIC SURVEY HANDBOOK 47 (section 8)
MILEAGE:
ELEMENT - ABUTMENTS > 20% FROM CHANNEL
A B c
---

Handbook47
BRIDGE No, STATION:
River
River
River
River
Bridge
Bridge
Bridge
Bridge
Bridge
o .. w of Issue 4/92
HYDROGRAPHIC SURVEY HANDBOOK 47 (section 8)
MILEAGE:
CATEGORY 2 ELEMENT - FLOOD RELIEF ARCH
A B c
(1)
(2)
(3)
( 4)
(1)
(2)
(3)
(4)
(5) ---


Handbook 47 D-ate of ls.sue 4192
APPENDIX E

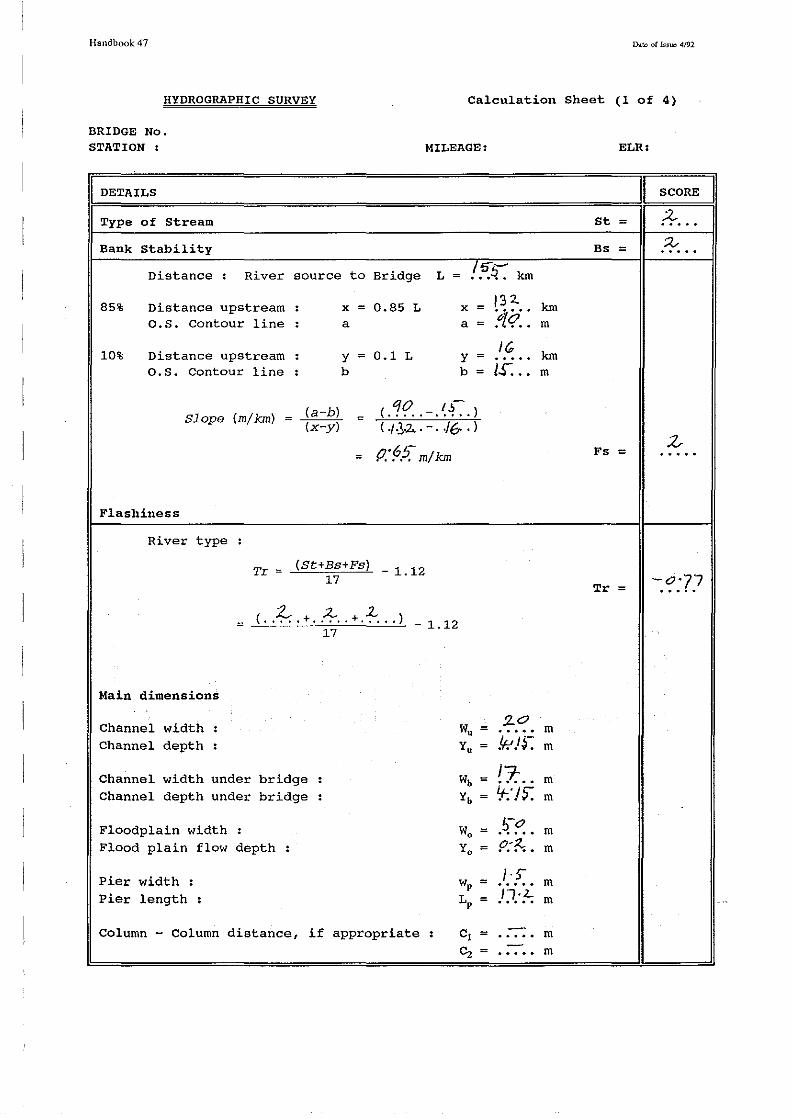
Handbook 47 n ... tc of Is.s~r.o 4/92
HYDROGRAPHIC SURVEY Calculation Sheet (1 of 4)
BRIDGE No. STATION :
DETAILS
Type of Stream
Bank Stability
MILEAGE:
Distance : River source to Bridge L = !.OS:S:: km
85% Distance upstream : X = 0.85 L X = 13 2.
o.s. Contour line : a a = :4.l?:: 10% Distance upstream 0.1 L
16 : y = y =
o.s. Contour line : b b = IS: ..
Slope (m/km) = (a-b) = < .1?. . -. ~ L > (X y) ( .f.],;2,_ . . . J(r . )
= o·G!J ....• m/km
Flashiness
River type :
Tr = (St+Bs+Fs) 17
- 1.12
z_ .Z.. L = (. .... + ..... + ..... ) - 1.12
l7
Main dimensions
Channel width : w. = :LO
Channel depth : Yu = .If! Jr. Channel width under bridge : wb = !7:-.. Channel depth under bridge : yb = 't-.' j ~
Floodplain width : WO = .~-~. Flood plain flow depth : Yo = P:&.
Pier width : Wp = /·) ..... Pier length : LP = }~:!-;
Column - Column distance, if appropriate cl = -: ..... Cz = -.....
ELRI
I SCORE
St = 2-
Bs = ;:z,. .....
km m
km m
Fs z = .....
Tr = -.c::?!
m
m
m m
m m
m
m
m m
I

Handbook 47
HYDROGRAPHIC SURVEY
BRIDGE No. STATION :
I DETAILS
Size ratios
Wu/Wb Yo/Yu Wo/Wu
= 1·/'i?
= .C!:i!!? = ;J.;::j!J
Scour due to Bends
Pier thinness Angle of attack
= =
Ca~cu~ation Sheet (2 of 4)
MILEAGE: ELRI
11 SCORE
From figs 15 - 18: dg/Yu
= 0·/ ;z_
Sb = . tf ... Lp/Wp = . !J •.. a = . .lv . . 0
Angle of Attack and Pier Thinness
A a = 2-0 •• 4 ••
Group of columns Gc = . L .. Pier I Abutment Nose Shape Ns = . :-? .. Bed Materia~ Grading Bm = .~ .. B~ockage due to Debris Bd = . 7 ... Adjustment factor AF = .0. . ..
Foundation Depth dr = ~.!':'-
Tab~e I
Description Res. s Calculation Res.
Scour due to Bends Sb= . /f .. 0.25 X s + 0.25 t·?;? . ·s
Bed Material Grading Bm= . s::. 0.05 X s + 0.65 f:· :f.C?. BMG
dgl (Section7.3.1) = .t!:?.o
dgl + 1.0 = 1::?.<?
(dgl + 1.0) * B * BMG = ! :f: 9.
[ (dgl + 1.0) * B * BMGJ - BMG = dg/Yu = . C:.'?.1
Multiply by Y0 to give general scour d. = 3'-t G
I
..
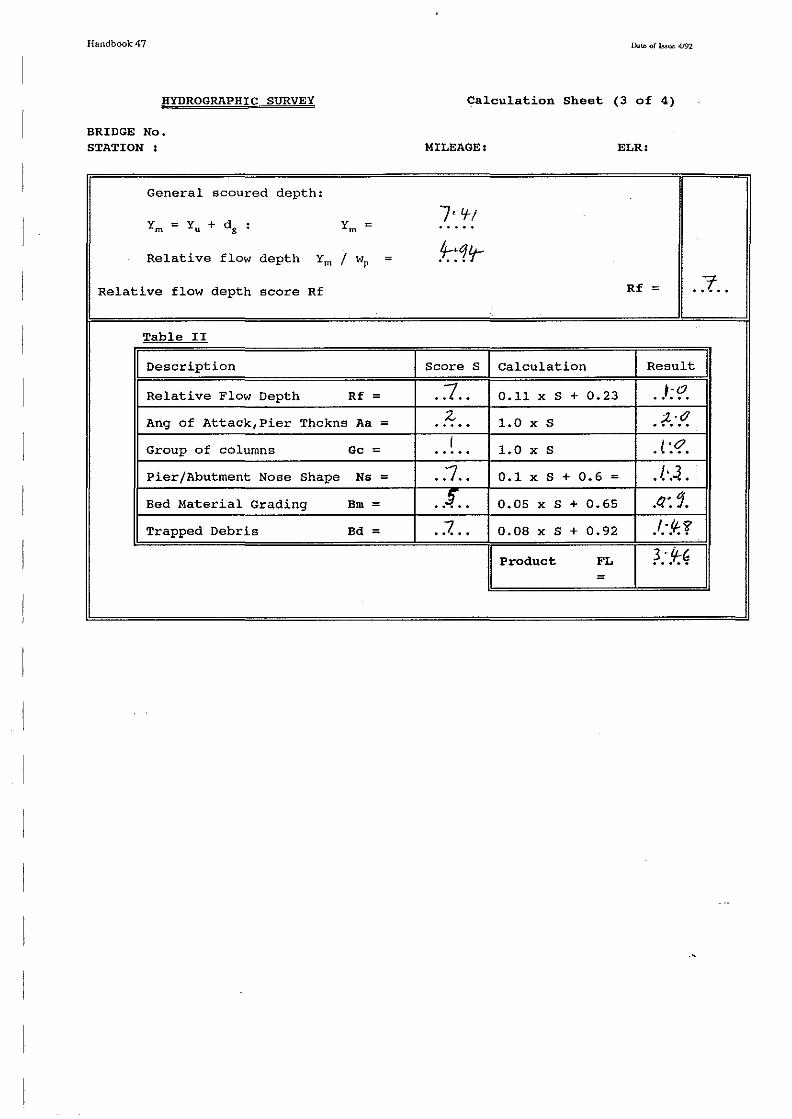
Handbook47
HYDROGRAPHIC SURVEY
BRIDGE No. STATION I
General scoured depth:
Ym = Yu + dg :
Relative flow depth Ym
Relative flow depth score Rf
Table II
Description
Relative Flow Depth
y = m
I wP =
Rf = Ang of Attack,Pier Thckns Aa = Group of columns Gc =
Pier/Abutment Nose Shape Ns = Bed Material Grading Bm = Trapped Debris Bd =
r> .. t.:. of w~ 4192
Calculation Sheet (3 of 4)
MILEAGE: ELR:
7· '+! .....
.4:~1'1-Rf = . x ..
Score s Calculation Result
. 7 .. 0.11 X s + 0.23 . .I: if'. z 1.0 X s • :!-:.11. I 1.0 ..... X s . ( : <?.
. . 1 .. 0.1 X s + 0.6 = J.~ .
.. ~ .. 0.05 X s + 0.65 .o.: 5.
.. 7. .• 0.08 X s + 0.92 .l:.lf-.V Product FL ~ ... ~~
=

Handbook47 lhte of km> 4f9l
HYDROGRAPHIC SURVEY Calculat~on Sheet (4 of 4)
BRIDGE No. STATION I
Local scour d1 = 1. 5 x FL x wP : d1
Total scour dt
Adjusted total scour d, = d, - AF
MILEAGE: ELR:
7.-:?1
.IU.
.I!:!.
Preliminary priotity rating, function of ~ and dr (using figure 23) Preliminary priority rating PPR = .l/l•. 7
Adjust for river type: PPR = PPR + TR : PPR = • f f:·.tf
Adjust for load bearing material (See section 7.7.2) PPR adjusted for load bearing material = ).5,·.1
Final priority rating = .Jfi.:.Cf
This determines into which priority category the bridge element falls.
Category: Priority 1 (Highest priority) Priority 2 Priority & ......-Priority 4 Priority 5 Priority 6 (Lowest priority)

Handbook 47
BRIDGE No. STATION:
River
River
River
River
River
Bridge
Bridge
Bridge
Bridge
Bridge
Bridge
Bridge
(1)
(2)
(3)
(4)
(5)
( 1)
(2)
(3)
(4)
(5)
(6)
(7)
HYDROGRAPHIC SURVEY
MILEAGE:
CATEGORY 2 ELEMENT - ABUTMENT < 20%
A B
v-v v
/ ../
../
v ,__/""
..._/
..._/'
\./
Date of Issue 4192
HANDBOOK 47 (section 8)
FROM CHANNEL
c D
------
---v- ---
---
--- ---
---
--- ---
--- ------ ------ ---

Handbook47
BRIDGE No. STATION:
CATEGORY 2
River ( 1)
River (2)
River (3)
Bridge (1)
Bridge (2)
Bridge (3)
Bridge (4)
O.!c of ls.s~ 4!92
HYDROGRAPHIC SURVEY HANDBOOK 47 (section 8)
MILEAGE:
ELEMENT - ABUTMENTS > 20% FROM CHANNEL
A B c
~
......----
~
~
~
v-~ ---

Handbook47
BRIDGE No. STATION:
River
River
River
River
Bridge
Bridge
Bridge
Bridge
Bridge
HYDROGRAPHIC SURVEY HANDBOOK 47 (section 8)
MILEAGE:
CATEGORY 2 ELEMENT - FLOOD RELIEF ARCH
A B c
(1) ../
(2) ../
(3) / (4) ~
(1) ~
(2) L/
(3) ,_/"
(4)
( 5) / ---