Embed Size (px)
Citation preview

i
A STUDY ON RISK ASSESSMENT OF SCOUR VULNERABLE BRIDGES
A THESIS SUBMITTED TO
THE GRADUATE SCHOOL OF NATURAL AND APPLIED SCIENCES
OF
MIDDLE EAST TECHNICAL UNIVERSITY
BY
MERĠÇ APAYDIN
IN PARTIAL FULFILLMENT OF THE REQUIREMENTS
FOR
THE DEGREE OF MASTER OF SCIENCE
IN
CIVIL ENGINEERING
SEPTEMBER 2010

ii
Approval of the thesis:
A STUDY ON RISK ASSESSMENT OF SCOUR VULNERABLE BRIDGES
submitted by MERİÇ APAYDIN in partial fulfillment of the requirements for the
degree of Master of Science in Civil Engineering Department, Middle East
Technical University by,
Prof. Dr. Canan Özgen
Dean, Graduate School of Natural and Applied Sciences ____________
Prof. Dr. Güney Özcebe
Head of Department, Civil Engineering ____________
Prof. Dr. A. Melih Yanmaz
Supervisor, Civil Engineering Dept., METU ____________
Examining Committee Members
Asst. Prof. Dr. ġahnaz Tiğrek
Civil Engineering Dept., METU ____________
Prof. Dr. A. Melih Yanmaz
Supervisor, Civil Engineering Dept., METU ____________
Asst. Prof. Dr. Alp Caner
Civil Engineering Dept., METU ____________
Asst. Prof. Dr. Elçin Kentel
Civil Engineering Dept., METU ____________
Özgür Çiçekdağ, M.Sc.
Civil Engineer, DOLSAR ____________
Date: 7 September 2010

iii
I hereby declare that all information in this document has been obtained and
presented in accordance with academic rules and ethical conduct. I also declare
that, as required by these rules and conduct, I have fully cited and referenced
all material and results that are not original to this work.
Name, Last name: Meriç APAYDIN
Signature :

iv
ABSTRACT
A STUDY ON RISK ASSESSMENT OF SCOUR VULNERABLE BRIDGES
Apaydın, Meriç
M.Sc., Department of Civil Engineering
Supervisor: Prof. Dr. A. Melih Yanmaz
September 2010, 84 pages
Many river bridges fail or are seriously damaged due to excessive local scouring
around piers and abutments. To protect a bridge from scour-induced failure, it should
be designed properly against excessive scouring and its scour criticality should be
checked regularly throughout the service life to take prompt action. The Federal
Highway Administration of United States (FHWA) developed a program, HYRISK,
as a basis for evaluation of existing scour failure risk of a bridge. It provides
implementation of a risk-based model, which is used to calculate the annual risk of
scour failure of a bridge or series of bridges in monetary values. A case study is
carried out for a bridge crossing Fol Creek in Black Sea Region (close to
Vakfıkebir), for the illustration of this software. Besides, hydraulic analysis and
scour depth computations of the bridge are carried out via HEC-RAS program. Also,
a study is carried out to recommend scour countermeasures that can be applied to the
aforementioned bridge.
Keywords: Risk assessment, local scour, bridge piers, abutments, scour
countermeasures, HYRISK, HEC-RAS

v
ÖZ
OYULMA EĞĠLĠMLĠ KÖPRÜLERDE RĠSK DEĞERLENDĠRMESĠ ÜZERĠNE
BĠR ÇALIġMA
Apaydın, Meriç
Yüksek Lisans, ĠnĢaat Mühendisliği Bölümü
Tez Yöneticisi: Prof. Dr. A. Melih Yanmaz
Eylül 2010, 84 sayfa
Çok sayıda nehir köprüsü orta ve kenar ayaklar etrafındaki aĢırı yerel oyulmalar
nedeniyle yıkılmakta veya ciddi hasar görmektedir. Bir köprüyü oyulma nedenli
yıkılmaya karĢı korumak için köprü oyulmaya karĢı uygun tasarlanmalı; sonra
gerekli korumaları yapabilmek için köprünün oyulma kritikliği servis ömrü
içerisinde düzenli olarak kontrol edilmelidir. Bir köprünün mevcut oyulma riskini
değerlendirmede bir temel oluĢturması amacıyla Amerika BirleĢik Devletleri,
Federal Karayolu Ġdaresi (FHWA) HYRISK yazılımını geliĢtirmiĢtir. Bu yazılım, bir
veya bir dizi köprünün oyulma nedeniyle yıllık yıkılma riskini parasal olarak
hesaplamakta kullanılan risk tahmin modelinin uygulanmasını sağlamaktadır. Risk
tahmin modeli ve HYRISK yazılımının gösterimi için, Karadeniz Bölgesi’ndeki
(Vakfıkebir civarı) Fol Deresi üzerinde bulunan mevcut bir köprü ile örnek
uygulama yapılmıĢtır. Ayrıca, bu köprünün hidrolik analizi ve oyulma derinliği
hesapları HEC-RAS yazılımı ile gerçekleĢtirilmiĢtir. Ayrıca, bahsi geçen köprüye
uygulanabilecek oyulma önleyici düzenlemeler üzerine bir çalıĢma yapılmıĢtır.
Anahtar Kelimeler: Risk değerlendirmesi, yerel oyulma, köprü ayağı, kenar ayak,
oyulma önleyici düzenlemeler, HYRISK, HEC-RAS

vi
In the memory of my very special grandmother Naşide Selamoğlu

vii
ACKNOWLEDGMENTS
First and foremost, the author wishes to express her deepest gratitude to her
supervisor Prof. Dr. A. Melih Yanmaz for his guidance, advice, encouragement, and
great patience throughout the study.
The author is also grateful to Özgür Çiçekdağ from DOLSAR Engineering for his
worthful contributions, comments, and suggestions.
The author would like to thank to Mustafa Gayretli from State Hydraulic Works in
Trabzon and Arman Domaniç from Yüksel Domaniç Engineering Limited
Company for their invaluable assistance and sharing their knowledge.
Encouragement and never ending support of the author’s friends and colleagues
Arzu Soytekin, Aslıcan Yılmaz, Tuğçe Yıldırım, and Özge Küreksiz are gratefully
acknowledged. The author also would like to thank to Water Resources Laboratory
staff for their favour.
The author wishes to express her gratitude to her husband Berksan Apaydın for his
great support and patience, and being always near. Last but not the least; sincere
thanks are extended to the author’s parents Hacer and Celal Selamoğlu, and her
brother Arda Selamoğlu for their endless love and unshakable faith in her.

viii
TABLE OF CONTENTS
ABSTRACT .............................................................................................................. iv
ÖZ…… ...................................................................................................................... v
ACKNOWLEDGMENTS ....................................................................................... vii
TABLE OF CONTENTS ........................................................................................ viii
LIST OF TABLES .................................................................................................... xi
LIST OF FIGURES ................................................................................................ xiii
LIST OF SYMBOLS AND ABBREVIATIONS .................................................... xv
CHAPTER
1. INTRODUCTION .......................................................................................... 1
1.1 Statement of the Problem ............................................................................... 1
1.2 Objectives of the Study .................................................................................. 2
1.3 Description of the Thesis ................................................................................ 3
2. EVALUATION OF RISK OF SCOUR VULNERABLE BRIDGES ........... 4
2.1 General ........................................................................................................... 4
2.2 Scour Risk Evaluation .................................................................................... 5
2.2.1 The Risk-Based Model ........................................................................... 5
2.2.1.1 Overtopping Frequency .................................................................. 8
2.2.1.2 Scour Vulnerability ...................................................................... 10
2.2.2 Channel Stability Indicators ................................................................. 14
2.2.3 HYRISK Methodology ........................................................................ 20
ix
2.3 Evaluation of Scour Countermeasures ......................................................... 23
2.3.1 General ................................................................................................. 23
2.3.2 Scour Countermeasures Calculator ...................................................... 24
3. CASE STUDY ............................................................................................. 32
3.1 Fol Creek Basin and Flood Frequency Analysis .......................................... 32
3.2 Determination of Water Surface Profiles ..................................................... 34
3.3 Description of Fol-1 Bridge ......................................................................... 35
3.4 Field Trip ...................................................................................................... 39
3.5 HYRISK Parameters of the Case Study ....................................................... 40
3.5.1 NBI Parameters Related to Fol-1 Bridge ............................................. 41
3.5.2 Substructure and Channel Condition, Waterway Adequacy, and Scour
Criticality of Fol-1 Bridge ................................................................................ 42
3.5.2.1 Substructure Condition ................................................................ 42
3.5.2.2 Channel Condition ....................................................................... 42
3.5.2.3 Waterway Adequacy .................................................................... 46
3.5.2.4 Scour Criticality ........................................................................... 47
3.5.3 Analysis Assumptions .......................................................................... 47
3.5.3.1 Unit Rebuilding Cost (C1) Calculations ....................................... 48
3.6 Implementation of the Risk-Based Model for the Case Study ..................... 50
3.6.1 Sensitivity Analysis .............................................................................. 52
3.7 Scour Calculations ........................................................................................ 54
3.8 Scour Countermeasures for Fol-1 Bridge ..................................................... 56
3.8.1 Riprap Calculations .............................................................................. 59
3.8.2 Grout Filled Bag Calculations .............................................................. 61
3.8.3 Gabion Box Calculations ..................................................................... 63

x
3.9 Economic Analysis of Scour Countermeasures ........................................... 67
4. DISCUSSION OF THE RESULTS ............................................................. 71
4.1 Introduction .................................................................................................. 71
4.2 Evaluation of Scour Failure Risk ................................................................. 71
4.3 Evaluation of Scour Countermeasures ......................................................... 73
5. CONCLUSIONS .......................................................................................... 75
5.1 Summary and Conclusions ........................................................................... 75
5.2 Recommendations ........................................................................................ 77
REFERENCES ......................................................................................................... 79
APPENDICES
A. HEC-RAS OUTPUTS FOR STEADY FLOW SIMULATION OF FOL
CREEK AND SCOUR CALCULATIONS OF FOL-1 BRIDGE ........................... 83

xi
LIST OF TABLES
TABLES
Table 2.1 NBI parameters used in the risk-based model ........................................... 6
Table 2.2 Average daily traffic versus detour duration and cost multiplier............... 8
Table 2.4 Annual overtopping probabilities for various grades and dimensionless
depth ratios ................................................................................................... 10
Table 2.5 Scour vulnerability grades and dimensionless depth ratios ..................... 11
Table 2.6 Annual failure probability of a bridge...................................................... 13
Table 2.7 Stability indicators, descriptions, and ratings .......................................... 16
Table 2.8 Weights of the stability indicators ........................................................... 20
Table 2.9 Overall rating ranges ................................................................................ 20
Table 3.1 Flood frequency analysis for Fol Creek Basin ......................................... 33
Table 3.2 Rating of stability indicators in close vicinity to Fol-1 Bridge ................ 44
Table 3.3 Concrete and reinforcement quantities used in the major bridge
components ................................................................................................... 49
Table 3.4 Costs of concrete and reinforcement work in major bridge components 49
Table 3.5 Costs of materials in bridge construction ................................................. 50
Table 3.6 Risk of scour failure of Fol-1 Bridge ....................................................... 51
Table 3.7 Scour depths around bridge piers and abutments..................................... 56
Table 3.8 Median riprap size calculations................................................................ 60
Table 3.9 Unit prices for grout filled bag placement ............................................... 61
Table 3.10 Cost calculation for grout filled bag placement ..................................... 63
Table 3.11 Unit prices for gabion box placement .................................................... 64

xii
Table 3.12 Cost calculation for gabion box placement ............................................ 66
Table 3.13 Comparison table for costs of scour countermeasures ........................... 66
Table 4.1 Scour levels at piers and abutments of Fol-1 Bridge ............................... 72
Table 4.2 Scour criticality codes for piers and abutments of Fol-1 Bridge ............. 72
Table A.1 Results of steady flow analysis and scour calculations ........................... 84
xiii
LIST OF FIGURES
FIGURES
Figure 1.1 A definition sketch for local scour around bridge piers and abutments .... 2
Figure 2.1 Scour levels with respect to bridge footings ............................................ 12
Figure 2.2 NBI data window ..................................................................................... 21
Figure 2.3 Analysis result window for a single bridge ............................................. 23
Figure 2.4 Setting bridge description ........................................................................ 25
Figure 2.5 Setting cost multipliers ............................................................................ 26
Figure 2.6 Setting economic assumptions ................................................................. 27
Figure 2.7 Setting annual probability of failure ........................................................ 28
Figure 2.8 Setting useful life of bridge ..................................................................... 29
Figure 2.9 Presentation of economic risks ................................................................ 30
Figure 3.1 Highway is damaged due to flood ........................................................... 33
Figure 3.2 A view of the study bridge from downstream ......................................... 35
Figure 3.3 Map of the case study area ....................................................................... 36
Figure 3.4 Longitudinal section of the bridge (from upstream) ................................ 37
Figure 3.5 General view of Fol-1 Bridge .................................................................. 38
Figure 3.6 Right piers and abutment (Vakfıkebir side) ............................................. 38
Figure 3.7 Bridge deck skewed to flow .................................................................... 39
Figure 3.8 Excessive debris accumulations between piers ....................................... 40
Figure 3.9 A view of the bridge site from its upstream ............................................ 45
Figure 3.10 Mass wasting and aggradation in the upstream of Fol-1 Bridge ........... 46

xiv
Figure 3.11 Risk versus waterway adequacy for different scour criticalities ........... 53
Figure 3.12 An application of riprap around bridge piers ......................................... 58
Figure 3.13 An application of grout filled bags around bridge abutment ................. 58
Figure 3.14 Use of gabion boxes around bridge piers .............................................. 59
Figure 3.15 Details of grout filled bag placement ..................................................... 62
Figure 3.16 Details of gabion box placement ........................................................... 65
Figure 3.17 Benefit calculations of countermeasures ............................................... 68
Figure 3.18 Economical comparison of the proposed scour countermeasures ......... 69
Figure 3.19 Scour countermeasure analysis report ................................................... 70

xv
LIST OF SYMBOLS AND ABBREVIATIONS
a : Pier width
A = ADT : Average daily traffic
ACB : Articulated concrete block system
B1 : Present value benefit accounting for loss of life
B2 : Present value benefit precluding for loss of life
CE : Present value of expected rebuilding cost
Cf : Cost of failure, including injury and loss of life
CR : Current rebuilding cost
C1 : Unit rebuilding cost
C2 : Unit cost of running vehicle
C3 : Unit value of time per adult
C4 : Unit value of time for truck
d : Duration of detour
D : Detour length
Dd : Dimensionless depth
Df : Depth of flow corresponding to Qf
Di : Normal depth of a corresponding Qi
DL : Costs associated with loss of life
Dm : Distance from bridge upstream to meander impact point
Dr50 : Median riprap size diameter
D50 : Median grain size diameter
D90 : Diameter of grain of which 90% is finer
DSĠ : General Directorate of State Hydraulic Works
EĠE : Electrical Power Resources Survey and Development
Administration
F : Failure
Fr : Froude number
Fr1 : Froude number just upstream of pier
Fra : Froude number just upstream of abutment

xvi
g : Gravitational acceleration
H,V : Horizontal and vertical value of side inclinations
i : Discount rate
K : Risk adjustment factor
K1 : Bridge type factor
K2 : Foundation type factor
Ka1 : Coefficient for abutment shape
Ka2 : Coefficient for angle of embankment to flow
Kp : Coefficient for pier nose shape
Kp1 : Correction factor for pier nose shape
Kp2 : Correction factor for angle of attack of flow
Kp3 : Correction factor for bed condition
Kp4 : Correction factor for armoring
KGM : General Directorate of Highways
KHGM : General Directorate of Rural Services
L : Remaining useful life of bridge
La : Projected abutment length
Lb : Bridge length
L' : Length of active flow obstructed by embankment
M : Emergency cost multiplier
MP : Present value given annual cost multiplier
NBI : National Bridge Inventory
O : Occupancy rate
OT : Overtopping frequency
P : Annual probability of scour failure
PA : Annual probability of failure without protection
PL : Probability of failure over the expected life of bridge
PL' : Probability of failure over the extended life of the protected bridge
Ptr : Trial probability of scour failure
Q : Discharge
Qf : Full flow discharge
Qi : Discharge corresponding to a return period
xvii
R : Annual scour failure risk
Rh : Hydraulic radius
RP : Return period protection desired
S : Average detour speed
Sf : Energy grade line slope
S.C. : Scour Criticality
SV : Scour vulnerability
T = ADTT : Average daily truck traffic
Tr : Return period of a discharge
up : Velocity just upstream of pier
W : Bridge deck width
X90 : 90th
percentile mean time to scour failure
ya : Average flow depth
ya1 : Approach flow depth
y1 : Flow depth just upstream of pier
ys : Scour depth
Zmin : Minimum channel bed elevation
Zw : Water surface elevation
α : Approach flow angle to bridge
Δ : Relative density
γ : Specific weight of water
ρw : Water density
τ0 : Bed shear stress
τc : Critical shear stress at the incipient motion
1
CHAPTER 1
1. INTRODUCTION
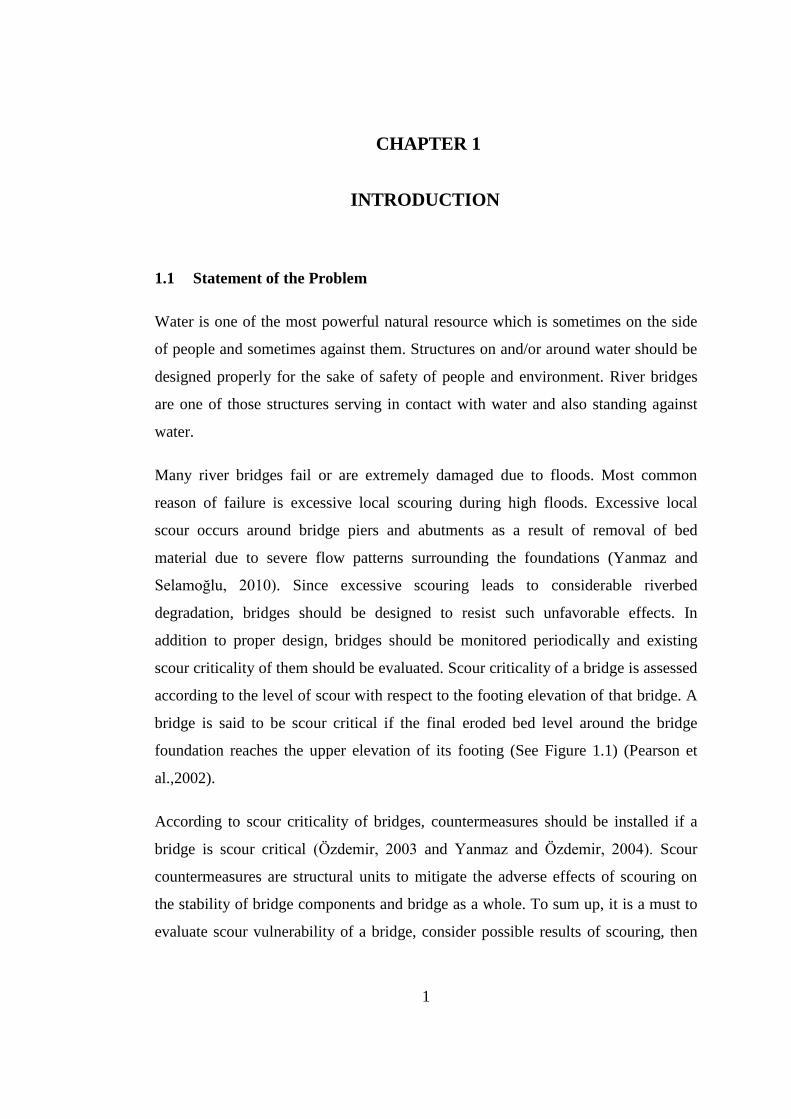
1.1 Statement of the Problem
Water is one of the most powerful natural resource which is sometimes on the side
of people and sometimes against them. Structures on and/or around water should be
designed properly for the sake of safety of people and environment. River bridges
are one of those structures serving in contact with water and also standing against
water.
Many river bridges fail or are extremely damaged due to floods. Most common
reason of failure is excessive local scouring during high floods. Excessive local
scour occurs around bridge piers and abutments as a result of removal of bed
material due to severe flow patterns surrounding the foundations (Yanmaz and
Selamoğlu, 2010). Since excessive scouring leads to considerable riverbed
degradation, bridges should be designed to resist such unfavorable effects. In
addition to proper design, bridges should be monitored periodically and existing
scour criticality of them should be evaluated. Scour criticality of a bridge is assessed
according to the level of scour with respect to the footing elevation of that bridge. A
bridge is said to be scour critical if the final eroded bed level around the bridge
foundation reaches the upper elevation of its footing (See Figure 1.1) (Pearson et
al.,2002).
According to scour criticality of bridges, countermeasures should be installed if a
bridge is scour critical (Özdemir, 2003 and Yanmaz and Özdemir, 2004). Scour
countermeasures are structural units to mitigate the adverse effects of scouring on
the stability of bridge components and bridge as a whole. To sum up, it is a must to
evaluate scour vulnerability of a bridge, consider possible results of scouring, then

2
select and design suitable countermeasures against scouring for the sake of bridge
safety and life around the bridge.
Figure 1.1 A definition sketch for local scour around bridge piers and abutments
(Yanmaz A. M., 2002)
1.2 Objectives of the Study
Main objective of this study is to apply the software HYRISK for determining the
annual failure risk of a scour vulnerable bridge. In determination of the failure risk,
several stability parameters are studied together with scour criticality aspects of
bridges. Scour depth calculations are performed to get support for assessing the
bridge scour criticality. To illustrate the assessment of scour vulnerability and
determination of failure risk of a bridge, a case study is carried out for an existing
bridge in Turkey. In addition to those evaluations mentioned above, suitable
countermeasures are defined to protect the aforesaid bridge against scour-induced
failure.

3
1.3 Description of the Thesis
This thesis is composed of five chapters. Contents of the chapters are as follows:
An introduction to the thesis is made and the objectives of the study are highlighted
in Chapter 1.
In Chapter 2, the methodology of the study is explained and HYRISK software is
introduced. Governing equations and tables used in the study are presented in this
chapter.
The case study is described in Chapter 3. Results of the analyses are also given in
this chapter.
Chapter 4 discusses the results obtained in the case study.
In Chapter 5, a summary of the thesis is presented. Also several recommendations
for future works are made.
In the Appendix A, the outputs of HEC-RAS program are tabulated.

4
CHAPTER 2
2. EVALUATION OF RISK OF SCOUR VULNERABLE
BRIDGES
2.1 General
Scouring is the most common reason for bridge damage or failure. Excessive
scouring occurs due to erosive effects of water flow, which would lead to removal of
material from the stream bed and bank, and around infrastructural elements of
bridges.
This study is mostly concentrated on the probabilistic approach to scour risk
evaluation; therefore the mechanism of local scour is not given. Interested readers
are advised to refer to Yanmaz and Altınbilek (1991), Melville and Coleman (2000),
Yanmaz (2002), Yanmaz (2006), and Yanmaz and Köse (2009).
Since scouring is the most severe damage or failure reason for river bridges,
investigating the potential of scour failure of bridges should be made carefully.
Due to complexity of river flow pattern, analyzing the real scouring phenomenon
around piers and abutments is relatively difficult. Because of unknown nature of
various parameters, uncertainties would arise, which should be treated and
incorporated in the model (Yanmaz and Selamoğlu, 2010). As a preliminary
approach, probabilistic scour risk evaluation would be quite helpful to evaluate the
scour criticality of a bridge. This approach and its methodology will be explained in
the subsequent sections. Such an approach is implemented using a software
program, HYRISK (Pearson et al., 2002).

5
2.2 Scour Risk Evaluation
For evaluating the risk of scour failure of a bridge, a risk-based model is developed
and documented in the Federal Highway Administration (FHWA) report in 1994,
i.e. Report No. FHWA-RD-92-030 “Strategies for Managing Unknown Bridge
Foundations”. FHWA coded the software program HYRISK for the implementation
of this risk-based model (Pearson et al., 2002).
The risk-based model allows determining the annual risk of scour failure of a bridge.
The risk is obtained by multiplying annual probability of scour failure of a bridge
and economic losses related to the bridge failure. It means that the risk of a bridge
failure is estimated in monetary terms. Obtaining the results in cost terms provides
convenience to those who intend to improve safety of infrastructural systems both in
rural and urban areas. Therefore, assessment of scour criticality of bridges is an
integral part of such evaluations. Also the model is helpful to categorize a series of
scour-critical bridges according to degree of deficiency. It is, therefore, possible to
rank those bridges such that priority is given to the most susceptible ones.
2.2.1 The Risk-Based Model
In the risk-based model, data related to bridge and economic factors are used. A
database called National Bridge Inventory (NBI) was generated by FHWA to collect
and store information pertinent to bridges in the United States. Data, which are
recorded in the database, are modified and/or updated based on periodical field
inspections. The NBI parameters used in the risk-based model are tabulated in
Table 2.1.

6
Table 2.1 NBI parameters used in the risk-based model (Pearson et al., 2002)
NBI Parameters
Bypass length
Functional classification
Year built
Average daily traffic
Type of service
Type of span
Structure length
Deck width
Waterway adequacy
Average daily truck traffic
Scour-critical bridges (criticality level)
A brief information on the terms used in this model clarifies the approach. In case of
a bridge failure, the bridge is closed and a bypass (detour) route is determined.
Bypass length is the additional distance traveled while detouring. Functional
classification of a bridge is determined according to its location and character of the
roadway. Year of construction of the bridge is another parameter, which accounts
for aging effects. Average daily traffic (ADT) is the annual average daily traffic load
on the inventory route. Type of service is determined both for under the bridge and
over the bridge, whether they are highway, railroad, waterway, or another service
type. Type of span is described as both the material used in the construction of the
bridge and type of its design. Structure length is the length of the roadway supported
on the bridge sub-structure. Deck width is out-to-out width of the bridge slab.
Waterway adequacy is related to whether the waterway opening under the bridge is
sufficient for no overtopping or not. Average daily truck traffic (ADTT) is the
annual average daily truck traffic load on the inventory route, and is indicated as a
percentage of ADT. Finally, in scour-critical bridges, current scour vulnerability of a
bridge is indicated, based on scour field inspection or scour evaluation study, if
available (Pearson et al., 2002).
7
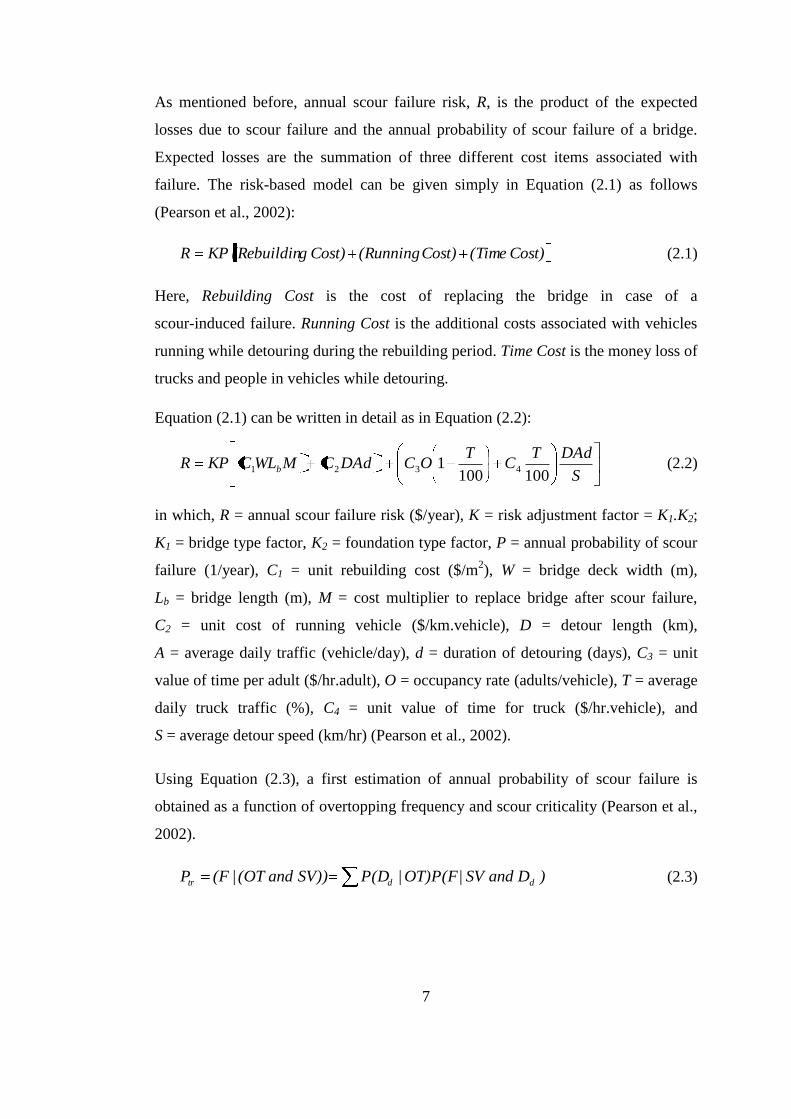
As mentioned before, annual scour failure risk, R, is the product of the expected
losses due to scour failure and the annual probability of scour failure of a bridge.
Expected losses are the summation of three different cost items associated with
failure. The risk-based model can be given simply in Equation (2.1) as follows
(Pearson et al., 2002):
Cost) (TimeCost) (RunningCost) g(RebuildinKPR (2.1)
Here, Rebuilding Cost is the cost of replacing the bridge in case of a
scour-induced failure. Running Cost is the additional costs associated with vehicles
running while detouring during the rebuilding period. Time Cost is the money loss of
trucks and people in vehicles while detouring.
Equation (2.1) can be written in detail as in Equation (2.2):
S
DAdTC
TOC DAdCMWLCKPR b
1001001 4321
(2.2)
in which, R = annual scour failure risk ($/year), K = risk adjustment factor = K1.K2;
K1 = bridge type factor, K2 = foundation type factor, P = annual probability of scour
failure (1/year), C1 = unit rebuilding cost ($/m2), W = bridge deck width (m),
Lb = bridge length (m), M = cost multiplier to replace bridge after scour failure,
C2 = unit cost of running vehicle ($/km.vehicle), D = detour length (km),
A = average daily traffic (vehicle/day), d = duration of detouring (days), C3 = unit
value of time per adult ($/hr.adult), O = occupancy rate (adults/vehicle), T = average
daily truck traffic (%), C4 = unit value of time for truck ($/hr.vehicle), and
S = average detour speed (km/hr) (Pearson et al., 2002).
Using Equation (2.3), a first estimation of annual probability of scour failure is
obtained as a function of overtopping frequency and scour criticality (Pearson et al.,
2002).
)D and SV|OT)P(F|P(D SV))and (OT|(FP ddtr (2.3)

8
where, Ptr = trial probability of scour failure, F = failure, OT = overtopping
frequency, SV = scour vulnerability, and Dd = dimensionless depth. Overtopping
frequency and scour vulnerability are explained in the next two sections.
Duration of detouring (d) and cost multiplier (M) in Equation (2.2) are both
specified according to ADT. M accounts for the emergency of rebuilding of a bridge
based on the importance of the inventory route. Rebuilding costs will be multiplied
by M. The relation between ADT, d, and M is given in Table 2.2. As ADT value of a
route on bridge increases, importance of bridge pronounces. Therefore, the bridge
should be replaced in shorter durations for higher ADT values. If a bridge is
intended to be replaced in shorter durations than planned for nonemergency
condition, the cost of replacement will increase. Multiple shift operations may be
needed in that case, and this will result in increased cost of workmanship and higher
operating cost of construction equipment. Therefore, the rebuilding cost of a bridge
should be increased by a specified multiplier, to reflect the emergency of the
condition.
Table 2.2 Average daily traffic versus detour duration and cost multiplier
(Pearson et al., 2002)
ADT
(veh/day)
Detour Duration
(days) M
< 100 1095 1.0
< 500 731 1.1
< 1000 548 1.25
< 5000 365 1.5
5000 ≤ A ≤ 10000 183 2.0
2.2.1.1 Overtopping Frequency
Overtopping frequency is estimated according to the waterway adequacy and
functional classification of a bridge. Overtopping frequency grades and

9
corresponding return periods and annual overtopping probabilities for full-flow
condition are presented in Table 2.3. Annual overtopping probabilities are taken as
approximately the reciprocals of the average return periods in the proposed intervals.
Some regression equations are proposed for various discharges corresponding to
different return periods using available hydrologic data (Fletcher et al., 1977). In
fact, such discharges should be obtained for every basin exhibiting different
characteristics than those considered in Fletcher et al. (1977). In this thesis, a flow-
frequency analysis conducted for the study area is directly used in the execution of
the software.
Table 2.3 Overtopping frequency grades for full-flow (Pearson et al., 2002)
Overtopping
Frequency
Return Period
(years)
Annual Overtopping
Probability
None Never Never
Remote > 100 0.01
Slight 11 – 100 0.02
Occasional 3 – 10 0.2
Frequent < 3 0.5
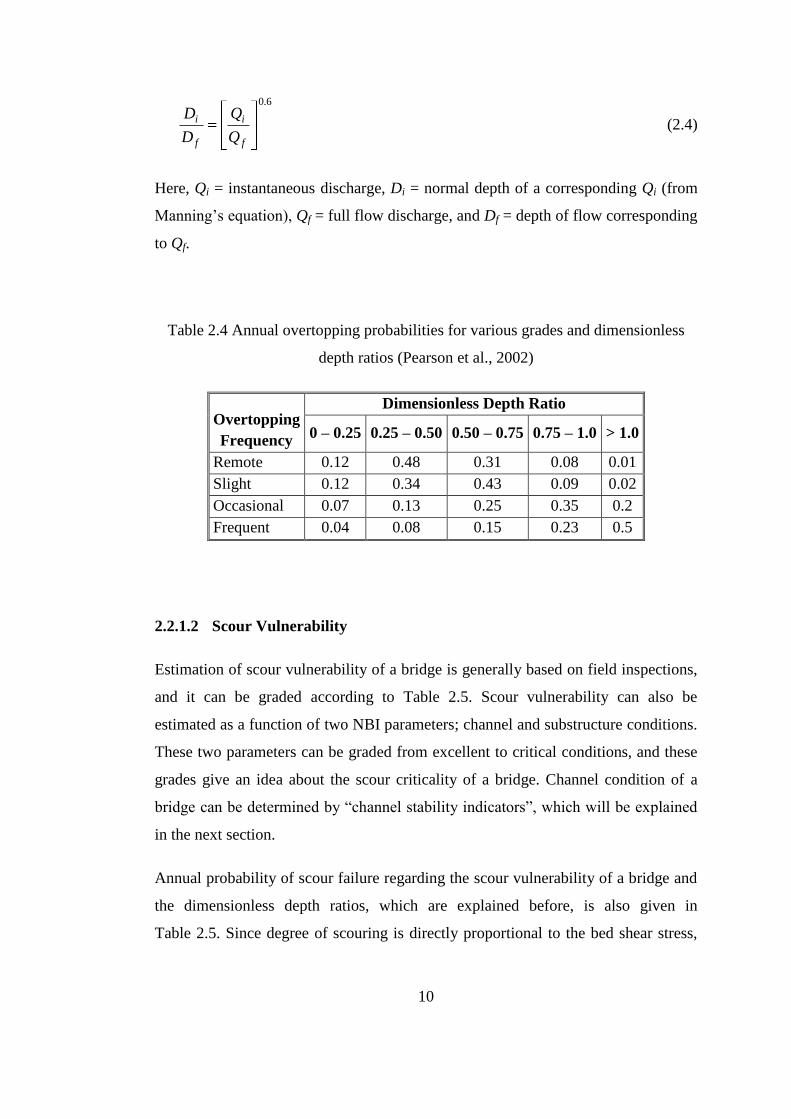
Using the dimensionless discharge and depth ratio relation given in Equation (2.4),
annual overtopping probabilities corresponding to various overtopping frequency
grades and dimensionless depth ratios are calculated and presented in Table 2.4
(Pearson et al., 2002). Considering an overtopping frequency, the row-wise
summation of the probabilities corresponding to different dimensionless depth ratios
is 1.0. These probabilities tend to increase with respect to flow depth for occasional
and frequent overtopping frequency grades. Such a tendency is also observed for
slight and remote overtopping frequency grades for up to 75% fullness. The last
column of Table 2.4 presents overtopping probabilities for depth ratio greater than
1.0. This case may represent pressure flow conditions, i.e. the flow depth exceeds
the bottom elevation of the girder but the bridge is not overtopped.
10
6.0
f
i
f
i
Q
Q
D
D (2.4)
Here, Qi = instantaneous discharge, Di = normal depth of a corresponding Qi (from
Manning’s equation), Qf = full flow discharge, and Df = depth of flow corresponding
to Qf.
Table 2.4 Annual overtopping probabilities for various grades and dimensionless
depth ratios (Pearson et al., 2002)
Overtopping
Frequency
Dimensionless Depth Ratio
0 – 0.25 0.25 – 0.50 0.50 – 0.75 0.75 – 1.0 > 1.0
Remote 0.12 0.48 0.31 0.08 0.01
Slight 0.12 0.34 0.43 0.09 0.02
Occasional 0.07 0.13 0.25 0.35 0.2
Frequent 0.04 0.08 0.15 0.23 0.5
2.2.1.2 Scour Vulnerability
Estimation of scour vulnerability of a bridge is generally based on field inspections,
and it can be graded according to Table 2.5. Scour vulnerability can also be
estimated as a function of two NBI parameters; channel and substructure conditions.
These two parameters can be graded from excellent to critical conditions, and these
grades give an idea about the scour criticality of a bridge. Channel condition of a
bridge can be determined by “channel stability indicators”, which will be explained
in the next section.
Annual probability of scour failure regarding the scour vulnerability of a bridge and
the dimensionless depth ratios, which are explained before, is also given in
Table 2.5. Since degree of scouring is directly proportional to the bed shear stress,

11
and hence flow depths, this probability tends to increase with respect to
dimensionless depth ratio for a particular scour vulnerability condition.
Table 2.5 Scour vulnerability grades and dimensionless depth ratios
(Pearson et al., 2002)
Scour
Vulnerability
Dimensionless Depth Ratio
0 – 0.25 0.25 – 0.50 0.50 – 0.75 0.75 – 1.0 > 1.0
0 (Bridge failure) 1 1 1 1 1
1 (Bridge closed) 1 1 1 1 1
2 (Extremely vulnerable) 0.25 0.4 0.55 0.7 0.88
3 (Unstable foundations) 0.14 0.2 0.3 0.45 0.65
4 (Stable, action required) 0.06 0.1 0.15 0.26 0.41
5 (Stable, limited life) 0.002 0.002 0.002 0.03 0.1
6, U (Unassessed/Unknown) 0.1 0.15 0.225 0.355 0.53
7 (Countermeasure installed) 0.1 0.15 0.225 0.355 0.53
8 (Very good condition) 0.002 0.002 0.002 0.01 0.05
9 (Excellent condition) 0.002 0.002 0.002 0.002 0.01
The numbers given in the scour vulnerability column in Table 2.5 are the codes of
vulnerability grades which will be used in the HYRISK implementation. Those
scour vulnerability codes and corresponding explanations are given below:
Bridge is failed (0) – Bridge is closed to traffic (1): in these conditions
bridge is failed or failure is imminent, respectively. Bridge is closed to traffic
in both conditions.
Bridge is scour-critical (2): extensive scour has occurred at bridge piers and
abutments.
Bridge is scour-critical (3): bridge foundations are unstable.
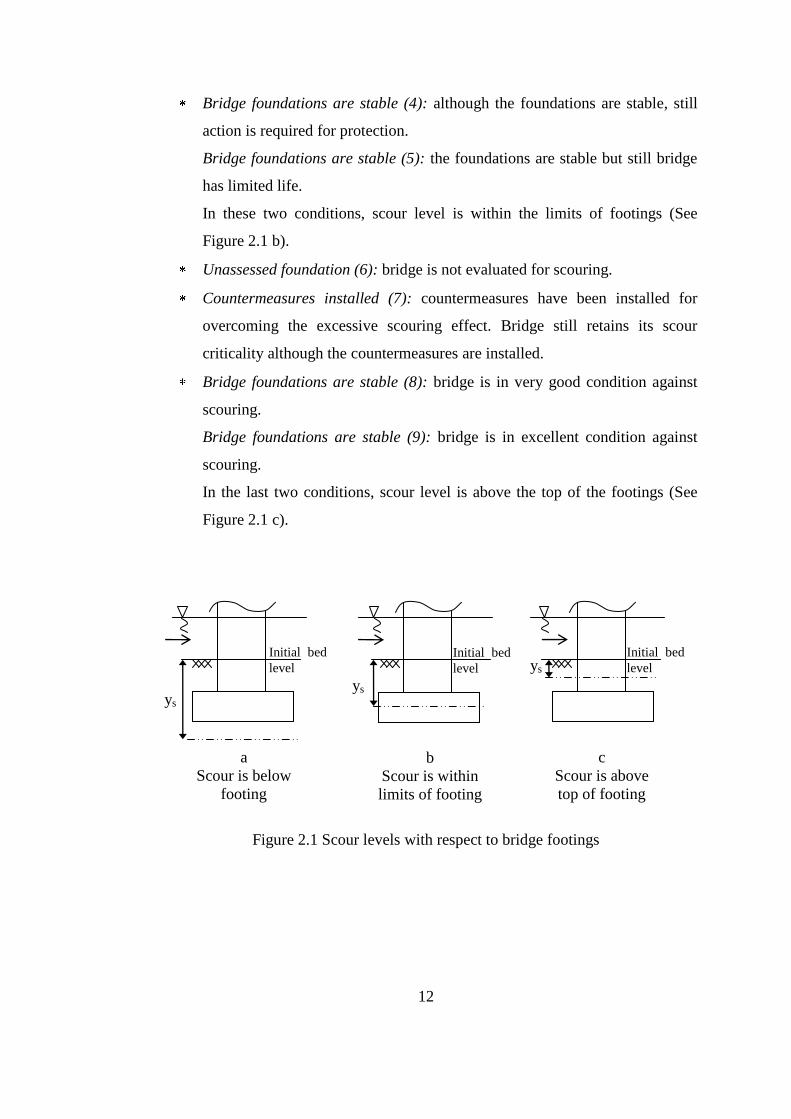
In these two conditions, scour level, ys, is below footings or within the limits
of footings with a minimal chance (See Figure 2.1 a).
12
Bridge foundations are stable (4): although the foundations are stable, still
action is required for protection.
Bridge foundations are stable (5): the foundations are stable but still bridge
has limited life.
In these two conditions, scour level is within the limits of footings (See
Figure 2.1 b).
Unassessed foundation (6): bridge is not evaluated for scouring.
Countermeasures installed (7): countermeasures have been installed for
overcoming the excessive scouring effect. Bridge still retains its scour
criticality although the countermeasures are installed.
Bridge foundations are stable (8): bridge is in very good condition against
scouring.
Bridge foundations are stable (9): bridge is in excellent condition against
scouring.
In the last two conditions, scour level is above the top of the footings (See
Figure 2.1 c).
Figure 2.1 Scour levels with respect to bridge footings
a
Scour is below
footing
b
Scour is within
limits of footing
c
Scour is above
top of footing
ys ys
ys Initial bed
level
Initial bed
level
Initial bed
level

13
Combining Tables 2.4 and 2.5 with Equation (2.3), annual failure probability of a
bridge regarding scour vulnerability and overtopping frequency can be obtained,
which is given in Table 2.6. Annual failure probability increases as overtopping
frequency grade changes from remote to frequent for a particular scour vulnerability
condition. It may be stated that the proposed failure probabilities given in Table 2.6
are defined by the program developers. Therefore, this program gives mainly a
preliminary qualitative information for sites having different characteristics than
those included in NBI database.
Table 2.6 Annual failure probability of a bridge (Pearson et al., 2002)
Scour
Vulnerability
Overtopping Frequency
Remote Slight Occasional Frequent
0 (Bridge failure) 1 1 1 1
1 (Bridge closed) 1 1 1 1
2 (Extremely vulnerable) 0.4573 0.4831 0.628 0.7255
3 (Unstable foundations) 0.2483 0.2673 0.3983 0.4951
4 (Stable, action required) 0.1266 0.1373 0.2277 0.2977
5 (Stable, limited life) 0.00522 0.00648 0.0314 0.05744
6, U (Unassessed/Unknown) 0.18745 0.2023 0.313 0.3964
7 (Countermeasure installed) 0.18745 0.2023 0.313 0.3964
8 (Very good condition) 0.00312 0.00368 0.0144 0.02784
9 (Excellent condition) 0.00208 0.00216 0.0036 0.006
As mentioned before, the obtained probability in Table 2.6 is a first estimation for
the annual scour failure probability (trial probability). The current age of the bridge
is a check for this probability. Assuming that binomial distribution is suitable for the
annual failure probability, the probability is modified by Equation (2.5) (Pearson et
al., 2002):

14
)1log(
)90.01log(90
trPX (2.5)
in which, X90 = 90th
percentile mean time to scour failure and Ptr = trial probability
of scour failure. In circumstances, where the current age of the bridge is greater than
X90, Ptr needs to be modified. The required modification can be assessed by applying
the age of the bridge as X90 in the above equation. Once new Ptr is obtained, it is
used in Equation (2.2).
2.2.2 Channel Stability Indicators
As mentioned in the previous section, scour vulnerability of a bridge can be assessed
by the aid of the information about the nearby channel characteristics and
substructure condition of the bridge concerned. Substructure condition includes the
physical condition of the bridge components, such as piers, abutments, footings and
other structural members. Observing the probable deteriorations, cracks in these
members and grading their condition is not complicated at such a level of study.
A methodology developed by Yanmaz et al. (2007) can be used to assess the
existing level of a bridge with respect to conditions of main body, earth retaining,
and serviceability components. This methodology is based on a grading system
according to in-situ measurements and observations. In another study conducted by
Caner et al. (2008), the remaining lifetime of existing bridges were examined. An
empirical equation was derived based on extensive field surveys conducted at
various bridge sites using the methodology developed by Yanmaz et al. (2007).
However, assessment of the channel condition is a relatively complex task. That is
why dividing it to sub-parameters provides convenience.
Johnson et al. (1999) proposed a method for rapid assessment of channel stability. In
this method, there are 13 stability indicators having different weights. These
indicators are graded from 1 – 12, such as excellent (1 – 3), good (4 – 6), fair (7 – 9),
and poor (10 – 12). These grades are multiplied with their corresponding weights
and an overall rating is obtained for the channel stability by the summation of 13

15
weighted grades. Yanmaz et al. (2007) also used this method for assessing the
current hydraulic conditions of the channel in close vicinity of the bridge concerned.
The stability indicators and their descriptions for the corresponding grade ranges are
presented in Table 2.7, in which H and V are horizontal and vertical values of side
inclinations, respectively, τ0 is bed shear stress, τc is critical bed shear stress leading
to incipient motion at the bed, α is the angle between approach flow and pier axis,
and Dm is the bridge or culvert distance from meander impact point. In Table 2.8,
weights of the indicators are shown, and finally in Table 2.9, overall rating ranges of
channel stability are presented.

16
Tab
le 2
.7 S
tabil
ity i
ndic
ators
, des
crip
tio
ns,
and r
atin
gs
(Johnso
n e
t al
., 1
999)
Rati
ng
s
Poor
(10
–12)
Loam
y s
and t
o s
and;
non-c
ohes
ive
mat
eria
l.
Ban
k s
lopes
over
60%
com
mon
on o
ne
or
both
ban
ks.
Woody v
eget
atio
n b
and
may
var
y d
epen
din
g o
n a
ge
and h
ealt
h w
ith l
ess
than
50%
pla
nt
den
sity
and
cover
. P
rim
aril
y s
oft
woo
d,
pin
ey, co
nif
erous
tree
s w
ith
ver
y y
oung, old
and d
yin
g,
and/o
r m
ono
-sta
nd
veg
etat
ion l
oca
ted o
ff o
f th
e
ban
k. W
oody v
eget
atio
n
ori
ente
d a
t le
ss t
han
70°
from
hori
zonta
l w
ith
exte
nsi
ve
root
exposu
re.
Fair
(7
–9)
San
dy c
lay t
o s
andy
loam
.
Ban
k s
lopes
to 1
.7H
:1V
(31°
or
60%
) co
mm
on
on o
ne
or
both
ban
ks.
Sm
all
ban
d o
f w
oody
veg
etat
ion w
ith 5
0–
70%
pla
nt
den
sity
and
cover
. A
maj
ori
ty o
f
soft
wood, pin
ey,
conif
erous
tree
s w
ith
young o
r old
veg
etat
ion
lack
ing i
n d
iver
sity
loca
ted o
n o
r nea
r th
e
top o
f ban
k.
Woody
veg
etat
ion o
rien
ted a
t
70–80°
from
hori
zonta
l
oft
en w
ith e
vid
ent
root
exposu
re.
Good
(4
–6)
Cla
y l
oam
to s
andy c
lay
loam
.
Ban
k s
lopes
up t
o
2H
:1V
(27°
or
50%
) on
one
or
occ
asio
nal
ly
both
ban
ks.
Med
ium
ban
d o
f w
oody
veg
etat
ion w
ith 7
0-9
0%
pla
nt
den
sity
and c
over
.
A m
ajori
ty o
f har
d
wood, le
afy, d
ecid
uous
tree
s w
ith
mat
uri
ng,
div
erse
veg
etat
ion
loca
ted o
n t
he
ban
k.
Woody v
eget
atio
n
ori
ente
d 8
0–90°
from
hori
zonta
l w
ith m
inim
al
root
exposu
re.
Exce
llen
t (1
–3)
Cla
y a
nd s
ilty
cla
y;
cohes
ive
mat
eria
l.
Ban
k s
lopes
<3H
:1V
(18°
or
33%
) on b
oth
sides
.
Wid
e ban
d o
f w
oody
veg
etat
ion
wit
h a
t
leas
t 90%
den
sity
and
cover
. P
rim
aril
y h
ard
wood, le
afy,
dec
iduous
tree
s w
ith
mat
ure
, hea
lthy, an
d
div
erse
veg
etat
ion
loca
ted o
n t
he
ban
k.
Woody v
eget
atio
n
ori
ente
d v
erti
call
y.
Sta
bil
ity i
nd
icato
r
1. B
ank s
oil
tex
ture
and c
oher
ence
2. A
ver
age
ban
k
slope
angle
(Pfa
nkuch
1978)
3. V
eget
ativ
e b
ank
pro
tect
ion
(Pfa
nkuch
1978;
Thorn
e et
al.
1996)

17
Tab
le 2
.7 c
onti
nued
Rati
ngs
Poor
(10
–12)
Alm
ost
conti
nuous
cuts
,
som
e over
60 c
m h
igh.
Under
cutt
ing,
sod
-root
over
han
gs,
and s
ide
fail
ure
s fr
equen
t.
Fre
quen
t an
d e
xte
nsi
ve
mas
s w
asti
ng. T
he
pote
nti
al f
or
ban
k f
ailu
re,
as e
vid
ence
d b
y t
ensi
on
crac
ks,
mas
sive
under
cutt
ings,
and b
ank
slum
pin
g,
is c
onsi
der
able
.
Chan
nel
wid
th i
s hig
hly
irre
gula
r an
d b
anks
are
scal
loped
.
Bar
wid
ths
are
gen
eral
ly
gre
ater
than
1/2
the
stre
am
wid
th a
t lo
w f
low
. B
ars
are
com
pose
d o
f ex
tensi
ve
dep
osi
ts o
f fi
ne
par
ticl
es
up t
o c
oar
se g
ravel
wit
h
litt
le t
o n
o v
eget
atio
n.
Fair
(7
–9)
Sig
nif
ican
t an
d f
requ
ent.
Cuts
30–60 c
m h
igh. R
oot
mat
over
han
gs.
Evid
ence
of
freq
uen
t an
d/o
r
signif
ican
t occ
urr
ence
s o
f
mas
s w
asti
ng t
hat
can
be
aggra
vat
ed b
y h
igher
flo
ws,
whic
h m
ay c
ause
under
cutt
ing a
nd
mas
s
was
ting o
f unst
able
ban
ks.
Chan
nel
wid
th q
uit
e
irre
gula
r an
d s
call
opin
g o
f
ban
ks
is e
vid
ent.
Bar
wid
ths
tend t
o b
e w
ide
and c
om
pose
d o
f n
ewly
dep
osi
ted c
oar
se s
and t
o
smal
l co
bble
s an
d/o
r m
ay b
e
spar
sely
veg
etat
ed.
Good
(4
–6)
Som
e in
term
itte
ntl
y
along c
han
nel
ben
ds
and
at p
rom
inen
t
const
rict
ions.
Raw
ban
ks
may
be
up t
o 3
0 c
m.
Evid
ence
of
infr
equ
ent
and/o
r m
inor
mas
s
was
ting. M
ost
ly h
eale
d
over
wit
h v
eget
atio
n.
Rel
ativ
ely c
onst
ant
chan
nel
wid
th a
nd
min
imal
sca
llopin
g o
f
ban
ks.
Bar
s m
ay h
ave
veg
etat
ion a
nd/o
r be
com
pose
d o
f co
arse
gra
vel
to c
obble
s, b
ut
min
imal
rec
ent
gro
wth
of
bar
evid
ent
by l
ack
of
veg
etat
ion o
n p
ort
ions
of
the
bar
.
Exce
llen
t (1
–3)
Lit
tle
or
none
evid
ent.
Infr
equen
t
raw
ban
ks
less
than
15 c
m h
igh
gen
eral
ly.
No o
r li
ttle
evid
ence
of
pote
nti
al o
r ver
y
smal
l am
ounts
of
mas
s w
asti
ng.
Unif
orm
chan
nel
wid
th o
ver
the
enti
re r
each
.
Bar
s ar
e m
ature
,
nar
row
rel
ativ
e to
stre
am w
idth
at
low
flo
w,
wel
l
veg
etat
ed,
and
com
pose
d o
f
coar
se g
ravel
to
cobble
s.
Sta
bil
ity i
nd
icato
r
4. B
ank c
utt
ing
(Pfa
nkuch
1978)
5. M
ass
was
ting o
r
ban
k f
ailu
re
(Pfa
nkuch
1978)
6. B
ar d
evel
opm
ent
(Lag
asse
et
al.
1995)

18
Tab
le 2
.7 c
onti
nued
Rati
ngs
Poor
(10
–12)
Moder
ate
to h
eavy
accu
mula
tions
of
var
ious
size
deb
ris
pre
sent.
Deb
ris
jam
pote
nti
al s
ignif
ican
t.
Fre
quen
t an
d o
ften
unst
able
causi
ng
a c
onti
nual
shif
t of
sedim
ent
and f
low
. T
raps
are
easi
ly f
ille
d c
ausi
ng
ch
annel
to m
igra
te a
nd/o
r w
iden
.
Ver
y l
oose
ass
ort
men
t w
ith
no p
ackin
g. L
arg
e am
oun
ts
of
mat
eria
l <
4 m
m.
Fair
(7
–9)
Noti
ceab
le a
ccum
ula
tion o
f
all
size
s. M
oder
ate
dow
nst
ream
deb
ris
jam
pote
nti
al p
oss
ible
.
Mo
der
atel
y f
requen
t an
d
occ
asio
nal
ly u
nst
able
obst
ruct
ions,
cau
se
noti
ceab
le e
rosi
on o
f th
e
chan
nel
. C
onsi
der
able
sedim
ent
accu
mula
tion
beh
ind o
bst
ruct
ions.
Loose
ass
ort
men
t w
ith n
o
appar
ent
ov
erla
p. S
mal
l to
med
ium
am
ounts
of
mat
eria
l
<4 m
m.
Good
(4
–6)
Sm
all
amounts
of
deb
ris
pre
sent.
Sm
all
jam
s co
uld
be
form
ed.
Pre
sent,
cau
sing
cro
ss
curr
ents
and m
inor
ban
k a
nd b
ott
om
erosi
on.
Moder
atel
y p
acked
wit
h s
om
e
over
lappin
g. V
ery
smal
l am
ounts
of
mat
eria
l <
4 m
m.
Exce
llen
t (1
–3)
Deb
ris
or
pote
nti
al f
or
deb
ris
in
chan
nel
is
neg
ligib
le.
Rar
e or
not
pre
sent.
Ass
ort
ed s
izes
tig
htl
y
pac
ked
,
over
lappin
g, an
d
poss
ibly
im
bri
cate
d.
Most
mat
eria
l >
4 m
m.
Sta
bil
ity i
nd
icato
r
7. D
ebri
s ja
m
pote
nti
al
(Pfa
nkuch
1978)
8. O
bst
ruct
ions,
flow
def
lect
ors
,
and s
edim
ent
trap
s
(Pfa
nkuch
1978)
9. C
han
nel
bed
mat
eria
l
conso
lidat
ion
and a
rmori
ng
(Pfa
nkuch
1978)

19
Tab
le 2
.7 c
onti
nued
Rati
ngs
Poor
(10
–12)
τ 0 /
τc ≥
2.5
α >
30°
0 <
Dm ≤
10 m
>50%
Fair
(7
–9)
1.5
≤ τ
0 /
τc <
2.5
10°
< α
≤ 3
0°
10 <
Dm ≤
20 m
26–50%
Good
(4–6)
1.0
≤ τ
0 /
τc <
1.5
5°
< α
≤ 1
0°
20 <
Dm ≤
35 m
6–25%
Exce
llen
t (1
–3)
τ 0 /
τc <
1.0
gen
eral
ly.
0°
≤ α
≤ 5
°
Dm >
35 m
0–5%
Sta
bil
ity i
nd
icato
r
10. S
hea
r st
ress
rat
io
11. H
igh f
low
ang
le o
f
appro
ach
to b
ridge
or
culv
ert
(Sim
on a
nd D
ow
ns
1995)
12.
Bri
dge
or
culv
ert
dis
tance
from
mea
nder
im
pac
t poin
t
(Sim
on a
nd D
ow
ns
1995)
13. P
erce
nta
ge
of
chan
nel
const
rict
ion (
Sim
on a
nd
Dow
ns
1995)

20
Table 2.8 Weights of the stability indicators (Johnson et al., 1999)
Stability Indicator Weight
1. Bank soil texture and coherence 0.6
2. Average bank slope angle 0.6
3. Vegetative bank protection 0.8
4. Bank cutting 0.4
5. Mass wasting or bank failure 0.8
6. Bar development 0.6
7. Debris jam potential 0.2
8. Obstructions, deflectors, and sediment traps 0.2
9. Bed material consolidation and armoring 0.8
10. Shear stress ratios 1.0
11. High flow angle of approach to bridge 0.8
12. Distance from meander impact point 0.8
13. Percentage of channel constriction 0.8
Table 2.9 Overall rating ranges (Johnson et al., 1999)
Description Rating (R')
Excellent R' < 32
Good 32 ≤ R' < 55
Fair 55 ≤ R' < 78
Poor R' ≥ 78
2.2.3 HYRISK Methodology
For the implementation of the risk-based model, HYRISK Version 2.0
(Pearson et al., 2002) is used in this thesis. The software is quick and reliable to
estimate annual risk of scour failure of a bridge or many bridges at the same time.
As mentioned before, NBI database stores the information of bridges in United
States. Information of a bridge in another country is not available in the database.
Therefore, use of this approach outside the USA needs special care about the
definitions and default and/or characteristic parameters used in the model. An “NBI
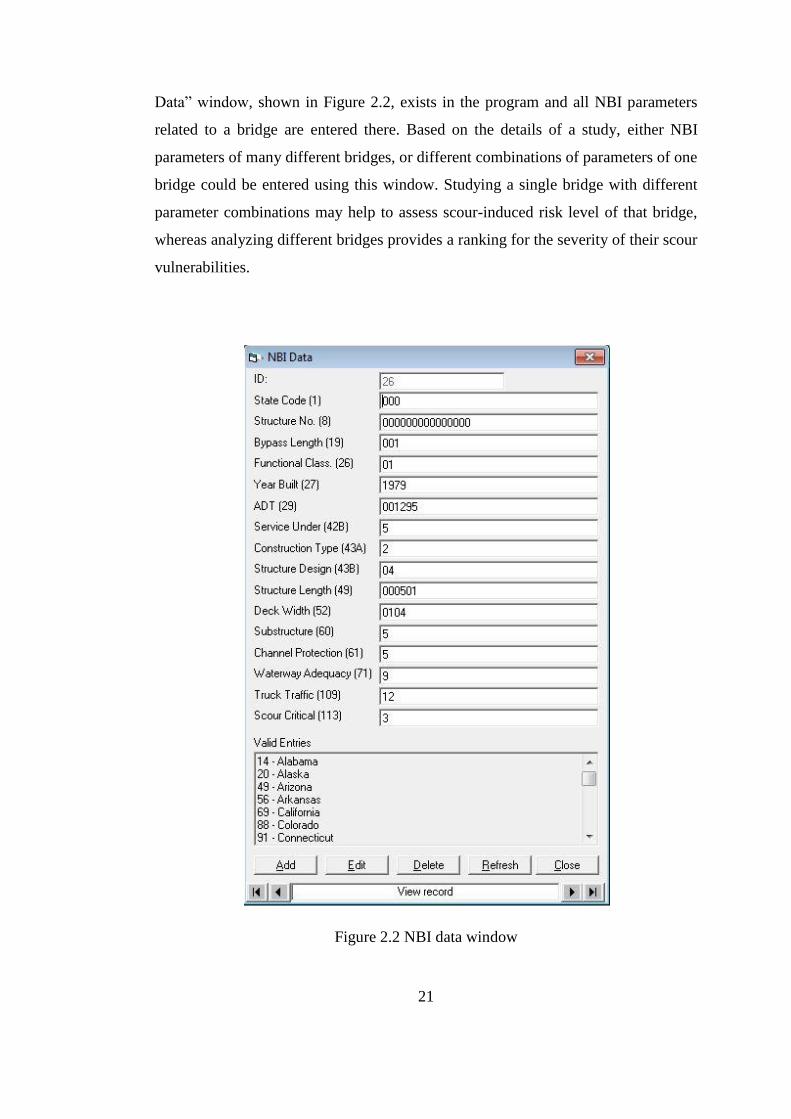
21
Data” window, shown in Figure 2.2, exists in the program and all NBI parameters
related to a bridge are entered there. Based on the details of a study, either NBI
parameters of many different bridges, or different combinations of parameters of one
bridge could be entered using this window. Studying a single bridge with different
parameter combinations may help to assess scour-induced risk level of that bridge,
whereas analyzing different bridges provides a ranking for the severity of their scour
vulnerabilities.
Figure 2.2 NBI data window

22
In NBI Data window, some parameters are entered directly. For example, bypass
length is entered as its actual value in kilometers, or the construction year is directly
written in “Year built” area. However, functional classification of bridge, service
type under bridge, construction design type, and material used in construction,
substructure condition, channel condition, waterway adequacy, and scour
vulnerability have definitions rather than numerical values. Various definitions exist
for each parameter and each definition has a corresponding code for quick
implementation of the model (See Pearson et al., 2002). Therefore, those definitions
are coded accordingly in this window.
As soon as all required NBI date is entered, various analysis assumptions, such as
current year (in which the analysis is carried out), confidence limit for the
calculations of expected age via Equation 2.5, which is initially set to 90% as a
default in the program, K1 and K2 factors, average speed in the bypass route,
occupancy rate, and C1, C2, C3, and C4 unit costs, are defined in another window so
called “Basic Assumptions”. By this way, the necessary data for the analysis are
completed and the analysis can be run. The result of a single bridge is presented in a
window as it is shown in Figure 2.3. Also the results for multiple bridges or multiple
cases are tabulated and can be viewed together in the program.
In the analysis result window, annual scour failure probability (P), annual risk of
scour failure (R), and costs associated with scour failure of a bridge are presented.
Obtaining scour failure risk in monetary values provides a better understanding for
the criticality of bridge scour. By this way, annual risk taken by doing nothing to
scour-critical bridge can be compared with costs associated with scour failure of a
bridge and also cost of countermeasures that can be applied to the bridge and the
bridge site. This will be helpful for selecting the feasible countermeasure for a
scour-critical bridge.

23
Figure 2.3 Analysis result window for a single bridge
2.3 Evaluation of Scour Countermeasures
2.3.1 General
In the absence of extensive and specific data pertinent to bridges and/or the bridge(s)
under consideration, the results of HYRISK model can be used to clarify which
bridges represent the greatest annual expected loss due to failure or heavy damage
due to scour. On the contrary, the model itself is not capable to answer the main
concern of the bridge owners: How much is reasonable to spend on scour
countermeasures to protect a bridge with a known, finite life before scheduled
replacement?

24
The Sour Countermeasures Calculator in the HYRISK model (Pearson et al., 2002)
can be used to answer this question. This question can only be answered if particular
information about a particular bridge site is available. In line with this argument, the
calculator performs its calculations on a single bridge rather than a “set” of bridges
as does the basic HYRISK model.
The Scour Countermeasures Calculator is mainly used to evaluate the economic
feasibility of available scour countermeasures at a particular bridge site. The
analysis used allows better accounting for the costs associated with loss of life and,
knowing the service life of the structure, the time value of money.
The calculator performs its analysis using the results of the basic HYRISK analysis.
However, it is possible to use the calculator itself without analysis results of
HYRISK in case if real required input data is available so as to perform the
economical analysis.
The analysis results are then reviewed, refined, and modified in a seven-step
process, which are defined in the next section.
2.3.2 Scour Countermeasures Calculator
The steps followed in the Scour Countermeasures Calculator are as follows:
1) Step 1: Describe the Bridge
In this first step, the data entered to HYRISK model to calculate the annual failure
probability of the bridge under consideration is initially displayed on the screen
presented in Figure 2.4. The user should change this information if it differs from
what is known about the bridge and further; the basic assumptions (i.e. rebuild cost,
vehicle running cost, etc.) used in the HYRISK methodology can be modified if
required.

25
Figure 2.4 Setting bridge description
It is important to note that the changes made at this step will automatically be
recorded in the active HYRISK database, which means that in the next run of the
database new values for annual failure probability, rebuilt cost, etc. will be
calculated.
2) Step 2: Set Cost Multipliers
As in Step 1, the data entered to HYRISK model to calculate the annual failure
probability of the bridge under consideration is initially displayed on the screen
shown in Figure 2.5 and if more appropriate values than those offered by HYRISK
are known, it should be entered at this stage.
HYRISK Model Input

26
Figure 2.5 Setting cost multipliers
3) Step 3: Quantify Economic Assumptions
The economic assumptions to be used during scour countermeasures economic
analysis are entered at this step. The costs associated with loss of life will be the
product of the values set in the first three fields on the screen presented in
Figure 2.6. The National Bridge Inventory data contains no information which can
be used to derive this cost, so, if it is to be accounted for, it must be quantified. One
reasonable approach is to estimate amounts to be awarded (or settled for) as the
result of legal action. In the case study of this thesis, loss of life is ignored, therefore,
the costs associated with loss of life is out of consideration.
HYRISK Model Input

27
Figure 2.6 Setting economic assumptions
The discount rate is the time value of money (interest) minus inflation during the
remaining life of the bridge. Owing to the fact that, US$ is used as a currency of all
cost calculations, a discount rate of 2%, which is commonly accepted in Turkish
engineering practice, is considered.
The displayed rebuild costs, running costs, and time lost costs are those calculated
by the HYRISK methodology. In case if required, the alternate cost values can be
entered.
4) Step 4: Set the Annual Probability of Failure
Initially, the annual probability of failure due to scour is set to that estimated by
HYRISK, however, as in the previous steps; the values may be adjusted in the
screen shown in Figure 2.7.
Calculated by HYRISK
Model
Costs due to loss of life

28
Figure 2.7 Setting annual probability of failure
5) Step 5: Specify a Remaining Useful Life for the Bridge
In this step, either the remaining useful life for the bridge or the lifetime probability
of failure is specified. For the latter, the remaining useful lifetime will be calculated
by the program automatically.
Using the annual probability of failure specified on the screen given in Figure 2.7,
the probability of failure during that lifetime is calculated using the following
relationships (Pearson et al., 2002):
L
AL PP )1(1 (2.6)
)1log(
)1log(
A
L
P
PL (2.7)
where, PL = probability of failure over the expected life of the bridge, PA = annual
probability of failure calculated by HYRISK or supplied by the modeller, and
L = remaining useful life of bridge (year).

29
Using the equation(s) given above, the calculator automatically generates both a
table and a graph showing the probabilities of failure at five-year intervals up to
100 years, as given in Figure 2.8.
Figure 2.8 Setting useful life of bridge
6) Step 6: Economic Risks
A reasonable measure of resources appropriate for protection of a particular bridge
is the present value benefit of any countermeasure contemplated.
Using the information specified in the previous steps, the present values of the
economic risks of scour failure for the bridge under consideration are shown in
Figure 2.9. For each return period, two values are shown; one accounts for loss-of-
life costs while the other precludes them.

30
Figure 2.9 Presentation of economic risks
The following relationships are used to perform these calculations (Pearson et al.,
2002):
L
RE
i
CC
)1( (2.8)
where, CE = present value of expected rebuilding cost ($), CR = current rebuilding
cost ($), i = discount rate (%), and L = remaining useful life of bridge (year); and
L
L
pii
iM
1
11 (2.9) (2.9)
where, Mp = present value given annual cost multiplier; and
'1 LLE
f
fAp PPCRP
CCPMB (2.10)
(2.10)
where, B1 = present value benefit accounting for loss of life ($), Cf = cost of failure,
including injury and loss of life ($), PA = annual probability of failure without

31
protection, RP = return period protection desired (year), and PL' = probability of
failure over the extended life of the protected bridge; and
'2 LLE
Lf
fAp PPCRP
DCCPMB
(2.10)
where, B2 = present value benefit precluding for loss of life ($) and DL = costs
associated with loss of life ($).
The last step of scour countermeasures economic calculator is used to evaluate the
net benefit and hence benefit/cost ratio of each user-defined scour countermeasure.
The NBI Data do not store any information to derive costs of scour
countermeasures. Therefore, these costs shall be calculated and entered manually to
the program.
The methodology described in this chapter is applied to a case study, which includes
further details of last step of scour countermeasure calculator, and it is presented in
Chapter 3.

32
CHAPTER 3
3. CASE STUDY
The objective of this thesis is to investigate the failure risk of river bridges and
evaluate the feasibility of installing scour countermeasures. For this purpose, a case
study is carried out for the demonstration of this evaluation.
Fol-1 Bridge is selected for this study, which is a highway bridge crossing
Fol Creek.
3.1 Fol Creek Basin and Flood Frequency Analysis
Fol Creek Basin is located in the Black Sea Region which is a flood prone zone in
Turkey. Bahadırlı (No. 2228) flow gauging station, with a catchment area of
191.4 km2, operated by Electrical Power Resources Survey and Development
Administration (EĠE) since 1960 is located near the outlet of the basin. The station is
still in operation, and the maximum flood estimated at this station is 412 m3/s in
1990. The 1990 flood caused extensive damage to the settlement in close vicinity of
Fol Creek, as seen in Figure 3.1. Using a frequency analysis method named
L-moments, Bilen (1999) carried out a uni-variate flood frequency analysis in which
annual maximum flows were considered as a series. Bi-variate flood frequency
analysis of Fol Creek was also carried out by Yanmaz and Günindi (2006) and
Yanmaz et al. (2008) in which annual peak discharges and flood volumes were used
in the frequency analysis using multi-variate probability density functions. Since
uni-variate frequency analysis results are also covered by discharge ranges of the
multi-variate analyses, the analysis conducted by Bilen (1999) is accepted to be
representative for the basin and is used in this study. Out of 12 different probability
distributions, Wakeby distribution was selected as the suitable one. The results of
the flood frequency analysis for Wakeby distribution is presented in Table 3.1,

33
in which Tr is return period and Qi is the discharge corresponding to this return
period.
Figure 3.1 Highway is damaged due to flood (Tuna, 2008)
Table 3.1 Flood frequency analysis for Fol Creek Basin (Bilen, 1999)
Qi Return Period, Tr
(years) Discharge
(m3/s)
Q2 2 56.7
Q5 5 93.3
Q10 10 117.3
Q25 25 145.2
Q50 50 163.8
Q60 60 168.4
Q70 70 172.2
Q80 80 175.4
Q90 90 178.1
Q100 100 180.6
Q150 150 189.6
Q200 200 195.6
Q300 300 203.7
Q400 400 209.1
Q500 500 213.1

34
In a study carried out by Tuna (2008), it is estimated that the maximum discharge
during the passage of 1990 flood is 246 m3/s. He obtained the maximum annual
flows synthetically by Mockus method and he calculated the return period of this
discharge in a range of 10-25 years, where Q100 discharge is 498 m3/s. At this point,
it should be stated that the results of frequency analysis conducted using different
approaches are subject to high levels of uncertainties.
Another important point is that Bahadırlı station is close to the outlet of the basin
and the Fol-1 Bridge is almost at 1.5 km upstream of this station. Within this
distance, additional surface water flow might have joined to the main channel from
the sides. Therefore, the maximum flow occurred at the bridge site may be less than
the maximum flow expected at the station. However, the annual maximum flows
accepted at the station are used in the analyses carried out for the Fol-1 Bridge.
3.2 Determination of Water Surface Profiles
Water surface profile computations are needed to check bridge waterway adequacy
and to decide on degree of bed and bank protection facilities. For the water surface
profile calculations of Fol Creek, HEC-RAS software (Version 3.1.3 released in
2005) (Brunner, 2002) is used in this thesis. HEC-RAS is a well-known hydraulic
analysis software, which is capable of one dimensional steady flow calculations,
unsteady flow simulations, sediment transport calculations, and scour analysis
(Brunner, 2002). Sinuosity of Fol Creek, which is the ratio of thalweg length to
valley length of a river reach under consideration, is calculated as 1.08 using the
information presented in Bilen (1999). According to its sinuosity, the study reach
along Fol Creek is almost straight, so HEC-RAS was used with confidence. To
determine the water surface profiles, cross-sections of Fol Creek are needed, which
are obtained from Bilen (1999) and some of them are modified based on the field
inspections carried out by the author. Furthermore, characteristics of the bridge are
necessary inputs for water surface profile calculations. The cross-section data of
Fol-1 Bridge are also obtained from CoĢkun (1994) and Bilen (1999). Detailed
information of Fol-1 Bridge will be given in Section 3.3.

35
Water surface profiles of Fol Creek are calculated by implementing a mixed regime
steady flow analysis in the software. Calculations are made using energy equation
and momentum equation, which is necessary for mixed flow regime calculations
(Bilen, 1999). For each discharge given in Table 3.1, the corresponding water
surface profile of Fol Creek is calculated and the analysis results for just upstream of
the bridge are tabulated in the Appendix A. Characteristic input data are also
provided in the Appendix A.
3.3 Description of Fol-1 Bridge
The selected bridge for this study, Fol-1 Bridge, was constructed in 1979. The
bridge is located on Route 61-77, which is the road between Vakfıkebir and Tonya
counties in Trabzon (See Figure 3.2). The route is indicated as green line and the
bridge is highlighted inside the blue oval in Figure 3.3. Actual location of the bridge
is 1+442 km upstream from the centre of Vakfıkebir (along the roadway) and
1+600 km upstream from the outlet of the Fol Creek Basin (along the river)
(CoĢkun, 1994), (Yanmaz and Selamoğlu, 2010).
Figure 3.2 A view of the study bridge from downstream
Vakfıkebir
Tonya

36
Figure 3.3 Map of the case study area
Fol-1 is a simple spanned and concrete tee beam bridge. The bridge slab is 50.1 m
long and 10.40 m wide. The bridge is supported by vertical wall abutments on both
sides and intermediary piers as shown in Figure 3.4, which presents the longitudinal
section of it. There are two groups of cylindrical piers in between the abutments
(See Figure 3.5). Each pier group is composed of 4 cylindrical piers having 1 m
diameter (See Figure 3.6). The bridge deck is 58° skewed to the flow, whereas the
piers and abutments are aligned with the flow (See Figure 3.7).
N

37
Figure 3.4 Longitudinal section of the bridge (from upstream)
Tonya Vakfıkebir
Left Abutment Right Abutment Left Pier Right Pier

38
Figure 3.5 General view of Fol-1 Bridge
Figure 3.6 Right piers and abutment (Vakfıkebir side)
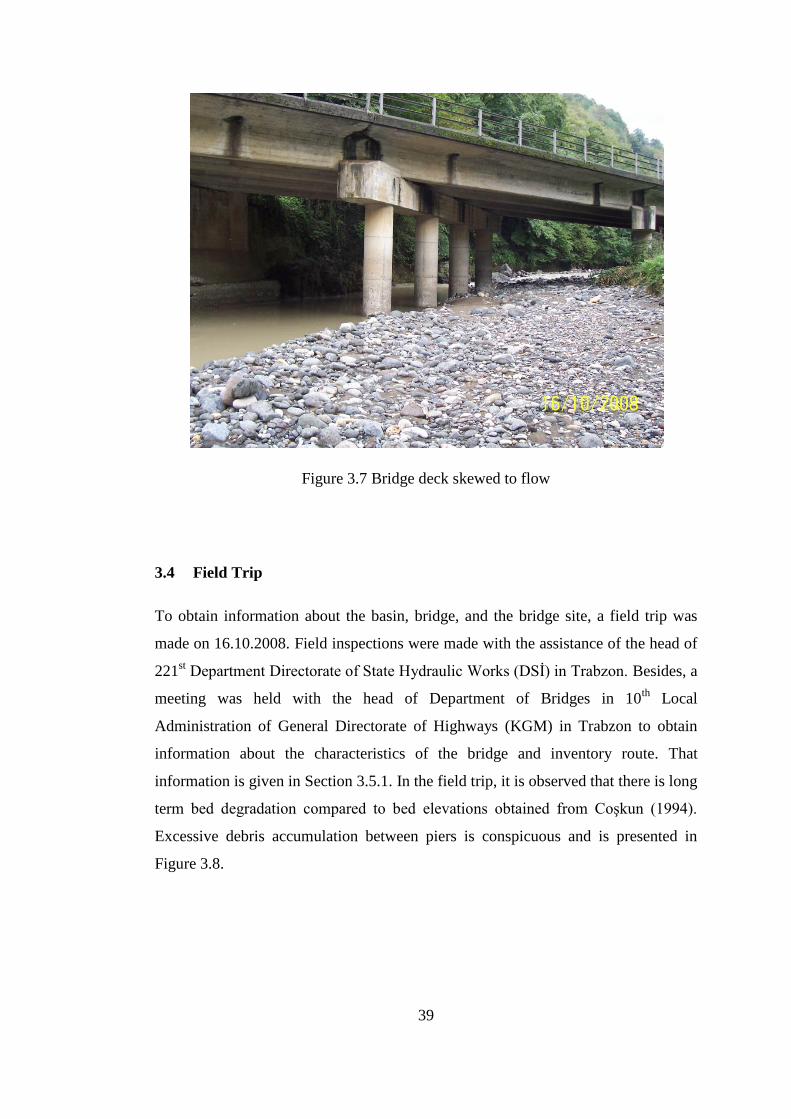
39
Figure 3.7 Bridge deck skewed to flow
3.4 Field Trip
To obtain information about the basin, bridge, and the bridge site, a field trip was
made on 16.10.2008. Field inspections were made with the assistance of the head of
221st Department Directorate of State Hydraulic Works (DSĠ) in Trabzon. Besides, a
meeting was held with the head of Department of Bridges in 10th
Local
Administration of General Directorate of Highways (KGM) in Trabzon to obtain
information about the characteristics of the bridge and inventory route. That
information is given in Section 3.5.1. In the field trip, it is observed that there is long
term bed degradation compared to bed elevations obtained from CoĢkun (1994).
Excessive debris accumulation between piers is conspicuous and is presented in
Figure 3.8.

40
Figure 3.8 Excessive debris accumulations between piers
In addition, inspections on the channel stability indicators were made in the field
trip. The information gathered is given in Section 3.5.2.2. Observations made on the
bridge site are also used in scour countermeasure determinations. In this thesis,
analyses are carried out in 2009, and it is assumed that the observations made in the
field trip are still valid in 2009.
3.5 HYRISK Parameters of the Case Study
In the risk-based model, NBI parameters are needed as mentioned in Section 2.2.1.
Those parameters and their definitions for this study are given in the subsequent
sections. Then, analysis assumptions will be given. The definitions and
corresponding codings of those parameters are based on Pearson et al. (2002).

41
3.5.1 NBI Parameters Related to Fol-1 Bridge
Functional classification: functional classification of the inventory route,
which is Route 61-77 in the study, is defined as “rural principle arterial –
interstate” based on the specifications of FHWA (1989). Coded as 01.
Type of service: service type on the bridge is highway and under the bridge is
waterway. Coded as 1 and 5, respectively.
Average daily traffic: previous years’ ADT values are taken from the
10th
Local Administration of General Directorate of Highways (KGM) in
Trabzon in 2008. By making linear extrapolation, the ADT value in 2009 is
estimated as 1295 vehicles/day. Coded as 001295.
Average daily truck traffic: based on the information taken from KGM,
ADTT is estimated to be 158 trucks/day, which is 12% of ADT.
Coded as 12.
Construction type: this parameter stands for the material used in the
construction, which is concrete continuous for Fol-1 Bridge. Coded as 2.
Structure design: design type of this bridge is tee beam. Coded as 04.
Structure length: this is the length of bridge deck and is 50.1 m, as
mentioned before. Coded as 000501.
Deck width: width of the bridge deck is 10.40 m. Coded as 0104.
Bypass length: in case of bridge closure, a bypass route is determined, which
is a roadway parallel to Route 61-77 and passing through villages between
Vakfıkebir and Tonya. Bypass route is indicated as the red line in Figure 3.3
and detouring is between the red arrows on the map. The additional length is
measured as 325 m, from 1/25000 scaled map of the study area. But in
HYRISK, the minimum acceptable bypass length is 1 km, therefore bypass
length for this study is assumed as 1 km. Coded as 001.

42
3.5.2 Substructure and Channel Condition, Waterway Adequacy, and Scour
Criticality of Fol-1 Bridge
Four NBI parameters that are not mentioned in the previous section; substructure
and channel condition, waterway adequacy, and scour criticality are explained in
this section.
3.5.2.1 Substructure Condition
Physical condition of the structural components of a bridge may be estimated by
field inspections and monitoring, which was handled by visual inspections in the
field trip. Although some minor cracks and deterioration have been observed, the
components of the bridge were still sound. Therefore, the substructure components
are said to be in fair condition, which is coded as 5 (Pearson et al., 2002).
3.5.2.2 Channel Condition
Assessment of the channel stability condition is carried out using channel stability
indicators. Based on the observations during the field trip, using Table 2.7, the
indicators for Fol-1 Bridge site are determined:
1. According to the study carried out by CoĢkun (1994), the bed material is
coarse sand with a median grain size of D50 = 0.75 mm. Possible deviations
from this value, as a result of progression of annual floods, were ignored and
this median size was used in the computations of the critical bed shear stress
and scour depths at bridge elements.
2. Average bank slope is 2.5H:1V on Vakfıkebir side where it is almost
15H:1V (See Figure 3.2) on Tonya side.
3. There is a medium band of woody vegetation (See Figure 3.9).
4. Some bank cutting exists, less on Tonya side, more on Vakfıkebir side.
5. Mass wasting is observed and channel width is quite irregular (See
Figure 3.10 for the upstream of the bridge).
6. Some bar development is observed without vegetation.

43
7. High debris accumulation exists, especially between piers (See Figure 3.8).
8. Obstructions and flow deflectors cause potential minor bank erosion.
9. Channel bed material is loose and almost all material size is less than 4 mm
according to grain size distribution obtained from CoĢkun (1994).
The assumption made in item 1 is also applicable for grain size distribution.
10. The critical bed shear stress, τc, for D50 < 1 mm can be obtained from
Equation (3.1) (Yanmaz, 2002).
24.1
500125.00115.0 Dwc (3.1)
where, τc = critical bed shear stress (Pa), ρw = water density (kg/m3), and
D50 = median grain size (mm). With this information, τc is calculated as
0.394 Pa, which is relatively smaller than the bed shear stresses occuring
under various discharges which are to be discussed in Section 3.8.1. Shear
stress ratio is, therefore, much greater than 2.5.
11. Bridge piers and abutments are almost aligned with the approach flow.
12. Upstream of the bridge is very close to a meander impact point as presented
in Figure 3.9.
13. Channel is constricted about 50% in close vicinity to the bridge.
The indicators defined above are rated using Table 2.7 and an overall rating is
obtained for the channel stability. Ratings are presented in Table 3.2. Weighted
ratings are obtained as the product of rating of each indicator and the corresponding
weight, which is tabulated in Table 2.8.

44
Table 3.2 Rating of stability indicators in close vicinity to Fol-1 Bridge
No Stability Indicator Rating Weighted
Rating
1 Bank soil texture and coherence 11 6.6
2 Average bank slope angle 5 3.0
3 Vegetative bank protection 4 3.2
4 Bank cutting 6 2.4
5 Mass wasting or bank failure 7 5.6
6 Bar development 5 3.0
7 Debris jam potential 9 1.8
8 Obstructions, flow deflectors, and sediment traps 5 1.0
9 Channel bed material consolidation and armoring 11 8.8
10 Shear stress ratio 12 12
11 High flow angle of approach to bridge or culvert 2 1.6
12 Bridge or culvert distance from meander impact point 12 9.6
13 Percentage of channel constriction 9 7.2
OVERALL RATING 65.8
The overall rating is obtained as 65.8 for the channel stability condition. Using
Table 2.9, this rating can be described as fair. In HYRISK, fair condition is
explained as “the primary structural components are sound but may have minor
section loss, cracking, spalling, or scour” (Pearson et al., 2002). Furthermore, bank
protection is eroded and embankment has damage. This condition is coded as 5 in
HYRISK.

45
Figure 3.9 A view of the bridge site from its upstream
It is indicated that almost all of the bed material is smaller than 4 mm in diameter.
However, very coarse material is observed at the bridge site as presented in
Figure 3.10. The photograph presented in the figure is taken during the field trip,
which was made in the low-flow season of Fol Creek. In high flow season, upstream
bed and bank material is transported through downstream of the river. Then, in
low-flow season, temporary aggradation coarse upstream material occurs, whereas
the fine upstream material continuously transported. As flow conditions change,
irregularly accumulated coarse material is transported. Therefore, the coarse material
at the bridge site is expected to be transported in the next high-flow season.
Flow

46
Figure 3.10 Mass wasting and aggradation in the upstream of Fol-1 Bridge
3.5.2.3 Waterway Adequacy
According to water surface profile calculations tabulated in Appendix A,
overtopping is not expected at the bridge even for Q500 discharge (213.1 m3/s). Also
based on the information obtained from 10th
Local Administration of General
Directorate of Highways, no overtopping was observed at Fol-1 Bridge since it was
constructed. As mentioned before, the maximum discharge recorded at Bahadırlı
Station is 412 m3/s, which is much greater than Q500 discharge. Even at this
maximum discharge, no overtopping was observed. Therefore, the overtopping
frequency is said to be remote with a return period greater than 100 years (See
Table 2.3).
Waterway adequacy is coded according to overtopping frequency and functional
classification together. Remote chance of overtopping frequency and rural principle
arterial – interstate roadway is coded as 9 in HYRISK. In this study, although
overtopping frequency of Fol-1 Bridge is obviously remote, to be able to observe the
effect of waterway adequacy on failure risk, slight and occasional chance of
overtopping are also considered. The expected effect of waterway adequacy will be

47
discussed in Section 3.6.1. Together with the functional classification of
Route 61-77, slight and occasional chance of overtopping result in waterway
adequacy codes 8 and 4, respectively.
3.5.2.4 Scour Criticality
Scour criticality of a bridge is the most important parameter for the assessment of
the risk of scour failure. As mentioned before, channel and substructure conditions
of a bridge are quite assistive for evaluating the scour criticality. However, in this
study, as indicated in the previous section, risk of the scour failure of Fol-1 Bridge is
studied for different combinations of waterway adequacy and scour criticality. As
presented in Table 2.6, scour criticality codes are ranging between 0 – 9.
Considering the conditions of Fol-1 Bridge, the analysis is carried out for scour
criticality codes: 2, 3, 4, 5, 7, and 8. In Section 3.6.1, why some intermediary codes
are discarded will be discussed, and effect of scour criticality on failure risk will be
evaluated.
3.5.3 Analysis Assumptions
As indicated before, together with the NBI parameters, some assumptions which are
included in the risk-based model (Equation (2.2)) are determined for the case study.
These assumptions and their explanations are listed below:
Current year: the year when the analysis is carried out. All types of analyses
are carried out in 2009.
Risk adjustment factor (K): K=K1.K2
K1, bridge type factor is 1.0 for simple spanned bridges. K2, foundation type
factor has a default value of 1.0 (Pearson et al., 2002). Therefore, K is
obtained as 1.0.
Detour speed (S): based on the information gathered from KGM, allowable
speed in the bypass route is 50 km/hr.
Occupancy rate (O): occupancy rate is assumed as 3 adults/vehicle based on

48
the information gathered from KGM.
Unit rebuilding cost (C1): cost of rebuilding the same bridge is obtained by a
detailed calculation using 2009 unit costs and presented in Section 3.5.3.1.
Unit rebuilding cost is calculated as 615.53 $/m2.
Unit cost of running vehicle (C2): this cost is obtained by estimating the
average fuel consumption and depreciation of the vehicle (Yanmaz and
Selamoğlu, 2010). It is assumed as 0.20 $/km.
Unit cost of time per adult and truck (C3 and C4): value of time for people
and for trucks for commercial purposes is uncertain for the study area.
Therefore, the default values proposed by HYRISK are used in this study,
which reflect average values for the United States. C3 is assumed as 8 $/hr
and C4 is assumed as 30 $/hr. However, a comprehensive survey is needed in
future to obtain more realistic values according to region-specific conditions
in Turkey.
Together with these assumptions listed above, detour duration (d) and cost multiplier
(M) are determined for the analysis. Based on Table 2.2, for ADT of
1295 vehicle/day, d = 365 days and M = 1.5. This means that in case of bridge
failure, the bridge should be replaced in 365 days, and this replacement would result
in 50% higher rebuilding cost.
3.5.3.1 Unit Rebuilding Cost (C1) Calculations
In case of failure of bridge or irreversible damage to bridge, it should be replaced.
Unit rebuilding cost in risk calculations is found by calculating the cost of
constructing the same bridge at the same location. A detailed study has been carried
out with the assistance of bridge design engineers in Yüksel Domaniç Engineering
Limited Company, to obtain the rebuilding cost of Fol-1 Bridge. Calculations are
based on the fact that if the bridge is failed, exactly the same bridge will be replaced
there. Items related to construction of a bridge are defined, and their dimensions are
obtained from the longitudinal section of the bridge shown in Figure 3.4. Also, some
necessary information on these dimensions is gathered from the headquarters of

49
KGM in Ankara. Calculations are made using 2009 unit prices of the items, which
are defined by KGM. An exchange rate of US$/TL of 1.50 is considered.
In Tables 3.3 and 3.4, calculations for the major bridge components, such as
superstructure (deck), cap on top of the piers, piers, abutments, and foundation
(footing) under the piers are considered. Multiplying the area, length/height, and
quantity of the component, a total volume of concrete is obtained. Weight of
reinforcement per cubic meter of concrete used in these components is also
presented. Concrete volume and reinforcement weight of the items are multiplied
with their corresponding unit prices of installation. Summation of these costs gives
the total cost of concrete and reinforcement work in these items. The total costs are
presented in Table 3.4.
Table 3.3 Concrete and reinforcement quantities used in the major bridge
components
Item
Cross-section/
Plan (*)Area
(m2)
Length/
Height (*)
(m)
Quantity Volume
(m3)
Reinforcement
(kg/m3)
Superstructure 5.100 50.1 - 255.51 99.25
Cap 1.200 13.4 2 32.16 78.40
Pier 0.785 4.6 8 28.90 78.40
Abutment - - - 358.00 117.70
Foundation(*) 36.420 2 2 145.68 39.25
Table 3.4 Costs of concrete and reinforcement work in major bridge components
Item
Concrete
Volume
(m3)
Pose
No.
Unit
Price
($)
Reinf.
Weight
(tons)
Pose
No.
Unit
Price
($)
Total
Cost
($)
Superstructure 255.51 16.133/K-1 129.79 20.44 23.015/K 299.37 39,282.59
Cap 32.16 16.133/K-2 161.87 2.57 23.015/K 299.37 5,975.22
Pier 28.90 16.133/K-2 161.87 2.31 23.015/K 299.37 5,369.68
Abutment 358.00 16.133/K-2 161.87 42.96 23.015/K 299.37 70,811.60
Foundation 145.68 16.133/K-2 161.87 11.65 23.015/K 299.37 27,069.35

50
In addition to concrete and reinforcement work costs tabulated above, calculations
for cost of materials, such as railing, expansion joint, pavement, deck water
proofing, elastomeric bearing are made. Also costs associated with transportation of
cement and reinforcement, as well as excavation for footings, which is assumed to
be approximately double of the foundation volume considering certain excavation
slope inclination, are calculated by multiplying their amounts with corresponding
unit prices. These items and their costs are given in Table 3.5.
Table 3.5 Costs of materials in bridge construction
Item Amount Unit Pose
No.
Unit Price
($)
Total
Cost ($)
Railing 9.00 tons 23.176/K 2,288.60 20,597.40
Expansion Joint 21.00 m 28.010/K 312.27 6,557.61
Pavement 521.04 m2 4475 25.95 13,520.99
Cement Supply 266.58 tons 3000 86.00 22,925.88
Deck Water Proofing 521.04 m2 3650 10.15 5,290.12
Elastomeric Bearing 45.00 d3 3805 50.41 2,268.32
Foundation Excavation 341.55 m3 14.124 54.49 18,610.28
Reinforcement Supply 79.93 tons 3790 508.00 40,604.44
Total costs presented in Tables 3.4 and 3.5 are added up and total cost is obtained as
$278,883. The cost becomes $320,716 by addition of 15% contingencies. Dividing
this total cost by the bridge deck area, which is 521.04 m2, unit rebuilding cost, C1 is
found as 615.53 $/m2.
3.6 Implementation of the Risk-Based Model for the Case Study
All necessary NBI data and analysis assumptions are gathered. At this stage, the risk
of scour failure of Fol-1 Bridge is analyzed via HYRISK software. The results of the
analysis are presented in Table 3.6.

51
Rebuilding cost of the bridge is calculated from the software as $481,074. In the
previous section, total rebuilding cost is calculated as $320,716. This difference is
due to effect of emergency cost multiplier (M), since rebuilding cost is multiplied
with M = 1.5 based on the ADT value of Fol-1 Bridge. Additional running cost in
detouring is $94,535 and additional time cost for people and trucks together is
$233,690. Additional time cost is minimized in the case study, since allowable speed
is used in the model, rather than average speed. Summation of these costs give the
total cost associated with the bridge failure and is found as $809,299.
Table 3.6 Risk of scour failure of Fol-1 Bridge
Waterway
Adequacy
Scour
Criticality
Trial
Failure
Probability
Annual
Failure
Probability
Risk
($/yr)
Expected
Age (yr)
4 2 0.628 0.074 59,792 2.3
4 3 0.398 0.074 59,792 4.5
4 4 0.228 0.074 59,792 8.9
4 5 0.031 0.031 25,412 72.2
4 7 0.313 0.074 59,792 6.1
4 8 0.014 0.014 11,654 > 100
8 2 0.483 0.074 59,792 3.5
8 3 0.267 0.074 59,792 7.4
8 4 0.137 0.074 59,792 15.6
8 5 0.006 0.006 5,244 > 100
8 7 0.202 0.074 59,792 10.2
8 8 0.004 0.004 2,978 > 100
9 2 0.457 0.074 59,792 3.8
9 3 0.248 0.074 59,792 8.1
9 4 0.127 0.074 59,792 17.0
9 5 0.005 0.005 4,225 >100
9 7 0.187 0.074 59,792 11.1
9 8 0.003 0.003 2,525 > 100
In Table 3.6, the analysis results are given for 18 combinations of waterway
adequacy and scour criticality. Trial failure probabilities are obtained from

52
Table 2.6. Expected age of the bridge is calculated by Equation (2.5). In Table 3.6,
“> 100” stands for very long expected ages. In the conditions where expected age is
less than 30, which is the actual age of bridge, the trial failure probability is
modified to obtain annual failure probability. Otherwise, annual failure probability
remains the same as trial failure probability. The annual failure risk is calculated
using modified annual failure probability, which is calculated by setting the X90 age
to the actual bridge age, 30 years in Equation (2.5). Since the actual bridge age is
used in the equation, the annual failure probability obtained is constant, and it is
0.074. That is why the risk does not change at certain scour criticality ratings where
the expected bridge age is less than the actual bridge age, although their trial failure
probabilities vary. Further discussions for the obtained results are given in
Chapter 4.
3.6.1 Sensitivity Analysis
To evaluate the effect of waterway adequacy on risk computation, various waterway
adequacy codings are considered. In fact, such evaluations should not be carried out
considering only the present circumstances. Possible alterations in channel
conditions may occur in the future especially during or after the passage of severe
floods, and mis-use of the river. Therefore, it may be possible to have various
coding levels for waterway adequacy. That is why different waterway adequacies
are considered in the analysis. Codings corresponding to remote, slight, and
occasional chance of overtopping are considered. Frequent chance of overtopping
leads to same results as occasional chance gives, therefore it is not necessary to
present in the analysis.
Similarly, scour criticality of the bridge may change in the future, may be because of
long term degradation, short term irregular aggradation around the bridge, which
may alter characteristics of sediment-laden flow, nearby channel mining activities,
etc. Therefore possible criticality codings are analyzed in the study. If the bridge is
closed to traffic or will be closed in future, HYRISK does not calculate a failure risk
since the bridge will be replaced immediately. Therefore, codes 0 and 1 are

53
discarded. Code 6 stands for unknown/unassessed foundations, which is an invalid
condition for Fol-1 Bridge, so it is excluded from the analysis. Scour is observed
around the study bridge foundations, so the bridge is somehow scour vulnerable.
Even if scour countermeasures are installed, excellent condition of scour criticality
(coded as 9) cannot be reached in the future, and it is excluded from the analysis.
Although the bridge has not failed, it still holds a probability of failure because of
possible aforementioned alterations in its vicinity. Therefore, implementation of
proper scour countermeasures would decrease failure risk.
As presented in Table 3.6, for some scour criticality levels, risk of failure changes as
waterway adequacy changes. In Figure 3.11, the relation between waterway
adequacy and failure risk is presented for different scour criticality, S.C., levels.
Figure 3.11 Risk versus waterway adequacy for different scour criticalities
For scour criticality codes 2, 3, 4, and 7, risk is constant and is $59,792 per year.
Rate of decrease in risk of failure between waterway adequacy codings 8 and 9 is
almost equal for scour criticality ratings 5 and 8. However, the mentioned rate
between waterway adequacies 4 and 8 is considerably different for presented scour
0
10.000
20.000
30.000
40.000
50.000
60.000
7 8 9
Ris
k (
$/y
r)
Waterway Adequacy Code
S.C=5
S.C.=8
S.C.=2,3,4,7
4

54
criticalities. It is deduced that, for good condition of scour criticality, effect of
waterway adequacy on failure risk is relatively small.
3.7 Scour Calculations
Risk of scour failure of Fol-1 Bridge is calculated for various scour criticality values
above. Although scouring is a complicated mechanism due to complexity of the
river flow, acceptable scour determination can be made using HEC-RAS software.
Hydraulic design part of the software is utilized for bridge scour calculations. In this
study, the effect of contraction scour is ignored.
1) Pier scour: for the pier scour computations, additional information about the
bridge site should be determined. Pier shape is indicated as group of
cylinders. In the computations, equivalent pier length is used, which is the
total length of four piers for zero angle of attack (Richardson and Davis,
2001). Together with median grain size, diameter of grain of which 90% is
finer (D90) is needed, and it is 2.38 mm in close vicinity of Fol-1 Bridge
(CoĢkun, 1994). Pier scour computations are made using both CSU and
Froehlich equations. Since CSU equation gave higher results than Froehlich,
it is selected as the governing equation for pier scour computations. It is
given by:
43.0
1
65.0
1
4321
1
0.2 Fry
aKKKK
y
ypppp
s (3.2)
where, ys = scour depth (m), y1 = flow depth just upstream of the pier (m),
Kp1 = correction factor for pier nose shape, Kp2 = correction factor for angle
of attack of flow, Kp3 = correction factor for bed condition, Kp4 = correction
factor for bed armoring, a = pier width (m), and Fr1 = Froude number just
upstream of pier. The value of Kp1 is 1.0 for cylindrical shape, whereas Kp2 is
1.0 for zero angle of attack. Furthermore, Kp3 is 1.1 for plane bed to medium
dunes, and Kp4 is 1 for the grain size around bridge (Richardson and Davis,
2001). The values of y1 and Fr1 are automatically gathered from water

55
surface profile calculations, and then ys is computed from Equation (3.2).
Pier scour computation results are presented in Table 3.7.
2) Abutment scour: local scour around abutments can be computed using
Froehlich or HIRE equations. There is a limitation for the use of HIRE
equation; the equation is applicable for La/ya1 > 25, where La = projected
abutment length perpendicular to flow direction and ya1 = approach flow
depth. In Fol-1 Bridge case, this limitation is not satisfied, therefore
Froehlich equation, given in Equation (3.3), is used in the computations:
127.2 61.0
43.0
21 a
a
aa
a
s Fry
LKK
y
y (3.3)
in which, ys = scour depth (m), ya = average flow depth on floodplain (m),
Ka1 = coefficient for abutment shape, Ka2 = coefficient for angle of
embankment to flow, L' = length of active flow obstructed by embankment
(m), and Fra = Froude number just upstream of abutment. Ka1 is 1.0 for
vertical wall and Ka2 is 1.0 for 90° angle of approach flow with the abutment
axis. The values of ya and Fra are automatically calculated for each flow
profile and then ys is computed using Equation (3.3). Abutment scour
computation results are also presented in Table 3.7.

56
Table 3.7 Scour depths around bridge piers and abutments
Qi
Scour Depth, ys (m)
Left Pier
(Tonya side)
Right Pier
(Vakfıkebir side)
Right Abutment
(Vakfıkebir side)
Q2 - 2.68 -
Q5 - 2.93 -
Q10 - 3.06 -
Q25 0.94 3.18 -
Q50 1.16 3.26 -
Q60 1.23 3.27 -
Q70 1.29 3.29 -
Q80 1.33 3.30 0.02
Q90 1.36 3.31 0.02
Q100 1.39 3.32 0.31
Q150 1.49 3.35 0.37
Q200 1.54 3.37 0.54
Q300 1.62 3.40 0.61
Q400 1.66 3.42 0.70
Q500 1.69 3.43 0.77
In the computations, scouring is not observed even under Q500, at the left abutment,
which is at Tonya side of Fol-1 Bridge. Also there is no scouring under the left pier
and the right abutment for the first three and seven discharge profiles, respectively.
The maximum scour depth for the left pier, which is 1.69 m for Q500, even will not
endanger the footing of the pier (See Figure 3.4). Scouring is most critical under the
right pier and scour depths are severe. Detailed discussion on bridge scouring is
given in Chapter 4 and scour-related results obtained from HEC-RAS for the right
pier are tabulated in Appendix A.
3.8 Scour Countermeasures for Fol-1 Bridge
To mitigate the severe results of excessive scouring, scour countermeasures can be
installed around bridge foundations. According to Richardson and Davis (2001), a
suitable countermeasure should be installed when the scour criticality code of a

57
bridge is equal to or less than 3. Discussions on the scour criticality of Fol-1 Bridge
will be given in Section 4.2. Briefly, scour criticality of the bridge is 2, 3, and 4
corresponding to different flood profiles and scour criticality of the bridge is
originated from the right pier group. Therefore scour countermeasures should be
considered for this bridge and they should be designed only for the right pier.
A case study on bridge scour countermeasures has been conducted by Özdemir
(2003). He studied design methods of various countermeasures against local scour
around bridge piers and abutments, stream bed degradation, meander migration, and
erosion of banks. Rock riprap, grout filled mattresses or bags, gabion boxes,
articulated concrete block system (ACB), and concrete armor units, such as A-Jacks
and Toskanes are proposed as pier scour countermeasures. Riprap is natural rock
installed around the pier or footing under the pier. Grout filled bags are bags made
of canvas and filled with grout of Portland cement. These bags are produced in
specific dimensions and are placed around piers. Gabion boxes are interconnected
wire mesh boxes filled with rock of suitable size, which may be acquired in site of
installation. ACB and concrete armor units are pre-cast concrete units to protect
bridge from local scouring, which may be used in case of unavailability of riprap of
sufficient size. The advantage of concrete armor units is the interlocking of units
providing stability to them. However, they are expensive.
For the pier scour in Fol-1 Bridge, riprap, grout filled bags, and gabion boxes are
selected as scour countermeasures from view points of local site conditions, ease in
installation, and workmanship. Riprap is the most common countermeasure among
the alternatives mentioned, due to availability of material and installation
convenience. A photograph of riprap around a bridge pier is given in Figure 3.12.
Grout filled bags are used in case of absence of riprap close to the bridge site.
Although they are not used in Turkish practice to date, grout filled bags specifically
considered as a feasible alternative because of ease of installation, less production
time, and less cost. An application of grout filled bags around bridge abutment is
presented in Figure 3.13. Gabion boxes are generally used in rivers where bed shear
stress is high and when there is no riprap in large diameters available in site, or it is

58
economically infeasible to use such large riprap. An example of gabion box use
around bridge piers is presented in Figure 3.14.
Figure 3.12 An application of riprap around bridge piers (Newsline, 2007)
Figure 3.13 An application of grout filled bags around bridge abutment
(Lagasse, 2002)

59
Figure 3.14 Use of gabion boxes around bridge piers
(Red Star Wire Mesh Factory, 2006)
For Fol-1 Bridge, scour countermeasure computations are carried out according to
the procedure followed by Özdemir (2003). Calculations of riprap, grout filled bags,
and gabion boxes are carried out and presented in the subsequent sections. In the
calculations, 1 US Dollar is taken as equal to 1.5 Turkish Liras and 2009 unit prices
are used. Also, the total costs of these countermeasures include 15% contingencies.
3.8.1 Riprap Calculations
As a scour countermeasure, riprap is mostly installed on a geotextile filter cloth.
The geotextile is necessary to prevent erosion of the fine material below the riprap
layer (GISHydro, 2004). In the calculations, first of all, riprap size to be used should
be selected. However, there is no universally accepted single criterion for the design
discharge of riprap size computation. It normally changes according to the location
of the bridge, traffic intensity, importance of the structure, etc. that is why various
alternatives were considered for riprap size for Qi ≥ Q50 up to Q500 (See Table 3.8).
Median riprap size diameter is calculated according to HEC-23 criteria and
presented below (Lagasse et al., 2001):

60
g
uKD
pp
r2
)(692.0
2
50 (3.4) (3.4)
in which, Dr50 = median riprap size diameter (m), Kp = coefficient for pier nose
shape, which is 1.5 for round nose shape, up = velocity just upstream of pier (m/s),
g = gravitational acceleration (m/s2), and Δ = relative density, which is 1.65 for rock
riprap. For the discharges Q50 to Q500, up values for right pier are obtained by
HEC-RAS and then using Equation (3.4), Dr50 values are calculated and presented in
Table 3.8.
Table 3.8 Median riprap size calculations
Qi up (m/s) Dr50 (m)
Q50 7.21 2.50
Q60 7.27 2.54
Q70 7.32 2.58
Q80 7.36 2.61
Q90 7.39 2.63
Q100 7.43 2.66
Q150 7.54 2.73
Q200 7.62 2.79
Q300 7.72 2.87
Q400 7.78 2.91
Q500 7.84 2.96
As tabulated above, necessary riprap diameter is too high. Using such large ripraps
would be economically infeasible. Moreover, ripraps with such diameters are almost
impossible to find in vicinity of the bridge. At this stage, bed shear stress of the river
should be calculated to evaluate whether using smaller ripraps would be sufficient to
protect the bridge from excessive scouring. Bed shear stress is calculated for Q100
and Q500 discharges using Equation (3.5).
fh SR0 (3.5) (3.4)

61
where, τ0 = bed shear stress (Pa), γ = specific weight of water (N/m3), Rh = hydraulic
radius, Sf = energy grade line slope. From Equation 3.5, τ0 is calculated as 483 Pa for
Q100 and as 516 Pa for Q500. Since bed shear stress of the river is too high, smaller
size ripraps cannot resist the force of water flow. Moreover, use of concrete blocks
in the channel bed is appropriate up to τ0 ≈ 60 kgf/m2 (588 Pa) and gabion boxes are
appropriate up to τ0 ≈ 150 kgf/m2 (1472 Pa) (Erkek and Ağıralioğlu, 2010).
Therefore, riprap is not an appropriate alternative for scour countermeasures to be
used at Fol-1 Bridge.
3.8.2 Grout Filled Bag Calculations
Grout filled bags are made of canvas bags and filled with grout. Unit prices for the
grout filled bag placement items against pier scouring are listed in Table 3.9. The
authorities defining those unit prices are also indicated in the table below.
Table 3.9 Unit prices for grout filled bag placement (Özdemir, 2003 and
Birimfiyat.com, 2010)
Item
No.
Pose
No. Explanation Unit
Unit
Price ($)
1 14.100 (KGM) Excavation of any type of soil around
bridges manually except rocks m
3 9.353
2 07.006/14 (DSĠ) Transportation of excavation (2 km) ton 1.053
3 10.022/K (KGM) Cost of grout m3 9.027
4 Market price Canvas m2 1.062
Grout filled bags are placed around the right pier, and they are shown with canvas
hatch in Figure 3.15. The bags are placed all around the footing from channel bed to
bottom elevation of the footing (dotted in Figure 3.15) and on top of the footing
from channel bed elevation to top elevation of the footing. Dimensions of the bags
used are 1.2x0.9x0.3 m and 2.4x0.9x0.3 m (length, width, thickness), which are
indicated as “A” and “B”, respectively (Özdemir, 2003). The area of grout filled bag

62
installation is shown in Figure 3.15 in which ys is the depth of scour. Number of
bags in depth and area are calculated for around and on top of the footing as
presented in Table 3.10.
a) Plan view
b) Section a-a
Figure 3.15 Details of grout filled bag placement
Total volume of excavation is calculated as the summation of volume of grout filled
bag placement on top of and around the footing. On top of the footing, area of
excavation is 32.86 m2 and depth of soil is 1.05 m. Therefore, the volume on top of
1 m
1.05 m
12 m
1 m
4.8 m 4.8 m
2 m 2 m ys
Channel bed elevation
1 m
3 m 1 m
10m
12 m
1 m
21.8 m
4.8 m 4.8 m
a
4.5 m
4.5 m
a
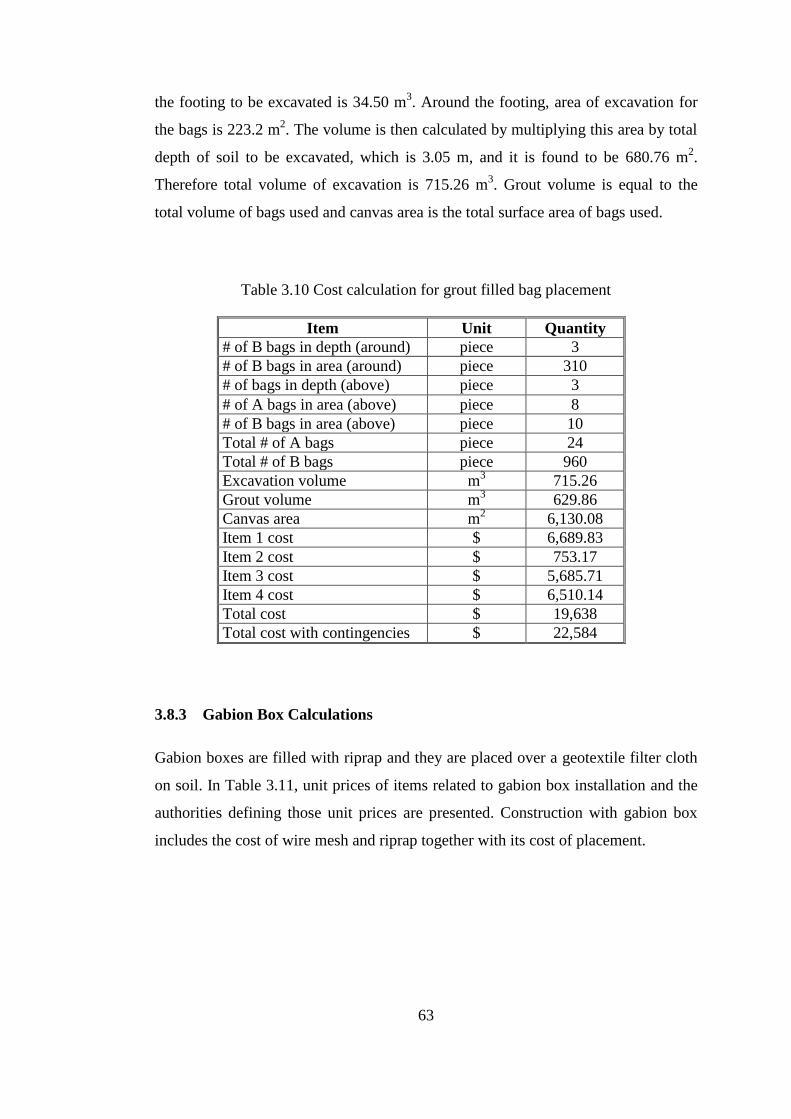
63
the footing to be excavated is 34.50 m3. Around the footing, area of excavation for
the bags is 223.2 m2. The volume is then calculated by multiplying this area by total
depth of soil to be excavated, which is 3.05 m, and it is found to be 680.76 m2.
Therefore total volume of excavation is 715.26 m3. Grout volume is equal to the
total volume of bags used and canvas area is the total surface area of bags used.
Table 3.10 Cost calculation for grout filled bag placement
3.8.3 Gabion Box Calculations
Gabion boxes are filled with riprap and they are placed over a geotextile filter cloth
on soil. In Table 3.11, unit prices of items related to gabion box installation and the
authorities defining those unit prices are presented. Construction with gabion box
includes the cost of wire mesh and riprap together with its cost of placement.
Item Unit Quantity
# of B bags in depth (around) piece 3
# of B bags in area (around) piece 310
# of bags in depth (above) piece 3
# of A bags in area (above) piece 8
# of B bags in area (above) piece 10
Total # of A bags piece 24
Total # of B bags piece 960
Excavation volume m3 715.26
Grout volume m3 629.86
Canvas area m2 6,130.08
Item 1 cost $ 6,689.83
Item 2 cost $ 753.17
Item 3 cost $ 5,685.71
Item 4 cost $ 6,510.14
Total cost $ 19,638
Total cost with contingencies $ 22,584

64
Table 3.11 Unit prices for gabion box placement (Dursun, 2008 and Birimfiyat.com)
Item
No. Position No. Explanation Unit
Unit
Price ($)
1 14.100 (KGM) Excavation of any type of soil around
bridges manually except rocks m
3 9.353
2 07.006/14 (DSĠ) Transportation of excavation (2 km) ton 1.053
3A 23.KH/5-2
(KHGM)
Construction with gabion box of
2.0x1.0x1.0 m size piece 109.610
3B 23.KH/5-4
(KHGM)
Construction with gabion box of
3.0x1.0x1.0 m size piece 168.270
4 07.006/35 (DSĠ) Transportation of riprap (11 km) m3 7.853
5 Market price Placement of geotextile m2 3.589
Two different sizes of gabion boxes are used in the study, which are
2.0x1.0x1.0 m and 3.0x1.0x1.0 m (length, width, thickness) (Dursun, 2008). These
boxes are indicated as “A” and “B”, respectively. Gabion boxes are placed around
the right pier and they are shown with diamond hatch in Figure 3.16. For the extent
of the gabion box placement, riprap placement criteria, which is mentioned in
Özdemir (2003) is followed. Similar to the grout filled bags, the boxes are placed
around (dotted area in Figure 3.16) and on top of the footing. The dimensions of
gabion box installation area are shown below, in which ys is the depth of scour.
Number of boxes in depth and area are calculated, and they are presented in
Table 3.12.

65
a) Plan view
b) Section a-a
Figure 3.16 Details of gabion box placement
Similar to grout filled bag calculations, total volume of excavation is calculated. On
top of the footing, it is 34.50 m3. Around the footing, area of excavation is 126 m
2.
The volume is then calculated by multiplying this area by depth of soil from channel
bed to bottom of footing, which is 3.05 m. Therefore, excavation volume around the
footing is found to be 384.30 m3, and the total excavation volume is 418.80 m
3. The
area of excavation around the footing is equal to the area of geotextile used. Volume
of riprap needed is calculated as the total volume of gabion boxes. Total cost of
gabion box placement is presented in Table 3.12.
1 m
1.05 m
12 m
1 m
3 m 3 m
2 m 2 m Based
on ys
Channel bed elevation
1 m
3 m 1 m
10m
12 m
1 m
18 m
3 m 3 m
a
3 m
3 m
a

66
Table 3.12 Cost calculation for gabion box placement
A summary of the results obtained from the calculations for scour countermeasures
is presented in Table 3.13. Comparing only the costs of countermeasures, gabion
box is found to be a more expensive alternative.
Table 3.13 Comparison table for costs of scour countermeasures
Scour Countermeasure Cost ($)
Grout filled bags 22,584
Gabion boxes 35,164
Item Unit Quantity
# of A boxes in depth (around) piece 3
# of A boxes in area (around) piece 54
# of B boxes in depth (around) piece 3
# of B boxes in area (around) piece 6
# of A boxes (above) piece 13
# of B boxes (above) piece 2
Total # of A boxes piece 175
Total # of B boxes piece 20
Excavation volume m3 418.80
Riprap volume m3 410.00
Geotextile area m2 126.00
Item 1 cost $ 3,917.04
Item 2 cost $ 441.00
Item 3 cost $ 22,547.15
Item 4 cost $ 3,219.73
Item 5 cost $ 452.21
Total cost $ 30,577
Total cost with contingencies $ 35,164

67
3.9 Economic Analysis of Scour Countermeasures
In this section, the seventh step of Scour Countermeasures Calculator, which is
mentioned in Section 2.3.2, is carried out. In this last step, up to seven scour
countermeasures which may be appropriate at the bridge site can be specified in
order to calculate the net benefit and benefit cost ratio of each countermeasure
proposed.
In the Step 5 of Scour Countermeasures Calculator, remaining useful life of the
bridge is defined. In OECD countries, average service life of bridges is 80 years
(Caner et al., 2007). Therefore, the remaining life of Fol-1 Bridge is 50 years, since
it is a 30-year-old bridge. In Step 7, three alternatives are discussed: doing nothing
to the bridge, installation of grout filled bags and gabion boxes. Entering the costs of
these alternatives and their return period of protection, adjusted lifetime failure
probability of Fol-1 Bridge, net benefit, and benefit/cost ratio of each alternative are
calculated as presented in Figure 3.17. With the proposed scour countermeasures, it
is aimed to protect the bridge against return period of floods equal to at least
reciprocal of the annual failure probability. In the case study, reciprocal of the
annual failure probability (i.e. 1/0.07388) corresponds to a return period of
approximately 14 years. Any scour countermeasure with an assumed return period
of protection greater than this return period will eventually decrease the annual
failure probability of the bridge. This annual probability is referred as adjusted
lifetime failure probability and is calculated with Equation (3.6).
L
LRP
P1
11' (3.6)
where, PL' = probability of failure over the extended life of the protected bridge,
RP = return period protection desired (year), and L = remaining useful life of bridge
(year).

68
Figure 3.17 Benefit calculations of countermeasures
A graphical comparison of the proposed countermeasures is provided in the
HYRISK software. The graphical comparison of the countermeasures proposed for
Fol-1 Bridge is presented in Figure 3.18.
INPUT

69
Figure 3.18 Economical comparison of the proposed scour countermeasures
Also, the report of the proposed countermeasure analysis is generated in the model,
and the report for Fol-1 Bridge is given in Figure 3.19.

70
Figure 3.19 Scour countermeasure analysis report
Considering the net benefit and benefit/cost ratio of the countermeasures together, it
is reasonable to select grout filled bags for Fol-1 Bridge. A discussion on the
selection of scour countermeasure will be provided in Chapter 4.
71
CHAPTER 4
4. DISCUSSION OF THE RESULTS
4.1 Introduction
The objective of this thesis is to evaluate the scour failure risk of Fol-1 Bridge. A
case study is carried out for the demonstration of this evaluation. Scour failure risk
calculations are carried out for Fol-1 Bridge using HYRISK software. In addition to
scour failure risk calculations, local scour computations are conducted and costs of
applicable scour countermeasures for the bridge site are determined. Results of these
calculations are presented in the previous chapter. In this chapter, evaluation of the
risk of the bridge is made and discussions are given for the case study.
4.2 Evaluation of Scour Failure Risk
As it is discussed in Chapter 3, waterway adequacy of Fol-1 Bridge is coded as 9,
which means that overtopping chance is remote corresponding to return periods
greater than 100 years. This decision is based on the fact that no overtopping is
observed even under the maximum discharge recorded in the basin, i.e. 412 m3/s.
This discharge almost doubles the discharge corresponding to 500-year return
period.
Scour criticality rating can be estimated based on the channel and substructure
conditions. However, making an evaluation using HEC-RAS program is a more
realistic approach. As briefly explained in Section 3.7, scour depths and their levels
corresponding to footings differ in each abutment and pier. Discharges considered
and levels of scouring are summarized in Table 4.1.

72
Table 4.1 Scour levels at piers and abutments of Fol-1 Bridge
Qi Scour Level
Left Pier Right Pier Right Abutment Q2 No scour Within limits of footing No scour
Q5 No scour Within limits of footing No scour
Q10 No scour Within limits of footing No scour Q25 Above footing Below footing No scour
Q50 Above footing Below footing No scour
Q60 Above footing Below footing No scour Q70 Above footing Below footing No scour Q80 Above footing Below footing Within limits of footing Q90 Above footing Below footing Within limits of footing Q100 Above footing Below footing Within limits of footing Q150 Above footing Below footing Within limits of footing Q200 Above footing Below footing Within limits of footing Q300 Above footing Below footing Within limits of footing Q400 Above footing Below footing Within limits of footing Q500 Above footing Below footing Within limits of footing
Scour levels explained in Table 4.1 are presented in Figure 2.1. Scour criticality
codings corresponding to these scour levels are given in Table 4.2 which are
explained previously in Section 2.2.1.2.
Table 4.2 Scour criticality codes for piers and abutments of Fol-1 Bridge
Qi Scour Criticality Codes
Left Pier Right Pier Right Abutment Q2 9 3 - 4 9
Q5 9 3 - 4 9
Q10 9 3 - 4 9 Q25 8 2 - 3 9
Q50 8 2 - 3 9
Q60 8 2 - 3 9 Q70 8 2 - 3 9 Q80 8 2 - 3 5 Q90 8 2 - 3 5 Q100 8 2 - 3 5 Q150 8 2 - 3 5 Q200 8 2 - 3 5 Q300 8 2 - 3 5 Q400 8 2 - 3 5 Q500 8 2 - 3 5
73
Instead of evaluating the scour criticalities of piers and abutments individually, the
entire bridge should be considered. As a whole, the worst condition for scour
criticality is taken into consideration. This approach yields to a result that, scour
criticality of Fol-1 Bridge is coded as 3 - 4 for Q2, Q5, and Q10 profiles where it is
coded as 2 - 3 for Q25 and greater discharges. According to Table 3.6, for waterway
adequacy coding 9 and scour criticality codings 2, 3, and 4, the annual risk of scour
failure of the bridge is $59,792. Compared to rebuilding cost of the bridge
($481,074) it is a high risk to take annually, if no necessary action is done.
Therefore, it is reasonable to consider appropriate local scour countermeasures for
Fol-1 Bridge.
4.3 Evaluation of Scour Countermeasures
Appropriate pier scour countermeasures for Fol-1 Bridge are selected as grout filled
bag and gabion box, and necessary cost calculations are carried out in Section 3.8.
After installing a countermeasure, scour criticality code of a bridge can be upgraded
to a code of 8 or 7, meaning that the bridge is in good condition or scour
countermeasures are installed, respectively (Richardson and Davis, 2001).
Upgrading the code to 7 makes no difference in the annual scour failure risk, since
this code means that necessary action has been done for the bridge but still there
exist the risk of failure. If the code is upgraded to 8, the risk decreases to
2,525 $/year.
Since Fol Creek is frequently exposed to high flows, both grout filled bags and
gabion boxes are designed to protect the bridge from excessive scouring throughout
its remaining useful life, which is 50 years. Therefore, the upgraded scour criticality
ratings are predicted as 8 for both countermeasures. Considering their effects on the
scour criticality rating together with their costs, net benefits, and benefit/cost ratios,
grout filled bags is accepted to be the economically feasible countermeasure.
However, in Turkish practice, there is no use of grout filled bags to date. Although
the benefit/cost ratio of the gabion boxes is less than that of grout filled bags, they
still have a high ratio. Furthermore, gabion boxes and mattresses are used in river

74
training practices in Turkey. Therefore, gabion box alternative is selected as a
reasonable scour countermeasure for Fol-1 Bridge.
As given in Table 3.13, the cost of gabion box is $35,164 whereas, for scour
criticality codes of 2, 3, 4 and 7 the annual risk of failure is $59,792. In line with this
figures, it is evident that with a total investment of $35,164 for gabion box
installation (which is likely to be spent once in whole economic life of the bridge),
which is approximately 60% of the annual risk of failure, the scour criticality of the
bridge can be upgraded to 8 and consequently the risk decreases to 2,525 $/year. In
other words, with an overall investment of $35,164, the annual risk of failure can be
reduced approximately 95%, i.e. from $59,792 to $2,525. Another considerable fact
of such investment is that once the scour criticality is upgraded to 8, the annual
failure probability is reduced from 0.074 corresponding to a return period of
14 years (Return period=1/annual failure probability) to 0.003 with a return period
of 333 years.
In this study, although the appropriate local scour countermeasures are designed
properly and they both may mitigate the severe effects on the bridge stability, there
exist long-term bed degradation problem in close vicinity of the bridge. Therefore,
long-term bed degradation of the bridge should be studied and degradation
countermeasures should also be considered carefully. Check-dams and bank training
facilities are suitable countermeasures against degradation. Derivatives of these
countermeasures are reasonable to consider for coping with the severe results of bed
degradation (Lagasse et al., 2001). Bank protection at the bridge site has not been
considered specifically in this study as it is assumed to be an integral part of the
bank protection facility to be implemented along the whole reach of Fol Creek. A
pioneering study was carried out in Turkey by Yanmaz and CoĢkun (1995) to
emphasize the effect of hydrologic and hydraulic aspects on design of river bridges.
In fact, various combinations of bank protection facilities with their economic
analyses are studied for Fol Creek by Yanmaz and Bilen (2000). Suitability of an
upstream flood detention dam on Fol Creek was also studied by Yanmaz and
Günindi (2006).

75
CHAPTER 5
5. CONCLUSIONS
5.1 Summary and Conclusions
Excessive local scouring around bridge piers and abutments may lead to stability
problems or damage on bridge, or even failure of it. Therefore, scouring and the
failure risk of a bridge associated with scouring have to be studied. This study is
carried out to present the determination of scour failure risk of a river bridge via a
risk-based model, using HYRISK software. The methodology of the study is
discussed and a case study is performed for Fol-1 Bridge crossing Fol Creek to
exemplify the objective of the thesis. Water surface profile and scour depth
calculations are performed using the HEC-RAS software. Also a study on suitable
scour countermeasures for the bridge is carried out for mitigation of unfavorable
results of excessive scouring. In the light of these studies, the following conclusions
are reached:
1) With the availability of necessary information, the annual risk of scour
failure of a bridge can be calculated using HYRISK. However, one has to be
careful in assigning relevant input parameters, which should be compatible
to the local site conditions and the commonly accepted standards used in the
country concerned.
2) A detailed study on channel and substructure conditions, waterway
adequacy, and scour criticality leads to more realistic results of risk
calculations. Channel stability indicators proposed by Lagasse et al. (2001)
and Johnson et al. (1999) provide confidence in determining the channel
condition around bridge site. Using hydraulic design of HEC-RAS software
for scour depth calculations is convenient for scour criticality estimation.
3) Suitable scour countermeasures should be assessed for mitigating the

76
excessive scour around bridge foundations. Selection of the appropriate
countermeasure is based on both its applicability on the bridge site and its
economical feasibility. The risk of scour failure obtained in the calculations
is quite guiding for the selection. Bank protection at the bridge site has not
been considered specifically in this study as it is assumed to be an integral
part of the bank protection facility to be implemented along the whole reach
of Fol Creek.
4) Fol-1 Bridge is 30-year-old, it has resisted to 1990 flash flood and no
overtopping is observed during this event. Although the bridge is still
serviceable, supplementing proper scour countermeasures would be of worth
since it is subject to various sources of uncertainties, e.g. uncertainties
associated with flow computations and distribution of flow in the channel
reach and possible future alterations in river resistance. These uncertainties
should force an engineer to consider the protection of the bridge. Besides, in
case of a bridge failure, many people may die or injured. It is unethical for an
engineer to discard the probability of loss of life. Therefore, it is reasonable
and even compulsory to protect the bridge with suitable scour
countermeasure(s).
5) In the case study, scour criticality of Fol-1 Bridge is found to be 2, 3, and 4
for various flood profiles, which lead to an annual failure probability of
0.074 and an annual risk of scour failure of $59,792. The right pier of the
bridge is exposed to extreme local scouring. For the computed discharges
corresponding to big return periods, i.e. 100 and 500 years, the size of the
riprap was obtained quite large which is not economical. Therefore, grout
filled bags and gabion boxes were found to be suitable to be used in the
study area. Cost calculations of these countermeasures and a benefit/cost
study are carried for the selection of the appropriate countermeasure.
Although installation of grout filled bags have higher benefit/cost ratio than
gabion boxes, the extensive use of gabion boxes in Turkish practice
predominates the selection criteria. Therefore, gabion boxes are selected for
the case study area.

77
5.2 Recommendations
This study has been carried out to present a method for scour failure risk assessment
which is developed and being used in the United States. A case study is conducted
on a pilot bridge to present the applicability of this method for bridges in Turkey.
For the analyses in the study, necessary information is gathered from the previous
studies, General Directorate of Highways, State Hydraulic Works, and inspections
made in the field trip to the bridge site.
Although a comprehensive study has been conducted to obtain information on
bridge and bridge site, still there are some missing data for the bridge and local
conditions both in the study area and in Turkey in general. Lacking data and
recommendations for overcoming these problems are simply as follows:
1) There is no database for bridges in Turkey. For each study, the necessary
information should be gathered from various authorities, which leads to loss
of time and effort. A national database, similar to NBI, should be developed
for Turkey. The database should include the cross-sectional data, dimensions
and structural classifications of the bridge, functional classification, traffic
information of the roadway on/under the bridge, and relevant hydraulic and
hydrologic information.
Also, the stability of the channel and structure together with its scour
criticality should be defined. Considering these items, bridges should be
inspected periodically using the methodology proposed by Yanmaz et al.
(2007) and the database should be updated periodically when necessary.
2) Obtaining current information of old bridges in Turkey is very difficult.
A special attention should be attracted to this problem and information of old
bridges should be updated by detailed field inspections. Approximate
remaining lifetime of existing bridges should be computed using the
procedure described by Caner et al. (2008) such that series of bridges are
ranked according to the structural and hydraulic deficiencies. Therefore,
priority may be given to those bridges to reinforce them with the right
techniques at the right time.

78
3) The awareness for the concept of importance of time loss and the resultant
inconveniences should be established in Turkey. A study on the cost of time
for people and commercial trucks should be conducted considering the socio-
economic conditions of different regions in Turkey.
A national based study on bridges together with overcoming the problems stated
above will provide convenience to those structures and the surrounding properties.

79
6. REFERENCES
Bilen, S. V. (1999). "Investigation of Design Criteria for River Bank Protection
Facilities", MSc Thesis. Middle East Technical University, Ankara.
Birimfiyat.com. (2010). Retrieved March 26, 2010, from http://www.birimfiyat.com
Brunner, G. W. (2002). "HEC-RAS River Analysis System User’s Manual Version
3.1". California: US Army Corps of Engineers Institute for Water Resources,
Hydrologic Engineering Center (HEC).
Caner, A., Yanmaz, A. M., Yakut, A., AvĢar, Ö., and Yılmaz, T. (2008). “Service
Life Assessment of Existing Highway Bridges with No Planned Regular
Inspections”. Journal of Performance of Constructed Facilities, ASCE, Volume
22(2) , 108-114.
Caner, A., Yanmaz, A. M., Yakut, A., Yıldırım, O., AvĢar, Ö., and Yılmaz, T.
(2007). "Çanakkale-Bursa Arasındaki Mevcut Köprülerin Ekonomik Ömürlerinin
Ġstatistiksel Olarak Hesaplanması". Köprü ve Viyadükler Sempozyumu. Antalya.
CoĢkun, F. (1994). "Investigation of Hydrologic and Hydraulic Design Criteria of
Bridges", MSc Thesis. Middle East Technical University, Ankara.
Dursun, Ö. F. (2008). "Gabyon Sandık Uygulamasının Tersip Bendi ve Islah
Sekillerinde Kullanılabilirliğinin AraĢtırılması". Doğu Anadolu Bölgesi
Araştırmaları, Cilt 7, Sayı 1 , 7-11.
Erkek, C. and Ağıralioğlu, N. (2010). "Su Kaynakları Mühendisliği", 6. Baskı.
Ġstanbul: Beta Yayınları.
FHWA. (1989). "FHWA Functional classification Guidelines". Retrieved September
22, 2008, from http://www.fhwa.dot.gov/planning/fctoc.htm

80
Fletcher, J. E., Huber, A. L., Haws, F. W., and Clyde, C. G. (1977). "Runoff
Estimates for Small Rural Watersheds and Development of a Sound Design
Method". FHWA Report No. FHWA-RD-77-158. Virginia: Federal Highway
Administration.
GISHydro. (2004, April). Retrieved August 25, 2010, from
http://www.gishydro.umd.edu/sha_sept07/CH 11 SCOUR/5 CH 11 APP D.pdf
Johnson, P. A., Gleason, L. G., and Hey, R. D. (1999). "Rapid Assessment of
Channel Stability in Vicinity of Road Crossing". Journal of Hydraulic Engineering,
ASCE, Vol. 125, No. 6 , 645-651.
Lagasse, P. F. (2002). "HEC-23 Matrix for Selecting Countermeasures".
Transportation Research Board 2002 Annual Meeting Presentations from Workshop
on Plan of Action for Scour Critical Bridges. FHWA.
Lagasse, P. F., Zevenbergen, L. W., Schall, J. D., and Clopper, P. E. (2001). "Bridge
Scour and Stream Instability Countermeasures - Experience, Selection, and Design
Guidelines", Hydraulic Engineering Circular (HEC) No. 23, Second Edition. FHWA
Report No. FHWA NHI 01-003. Washington, D.C.: Federal Highway
Administration.
Melville, B. W. and Coleman, S. E. (2000). "Bridge Scour". Colorado: Water
Resources Publications.
Newsline - Minnesota Department of Transportation Employee News. (2007, April
11). Retrieved August 25, 2010, from
http://www.newsline.dot.state.mn.us/archive/07/apr/11.html
Özdemir, C. E. (2003). "A Feasibility Study on Bridge Scour Countermeasures",
MSc Thesis. Middle East Technical University, Ankara.
Pearson, D., Stein, S., and Jones, J. S. (2002). "HYRISK Methodology and User
Guide". FHWA Report No. FHWA-RD-02-XXX. Virginia: Federal Highway
Administration.

81
Red Star Wire Mesh Factory. (2006). Retrieved August 28, 2010, from
http://gabions.cc/index.html
Richardson, E. V. and Davis, S. R. (2001). "Evaluating Scour at Bridges", Fourth
edition. FHWA Report No. FHWA NHI 01-001. Virginia: Federal Highway
Administration.
Tuna, M. C. (2008). "Mockus Metodu ile Trabzon TaĢkınlarının Ġncelenmesi". V.
Dünya Su Forumu, Türkiye Bölgesel Hazırlık Toplantıları, Taşkın, Heyelan ve Dere
Yataklarının Korunması Konferansı, (pp. 81-88). Trabzon.
Yanmaz, A. M. (2002). "Köprü Hidroliği". Ankara: METU Press.
Yanmaz, A. M. (2006). “Temporal Variation of Clear Water Scour at Cylindrical
Bridge Piers”. Canadian Journal of Civil Engineering, Vol. 33, No: 8 , 1098-1102.
Yanmaz, A. M. and Altınbilek, H. D. (1991). "Study of Time Dependent Local
Scour Around Bridge Piers". Journal of Hydraulic Engineering, ASCE, Vol. 117,
No.10 , 1247-1268.
Yanmaz, A. M. and Bilen, S. V. (2000). "Selection of Optimum Riverbank
Stabilization Facility". 4th International Conference on Hydroscience and
Engineering Conference (pp. 26-29). Seoul: Korea Water Resources Association.
Yanmaz, A. M. and CoĢkun, F. (1995). "Hydrological Aspects of Bridge Design:
Case Study". Journal of Irrigation and Drainage Engineering, ASCE, 121 (6) , 411-
418.
Yanmaz, A. M. and Günindi, E. (2006). “Probabilistic Assessment of Overtopping
Reliability of a Dam”. International Conference on Water Observation and
Information System for Decision Support. Macedonia, Ohrid.
Yanmaz, A. M. and Köse, Ö. (2009). “A Semi-Empirical Model for Clear Water
Scour Evolution at Bridge Abutments”. Journal of Hydraulic Research, Vol.47,
No.1 , 110-118.

82
Yanmaz, A. M. and Özdemir, E. C. (2004). “A Feasibility Study on Bridge Scour
Countermeasures”. World Water and Environmental Resources Congress (pp. 1-10).
Salt Lake City: ASCE.
Yanmaz, A. M. and Selamoğlu, M. (2010). "A Case Study on Bridge Scour Risk
Assessment". 9th International Congress on Advances in Civil Engineering.
Trabzon.
Yanmaz, A. M., Caner, A., and Berk, A. (2007). “Renovation of a Safety-Inspection
Methodology for River Bridges”. Journal of Performance of Constructed Facilities,
ASCE, Vol.21, No:5 , 382-389.
Yanmaz, A. M., Günindi, E., and Kentel, E. (2008). “Interpretation of New Trends
in Flood Frequency Analysis: A Case Study”. International Conference on Water
Observation and Information System for Decision Support. Macedonia, Ohrid.

83
APPENDIX A
7. HEC-RAS OUTPUTS FOR STEADY FLOW SIMULATION
OF FOL CREEK AND SCOUR CALCULATIONS OF FOL-1
BRIDGE
Steady flow simulation of Fol Creek is carried out via HEC-RAS software. In the
execution of the program, the input data are taken as: Manning’s roughness
coefficient, which is 0.069 for bank and 0.033 for channel, contraction and
expansion coefficients, which are 0.1 and 0.3 for natural sections and 0.3 and 0.5 for
bridge section, respectively, normal depth both at upstream and downstream ends as
a boundary condition for mixed flow, and average bed slope of 0.008 (Bilen, 1999).
Also, scour depth calculations are carried out using HEC-RAS software. For fifteen
flood profiles corresponding to different return periods, analyses are made and the
results of the analyses are presented in Table A.1, in which Qi, Q, Zmin, Zw, up, and ys
are discharge corresponding to a return period, discharge, minimum channel bed
elevation, water surface elevation, velocity just upstream of right pier, and depth of
scour around right pier of Fol-1 Bridge, respectively.

84
Table A.1 Results of steady flow analysis and scour calculations
Qi Q (m3/s) Zmin (m) Zw (m) up (m/s) ys (m)
Q2 56.7 9.95 10.86 5.37 2.68
Q5 93.3 9.95 11.07 6.14 2.93
Q10 117.3 9.95 11.19 6.51 3.06
Q25 145.2 9.95 11.31 6.92 3.18
Q50 163.8 9.95 11.37 7.21 3.26
Q60 168.4 9.95 11.39 7.27 3.27
Q70 172.2 9.95 11.40 7.32 3.29
Q80 175.4 9.95 11.41 7.36 3.30
Q90 178.1 9.95 11.42 7.39 3.31
Q100 180.6 9.95 11.43 7.43 3.32
Q150 189.6 9.95 11.46 7.54 3.35
Q200 195.6 9.95 11.48 7.62 3.37
Q300 203.7 9.95 11.50 7.72 3.40
Q400 209.1 9.95 11.52 7.78 3.42
Q500 213.1 9.95 11.53 7.84 3.43