Embed Size (px)
Citation preview
5Plug-in Hybrid Electric Vehicles
5.1 Introduction to PHEVs
Plug-in hybrid electric vehicles (PHEVs) have the potential to displace transportation fuelconsumption by using grid electricity to drive the car. PHEVs can be driven initially usingelectric energy stored in the onboard battery, and an onboard gasoline engine can extendthe driving range. In the 1990s and early 2000s, pure electric cars were not successful,one of the major reasons being the limited driving range of the battery-powered carsavailable at that time. For example, the GM electric vehicle (EV) had a range of about100 miles (160 km) and the Ford Ranger electric truck had a range of approximately60 miles (96 km).
5.1.1 PHEVs and EREVs
PHEVs are sometimes called range-extended electric vehicles (ReEVs) or extended rangeelectric vehicles (EREVs), in the sense that these vehicles always have onboard gasolineor diesel that can be used to drive the vehicle for an extended distance when the onboardbattery energy is depleted. Furthermore, these vehicles can provide high fuel economyduring the extended driving range due to the large battery pack that can accept moreregenerative braking energy and provide more flexibility for engine optimization duringthe extended driving range.
However, EREVs, such as the GM Chevy Volt, must be equipped with a full-sizedelectric motor so that pure electric driving can be realized for all kinds of driving condi-tions. It is shown that, for some driving conditions, all-electric drive sometimes does notprovide the most benefits, given the limited battery energy available.
For example, the powertrain motor of a PHEV is rated at 125 kW, and the battery packhas a capacity of 16 kWh. This means that at full powertrain power, the battery needs tosupply a power eight times its nominal capacity, or 8 C. This high power requirement notonly is difficult to achieve, but also results in inevitable heavy losses inside the batterypack, which makes the drive system very inefficient.
Hybrid Electric Vehicles: Principles and Applications with Practical Perspectives, First Edition.Chris Mi, M. Abul Masrur and David Wenzhong Gao.© 2011 John Wiley & Sons, Ltd. Published 2011 by John Wiley & Sons, Ltd. ISBN: 978-0-470-74773-5
108 Hybrid Electric Vehicles
Example 5.1: A 400 V, 16 kWh lithium-ion battery pack has an internal impedanceof approximately 0.5 �. The motor and inverter have a combined efficiency of 90%and rated output of 125 kW. The rated current is 347 A on the DC side of the inverter.At this current, the battery will drop 174 V internally. In other words, the battery ter-minal voltage will be only 226 V at 347 A. This will result in a battery output powerof 78 kW instead of 125 kW, and a loss inside the battery to an amount of 60.8 kW.
5.1.2 Blended PHEVs
Blended PHEVs have become more popular because of the reduced system cost (smallerelectric motor, smaller battery pack, and lower battery power ratings), as well as theflexibility of optimizing fuel economy for different driving conditions. Compared to anEREV, a blended PHEV usually uses a parallel or complex configuration in which theengine and the motor can both drive the wheels directly. Since the engine is available forpropulsion at high power demand, the size of the electric motor and the power requirementfor the battery pack can be much smaller than the one in an EREV. Therefore, the costof the vehicle is reduced.
Planetary gear-based hybrid vehicles, such as the Toyota Prius, and the GM two-modehybrid, can be considered as parallel configurations since the electric motor (referred toas MG2 in Chapter 4) is in parallel with the engine output, while the generator (referredto as MG1 in Chapter 4) is used to realize the continuously variable transmission (CVT)and to optimize engine operation.
5.1.3 Why PHEV?
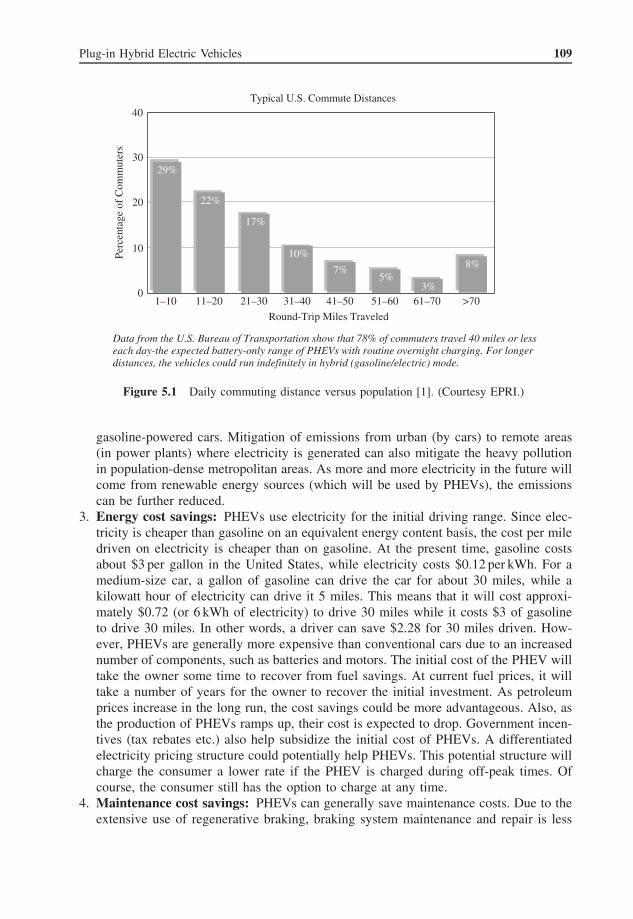
A survey [1, 2] showed that 78% of the US population drives an average of 40 miles(64 km) or less in their daily commuting. Figure 5.1 shows the distribution of daily milesdriven versus percentage of population. Based on this survey, a PHEV with an electricrange of 40 miles (or PHEV40) will satisfy the daily driving needs of 78% of the USpopulation while driving on electricity in their daily commuting. Furthermore, peopleowning a 40 mile electric range PHEV but driving less than 40 miles daily will not needto refuel gasoline if they charge their car at night on a daily basis.
PHEVs can produce significant environmental and economic benefits for society. Theadvantages of PHEVs can be evaluated by how much fuel is displaced, as well as by howmuch pollution, including greenhouse gas (GHG) emissions, can be reduced. The mainpurpose for developing PHEVs can be summarized as follows:
1. Displacement of fossil fuel consumption in the transportation sector: Since PHEVowners will not need to refuel gasoline or need less gasoline, a significant amount offossil fuel can be saved. This will have a long-term impact on the economy, environ-ment, and political arena.
2. Reduction of emissions: Due to the reduced use of gasoline, a significant amountof emissions can be reduced due to the large deployment of PHEVs. Centralizedgeneration of electricity is much more efficient and has much less emissions than
Plug-in Hybrid Electric Vehicles 109
7%5%
3%
Typical U.S. Commute Distances
29%
22%
17%
10%8%
1–10
40
30
20
10
Perc
enta
ge o
f C
omm
uter
s
011–20 21–30 31–40 41–50 51–60
Round-Trip Miles Traveled
61–70 >70
Data from the U.S. Bureau of Transportation show that 78% of commuters travel 40 miles or lesseach day-the expected battery-only range of PHEVs with routine overnight charging. For longerdistances, the vehicles could run indefinitely in hybrid (gasoline/electric) mode.
Figure 5.1 Daily commuting distance versus population [1]. (Courtesy EPRI.)
gasoline-powered cars. Mitigation of emissions from urban (by cars) to remote areas(in power plants) where electricity is generated can also mitigate the heavy pollutionin population-dense metropolitan areas. As more and more electricity in the future willcome from renewable energy sources (which will be used by PHEVs), the emissionscan be further reduced.
3. Energy cost savings: PHEVs use electricity for the initial driving range. Since elec-tricity is cheaper than gasoline on an equivalent energy content basis, the cost per miledriven on electricity is cheaper than on gasoline. At the present time, gasoline costsabout $3 per gallon in the United States, while electricity costs $0.12 per kWh. For amedium-size car, a gallon of gasoline can drive the car for about 30 miles, while akilowatt hour of electricity can drive it 5 miles. This means that it will cost approxi-mately $0.72 (or 6 kWh of electricity) to drive 30 miles while it costs $3 of gasolineto drive 30 miles. In other words, a driver can save $2.28 for 30 miles driven. How-ever, PHEVs are generally more expensive than conventional cars due to an increasednumber of components, such as batteries and motors. The initial cost of the PHEV willtake the owner some time to recover from fuel savings. At current fuel prices, it willtake a number of years for the owner to recover the initial investment. As petroleumprices increase in the long run, the cost savings could be more advantageous. Also, asthe production of PHEVs ramps up, their cost is expected to drop. Government incen-tives (tax rebates etc.) also help subsidize the initial cost of PHEVs. A differentiatedelectricity pricing structure could potentially help PHEVs. This potential structure willcharge the consumer a lower rate if the PHEV is charged during off-peak times. Ofcourse, the consumer still has the option to charge at any time.
4. Maintenance cost savings: PHEVs can generally save maintenance costs. Due to theextensive use of regenerative braking, braking system maintenance and repair is less
110 Hybrid Electric Vehicles
frequent, such as brake pad replacement, brake fluid change, and so on. Since theengine is not operating, or operating for much less time, there will be longer intervalsfor oil changes and other engine maintenance services.
5. Backup power: A PHEV can be used as a backup power source when a bidirectionalcharger is provided. A typical PHEV battery pack can provide a home or office with3–10 kW of power for a few hours, and the onboard engine generator/motor can furtherextend the backup duration by using gasoline to generate electricity.
6. End-of-life use of the battery: Batteries that can no longer provide the desired per-formance in a PHEV can potentially be used for grid energy storage, which providesvoltage regulation, system stability, and frequency regulation for a power grid. In par-ticular, frequency regulation and stability become more and more important as moreand more renewable energy generation is put on the power grid. These “retired” bat-teries, which may still have 30–50% of their original energy capacity, can provide thistype of service.
5.1.4 Electricity for PHEV Use
Since PHEVs need to be charged from the power grid, the utility industry must be readyfor the large deployment of PHEVs. Fortunately, the deployment of PHEVs will take placeover a period of time, which will give the utility industry sufficient time to get ready.
PHEVs will be mostly charged at night. The electric power grid has capacity availableat late evenings and nights when most of the PHEVs are charged. An Electric PowerResearch Institute (EPRI) study showed that with 1 million PHEVs plugged into the USgrid, there is no need to build a single power plant in the United States [1]. With 10 millionPHEVs on the road, the United States will only have to build three additional power plants(http://www.ornl.gov/info/ornlreview/v40_2_07/2007_plug-in_paper.pdf) [1–4].
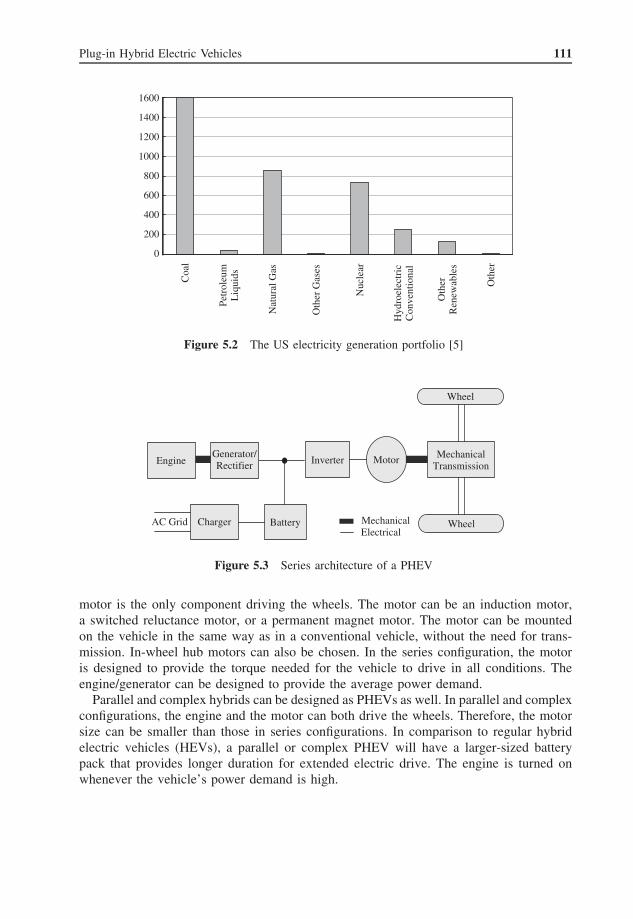
On the other hand, electricity can be generated from a variety of sources, includingnuclear and renewables such as hydroelectric, wind, photovoltaic, and ocean waves. Evencoal-fired power plants will have advantages because there are more coal reserves thanpetroleum. By using renewable energy for PHEVs, it will significantly reduce the con-sumption of petroleum-based fossil fuel. Finally, centralized generation will reduce thetotal emissions and move the source of emissions to urban areas.
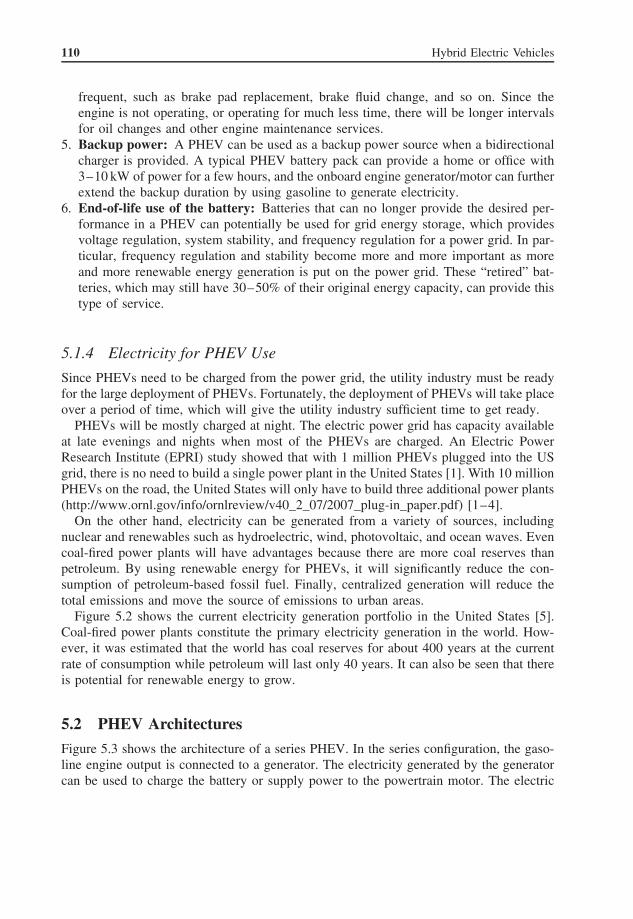
Figure 5.2 shows the current electricity generation portfolio in the United States [5].Coal-fired power plants constitute the primary electricity generation in the world. How-ever, it was estimated that the world has coal reserves for about 400 years at the currentrate of consumption while petroleum will last only 40 years. It can also be seen that thereis potential for renewable energy to grow.
5.2 PHEV Architectures
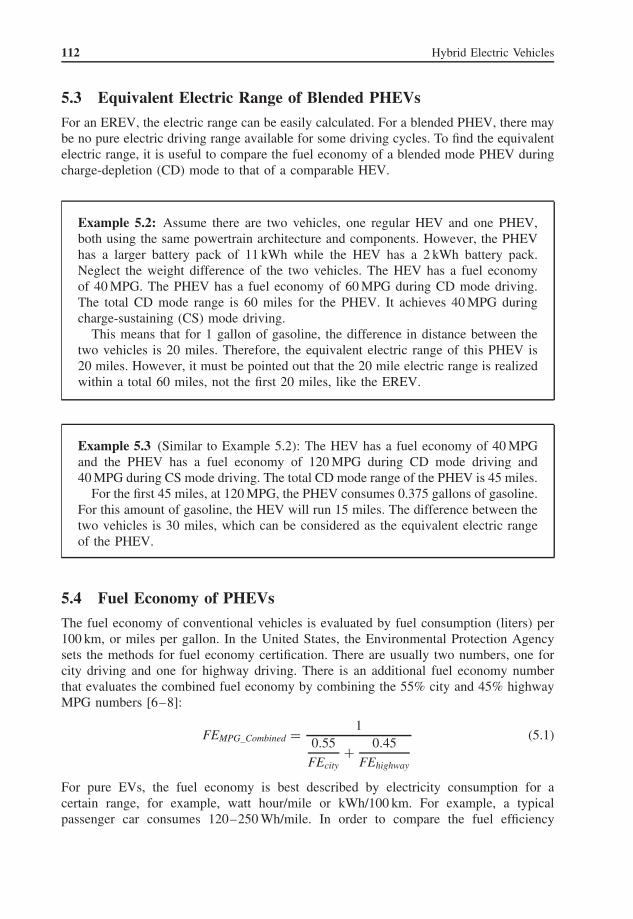
Figure 5.3 shows the architecture of a series PHEV. In the series configuration, the gaso-line engine output is connected to a generator. The electricity generated by the generatorcan be used to charge the battery or supply power to the powertrain motor. The electric
Plug-in Hybrid Electric Vehicles 111
0
200
400
600
800
1000
1200
1400
1600
Coa
l
Petr
oleu
mL
iqui
ds
Nat
ural
Gas
Oth
er G
ases
Nuc
lear
Hyd
roel
ectr
icC
onve
ntio
nal
Oth
erR
enew
able
s
Oth
er
Figure 5.2 The US electricity generation portfolio [5]
Battery
Inverter Motor
Wheel
Generator/RectifierEngine
MechanicalElectrical
ChargerAC Grid
Wheel
MechanicalTransmission
Figure 5.3 Series architecture of a PHEV
motor is the only component driving the wheels. The motor can be an induction motor,a switched reluctance motor, or a permanent magnet motor. The motor can be mountedon the vehicle in the same way as in a conventional vehicle, without the need for trans-mission. In-wheel hub motors can also be chosen. In the series configuration, the motoris designed to provide the torque needed for the vehicle to drive in all conditions. Theengine/generator can be designed to provide the average power demand.
Parallel and complex hybrids can be designed as PHEVs as well. In parallel and complexconfigurations, the engine and the motor can both drive the wheels. Therefore, the motorsize can be smaller than those in series configurations. In comparison to regular hybridelectric vehicles (HEVs), a parallel or complex PHEV will have a larger-sized batterypack that provides longer duration for extended electric drive. The engine is turned onwhenever the vehicle’s power demand is high.
112 Hybrid Electric Vehicles
5.3 Equivalent Electric Range of Blended PHEVs
For an EREV, the electric range can be easily calculated. For a blended PHEV, there maybe no pure electric driving range available for some driving cycles. To find the equivalentelectric range, it is useful to compare the fuel economy of a blended mode PHEV duringcharge-depletion (CD) mode to that of a comparable HEV.
Example 5.2: Assume there are two vehicles, one regular HEV and one PHEV,both using the same powertrain architecture and components. However, the PHEVhas a larger battery pack of 11 kWh while the HEV has a 2 kWh battery pack.Neglect the weight difference of the two vehicles. The HEV has a fuel economyof 40 MPG. The PHEV has a fuel economy of 60 MPG during CD mode driving.The total CD mode range is 60 miles for the PHEV. It achieves 40 MPG duringcharge-sustaining (CS) mode driving.
This means that for 1 gallon of gasoline, the difference in distance between thetwo vehicles is 20 miles. Therefore, the equivalent electric range of this PHEV is20 miles. However, it must be pointed out that the 20 mile electric range is realizedwithin a total 60 miles, not the first 20 miles, like the EREV.
Example 5.3 (Similar to Example 5.2): The HEV has a fuel economy of 40 MPGand the PHEV has a fuel economy of 120 MPG during CD mode driving and40 MPG during CS mode driving. The total CD mode range of the PHEV is 45 miles.
For the first 45 miles, at 120 MPG, the PHEV consumes 0.375 gallons of gasoline.For this amount of gasoline, the HEV will run 15 miles. The difference between thetwo vehicles is 30 miles, which can be considered as the equivalent electric rangeof the PHEV.
5.4 Fuel Economy of PHEVs
The fuel economy of conventional vehicles is evaluated by fuel consumption (liters) per100 km, or miles per gallon. In the United States, the Environmental Protection Agencysets the methods for fuel economy certification. There are usually two numbers, one forcity driving and one for highway driving. There is an additional fuel economy numberthat evaluates the combined fuel economy by combining the 55% city and 45% highwayMPG numbers [6–8]:
FEMPG_Combined = 10.55
FEcity+ 0.45
FEhighway
(5.1)
For pure EVs, the fuel economy is best described by electricity consumption for acertain range, for example, watt hour/mile or kWh/100 km. For example, a typicalpassenger car consumes 120–250 Wh/mile. In order to compare the fuel efficiency
Plug-in Hybrid Electric Vehicles 113
of EVs with conventional gasoline or diesel vehicles, the energy content of gasolineis used to convert the numbers. Since 1 gallon of gasoline contains 33.7 kWh energy(http://www.eere.doe.gov), the equivalent fuel economy of an EV can be expressed as
FEgas_equivalent = 1
Wh/mile× 33 700 (5.2)
Therefore, a passenger car that consumes 240 Wh/mile will have an equivalent gasolinemileage of 140 MPG from the energy point of view.
5.4.1 Well-to-Wheel Efficiency
The above fuel efficiencies are also called tank-to-wheel efficiencies. This does not reflectthe losses during the refining and distribution. It is sometimes easier to compare the overallfuel efficiencies of conventional vehicles and EVs. For gasoline, this efficiency is 83%,which reflects a lumped efficiency from the refining and distribution of gasoline. Forelectricity generation, this efficiency is 30.3%, which reflects a lumped efficiency thatincludes electricity generation of 32.8% (assume electricity is generated from gasoline)and distribution of electricity at 92.4%. Charge efficiency of the battery also needs to bereflected [9]. Thus,
FEEV_well_wheel = 1
Wh/mile× 33 700 × ηelectricity (5.3)
FEICEV_well_wheel = FEmpg × ηgasoline (5.4)
where ηelectricity = 30.3 and ηgasoline = 83%, and subscript ICEV stands for Internal Com-bustion engine Vehicle.
Example 5.4: A car of 30 MPG will have a well-to-wheel fuel efficiency of24 MPG, and an EV that consumes 240 Wh/mile will have a well-to-wheelefficiency of 42.5 MPG.
5.4.2 PHEV Fuel Economy
For PHEVs, it is usually confusing as to which number should be used. Here, we discusstwo different scenarios: all-electric capable PHEVs and blended PHEVs.
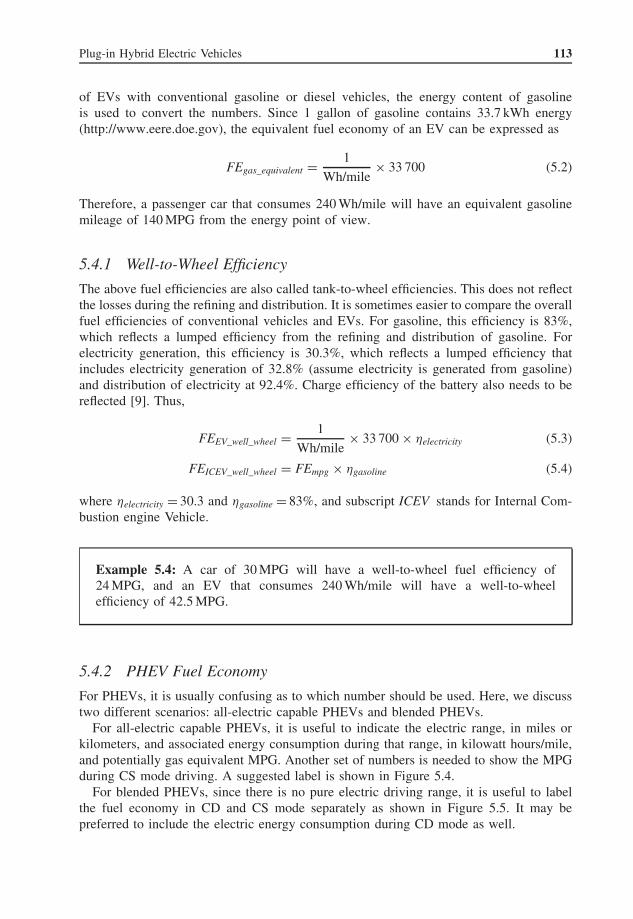
For all-electric capable PHEVs, it is useful to indicate the electric range, in miles orkilometers, and associated energy consumption during that range, in kilowatt hours/mile,and potentially gas equivalent MPG. Another set of numbers is needed to show the MPGduring CS mode driving. A suggested label is shown in Figure 5.4.
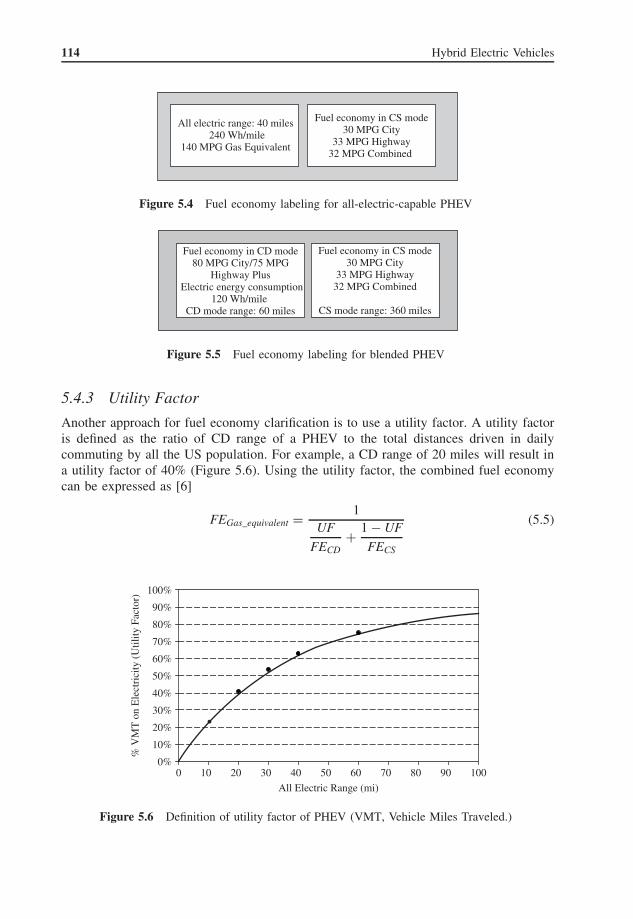
For blended PHEVs, since there is no pure electric driving range, it is useful to labelthe fuel economy in CD and CS mode separately as shown in Figure 5.5. It may bepreferred to include the electric energy consumption during CD mode as well.
114 Hybrid Electric Vehicles
All electric range: 40 miles 240 Wh/mile
140 MPG Gas Equivalent
Fuel economy in CS mode30 MPG City
33 MPG Highway32 MPG Combined
Figure 5.4 Fuel economy labeling for all-electric-capable PHEV
Fuel economy in CD mode80 MPG City/75 MPG
Highway Plus Electric energy consumption
120 Wh/mile CD mode range: 60 miles
Fuel economy in CS mode30 MPG City
33 MPG Highway32 MPG Combined
CS mode range: 360 miles
Figure 5.5 Fuel economy labeling for blended PHEV
5.4.3 Utility Factor
Another approach for fuel economy clarification is to use a utility factor. A utility factoris defined as the ratio of CD range of a PHEV to the total distances driven in dailycommuting by all the US population. For example, a CD range of 20 miles will result ina utility factor of 40% (Figure 5.6). Using the utility factor, the combined fuel economycan be expressed as [6]
FEGas_equivalent = 1UF
FECD+ 1 − UF
FECS
(5.5)
0%
10%
20%
30%
40%
50%
60%
70%
80%
90%
100%
0 10 20 30 40 50 60 70 80 90 100
All Electric Range (mi)
% V
MT
on
Ele
ctri
city
(U
tility
Fac
tor)
Figure 5.6 Definition of utility factor of PHEV (VMT, Vehicle Miles Traveled.)
Plug-in Hybrid Electric Vehicles 115
where UF is the utility factor, and FE CD and FE CS are the fuel economy during CD andCS operation of a PHEV, respectively.
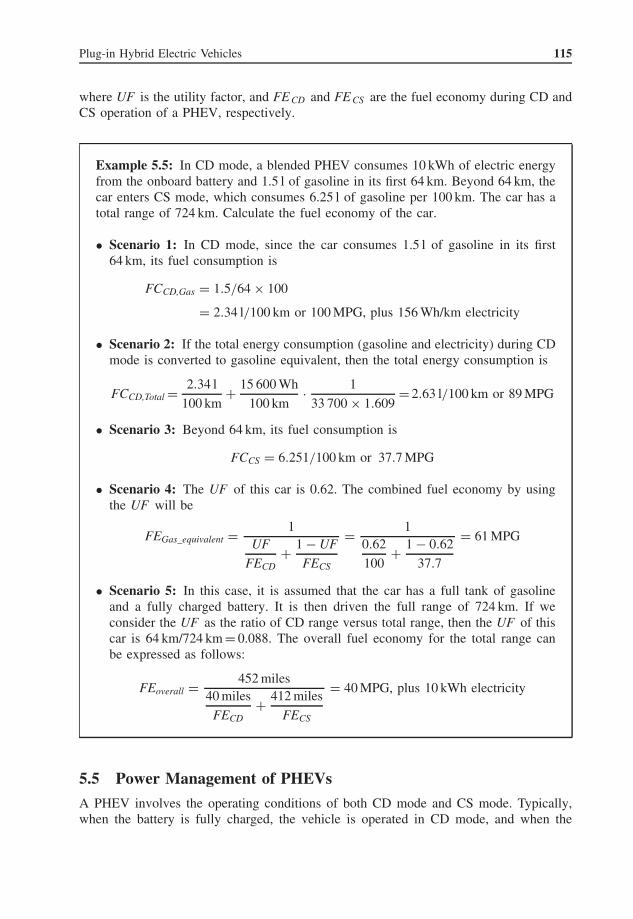
Example 5.5: In CD mode, a blended PHEV consumes 10 kWh of electric energyfrom the onboard battery and 1.5 l of gasoline in its first 64 km. Beyond 64 km, thecar enters CS mode, which consumes 6.25 l of gasoline per 100 km. The car has atotal range of 724 km. Calculate the fuel economy of the car.
• Scenario 1: In CD mode, since the car consumes 1.5 l of gasoline in its first64 km, its fuel consumption is
FCCD,Gas = 1.5/64 × 100
= 2.34 l/100 km or 100 MPG, plus 156 Wh/km electricity
• Scenario 2: If the total energy consumption (gasoline and electricity) during CDmode is converted to gasoline equivalent, then the total energy consumption is
FCCD,Total = 2.34 l
100 km+ 15 600 Wh
100 km· 1
33 700 × 1.609= 2.63 l/100 km or 89 MPG
• Scenario 3: Beyond 64 km, its fuel consumption is
FCCS = 6.251/100 km or 37.7 MPG
• Scenario 4: The UF of this car is 0.62. The combined fuel economy by usingthe UF will be
FEGas_equivalent = 1UF
FECD+ 1 − UF
FECS
= 10.62
100+ 1 − 0.62
37.7
= 61 MPG
• Scenario 5: In this case, it is assumed that the car has a full tank of gasolineand a fully charged battery. It is then driven the full range of 724 km. If weconsider the UF as the ratio of CD range versus total range, then the UF of thiscar is 64 km/724 km = 0.088. The overall fuel economy for the total range canbe expressed as follows:
FEoverall = 452 miles40 miles
FECD+ 412 miles
FECS
= 40 MPG, plus 10 kWh electricity
5.5 Power Management of PHEVs
A PHEV involves the operating conditions of both CD mode and CS mode. Typically,when the battery is fully charged, the vehicle is operated in CD mode, and when the
116 Hybrid Electric Vehicles
battery state of charge (SOC) reaches a low threshold, it switches to CS mode. In CDmode, the vehicle will maximize the use of battery energy. In CS mode the vehicle willuse gasoline to power the vehicle while maintaining the battery SOC at the same level.
During CD mode operation, the goal of vehicle power management is to minimizethe total energy consumption by distributing power between the battery and the gaso-line engine/generator for a given driving scenario. In other words, the goal of powermanagement in a PHEV is to minimize the fuel consumption for a given drive scenario.
For a series PHEV (or EREV), if the drive distance is less than the nominal electricdrive range, then it is possible to operate the vehicle in all-electric mode, hence no fuelis consumed. If the drive distance is longer than the electric range, then there are threepossible approaches for operating the vehicle:
1. Operate the vehicle in electric mode until the battery is depleted to a preset threshold,then run in CS mode.
2. Operate the vehicle in a blended mode with the engine turning on at high powerdemands, and deplete the battery to the preset threshold at the end of the totaldriving cycle.
3. Operate the vehicle in a blended mode with the engine turning on at high powerdemands but with an optimal battery discharge policy, so the battery will be depletedto the preset threshold before the end of the total driving cycle.
In these approaches, since the total drive distance is the same, the one that consumesthe least fuel will be the best choice. The fact that the battery will exhibit a large powerloss at high power output in comparison to its output power, it may be advantageous tooperate the vehicle in blended mode. The optimization problem can be expressed as
min {fuel consumption}Subject to a given distance and drive cycle
For a blended PHEV, since there is no pure electric range available, the goal of thepower management is to minimize fuel consumption for a given drive cycle and giventotal battery energy available. This is strongly related to the characteristics of the powersources (battery and engine).
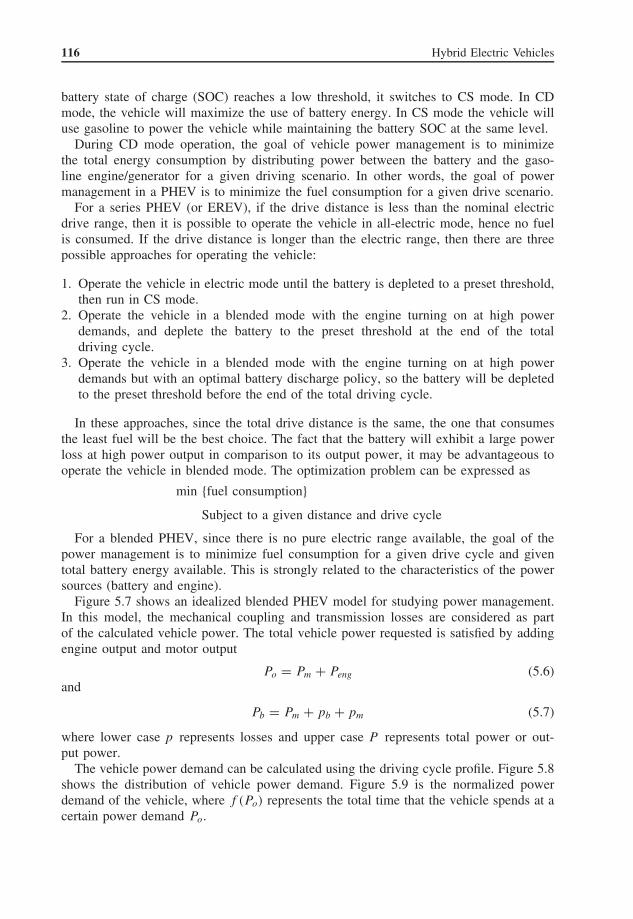
Figure 5.7 shows an idealized blended PHEV model for studying power management.In this model, the mechanical coupling and transmission losses are considered as partof the calculated vehicle power. The total vehicle power requested is satisfied by addingengine output and motor output
Po = Pm + Peng (5.6)and
Pb = Pm + pb + pm (5.7)
where lower case p represents losses and upper case P represents total power or out-put power.
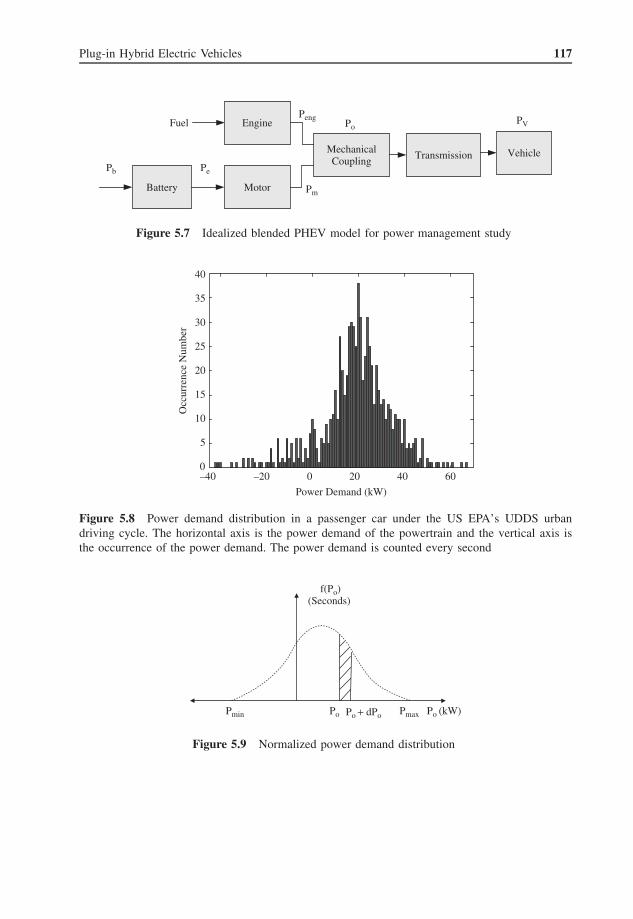
The vehicle power demand can be calculated using the driving cycle profile. Figure 5.8shows the distribution of vehicle power demand. Figure 5.9 is the normalized powerdemand of the vehicle, where f (Po) represents the total time that the vehicle spends at acertain power demand Po.
Plug-in Hybrid Electric Vehicles 117
MechanicalCoupling
Transmission
Battery Motor
Vehicle
PengPo
PePb
EngineFuel
Pm
PV
Figure 5.7 Idealized blended PHEV model for power management study
40
–40 –20 0 20 40 60
5
10
15
20
25
30
35
Power Demand (kW)
Occ
urre
nce
Num
ber
0
Figure 5.8 Power demand distribution in a passenger car under the US EPA’s UDDS urbandriving cycle. The horizontal axis is the power demand of the powertrain and the vertical axis isthe occurrence of the power demand. The power demand is counted every second
f(Po)(Seconds)
Po (kW)PmaxPmin Po Po + dPo
Figure 5.9 Normalized power demand distribution
118 Hybrid Electric Vehicles
The total battery energy consumed during the drive cycle is
Eb =∫ Pmax
Pmin
Pbf (Po) dPo (5.8)
The total fuel consumed is
Fe =∫ Pmax
Pmin
f (Peng)f (Po) dPo (5.9)
where f (Peng) is the fuel consumption of the engine for a given power output of Peng.The optimization problem is to minimize the total fuel consumption Fe for a given
battery energy Eb = constant.
5.6 PHEV Design and Component Sizing
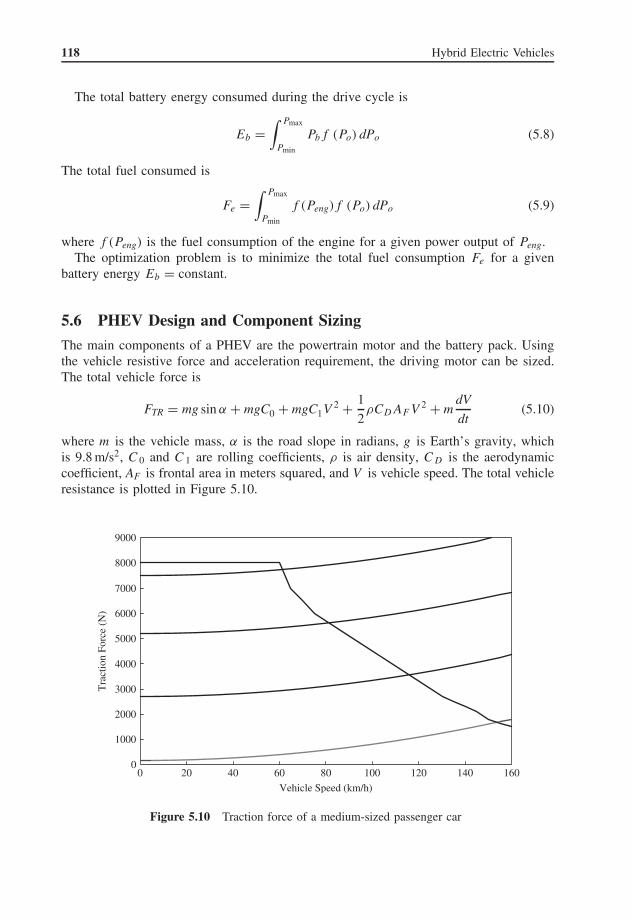
The main components of a PHEV are the powertrain motor and the battery pack. Usingthe vehicle resistive force and acceleration requirement, the driving motor can be sized.The total vehicle force is
FTR = mg sin α + mgC0 + mgC1V2 + 1
2ρCDAF V 2 + m
dV
dt(5.10)
where m is the vehicle mass, α is the road slope in radians, g is Earth’s gravity, whichis 9.8 m/s2, C 0 and C 1 are rolling coefficients, ρ is air density, C D is the aerodynamiccoefficient, AF is frontal area in meters squared, and V is vehicle speed. The total vehicleresistance is plotted in Figure 5.10.
0
1000
2000
3000
4000
5000
6000
7000
8000
9000
0 20 40 60 80 100 120 140 160
Vehicle Speed (km/h)
Tra
ctio
n Fo
rce
(N)
Figure 5.10 Traction force of a medium-sized passenger car
Plug-in Hybrid Electric Vehicles 119
At any given vehicle speed, the power at the wheels is
P = FTRV =(
mg sin α + mgC0 + mgC1V2 + 1
2ρCDAF V 2 + m
dV
dt
)V (5.11)
5.7 Component Sizing of EREVs
Assume the driveline efficiency is ηd . For a PHEV to be capable of electric driving, thepowertrain motor needs to be sized such that the motor can provide sufficient torque forall driving conditions, that is,
Pm = P/ηd (5.12)
The total acceleration time and gradability of the vehicle are other design criteria fortraction motor sizing. In general, the traction motor of an EREV is very similar to thedesign of a series HEV. For example, the typical power rating of a passenger car is about125 kW, and the typical traction motor for a middle-sized sports utility vehicle (SUV) isabout 150 kW.
The engine/generator set of an EREV is designed to provide average power during theextended driving range. In addition to the driveline need, auxiliary power needs shouldalso be considered.
For the traction battery, there are two very important parameters: energy capacity andpower capacity. Since the EREV is designed to operate under all kinds of conditionswithout turning on the engine during CD mode, the battery power rating needs to matchthe traction motor rating. For example, if the traction motor is rated at 125 kW outputwith a system efficiency of 95% (inverter + motor), then the battery needs to have apower capacity of 131.6 kW.
Another parameter of the battery pack is the energy capacity. This can be calculatedbased on the total electric range to be designed. For example, if a vehicle is designed tohave an electric range of 64 km, and the vehicle consumes an average of 150 W per kmin city driving, then the battery needs to be able to provide 9.6 kWh usable energy. If weallow the battery SOC only to go down to 30%, and consider the average efficiency ofthe battery to be 96%, then the nominal energy capacity of the battery will be 14.3 kWh.
Further, if we choose a battery pack that is composed of individual battery cells of3.2 V, 40 Ah, then we will need 112 cells. Connecting all the cells in series will result ina nominal voltage of 358.4 V.
5.8 Component Sizing of Blended PHEVs
The design of the powertrain motor and engine of a blended PHEV is similar to thedesign of a parallel HEV. The only requirement is that the traction motor should be sizedsuch that the vehicle can be driven in electric mode for the majority of city driving. Forhighway driving, the engine will provide power for the driving. In Figure 5.8, a motorrated at 50 kW will cover 95% of the city driving power demand.
The battery sizing is similar to the battery sizing of an ERVE, that is, the equivalentelectric distance required for the PHEV. Since the focus is on city driving, the battery issized to satisfy city driving cycles.
120 Hybrid Electric Vehicles
For example, if a blended PHEV is equipped with a powertrain motor of 50 kW withan efficiency of 95%, then the battery needs to be capable of providing 52.6 kW of power.If the desired city driving distance in electric mode is 40 km, and the power consumptionis 160 W per km, then the battery needs to have a usable capacity of 6.4 kWh. Again, ifwe assume that battery SOC can only go down to 30%, and has an average efficiency of95%, then the battery nominal capacity will be 9.6 kWh. If we choose battery cells ratedat 3.75 V, 32 Ah each, then the total battery cells needed is 80. Connecting all cells inseries will result in a nominal voltage of 300 V.
5.9 HEV to PHEV Conversions
At the time of writing, automotive companies are still in the process of developing PHEVs.Since there has been no mass-produced PHEV available for the past few years, regularHEVs have been converted to PHEVs by interested parties. Many independent conversionshave been performed by various groups (such as Cal-Cars) and companies (such as A123Hymotion, EEtrex, etc.) (http://www.eaa-phev.org/).
There are two potential ways to perform the conversion. One way is to replace theoriginal battery pack (usually a nickel metal hydride (NiMH) battery) with a largerbattery (usually lithium-ion batteries). Another way is to add an extra battery pack tothe vehicle system.
Typical HEVs today are equipped with a NiMH battery pack ranging from 1.2 to2.2 kWh. A converted PHEV will usually have a battery pack in the range of 7–16 kWh.This new or extra battery capacity will either make it possible to drive the vehicle inall-electric mode or significantly increase the fuel consumption of the car in the initialdrive range.
5.9.1 Replacing the Existing Battery Pack
In this approach, the original battery pack is removed and a new battery pack is installed. Incustomized conversions of HEVs to PHEVs, the vehicle control is usually kept intact.In order to utilize the battery energy, usually the battery information is manipulated, orspoofed. One way of doing this is to replace the original battery ECU (Electronic ControlUnit) with a new battery ECU that duplicates all the battery information. However, thereal battery information is spoofed to a value such that the vehicle controller thinks thereis sufficient energy and power from the battery so that it uses more battery energy todrive the car.
Another approach for spoofing the battery data is to use a gateway, as shown inFigure 5.11. The real battery information is sent to a gateway, which then sends manip-ulated battery data to the vehicle controller. The gateway can be part of the new batteryECU, or a standalone ECU.
Most HEVs use high-voltage (HV) NiMH batteries (HV battery). The power and energyavailable from the battery are typically determined by the battery SOC and battery tem-perature. The battery ECU constantly monitors the HV battery conditions, includingtemperature, voltage, and amperage, and calculates the SOC. When the vehicle is inmotion, the HV battery goes through repetitive charge and discharge cycles (dischargedduring acceleration and charged during regenerative braking). The battery could also be
Plug-in Hybrid Electric Vehicles 121
Battery ECU(Real battery data)
Gateway ECU
VehicleHV ECU
Manipulatedbattery data
Real batterydata
Other data or signals
Figure 5.11 Gateway approach in the conversion of HEV to PHEV
charged by the motor/generator using engine power as necessary. The ECU calculates theSOC and sends charge/discharge requests to the vehicle ECU to maintain the SOC at amedian level. In the Prius, for example, the target SOC is 60% within a ±20% band.When the SOC drops below the controlled region (40%), the battery ECU sends a requestto the vehicle ECU, which then sends a request to the engine ECU to increase enginepower to charge the battery. If the SOC increases to above the controlled region (80%),then the battery ECU sends a request to the vehicle ECU, which then sends a request tothe motor so that the battery power is discharged by using the motor to drive the vehicle(either alone, or in combination with the engine).
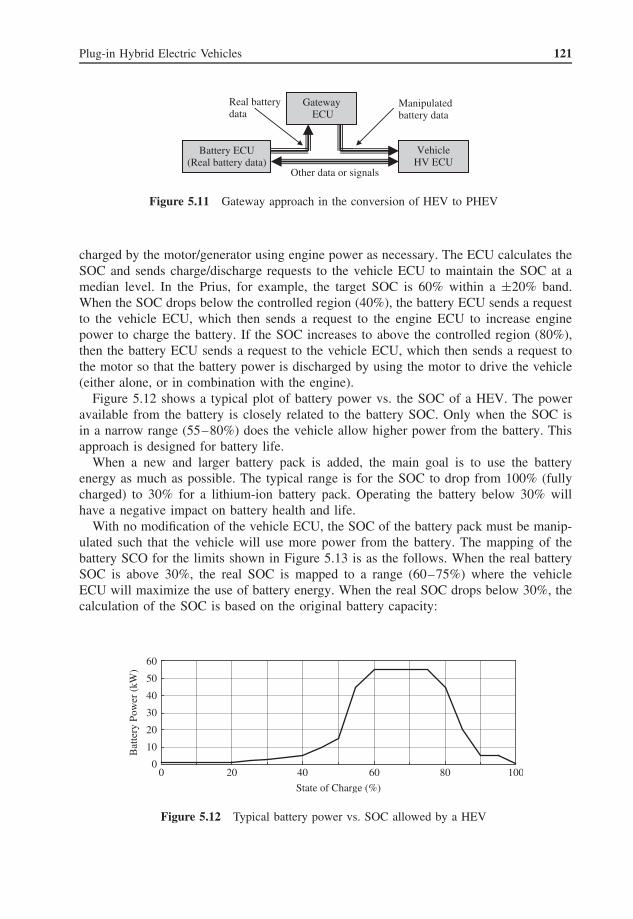
Figure 5.12 shows a typical plot of battery power vs. the SOC of a HEV. The poweravailable from the battery is closely related to the battery SOC. Only when the SOC isin a narrow range (55–80%) does the vehicle allow higher power from the battery. Thisapproach is designed for battery life.
When a new and larger battery pack is added, the main goal is to use the batteryenergy as much as possible. The typical range is for the SOC to drop from 100% (fullycharged) to 30% for a lithium-ion battery pack. Operating the battery below 30% willhave a negative impact on battery health and life.
With no modification of the vehicle ECU, the SOC of the battery pack must be manip-ulated such that the vehicle will use more power from the battery. The mapping of thebattery SCO for the limits shown in Figure 5.13 is as the follows. When the real batterySOC is above 30%, the real SOC is mapped to a range (60–75%) where the vehicleECU will maximize the use of battery energy. When the real SOC drops below 30%, thecalculation of the SOC is based on the original battery capacity:
0
10
20
30
40
50
60
0 20 40 60 80 100
State of Charge (%)
Bat
tery
Pow
er (
kW)
Figure 5.12 Typical battery power vs. SOC allowed by a HEV
122 Hybrid Electric Vehicles
Real battery SOC: [30%, 100%] Manipulated SOC: [60% . 75%]
Real battery SOC < 30% Manipulated SOC: Δ SOC + 60%
Figure 5.13 Actual and manipulated battery SOC information for powertrain control purposes ina converted PHEV
If SOC real > 0.3, then
SOCreal = (Ah)new − ∫idt
(Ah)new(5.13)
SOCmanipulated = 60% + 0.21(SOCreal − 0.3) (5.14)If SOC real < 0.3, then
SOCmanipulated = �SOC + 0.6 =∫
idt
(Ah)old+ 0.6 (5.15)
where (Ah)old is the capacity of the original pack, and (Ah)new is the capacity of thenew pack.
5.9.2 Adding an Extra Battery Pack
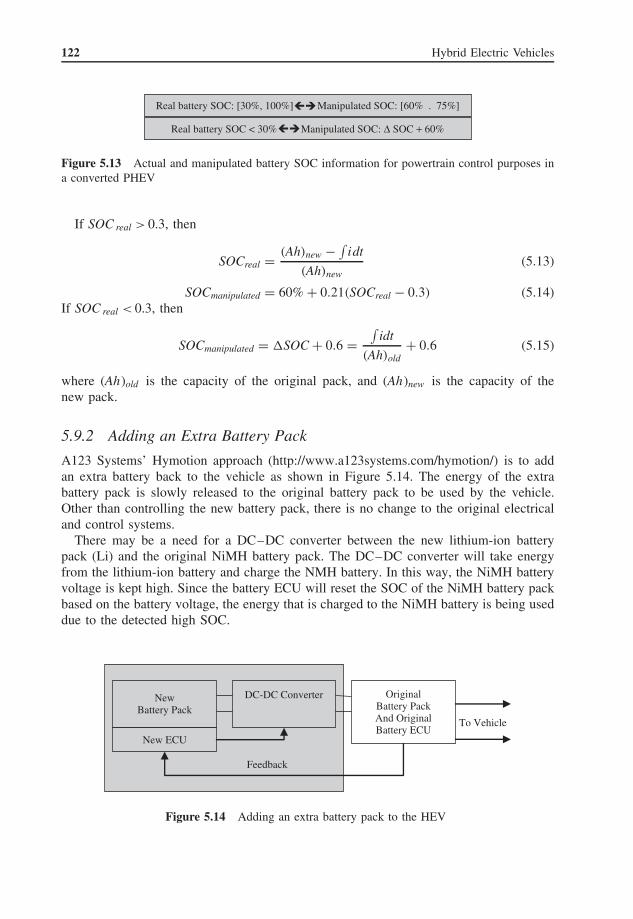
A123 Systems’ Hymotion approach (http://www.a123systems.com/hymotion/) is to addan extra battery back to the vehicle as shown in Figure 5.14. The energy of the extrabattery pack is slowly released to the original battery pack to be used by the vehicle.Other than controlling the new battery pack, there is no change to the original electricaland control systems.
There may be a need for a DC–DC converter between the new lithium-ion batterypack (Li) and the original NiMH battery pack. The DC–DC converter will take energyfrom the lithium-ion battery and charge the NMH battery. In this way, the NiMH batteryvoltage is kept high. Since the battery ECU will reset the SOC of the NiMH battery packbased on the battery voltage, the energy that is charged to the NiMH battery is being useddue to the detected high SOC.
Feedback
NewBattery Pack
OriginalBattery PackAnd OriginalBattery ECU
To Vehicle
New ECU
DC-DC Converter
Figure 5.14 Adding an extra battery pack to the HEV
Plug-in Hybrid Electric Vehicles 123
5.9.3 Converting Conventional Vehicles to PHEVs
Some vehicles, such as pickup trucks, have abundant space available. Hybrid ElectricVehicles Technology Inc. and Raser Inc. have each converted a conventional gasoline-powered pickup truck to a PHEV (http://hevt.com/flyers/HEVT%20Ford%20F150%20Pickup%20Truck%20Plug-in%20Hybrid%20Electric%20Conversion.pdf, http://www.rasertech.com/). In the former approach, the company kept the existing front axle as gasolineengine driven, but modified the rear axle by adding an induction motor and an extrabattery pack. The vehicle controller needs to be modified to take advantage of the batteryenergy.
5.10 Other Topics on PHEVs
5.10.1 End-of-Life Battery for Electric Power Grid Support
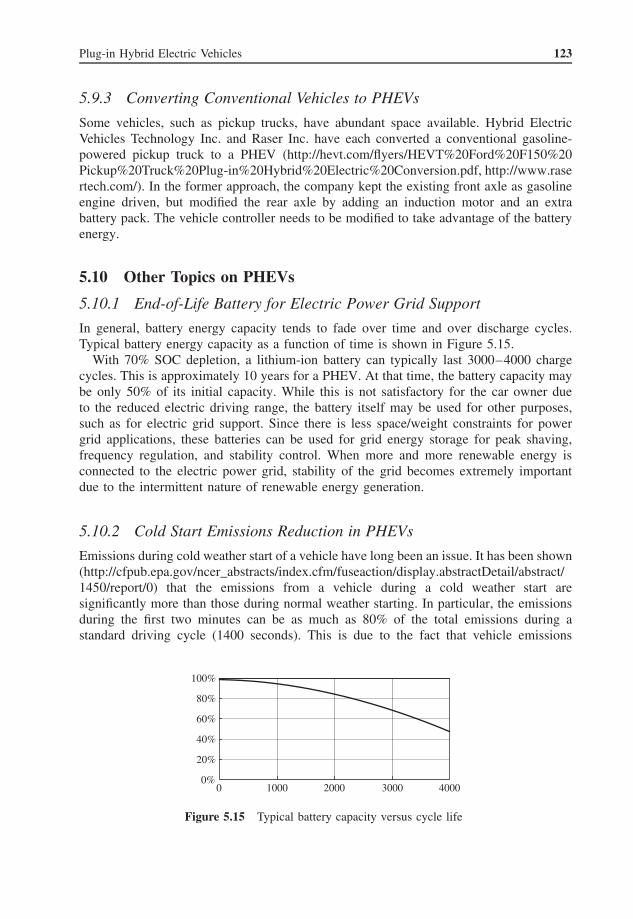
In general, battery energy capacity tends to fade over time and over discharge cycles.Typical battery energy capacity as a function of time is shown in Figure 5.15.
With 70% SOC depletion, a lithium-ion battery can typically last 3000–4000 chargecycles. This is approximately 10 years for a PHEV. At that time, the battery capacity maybe only 50% of its initial capacity. While this is not satisfactory for the car owner dueto the reduced electric driving range, the battery itself may be used for other purposes,such as for electric grid support. Since there is less space/weight constraints for powergrid applications, these batteries can be used for grid energy storage for peak shaving,frequency regulation, and stability control. When more and more renewable energy isconnected to the electric power grid, stability of the grid becomes extremely importantdue to the intermittent nature of renewable energy generation.
5.10.2 Cold Start Emissions Reduction in PHEVs
Emissions during cold weather start of a vehicle have long been an issue. It has been shown(http://cfpub.epa.gov/ncer_abstracts/index.cfm/fuseaction/display.abstractDetail/abstract/1450/report/0) that the emissions from a vehicle during a cold weather start aresignificantly more than those during normal weather starting. In particular, the emissionsduring the first two minutes can be as much as 80% of the total emissions during astandard driving cycle (1400 seconds). This is due to the fact that vehicle emissions
0%
20%
40%
60%
80%
100%
0 1000 2000 3000 4000
Figure 5.15 Typical battery capacity versus cycle life
124 Hybrid Electric Vehicles
are usually treated by a catalytic converter. A typical converter needs to heat up tofunction properly.
For conventional vehicles, a number of methods have been proposed to mitigate coldweather start emissions, such as catalytic heaters, novel materials, and so on.
It is possible to reduce cold start emissions in PHEVs by using the large onboard batterypack. The idea is to operate the vehicle in electric-only mode in the first few minutesand, at the same time, use electricity from the battery to warm up the catalytic converterto a certain temperature. Once the converter is normal and functional, the engine may bestarted as needed. However, almost all batteries do not work well under extremely coldweather conditions. Not only do the useful energy decrease and the internal impedanceincrease (efficiency drop), but also there is a negative impact on battery life if the dischargepower is large. A reasonable compromise needs to be made in this regard.
5.10.3 Cold Weather/Hot Weather Performance Enhancement in PHEVs
The typical operating temperature range of a lithium-ion battery is from 0 to 50 ◦C. Inextreme cold or hot weather conditions, the battery will exhibit large internal impedanceand reduced power levels. In order to extend the driving distance and the battery life ofa PHEV during cold weather conditions, additional measures may be necessary.
One method is to thermally insulate the battery pack so that no or very little heatexchange takes place between the battery cells and the ambient air, except at the coolingoutlet. This thermal insulation will allow the battery to hold a steady temperature for anextended period of time during extreme cold or hot weather conditions. Another approachis to heat up the battery during cold weather by using an internal heater that consumesbattery energy to warm up the battery pack. An additional method includes keeping thebattery in trickle charge mode when plugged in to the power grid.
5.10.4 PHEV Maintenance
One issue of PHEVs is that if the driver always drives less than the electric range and isalways charging the battery, the engine may never start. This could cause the fuel to gostale and some mechanical parts including ones in the engine to seize. Therefore, vehiclessuch as the Chevrolet Volt have been designed with an additional mode, namely, themaintenance mode [10]. This mode is activated either by the driver or automatically tooperate the engine and the generator routinely to maintain the health of those components.
5.10.5 Safety of PHEVs
HEVs and PHEVs deal with high voltages and a large amount of energy in the batterypack. A PHEV is safe under normal drive conditions but safety can be an issue duringcharging (rain or wet plug), repair and service of the vehicle, as well as in a accident.Just like any HV system, the electrical system in a HEV or PHEV can be unsafe whenmishandled. HV systems may cause electrical hazards if not handled properly, includingelectric shock, arcing, and blast [11].
Plug-in Hybrid Electric Vehicles 125
The car’s HV system is isolated from the ground and also isolated from the vehiclechassis. Therefore, electrical hazards can only arise when a person holds both the positiveand the negative terminals of the HV system while repairing or servicing the car.
However, PHEVs must be plugged into an electrical outlet to charge the onboardbattery. Advanced charging techniques, such as inductive and wireless charging, couldpotentially reduce the risk of electric shock during charging of the vehicle but will alsoreduce charge efficiency and increase system cost.
Charging the vehicle during rainy days with a contact charger can potentially causeleakage of current to the person handling the plug. Old and worn plugs and cables cancause current leakage. Therefore, extra caution needs to be taken when charging thevehicle. The leakage current can cause electric shocks, leading to muscle contraction,fibrillation, and tissue damage. A 10 mA current is enough to cause muscles to contract.A person may not be able to release the grip of his or her hand if it is exposed to sufficientelectric current. If sufficient current goes through the chest, the person’s chest muscle mayparalyze and halt breathing.
More severe damage, such as fibrillation, can happen if the body’s normal heartbeat isdisrupted. The HV system, in particular the charger voltage from the electrical outlet, isenough to interrupt the brain current and cause the heart to stop beating. However, thecurrent must follow a path through the body (hand to ground, hand to hand) in order forfibrillation to occur. Tissues can be damaged from prolonged exposure to electric shockdue to heat concentration in the tissues.
The high-power, high-voltage connectors may become short-circuited during an acci-dent and cause sparks or overheat, which could lead to a fire or explosion. After-marketPHEVs typically have the battery installed at the back of the vehicle. This may be anissue during a rear collision. The added battery pack also shifts the weight center of thevehicle, which may cause stability problems during braking. Mass-produced PHEVs willhave been designed taking battery weight into consideration, and the batteries are likelynot to be installed in the crash zone. Safety disconnection devices such as a service plugand fast fuse will provide additional safety measures.
Extra care should be taken when working on a PHEV during maintenance and repair.For example, insulation gloves are necessary in order to avoid electric shock when han-dling the HV system. Terminals of cables need to be insulated if they are disconnectedfrom their original place. Tools and instruments should have insulated handles whendealing with the battery and other HV components in the PHEV. In fact, the handlingand safety measures in the EV, HEV, and PHEV are the same as those used in homeelectrical repairs.
5.11 Vehicle-to-Grid Technology
Vehicle-to-grid, or V2G, is a concept referring to the capability of bidirectionalpower and energy exchange between the power grid and the vehicle battery(http://www.ornl.gov/info/ornlreview/v40_2_07/2007_plug-in_paper.pdf) [3, 4]. With thebidirectional charger, the vehicle can be used a power backup for the home or office. It isalso possible to use the PHEV battery to control the stability and regulate the frequencyand voltage of the power grid, such as in a distributed power grid and with renewableenergy generation.
126 Hybrid Electric Vehicles
PHEVs need to be charged from the electric power grid. During charging, the chargerwill generate inrush current, harmonics, and could cause the grid to malfunction if notcoordinated properly.
In a broad sense, and in the foreseeable future, hundreds of thousands of PHEVs willbe connected to the power grid as electric drive transportation prevails as our ultimatesolution to becoming independent of fossil fuels. It is imperative to study the grid-to-vehicle (G2V) impact on power system operation and to consider various factors such asbattery size, charging, PHEV distribution, and efficiency [12].
In order to optimize G2V it is important to educate consumers in the context of a“smart grid.” They should be made aware of the fact that battery charging at night wouldimprove utility generation efficiency, because at night-time the electricity is supplied bythe base load generation units. Studies show that even with 50% penetration of PHEVsinto the power system, no additional generating capacity or no new power plants arerequired [12]. Although there are concerns with PHEVs straining the grid, PHEVs, ifproperly managed, actually could help prevent brownouts, reduce the cost of electricity,and accommodate the integration of more renewable energy resources.
5.11.1 PHEV Battery Charging
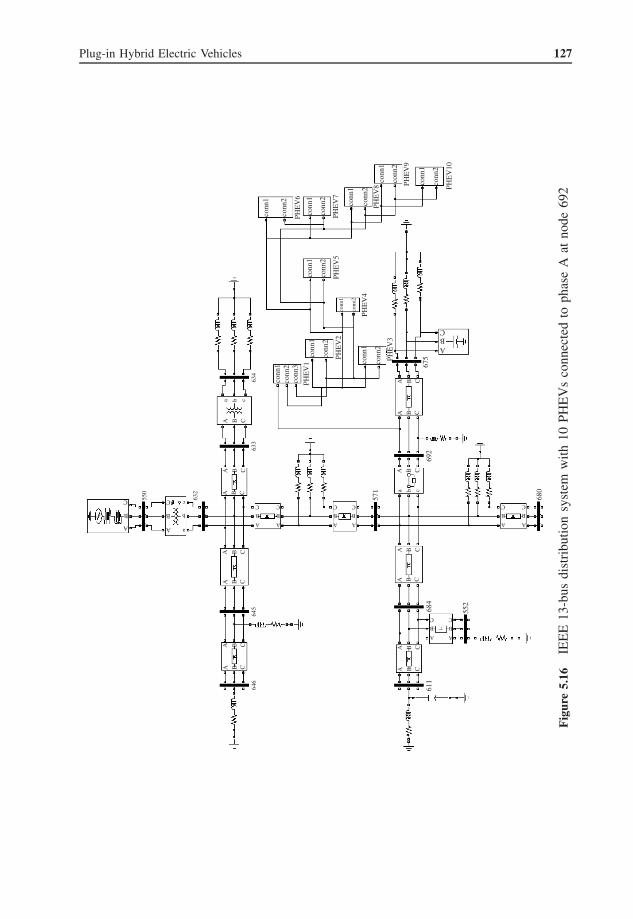
There are three levels of charging for the PHEV depending on the voltage: single-phaseAC 120 V, single-phase AC 240 V, and three-phase AC 480 V. The different voltage levelswill affect the charging time, ranging from hours to tens of minutes. In general, there arefour types of charging algorithms for PHEV: constant voltage, constant current, constantvoltage and constant current, and pulse charging. These different charging algorithmsrequire corresponding controller designs for power electronics circuits. In this section,the pulse charging technique is studied in detail through simulation. Here PHEVs areconnected to an example distribution system. The case of 10 PHEVs has been consideredfor simulations in which the PHEVs are connected to an IEEE 13-bus distribution system.Figure 5.16 shows this distribution system together with PHEVs. The system is relativelysmall and highly loaded. For this study, the PHEVs are connected between nodes 692and 675 of the distribution system.
The PHEVs connected to the distribution system via a single-phase transformer arecharged by the pulse charging technique. Initially the battery is assumed to have a 90%SOC. The battery is charged by the DC–DC converter with pulse current until it reachesa 95% SOC.
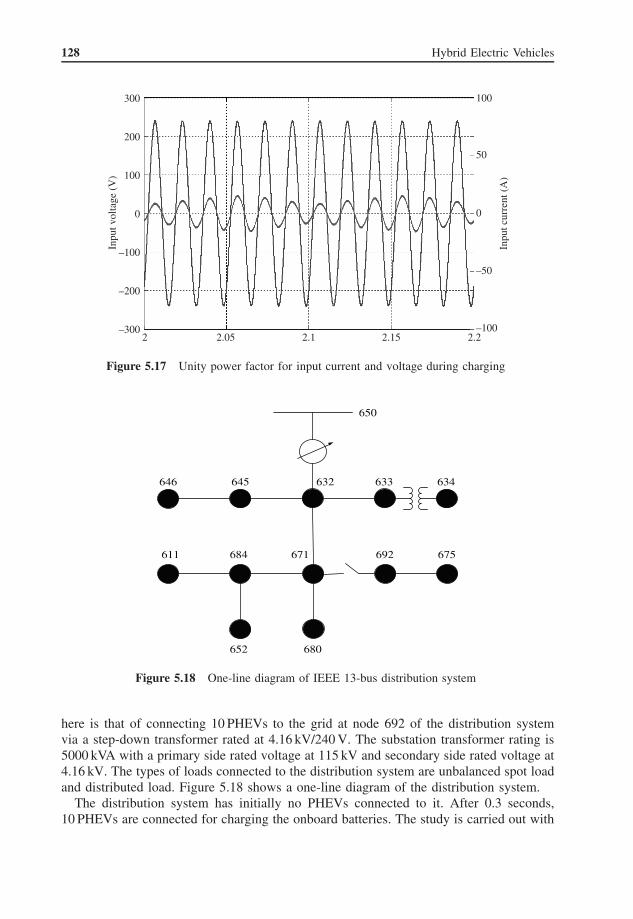
The AC–DC converter connected to the distribution system draws unity power factor,which shows that the PHEV is utility friendly. Figure 5.17 shows the unity power factorfor input current and voltage at the secondary side of the single-phase transformer. Theinput voltage has a 240 V rms value. The reference current is generated by a phase-lockedloop (PLL) block. The secondary side voltage of the transformer is the input to the PLL.This in turn generates a sine wave to form the reference input current for the unity powerfactor controller.
5.11.2 Impact of G2V
The IEEE 13-bus distribution system [13, 14] with 10 PHEVs has been simulated to studythe impact of connecting many PHEVs to the power system/grid. The case to be discussed
Plug-in Hybrid Electric Vehicles 127
conn
1
conn
1
conn
2
conn
1
conn
2
conn
1
conn
2
conn
1
conn
2
conn
2
PHE
V6
PHE
V5
PHE
V4
PHE
V3
675
692
684
611
552
571
680
ABC
A B C
A
B
C
A
B
C
A
B
C
A
B
C
A
B
C
A
B
C
A
B
C
A
B
C
A B C
a b c
A
B
C
A
B
C
a
b
c
A B C
A B C
A B C
A B C
A B C
A B C
A B C
A B C
A B C
A B C
A B C
PHE
V2
PHE
V1
PHE
V7
PHE
V8 PH
EV
9
PHE
V10
conn
1
conn
2
conn
1
conn
2
conn
1
conn
2
conn
1co
nn2
conn
3
conn
1
conn
2
A B C
a b c
550
632
646
645
633
634
Fig
ure
5.16
IEE
E13
-bus
dist
ribu
tion
syst
emw
ith10
PHE
Vs
conn
ecte
dto
phas
eA
atno
de69
2
128 Hybrid Electric Vehicles
300 100
50
0
–50
Inpu
t cur
rent
(A
)
Inpu
t vol
tage
(V
)
–100
200
100
0
–100
–200
–3002 2.05 2.1 2.15 2.2
Figure 5.17 Unity power factor for input current and voltage during charging
.
692
633632
650
645646
611 684 671
652 680
675
634
Figure 5.18 One-line diagram of IEEE 13-bus distribution system
here is that of connecting 10 PHEVs to the grid at node 692 of the distribution systemvia a step-down transformer rated at 4.16 kV/240 V. The substation transformer rating is5000 kVA with a primary side rated voltage at 115 kV and secondary side rated voltage at4.16 kV. The types of loads connected to the distribution system are unbalanced spot loadand distributed load. Figure 5.18 shows a one-line diagram of the distribution system.
The distribution system has initially no PHEVs connected to it. After 0.3 seconds,10 PHEVs are connected for charging the onboard batteries. The study is carried out with
Plug-in Hybrid Electric Vehicles 129
3000
2000
1000
–1000
–2000
–30000.2
Phas
e A
vol
tage
(V
)
0.25 0.3
Time
0.35 0.4 0.45
0
Figure 5.19 Phase A voltage with PHEV connected at t = 0.3 seconds
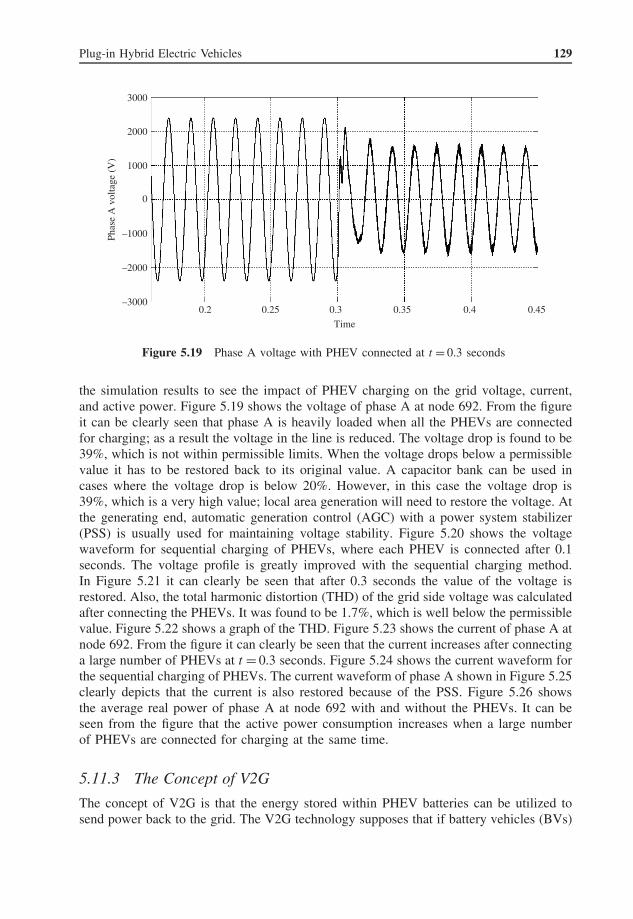
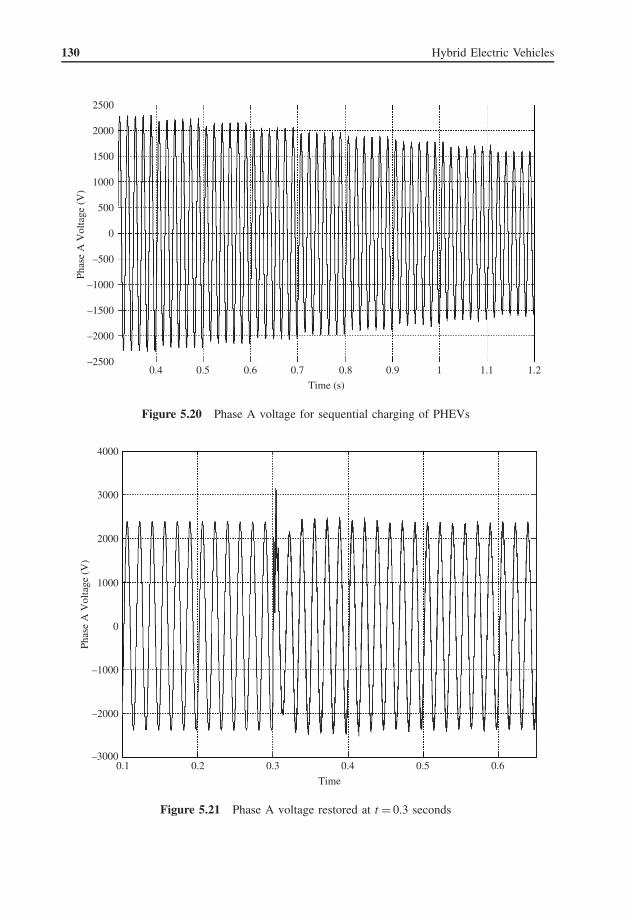
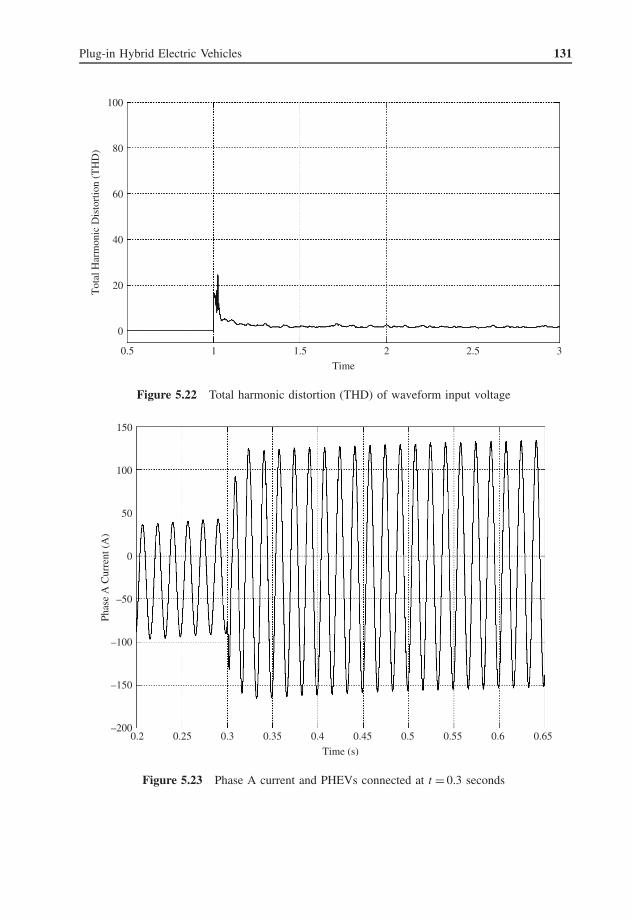
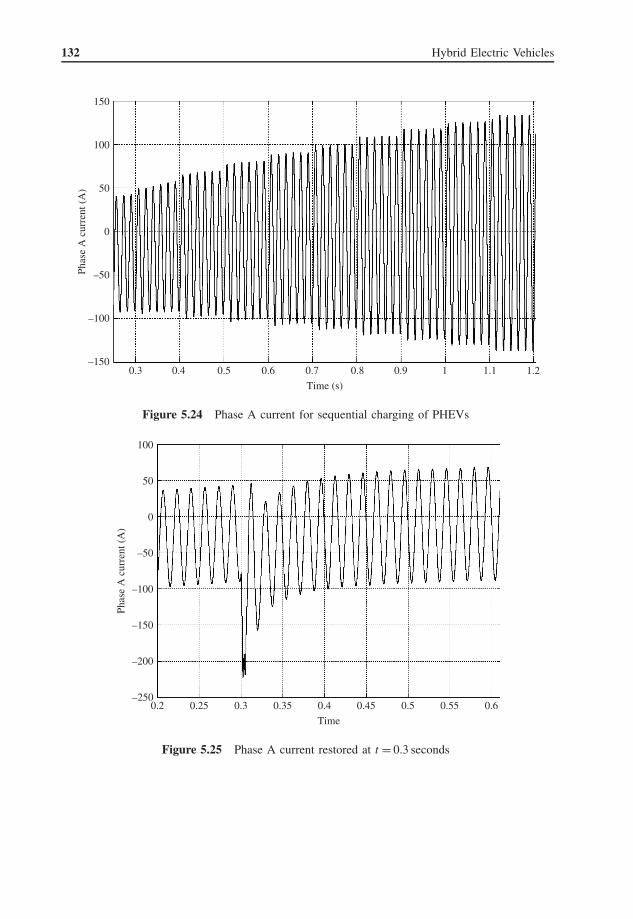
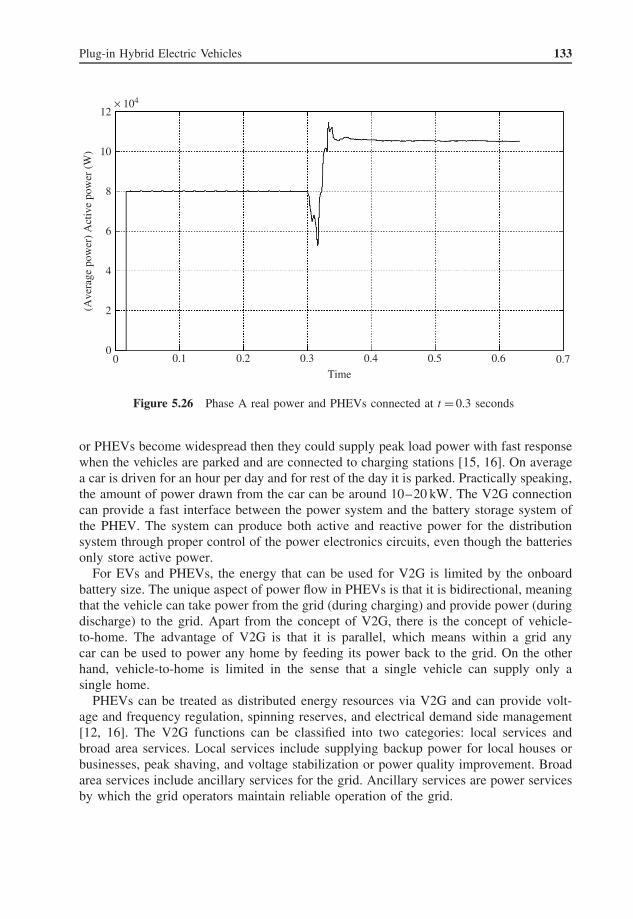
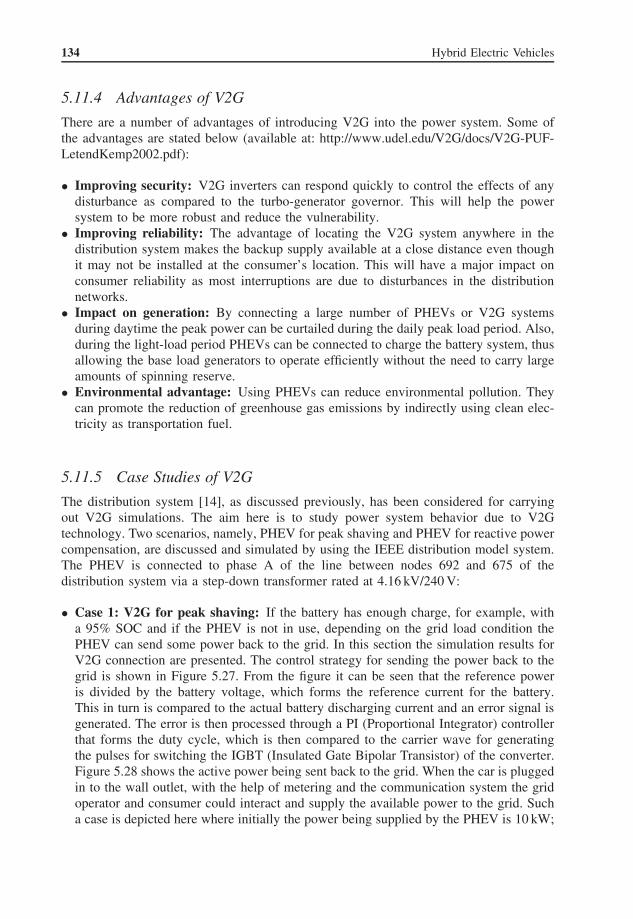
the simulation results to see the impact of PHEV charging on the grid voltage, current,and active power. Figure 5.19 shows the voltage of phase A at node 692. From the figureit can be clearly seen that phase A is heavily loaded when all the PHEVs are connectedfor charging; as a result the voltage in the line is reduced. The voltage drop is found to be39%, which is not within permissible limits. When the voltage drops below a permissiblevalue it has to be restored back to its original value. A capacitor bank can be used incases where the voltage drop is below 20%. However, in this case the voltage drop is39%, which is a very high value; local area generation will need to restore the voltage. Atthe generating end, automatic generation control (AGC) with a power system stabilizer(PSS) is usually used for maintaining voltage stability. Figure 5.20 shows the voltagewaveform for sequential charging of PHEVs, where each PHEV is connected after 0.1seconds. The voltage profile is greatly improved with the sequential charging method.In Figure 5.21 it can clearly be seen that after 0.3 seconds the value of the voltage isrestored. Also, the total harmonic distortion (THD) of the grid side voltage was calculatedafter connecting the PHEVs. It was found to be 1.7%, which is well below the permissiblevalue. Figure 5.22 shows a graph of the THD. Figure 5.23 shows the current of phase A atnode 692. From the figure it can clearly be seen that the current increases after connectinga large number of PHEVs at t = 0.3 seconds. Figure 5.24 shows the current waveform forthe sequential charging of PHEVs. The current waveform of phase A shown in Figure 5.25clearly depicts that the current is also restored because of the PSS. Figure 5.26 showsthe average real power of phase A at node 692 with and without the PHEVs. It can beseen from the figure that the active power consumption increases when a large numberof PHEVs are connected for charging at the same time.
5.11.3 The Concept of V2G
The concept of V2G is that the energy stored within PHEV batteries can be utilized tosend power back to the grid. The V2G technology supposes that if battery vehicles (BVs)
130 Hybrid Electric Vehicles
2500
–2500
2000
–2000
–1500
1500
1000
–1000
500
–500
Phas
e A
Vol
tage
(V
)
0
0.4 0.5 0.6 0.7
Time (s)
0.8 0.9 1 1.1 1.2
Figure 5.20 Phase A voltage for sequential charging of PHEVs
4000
3000
2000
1000
–1000
–2000
–30000.1
Phas
e A
Vol
tage
(V
)
0.2 0.3 0.4
Time
0.5 0.6
0
Figure 5.21 Phase A voltage restored at t = 0.3 seconds
Plug-in Hybrid Electric Vehicles 131
100
80
60
40
20
0
10.5
Tot
al H
arm
onic
Dis
tort
ion
(TH
D)
1.5
Time
2 2.5 3
Figure 5.22 Total harmonic distortion (THD) of waveform input voltage
150
100
50
–50
–100
–150
–2000.2 0.25 0.3 0.35 0.4
Time (s)
0.45 0.5 0.55 0.6 0.65
0
Phas
e A
Cur
rent
(A
)
Figure 5.23 Phase A current and PHEVs connected at t = 0.3 seconds
132 Hybrid Electric Vehicles
Phas
e A
cur
rent
(A
)
0.3 0.4
Time (s)
0.5 0.6 0.7 0.8 0.9 1 1.1 1.2
150
100
50
–50
–100
–150
0
Figure 5.24 Phase A current for sequential charging of PHEVs
100
50
0
–50
–100
–150
–200
–2500.2 0.25 0.3
Phas
e A
cur
rent
(A
)
0.35 0.4
Time
0.45 0.5 0.55 0.6
Figure 5.25 Phase A current restored at t = 0.3 seconds
Plug-in Hybrid Electric Vehicles 133
× 104
10
12
8
6
(Ave
rage
pow
er)
Act
ive
pow
er (
W)
4
2
00 0.1 0.2 0.3 0.4
Time
0.5 0.6 0.7
Figure 5.26 Phase A real power and PHEVs connected at t = 0.3 seconds
or PHEVs become widespread then they could supply peak load power with fast responsewhen the vehicles are parked and are connected to charging stations [15, 16]. On averagea car is driven for an hour per day and for rest of the day it is parked. Practically speaking,the amount of power drawn from the car can be around 10–20 kW. The V2G connectioncan provide a fast interface between the power system and the battery storage system ofthe PHEV. The system can produce both active and reactive power for the distributionsystem through proper control of the power electronics circuits, even though the batteriesonly store active power.
For EVs and PHEVs, the energy that can be used for V2G is limited by the onboardbattery size. The unique aspect of power flow in PHEVs is that it is bidirectional, meaningthat the vehicle can take power from the grid (during charging) and provide power (duringdischarge) to the grid. Apart from the concept of V2G, there is the concept of vehicle-to-home. The advantage of V2G is that it is parallel, which means within a grid anycar can be used to power any home by feeding its power back to the grid. On the otherhand, vehicle-to-home is limited in the sense that a single vehicle can supply only asingle home.
PHEVs can be treated as distributed energy resources via V2G and can provide volt-age and frequency regulation, spinning reserves, and electrical demand side management[12, 16]. The V2G functions can be classified into two categories: local services andbroad area services. Local services include supplying backup power for local houses orbusinesses, peak shaving, and voltage stabilization or power quality improvement. Broadarea services include ancillary services for the grid. Ancillary services are power servicesby which the grid operators maintain reliable operation of the grid.
134 Hybrid Electric Vehicles
5.11.4 Advantages of V2G
There are a number of advantages of introducing V2G into the power system. Some ofthe advantages are stated below (available at: http://www.udel.edu/V2G/docs/V2G-PUF-LetendKemp2002.pdf):
• Improving security: V2G inverters can respond quickly to control the effects of anydisturbance as compared to the turbo-generator governor. This will help the powersystem to be more robust and reduce the vulnerability.
• Improving reliability: The advantage of locating the V2G system anywhere in thedistribution system makes the backup supply available at a close distance even thoughit may not be installed at the consumer’s location. This will have a major impact onconsumer reliability as most interruptions are due to disturbances in the distributionnetworks.
• Impact on generation: By connecting a large number of PHEVs or V2G systemsduring daytime the peak power can be curtailed during the daily peak load period. Also,during the light-load period PHEVs can be connected to charge the battery system, thusallowing the base load generators to operate efficiently without the need to carry largeamounts of spinning reserve.
• Environmental advantage: Using PHEVs can reduce environmental pollution. Theycan promote the reduction of greenhouse gas emissions by indirectly using clean elec-tricity as transportation fuel.
5.11.5 Case Studies of V2G
The distribution system [14], as discussed previously, has been considered for carryingout V2G simulations. The aim here is to study power system behavior due to V2Gtechnology. Two scenarios, namely, PHEV for peak shaving and PHEV for reactive powercompensation, are discussed and simulated by using the IEEE distribution model system.The PHEV is connected to phase A of the line between nodes 692 and 675 of thedistribution system via a step-down transformer rated at 4.16 kV/240 V:
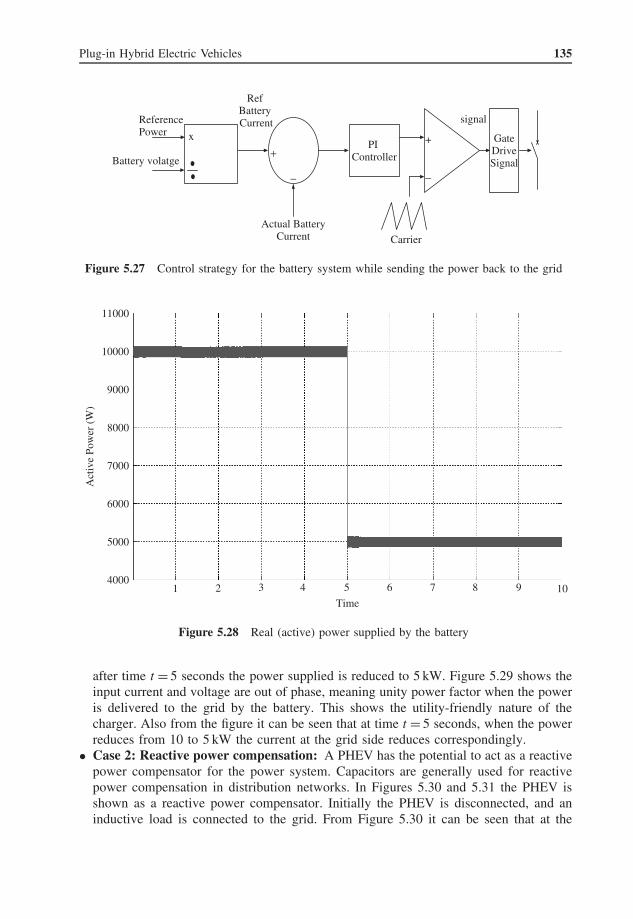
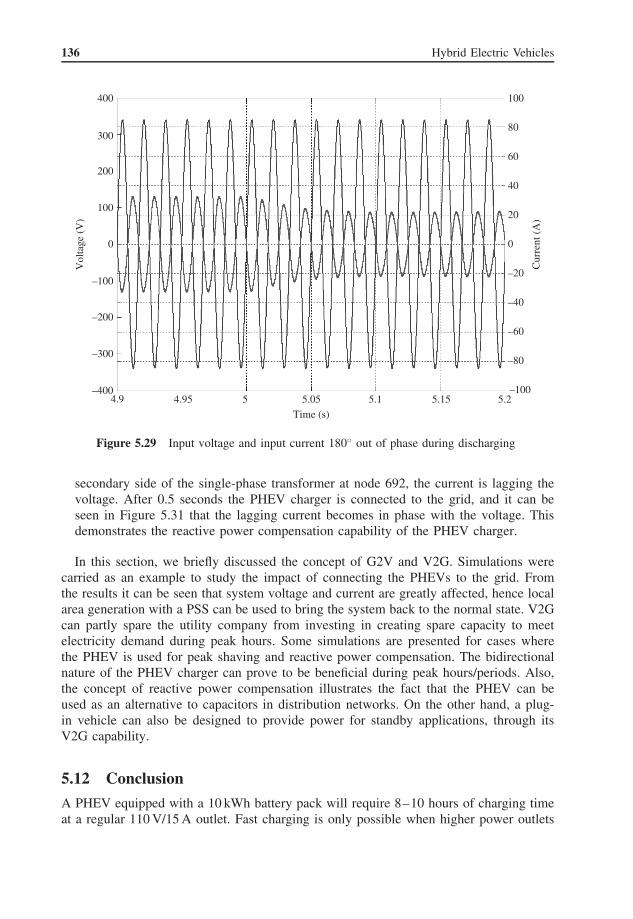
• Case 1: V2G for peak shaving: If the battery has enough charge, for example, witha 95% SOC and if the PHEV is not in use, depending on the grid load condition thePHEV can send some power back to the grid. In this section the simulation results forV2G connection are presented. The control strategy for sending the power back to thegrid is shown in Figure 5.27. From the figure it can be seen that the reference poweris divided by the battery voltage, which forms the reference current for the battery.This in turn is compared to the actual battery discharging current and an error signal isgenerated. The error is then processed through a PI (Proportional Integrator) controllerthat forms the duty cycle, which is then compared to the carrier wave for generatingthe pulses for switching the IGBT (Insulated Gate Bipolar Transistor) of the converter.Figure 5.28 shows the active power being sent back to the grid. When the car is pluggedin to the wall outlet, with the help of metering and the communication system the gridoperator and consumer could interact and supply the available power to the grid. Sucha case is depicted here where initially the power being supplied by the PHEV is 10 kW;
Plug-in Hybrid Electric Vehicles 135
signal
x
+
−
PI Controller
+
−
GateDriveSignal
Actual BatteryCurrent
RefBattery CurrentReference
Power
Battery volatge
Carrier
Figure 5.27 Control strategy for the battery system while sending the power back to the grid
11000
10000
9000
8000
7000
6000
5000
40001 2 3 4 5
Time
6 7 8 9 10
Act
ive
Pow
er (
W)
Figure 5.28 Real (active) power supplied by the battery
after time t = 5 seconds the power supplied is reduced to 5 kW. Figure 5.29 shows theinput current and voltage are out of phase, meaning unity power factor when the poweris delivered to the grid by the battery. This shows the utility-friendly nature of thecharger. Also from the figure it can be seen that at time t = 5 seconds, when the powerreduces from 10 to 5 kW the current at the grid side reduces correspondingly.
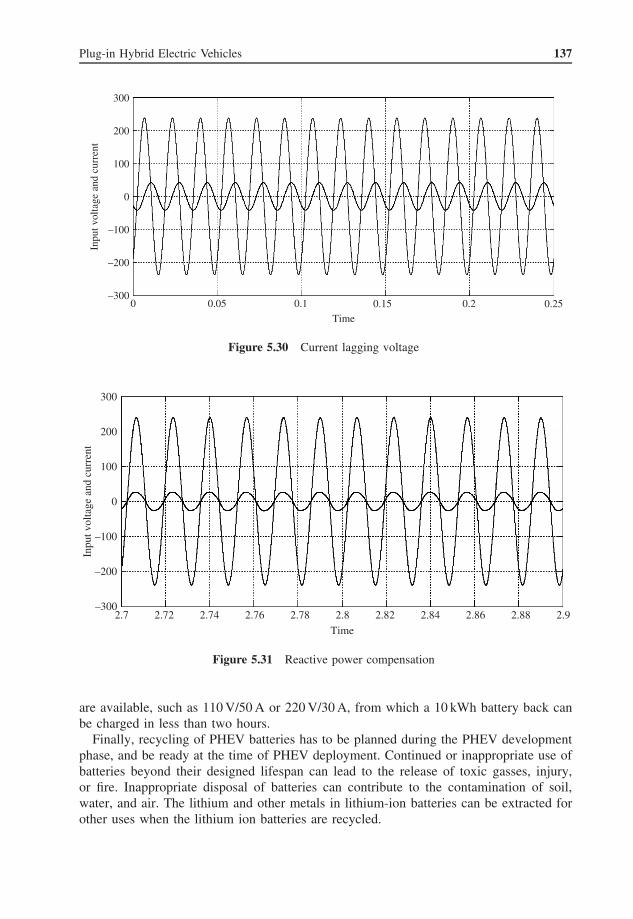
• Case 2: Reactive power compensation: A PHEV has the potential to act as a reactivepower compensator for the power system. Capacitors are generally used for reactivepower compensation in distribution networks. In Figures 5.30 and 5.31 the PHEV isshown as a reactive power compensator. Initially the PHEV is disconnected, and aninductive load is connected to the grid. From Figure 5.30 it can be seen that at the
136 Hybrid Electric Vehicles
400 100
80
60
40
20
0
–20
–40
–60
–80
–100
300
200
100
–100
–200
–300
–4004.9 4.95 5 5.05
Time (s)
Vol
tage
(V
)
5.1 5.15 5.2
0
Cur
rent
(A
)
Figure 5.29 Input voltage and input current 180◦ out of phase during discharging
secondary side of the single-phase transformer at node 692, the current is lagging thevoltage. After 0.5 seconds the PHEV charger is connected to the grid, and it can beseen in Figure 5.31 that the lagging current becomes in phase with the voltage. Thisdemonstrates the reactive power compensation capability of the PHEV charger.
In this section, we briefly discussed the concept of G2V and V2G. Simulations werecarried as an example to study the impact of connecting the PHEVs to the grid. Fromthe results it can be seen that system voltage and current are greatly affected, hence localarea generation with a PSS can be used to bring the system back to the normal state. V2Gcan partly spare the utility company from investing in creating spare capacity to meetelectricity demand during peak hours. Some simulations are presented for cases wherethe PHEV is used for peak shaving and reactive power compensation. The bidirectionalnature of the PHEV charger can prove to be beneficial during peak hours/periods. Also,the concept of reactive power compensation illustrates the fact that the PHEV can beused as an alternative to capacitors in distribution networks. On the other hand, a plug-in vehicle can also be designed to provide power for standby applications, through itsV2G capability.
5.12 Conclusion
A PHEV equipped with a 10 kWh battery pack will require 8–10 hours of charging timeat a regular 110 V/15 A outlet. Fast charging is only possible when higher power outlets
Plug-in Hybrid Electric Vehicles 137
300
200
100
–100
–200
–3000 0.05 0.1 0.15
Time
Inpu
t vol
tage
and
cur
rent
0.2 0.25
0
Figure 5.30 Current lagging voltage
300
200
100
–100
–200
Inpu
t vol
tage
and
cur
rent
–3002.7 2.72 2.74 2.76 2.78 2.8 2.82
Time
2.84 2.86 2.88 2.9
0
Figure 5.31 Reactive power compensation
are available, such as 110 V/50 A or 220 V/30 A, from which a 10 kWh battery back canbe charged in less than two hours.
Finally, recycling of PHEV batteries has to be planned during the PHEV developmentphase, and be ready at the time of PHEV deployment. Continued or inappropriate use ofbatteries beyond their designed lifespan can lead to the release of toxic gasses, injury,or fire. Inappropriate disposal of batteries can contribute to the contamination of soil,water, and air. The lithium and other metals in lithium-ion batteries can be extracted forother uses when the lithium ion batteries are recycled.

138 Hybrid Electric Vehicles
References1. Sanna, L. (2005) Driving the Solution – the Plug-in Hybrid Vehicle. http://mydocs.epri.com/docs/
CorporateDocuments/EPRI_Journal/2005-Fall/1012885_PHEV.pdf (accessed February 2, 2011).2. Douglas, J. (2008) Plug-in hybrids on the horizon – building a business case. Journal of Electric Power
Research Institute (EPRI), Spring.3. Kempton, W. and Tomic, J. (2005) Vehicle-to-grid power implementation: from stabilizing the grid to
supporting large-scale renewable energy. Journal of Power Sources , 144, 28 0–294.4. Gage, T.B. (2003) Development and Evaluation of a Plug-in HEV with Vehicle-to-Grid Power Flow , AC
Propulsion, Inc., San Dimas, CA, CARB Grant Number ICAT 01-2, December 17.5. Electric Power Annual, http://www.eia.doe.gov/cneaf/electricity/epa/figes1.html (accessed February 2,
2011).6. SAE International (2009) Surface Vehicle Information Report SAE J2841 – Utility Factor Definitions for
Plug-in Hybrid Electric Vehicles Using 2001 U.S. DOT National Household Travel Survey Data, March.7. SAE International (1999) Surface Vehicle Recommended Practice SAE J1711 – Recommended Practice
for Measuring the Exhaust Emissions and Fuel Economy of Hybrid-electric Vehicles, March.8. United States Environmental Protection Agency (2006) Fuel Economy Labeling of Motor Vehicles: Revi-
sions to Improve Calculation of Fuel Economy Estimates, Final Rule, 40 CFR Parts 86 and 600, December27, 2006, http://www.epa.gov/fedrgstr/EPA-AIR/2006/December/Day-27/a9749.pdf.
9. Williamson, S.S. and Emadi, A. (2005) Comparative assessment of hybrid electric and fuel cell vehiclesbased on comprehensive well-to-wheels efficiency analysis. IEEE Transactions on Vehicular Technology ,54 (3), 856–862.
10. Maintenance Mode of the Chevrolet Volt, http://gm-volt.com/2010/08/17/chevrolet-volt-maintenance-mode/(accessed February 2, 2011).
11. Ford Ranger EV User’s Manual, http://www.eserviceinfo.com/download.php?fileid=18730 (accessed Febru-ary 2, 2011).
12. Kramer, B., Chakraborty, S., and Kroposki, B. (2008) A review of plug-in vehicles and vehicle-to-gridcapability. IEEE Industrial Electronics Conference IECON’08, November, Orlando, FL, pp. 2278–2283.
13. Kersting, W.H. (1991) Radial distribution test feeders. IEEE Transactions on Power Systems , 6 (3),975–985.
14. Ma, W. and Jing, L. (1997) Distribution modeling and simulation based on MATLAB. 17th Conference ofthe Electric Power Supply Industry (CEPSi 2008), October, Macau SAR.
15. Haines, G., McGordon, A., and Jennings, P. (2009) The simulation of vehicle-to-home systems – usingelectric vehicle battery storage to smooth domestic electricity demand. Ecological Vehicles RenewableEnergies, EVER’09, March, Monaco.
16. Kempton, W. and Tomic, J. (2005) Vehicle-to-grid power fundamentals: calculating capacity and net rev-enue. Journal of Power Sources , 144, 268–279.