Embed Size (px)
Citation preview
NATIONAL HURRICANE CENTER TROPICAL CYCLONE REPORT
HURRICANE ETA (AL292020) 31 October–13 November 2020
Richard J. Pasch, Brad J. Reinhart, Robbie Berg, and David P. Roberts
National Hurricane Center 9 June 2021
GOES-16 IR SATELLITE IMAGE OF HURRICANE ETA NEAR PEAK INTENSITY AT 0300 UTC 3 NOVEMBER 2020. IMAGE
COURTESY OF NAVAL RESEARCH LABORATORY.
Eta struck Nicaragua as a category 4 hurricane (on the Saffir-Simpson Hurricane Wind Scale), and caused severe flooding over portions of Central America. It later redeveloped over the northwestern Caribbean Sea as a tropical storm, crossed Cuba and the Florida Keys and produced torrential rains and flooding over portions of South Florida.
Hurricane Eta 2
Table of Contents SYNOPTIC HISTORY .............................................................................................. 3
METEOROLOGICAL STATISTICS ........................................................................ 5 Winds and Pressure .............................................................................................. 5 Storm Surge ........................................................................................................... 6 Rainfall and Flooding ............................................................................................. 6 Tornadoes .............................................................................................................. 8
CASUALTY AND DAMAGE STATISTICS ............................................................. 8 International ........................................................................................................... 8 United States ......................................................................................................... 9
FORECAST AND WARNING CRITIQUE ............................................................. 10 Genesis ................................................................................................................ 10 Track .................................................................................................................... 10 Intensity ............................................................................................................... 10 Storm Surge Forecasts and Warnings ................................................................ 11 Wind Watches and Warnings .............................................................................. 12 Impact-Based Decision Support Services (IDSS) and Public Communication ... 12
ACKNOWLEDGMENTS ........................................................................................ 12
TABLES ...................................................................................................................... 13
FIGURES .................................................................................................................... 56
Hurricane Eta 3
Hurricane Eta 31 OCTOBER–13 NOVEMBER 2020
SYNOPTIC HISTORY Eta can be traced back to a tropical wave that is estimated to have moved off the west coast of Africa on 22 October. This system moved westward across the tropical Atlantic for about a week, accompanied by a large area of disorganized cloudiness, showers, and thunderstorms. Deep convection showed signs of organization when the disturbance reached the Windward Islands on 29 October. On 30 October, the disturbance moved west-northwestward into the eastern Caribbean Sea and gradually became better organized. Early on 31 October, the system’s deep convection became more consolidated over the east-central Caribbean Sea, with some evidence of banding features. By 1800 UTC that day, a low-level circulation became sufficiently well-defined to denote the formation of a tropical depression centered about 190 n mi south of Pedernales, Dominican Republic. The “best track” chart of the tropical cyclone’s path is given in Fig. 1, with the wind and pressure histories shown in Figs. 2 and 3, respectively. The best track positions and intensities are listed in Table 11.
A ridge of high pressure to the north caused the cyclone to move westward over the west-central and western Caribbean Sea for a couple of days, and the depression strengthened into a tropical storm by 0000 UTC 1 November when it was centered about 260 n mi southeast of Kingston, Jamaica. In an environment of low vertical shear and high oceanic heat content, Eta quickly intensified, becoming a 70-kt hurricane by 0600 UTC 2 November while centered about 270 n mi south of Grand Cayman. The hurricane strengthened extremely rapidly on 2 November as a distinct eye became apparent on visible satellite images around 1500 UTC that day. Eta’s maximum winds increased to near 115 kt, category 4 intensity, by 1800 UTC 2 November, an increase of 45 kt over just 12 h. The hurricane reached its peak intensity of about 130 kt at 0000 UTC 3 November when it was centered about 55 n mi east-southeast of Puerto Cabezas, Nicaragua. A mid-level ridge then built over the western Gulf of Mexico and Mexico, which caused Eta to turn toward the southwest with a decrease in forward speed. Eta maintained an intensity near 130 kt through 0600 UTC 3 November, by which time the central pressure had fallen to 922 mb. Some weakening then took place, likely due to an eyewall replacement, while the system’s forward speed slowed even further. Upwelling of cooler shelf waters near the east coast of Nicaragua by this slow-moving system may have also contributed to the weakening. After nearly stalling just off the coast of northeastern Nicaragua later on 3 November, the hurricane turned toward the west-northwest and made landfall in that country about 15 n mi south-southwest of Puerto Cabezas around 2100 UTC that day, with a category 4 intensity of 120 kt.
1 A digital record of the complete best track, including wind radii, can be found on line at ftp://ftp.nhc.noaa.gov/atcf. Data for the current year’s storms are located in the btk directory, while previous years’ data are located in the archive directory.
Hurricane Eta 4
After crossing the coast, the cyclone moved slowly westward over northern Nicaragua while steadily weakening to a tropical storm by 1200 UTC 4 November, and to a tropical depression by 0000 UTC 5 November while located well inland about 70 n mi east of Tegucigalpa, Honduras. The system’s surface circulation appeared to dissipate by 0600 UTC 5 November, but an associated low- to mid-tropospheric circulation center or vorticity maximum was still present. This disturbance moved west-northwestward, northwestward, and northward over Honduras on 5 November, and then emerged over the Gulf of Honduras just before 0000 UTC 6 November. Meanwhile, the ridge over the Gulf of Mexico was replaced by a mid- to upper-level cyclone and trough which dug southeastward toward the disturbance, causing it to turn toward the east-northeast. It is estimated that the system re-acquired a surface circulation, and thus re-developed into a tropical depression, to the east of Belize around 0600 UTC 6 November. The cyclone regained tropical storm status by about 0600 UTC 7 November and briefly accelerated east-northeastward later that day. The storm strengthened to an intensity of 55 kt at 0000 UTC 8 November. Eta then moved on a counterclockwise trajectory, along the periphery of a broad deep-layer cyclonic circulation. This motion took the center of Eta across the south coast of central Cuba around 0900 UTC 8 November, and the center emerged off the north coast of Cuba and into the Straits of Florida by around 1500 UTC that day.
Eta continued to move along a counterclockwise path, turning northward, north-northwestward, and west-northwestward over the Straits through early on 9 November. The center of the tropical storm made landfall in the Florida Keys near Lower Matecumbe Key with an intensity of about 55 kt around 0400 UTC 9 November. Eta then moved westward into the southeastern Gulf of Mexico. Dry air entrainment caused some weakening, and the storm’s winds decreased to 45 kt later on 9 November while the system turned west-southwestward and southwestward. The cyclone made a cyclonic loop to the north of the western tip of Cuba, with little change in strength, on 10 November. Eta moved northward on 11 November, and briefly regained hurricane intensity around 1200 UTC that day. This re-intensification may have been due to the system’s interaction with the higher oceanic heat content of the Loop Current over the southeastern Gulf of Mexico. In any event, the cyclone’s hurricane status was short-lived. Eta, having weakened back to a tropical storm, moved generally northward over the extreme eastern Gulf of Mexico later on 11 November, passing to the west of the southern and south-central Florida peninsula. At 0000 UTC 12 November, Eta’s center passed about 40 n mi west of Clearwater, Florida. The system turned north-northeastward and made landfall near Cedar Key, Florida at about 0900 UTC that day, with its maximum winds weakening to near 45 kt due to strong west-southwesterly shear and some incursions of drier air. While continuing to weaken, Eta then moved northeastward and crossed northern Florida on 12 November, with most of the convection displaced to the east of the center due to strong shear.
The center of the cyclone emerged into the Atlantic just north of the Florida/Georgia border by 1800 UTC 12 November, having weakened further while over land. Eta re-intensified slightly once back over water and accelerated east-northeastward late that day and early on 13 November, passing offshore of the South Carolina and North Carolina coasts. By 1200 UTC 13 November, the system became embedded within a frontal zone and thus had been transformed into an extratropical cyclone. The cyclone was absorbed by another extratropical low offshore of the northeastern United States just after 0000 UTC November 14.
Hurricane Eta 5
METEOROLOGICAL STATISTICS Observations in Eta (Figs. 2 and 3) include subjective satellite-based Dvorak technique intensity estimates from the Tropical Analysis and Forecast Branch (TAFB) and the Satellite Analysis Branch (SAB), and objective Advanced Dvorak Technique (ADT) estimates and Satellite Consensus (SATCON) estimates from the Cooperative Institute for Meteorological Satellite Studies/University of Wisconsin-Madison. Observations also include flight-level, stepped frequency microwave radiometer (SFMR), and dropwindsonde observations from flights of the 53rd Weather Reconnaissance Squadron of the U.S. Air Force Reserve Command (AFRES) and WD-P3 aircraft of the NOAA Aircraft Operations Center. Data and imagery from NOAA polar-orbiting satellites including the Advanced Microwave Sounding Unit (AMSU), the NASA Global Precipitation Mission (GPM), the European Space Agency’s Advanced Scatterometer (ASCAT), and Defense Meteorological Satellite Program (DMSP) satellites, among others, were also useful in constructing the best track of Eta.
There was a total of 21 aircraft missions into and around Eta, 11 from the AFRES, and 10 from NOAA (6 center fix missions, 3 synoptic surveillance flights, and 1 tail doppler radar mission). The AFRES transmitted 21 center fixes, and NOAA transmitted 16 fixes.
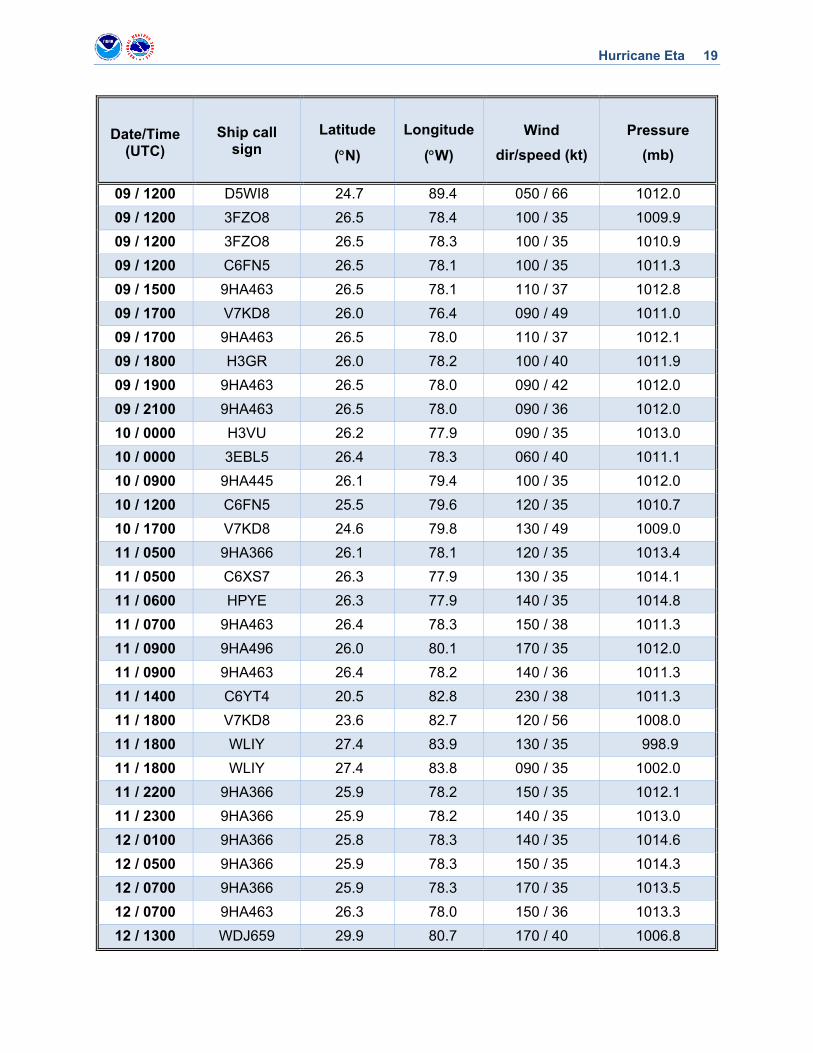
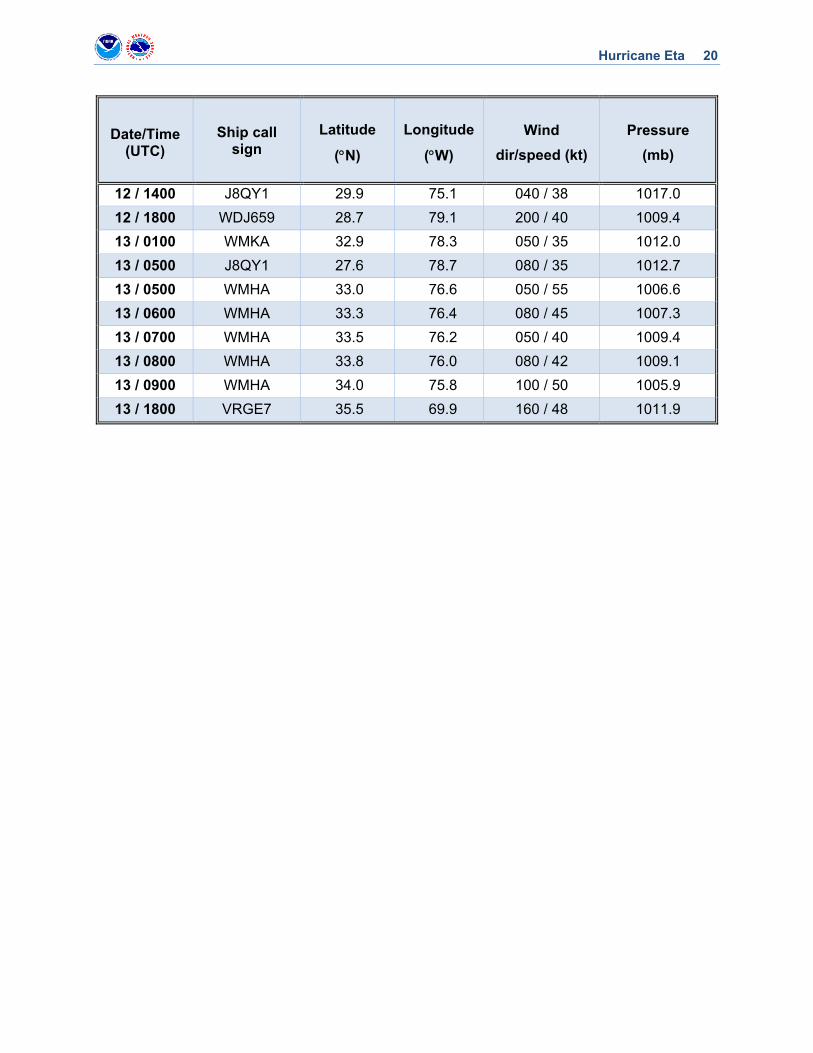
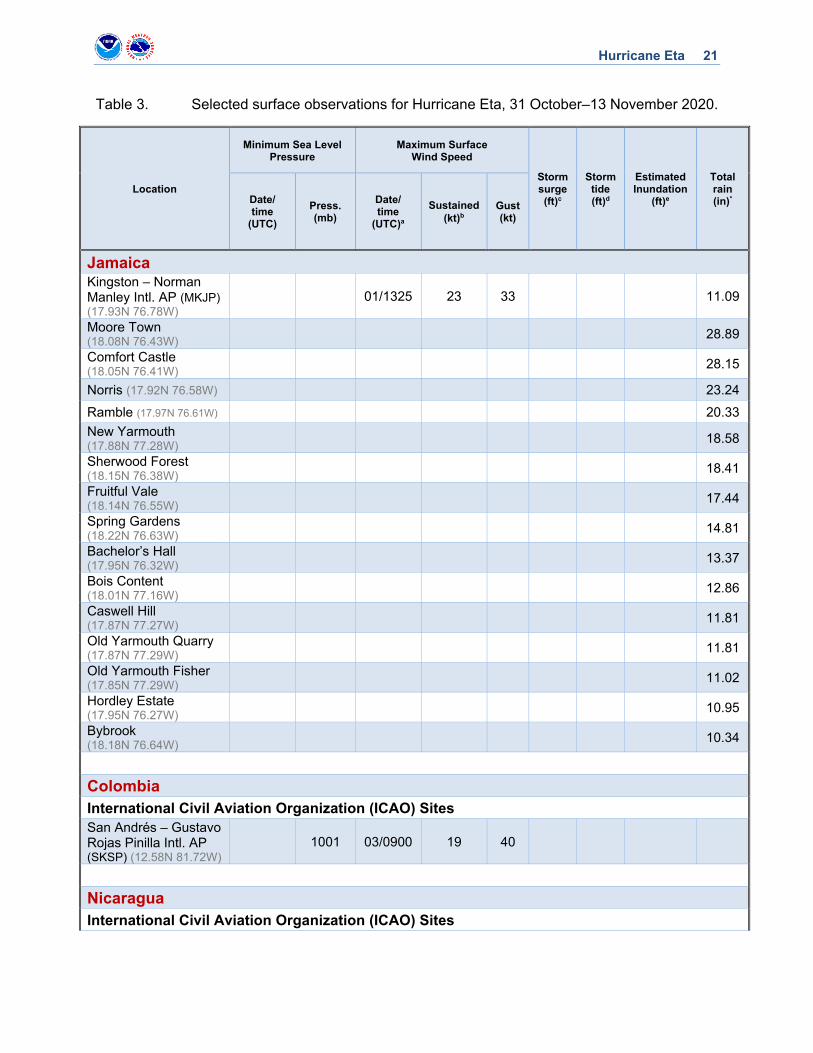
Ship reports of winds of tropical storm force associated with Eta are listed in Table 2. Selected surface observations from land stations and data buoys are given in Table 3.
Winds and Pressure The estimated maximum intensity of Eta, 130 kt from 0000 to 0600 UTC 3 November, is based on AFRES observations, using a blend of the highest 700 mb flight-level winds of 137 kt, which adjusts to an intensity of 123 kt, and the peak SFMR-observed surface winds of 135 kt. The 130-kt intensity is also supported by a maximum eyewall dropsonde wind speed of 129 kt averaged over the lowest 150 m of the sounding at 0306 UTC. Eta’s estimated minimum central pressure of 922 mb at 0600 UTC 3 November is based on an AFRES eye dropsonde measurement of 925 mb with splash winds of 14 kt at 0358 UTC 3 November, and the possibility that the pressure was still falling at that time.
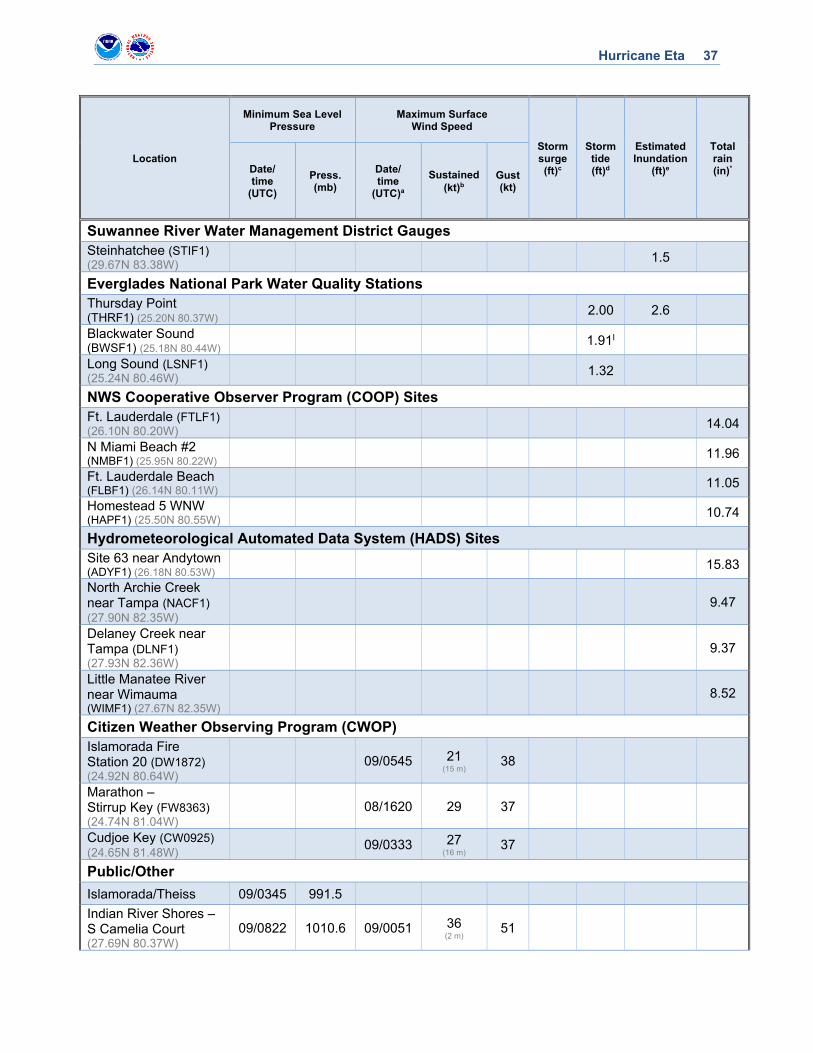
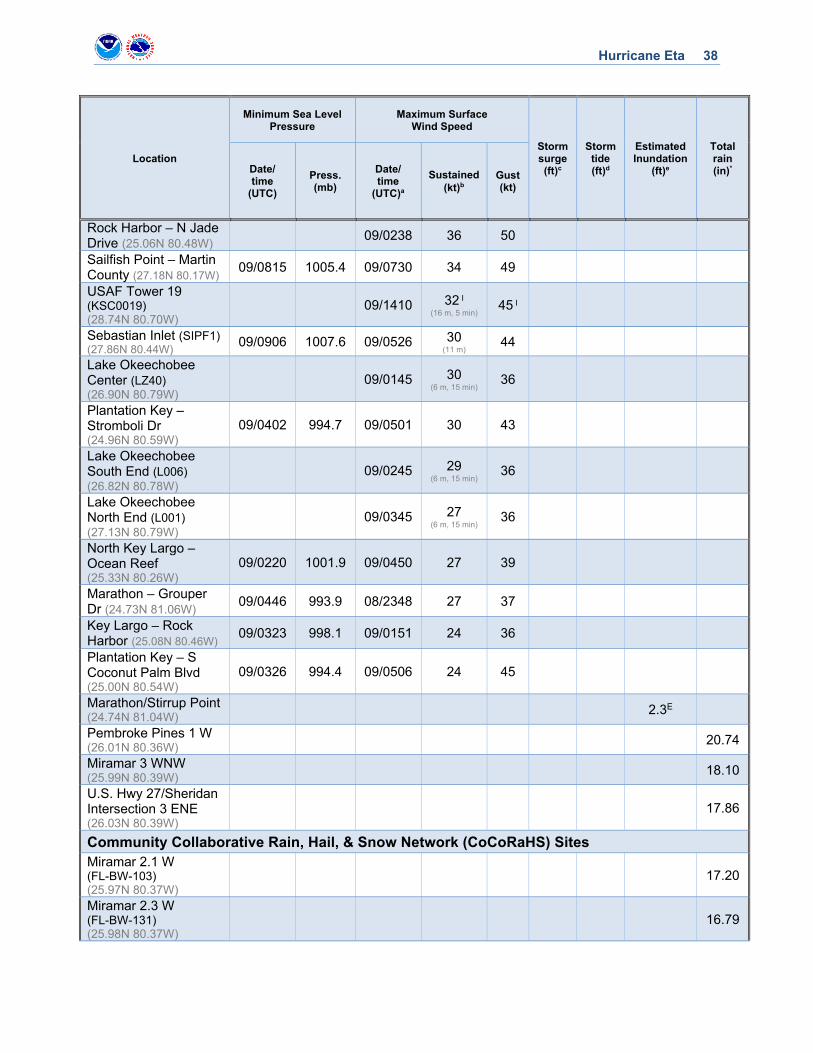
The 130-kt intensity of Eta at landfall in Nicaragua is based on a blend of Dvorak estimates and earlier aircraft observations. Sustained winds of 94 kt and a gust to 118 kt were reported at the Puerto Cabezas, Nicaragua, airport, but these observations were incomplete. Peak sustained winds of 46 kt with a gust to 49 kt were measured at Cayo Coco, Cuba. A slightly elevated WeatherFlow observing site on Carysfort Reef Light in the upper Florida Keys measured maximum sustained winds of 55 kt with a gust to 61 kt. Sites near the standard 10-m elevation in Miami-Dade and Broward Counties in south Florida reported sustained winds close to 40 kt with gusts near 50 kt. Sustained winds of 35–40 kt with gusts to around 50 kt were measured in the Tampa Bay area. A sustained wind of 35 kt with a gust to 44 kt and a minimum pressure of 997 mb was reported at Cedar Key, Florida around the landfall near that location. The lowest pressure reported in Florida was about 992 mb in the mid-upper Florida Keys while the center moved through that area.
Hurricane Eta 6
Storm Surge2 The meteorological service of Nicaragua reported a storm surge of 26 to 33 ft above
normal near Eta’s landfall location in Nicaragua.
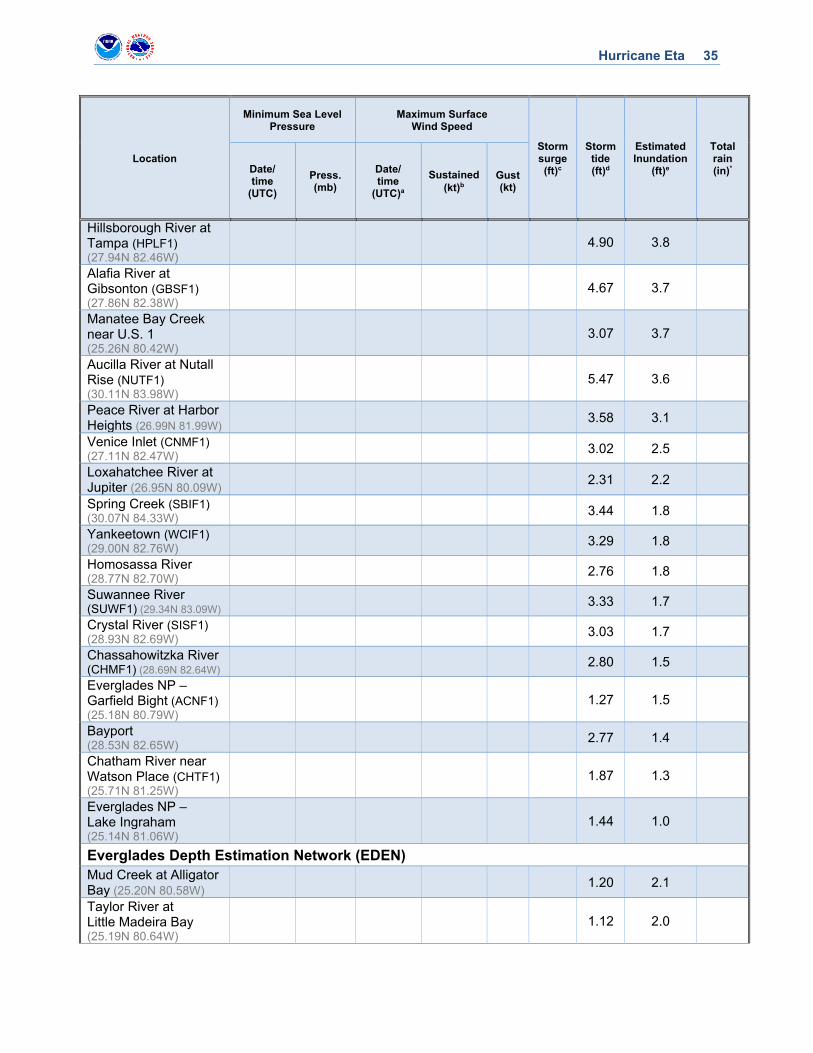
Eta produced storm surge inundation levels of 3 to 4 ft above ground level (AGL) in the Tampa Bay area of Florida. National Ocean Service (NOS) tide gauges in the northern part of the bay, at Old Port Tampa and Tampa-East Bay, both measured peak water levels of 3.9 ft above Mean Higher High Water (MHHW). Also, the NOS gauge in St. Petersburg recorded a peak water level of 3.5 ft MHHW. Several stream gauges from the United States Geological Survey (USGS) confirmed these heights. For example, a gauge in Pinellas County on Lake Seminole recorded a peak water level of 4.1 ft MHHW, and a gauge on the Hillsborough River in Tampa measured 3.8 ft MHHW. Figure 4 shows observations from various tide stations and water level sensors along the Florida coast.
Storm surge inundation levels along the remainder of the Florida coast were generally 1 to 3 ft AGL, but some isolated areas were between 3 and 4 ft AGL. These areas include the upper part of Florida Bay, where a USGS gauge between U.S. 1 and Card Sound Road recorded a peak water level of 3.7 ft MHHW. Along Apalachee Bay, the USGS gauge at the Aucilla River measured 3.6 ft MHHW, and along the southwest coast of Florida, a gauge on the Peace River near Charlotte Harbor registered 3.1 ft MHHW. Otherwise, all other gauges along the Florida coast measured peak water levels less than 3 ft MHHW.
Rainfall and Flooding
International
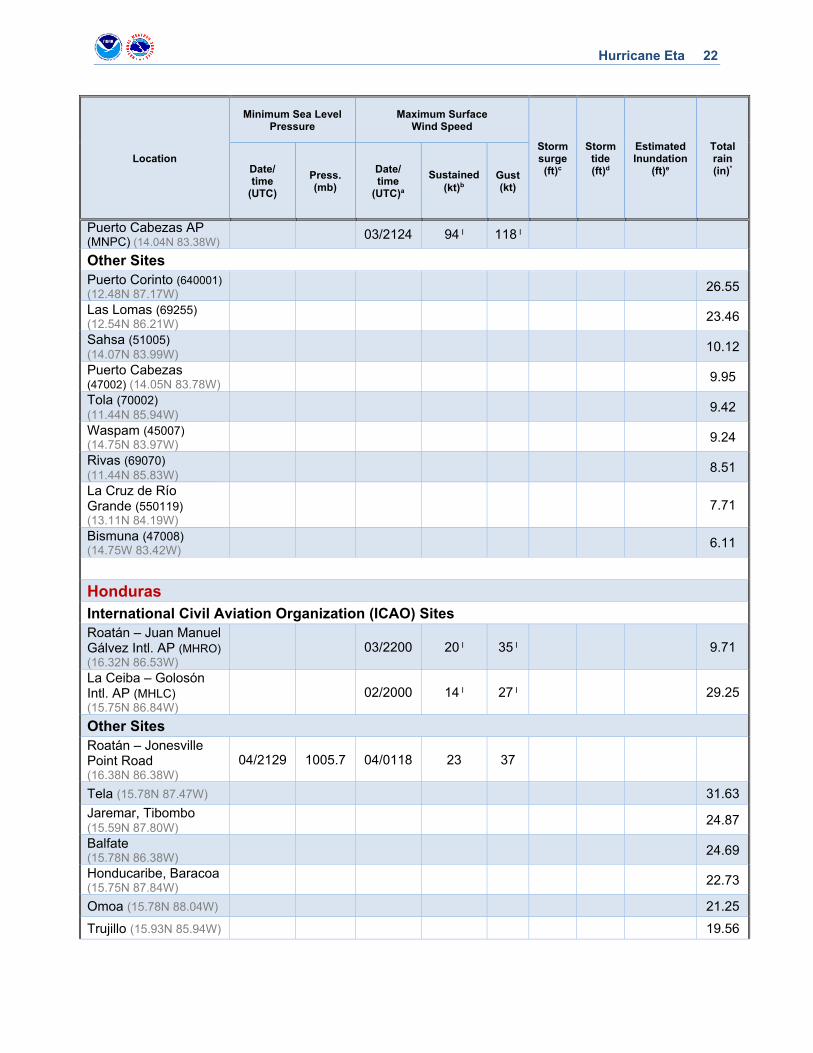
Abundant moisture associated with Eta and its remnants, combined with the cyclone’s slow motion before and after landfall in Nicaragua, resulted in an extended period of heavy rainfall across large portions of Central America. The highest reported rainfall totals occurred along the northern coast of Honduras (Fig. 5), with 31.63 inches (803.3 mm) in Tela and 29.25 inches (743.0 mm) at Golosón International Airport in La Ceiba from 1–7 November 2020. Over 20 inches of rainfall occurred in parts of northeastern Nicaragua (Fig. 6) as well, with a peak of 26.55 inches (674.3 mm) at Puerto Corinto. However, rainfall totals in Nicaragua are likely incomplete due to damage caused by the storm. In Guatemala (Fig. 7), heavy rain fell across the eastern and central portions of the country, with 21.06 inches (534.8 mm) reported at Cobán, Alta Verapaz and 19.10 inches (485.1 mm) in Puerto Barrios, Izabal. A swath of 10+ inches of rainfall occurred across the central portion of Belize (Fig. 8), with a topographically-enhanced maximum of 21.86 inches (555.2 mm) at Baldy Beacon. A maximum of 10.84 inches (275.4 mm) occurred in the northwestern part of El Salvador (Fig. 9) near Planes de Montecristo. In Costa Rica (Fig.
2 Several terms are used to describe water levels due to a storm. Storm surge is defined as the abnormal rise of water generated by a storm, over and above the predicted astronomical tide, and is expressed in terms of height above normal tide levels. Because storm surge represents the deviation from normal water levels, it is not referenced to a vertical datum. Storm tide is defined as the water level due to the combination of storm surge and the astronomical tide, and is expressed in terms of height above a vertical datum, i.e. the North American Vertical Datum of 1988 (NAVD88). Inundation is the total water level that occurs on normally dry ground as a result of the storm tide, and is expressed in terms of height above ground level. At the coast, normally dry land is roughly defined as areas higher than the normal high tide line, or Mean Higher High Water (MHHW).
Hurricane Eta 7
10), topography combined with moist flow from the Pacific focused the heaviest precipitation near the southern Pacific coast, with a maximum of 24.58 inches (624.4 mm) near Arunachala. Additionally, portions of southern Mexico (Fig. 11) received heavy rainfall from Eta and its remnants from 3–7 November, with the highest totals noted in the states of Chiapas and Tabasco and a maximum of 24.90 inches (632.5 mm) reported at Tzimbac, Chiapas.
Heavy rainfall from Eta also impacted portions of the Greater Antilles. Eta passed to the south of Jamaica on 1 November, and then passed northwest of the island on 7 November before making landfall in Cuba. As a result, Jamaica received several days of heavy rain, with 10–20 inches reported across the eastern parishes from 1–8 November and a maximum of 28.89 inches (733.8 mm) measured at Moore Town. Elsewhere, Grand Cayman received 9.87 inches (250.7 mm) of rainfall from 3–7 November as Eta made a close approach to the Cayman Islands. The storm’s landfall in central Cuba resulted in 3–6 inches of rain across the region with isolated totals greater than 10 inches, including 17.71 inches (449.8 mm) at Topes de Collantes and 15.24 inches (387.2 mm) at La Piedra.
Maximum reported rainfall totals by country:
Honduras: 31.63 inches (803.3 mm) at Tela, Atlántida Jamaica: 28.89 inches (733.8 mm) at Moore Town, Portland Nicaragua: 26.55 inches (674.3 mm) at Puerto Corinto, Chinandega Mexico: 24.90 inches (632.5 mm) at Tzimbac, Chiapas Costa Rica: 24.58 inches (624.4 mm) at Arunachala Belize: 21.86 inches (555.2 mm) at Baldy Beacon, Cayo Guatemala: 21.06 inches (534.8 mm) at Cobán, Alta Verapaz Cuba: 17.71 inches (449.8 mm) at Topes de Collantes El Salvador: 10.84 inches (275.4 mm) at Planes de Montecristo Cayman Islands: 9.87 inches (250.7 mm) at Grand Cayman
United States
South Florida was the focus of significant rainfall from Eta in the United States (Fig. 12). The highest reported storm total rainfall of 20.74 inches occurred in Broward County in Pembroke Pines, with 16–18 inches measured at several other locations in Pembroke Pines and nearby Miramar. In Miami-Dade County, 14.12 inches of rain fell near Biscayne Park, and 13.40 inches occurred in North Miami. Numerous other locations in Broward and Miami-Dade Counties received over 10 inches of rainfall, which resulted in widespread major flooding across the area (Fig. 13).
Elsewhere, much of the Florida Keys received 4–8 inches of rainfall during the event, as Eta made two separate approaches and one landfall early on 9 November in Lower Matecumbe Key. A storm total maximum of 8.98 inches occurred near Key West. Eta also produced heavy rainfall across the greater Tampa Bay area, with several locations reporting more than 8 inches of rain during the event and a maximum of 10.64 inches noted near Sun City Center in Hillsborough County.

Hurricane Eta 8
Once Eta crossed northern Florida and emerged into the Atlantic Ocean, its interaction with a cold front moving across the Mid-Atlantic states produced heavy rains across portions of Georgia as well as eastern South Carolina and North Carolina from 11–13 November, before and during the cyclone’s extratropical transition. Peak rainfall totals from each state, which may include some precipitation not directly related to Eta, are as follows: 5.51 inches near Washington, Georgia; 7.50 inches near Conway, South Carolina; and 12.50 inches near Rocky Mount, North Carolina.
Tornadoes
There was one EF0 tornado reported in Manatee County, Florida, that caused minor damage.
CASUALTY AND DAMAGE STATISTICS
International
Eta was responsible for at least 165 direct deaths3 and over 100 missing people in Central America and southern Mexico, although these counts are uncertain and likely underdone due to inconsistent media reports. The extreme rainfall associated with Eta caused catastrophic flash flooding, river flooding, and deadly landslides across the region. Flooding or landslides contributed to at least 74 deaths in Honduras, 60 in Guatemala, 27 in Mexico, and 2 in both Nicaragua and Costa Rica. Incredibly, there was no reported loss of life near the landfall location on the coast of northeastern Nicaragua, although Eta must have caused very severe damage in that area. The United Nations (UN) estimates that 4.9 million people were adversely impacted by the torrential rainfall, strong winds, and storm surge produced by Eta. There was an estimated $6.8 billion (USD) worth of total damage from Eta in Central America, according to the Global Catastrophe Recap produced by Aon. Unfortunately, this devastation was soon to be followed by additional disastrous impacts from Hurricane Iota4 just two weeks later.
UNICEF estimates that over 110,000 people displaced by Eta across Central America were evacuated to temporary shelters during the COVID-19 pandemic. Floodwaters destroyed many roads and bridges, which isolated numerous villages and communities and stranded people on roofs as they awaited rescue. Preliminary reports by the government of Nicaragua indicated that Eta damaged or destroyed at least 6,900 homes, 16 healthcare facilities, 45 schools, and 560 miles of roads and bridges across the country. In Honduras, at least 450 homes were damaged by floodwaters, and around 40 communities were isolated by washed-out roads and
3 Deaths occurring as a direct result of the forces of the tropical cyclone are referred to as “direct” deaths. These would include those persons who drowned in storm surge, rough seas, rip currents, and freshwater floods. Direct deaths also include casualties resulting from lightning and wind-related events (e.g., collapsing structures). Deaths occurring from such factors as heart attacks, house fires, electrocutions from downed power lines, vehicle accidents on wet roads, etc., are considered “indirect” deaths. 4 Stewart, Stacy. “Tropical Cyclone Report: Hurricane Iota.” National Oceanic and Atmospheric Administration / National Weather Service / National Hurricane Center, 18 May 2021, www.nhc.noaa.gov/data/tcr/AL312020_Iota.pdf
Hurricane Eta 9
bridges. Hundreds of homes were also damaged or destroyed in Guatemala. A devastating landslide in the remote village of Quejá, Guatemala, buried numerous homes and approximately one hundred people according to media reports, many of whom remain missing but are likely not included in official death tolls since many victims were unable to be recovered. According to the UN, Guatemala lost over 119,000 hectares of crops and harvest during Eta, further contributing to the humanitarian crisis in the region. Major flooding impacts were also noted in Belize, Costa Rica, and El Salvador.
Elsewhere, floodwaters damaged infrastructure and thousands of homes in the states of Chiapas and Tabasco in southern Mexico. Jamaica experienced serious flooding that washed out roads and bridges and led to some landslides. Flash flooding was also reported in the Cayman Islands, along with some downed trees and power lines from strong winds. Cuba experienced coastal and river flooding that led to around 25,000 evacuations.
United States
There were 7 direct fatalities due to Eta in the United States, all drownings due to flash flooding in North Carolina; these occurred as moisture ahead of Eta interacted with a cold front that was moving across the Mid-Atlantic states. In Alexander County, 5 persons ranging in age from 1 to 76 drowned at a campground, and a 64-year-old man was killed when he drove his vehicle onto a collapsed bridge. An 11-year old child drowned in flood waters in Wake County. Additionally, there were 3 indirect deaths in the U.S. Two people died in weather-related traffic accidents in North Carolina and a 65-year-old man was electrocuted in floodwaters at his home in Bradenton Beach, Florida.
According to the NOAA National Centers for Environmental Information, Eta caused an estimated $1.5 billion worth of total damage in the United States, primarily in southern Florida. Major flooding was Eta’s greatest impact in South Florida, with water entering some structures in parts of Broward County including Fort Lauderdale, Lauderhill, and Davie. Heavy rains resulted in standing water that made streets impassable in northern Miami-Dade County and portions of downtown Miami and Brickell. Floodwaters in the streets were slow to recede and lingered for several days after the storm. Over 290,000 customers in Miami-Dade, Broward, and Palm Beach Counties lost power due to downed trees and power lines. In the Florida Keys, the combination of rain and storm surge resulted in some flooding in North Key Largo and Upper Matecumbe Key. A large tree fell on and destroyed a residence in Key Largo, resulting in a minor injury. Downed trees and limbs caused about 1,000 customers to lose power, mainly in Key Largo. During Eta’s passage to the west of the Keys, large wave action produced significant overwash along the Lower Keys and forced some road closures in Key West.
West-central Florida also received significant flooding impacts from storm surge and heavy rainfall. In Pinellas County, 33 people were rescued from flooded homes and stalled vehicles in Pass-a-Grille. Other areas between St. Pete Beach and Madeira Beach experienced up to a couple of feet of storm surge inundation. Several sailboats broke free of their moorings during the storm and became stuck under a bridge or were beached in Gulfport. Street flooding and road closures were also reported in coastal Hillsborough, Manatee, Sarasota, Charlotte, and Lee Counties. Wind impacts were generally minor, although a tractor-trailer crash in Hernando

Hurricane Eta 10
County was attributed to strong wind. Over 40,000 customers lost power in the greater Tampa Bay area.
FORECAST AND WARNING CRITIQUE
Genesis
The timing and location of the genesis of Eta was not that well predicted. It was first noted in the Tropical Weather Outlook (TWO) that an area of low pressure was expected to form over the southwestern Caribbean Sea 66 h before Eta’s genesis over the central Caribbean Sea, and the 5-day formation probability was set to low (<40%) at that time (Table 4). Subsequent TWOs closer to the time of genesis indicated a formation location farther east and closer to the actual genesis location. The 2-day formation probability was first set to low in the TWO 48 h before genesis. The 2- and 5-day formation probabilities were raised to medium (40%-60%) 30 and 54 h prior to genesis, respectively, and to high only 24 and 36 h before genesis, respectively.
Track
A verification of NHC official track forecasts for Eta is given in Table 5a. Official track forecast errors were a little higher than the mean official errors for the previous 5-yr period, a reasonably good performance considering the erratic nature of the tropical cyclone’s track. A homogeneous comparison of the official track errors with selected guidance models is given in Table 5b. Several of the guidance models had lower mean errors than the official forecasts, but in most of those cases the NHC forecasts had comparable errors. However, the COAMPS-TC (CTCI) model had substantially lower errors than most of the other track guidance at 48 h and beyond. The official forecasts consistently predicted landfall in northeastern Nicaragua (Fig. 14). It should also be noted that the NHC forecasts began calling for Eta to move into, or reform over, the northwestern Caribbean Sea about 96 h in advance of that occurrence.
Intensity
A verification of NHC official intensity forecasts for Eta is given in Table 6a. Official intensity forecast errors were somewhat higher than the mean official errors for the previous 5-yr period for the 12- through 48 h-forecast intervals, and lower than the 5-yr means at 60 through 120 h. A homogeneous comparison of the official intensity errors with selected guidance models is given in Table 6b. HWFI was the best performer at the 36- and 48-h forecast intervals. In general, however, the mean official errors were comparable to or lower than those of the intensity guidance models. As is typical, forecasting Eta’s rapid intensification before landfall in Nicaragua was problematic. Nonetheless, 30 h prior to Eta reaching peak intensity, the Deterministic to Probabilistic Statistical (DTOPS) model indicated a 71% chance of a 30-kt wind speed increase in 24 h, and the SHIPS Rapid Intensification Index showed a 53% chance of a 30-kt wind speed increase in 24 h one day before the hurricane’s peak. The official intensity forecasts issued 30 h before the Nicaragua landfall showed significant strengthening, and indicated that the system would become a major hurricane by the time it reached the coast.

Hurricane Eta 11
Storm Surge Forecasts and Warnings5
Storm surge watches and warnings associated with Eta are given in Table 7 and indicated in Fig. 15. A Storm Surge Watch was first issued for the southern part of the Florida peninsula from Golden Beach to Bonita Beach, the Florida Keys, Biscayne Bay, and Florida Bay at 2100 UTC 7 November. The part of the watch covering the Florida Keys and Florida Bay was upgraded to a Storm Surge Warning at 1500 UTC 8 November. While some minor coastal flooding did occur in these areas, there was only one observation of storm surge inundation of 3 ft or greater above normally dry ground (which NHC uses as a first-cut threshold for the storm surge watch/warning) in the upper part of Florida Bay. For the most part, then, the majority of the Storm Surge Warning for the Florida Keys and Florida Bay did not verify, and all watches and warnings were discontinued by 0900 UTC 9 November.
For the southern Florida peninsula and the Florida Keys, the initial peak storm surge inundation forecast issued at 0300 UTC 7 November was 2 to 3 ft above normally dry ground somewhere between North Miami Beach and Marco Island, as well as the Florida Keys. The forecast was raised slightly to 2 to 4 ft above normally dry ground for the same general area at 2100 UTC 7 November. The highest observation within this area was 3.7 ft MHHW by the USGS gauge in the upper part of Florida Bay between Homestead and Key Largo.
A Storm Surge Watch was issued for the west coast of Florida from Bonita Beach to the Steinhatchee River, including Tampa Bay and Charlotte Harbor, at 0300 UTC 11 November. The portion of the watch from Bonita Beach to the Suwanee River, including Tampa Bay and Charlotte Harbor, was upgraded to a Storm Surge Warning at 1500 UTC 11 November. Storm surge inundation of 3 ft or higher above ground level occurred within the warning area mainly within Tampa Bay and areas of Charlotte Harbor. There was very little lead time with this warning, as sustained tropical-storm-force winds are estimated to have begun in the Tampa Bay area later in the afternoon on 11 November. There were no observations of 3 ft or greater inundation along the open coast, although a storm surge simulation hindcast produced by the NHC Storm Surge Unit (not shown) suggests that at least 3 ft could have occurred along the beaches of Sarasota, Manatee, and Pinellas Counties.
For the west coast of Florida, the initial peak storm surge inundation forecast issued at 0300 UTC 11 November was 2 to 4 ft above normally dry ground somewhere between Bonita Beach and the Steinhatchee River, including Tampa Bay and Charlotte Harbor. The forecast was increased to 3 to 5 ft above normally dry ground between Boca Grande and Anclote River, including Tampa Bay, at 1500 UTC 11 November. The highest observations in this area were about 4 ft MHHW from several NOS and USGS gauges.
5 Storm surge watches and warnings are currently only issued for the United States.
Hurricane Eta 12
Wind Watches and Warnings
Wind watches and warnings associated with Eta are given in Table 8. A Hurricane Warning was issued for the northeast coast of Nicaragua about 36 h before the onset of tropical-storm-force winds over that area, and 54 h prior to landfall.
Impact-Based Decision Support Services (IDSS) and Public Communication
The NHC began communication with emergency managers on 6 November as Eta was in the northwestern Caribbean and continued through its multiple landfalls in Florida. This communication included daily briefings for Emergency Managers in Florida and Federal video-teleconferences with FEMA Headquarters. These decision support briefings were coordinated through the FEMA Hurricane Liaison Team, embedded at the NHC.
The Tropical Analysis and Forecast Branch of NHC provided 13 live briefings on Eta to the U.S. Coast Guard (USCG) District 7 in Miami between 5 and 12 November in support of USCG’s life-saving mission.
ACKNOWLEDGMENTS
Much of the observed data in this report came from Post Tropical Cyclone (PSH) Reports issued by NWS Weather Forecast Offices (WFOs) in Miami, Key West, Melbourne, Tampa, and Jacksonville, Florida. Jose Rubiera of the meteorological service of Cuba provided surface observations from that country. Select surface observations and rainfall data were provided by the meteorological services of Belize, Cayman Islands, Costa Rica, El Salvador, Jamaica, Guatemala, Honduras, Mexico, and Nicaragua.
John P. Cangialosi produced the track map and assisted with the forecast verification. Zackary Taylor and David Roth of the NOAA Weather Prediction Center produced the rainfall map. Tiffany O’Connor and Matthew Green gave IDSS briefing information.
Hurricane Eta 13
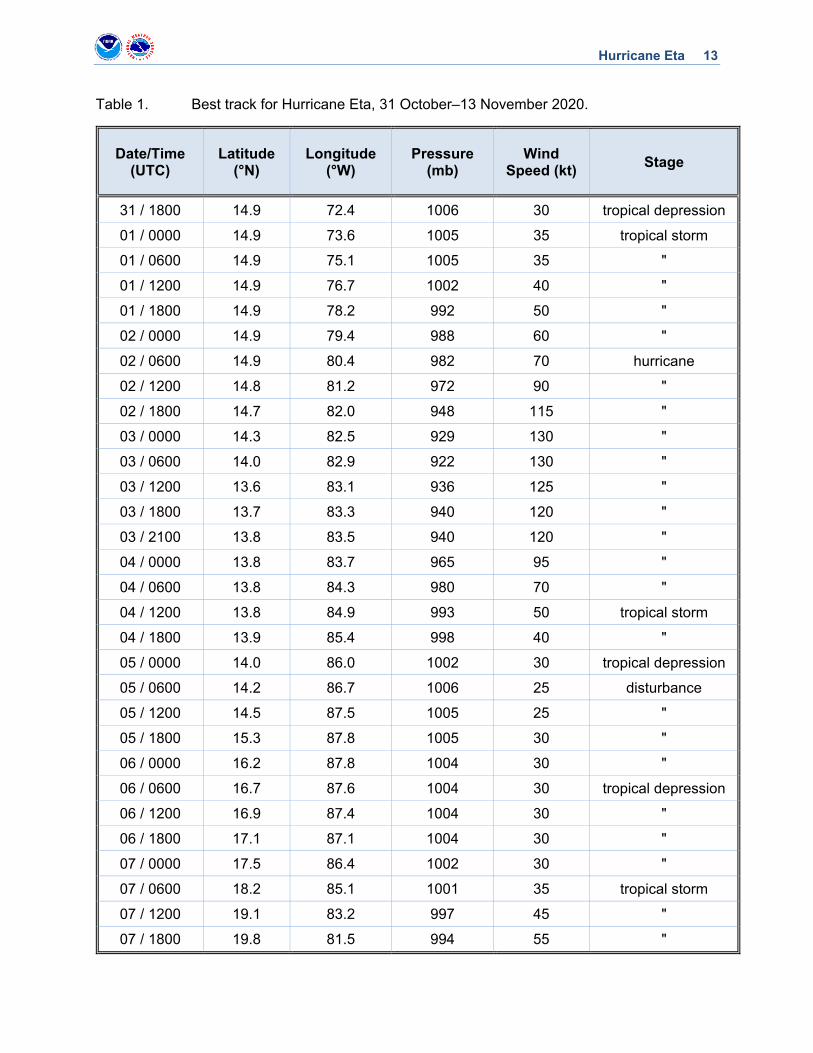
Table 1. Best track for Hurricane Eta, 31 October–13 November 2020.
Date/Time (UTC)
Latitude (°N)
Longitude (°W)
Pressure (mb)
Wind Speed (kt)
Stage
31 / 1800 14.9 72.4 1006 30 tropical depression
01 / 0000 14.9 73.6 1005 35 tropical storm
01 / 0600 14.9 75.1 1005 35 "
01 / 1200 14.9 76.7 1002 40 "
01 / 1800 14.9 78.2 992 50 "
02 / 0000 14.9 79.4 988 60 "
02 / 0600 14.9 80.4 982 70 hurricane
02 / 1200 14.8 81.2 972 90 "
02 / 1800 14.7 82.0 948 115 "
03 / 0000 14.3 82.5 929 130 "
03 / 0600 14.0 82.9 922 130 "
03 / 1200 13.6 83.1 936 125 "
03 / 1800 13.7 83.3 940 120 "
03 / 2100 13.8 83.5 940 120 "
04 / 0000 13.8 83.7 965 95 "
04 / 0600 13.8 84.3 980 70 "
04 / 1200 13.8 84.9 993 50 tropical storm
04 / 1800 13.9 85.4 998 40 "
05 / 0000 14.0 86.0 1002 30 tropical depression
05 / 0600 14.2 86.7 1006 25 disturbance
05 / 1200 14.5 87.5 1005 25 "
05 / 1800 15.3 87.8 1005 30 "
06 / 0000 16.2 87.8 1004 30 "
06 / 0600 16.7 87.6 1004 30 tropical depression
06 / 1200 16.9 87.4 1004 30 "
06 / 1800 17.1 87.1 1004 30 "
07 / 0000 17.5 86.4 1002 30 "
07 / 0600 18.2 85.1 1001 35 tropical storm
07 / 1200 19.1 83.2 997 45 "
07 / 1800 19.8 81.5 994 55 "
Hurricane Eta 14
Date/Time (UTC)
Latitude (°N)
Longitude (°W)
Pressure (mb)
Wind Speed (kt)
Stage
08 / 0000 20.4 80.2 991 55 "
08 / 0600 21.1 79.5 991 55 "
08 / 0855 21.5 79.2 991 55 "
08 / 1200 22.2 79.0 993 50 "
08 / 1800 23.5 79.2 993 55 "
09 / 0000 24.5 80.1 993 55 "
09 / 0400 24.9 80.7 993 55 "
09 / 0600 25.0 81.4 992 55 "
09 / 1200 24.9 82.9 992 50 "
09 / 1800 24.2 84.1 995 45 "
10 / 0000 23.4 85.0 995 45 "
10 / 0600 23.0 85.4 995 45 "
10 / 1200 22.6 85.3 992 50 "
10 / 1800 22.9 85.1 992 50 "
11 / 0000 23.5 84.6 990 55 "
11 / 0600 24.5 84.2 987 60 "
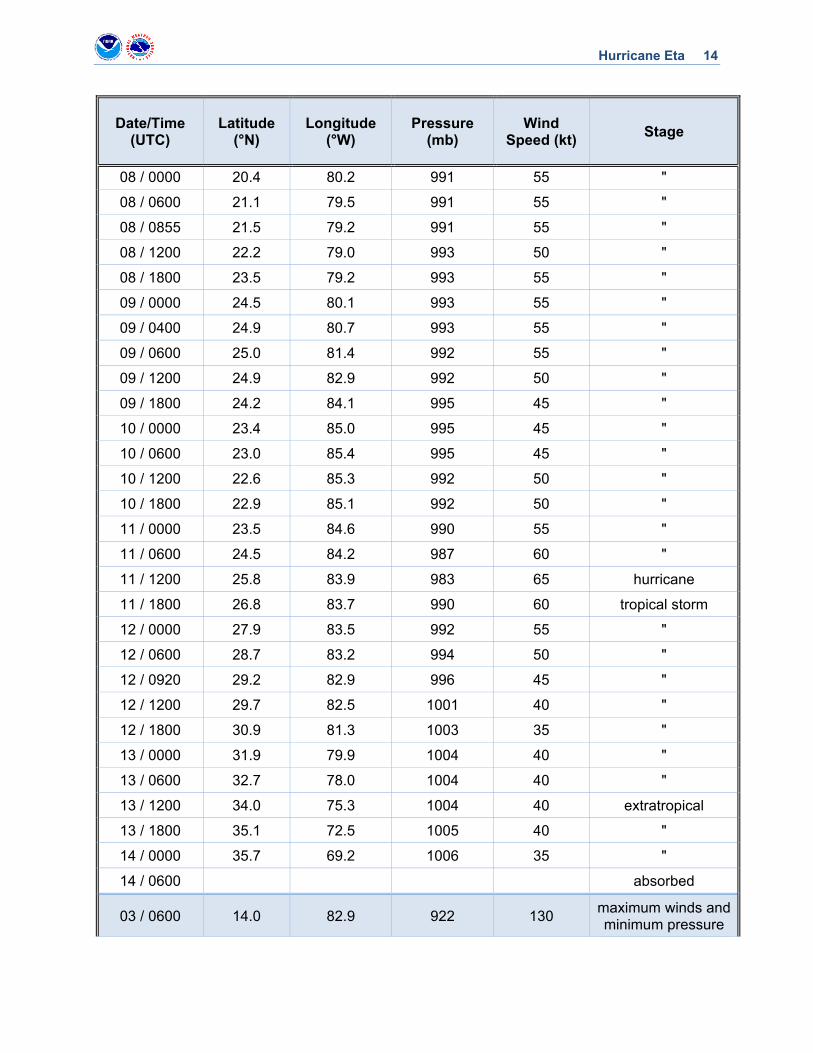
11 / 1200 25.8 83.9 983 65 hurricane
11 / 1800 26.8 83.7 990 60 tropical storm
12 / 0000 27.9 83.5 992 55 "
12 / 0600 28.7 83.2 994 50 "
12 / 0920 29.2 82.9 996 45 "
12 / 1200 29.7 82.5 1001 40 "
12 / 1800 30.9 81.3 1003 35 "
13 / 0000 31.9 79.9 1004 40 "
13 / 0600 32.7 78.0 1004 40 "
13 / 1200 34.0 75.3 1004 40 extratropical
13 / 1800 35.1 72.5 1005 40 "
14 / 0000 35.7 69.2 1006 35 "
14 / 0600 absorbed
03 / 0600 14.0 82.9 922 130 maximum winds and minimum pressure
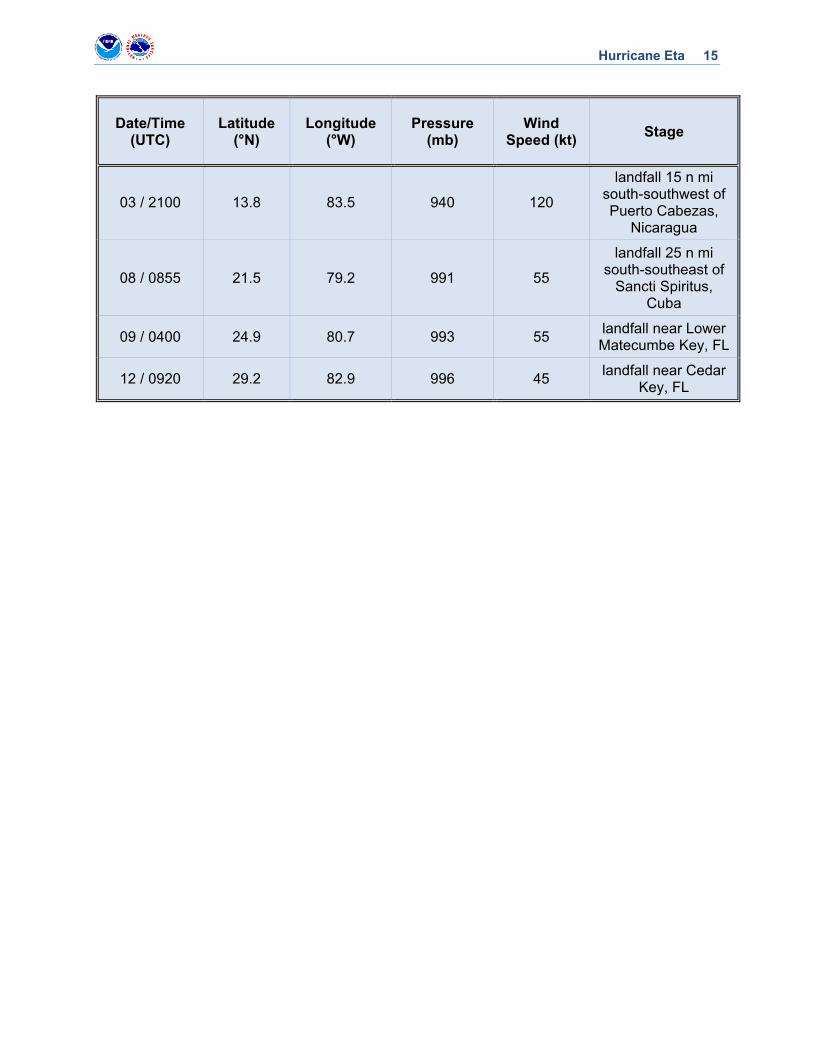
Hurricane Eta 15
Date/Time (UTC)
Latitude (°N)
Longitude (°W)
Pressure (mb)
Wind Speed (kt)
Stage
03 / 2100 13.8 83.5 940 120
landfall 15 n mi south-southwest of Puerto Cabezas,
Nicaragua
08 / 0855 21.5 79.2 991 55
landfall 25 n mi south-southeast of
Sancti Spiritus, Cuba
09 / 0400 24.9 80.7 993 55 landfall near Lower Matecumbe Key, FL
12 / 0920 29.2 82.9 996 45 landfall near Cedar
Key, FL
Hurricane Eta 16
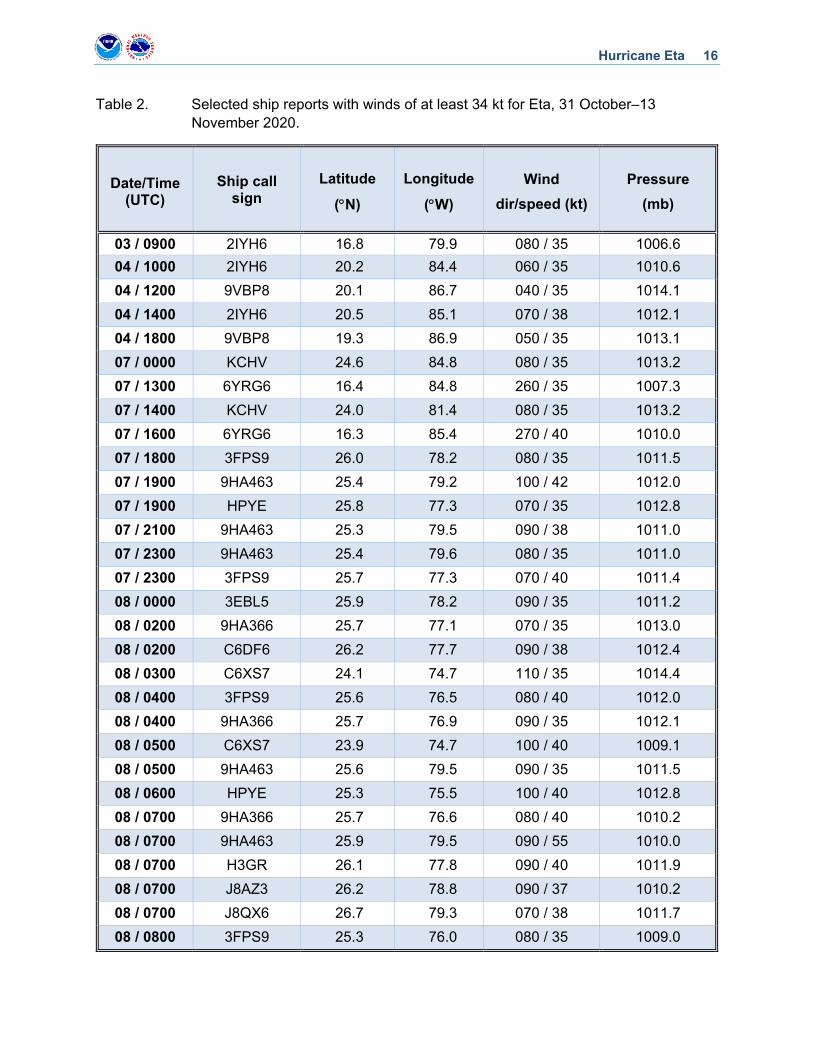
Table 2. Selected ship reports with winds of at least 34 kt for Eta, 31 October–13 November 2020.
Date/Time (UTC)
Ship call sign
Latitude
(N)
Longitude
(W)
Wind
dir/speed (kt)
Pressure
(mb)
03 / 0900 2IYH6 16.8 79.9 080 / 35 1006.6
04 / 1000 2IYH6 20.2 84.4 060 / 35 1010.6
04 / 1200 9VBP8 20.1 86.7 040 / 35 1014.1
04 / 1400 2IYH6 20.5 85.1 070 / 38 1012.1
04 / 1800 9VBP8 19.3 86.9 050 / 35 1013.1
07 / 0000 KCHV 24.6 84.8 080 / 35 1013.2
07 / 1300 6YRG6 16.4 84.8 260 / 35 1007.3
07 / 1400 KCHV 24.0 81.4 080 / 35 1013.2
07 / 1600 6YRG6 16.3 85.4 270 / 40 1010.0
07 / 1800 3FPS9 26.0 78.2 080 / 35 1011.5
07 / 1900 9HA463 25.4 79.2 100 / 42 1012.0
07 / 1900 HPYE 25.8 77.3 070 / 35 1012.8
07 / 2100 9HA463 25.3 79.5 090 / 38 1011.0
07 / 2300 9HA463 25.4 79.6 080 / 35 1011.0
07 / 2300 3FPS9 25.7 77.3 070 / 40 1011.4
08 / 0000 3EBL5 25.9 78.2 090 / 35 1011.2
08 / 0200 9HA366 25.7 77.1 070 / 35 1013.0
08 / 0200 C6DF6 26.2 77.7 090 / 38 1012.4
08 / 0300 C6XS7 24.1 74.7 110 / 35 1014.4
08 / 0400 3FPS9 25.6 76.5 080 / 40 1012.0
08 / 0400 9HA366 25.7 76.9 090 / 35 1012.1
08 / 0500 C6XS7 23.9 74.7 100 / 40 1009.1
08 / 0500 9HA463 25.6 79.5 090 / 35 1011.5
08 / 0600 HPYE 25.3 75.5 100 / 40 1012.8
08 / 0700 9HA366 25.7 76.6 080 / 40 1010.2
08 / 0700 9HA463 25.9 79.5 090 / 55 1010.0
08 / 0700 H3GR 26.1 77.8 090 / 40 1011.9
08 / 0700 J8AZ3 26.2 78.8 090 / 37 1010.2
08 / 0700 J8QX6 26.7 79.3 070 / 38 1011.7
08 / 0800 3FPS9 25.3 76.0 080 / 35 1009.0
Hurricane Eta 17
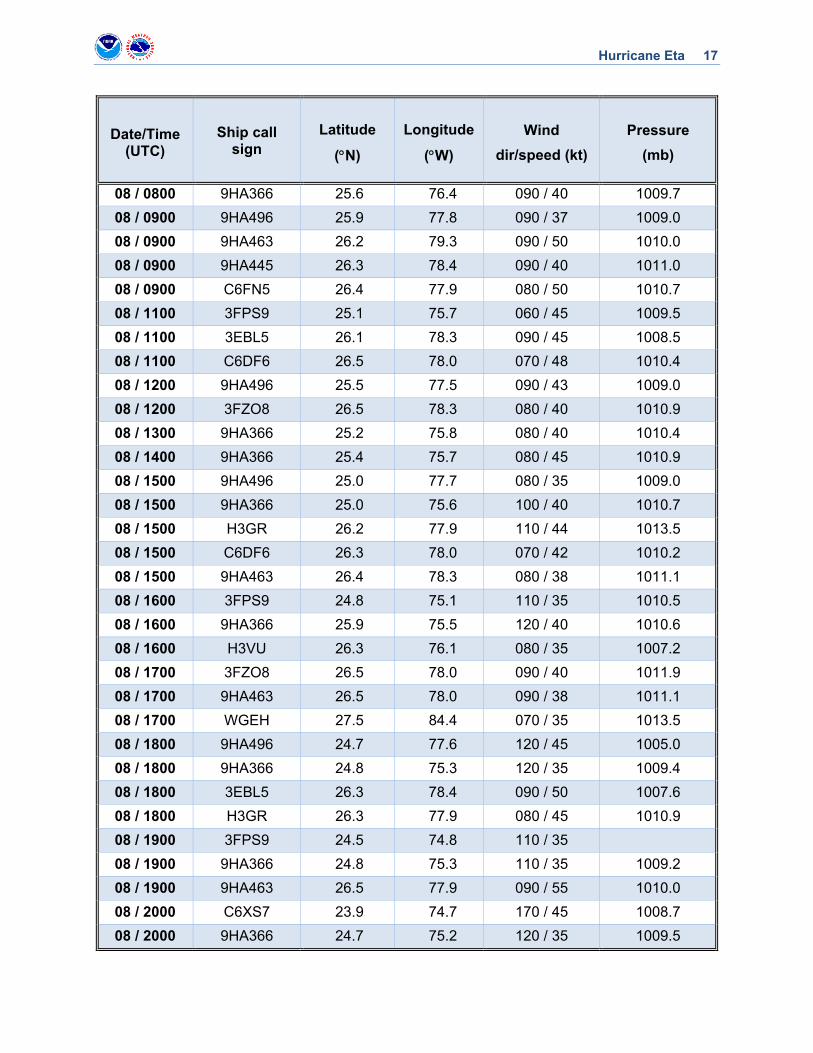
Date/Time (UTC)
Ship call sign
Latitude
(N)
Longitude
(W)
Wind
dir/speed (kt)
Pressure
(mb)
08 / 0800 9HA366 25.6 76.4 090 / 40 1009.7
08 / 0900 9HA496 25.9 77.8 090 / 37 1009.0
08 / 0900 9HA463 26.2 79.3 090 / 50 1010.0
08 / 0900 9HA445 26.3 78.4 090 / 40 1011.0
08 / 0900 C6FN5 26.4 77.9 080 / 50 1010.7
08 / 1100 3FPS9 25.1 75.7 060 / 45 1009.5
08 / 1100 3EBL5 26.1 78.3 090 / 45 1008.5
08 / 1100 C6DF6 26.5 78.0 070 / 48 1010.4
08 / 1200 9HA496 25.5 77.5 090 / 43 1009.0
08 / 1200 3FZO8 26.5 78.3 080 / 40 1010.9
08 / 1300 9HA366 25.2 75.8 080 / 40 1010.4
08 / 1400 9HA366 25.4 75.7 080 / 45 1010.9
08 / 1500 9HA496 25.0 77.7 080 / 35 1009.0
08 / 1500 9HA366 25.0 75.6 100 / 40 1010.7
08 / 1500 H3GR 26.2 77.9 110 / 44 1013.5
08 / 1500 C6DF6 26.3 78.0 070 / 42 1010.2
08 / 1500 9HA463 26.4 78.3 080 / 38 1011.1
08 / 1600 3FPS9 24.8 75.1 110 / 35 1010.5
08 / 1600 9HA366 25.9 75.5 120 / 40 1010.6
08 / 1600 H3VU 26.3 76.1 080 / 35 1007.2
08 / 1700 3FZO8 26.5 78.0 090 / 40 1011.9
08 / 1700 9HA463 26.5 78.0 090 / 38 1011.1
08 / 1700 WGEH 27.5 84.4 070 / 35 1013.5
08 / 1800 9HA496 24.7 77.6 120 / 45 1005.0
08 / 1800 9HA366 24.8 75.3 120 / 35 1009.4
08 / 1800 3EBL5 26.3 78.4 090 / 50 1007.6
08 / 1800 H3GR 26.3 77.9 080 / 45 1010.9
08 / 1900 3FPS9 24.5 74.8 110 / 35
08 / 1900 9HA366 24.8 75.3 110 / 35 1009.2
08 / 1900 9HA463 26.5 77.9 090 / 55 1010.0
08 / 2000 C6XS7 23.9 74.7 170 / 45 1008.7
08 / 2000 9HA366 24.7 75.2 120 / 35 1009.5
Hurricane Eta 18
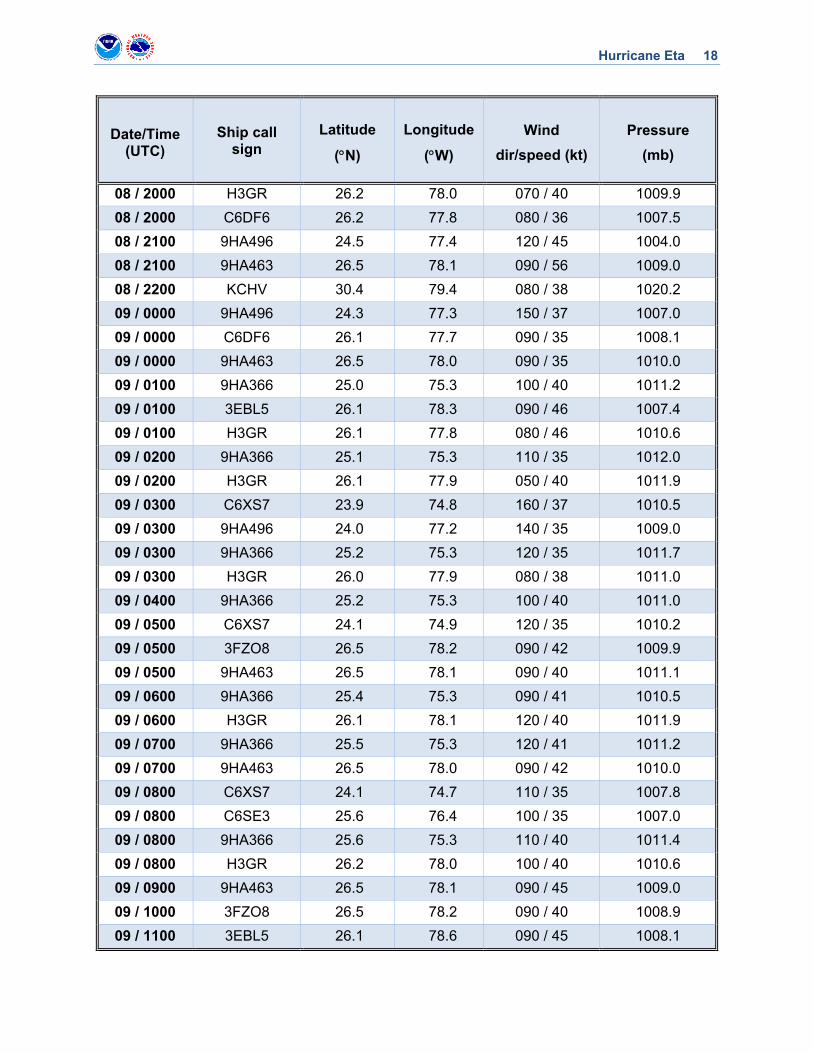
Date/Time (UTC)
Ship call sign
Latitude
(N)
Longitude
(W)
Wind
dir/speed (kt)
Pressure
(mb)
08 / 2000 H3GR 26.2 78.0 070 / 40 1009.9
08 / 2000 C6DF6 26.2 77.8 080 / 36 1007.5
08 / 2100 9HA496 24.5 77.4 120 / 45 1004.0
08 / 2100 9HA463 26.5 78.1 090 / 56 1009.0
08 / 2200 KCHV 30.4 79.4 080 / 38 1020.2
09 / 0000 9HA496 24.3 77.3 150 / 37 1007.0
09 / 0000 C6DF6 26.1 77.7 090 / 35 1008.1
09 / 0000 9HA463 26.5 78.0 090 / 35 1010.0
09 / 0100 9HA366 25.0 75.3 100 / 40 1011.2
09 / 0100 3EBL5 26.1 78.3 090 / 46 1007.4
09 / 0100 H3GR 26.1 77.8 080 / 46 1010.6
09 / 0200 9HA366 25.1 75.3 110 / 35 1012.0
09 / 0200 H3GR 26.1 77.9 050 / 40 1011.9
09 / 0300 C6XS7 23.9 74.8 160 / 37 1010.5
09 / 0300 9HA496 24.0 77.2 140 / 35 1009.0
09 / 0300 9HA366 25.2 75.3 120 / 35 1011.7
09 / 0300 H3GR 26.0 77.9 080 / 38 1011.0
09 / 0400 9HA366 25.2 75.3 100 / 40 1011.0
09 / 0500 C6XS7 24.1 74.9 120 / 35 1010.2
09 / 0500 3FZO8 26.5 78.2 090 / 42 1009.9
09 / 0500 9HA463 26.5 78.1 090 / 40 1011.1
09 / 0600 9HA366 25.4 75.3 090 / 41 1010.5
09 / 0600 H3GR 26.1 78.1 120 / 40 1011.9
09 / 0700 9HA366 25.5 75.3 120 / 41 1011.2
09 / 0700 9HA463 26.5 78.0 090 / 42 1010.0
09 / 0800 C6XS7 24.1 74.7 110 / 35 1007.8
09 / 0800 C6SE3 25.6 76.4 100 / 35 1007.0
09 / 0800 9HA366 25.6 75.3 110 / 40 1011.4
09 / 0800 H3GR 26.2 78.0 100 / 40 1010.6
09 / 0900 9HA463 26.5 78.1 090 / 45 1009.0
09 / 1000 3FZO8 26.5 78.2 090 / 40 1008.9
09 / 1100 3EBL5 26.1 78.6 090 / 45 1008.1
Hurricane Eta 19
Date/Time (UTC)
Ship call sign
Latitude
(N)
Longitude
(W)
Wind
dir/speed (kt)
Pressure
(mb)
09 / 1200 D5WI8 24.7 89.4 050 / 66 1012.0
09 / 1200 3FZO8 26.5 78.4 100 / 35 1009.9
09 / 1200 3FZO8 26.5 78.3 100 / 35 1010.9
09 / 1200 C6FN5 26.5 78.1 100 / 35 1011.3
09 / 1500 9HA463 26.5 78.1 110 / 37 1012.8
09 / 1700 V7KD8 26.0 76.4 090 / 49 1011.0
09 / 1700 9HA463 26.5 78.0 110 / 37 1012.1
09 / 1800 H3GR 26.0 78.2 100 / 40 1011.9
09 / 1900 9HA463 26.5 78.0 090 / 42 1012.0
09 / 2100 9HA463 26.5 78.0 090 / 36 1012.0
10 / 0000 H3VU 26.2 77.9 090 / 35 1013.0
10 / 0000 3EBL5 26.4 78.3 060 / 40 1011.1
10 / 0900 9HA445 26.1 79.4 100 / 35 1012.0
10 / 1200 C6FN5 25.5 79.6 120 / 35 1010.7
10 / 1700 V7KD8 24.6 79.8 130 / 49 1009.0
11 / 0500 9HA366 26.1 78.1 120 / 35 1013.4
11 / 0500 C6XS7 26.3 77.9 130 / 35 1014.1
11 / 0600 HPYE 26.3 77.9 140 / 35 1014.8
11 / 0700 9HA463 26.4 78.3 150 / 38 1011.3
11 / 0900 9HA496 26.0 80.1 170 / 35 1012.0
11 / 0900 9HA463 26.4 78.2 140 / 36 1011.3
11 / 1400 C6YT4 20.5 82.8 230 / 38 1011.3
11 / 1800 V7KD8 23.6 82.7 120 / 56 1008.0
11 / 1800 WLIY 27.4 83.9 130 / 35 998.9
11 / 1800 WLIY 27.4 83.8 090 / 35 1002.0
11 / 2200 9HA366 25.9 78.2 150 / 35 1012.1
11 / 2300 9HA366 25.9 78.2 140 / 35 1013.0
12 / 0100 9HA366 25.8 78.3 140 / 35 1014.6
12 / 0500 9HA366 25.9 78.3 150 / 35 1014.3
12 / 0700 9HA366 25.9 78.3 170 / 35 1013.5
12 / 0700 9HA463 26.3 78.0 150 / 36 1013.3
12 / 1300 WDJ659 29.9 80.7 170 / 40 1006.8
Hurricane Eta 20
Date/Time (UTC)
Ship call sign
Latitude
(N)
Longitude
(W)
Wind
dir/speed (kt)
Pressure
(mb)
12 / 1400 J8QY1 29.9 75.1 040 / 38 1017.0
12 / 1800 WDJ659 28.7 79.1 200 / 40 1009.4
13 / 0100 WMKA 32.9 78.3 050 / 35 1012.0
13 / 0500 J8QY1 27.6 78.7 080 / 35 1012.7
13 / 0500 WMHA 33.0 76.6 050 / 55 1006.6
13 / 0600 WMHA 33.3 76.4 080 / 45 1007.3
13 / 0700 WMHA 33.5 76.2 050 / 40 1009.4
13 / 0800 WMHA 33.8 76.0 080 / 42 1009.1
13 / 0900 WMHA 34.0 75.8 100 / 50 1005.9
13 / 1800 VRGE7 35.5 69.9 160 / 48 1011.9
Hurricane Eta 21
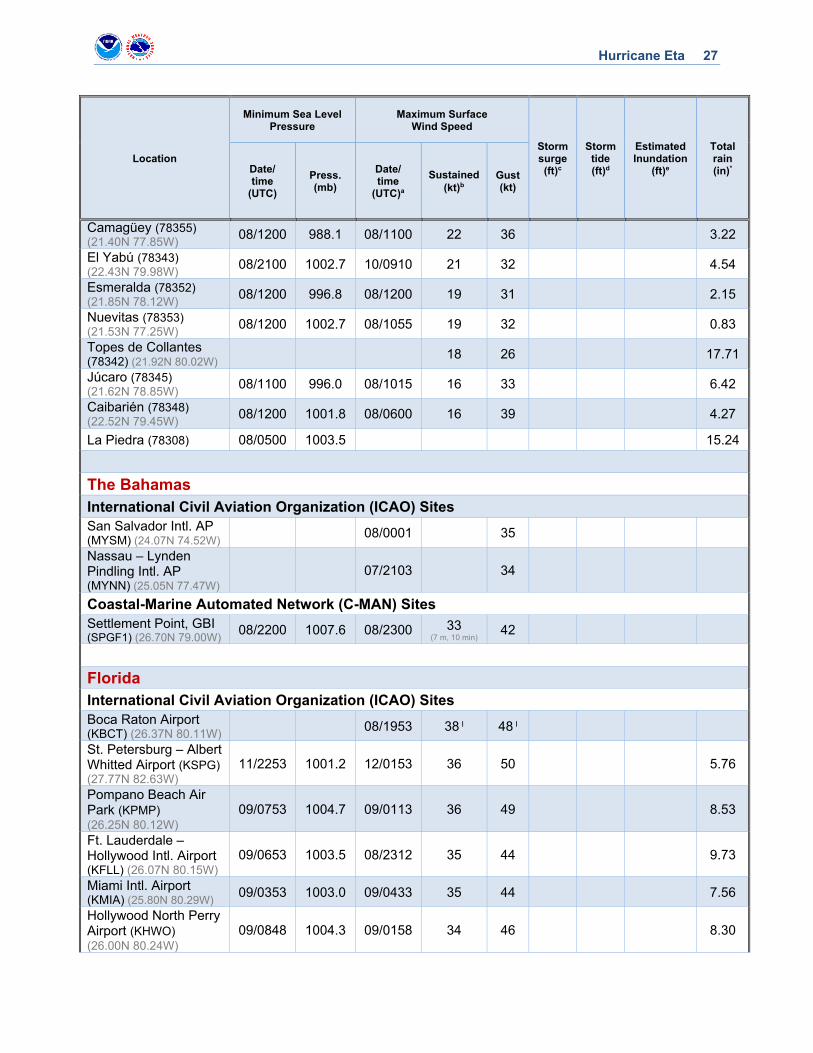
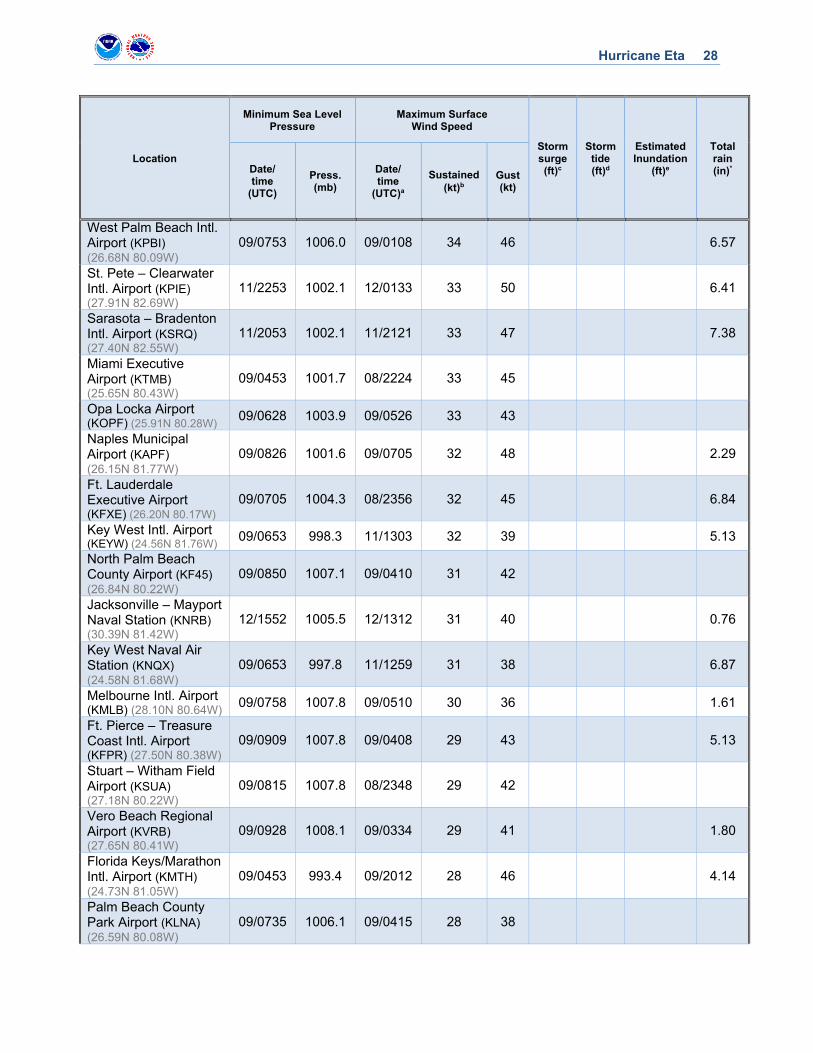
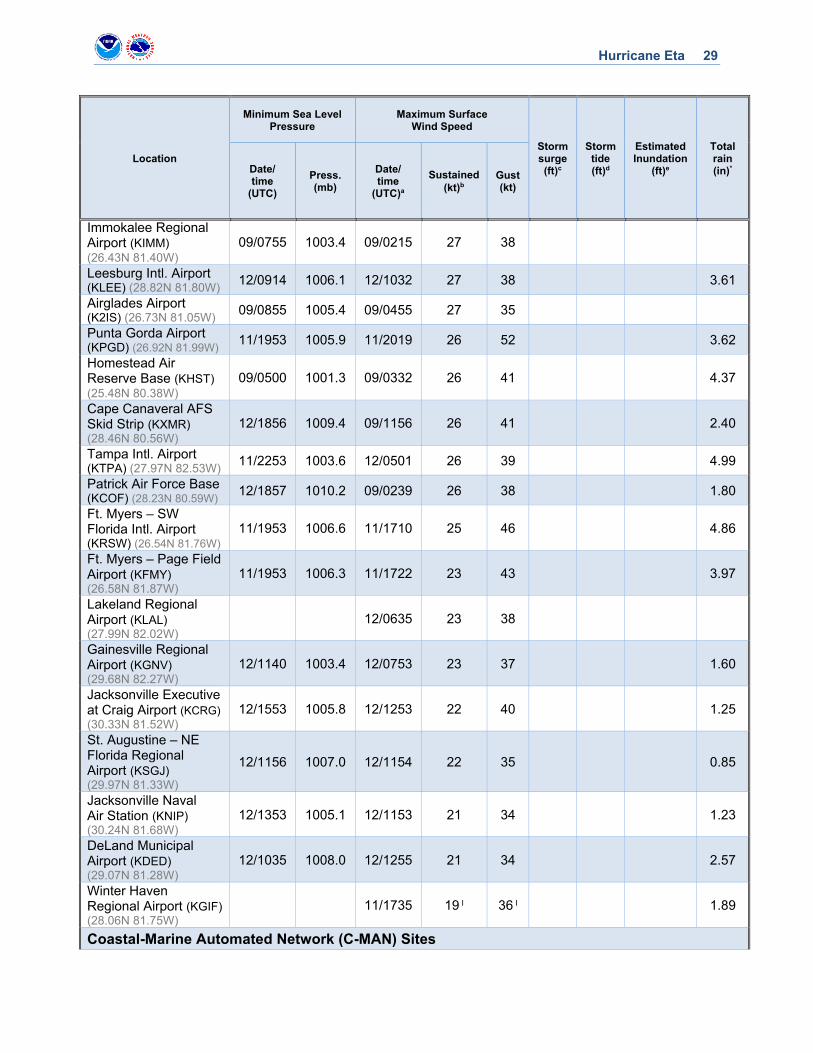
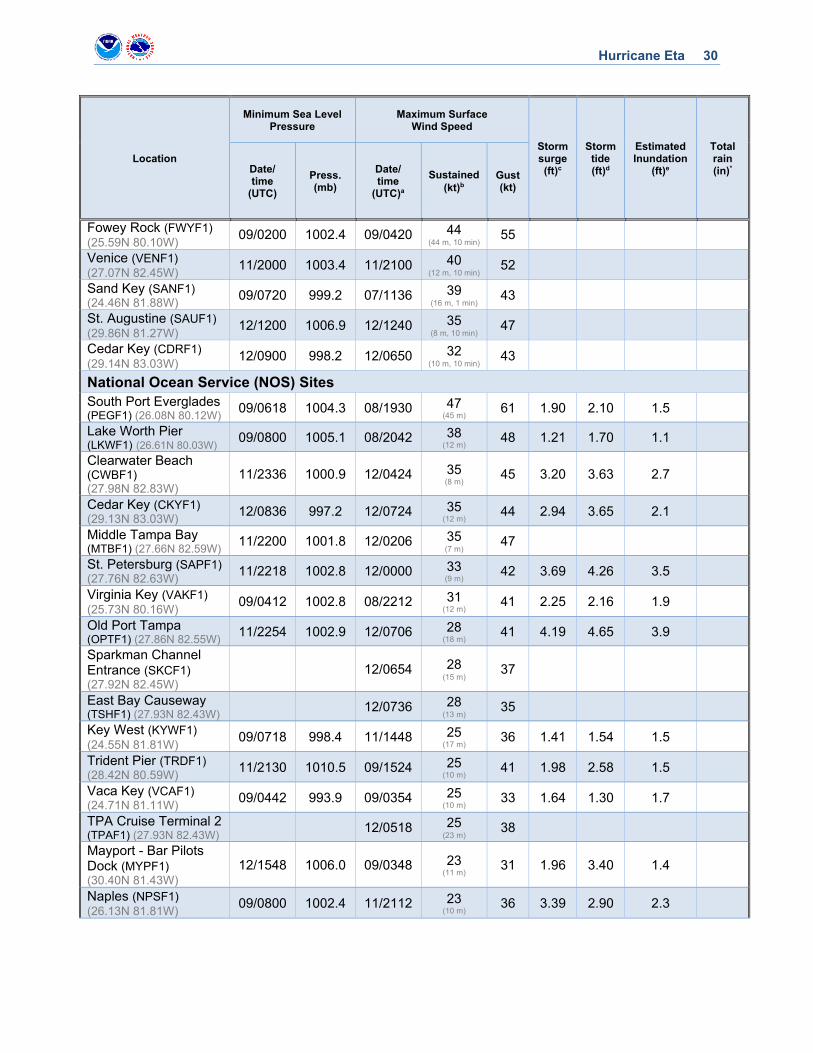
Table 3. Selected surface observations for Hurricane Eta, 31 October–13 November 2020.
Location
Minimum Sea Level Pressure
Maximum Surface Wind Speed
Storm surge (ft)c
Storm tide (ft)d
Estimated Inundation
(ft)e
Total rain (in)* Date/
time (UTC)
Press. (mb)
Date/ time
(UTC)a
Sustained (kt)b
Gust (kt)
Jamaica Kingston – Norman Manley Intl. AP (MKJP) (17.93N 76.78W)
01/1325 23 33 11.09
Moore Town (18.08N 76.43W) 28.89
Comfort Castle (18.05N 76.41W) 28.15
Norris (17.92N 76.58W) 23.24
Ramble (17.97N 76.61W) 20.33
New Yarmouth (17.88N 77.28W) 18.58
Sherwood Forest (18.15N 76.38W) 18.41
Fruitful Vale (18.14N 76.55W) 17.44
Spring Gardens (18.22N 76.63W) 14.81
Bachelor’s Hall (17.95N 76.32W) 13.37
Bois Content (18.01N 77.16W) 12.86
Caswell Hill (17.87N 77.27W) 11.81
Old Yarmouth Quarry (17.87N 77.29W) 11.81
Old Yarmouth Fisher (17.85N 77.29W) 11.02
Hordley Estate (17.95N 76.27W) 10.95
Bybrook (18.18N 76.64W) 10.34
Colombia
International Civil Aviation Organization (ICAO) Sites
San Andrés – Gustavo Rojas Pinilla Intl. AP (SKSP) (12.58N 81.72W)
1001 03/0900 19 40
Nicaragua
International Civil Aviation Organization (ICAO) Sites
Hurricane Eta 22
Location
Minimum Sea Level Pressure
Maximum Surface Wind Speed
Storm surge (ft)c
Storm tide (ft)d
Estimated Inundation
(ft)e
Total rain (in)* Date/
time (UTC)
Press. (mb)
Date/ time
(UTC)a
Sustained (kt)b
Gust (kt)
Puerto Cabezas AP (MNPC) (14.04N 83.38W) 03/2124 94 I 118 I
Other Sites
Puerto Corinto (640001) (12.48N 87.17W) 26.55
Las Lomas (69255) (12.54N 86.21W) 23.46
Sahsa (51005) (14.07N 83.99W) 10.12
Puerto Cabezas (47002) (14.05N 83.78W) 9.95
Tola (70002) (11.44N 85.94W) 9.42
Waspam (45007) (14.75N 83.97W) 9.24
Rivas (69070) (11.44N 85.83W) 8.51
La Cruz de Río Grande (550119) (13.11N 84.19W)
7.71
Bismuna (47008) (14.75W 83.42W) 6.11
Honduras
International Civil Aviation Organization (ICAO) Sites
Roatán – Juan Manuel Gálvez Intl. AP (MHRO) (16.32N 86.53W)
03/2200 20 I 35 I 9.71
La Ceiba – Golosón Intl. AP (MHLC) (15.75N 86.84W)
02/2000 14 I 27 I 29.25
Other Sites
Roatán – Jonesville Point Road (16.38N 86.38W)
04/2129 1005.7 04/0118 23 37
Tela (15.78N 87.47W) 31.63
Jaremar, Tibombo (15.59N 87.80W) 24.87
Balfate (15.78N 86.38W) 24.69
Honducaribe, Baracoa (15.75N 87.84W) 22.73
Omoa (15.78N 88.04W) 21.25
Trujillo (15.93N 85.94W) 19.56
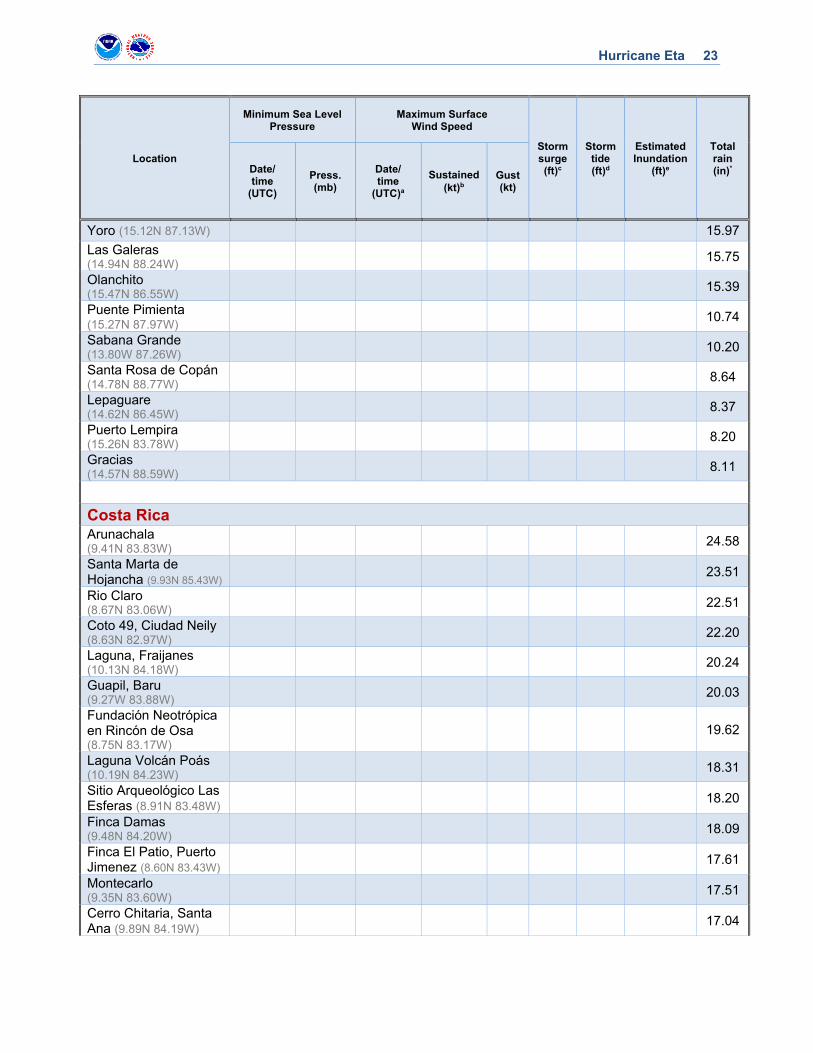
Hurricane Eta 23
Location
Minimum Sea Level Pressure
Maximum Surface Wind Speed
Storm surge (ft)c
Storm tide (ft)d
Estimated Inundation
(ft)e
Total rain (in)* Date/
time (UTC)
Press. (mb)
Date/ time
(UTC)a
Sustained (kt)b
Gust (kt)
Yoro (15.12N 87.13W) 15.97
Las Galeras (14.94N 88.24W) 15.75
Olanchito (15.47N 86.55W) 15.39
Puente Pimienta (15.27N 87.97W) 10.74
Sabana Grande (13.80W 87.26W) 10.20
Santa Rosa de Copán (14.78N 88.77W) 8.64
Lepaguare (14.62N 86.45W) 8.37
Puerto Lempira (15.26N 83.78W) 8.20
Gracias (14.57N 88.59W) 8.11
Costa Rica Arunachala (9.41N 83.83W) 24.58
Santa Marta de Hojancha (9.93N 85.43W)
23.51
Rio Claro (8.67N 83.06W) 22.51
Coto 49, Ciudad Neily (8.63N 82.97W) 22.20
Laguna, Fraijanes (10.13N 84.18W) 20.24
Guapil, Baru (9.27W 83.88W) 20.03
Fundación Neotrópica en Rincón de Osa (8.75N 83.17W)
19.62
Laguna Volcán Poás (10.19N 84.23W) 18.31
Sitio Arqueológico Las Esferas (8.91N 83.48W)
18.20
Finca Damas (9.48N 84.20W) 18.09
Finca El Patio, Puerto Jimenez (8.60N 83.43W)
17.61
Montecarlo (9.35N 83.60W) 17.51
Cerro Chitaria, Santa Ana (9.89N 84.19W)
17.04
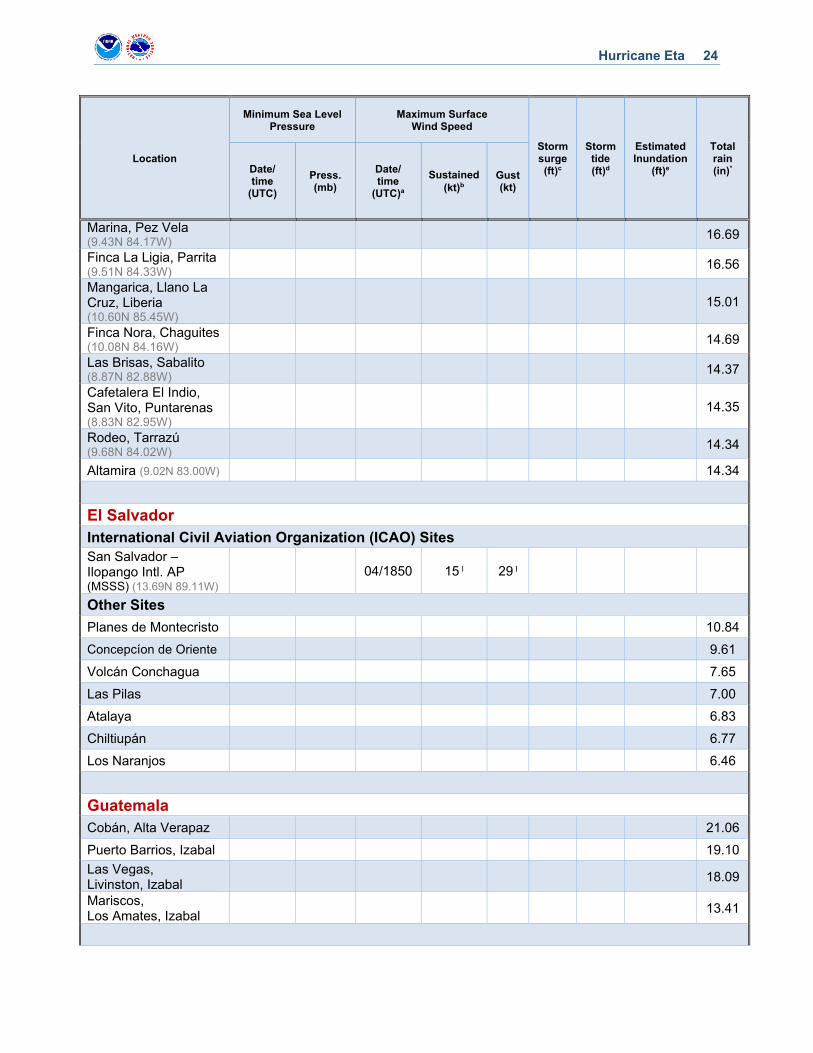
Hurricane Eta 24
Location
Minimum Sea Level Pressure
Maximum Surface Wind Speed
Storm surge (ft)c
Storm tide (ft)d
Estimated Inundation
(ft)e
Total rain (in)* Date/
time (UTC)
Press. (mb)
Date/ time
(UTC)a
Sustained (kt)b
Gust (kt)
Marina, Pez Vela (9.43N 84.17W) 16.69
Finca La Ligia, Parrita (9.51N 84.33W) 16.56
Mangarica, Llano La Cruz, Liberia (10.60N 85.45W)
15.01
Finca Nora, Chaguites (10.08N 84.16W) 14.69
Las Brisas, Sabalito (8.87N 82.88W) 14.37
Cafetalera El Indio, San Vito, Puntarenas (8.83N 82.95W)
14.35
Rodeo, Tarrazú (9.68N 84.02W) 14.34
Altamira (9.02N 83.00W) 14.34
El Salvador
International Civil Aviation Organization (ICAO) Sites
San Salvador – Ilopango Intl. AP (MSSS) (13.69N 89.11W)
04/1850 15 I 29 I
Other Sites
Planes de Montecristo 10.84
Concepcíon de Oriente 9.61
Volcán Conchagua 7.65
Las Pilas 7.00
Atalaya 6.83
Chiltiupán 6.77
Los Naranjos 6.46
Guatemala
Cobán, Alta Verapaz 21.06
Puerto Barrios, Izabal 19.10
Las Vegas, Livinston, Izabal
18.09
Mariscos, Los Amates, Izabal
13.41
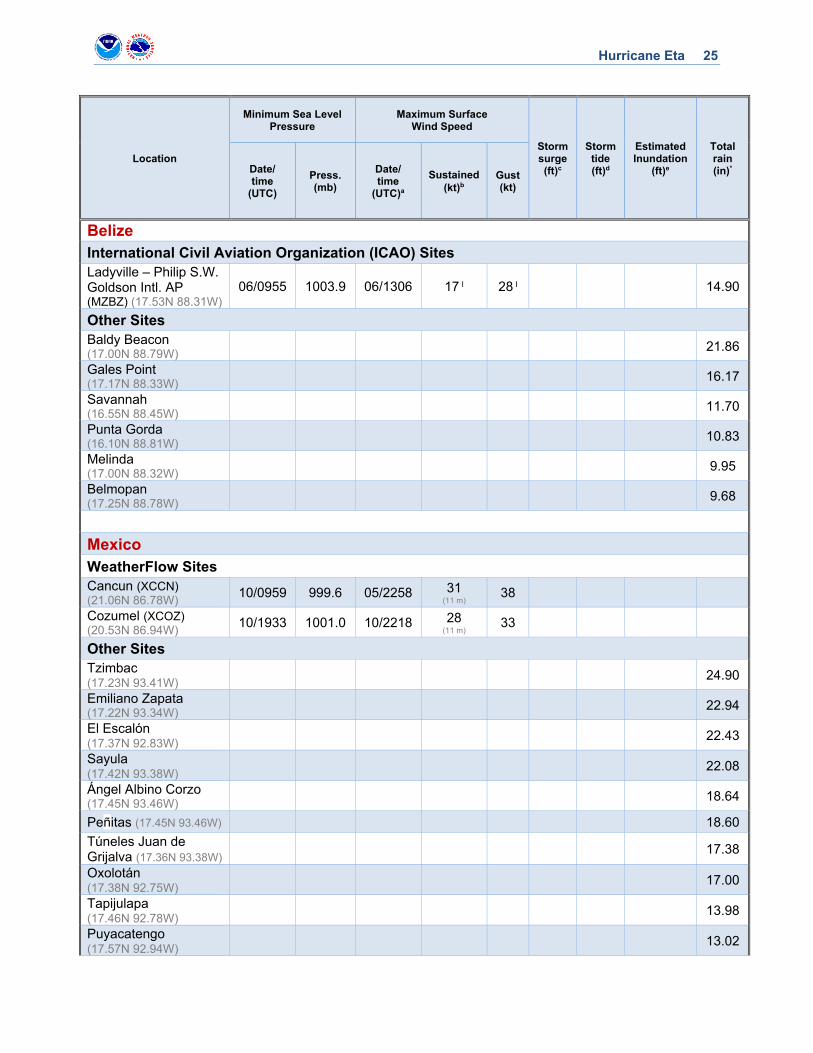
Hurricane Eta 25
Location
Minimum Sea Level Pressure
Maximum Surface Wind Speed
Storm surge (ft)c
Storm tide (ft)d
Estimated Inundation
(ft)e
Total rain (in)* Date/
time (UTC)
Press. (mb)
Date/ time
(UTC)a
Sustained (kt)b
Gust (kt)
Belize
International Civil Aviation Organization (ICAO) Sites
Ladyville – Philip S.W. Goldson Intl. AP (MZBZ) (17.53N 88.31W)
06/0955 1003.9 06/1306 17 I 28 I 14.90
Other Sites
Baldy Beacon (17.00N 88.79W) 21.86
Gales Point (17.17N 88.33W) 16.17
Savannah (16.55N 88.45W) 11.70
Punta Gorda (16.10N 88.81W) 10.83
Melinda (17.00N 88.32W) 9.95
Belmopan (17.25N 88.78W) 9.68
Mexico
WeatherFlow Sites
Cancun (XCCN) (21.06N 86.78W) 10/0959 999.6 05/2258 31
(11 m) 38
Cozumel (XCOZ) (20.53N 86.94W) 10/1933 1001.0 10/2218 28
(11 m) 33
Other Sites
Tzimbac (17.23N 93.41W) 24.90
Emiliano Zapata (17.22N 93.34W) 22.94
El Escalón (17.37N 92.83W) 22.43
Sayula (17.42N 93.38W) 22.08
Ángel Albino Corzo (17.45N 93.46W) 18.64
Peñitas (17.45N 93.46W) 18.60
Túneles Juan de Grijalva (17.36N 93.38W)
17.38
Oxolotán (17.38N 92.75W) 17.00
Tapijulapa (17.46N 92.78W) 13.98
Puyacatengo (17.57N 92.94W) 13.02
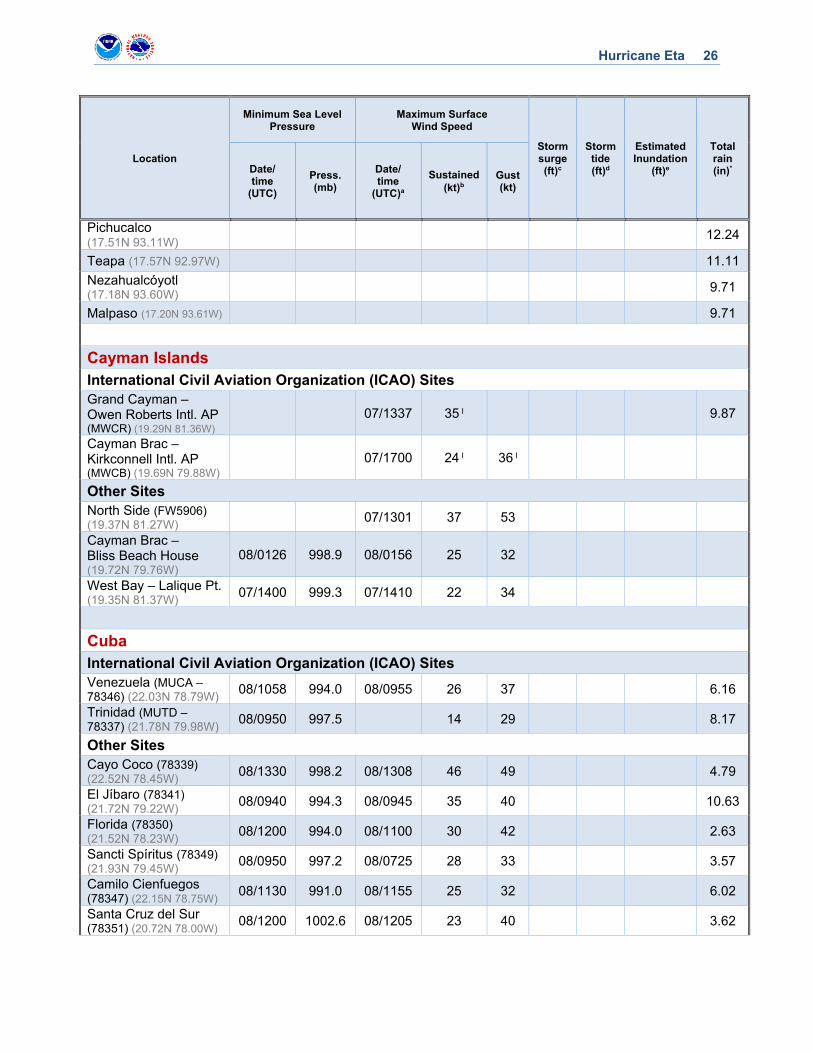
Hurricane Eta 26
Location
Minimum Sea Level Pressure
Maximum Surface Wind Speed
Storm surge (ft)c
Storm tide (ft)d
Estimated Inundation
(ft)e
Total rain (in)* Date/
time (UTC)
Press. (mb)
Date/ time
(UTC)a
Sustained (kt)b
Gust (kt)
Pichucalco (17.51N 93.11W) 12.24
Teapa (17.57N 92.97W) 11.11
Nezahualcóyotl (17.18N 93.60W) 9.71
Malpaso (17.20N 93.61W) 9.71
Cayman Islands
International Civil Aviation Organization (ICAO) Sites
Grand Cayman – Owen Roberts Intl. AP (MWCR) (19.29N 81.36W)
07/1337 35 I 9.87
Cayman Brac –Kirkconnell Intl. AP (MWCB) (19.69N 79.88W)
07/1700 24 I 36 I
Other Sites
North Side (FW5906) (19.37N 81.27W) 07/1301 37 53
Cayman Brac – Bliss Beach House (19.72N 79.76W)
08/0126 998.9 08/0156 25 32
West Bay – Lalique Pt. (19.35N 81.37W) 07/1400 999.3 07/1410 22 34
Cuba
International Civil Aviation Organization (ICAO) Sites
Venezuela (MUCA –78346) (22.03N 78.79W) 08/1058 994.0 08/0955 26 37 6.16
Trinidad (MUTD – 78337) (21.78N 79.98W) 08/0950 997.5 14 29 8.17
Other Sites
Cayo Coco (78339) (22.52N 78.45W) 08/1330 998.2 08/1308 46 49 4.79
El Jíbaro (78341) (21.72N 79.22W) 08/0940 994.3 08/0945 35 40 10.63
Florida (78350) (21.52N 78.23W) 08/1200 994.0 08/1100 30 42 2.63
Sancti Spíritus (78349) (21.93N 79.45W) 08/0950 997.2 08/0725 28 33 3.57
Camilo Cienfuegos (78347) (22.15N 78.75W) 08/1130 991.0 08/1155 25 32 6.02
Santa Cruz del Sur (78351) (20.72N 78.00W) 08/1200 1002.6 08/1205 23 40 3.62
Hurricane Eta 27
Location
Minimum Sea Level Pressure
Maximum Surface Wind Speed
Storm surge (ft)c
Storm tide (ft)d
Estimated Inundation
(ft)e
Total rain (in)* Date/
time (UTC)
Press. (mb)
Date/ time
(UTC)a
Sustained (kt)b
Gust (kt)
Camagüey (78355) (21.40N 77.85W) 08/1200 988.1 08/1100 22 36 3.22
El Yabú (78343) (22.43N 79.98W) 08/2100 1002.7 10/0910 21 32 4.54
Esmeralda (78352) (21.85N 78.12W) 08/1200 996.8 08/1200 19 31 2.15
Nuevitas (78353) (21.53N 77.25W) 08/1200 1002.7 08/1055 19 32 0.83
Topes de Collantes (78342) (21.92N 80.02W) 18 26 17.71
Júcaro (78345) (21.62N 78.85W) 08/1100 996.0 08/1015 16 33 6.42
Caibarién (78348) (22.52N 79.45W) 08/1200 1001.8 08/0600 16 39 4.27
La Piedra (78308) 08/0500 1003.5 15.24
The Bahamas
International Civil Aviation Organization (ICAO) Sites
San Salvador Intl. AP (MYSM) (24.07N 74.52W) 08/0001 35
Nassau – Lynden Pindling Intl. AP (MYNN) (25.05N 77.47W)
07/2103 34
Coastal-Marine Automated Network (C-MAN) Sites
Settlement Point, GBI (SPGF1) (26.70N 79.00W) 08/2200 1007.6 08/2300 33
(7 m, 10 min) 42
Florida
International Civil Aviation Organization (ICAO) Sites Boca Raton Airport (KBCT) (26.37N 80.11W) 08/1953 38 I 48 I
St. Petersburg – Albert Whitted Airport (KSPG) (27.77N 82.63W)
11/2253 1001.2 12/0153 36 50 5.76
Pompano Beach Air Park (KPMP) (26.25N 80.12W)
09/0753 1004.7 09/0113 36 49 8.53
Ft. Lauderdale –Hollywood Intl. Airport (KFLL) (26.07N 80.15W)
09/0653 1003.5 08/2312 35 44 9.73
Miami Intl. Airport (KMIA) (25.80N 80.29W) 09/0353 1003.0 09/0433 35 44 7.56
Hollywood North Perry Airport (KHWO) (26.00N 80.24W)
09/0848 1004.3 09/0158 34 46 8.30
Hurricane Eta 28
Location
Minimum Sea Level Pressure
Maximum Surface Wind Speed
Storm surge (ft)c
Storm tide (ft)d
Estimated Inundation
(ft)e
Total rain (in)* Date/
time (UTC)
Press. (mb)
Date/ time
(UTC)a
Sustained (kt)b
Gust (kt)
West Palm Beach Intl. Airport (KPBI) (26.68N 80.09W)
09/0753 1006.0 09/0108 34 46 6.57
St. Pete – Clearwater Intl. Airport (KPIE) (27.91N 82.69W)
11/2253 1002.1 12/0133 33 50 6.41
Sarasota – Bradenton Intl. Airport (KSRQ) (27.40N 82.55W)
11/2053 1002.1 11/2121 33 47 7.38
Miami Executive Airport (KTMB) (25.65N 80.43W)
09/0453 1001.7 08/2224 33 45
Opa Locka Airport (KOPF) (25.91N 80.28W) 09/0628 1003.9 09/0526 33 43
Naples Municipal Airport (KAPF) (26.15N 81.77W)
09/0826 1001.6 09/0705 32 48 2.29
Ft. Lauderdale Executive Airport (KFXE) (26.20N 80.17W)
09/0705 1004.3 08/2356 32 45 6.84
Key West Intl. Airport (KEYW) (24.56N 81.76W) 09/0653 998.3 11/1303 32 39 5.13
North Palm Beach County Airport (KF45) (26.84N 80.22W)
09/0850 1007.1 09/0410 31 42
Jacksonville – Mayport Naval Station (KNRB) (30.39N 81.42W)
12/1552 1005.5 12/1312 31 40 0.76
Key West Naval Air Station (KNQX) (24.58N 81.68W)
09/0653 997.8 11/1259 31 38 6.87
Melbourne Intl. Airport (KMLB) (28.10N 80.64W) 09/0758 1007.8 09/0510 30 36 1.61
Ft. Pierce – Treasure Coast Intl. Airport (KFPR) (27.50N 80.38W)
09/0909 1007.8 09/0408 29 43 5.13
Stuart – Witham Field Airport (KSUA) (27.18N 80.22W)
09/0815 1007.8 08/2348 29 42
Vero Beach Regional Airport (KVRB) (27.65N 80.41W)
09/0928 1008.1 09/0334 29 41 1.80
Florida Keys/Marathon Intl. Airport (KMTH) (24.73N 81.05W)
09/0453 993.4 09/2012 28 46 4.14
Palm Beach County Park Airport (KLNA) (26.59N 80.08W)
09/0735 1006.1 09/0415 28 38
Hurricane Eta 29
Location
Minimum Sea Level Pressure
Maximum Surface Wind Speed
Storm surge (ft)c
Storm tide (ft)d
Estimated Inundation
(ft)e
Total rain (in)* Date/
time (UTC)
Press. (mb)
Date/ time
(UTC)a
Sustained (kt)b
Gust (kt)
Immokalee Regional Airport (KIMM) (26.43N 81.40W)
09/0755 1003.4 09/0215 27 38
Leesburg Intl. Airport (KLEE) (28.82N 81.80W) 12/0914 1006.1 12/1032 27 38 3.61
Airglades Airport (K2IS) (26.73N 81.05W)
09/0855 1005.4 09/0455 27 35
Punta Gorda Airport (KPGD) (26.92N 81.99W) 11/1953 1005.9 11/2019 26 52 3.62
Homestead Air Reserve Base (KHST) (25.48N 80.38W)
09/0500 1001.3 09/0332 26 41 4.37
Cape Canaveral AFS Skid Strip (KXMR) (28.46N 80.56W)
12/1856 1009.4 09/1156 26 41 2.40
Tampa Intl. Airport (KTPA) (27.97N 82.53W) 11/2253 1003.6 12/0501 26 39 4.99
Patrick Air Force Base (KCOF) (28.23N 80.59W) 12/1857 1010.2 09/0239 26 38 1.80
Ft. Myers – SW Florida Intl. Airport (KRSW) (26.54N 81.76W)
11/1953 1006.6 11/1710 25 46 4.86
Ft. Myers – Page Field Airport (KFMY) (26.58N 81.87W)
11/1953 1006.3 11/1722 23 43 3.97
Lakeland Regional Airport (KLAL) (27.99N 82.02W)
12/0635 23 38
Gainesville Regional Airport (KGNV) (29.68N 82.27W)
12/1140 1003.4 12/0753 23 37 1.60
Jacksonville Executive at Craig Airport (KCRG) (30.33N 81.52W)
12/1553 1005.8 12/1253 22 40 1.25
St. Augustine – NE Florida Regional Airport (KSGJ) (29.97N 81.33W)
12/1156 1007.0 12/1154 22 35 0.85
Jacksonville Naval Air Station (KNIP) (30.24N 81.68W)
12/1353 1005.1 12/1153 21 34 1.23
DeLand Municipal Airport (KDED) (29.07N 81.28W)
12/1035 1008.0 12/1255 21 34 2.57
Winter Haven Regional Airport (KGIF) (28.06N 81.75W)
11/1735 19 I 36 I 1.89
Coastal-Marine Automated Network (C-MAN) Sites
Hurricane Eta 30
Location
Minimum Sea Level Pressure
Maximum Surface Wind Speed
Storm surge (ft)c
Storm tide (ft)d
Estimated Inundation
(ft)e
Total rain (in)* Date/
time (UTC)
Press. (mb)
Date/ time
(UTC)a
Sustained (kt)b
Gust (kt)
Fowey Rock (FWYF1) (25.59N 80.10W) 09/0200 1002.4 09/0420 44
(44 m, 10 min) 55
Venice (VENF1) (27.07N 82.45W) 11/2000 1003.4 11/2100 40
(12 m, 10 min) 52
Sand Key (SANF1) (24.46N 81.88W) 09/0720 999.2 07/1136 39
(16 m, 1 min) 43
St. Augustine (SAUF1) (29.86N 81.27W) 12/1200 1006.9 12/1240 35
(8 m, 10 min) 47
Cedar Key (CDRF1) (29.14N 83.03W)
12/0900 998.2 12/0650 32 (10 m, 10 min) 43
National Ocean Service (NOS) Sites
South Port Everglades (PEGF1) (26.08N 80.12W) 09/0618 1004.3 08/1930 47
(45 m) 61 1.90 2.10 1.5
Lake Worth Pier (LKWF1) (26.61N 80.03W) 09/0800 1005.1 08/2042 38
(12 m) 48 1.21 1.70 1.1
Clearwater Beach (CWBF1) (27.98N 82.83W)
11/2336 1000.9 12/0424 35 (8 m) 45 3.20 3.63 2.7
Cedar Key (CKYF1) (29.13N 83.03W) 12/0836 997.2 12/0724 35
(12 m) 44 2.94 3.65 2.1
Middle Tampa Bay (MTBF1) (27.66N 82.59W) 11/2200 1001.8 12/0206 35
(7 m) 47
St. Petersburg (SAPF1) (27.76N 82.63W) 11/2218 1002.8 12/0000 33
(9 m) 42 3.69 4.26 3.5
Virginia Key (VAKF1) (25.73N 80.16W) 09/0412 1002.8 08/2212 31
(12 m) 41 2.25 2.16 1.9
Old Port Tampa (OPTF1) (27.86N 82.55W) 11/2254 1002.9 12/0706 28
(18 m) 41 4.19 4.65 3.9
Sparkman Channel Entrance (SKCF1) (27.92N 82.45W)
12/0654 28 (15 m) 37
East Bay Causeway (TSHF1) (27.93N 82.43W) 12/0736 28
(13 m) 35
Key West (KYWF1) (24.55N 81.81W) 09/0718 998.4 11/1448 25
(17 m) 36 1.41 1.54 1.5
Trident Pier (TRDF1) (28.42N 80.59W) 11/2130 1010.5 09/1524 25
(10 m) 41 1.98 2.58 1.5
Vaca Key (VCAF1) (24.71N 81.11W) 09/0442 993.9 09/0354 25
(10 m) 33 1.64 1.30 1.7
TPA Cruise Terminal 2 (TPAF1) (27.93N 82.43W) 12/0518 25
(23 m) 38
Mayport - Bar Pilots Dock (MYPF1) (30.40N 81.43W)
12/1548 1006.0 09/0348 23 (11 m) 31 1.96 3.40 1.4
Naples (NPSF1) (26.13N 81.81W) 09/0800 1002.4 11/2112 23
(10 m) 36 3.39 2.90 2.3
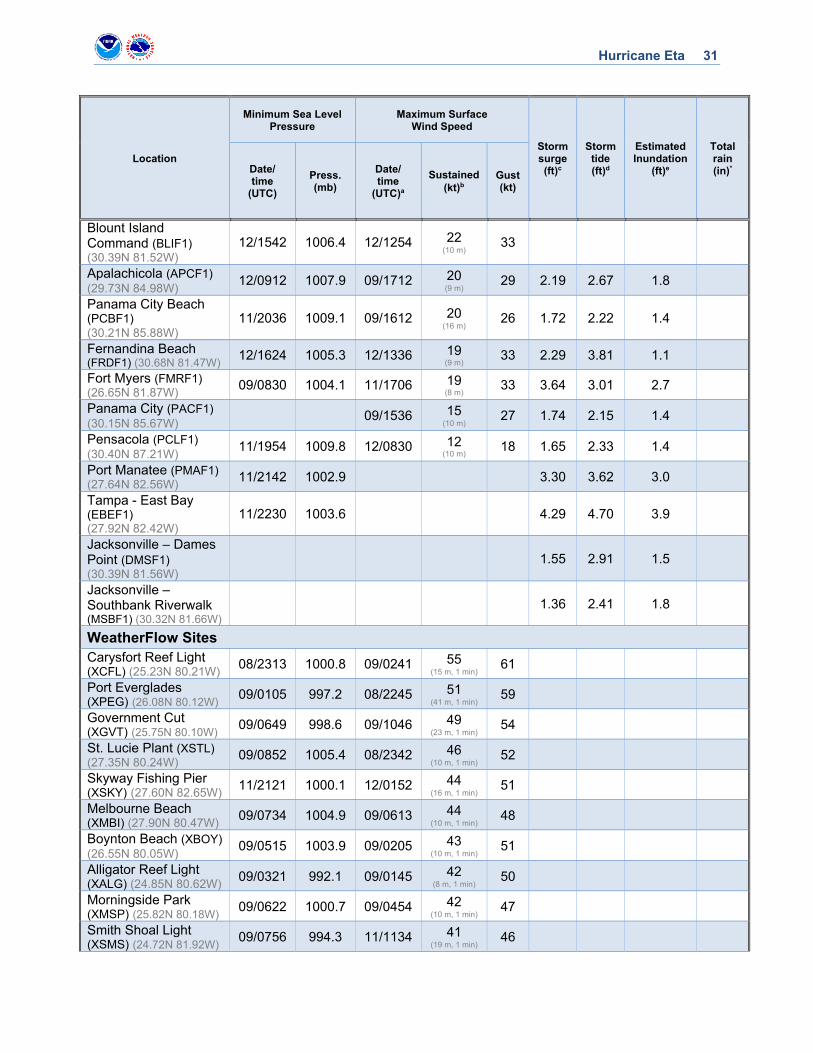
Hurricane Eta 31
Location
Minimum Sea Level Pressure
Maximum Surface Wind Speed
Storm surge (ft)c
Storm tide (ft)d
Estimated Inundation
(ft)e
Total rain (in)* Date/
time (UTC)
Press. (mb)
Date/ time
(UTC)a
Sustained (kt)b
Gust (kt)
Blount Island Command (BLIF1) (30.39N 81.52W)
12/1542 1006.4 12/1254 22 (10 m) 33
Apalachicola (APCF1) (29.73N 84.98W) 12/0912 1007.9 09/1712 20
(9 m) 29 2.19 2.67 1.8
Panama City Beach (PCBF1) (30.21N 85.88W)
11/2036 1009.1 09/1612 20 (16 m) 26 1.72 2.22 1.4
Fernandina Beach (FRDF1) (30.68N 81.47W) 12/1624 1005.3 12/1336 19
(9 m) 33 2.29 3.81 1.1
Fort Myers (FMRF1) (26.65N 81.87W) 09/0830 1004.1 11/1706 19
(8 m) 33 3.64 3.01 2.7
Panama City (PACF1) (30.15N 85.67W) 09/1536 15
(10 m) 27 1.74 2.15 1.4
Pensacola (PCLF1) (30.40N 87.21W) 11/1954 1009.8 12/0830 12
(10 m) 18 1.65 2.33 1.4
Port Manatee (PMAF1) (27.64N 82.56W) 11/2142 1002.9 3.30 3.62 3.0
Tampa - East Bay (EBEF1) (27.92N 82.42W)
11/2230 1003.6 4.29 4.70 3.9
Jacksonville – Dames Point (DMSF1) (30.39N 81.56W)
1.55 2.91 1.5
Jacksonville – Southbank Riverwalk (MSBF1) (30.32N 81.66W)
1.36 2.41 1.8
WeatherFlow Sites
Carysfort Reef Light (XCFL) (25.23N 80.21W) 08/2313 1000.8 09/0241 55
(15 m, 1 min) 61
Port Everglades (XPEG) (26.08N 80.12W) 09/0105 997.2 08/2245 51
(41 m, 1 min) 59
Government Cut (XGVT) (25.75N 80.10W) 09/0649 998.6 09/1046 49
(23 m, 1 min) 54
St. Lucie Plant (XSTL) (27.35N 80.24W) 09/0852 1005.4 08/2342 46
(10 m, 1 min) 52
Skyway Fishing Pier (XSKY) (27.60N 82.65W) 11/2121 1000.1 12/0152 44
(16 m, 1 min) 51
Melbourne Beach (XMBI) (27.90N 80.47W) 09/0734 1004.9 09/0613 44
(10 m, 1 min) 48
Boynton Beach (XBOY) (26.55N 80.05W) 09/0515 1003.9 09/0205 43
(10 m, 1 min) 51
Alligator Reef Light (XALG) (24.85N 80.62W) 09/0321 992.1 09/0145 42
(8 m, 1 min) 50
Morningside Park (XMSP) (25.82N 80.18W) 09/0622 1000.7 09/0454 42
(10 m, 1 min) 47
Smith Shoal Light (XSMS) (24.72N 81.92W) 09/0756 994.3 11/1134 41
(19 m, 1 min) 46
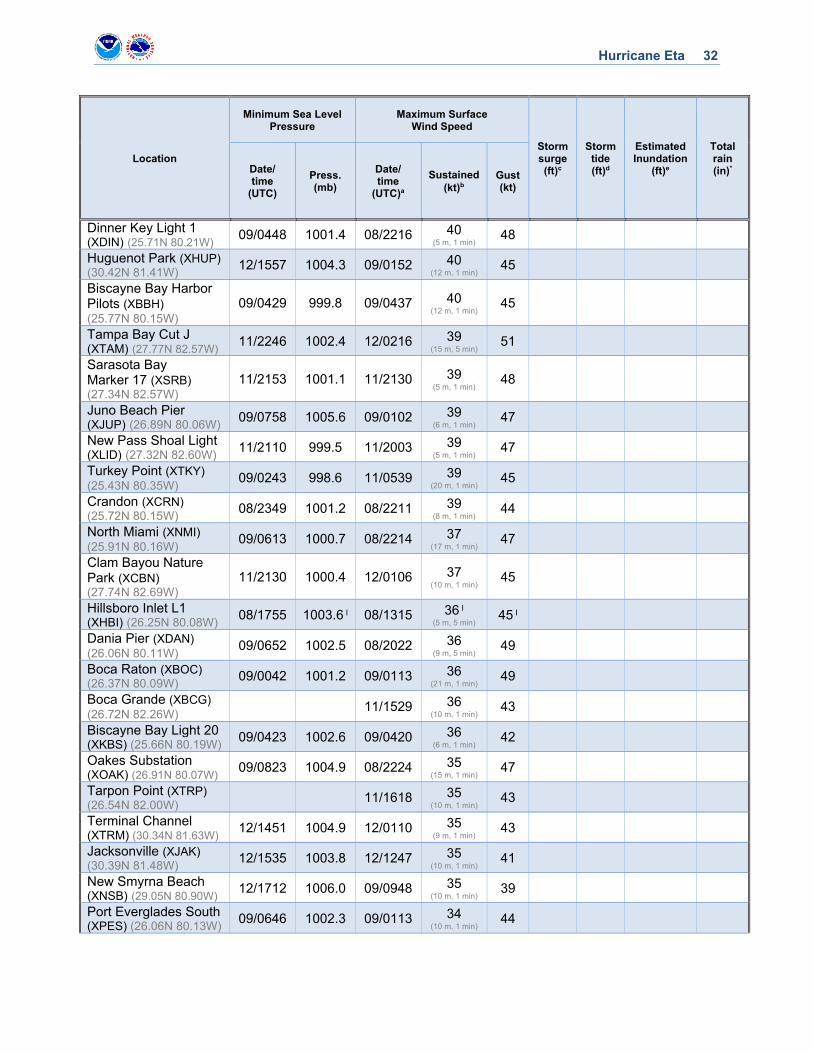
Hurricane Eta 32
Location
Minimum Sea Level Pressure
Maximum Surface Wind Speed
Storm surge (ft)c
Storm tide (ft)d
Estimated Inundation
(ft)e
Total rain (in)* Date/
time (UTC)
Press. (mb)
Date/ time
(UTC)a
Sustained (kt)b
Gust (kt)
Dinner Key Light 1 (XDIN) (25.71N 80.21W) 09/0448 1001.4 08/2216 40
(5 m, 1 min) 48
Huguenot Park (XHUP) (30.42N 81.41W) 12/1557 1004.3 09/0152 40
(12 m, 1 min) 45
Biscayne Bay Harbor Pilots (XBBH) (25.77N 80.15W)
09/0429 999.8 09/0437 40 (12 m, 1 min) 45
Tampa Bay Cut J (XTAM) (27.77N 82.57W) 11/2246 1002.4 12/0216 39
(15 m, 5 min) 51
Sarasota Bay Marker 17 (XSRB) (27.34N 82.57W)
11/2153 1001.1 11/2130 39 (5 m, 1 min) 48
Juno Beach Pier (XJUP) (26.89N 80.06W) 09/0758 1005.6 09/0102 39
(6 m, 1 min) 47
New Pass Shoal Light (XLID) (27.32N 82.60W) 11/2110 999.5 11/2003 39
(5 m, 1 min) 47
Turkey Point (XTKY) (25.43N 80.35W) 09/0243 998.6 11/0539 39
(20 m, 1 min) 45
Crandon (XCRN) (25.72N 80.15W) 08/2349 1001.2 08/2211 39
(8 m, 1 min) 44
North Miami (XNMI) (25.91N 80.16W) 09/0613 1000.7 08/2214 37
(17 m, 1 min) 47
Clam Bayou Nature Park (XCBN) (27.74N 82.69W)
11/2130 1000.4 12/0106 37 (10 m, 1 min) 45
Hillsboro Inlet L1 (XHBI) (26.25N 80.08W) 08/1755 1003.6 I 08/1315 36 I
(5 m, 5 min) 45 I
Dania Pier (XDAN) (26.06N 80.11W) 09/0652 1002.5 08/2022 36
(9 m, 5 min) 49
Boca Raton (XBOC) (26.37N 80.09W) 09/0042 1001.2 09/0113 36
(21 m, 1 min) 49
Boca Grande (XBCG) (26.72N 82.26W) 11/1529 36
(10 m, 1 min) 43
Biscayne Bay Light 20 (XKBS) (25.66N 80.19W) 09/0423 1002.6 09/0420 36
(6 m, 1 min) 42
Oakes Substation (XOAK) (26.91N 80.07W) 09/0823 1004.9 08/2224 35
(15 m, 1 min) 47
Tarpon Point (XTRP) (26.54N 82.00W) 11/1618 35
(10 m, 1 min) 43
Terminal Channel (XTRM) (30.34N 81.63W) 12/1451 1004.9 12/0110 35
(9 m, 1 min) 43
Jacksonville (XJAK) (30.39N 81.48W) 12/1535 1003.8 12/1247 35
(10 m, 1 min) 41
New Smyrna Beach (XNSB) (29.05N 80.90W) 12/1712 1006.0 09/0948 35
(10 m, 1 min) 39
Port Everglades South (XPES) (26.06N 80.13W) 09/0646 1002.3 09/0113 34
(10 m, 1 min) 44
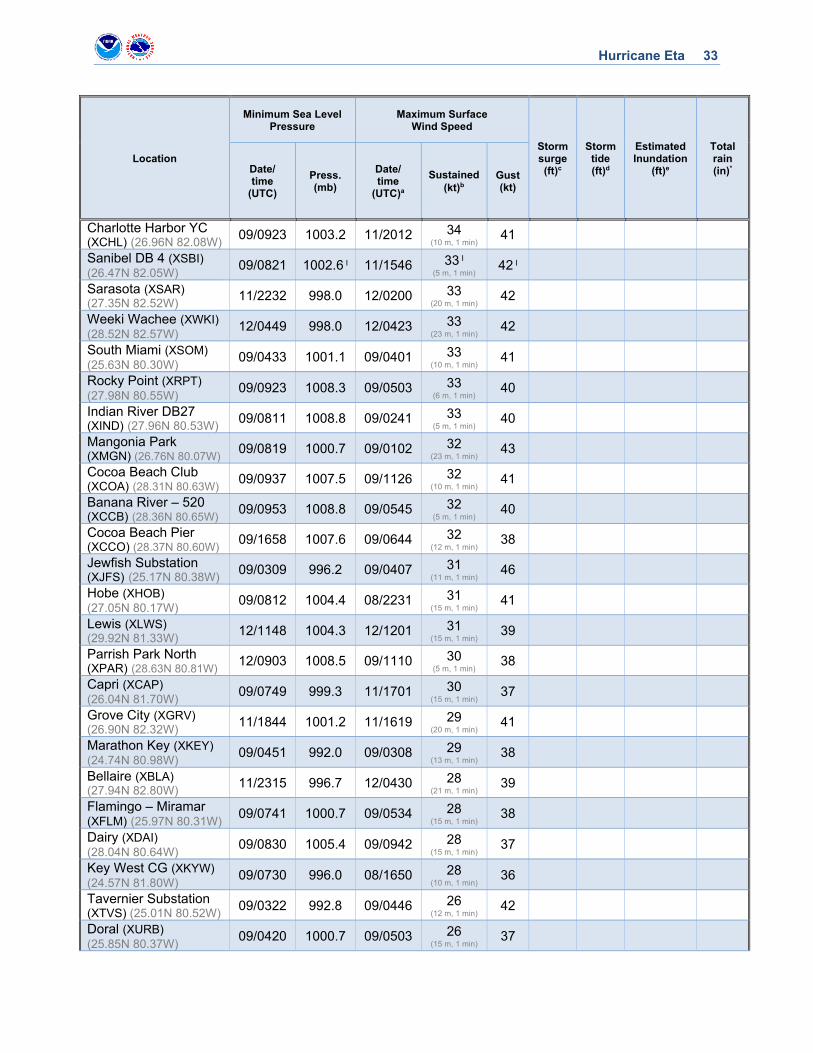
Hurricane Eta 33
Location
Minimum Sea Level Pressure
Maximum Surface Wind Speed
Storm surge (ft)c
Storm tide (ft)d
Estimated Inundation
(ft)e
Total rain (in)* Date/
time (UTC)
Press. (mb)
Date/ time
(UTC)a
Sustained (kt)b
Gust (kt)
Charlotte Harbor YC (XCHL) (26.96N 82.08W) 09/0923 1003.2 11/2012 34
(10 m, 1 min) 41
Sanibel DB 4 (XSBI) (26.47N 82.05W) 09/0821 1002.6 I 11/1546 33 I
(5 m, 1 min) 42 I
Sarasota (XSAR) (27.35N 82.52W) 11/2232 998.0 12/0200 33
(20 m, 1 min) 42
Weeki Wachee (XWKI) (28.52N 82.57W) 12/0449 998.0 12/0423 33
(23 m, 1 min) 42
South Miami (XSOM) (25.63N 80.30W) 09/0433 1001.1 09/0401 33
(10 m, 1 min) 41
Rocky Point (XRPT) (27.98N 80.55W) 09/0923 1008.3 09/0503 33
(6 m, 1 min) 40
Indian River DB27 (XIND) (27.96N 80.53W) 09/0811 1008.8 09/0241 33
(5 m, 1 min) 40
Mangonia Park (XMGN) (26.76N 80.07W) 09/0819 1000.7 09/0102 32
(23 m, 1 min) 43
Cocoa Beach Club (XCOA) (28.31N 80.63W) 09/0937 1007.5 09/1126 32
(10 m, 1 min) 41
Banana River – 520 (XCCB) (28.36N 80.65W) 09/0953 1008.8 09/0545 32
(5 m, 1 min) 40
Cocoa Beach Pier (XCCO) (28.37N 80.60W) 09/1658 1007.6 09/0644 32
(12 m, 1 min) 38
Jewfish Substation (XJFS) (25.17N 80.38W) 09/0309 996.2 09/0407 31
(11 m, 1 min) 46
Hobe (XHOB) (27.05N 80.17W) 09/0812 1004.4 08/2231 31
(15 m, 1 min) 41
Lewis (XLWS) (29.92N 81.33W) 12/1148 1004.3 12/1201 31
(15 m, 1 min) 39
Parrish Park North (XPAR) (28.63N 80.81W) 12/0903 1008.5 09/1110 30
(5 m, 1 min) 38
Capri (XCAP) (26.04N 81.70W) 09/0749 999.3 11/1701 30
(15 m, 1 min) 37
Grove City (XGRV) (26.90N 82.32W) 11/1844 1001.2 11/1619 29
(20 m, 1 min) 41
Marathon Key (XKEY) (24.74N 80.98W) 09/0451 992.0 09/0308 29
(13 m, 1 min) 38
Bellaire (XBLA) (27.94N 82.80W) 11/2315 996.7 12/0430 28
(21 m, 1 min) 39
Flamingo – Miramar (XFLM) (25.97N 80.31W) 09/0741 1000.7 09/0534 28
(15 m, 1 min) 38
Dairy (XDAI) (28.04N 80.64W) 09/0830 1005.4 09/0942 28
(15 m, 1 min) 37
Key West CG (XKYW) (24.57N 81.80W) 09/0730 996.0 08/1650 28
(10 m, 1 min) 36
Tavernier Substation (XTVS) (25.01N 80.52W) 09/0322 992.8 09/0446 26
(12 m, 1 min) 42
Doral (XURB) (25.85N 80.37W) 09/0420 1000.7 09/0503 26
(15 m, 1 min) 37
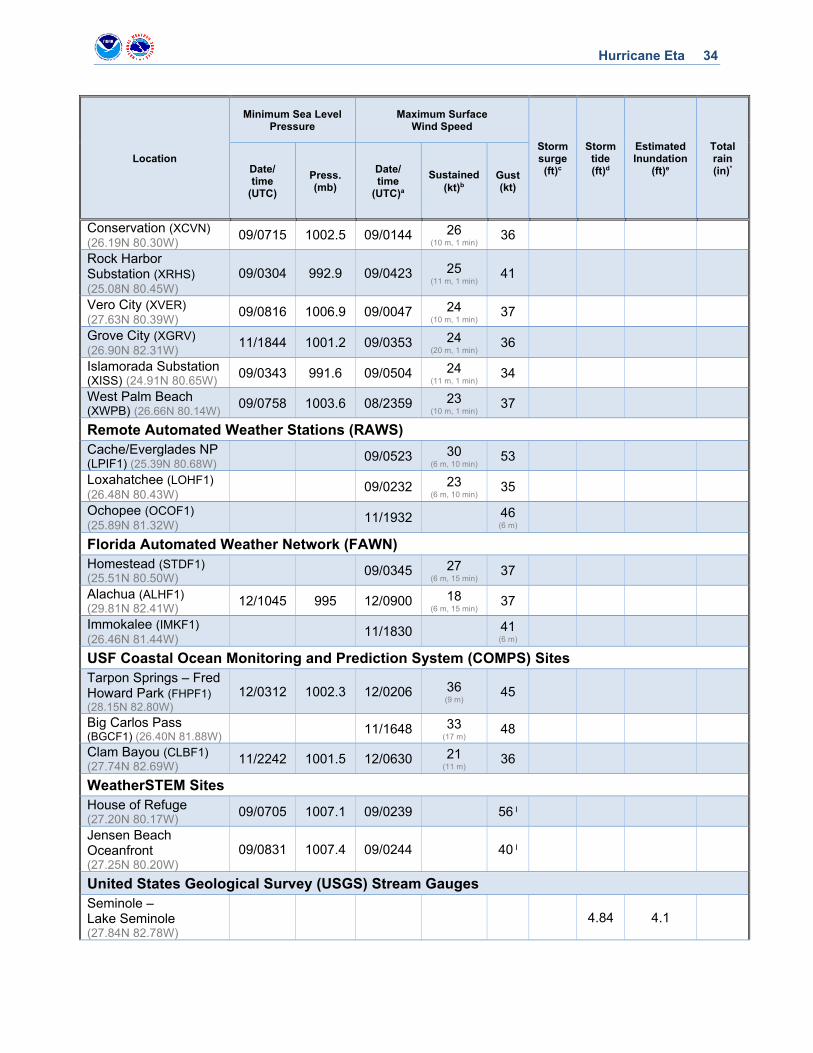
Hurricane Eta 34
Location
Minimum Sea Level Pressure
Maximum Surface Wind Speed
Storm surge (ft)c
Storm tide (ft)d
Estimated Inundation
(ft)e
Total rain (in)* Date/
time (UTC)
Press. (mb)
Date/ time
(UTC)a
Sustained (kt)b
Gust (kt)
Conservation (XCVN) (26.19N 80.30W) 09/0715 1002.5 09/0144 26
(10 m, 1 min) 36
Rock Harbor Substation (XRHS) (25.08N 80.45W)
09/0304 992.9 09/0423 25 (11 m, 1 min) 41
Vero City (XVER) (27.63N 80.39W) 09/0816 1006.9 09/0047 24
(10 m, 1 min) 37
Grove City (XGRV) (26.90N 82.31W) 11/1844 1001.2 09/0353 24
(20 m, 1 min) 36
Islamorada Substation (XISS) (24.91N 80.65W) 09/0343 991.6 09/0504 24
(11 m, 1 min) 34
West Palm Beach (XWPB) (26.66N 80.14W) 09/0758 1003.6 08/2359 23
(10 m, 1 min) 37
Remote Automated Weather Stations (RAWS) Cache/Everglades NP (LPIF1) (25.39N 80.68W) 09/0523 30
(6 m, 10 min) 53
Loxahatchee (LOHF1) (26.48N 80.43W) 09/0232 23
(6 m, 10 min) 35
Ochopee (OCOF1) (25.89N 81.32W) 11/1932 46
(6 m)
Florida Automated Weather Network (FAWN) Homestead (STDF1) (25.51N 80.50W) 09/0345 27
(6 m, 15 min) 37
Alachua (ALHF1) (29.81N 82.41W) 12/1045 995 12/0900 18
(6 m, 15 min) 37
Immokalee (IMKF1) (26.46N 81.44W) 11/1830 41
(6 m)
USF Coastal Ocean Monitoring and Prediction System (COMPS) Sites
Tarpon Springs – Fred Howard Park (FHPF1) (28.15N 82.80W)
12/0312 1002.3 12/0206 36 (9 m) 45
Big Carlos Pass (BGCF1) (26.40N 81.88W) 11/1648 33
(17 m) 48
Clam Bayou (CLBF1) (27.74N 82.69W) 11/2242 1001.5 12/0630 21
(11 m) 36
WeatherSTEM Sites
House of Refuge (27.20N 80.17W) 09/0705 1007.1 09/0239 56 I
Jensen Beach Oceanfront (27.25N 80.20W)
09/0831 1007.4 09/0244 40 I
United States Geological Survey (USGS) Stream Gauges
Seminole – Lake Seminole (27.84N 82.78W)
4.84 4.1
Hurricane Eta 35
Location
Minimum Sea Level Pressure
Maximum Surface Wind Speed
Storm surge (ft)c
Storm tide (ft)d
Estimated Inundation
(ft)e
Total rain (in)* Date/
time (UTC)
Press. (mb)
Date/ time
(UTC)a
Sustained (kt)b
Gust (kt)
Hillsborough River at Tampa (HPLF1) (27.94N 82.46W)
4.90 3.8
Alafia River at Gibsonton (GBSF1) (27.86N 82.38W)
4.67 3.7
Manatee Bay Creek near U.S. 1 (25.26N 80.42W)
3.07 3.7
Aucilla River at Nutall Rise (NUTF1) (30.11N 83.98W)
5.47 3.6
Peace River at Harbor Heights (26.99N 81.99W)
3.58 3.1
Venice Inlet (CNMF1) (27.11N 82.47W) 3.02 2.5
Loxahatchee River at Jupiter (26.95N 80.09W)
2.31 2.2
Spring Creek (SBIF1) (30.07N 84.33W) 3.44 1.8
Yankeetown (WCIF1) (29.00N 82.76W) 3.29 1.8
Homosassa River (28.77N 82.70W) 2.76 1.8
Suwannee River (SUWF1) (29.34N 83.09W) 3.33 1.7
Crystal River (SISF1) (28.93N 82.69W) 3.03 1.7
Chassahowitzka River (CHMF1) (28.69N 82.64W) 2.80 1.5
Everglades NP – Garfield Bight (ACNF1) (25.18N 80.79W)
1.27 1.5
Bayport (28.53N 82.65W) 2.77 1.4
Chatham River near Watson Place (CHTF1) (25.71N 81.25W)
1.87 1.3
Everglades NP – Lake Ingraham (25.14N 81.06W)
1.44 1.0
Everglades Depth Estimation Network (EDEN) Mud Creek at Alligator Bay (25.20N 80.58W)
1.20 2.1
Taylor River at Little Madeira Bay (25.19N 80.64W)
1.12 2.0

Hurricane Eta 36
Location
Minimum Sea Level Pressure
Maximum Surface Wind Speed
Storm surge (ft)c
Storm tide (ft)d
Estimated Inundation
(ft)e
Total rain (in)* Date/
time (UTC)
Press. (mb)
Date/ time
(UTC)a
Sustained (kt)b
Gust (kt)
Trout Creek at Trout Cove (25.21N 80.53W)
1.11 2.0
East Creek at Little Madeira Bay (25.20N 80.62W)
1.00 1.9
South Florida Water Management District (SFWMD) Gauges
St. Lucie River at Stuart (SLRF1) (27.20N 80.26W)
2.46 2.8
St. Lucie River at Steele Point (SPTF1) (27.20N 80.21W)
2.12 2.6
Plantation 7 W (WSTF1) (26.13N 80.37W) 12.31
El Portal (ELPF1) (25.85N 80.19W) 11.95
Carol City 2 NW (LLUF1) (25.97N 80.30W) 11.46
Davie 1 SE (DVIF1) (26.07N 80.21W) 11.20
Lauderdale Lakes 1 E (LDLF1) (26.17N 80.18W) 10.68
Miramar 10 W (NWDF1) (25.96N 80.43W) 10.54
Miami Springs 2 ESE (MINF1) (25.81N 80.26W) 10.50
Miami Lakes (MMLF1) (25.91N 80.32W) 10.45
Ft. Lauderdale 4 W (FTDF1) (26.14N 80.19W) 10.42
Sunrise (SNRF1) (26.16N 80.30W) 10.37
Plantation 2 SE (PLAF1) (26.09N 80.23W) 10.14
Coral Springs 3 SW (CSGF1) (26.23N 80.30W) 8.99
Boca Raton 12 W (WBCF1) (26.36N 80.30W) 8.73
Leisure City 2 WNW (LSCF1) (25.50N 80.47W) 8.67
North Miami Beach (NOMF1) (25.93N 80.15W) 8.50
St. Johns River Water Management District Gauges
Haulover Canal at Mims (28.74N 80.76W)
1.18 1.8
Indian River at Wabasso (IRWF1) (27.75N 80.43W)
1.00 1.7
Hurricane Eta 37
Location
Minimum Sea Level Pressure
Maximum Surface Wind Speed
Storm surge (ft)c
Storm tide (ft)d
Estimated Inundation
(ft)e
Total rain (in)* Date/
time (UTC)
Press. (mb)
Date/ time
(UTC)a
Sustained (kt)b
Gust (kt)
Suwannee River Water Management District Gauges
Steinhatchee (STIF1) (29.67N 83.38W) 1.5
Everglades National Park Water Quality Stations
Thursday Point (THRF1) (25.20N 80.37W) 2.00 2.6
Blackwater Sound (BWSF1) (25.18N 80.44W) 1.91I
Long Sound (LSNF1) (25.24N 80.46W) 1.32
NWS Cooperative Observer Program (COOP) Sites
Ft. Lauderdale (FTLF1) (26.10N 80.20W) 14.04
N Miami Beach #2 (NMBF1) (25.95N 80.22W) 11.96
Ft. Lauderdale Beach (FLBF1) (26.14N 80.11W) 11.05
Homestead 5 WNW (HAPF1) (25.50N 80.55W) 10.74
Hydrometeorological Automated Data System (HADS) Sites
Site 63 near Andytown (ADYF1) (26.18N 80.53W) 15.83
North Archie Creek near Tampa (NACF1) (27.90N 82.35W)
9.47
Delaney Creek near Tampa (DLNF1) (27.93N 82.36W)
9.37
Little Manatee River near Wimauma (WIMF1) (27.67N 82.35W)
8.52
Citizen Weather Observing Program (CWOP) Islamorada Fire Station 20 (DW1872) (24.92N 80.64W)
09/0545 21 (15 m) 38
Marathon – Stirrup Key (FW8363) (24.74N 81.04W)
08/1620 29 37
Cudjoe Key (CW0925) (24.65N 81.48W) 09/0333 27
(16 m) 37
Public/Other
Islamorada/Theiss 09/0345 991.5
Indian River Shores – S Camelia Court (27.69N 80.37W)
09/0822 1010.6 09/0051 36 (2 m) 51
Hurricane Eta 38
Location
Minimum Sea Level Pressure
Maximum Surface Wind Speed
Storm surge (ft)c
Storm tide (ft)d
Estimated Inundation
(ft)e
Total rain (in)* Date/
time (UTC)
Press. (mb)
Date/ time
(UTC)a
Sustained (kt)b
Gust (kt)
Rock Harbor – N Jade Drive (25.06N 80.48W)
09/0238 36 50
Sailfish Point – Martin County (27.18N 80.17W)
09/0815 1005.4 09/0730 34 49
USAF Tower 19 (KSC0019) (28.74N 80.70W)
09/1410 32 I (16 m, 5 min) 45 I
Sebastian Inlet (SIPF1) (27.86N 80.44W) 09/0906 1007.6 09/0526 30
(11 m) 44
Lake Okeechobee Center (LZ40) (26.90N 80.79W)
09/0145 30 (6 m, 15 min) 36
Plantation Key – Stromboli Dr (24.96N 80.59W)
09/0402 994.7 09/0501 30 43
Lake Okeechobee South End (L006) (26.82N 80.78W)
09/0245 29 (6 m, 15 min) 36
Lake Okeechobee North End (L001) (27.13N 80.79W)
09/0345 27 (6 m, 15 min) 36
North Key Largo – Ocean Reef (25.33N 80.26W)
09/0220 1001.9 09/0450 27 39
Marathon – Grouper Dr (24.73N 81.06W)
09/0446 993.9 08/2348 27 37
Key Largo – Rock Harbor (25.08N 80.46W)
09/0323 998.1 09/0151 24 36
Plantation Key – S Coconut Palm Blvd (25.00N 80.54W)
09/0326 994.4 09/0506 24 45
Marathon/Stirrup Point (24.74N 81.04W) 2.3E
Pembroke Pines 1 W (26.01N 80.36W) 20.74
Miramar 3 WNW (25.99N 80.39W) 18.10
U.S. Hwy 27/Sheridan Intersection 3 ENE (26.03N 80.39W)
17.86
Community Collaborative Rain, Hail, & Snow Network (CoCoRaHS) Sites Miramar 2.1 W (FL-BW-103) (25.97N 80.37W)
17.20
Miramar 2.3 W (FL-BW-131) (25.98N 80.37W)
16.79

Hurricane Eta 39
Location
Minimum Sea Level Pressure
Maximum Surface Wind Speed
Storm surge (ft)c
Storm tide (ft)d
Estimated Inundation
(ft)e
Total rain (in)* Date/
time (UTC)
Press. (mb)
Date/ time
(UTC)a
Sustained (kt)b
Gust (kt)
Miramar 3.0 WNW (FL-BW-13) (25.99N 80.38W)
16.68
Pembroke Pines 1.0 ENE (FL-BW-4) (26.01N 80.33W)
16.26
Weston 2.8 SE (FL-BW-99) (26.07N 80.37W)
16.00
Biscayne Park 0.3 E (FL-MD-33) (25.88N 80.18W)
14.12
North Miami 0.8 SE (FL-MD-104) (25.89N 80.16W)
13.40
Davie 2.6 WSW (FL-BW-67) (26.06N 80.33W)
13.20
Plantation 3.4 E (FL-BW-76) (26.11N 80.21W)
12.11
Sunrise 0.4 NNE (FL-BW-151) (26.16N 80.30W)
11.83
Plantation 1.2 SSW (FL-BW-106) (26.11N 80.27W)
11.51
Plantation 1.3 WNW (FL-BW-150) (26.13N 80.28W)
11.16
Homestead 3.0 NW (FL-MD-69) (25.49N 80.49W)
11.05
Cooper City 1.3 NE (FL-BW-155) (26.06N 80.28W)
10.96
Plantation 2.3 WNW (FL-BW-116) (26.14N 80.30W)
10.92
Pompano Beach 1.2 NNE (FL-BW-137) (26.25N 80.12W)
10.86
Sun City Center 1.0 NE (FL-HB-17) (27.73N 82.34W)
10.64
Miami 5.7 N (FL-MD-79) (25.84N 80.18W) 10.48

Hurricane Eta 40
Location
Minimum Sea Level Pressure
Maximum Surface Wind Speed
Storm surge (ft)c
Storm tide (ft)d
Estimated Inundation
(ft)e
Total rain (in)* Date/
time (UTC)
Press. (mb)
Date/ time
(UTC)a
Sustained (kt)b
Gust (kt)
Key Largo 6.2 NE (FL-MN-25) (25.17N 80.37W)
9.94
Sun City Center 1.8 NNE (FL-HB-134) (27.74N 82.34W)
9.89
Coral Gables 4.1 NNW (FL-MD-95) (25.76N 80.28W)
9.85
South Miami 0.9 SSE (FL-MD-42) (25.70N 80.29W)
9.68
Apollo Beach 2.7 ENE (FL-HB-130) (27.78N 82.36W)
9.61
Margate 0.4 W (FL-BW-79) (26.24N 80.22W)
9.49
Riverview 2.1 NNW (FL-HB-150) (27.90N 82.32W)
9.47
Deerfield Beach 2.5 ESE (FL-BW-26) (26.30N 80.08W)
9.43
Pompano Beach 3.1 NE (FL-BW-121) (26.27N 80.10W)
9.42
Miami Lakes 0.3 NNW (FL-MD-26) (25.91N 80.32W)
9.38
South Miami 0.5 N (FL-MD-30) (25.72N 80.30W)
9.35
Sun City Center 1.1 N (FL-HB-153) (27.74N 82.35W)
9.30
Sun City Center 0.9 S (FL-HB-139) (27.71N 82.35W)
9.19
Sunrise 2.1 N (FL-BW-139) (26.18N 80.30W)
9.12
St. Petersburg 1.6 WNW (FL-PN-74) (27.77N 82.67W)
9.11
Sun City Center 0.9 SSE (FL-HB-107) (27.71N 82.35W)
9.05
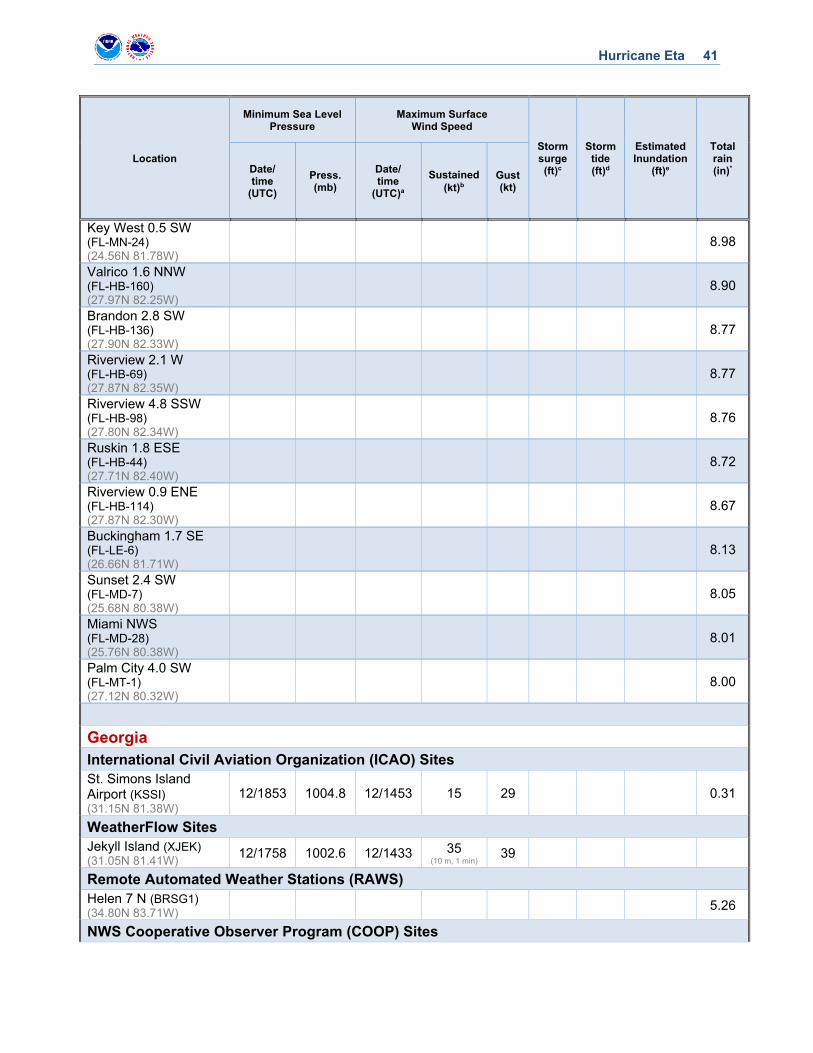
Hurricane Eta 41
Location
Minimum Sea Level Pressure
Maximum Surface Wind Speed
Storm surge (ft)c
Storm tide (ft)d
Estimated Inundation
(ft)e
Total rain (in)* Date/
time (UTC)
Press. (mb)
Date/ time
(UTC)a
Sustained (kt)b
Gust (kt)
Key West 0.5 SW (FL-MN-24) (24.56N 81.78W)
8.98
Valrico 1.6 NNW (FL-HB-160) (27.97N 82.25W)
8.90
Brandon 2.8 SW (FL-HB-136) (27.90N 82.33W)
8.77
Riverview 2.1 W (FL-HB-69) (27.87N 82.35W)
8.77
Riverview 4.8 SSW (FL-HB-98) (27.80N 82.34W)
8.76
Ruskin 1.8 ESE (FL-HB-44) (27.71N 82.40W)
8.72
Riverview 0.9 ENE (FL-HB-114) (27.87N 82.30W)
8.67
Buckingham 1.7 SE (FL-LE-6) (26.66N 81.71W)
8.13
Sunset 2.4 SW (FL-MD-7) (25.68N 80.38W)
8.05
Miami NWS (FL-MD-28) (25.76N 80.38W)
8.01
Palm City 4.0 SW (FL-MT-1) (27.12N 80.32W)
8.00
Georgia
International Civil Aviation Organization (ICAO) Sites
St. Simons Island Airport (KSSI) (31.15N 81.38W)
12/1853 1004.8 12/1453 15 29 0.31
WeatherFlow Sites
Jekyll Island (XJEK) (31.05N 81.41W) 12/1758 1002.6 12/1433 35
(10 m, 1 min) 39
Remote Automated Weather Stations (RAWS) Helen 7 N (BRSG1) (34.80N 83.71W) 5.26
NWS Cooperative Observer Program (COOP) Sites
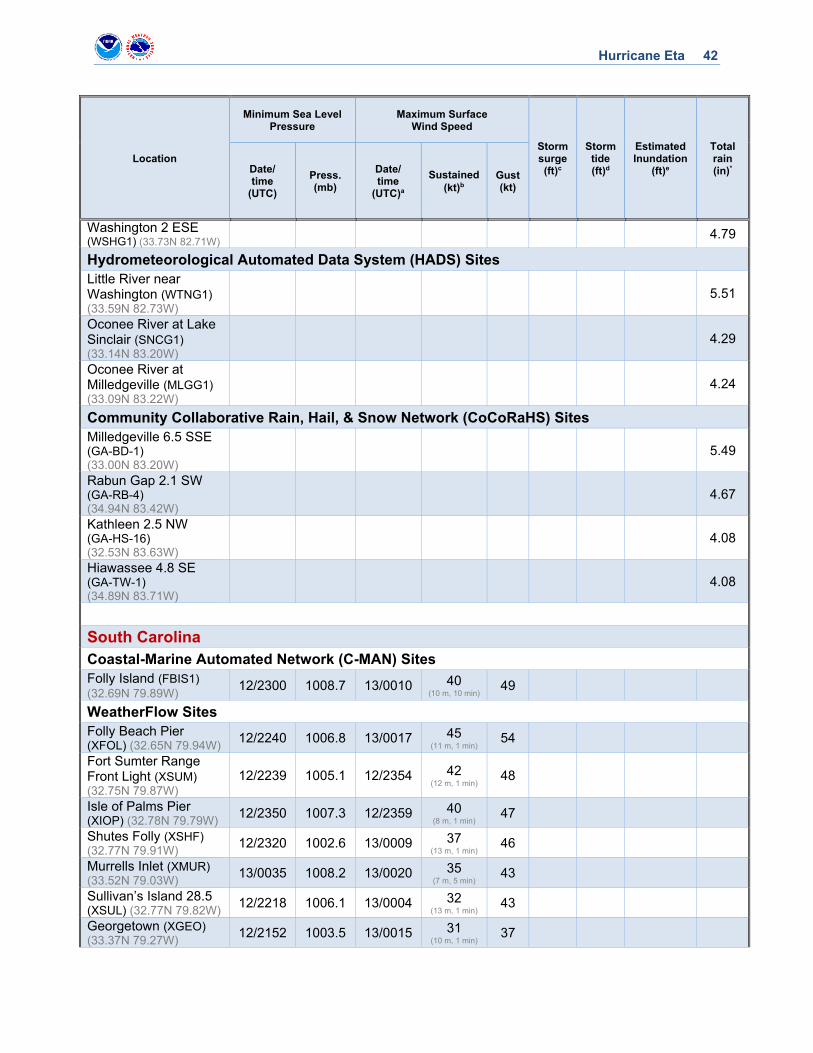
Hurricane Eta 42
Location
Minimum Sea Level Pressure
Maximum Surface Wind Speed
Storm surge (ft)c
Storm tide (ft)d
Estimated Inundation
(ft)e
Total rain (in)* Date/
time (UTC)
Press. (mb)
Date/ time
(UTC)a
Sustained (kt)b
Gust (kt)
Washington 2 ESE (WSHG1) (33.73N 82.71W) 4.79
Hydrometeorological Automated Data System (HADS) Sites
Little River near Washington (WTNG1) (33.59N 82.73W)
5.51
Oconee River at Lake Sinclair (SNCG1) (33.14N 83.20W)
4.29
Oconee River at Milledgeville (MLGG1) (33.09N 83.22W)
4.24
Community Collaborative Rain, Hail, & Snow Network (CoCoRaHS) Sites
Milledgeville 6.5 SSE (GA-BD-1) (33.00N 83.20W)
5.49
Rabun Gap 2.1 SW (GA-RB-4) (34.94N 83.42W)
4.67
Kathleen 2.5 NW (GA-HS-16) (32.53N 83.63W)
4.08
Hiawassee 4.8 SE (GA-TW-1) (34.89N 83.71W)
4.08
South Carolina
Coastal-Marine Automated Network (C-MAN) Sites
Folly Island (FBIS1) (32.69N 79.89W) 12/2300 1008.7 13/0010 40
(10 m, 10 min) 49
WeatherFlow Sites
Folly Beach Pier (XFOL) (32.65N 79.94W) 12/2240 1006.8 13/0017 45
(11 m, 1 min) 54
Fort Sumter Range Front Light (XSUM) (32.75N 79.87W)
12/2239 1005.1 12/2354 42 (12 m, 1 min) 48
Isle of Palms Pier (XIOP) (32.78N 79.79W) 12/2350 1007.3 12/2359 40
(8 m, 1 min) 47
Shutes Folly (XSHF) (32.77N 79.91W) 12/2320 1002.6 13/0009 37
(13 m, 1 min) 46
Murrells Inlet (XMUR) (33.52N 79.03W) 13/0035 1008.2 13/0020 35
(7 m, 5 min) 43
Sullivan’s Island 28.5 (XSUL) (32.77N 79.82W) 12/2218 1006.1 13/0004 32
(13 m, 1 min) 43
Georgetown (XGEO) (33.37N 79.27W) 12/2152 1003.5 13/0015 31
(10 m, 1 min) 37
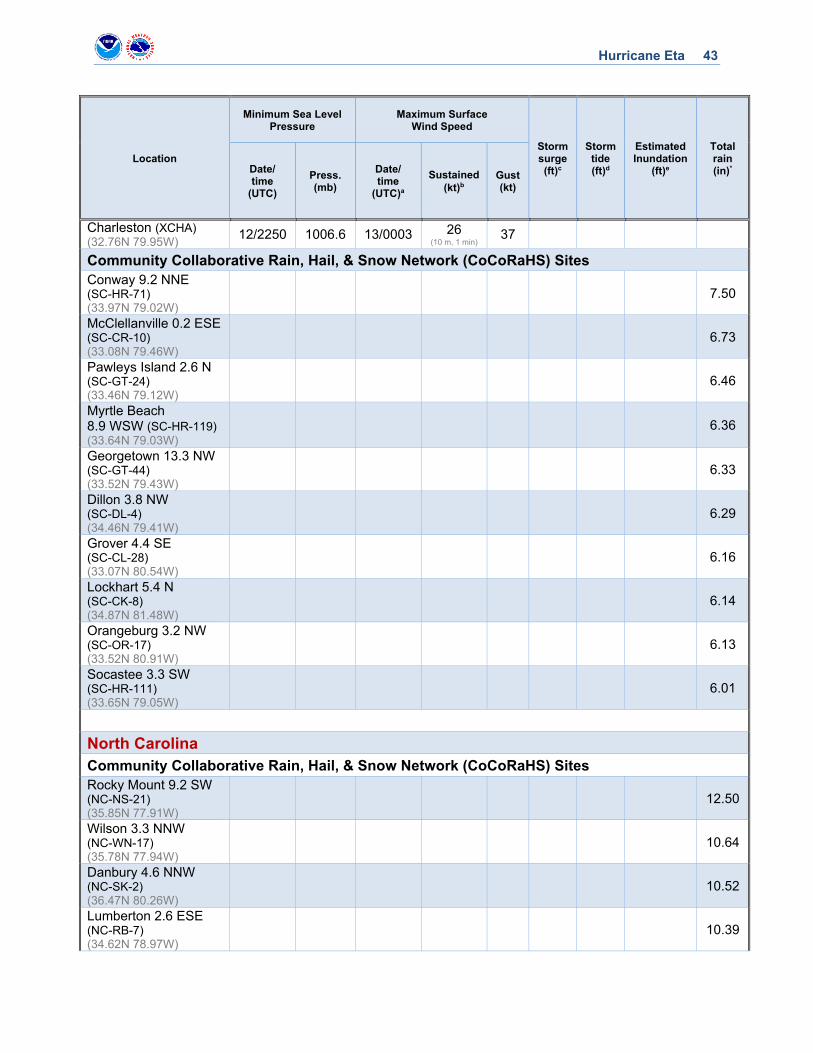
Hurricane Eta 43
Location
Minimum Sea Level Pressure
Maximum Surface Wind Speed
Storm surge (ft)c
Storm tide (ft)d
Estimated Inundation
(ft)e
Total rain (in)* Date/
time (UTC)
Press. (mb)
Date/ time
(UTC)a
Sustained (kt)b
Gust (kt)
Charleston (XCHA) (32.76N 79.95W) 12/2250 1006.6 13/0003 26
(10 m, 1 min) 37
Community Collaborative Rain, Hail, & Snow Network (CoCoRaHS) Sites
Conway 9.2 NNE (SC-HR-71) (33.97N 79.02W)
7.50
McClellanville 0.2 ESE (SC-CR-10) (33.08N 79.46W)
6.73
Pawleys Island 2.6 N (SC-GT-24) (33.46N 79.12W)
6.46
Myrtle Beach 8.9 WSW (SC-HR-119) (33.64N 79.03W)
6.36
Georgetown 13.3 NW (SC-GT-44) (33.52N 79.43W)
6.33
Dillon 3.8 NW (SC-DL-4) (34.46N 79.41W)
6.29
Grover 4.4 SE (SC-CL-28) (33.07N 80.54W)
6.16
Lockhart 5.4 N (SC-CK-8) (34.87N 81.48W)
6.14
Orangeburg 3.2 NW (SC-OR-17) (33.52N 80.91W)
6.13
Socastee 3.3 SW (SC-HR-111) (33.65N 79.05W)
6.01
North Carolina
Community Collaborative Rain, Hail, & Snow Network (CoCoRaHS) Sites
Rocky Mount 9.2 SW (NC-NS-21) (35.85N 77.91W)
12.50
Wilson 3.3 NNW (NC-WN-17) (35.78N 77.94W)
10.64
Danbury 4.6 NNW (NC-SK-2) (36.47N 80.26W)
10.52
Lumberton 2.6 ESE (NC-RB-7) (34.62N 78.97W)
10.39
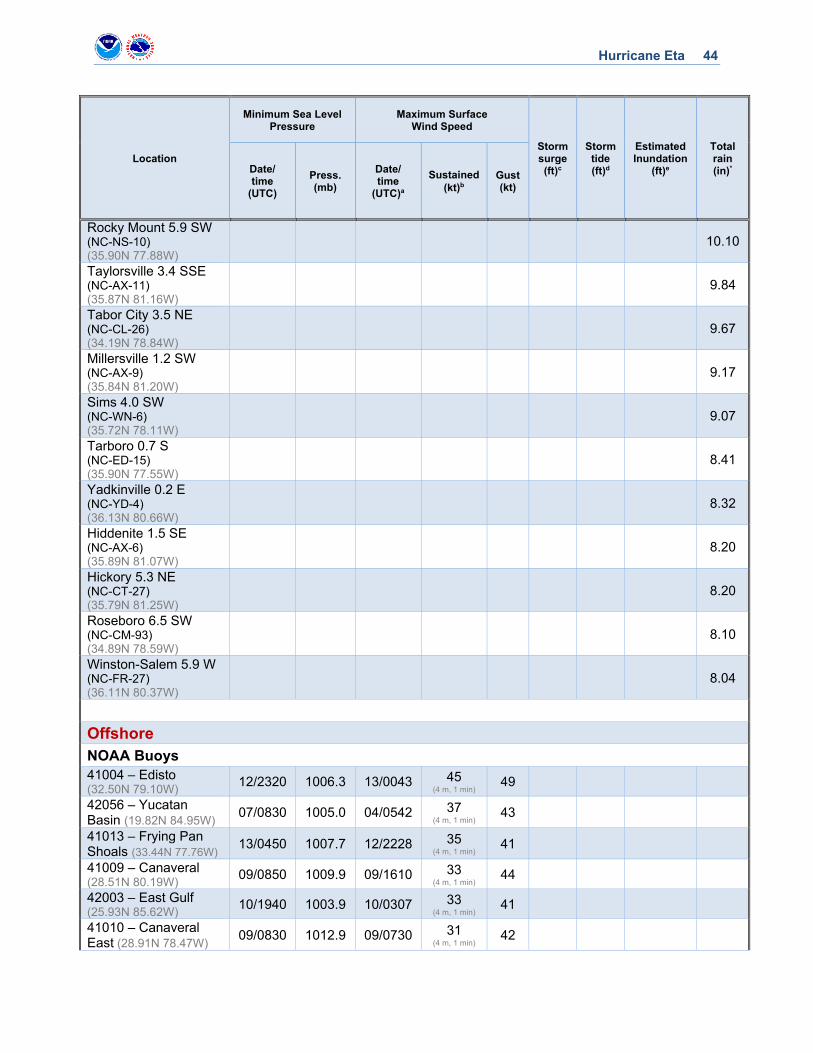
Hurricane Eta 44
Location
Minimum Sea Level Pressure
Maximum Surface Wind Speed
Storm surge (ft)c
Storm tide (ft)d
Estimated Inundation
(ft)e
Total rain (in)* Date/
time (UTC)
Press. (mb)
Date/ time
(UTC)a
Sustained (kt)b
Gust (kt)
Rocky Mount 5.9 SW (NC-NS-10) (35.90N 77.88W)
10.10
Taylorsville 3.4 SSE (NC-AX-11) (35.87N 81.16W)
9.84
Tabor City 3.5 NE (NC-CL-26) (34.19N 78.84W)
9.67
Millersville 1.2 SW (NC-AX-9) (35.84N 81.20W)
9.17
Sims 4.0 SW (NC-WN-6) (35.72N 78.11W)
9.07
Tarboro 0.7 S (NC-ED-15) (35.90N 77.55W)
8.41
Yadkinville 0.2 E (NC-YD-4) (36.13N 80.66W)
8.32
Hiddenite 1.5 SE (NC-AX-6) (35.89N 81.07W)
8.20
Hickory 5.3 NE (NC-CT-27) (35.79N 81.25W)
8.20
Roseboro 6.5 SW (NC-CM-93) (34.89N 78.59W)
8.10
Winston-Salem 5.9 W (NC-FR-27) (36.11N 80.37W)
8.04
Offshore
NOAA Buoys
41004 – Edisto (32.50N 79.10W) 12/2320 1006.3 13/0043 45
(4 m, 1 min) 49
42056 – Yucatan Basin (19.82N 84.95W)
07/0830 1005.0 04/0542 37 (4 m, 1 min) 43
41013 – Frying Pan Shoals (33.44N 77.76W)
13/0450 1007.7 12/2228 35 (4 m, 1 min) 41
41009 – Canaveral (28.51N 80.19W) 09/0850 1009.9 09/1610 33
(4 m, 1 min) 44
42003 – East Gulf (25.93N 85.62W) 10/1940 1003.9 10/0307 33
(4 m, 1 min) 41
41010 – Canaveral East (28.91N 78.47W)
09/0830 1012.9 09/0730 31 (4 m, 1 min) 42

Hurricane Eta 45
Location
Minimum Sea Level Pressure
Maximum Surface Wind Speed
Storm surge (ft)c
Storm tide (ft)d
Estimated Inundation
(ft)e
Total rain (in)* Date/
time (UTC)
Press. (mb)
Date/ time
(UTC)a
Sustained (kt)b
Gust (kt)
41008 – Grays Reef (31.40N 80.87W) 12/1950 1004.4 12/1646 29
(5 m, 1 min) 33
42036 – West Tampa (28.50N 84.52W) 11/2250 1004.5 11/1732 25
(4 m, 1 min) 29
USF Coastal Ocean Monitoring and Prediction System (COMPS) Buoys
42023 – C13 South Buoy (26.01N 83.09W)
11/1130 1000.6 11/1000 44 (3 m) 57
42026 – C22 Loop Current (25.17N 83.48W)
11/0930 993.4 11/0930 43 (3 m) 56
42013 – C10 Central Buoy (27.17N 82.92W)
11/2030 999.6 12/0100 37 (3 m) 51
42022 – C12 Central Buoy (27.51N 83.74W)
11/2200 992.8 11/1330 28 (3 m) 38
UNCW Coastal Ocean Research and Monitoring Program (CORMP) Buoys
41029 – Capers Nearshore (32.80N 79.62W)
12/2308 1008.6 13/0008 34 (3 m) 48
41033 – Fripp Nearshore (32.28N 80.41W)
12/2208 1006.7 13/0108 26 (3 m) 39
a Date/time is for sustained wind when both sustained and gust are listed. b Except as noted, sustained wind averaging periods for C-MAN and land-based reports are 2 min; buoy averaging
periods are 8 min. c Storm surge is water height above normal astronomical tide level. d Storm tide is water height above the North American Vertical Datum of 1988 (NAVD88). e Estimated inundation is the maximum height of water above ground. For NOS tide gauges and USGS water level
sensors, the height of the water above Mean Higher High Water (MHHW) is used as a proxy for inundation. Values marked with two asterisks (**) are from non-tidal stations, and the water level is referenced above Mean Sea Level (MSL).
E Estimated I Incomplete * International rainfall totals cover the following periods:
Belize: 1 to 6 November 2020, Cayman Islands: 3 to 7 November 2020, Costa Rica: 1 to 6 November 2020, El Salvador: 3 to 11 November 2020, Jamaica: 1 to 8 November 2020, Guatemala: 2 to 8 November 2020, Honduras: 1 to 7 November 2020, Mexico: 3 to 7 November 2020, Nicaragua: 1 to 5 November 2020
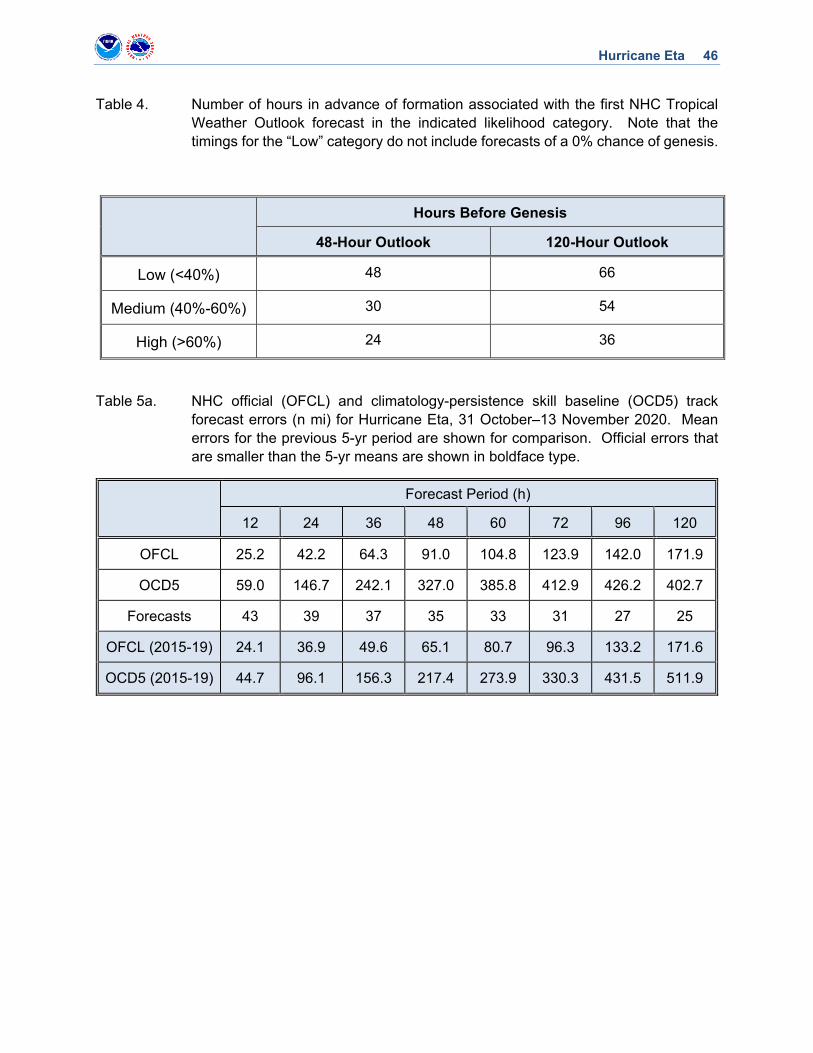
Hurricane Eta 46
Table 4. Number of hours in advance of formation associated with the first NHC Tropical Weather Outlook forecast in the indicated likelihood category. Note that the timings for the “Low” category do not include forecasts of a 0% chance of genesis.
Hours Before Genesis
48-Hour Outlook 120-Hour Outlook
Low (<40%) 48 66
Medium (40%-60%) 30 54
High (>60%) 24 36
Table 5a. NHC official (OFCL) and climatology-persistence skill baseline (OCD5) track forecast errors (n mi) for Hurricane Eta, 31 October–13 November 2020. Mean errors for the previous 5-yr period are shown for comparison. Official errors that are smaller than the 5-yr means are shown in boldface type.
Forecast Period (h)
12 24 36 48 60 72 96 120
OFCL 25.2 42.2 64.3 91.0 104.8 123.9 142.0 171.9
OCD5 59.0 146.7 242.1 327.0 385.8 412.9 426.2 402.7
Forecasts 43 39 37 35 33 31 27 25
OFCL (2015-19) 24.1 36.9 49.6 65.1 80.7 96.3 133.2 171.6
OCD5 (2015-19) 44.7 96.1 156.3 217.4 273.9 330.3 431.5 511.9
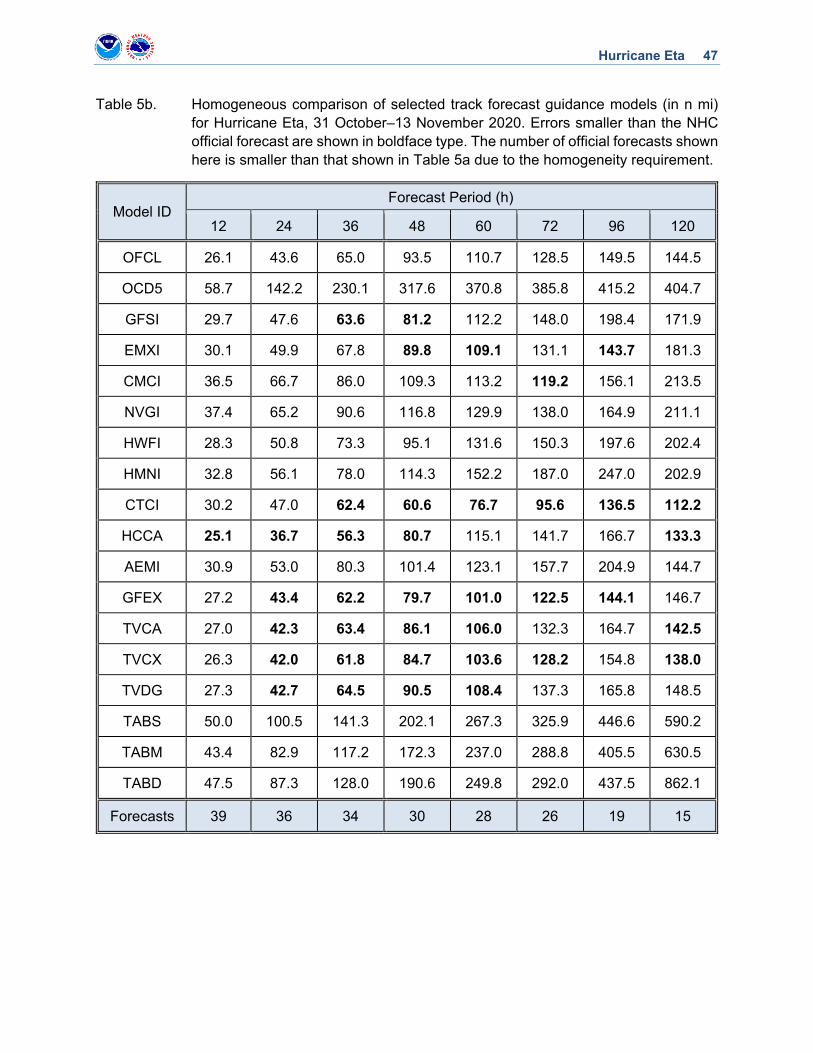
Hurricane Eta 47
Table 5b. Homogeneous comparison of selected track forecast guidance models (in n mi) for Hurricane Eta, 31 October–13 November 2020. Errors smaller than the NHC official forecast are shown in boldface type. The number of official forecasts shown here is smaller than that shown in Table 5a due to the homogeneity requirement.
Model ID Forecast Period (h)
12 24 36 48 60 72 96 120
OFCL 26.1 43.6 65.0 93.5 110.7 128.5 149.5 144.5
OCD5 58.7 142.2 230.1 317.6 370.8 385.8 415.2 404.7
GFSI 29.7 47.6 63.6 81.2 112.2 148.0 198.4 171.9
EMXI 30.1 49.9 67.8 89.8 109.1 131.1 143.7 181.3
CMCI 36.5 66.7 86.0 109.3 113.2 119.2 156.1 213.5
NVGI 37.4 65.2 90.6 116.8 129.9 138.0 164.9 211.1
HWFI 28.3 50.8 73.3 95.1 131.6 150.3 197.6 202.4
HMNI 32.8 56.1 78.0 114.3 152.2 187.0 247.0 202.9
CTCI 30.2 47.0 62.4 60.6 76.7 95.6 136.5 112.2
HCCA 25.1 36.7 56.3 80.7 115.1 141.7 166.7 133.3
AEMI 30.9 53.0 80.3 101.4 123.1 157.7 204.9 144.7
GFEX 27.2 43.4 62.2 79.7 101.0 122.5 144.1 146.7
TVCA 27.0 42.3 63.4 86.1 106.0 132.3 164.7 142.5
TVCX 26.3 42.0 61.8 84.7 103.6 128.2 154.8 138.0
TVDG 27.3 42.7 64.5 90.5 108.4 137.3 165.8 148.5
TABS 50.0 100.5 141.3 202.1 267.3 325.9 446.6 590.2
TABM 43.4 82.9 117.2 172.3 237.0 288.8 405.5 630.5
TABD 47.5 87.3 128.0 190.6 249.8 292.0 437.5 862.1
Forecasts 39 36 34 30 28 26 19 15
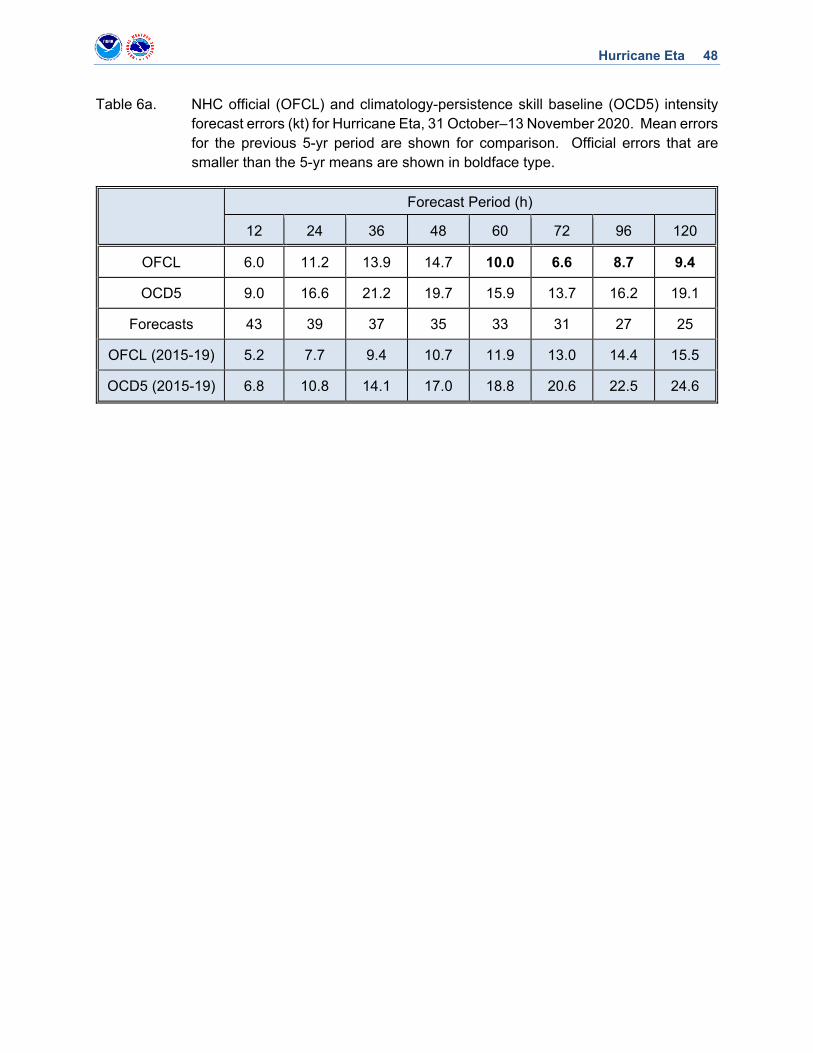
Hurricane Eta 48
Table 6a. NHC official (OFCL) and climatology-persistence skill baseline (OCD5) intensity forecast errors (kt) for Hurricane Eta, 31 October–13 November 2020. Mean errors for the previous 5-yr period are shown for comparison. Official errors that are smaller than the 5-yr means are shown in boldface type.
Forecast Period (h)
12 24 36 48 60 72 96 120
OFCL 6.0 11.2 13.9 14.7 10.0 6.6 8.7 9.4
OCD5 9.0 16.6 21.2 19.7 15.9 13.7 16.2 19.1
Forecasts 43 39 37 35 33 31 27 25
OFCL (2015-19) 5.2 7.7 9.4 10.7 11.9 13.0 14.4 15.5
OCD5 (2015-19) 6.8 10.8 14.1 17.0 18.8 20.6 22.5 24.6
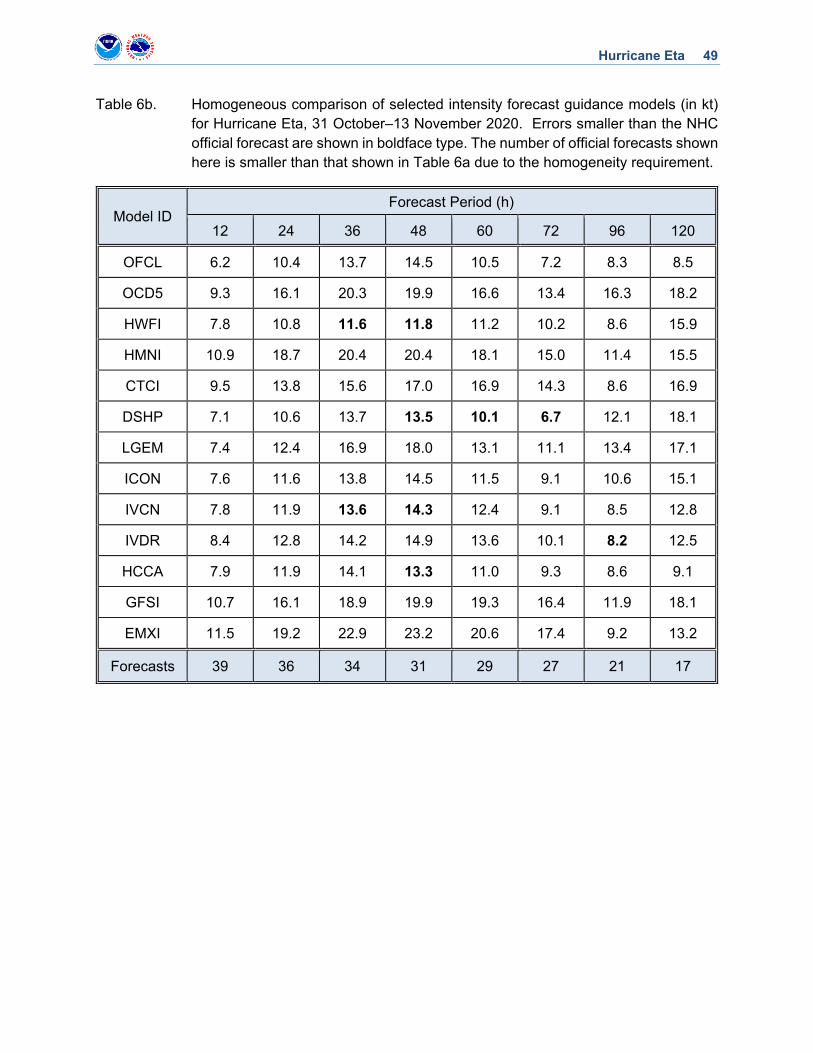
Hurricane Eta 49
Table 6b. Homogeneous comparison of selected intensity forecast guidance models (in kt) for Hurricane Eta, 31 October–13 November 2020. Errors smaller than the NHC official forecast are shown in boldface type. The number of official forecasts shown here is smaller than that shown in Table 6a due to the homogeneity requirement.
Model ID Forecast Period (h)
12 24 36 48 60 72 96 120
OFCL 6.2 10.4 13.7 14.5 10.5 7.2 8.3 8.5
OCD5 9.3 16.1 20.3 19.9 16.6 13.4 16.3 18.2
HWFI 7.8 10.8 11.6 11.8 11.2 10.2 8.6 15.9
HMNI 10.9 18.7 20.4 20.4 18.1 15.0 11.4 15.5
CTCI 9.5 13.8 15.6 17.0 16.9 14.3 8.6 16.9
DSHP 7.1 10.6 13.7 13.5 10.1 6.7 12.1 18.1
LGEM 7.4 12.4 16.9 18.0 13.1 11.1 13.4 17.1
ICON 7.6 11.6 13.8 14.5 11.5 9.1 10.6 15.1
IVCN 7.8 11.9 13.6 14.3 12.4 9.1 8.5 12.8
IVDR 8.4 12.8 14.2 14.9 13.6 10.1 8.2 12.5
HCCA 7.9 11.9 14.1 13.3 11.0 9.3 8.6 9.1
GFSI 10.7 16.1 18.9 19.9 19.3 16.4 11.9 18.1
EMXI 11.5 19.2 22.9 23.2 20.6 17.4 9.2 13.2
Forecasts 39 36 34 31 29 27 21 17
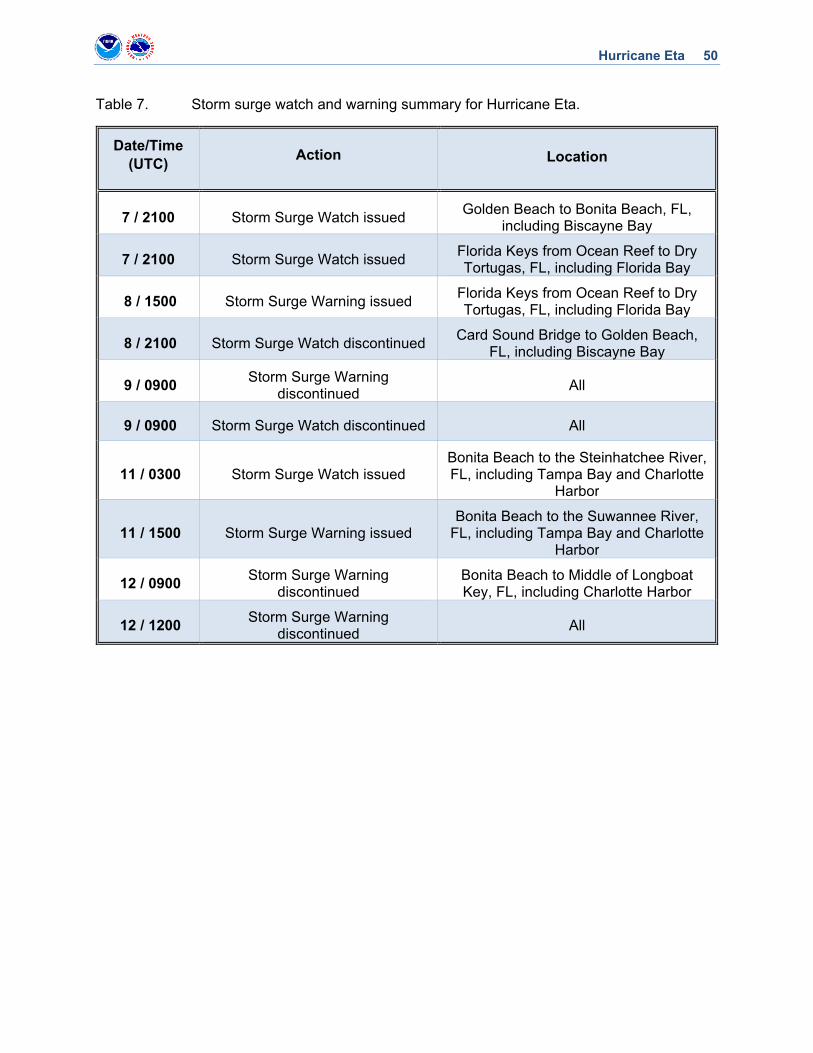
Hurricane Eta 50
Table 7. Storm surge watch and warning summary for Hurricane Eta.
Date/Time (UTC)
Action Location
7 / 2100 Storm Surge Watch issued Golden Beach to Bonita Beach, FL,
including Biscayne Bay
7 / 2100 Storm Surge Watch issued Florida Keys from Ocean Reef to Dry Tortugas, FL, including Florida Bay
8 / 1500 Storm Surge Warning issued Florida Keys from Ocean Reef to Dry Tortugas, FL, including Florida Bay
8 / 2100 Storm Surge Watch discontinued Card Sound Bridge to Golden Beach,
FL, including Biscayne Bay
9 / 0900 Storm Surge Warning
discontinued All
9 / 0900 Storm Surge Watch discontinued All
11 / 0300 Storm Surge Watch issued Bonita Beach to the Steinhatchee River, FL, including Tampa Bay and Charlotte
Harbor
11 / 1500 Storm Surge Warning issued Bonita Beach to the Suwannee River,
FL, including Tampa Bay and Charlotte Harbor
12 / 0900 Storm Surge Warning
discontinued Bonita Beach to Middle of Longboat Key, FL, including Charlotte Harbor
12 / 1200 Storm Surge Warning
discontinued All
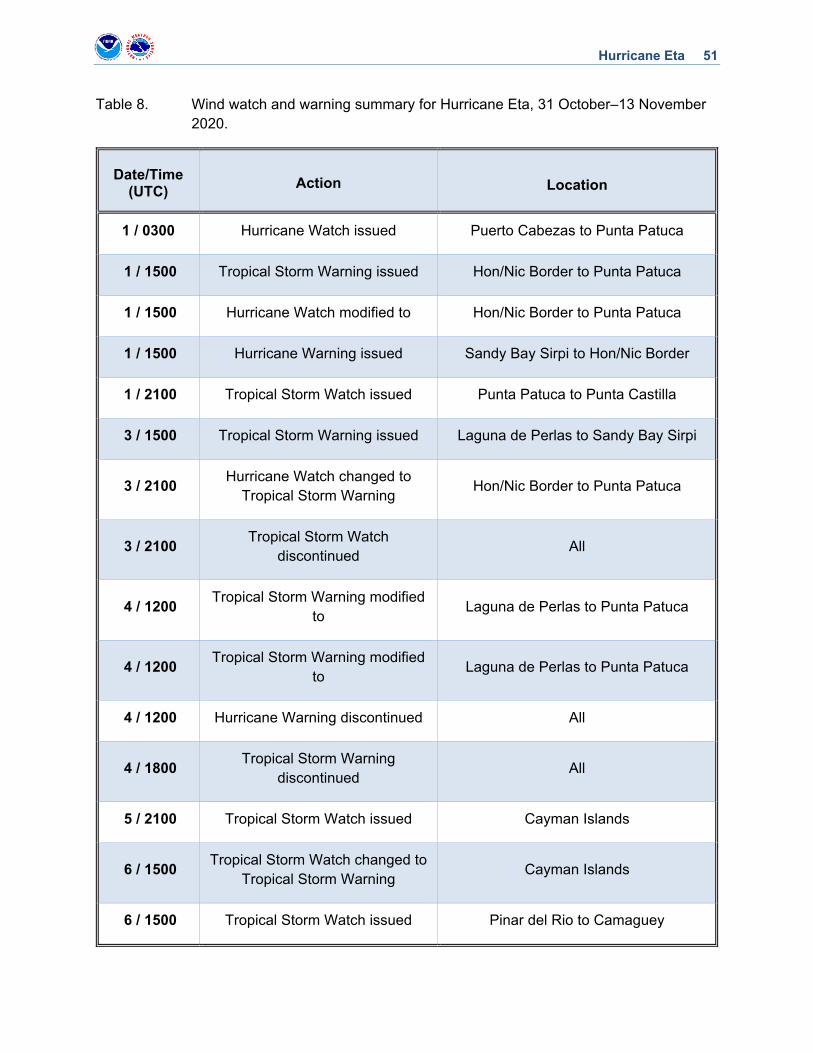
Hurricane Eta 51
Table 8. Wind watch and warning summary for Hurricane Eta, 31 October–13 November 2020.
Date/Time (UTC)
Action Location
1 / 0300 Hurricane Watch issued Puerto Cabezas to Punta Patuca
1 / 1500 Tropical Storm Warning issued Hon/Nic Border to Punta Patuca
1 / 1500 Hurricane Watch modified to Hon/Nic Border to Punta Patuca
1 / 1500 Hurricane Warning issued Sandy Bay Sirpi to Hon/Nic Border
1 / 2100 Tropical Storm Watch issued Punta Patuca to Punta Castilla
3 / 1500 Tropical Storm Warning issued Laguna de Perlas to Sandy Bay Sirpi
3 / 2100 Hurricane Watch changed to
Tropical Storm Warning Hon/Nic Border to Punta Patuca
3 / 2100 Tropical Storm Watch
discontinued All
4 / 1200 Tropical Storm Warning modified
to Laguna de Perlas to Punta Patuca
4 / 1200 Tropical Storm Warning modified
to Laguna de Perlas to Punta Patuca
4 / 1200 Hurricane Warning discontinued All
4 / 1800 Tropical Storm Warning
discontinued All
5 / 2100 Tropical Storm Watch issued Cayman Islands
6 / 1500 Tropical Storm Watch changed to
Tropical Storm Warning Cayman Islands
6 / 1500 Tropical Storm Watch issued Pinar del Rio to Camaguey
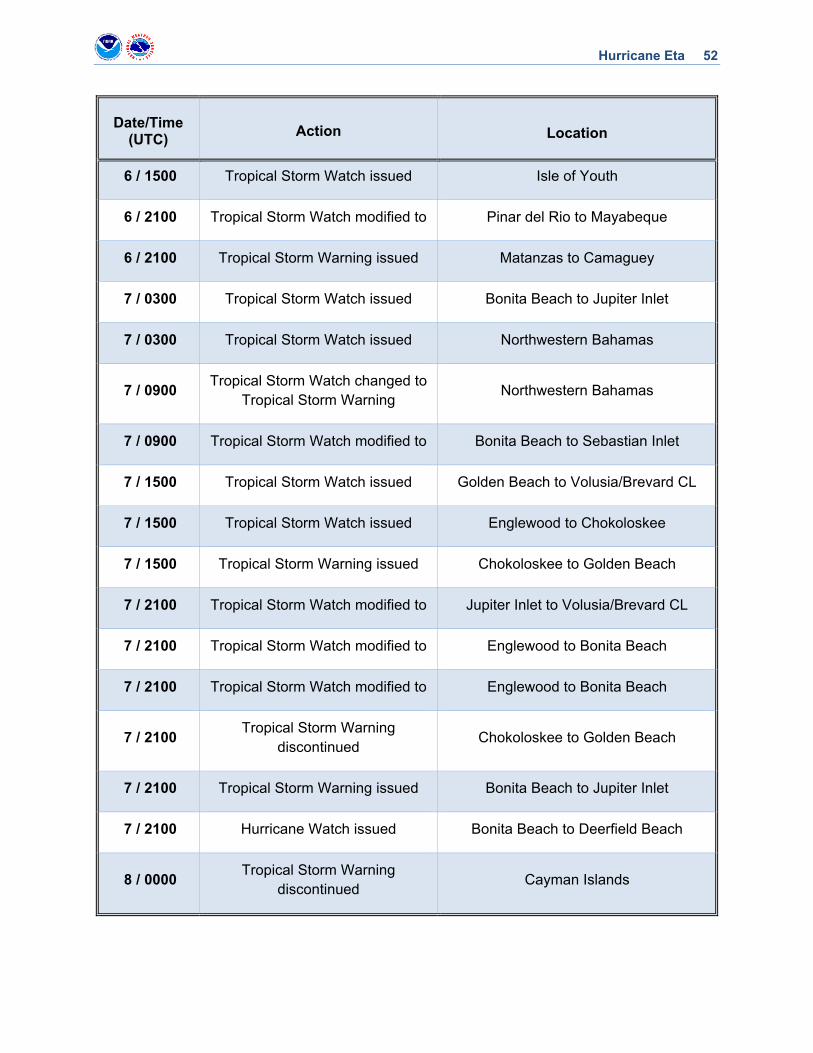
Hurricane Eta 52
Date/Time (UTC)
Action Location
6 / 1500 Tropical Storm Watch issued Isle of Youth
6 / 2100 Tropical Storm Watch modified to Pinar del Rio to Mayabeque
6 / 2100 Tropical Storm Warning issued Matanzas to Camaguey
7 / 0300 Tropical Storm Watch issued Bonita Beach to Jupiter Inlet
7 / 0300 Tropical Storm Watch issued Northwestern Bahamas
7 / 0900 Tropical Storm Watch changed to
Tropical Storm Warning Northwestern Bahamas
7 / 0900 Tropical Storm Watch modified to Bonita Beach to Sebastian Inlet
7 / 1500 Tropical Storm Watch issued Golden Beach to Volusia/Brevard CL
7 / 1500 Tropical Storm Watch issued Englewood to Chokoloskee
7 / 1500 Tropical Storm Warning issued Chokoloskee to Golden Beach
7 / 2100 Tropical Storm Watch modified to Jupiter Inlet to Volusia/Brevard CL
7 / 2100 Tropical Storm Watch modified to Englewood to Bonita Beach
7 / 2100 Tropical Storm Watch modified to Englewood to Bonita Beach
7 / 2100 Tropical Storm Warning
discontinued Chokoloskee to Golden Beach
7 / 2100 Tropical Storm Warning issued Bonita Beach to Jupiter Inlet
7 / 2100 Hurricane Watch issued Bonita Beach to Deerfield Beach
8 / 0000 Tropical Storm Warning
discontinued Cayman Islands
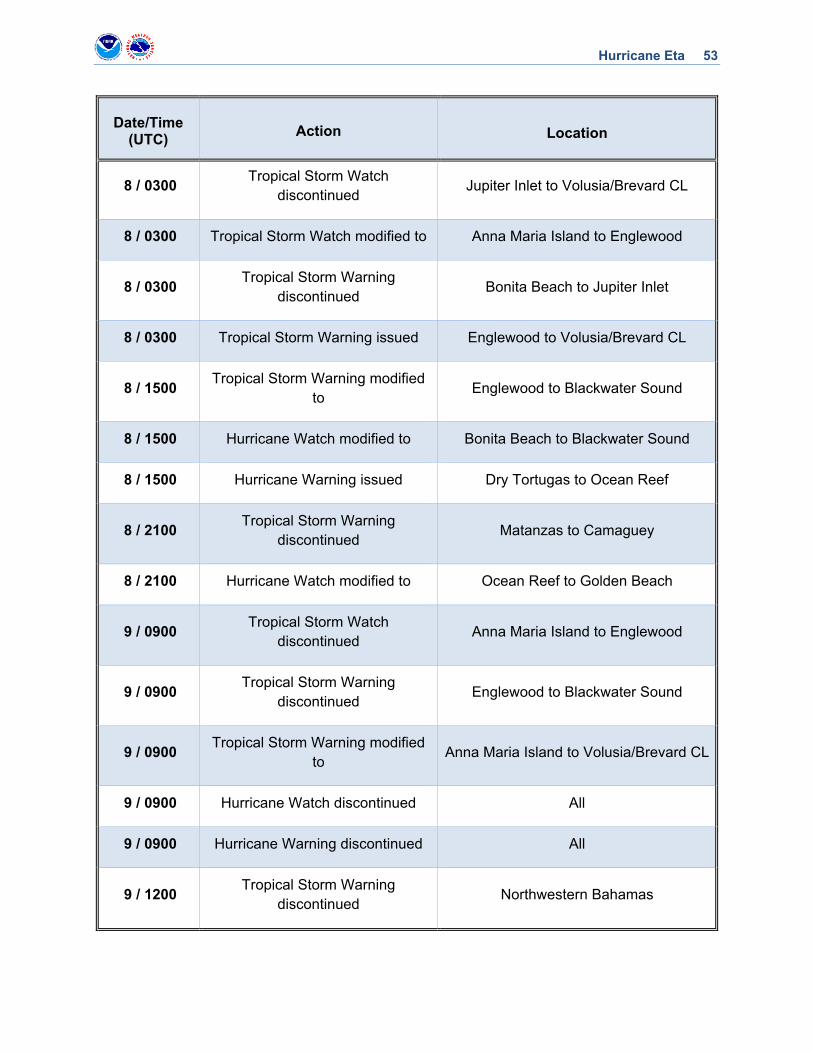
Hurricane Eta 53
Date/Time (UTC)
Action Location
8 / 0300 Tropical Storm Watch
discontinued Jupiter Inlet to Volusia/Brevard CL
8 / 0300 Tropical Storm Watch modified to Anna Maria Island to Englewood
8 / 0300 Tropical Storm Warning
discontinued Bonita Beach to Jupiter Inlet
8 / 0300 Tropical Storm Warning issued Englewood to Volusia/Brevard CL
8 / 1500 Tropical Storm Warning modified
to Englewood to Blackwater Sound
8 / 1500 Hurricane Watch modified to Bonita Beach to Blackwater Sound
8 / 1500 Hurricane Warning issued Dry Tortugas to Ocean Reef
8 / 2100 Tropical Storm Warning
discontinued Matanzas to Camaguey
8 / 2100 Hurricane Watch modified to Ocean Reef to Golden Beach
9 / 0900 Tropical Storm Watch
discontinued Anna Maria Island to Englewood
9 / 0900 Tropical Storm Warning
discontinued Englewood to Blackwater Sound
9 / 0900 Tropical Storm Warning modified
to Anna Maria Island to Volusia/Brevard CL
9 / 0900 Hurricane Watch discontinued All
9 / 0900 Hurricane Warning discontinued All
9 / 1200 Tropical Storm Warning
discontinued Northwestern Bahamas
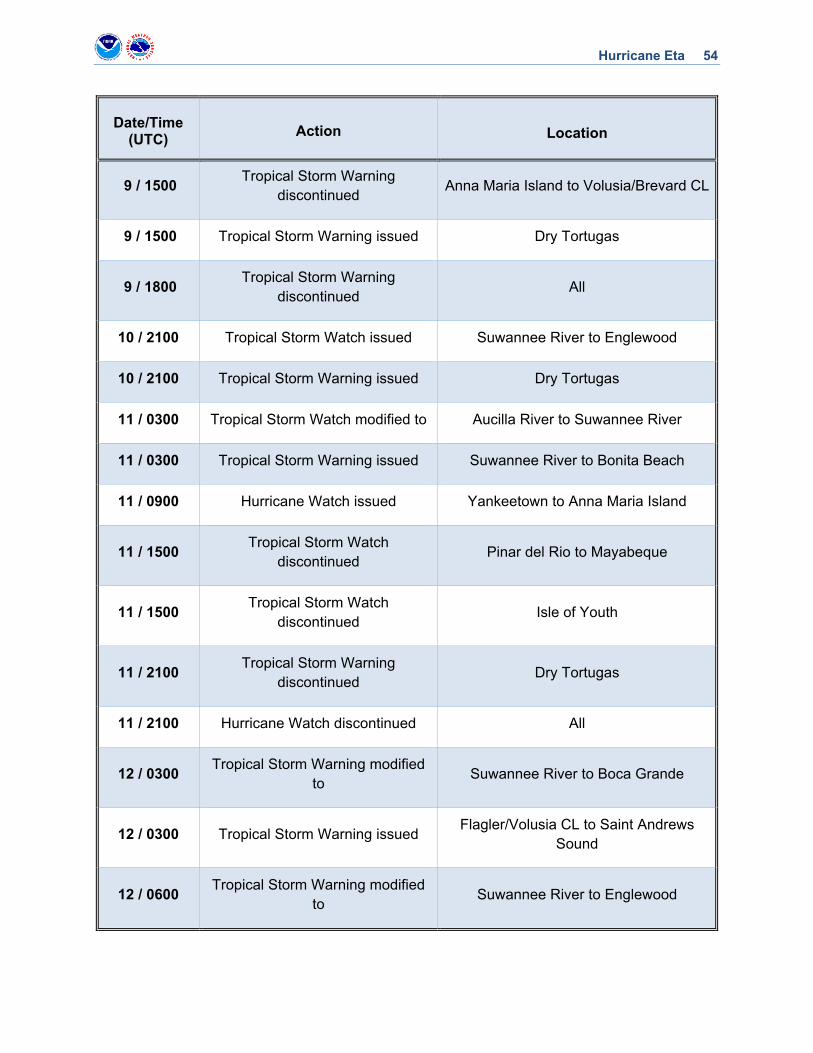
Hurricane Eta 54
Date/Time (UTC)
Action Location
9 / 1500 Tropical Storm Warning
discontinued Anna Maria Island to Volusia/Brevard CL
9 / 1500 Tropical Storm Warning issued Dry Tortugas
9 / 1800 Tropical Storm Warning
discontinued All
10 / 2100 Tropical Storm Watch issued Suwannee River to Englewood
10 / 2100 Tropical Storm Warning issued Dry Tortugas
11 / 0300 Tropical Storm Watch modified to Aucilla River to Suwannee River
11 / 0300 Tropical Storm Warning issued Suwannee River to Bonita Beach
11 / 0900 Hurricane Watch issued Yankeetown to Anna Maria Island
11 / 1500 Tropical Storm Watch
discontinued Pinar del Rio to Mayabeque
11 / 1500 Tropical Storm Watch
discontinued Isle of Youth
11 / 2100 Tropical Storm Warning
discontinued Dry Tortugas
11 / 2100 Hurricane Watch discontinued All
12 / 0300 Tropical Storm Warning modified
to Suwannee River to Boca Grande
12 / 0300 Tropical Storm Warning issued Flagler/Volusia CL to Saint Andrews
Sound
12 / 0600 Tropical Storm Warning modified
to Suwannee River to Englewood
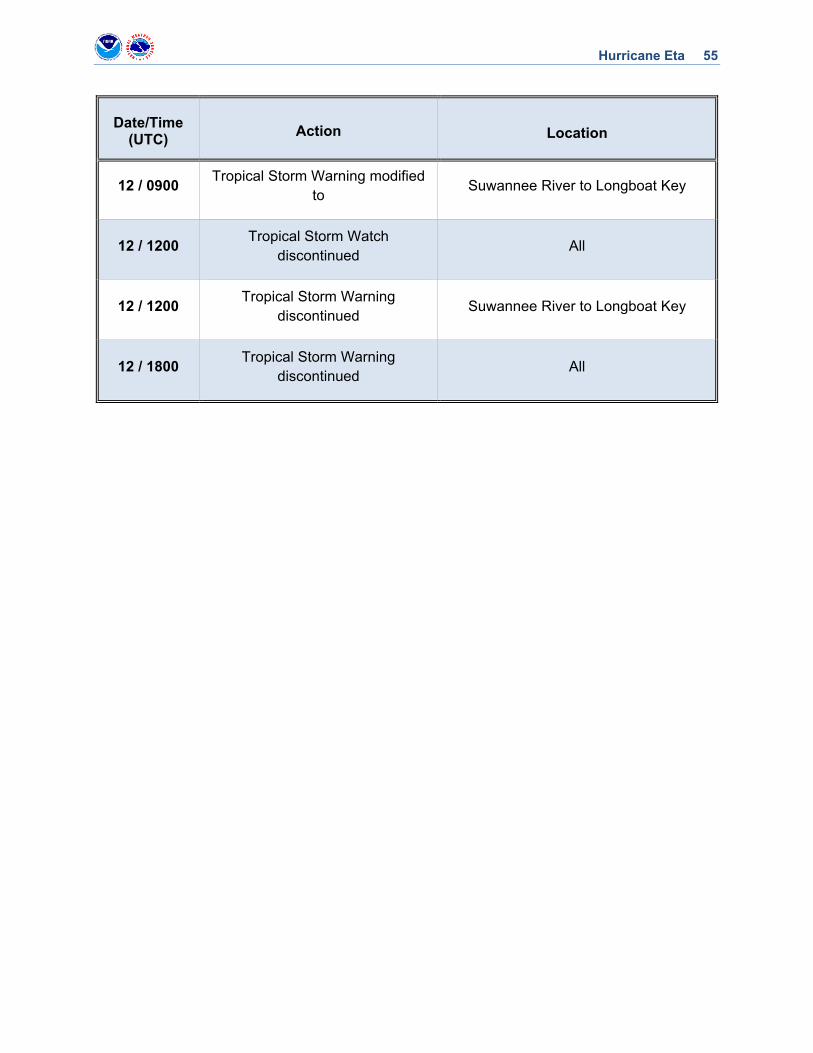
Hurricane Eta 55
Date/Time (UTC)
Action Location
12 / 0900 Tropical Storm Warning modified
to Suwannee River to Longboat Key
12 / 1200 Tropical Storm Watch
discontinued All
12 / 1200 Tropical Storm Warning
discontinued Suwannee River to Longboat Key
12 / 1800 Tropical Storm Warning
discontinued All
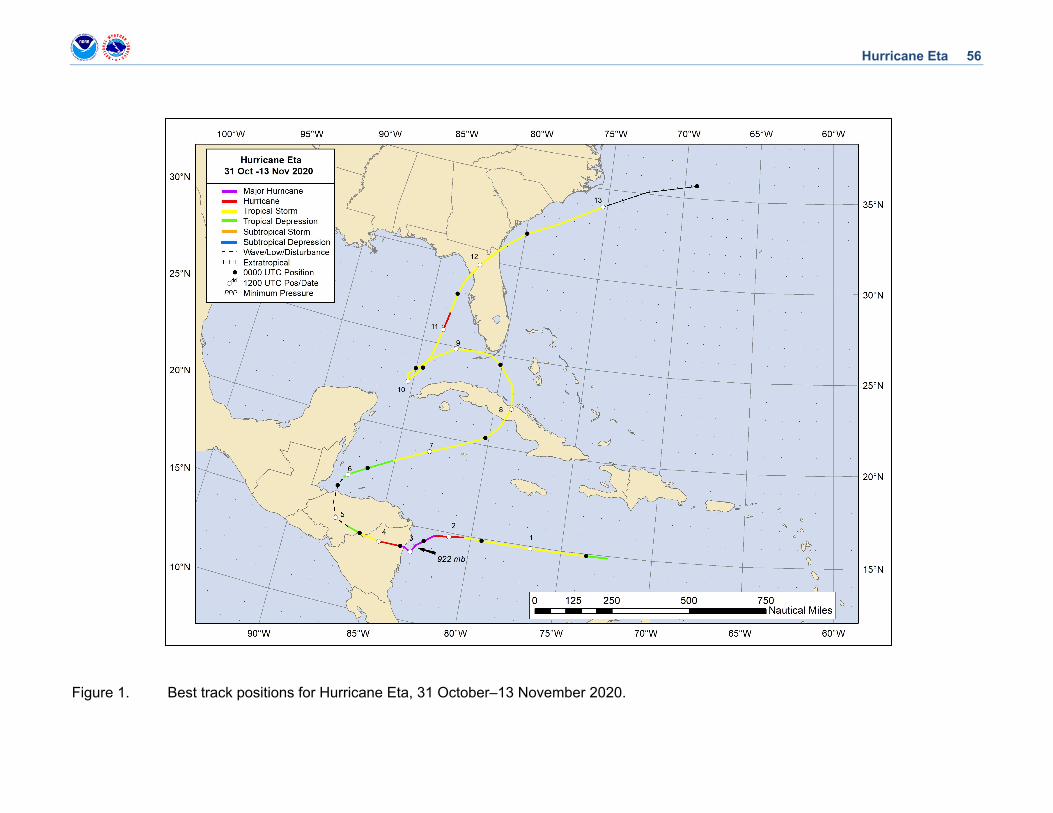
Hurricane Eta 56
Figure 1. Best track positions for Hurricane Eta, 31 October–13 November 2020.
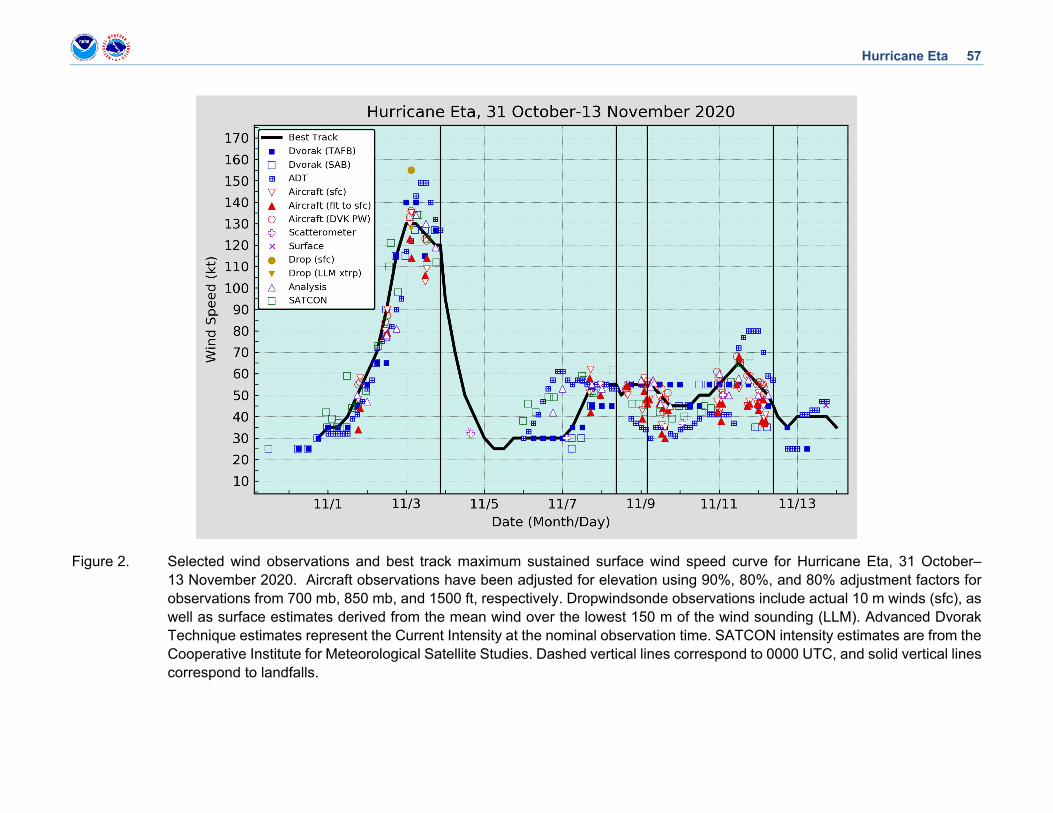
Hurricane Eta 57
Figure 2. Selected wind observations and best track maximum sustained surface wind speed curve for Hurricane Eta, 31 October– 13 November 2020. Aircraft observations have been adjusted for elevation using 90%, 80%, and 80% adjustment factors for observations from 700 mb, 850 mb, and 1500 ft, respectively. Dropwindsonde observations include actual 10 m winds (sfc), as well as surface estimates derived from the mean wind over the lowest 150 m of the wind sounding (LLM). Advanced Dvorak Technique estimates represent the Current Intensity at the nominal observation time. SATCON intensity estimates are from the Cooperative Institute for Meteorological Satellite Studies. Dashed vertical lines correspond to 0000 UTC, and solid vertical lines correspond to landfalls.
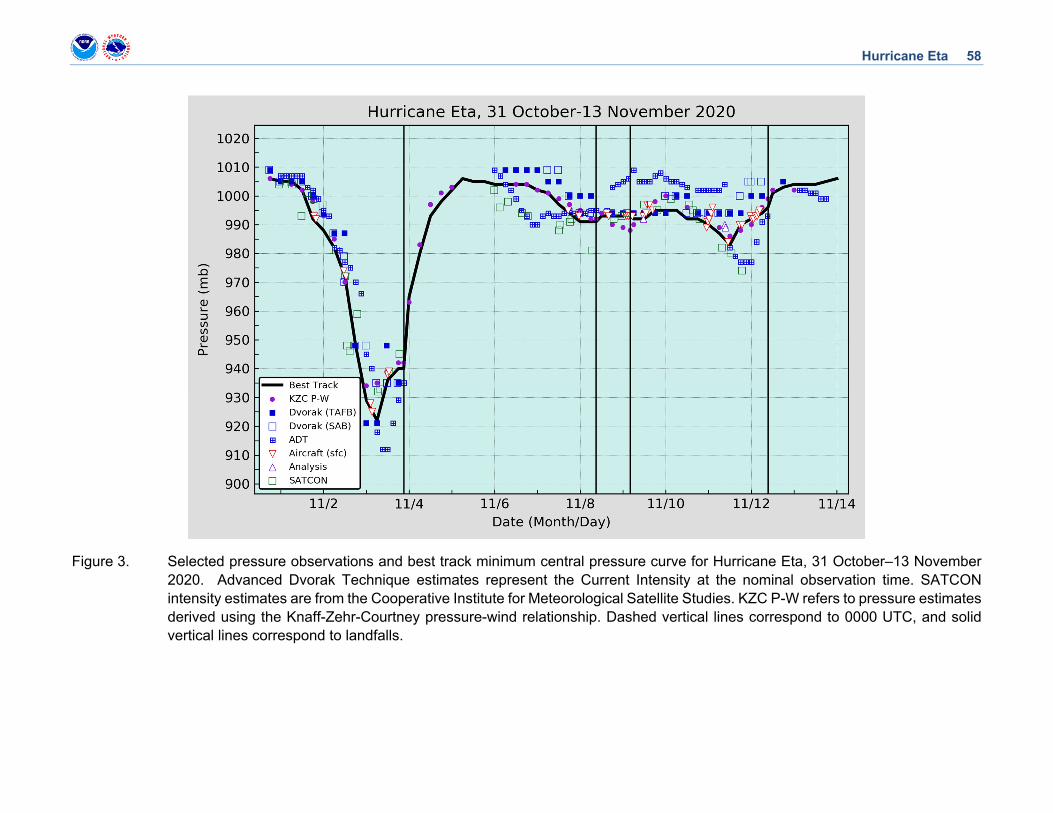
Hurricane Eta 58
Figure 3. Selected pressure observations and best track minimum central pressure curve for Hurricane Eta, 31 October–13 November 2020. Advanced Dvorak Technique estimates represent the Current Intensity at the nominal observation time. SATCON intensity estimates are from the Cooperative Institute for Meteorological Satellite Studies. KZC P-W refers to pressure estimates derived using the Knaff-Zehr-Courtney pressure-wind relationship. Dashed vertical lines correspond to 0000 UTC, and solid vertical lines correspond to landfalls.
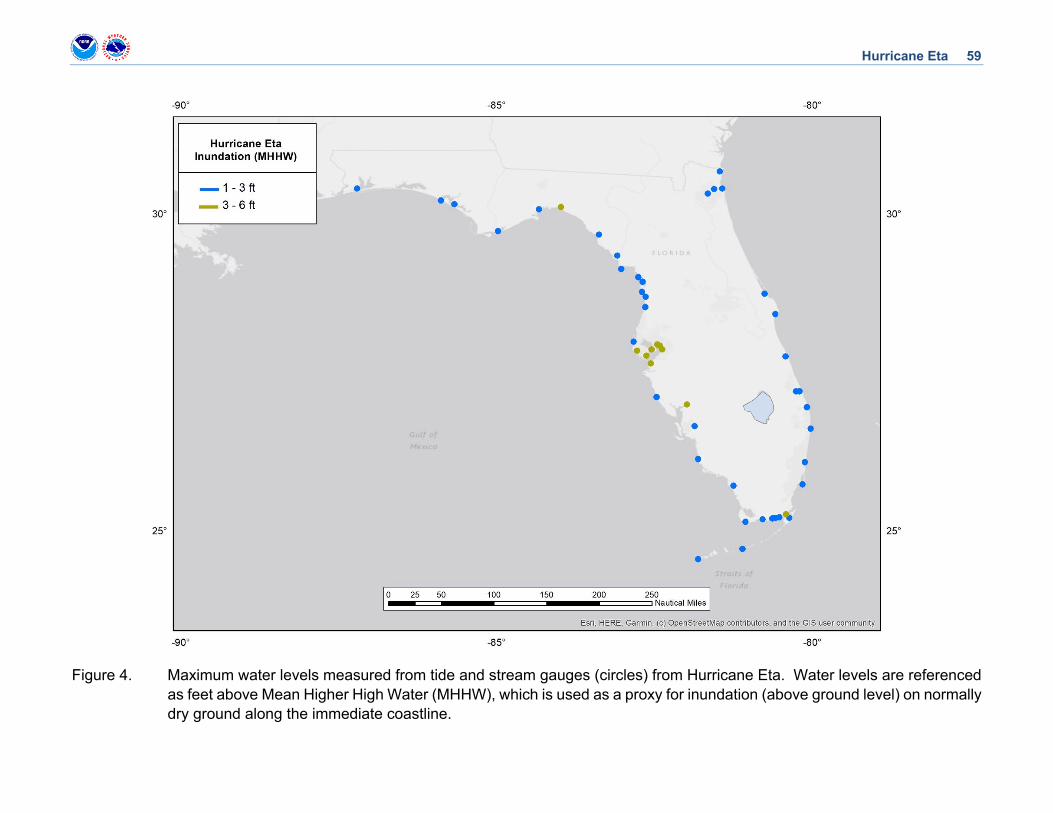
Hurricane Eta 59
Figure 4. Maximum water levels measured from tide and stream gauges (circles) from Hurricane Eta. Water levels are referenced as feet above Mean Higher High Water (MHHW), which is used as a proxy for inundation (above ground level) on normally dry ground along the immediate coastline.
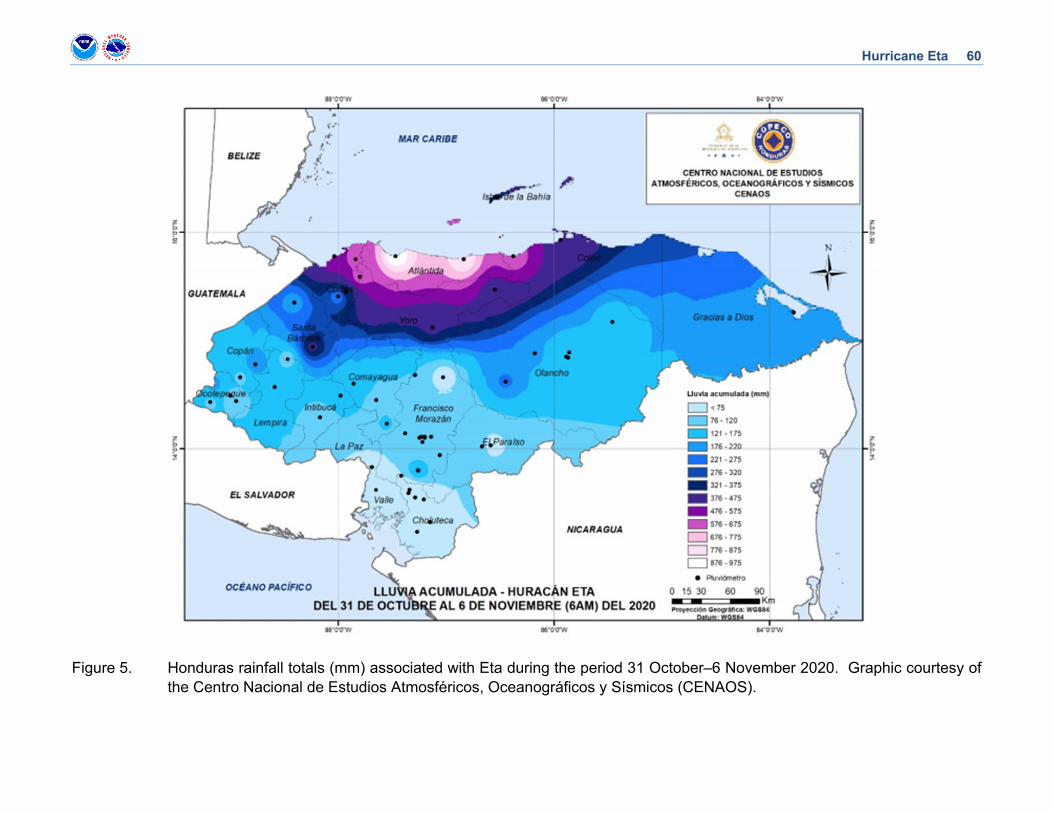
Hurricane Eta 60
Figure 5. Honduras rainfall totals (mm) associated with Eta during the period 31 October–6 November 2020. Graphic courtesy of the Centro Nacional de Estudios Atmosféricos, Oceanográficos y Sísmicos (CENAOS).
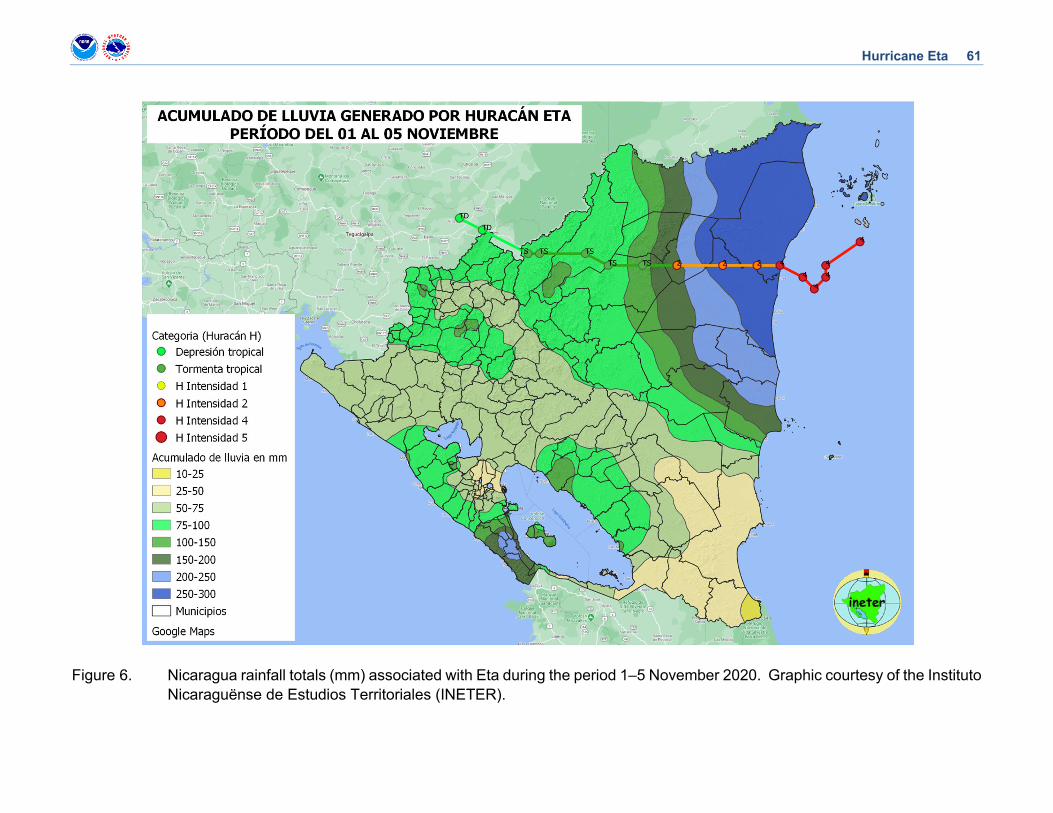
Hurricane Eta 61
Figure 6. Nicaragua rainfall totals (mm) associated with Eta during the period 1–5 November 2020. Graphic courtesy of the Instituto Nicaraguënse de Estudios Territoriales (INETER).
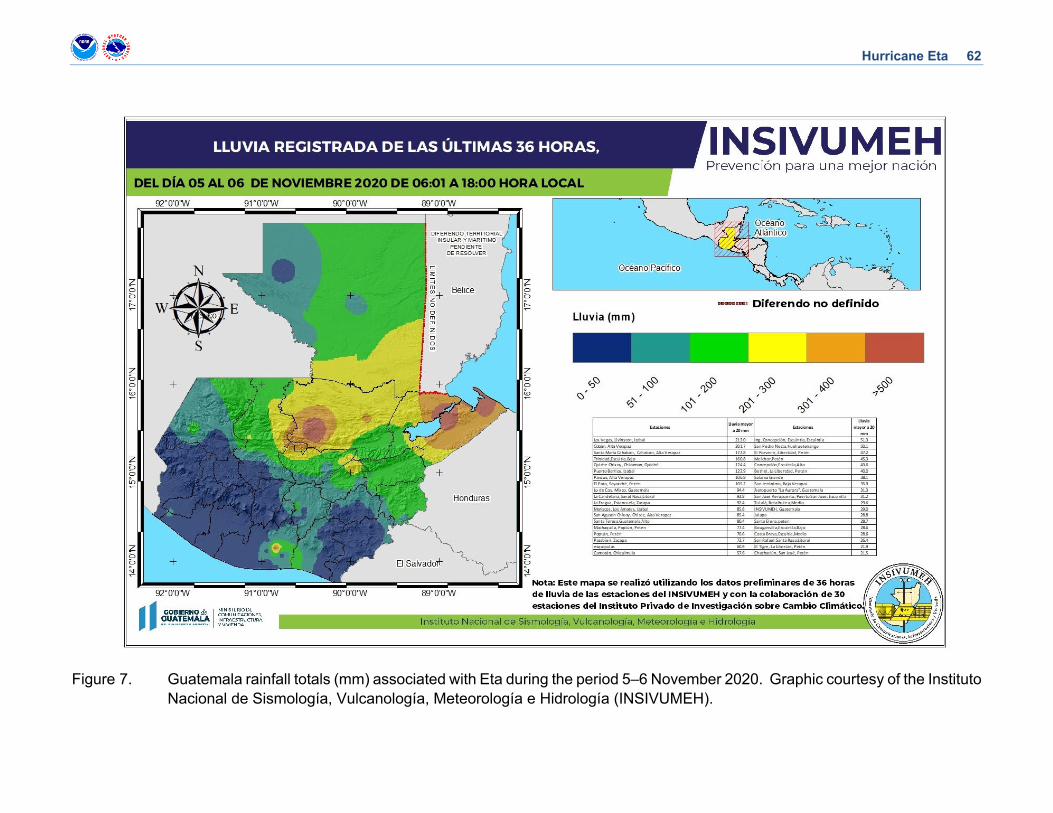
Hurricane Eta 62
Figure 7. Guatemala rainfall totals (mm) associated with Eta during the period 5–6 November 2020. Graphic courtesy of the Instituto Nacional de Sismología, Vulcanología, Meteorología e Hidrología (INSIVUMEH).
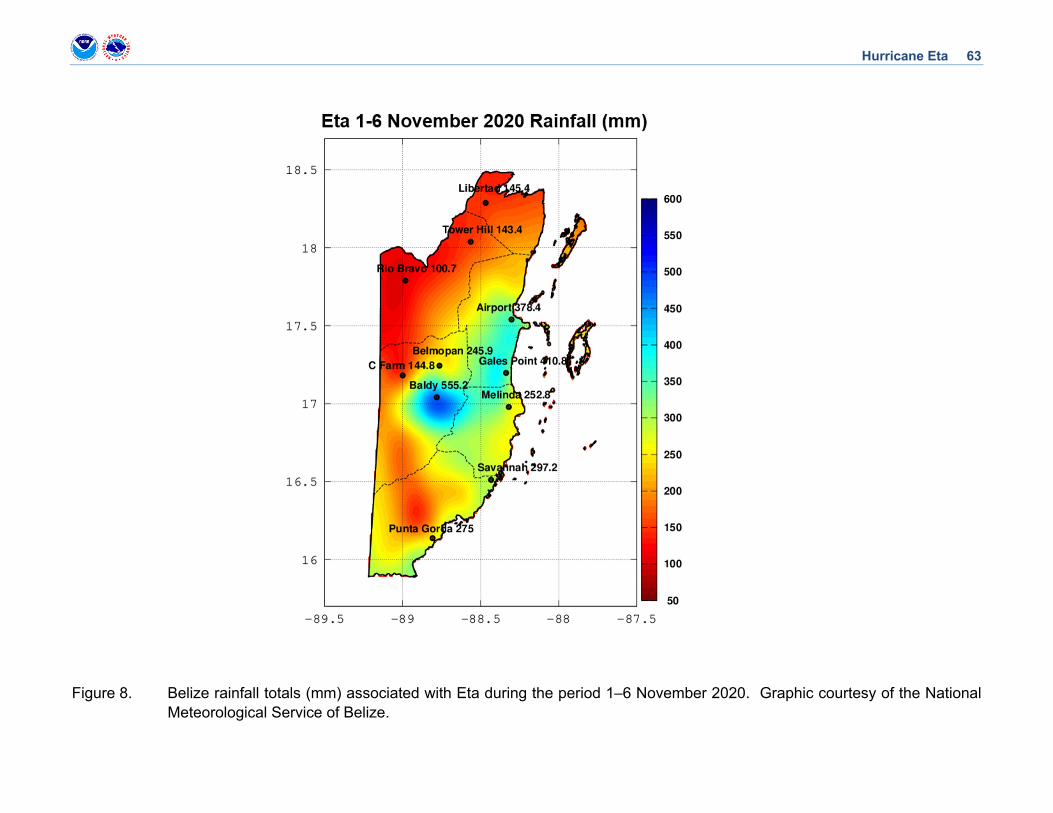
Hurricane Eta 63
Figure 8. Belize rainfall totals (mm) associated with Eta during the period 1–6 November 2020. Graphic courtesy of the National Meteorological Service of Belize.
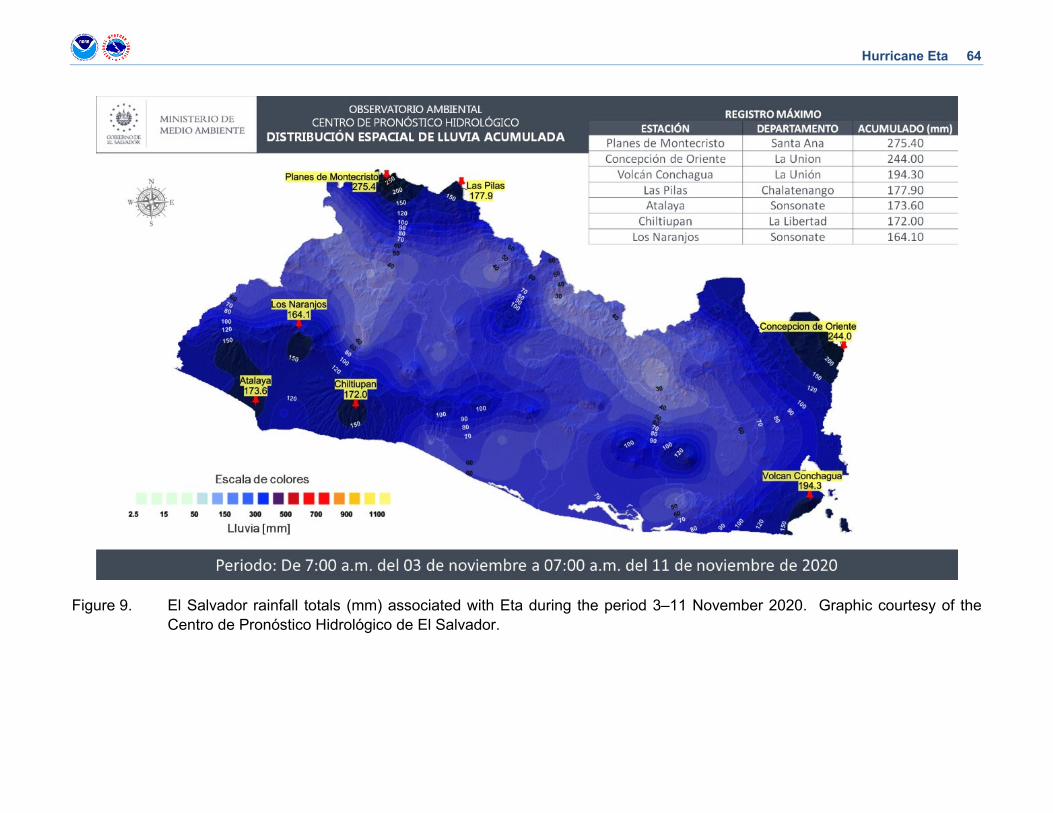
Hurricane Eta 64
Figure 9. El Salvador rainfall totals (mm) associated with Eta during the period 3–11 November 2020. Graphic courtesy of the Centro de Pronóstico Hidrológico de El Salvador.
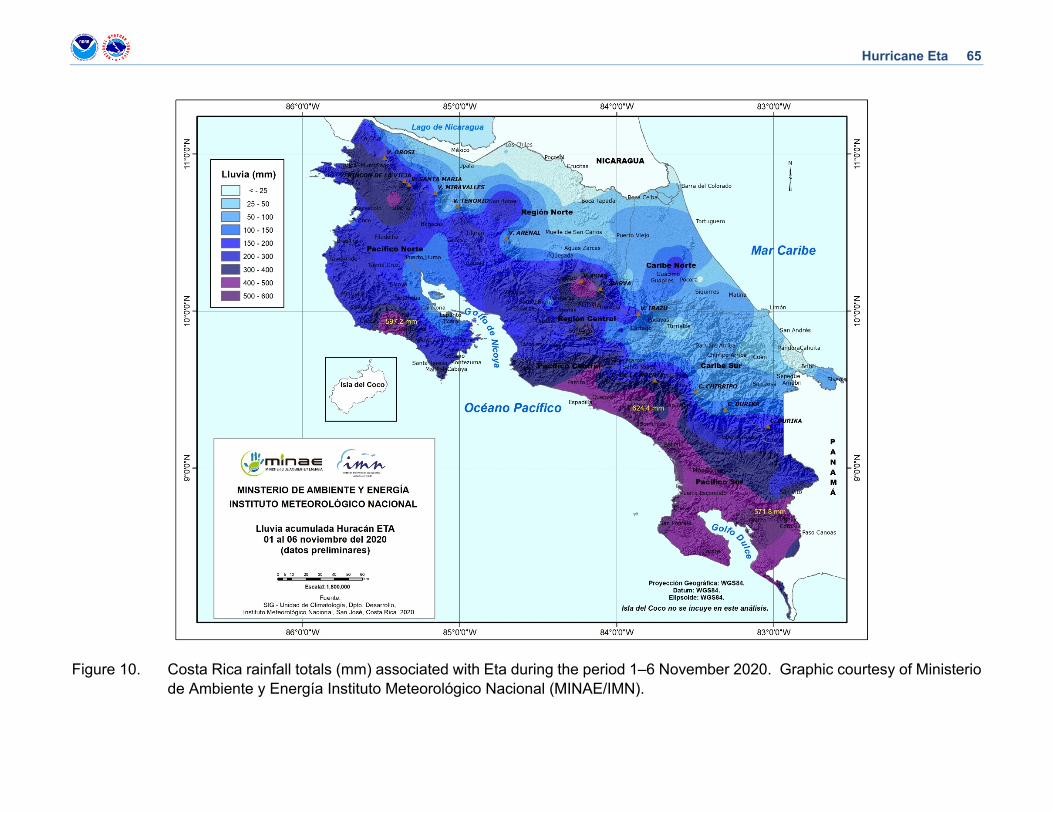
Hurricane Eta 65
Figure 10. Costa Rica rainfall totals (mm) associated with Eta during the period 1–6 November 2020. Graphic courtesy of Ministerio de Ambiente y Energía Instituto Meteorológico Nacional (MINAE/IMN).
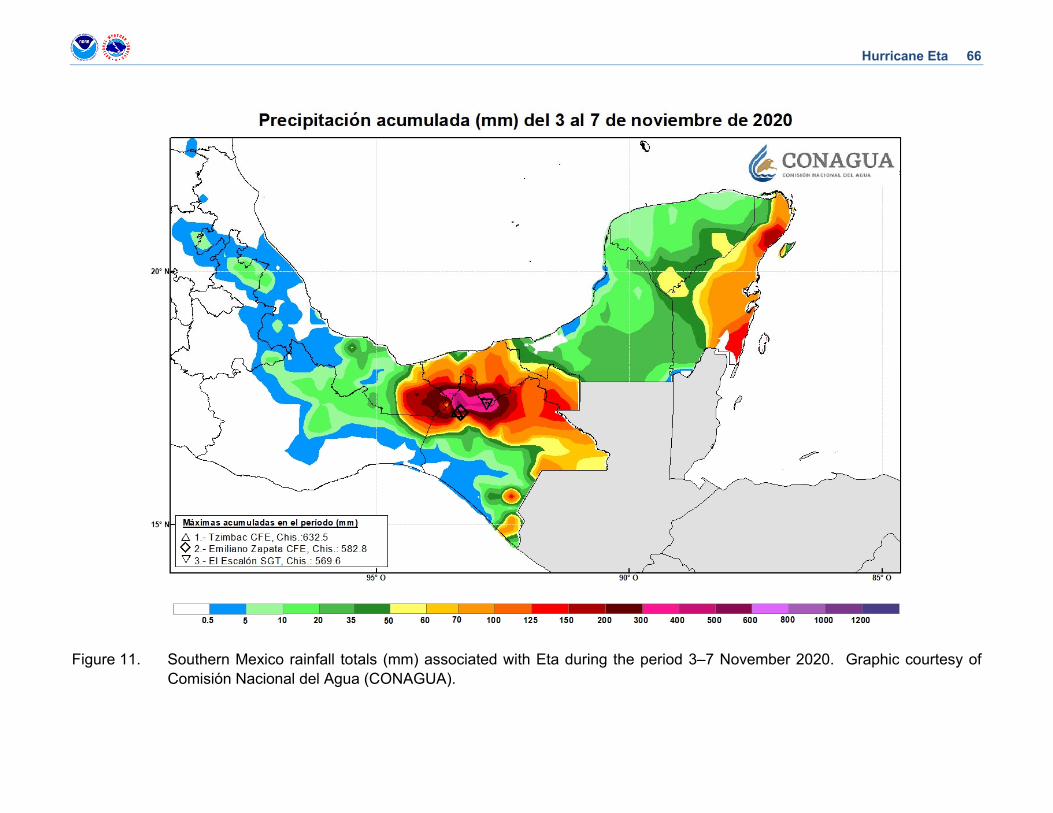
Hurricane Eta 66
Figure 11. Southern Mexico rainfall totals (mm) associated with Eta during the period 3–7 November 2020. Graphic courtesy of Comisión Nacional del Agua (CONAGUA).

Hurricane Eta 67
Figure 12. United States rainfall totals (inches) associated with Eta during the period 6–13 November 2020. Figure courtesy of Zackary Taylor and David Roth of the NOAA Weather Prediction Center.
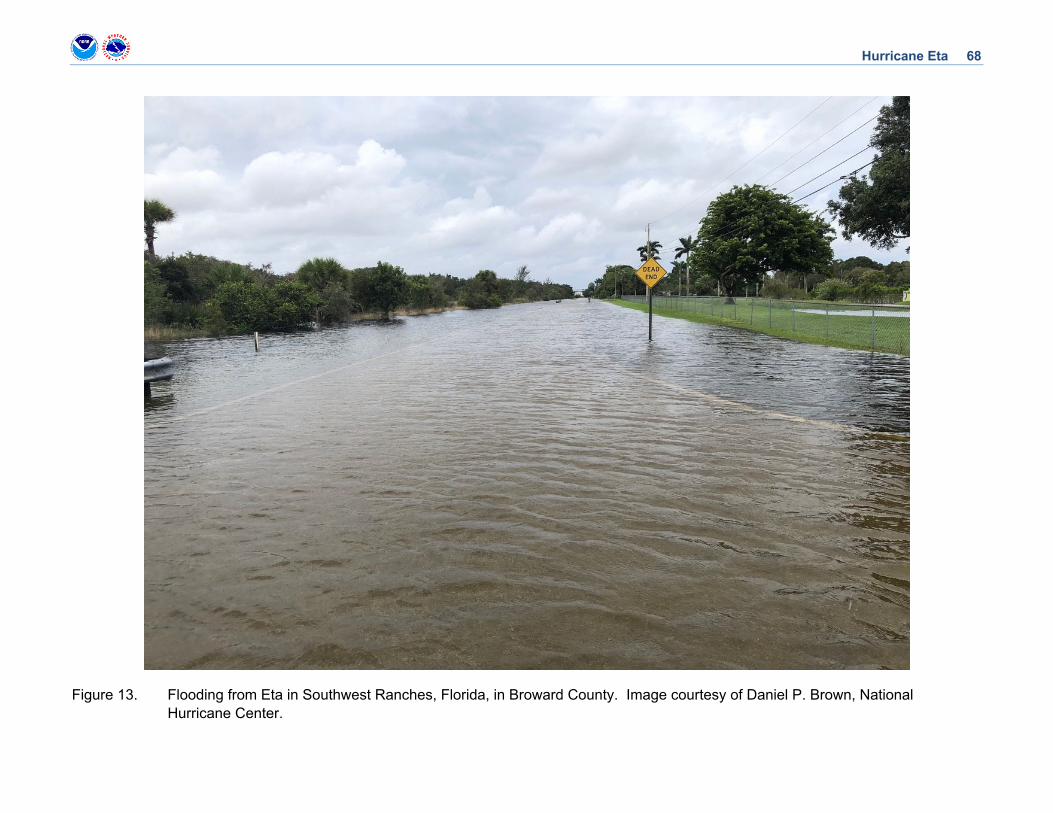
Hurricane Eta 68
Figure 13. Flooding from Eta in Southwest Ranches, Florida, in Broward County. Image courtesy of Daniel P. Brown, National Hurricane Center.

Hurricane Eta 69
Figure 14. Official track forecasts for Hurricane Eta, 31 October 1800 UTC to 3 November 1800 UTC 2020. The best track is shown by the white curve.
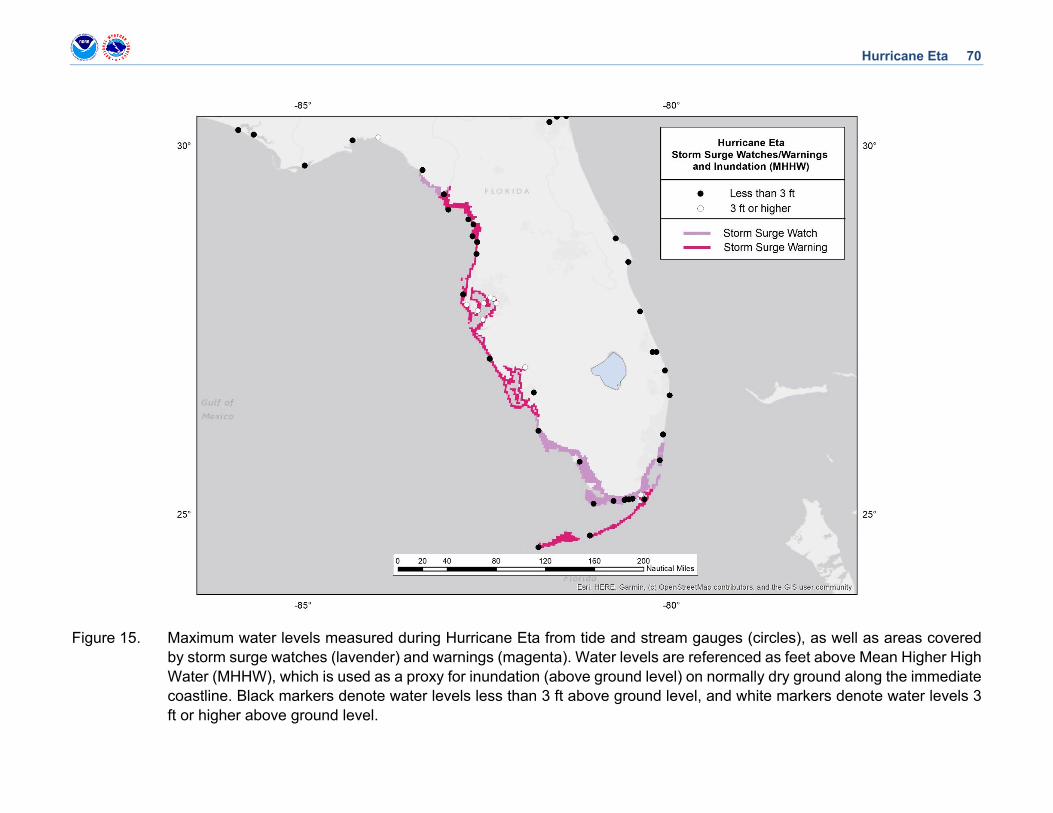
Hurricane Eta 70
Figure 15. Maximum water levels measured during Hurricane Eta from tide and stream gauges (circles), as well as areas covered by storm surge watches (lavender) and warnings (magenta). Water levels are referenced as feet above Mean Higher High Water (MHHW), which is used as a proxy for inundation (above ground level) on normally dry ground along the immediate coastline. Black markers denote water levels less than 3 ft above ground level, and white markers denote water levels 3 ft or higher above ground level.