Embed Size (px)
Citation preview
Journal of Membrane Science 246 (2005) 227–234
Humectant release from membrane materials
Scott Wrighta, John Pellegrinob,c,∗, Gary Amyb
a US Army, 30th Medical Brigade, CMR 442, Box 383, APO AP 09042-0383, USAb Department of Civil/Environmental Engineering, University of Colorado, Boulder, CO 80309-0428, USA
c NIST, 325 Broadway, MS838, Boulder, CO 80305, USA
Received 30 January 2004; received in revised form 28 July 2004; accepted 30 July 2004
Abstract
We report the results of membrane filtration studies designed to measure the removal of humectant preservatives (expressed as total organiccarbon) from new membrane samples. Membranes with different characteristic properties, that is, relative molecular mass cutoff and materialchemistry, were filtered with deionized water under constant flux and feed water temperature (in either dead-end or cross-flow devices) todetermine the area-normalized filtrate volume required to remove all of the measurable organic carbon. For specific cases, the effects ofc r mass cutoffa volume ofd easurementt©
K
1
vGb(slrdttipoi
oftenmem-dard
stedvary-eseser-em-that
on-em-lete.car-cale
ide ani-
mem-elativew
0d
hanging flux and feed water temperature are also reported. Release of humectants depends on the nominal relative moleculand the thickness (including support) of the membrane—complete removal is not simply predicted by a soaking time or measuredeionized water filtered through the membrane without regard to the flux. This report provides general guidance and a suggested m
echnique for monitoring the removal of membrane preservatives prior to membrane application studies.2004 Elsevier B.V. All rights reserved.
eywords:Characterization; Humectant; Preconditioning; Reverse osmosis; Ultrafiltration
. Introduction
Manufacturers of membranes commonly rely on preser-atives to stabilize membranes and extend their shelf life.lycerin and sodium azide are often used for cellulose-ased membrane materials[1]. Polyhydroxy compoundse.g., polyethylene glycol or PEG) and surfactants (e.g.,odium dodecyl sulfate) are also potential compounds, col-ectively referred to as humectants, used in membrane mate-ials to stabilize the pore structure when the membranes areried for storage and shipping. Removal of humectants prior
o bench-scale studies is important because they can affectransport phenomena through the membranes including thenitial solute rejection measurements. Additionally, incom-lete removal of humectant can lead to measurement error ifrganic carbon is the main measured parameter characteriz-
ng the transport or rejection characteristics of the membrane.
∗ Corresponding author.E-mail address:[email protected] (J. Pellegrino).
Humectants (or any preservative) in membranes areremoved at the bench-scale as a means to prepare thebranes prior to other characterization tests, but no stanmethod exists for this important initial step. One suggeprocedure is soaking membranes in caustic solutions foring periods of time followed by filtering varying quantitiof deionized water through the membrane to remove prvatives[2,3]. Other procedures have involved soaking mbranes ‘overnight’ and ‘rinsing prior to use’ to ensurethese preservatives do not influence the results[4–6].
The purpose of this work is to communicate and demstrate the need for monitoring permeate quality during mbrane preconditioning to ensure that cleaning is compWe present the results of monitoring removal of organicbon from membranes that are typically used in bench-sfiltration studies. Measurements of organic carbon provstraightforward, effective, and high-resolution way to motor the release of organic preservatives. Several types ofbranes have been tested, representing a broad range of rmolecular mass cutoff (MWCO, g/mol). Additionally, a fe
376-7388/$ – see front matter © 2004 Elsevier B.V. All rights reserved.oi:10.1016/j.memsci.2004.07.030
228 S. Wright et al. / Journal of Membrane Science 246 (2005) 227–234
Table 1Membrane material information and experimental results
Codea General type Materialb Nominal MWCOb Overall thicknessc
(�m)Area-normalized TOCremovedc (g m−2)
Area-normalized totalmass removedc (g m−2)
RO-SW RO Polyamide-TFC <50 140 (±3) 0.06 NMNF-TFC NF Polyamide-TFC 400 146 (±5) 0.31 (±0.02) 1.14 (±0.20)NF-CA NF Cellulose acetate 500 274 (±25) 1.43 (±0.14) 46.31 (±16.07)UF-8K UF Sulfonated polyimide 8000 201 (±3) 0.68 (±0.04) 5.25 (±0.86)UF-10K UF Regenerated cellulose 10000 236 (±12) 1.37 (±0.19) 52.58 (±2.99)UF-20K UF Sulfonated PES 20000 155 (±7) 1.68 (±0.33) 13.92 (±0.71)
NM: not measured.a Manufacturer is identified only to provide an accurate description of the materials used for scientific purposes. Identification is not intended to imply
recommendation or endorsement by the National Institute of Standards and Technology, nor is it intended to imply that the materials used are the best availablefor the purpose: RO-SW (Film Tec, SW30); NF-TFC (Film Tec, NF45); NF-CA (Millipore, YC05); UF-8K (Osmonics, GM); UF-10K (Millipore, YM10F);UF-20K (Nitto Denko, NTR7410).
b Based on manufacturer’s information.c Uncertainty at a coverage factor of one standard deviation.
limited measurements to ascertain the broad effects of fluxand temperature on organic carbon and total mass removal(for selected membrane materials) are reported. The resultsfrom these measurements are intended to provide generalguidance on the procedure for preparing membranes in orderto reduce the influence of release of humectant during mem-brane characterization and transport/rejection measurements.
2. Experimental
Table 1summarizes the membranes tested. Three typesof materials were selected: cellulose-based (NF-CA andUF-10K); sulfonated substrates (UF-20K and UF-8K); andpolyamide thin-film composite (TFC) membranes (RO-SWand NF-TFC). All membranes except the cellulose-basedones were stored at room temperature (ca. 25◦C) until used.Cellulose-based membranes were refrigerated at 4◦C andpermitted to reach room temperature just prior to testing.
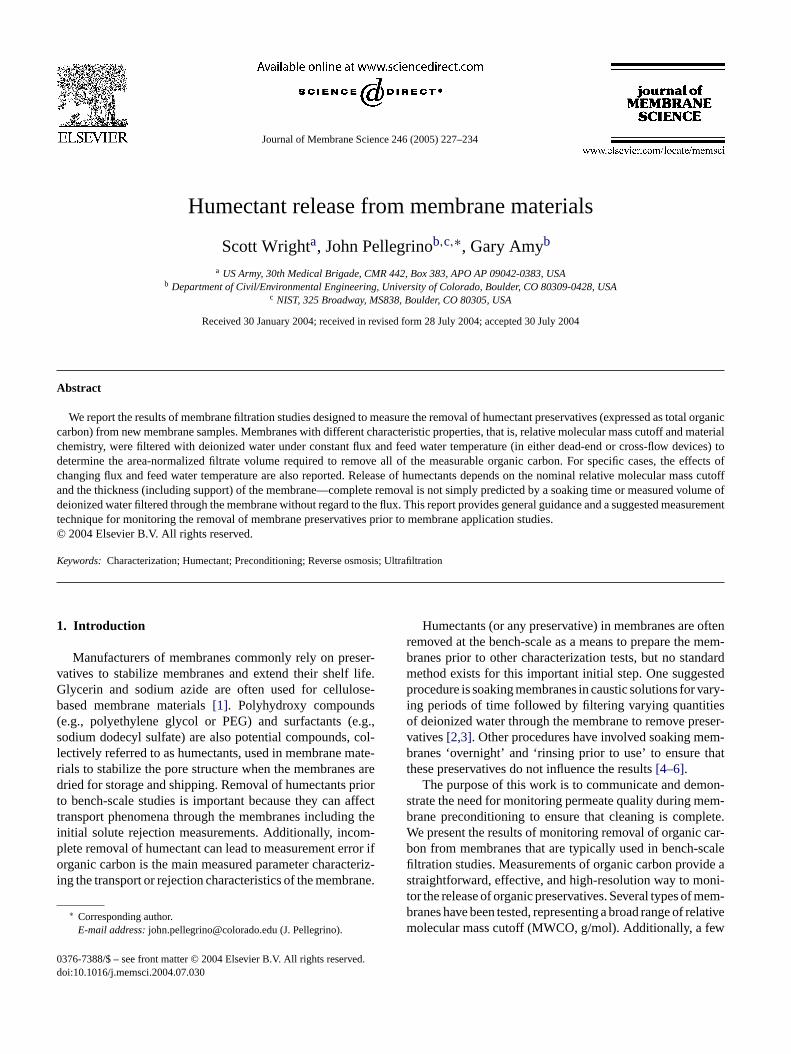
Three dead-end filtration cells were operated in paral-lel under the same conditions in order to average sample-to-sample variations in the stock sheet (seeFig. 1). Mem-brane samples were cut from different locations of a 1 m2
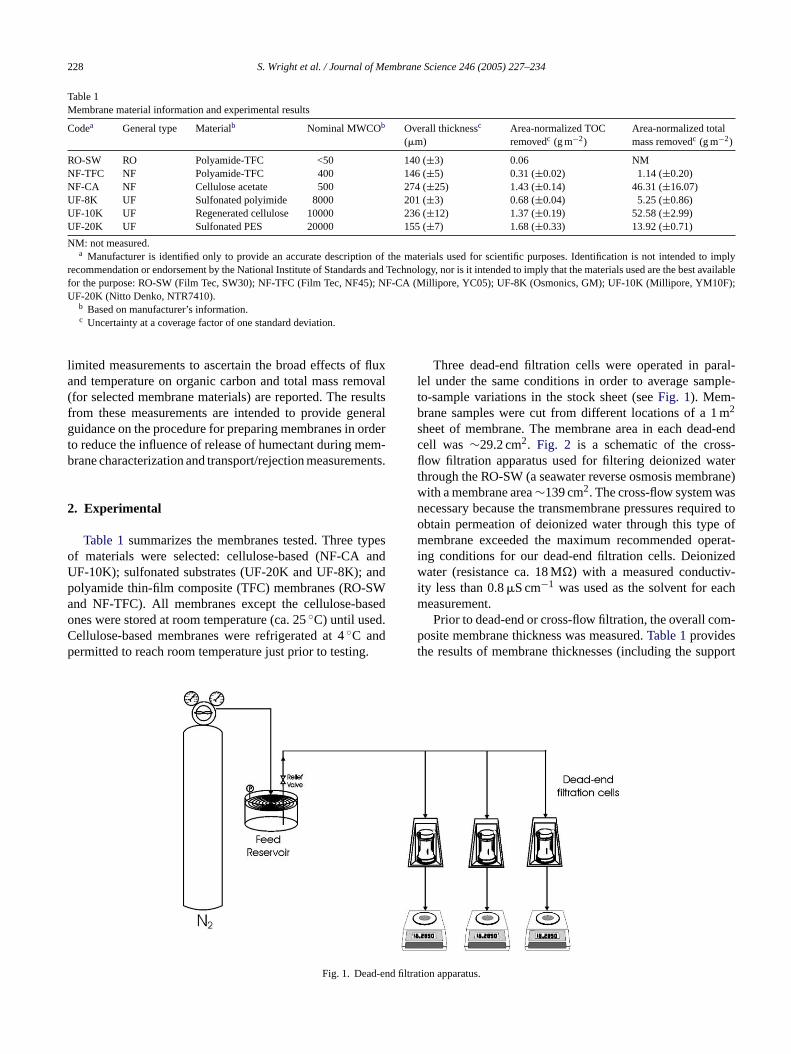
sheet of membrane. The membrane area in each dead-endcell was ∼29.2 cm2. Fig. 2 is a schematic of the cross-flow filtration apparatus used for filtering deionized waterthrough the RO-SW (a seawater reverse osmosis membrane)with a membrane area∼139 cm2. The cross-flow system wasnecessary because the transmembrane pressures required toobtain permeation of deionized water through this type ofmembrane exceeded the maximum recommended operat-ing conditions for our dead-end filtration cells. Deionizedwater (resistance ca. 18 M�) with a measured conductiv-ity less than 0.8�S cm−1 was used as the solvent for eachmeasurement.
Prior to dead-end or cross-flow filtration, the overall com-posite membrane thickness was measured.Table 1providesthe results of membrane thicknesses (including the support
nd filtr
Fig. 1. Dead-e ation apparatus.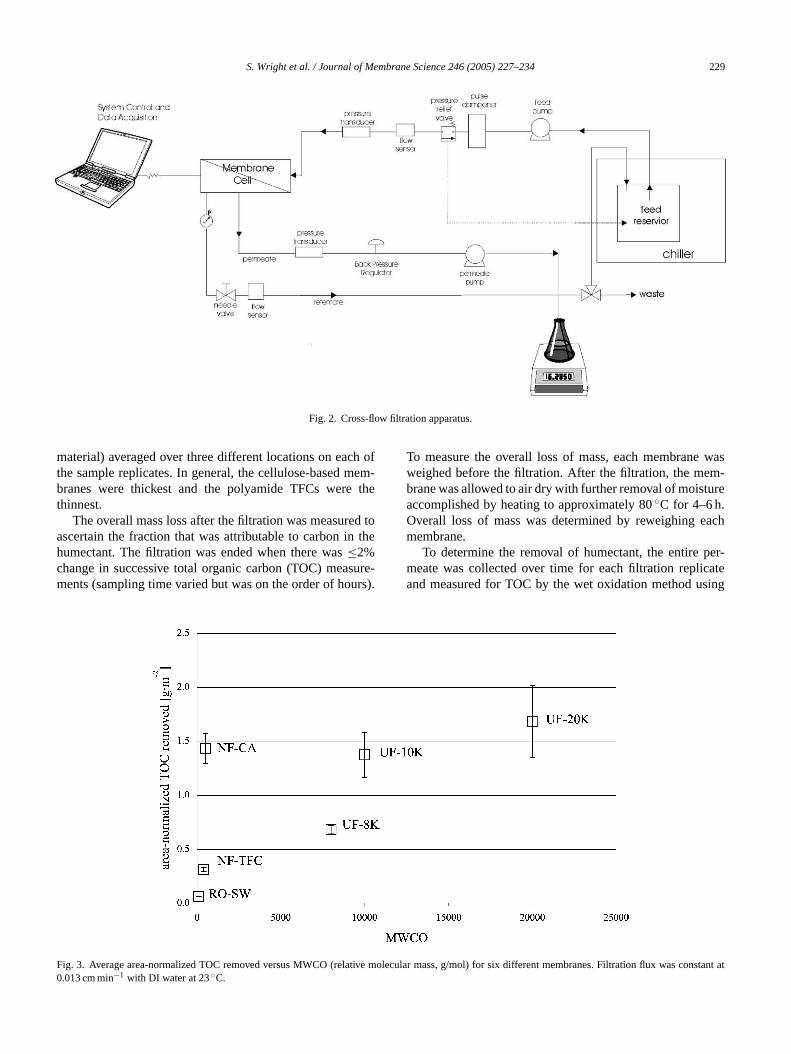
S. Wright et al. / Journal of Membrane Science 246 (2005) 227–234 229
Fig. 2. Cross-flow filtration apparatus.
material) averaged over three different locations on each ofthe sample replicates. In general, the cellulose-based mem-branes were thickest and the polyamide TFCs were thethinnest.
The overall mass loss after the filtration was measured toascertain the fraction that was attributable to carbon in thehumectant. The filtration was ended when there was≤2%change in successive total organic carbon (TOC) measure-ments (sampling time varied but was on the order of hours).
To measure the overall loss of mass, each membrane wasweighed before the filtration. After the filtration, the mem-brane was allowed to air dry with further removal of moistureaccomplished by heating to approximately 80◦C for 4–6 h.Overall loss of mass was determined by reweighing eachmembrane.
To determine the removal of humectant, the entire per-meate was collected over time for each filtration replicateand measured for TOC by the wet oxidation method using
F ive mo constant a0
ig. 3. Average area-normalized TOC removed versus MWCO (relat.013 cm min−1 with DI water at 23◦C.
lecular mass, g/mol) for six different membranes. Filtration flux wast
230 S. Wright et al. / Journal of Membrane Science 246 (2005) 227–234
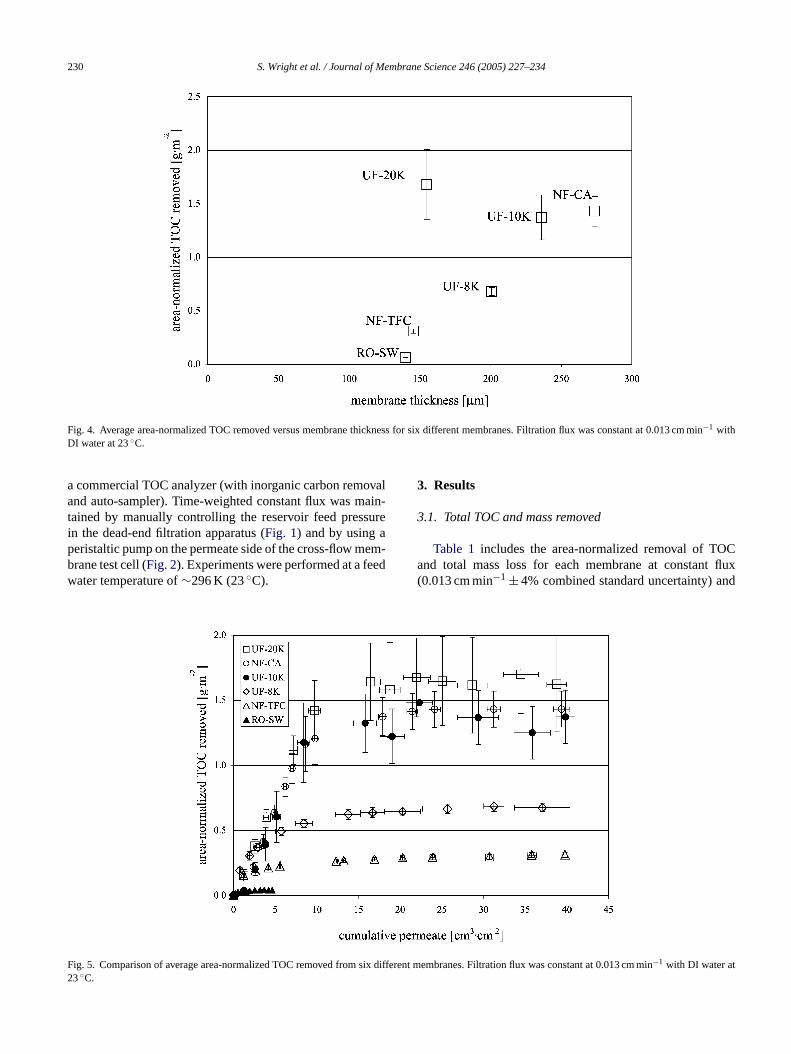
Fig. 4. Average area-normalized TOC removed versus membrane thickness for six different membranes. Filtration flux was constant at 0.013 cm min−1 withDI water at 23◦C.
a commercial TOC analyzer (with inorganic carbon removaland auto-sampler). Time-weighted constant flux was main-tained by manually controlling the reservoir feed pressurein the dead-end filtration apparatus (Fig. 1) and by using aperistaltic pump on the permeate side of the cross-flow mem-brane test cell (Fig. 2). Experiments were performed at a feedwater temperature of∼296 K (23◦C).
3. Results
3.1. Total TOC and mass removed
Table 1 includes the area-normalized removal of TOCand total mass loss for each membrane at constant flux(0.013 cm min−1 ± 4% combined standard uncertainty) and
F ix diffe2
ig. 5. Comparison of average area-normalized TOC removed from s3◦C.
rent membranes. Filtration flux was constant at 0.013 cm min−1 with DI water at
S. Wright et al. / Journal of Membrane Science 246 (2005) 227–234 231
temperature (23◦C± 5%). The results show that TOC is gen-erally only 3% (NF-CA and UF-10K) to 27% (NF-TFC) ofthe total mass removed per unit area. This indicates that or-ganic carbon was a relatively small fraction of the materialreleased during our measurements. No further work was per-formed to identify the specific composition of the humec-tants since our focus was simply to identify the best protocolfor removing them. It is possible that inorganic species arealso present in the membrane and, of course, the humectantmolecules probably include significant amounts of oxygenand nitrogen, and possibly, sulfur.
Fig. 3presents the area-normalized TOC removed versusthe manufacturers’ reported membrane MWCO. Excludingthe NF-CA membrane, there appears to be a direct corre-lation between MWCO and the area-normalized TOC re-moved. This may be attributed to greater pore volume as-sociated with materials of higher MWCO. The NF-CA was
also the thickest membrane studied. Consequently, its higheravailable volume (to fill with humectant) may account for itssubstantially greater release versus that of the other mem-branes (e.g., NF-TFC) with similar MWCO.Fig. 4presentsa similar view of the area-normalized TOC removed, but thistime against measured membrane thickness. Excluding theUF-20K membrane, there again is a direct correlation be-tween membrane thickness and humectant release. The UF-20K had the largest MWCO of the membranes studied. Al-though it was thinner by approximately 43 and 34% thanthe NF-CA and UF-10K membranes, respectively, it had thesame amount (within measurement uncertainty) of TOC re-moved during membrane cleaning. Conversely, the UF-20Khas a 40 times greater MWCO than that of the NF-CA and50% greater than that of the UF-10K membranes. Thus, theintuitive argument is supported that a greater volume of openpore area correlates with the total humectant released.
Ff
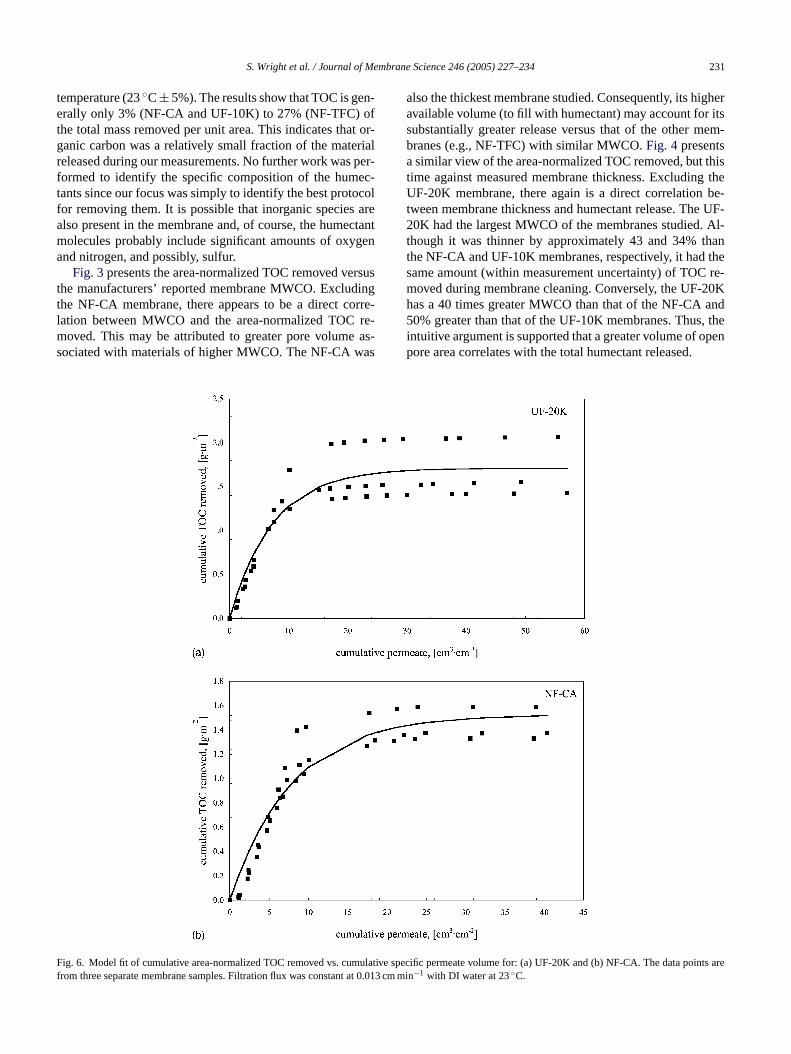
ig. 6. Model fit of cumulative area-normalized TOC removed vs. cumulativerom three separate membrane samples. Filtration flux was constant at 0.01
specific permeate volume for: (a) UF-20K and (b) NF-CA. The data points are3 cm min−1 with DI water at 23◦C.
232 S. Wright et al. / Journal of Membrane Science 246 (2005) 227–234
3.2. Mass transfer aspects of TOC removal
Fig. 5 reports theaverage(of three separate replicates)area-normalized TOC removed versusaveragecumulativepermeate volume (per unit membrane area) collected for thesix membrane types studied under constant flux and tem-perature. The standard deviations in sampling times betweeneach of the three replicates is reflected in thex-axis uncer-tainty bars, while variations in the TOC removed in that av-erage interval are included in they-uncertainty bars.Fig. 5clearly shows that different membranes (for example, UF-20K versus NF-TFC) will require different area-normalizedvolumes of DI water to permeate before one can be certainthat residual carbon-based humectant will not influence fur-ther bench-scale studies. In general, the results confirm thata thick membrane and/or a membrane with a relatively highMWCO is capable of retaining a larger amount of humectant.Ensuring that most of the carbon-based humectant is removedprior to transport and/or rejection studies may require moni-toring organic carbon during membrane cleaning.
Table 2presents the fitting parameters for the removalof humectant from the membranes modeled as two volumesin series (nominally the separating layer and the support).The total mass/area of humectant permeated over time,Mt(g/cm2), is related to the total volume/area permeated,Vp( 3 2
M
M OCrh
Table 2Empirical model fitting parameters for Eq.(1)
Code Material M∞ (g/m2) l (cm) θ (−)
RO-SW Polyamide-TFC 0.0588 1.1226 0.0092NF-TFC Polyamide-TFC 0.3106 3.2824 0.0010UF-8K Sulfonated polyimide 0.6735 3.8683 0.0064UF-10K Regenerated cellulose 1.4973 9.2238 0.0080NF-CA Cellulose acetate 1.527 7.9597 0.0048UF-20K Sulfonated PES 1.7090 7.2668 0.0048
Note: The uncertainty on the fitting parametersM∞ and l were∼1–5 and8–15%, respectively. The parameterθ has uncertainties >100%, but did im-prove the overall qualitative fit.
respectively, whish is related to its overall time constant be-cause the permeation rate is constant, but which also includesinternal mass transfer dynamics that can be quite complex.We intuitively chose Eq.(1) for convenience in quantitativelyrepresenting the kinetic response since a detailed mechanis-tic model of humectant extraction was beyond the scope ofthis communication. We fitted the data for all the replicates(for a single membrane type) to more fully represent the un-certainty from any single measurement. The characteristiclength parameter governs the rate at which complete desorp-tion occurs (the lower this value the faster the desorption).In the simplest sense, this length parameter would be equalto the membrane’s thickness and porosity. In fact, the fittedlandlθ parameters are orders of magnitude greater than theseintuitive physical quantities could ever be, thus lending con-firmation to the role of other rate processes besides simplemixing. The parameterθ was differentially weighted versusVp andl to achieve a better balance of the fitted line throughthe entire data set.
F rane. O x(
cm /cm ), by the equation:
t = M∞[1 − exp
(−Vp
l
)− Vp
lθexp
(−Vp
lθ
)]. (1)
∞ is a fitting constant related to the total amount of Teleased (g/cm2) andθ another fitting parameter (−). Eachypothetical volume has a characteristic length (cm),l andlθ,
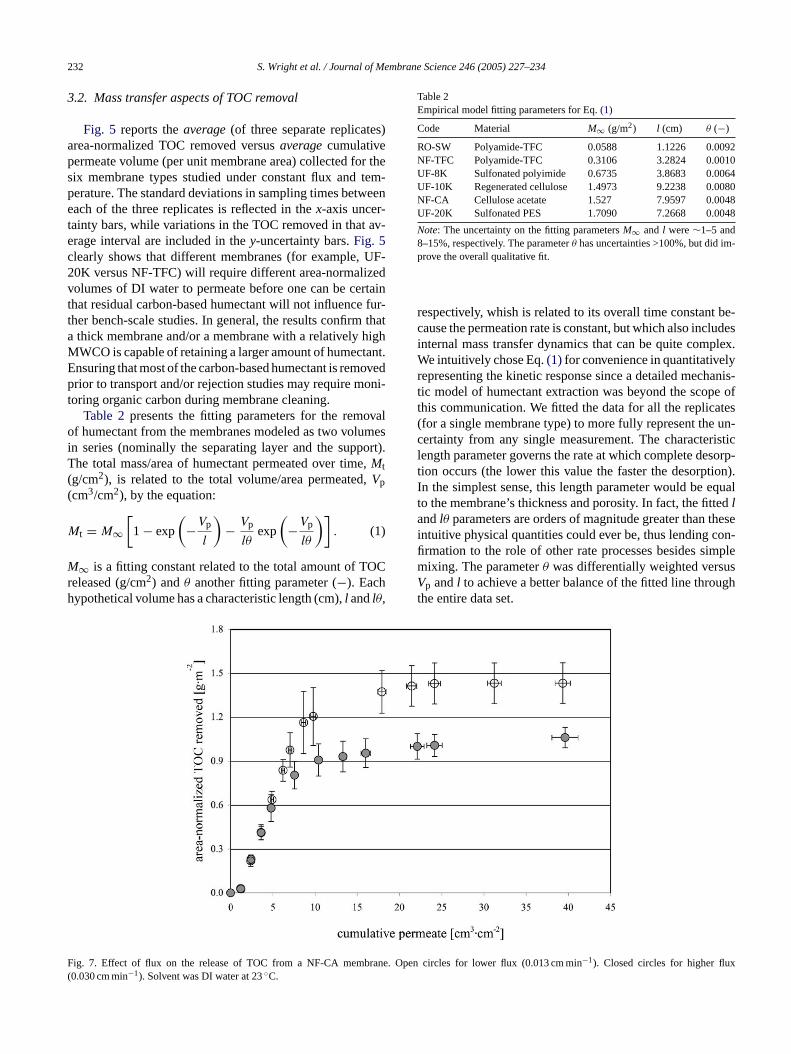
ig. 7. Effect of flux on the release of TOC from a NF-CA memb0.030 cm min−1). Solvent was DI water at 23◦C.
pen circles for lower flux (0.013 cm min−1). Closed circles for higher flu
S. Wright et al. / Journal of Membrane Science 246 (2005) 227–234 233
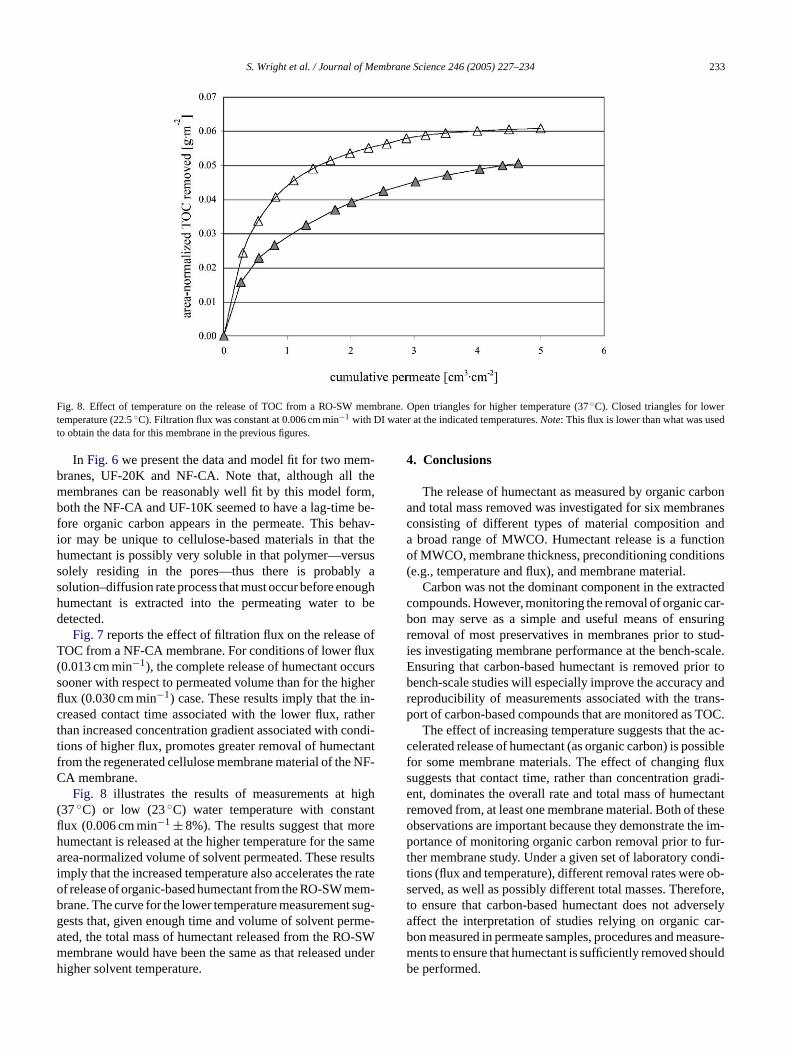
Fig. 8. Effect of temperature on the release of TOC from a RO-SW membrane. Open triangles for higher temperature (37◦C). Closed triangles for lowertemperature (22.5◦C). Filtration flux was constant at 0.006 cm min−1 with DI water at the indicated temperatures.Note: This flux is lower than what was usedto obtain the data for this membrane in the previous figures.
In Fig. 6we present the data and model fit for two mem-branes, UF-20K and NF-CA. Note that, although all themembranes can be reasonably well fit by this model form,both the NF-CA and UF-10K seemed to have a lag-time be-fore organic carbon appears in the permeate. This behav-ior may be unique to cellulose-based materials in that thehumectant is possibly very soluble in that polymer—versussolely residing in the pores—thus there is probably asolution–diffusion rate process that must occur before enoughhumectant is extracted into the permeating water to bedetected.
Fig. 7reports the effect of filtration flux on the release ofTOC from a NF-CA membrane. For conditions of lower flux(0.013 cm min−1), the complete release of humectant occurssooner with respect to permeated volume than for the higherflux (0.030 cm min−1) case. These results imply that the in-creased contact time associated with the lower flux, ratherthan increased concentration gradient associated with condi-tions of higher flux, promotes greater removal of humectantfrom the regenerated cellulose membrane material of the NF-CA membrane.
Fig. 8 illustrates the results of measurements at high(37◦C) or low (23◦C) water temperature with constantflux (0.006 cm min−1 ± 8%). The results suggest that morehumectant is released at the higher temperature for the samea sultsi e rateo em-b t sug-g rme-a -SWm undeh
4. Conclusions
The release of humectant as measured by organic carbonand total mass removed was investigated for six membranesconsisting of different types of material composition anda broad range of MWCO. Humectant release is a functionof MWCO, membrane thickness, preconditioning conditions(e.g., temperature and flux), and membrane material.
Carbon was not the dominant component in the extractedcompounds. However, monitoring the removal of organic car-bon may serve as a simple and useful means of ensuringremoval of most preservatives in membranes prior to stud-ies investigating membrane performance at the bench-scale.Ensuring that carbon-based humectant is removed prior tobench-scale studies will especially improve the accuracy andreproducibility of measurements associated with the trans-port of carbon-based compounds that are monitored as TOC.
The effect of increasing temperature suggests that the ac-celerated release of humectant (as organic carbon) is possiblefor some membrane materials. The effect of changing fluxsuggests that contact time, rather than concentration gradi-ent, dominates the overall rate and total mass of humectantremoved from, at least one membrane material. Both of theseobservations are important because they demonstrate the im-portance of monitoring organic carbon removal prior to fur-t ndi-t ob-s fore,t erselya car-b asure-m ouldb
rea-normalized volume of solvent permeated. These remply that the increased temperature also accelerates thf release of organic-based humectant from the RO-SW mrane. The curve for the lower temperature measuremenests that, given enough time and volume of solvent peted, the total mass of humectant released from the ROembrane would have been the same as that releasedigher solvent temperature.
r
her membrane study. Under a given set of laboratory coions (flux and temperature), different removal rates wereerved, as well as possibly different total masses. Thereo ensure that carbon-based humectant does not advffect the interpretation of studies relying on organicon measured in permeate samples, procedures and meents to ensure that humectant is sufficiently removed she performed.
234 S. Wright et al. / Journal of Membrane Science 246 (2005) 227–234
The results presented in this paper can be used as gen-eral guidelines for establishing terminal criteria for releaseof humectant from membranes. Monitoring removal of or-ganic carbon can serve as a potential surrogate for removalof total humectant and form the basis for a standard methodof membrane preconditioning prior to bench-scale investi-gations. In the absence of TOC monitoring capability, ourmeasurements indicate that using room-temperature deion-ized water as the solvent at a flux of∼0.013 cm min−1, allthe TOC is removed after permeation of∼40 cm3 cm−2.
Acknowledgements
This work was supported by a grant from the U.S. ArmyWater Quality and Treatment Center, a National Center forWater Treatment Technologies, located in Warren, Michigan,USA.
References
[1] Information Paper: Ultrafiltration Disc Membranes for Stirred Cellsand Micropartition System (MPS), Millipore Corporation, Bedford,MA, 1998. http://www.millipore.com.
[2] T.D. Waite, A.I. Schafer, A.G. Fane, A. Heuer, Colloidal fouling ofultrafiltration membranes: impact of aggregate structure and size, J.Colloid Interf. Sci. 212 (1999) 264–274.
[3] J. Cho, G. Amy, J. Pellegrino, Y. Yoon, Characterization of clean andnatural organic matter (NOM) fouled NF and UF membranes, andfoulants characterization, Desalination 118 (1998) 101–108.
[4] M. Chapman Wilbert, S. Delagah, J. Pellegrino, Variance of streamingpotential measurements, J. Membr. Sci. 161 (1999) 247–261.
[5] K.J. Kim, A.G. Fane, M. Nystrom, A. Pihlajamaki, W.R. Bowen, H.Mukhtar, Evaluation of electroosmosis and streaming potential formeasurement of electric charges of polymeric membranes, J. Membr.Sci. 116 (1996) 149–159.
[6] M. Elimelech, A.E. Childress, Zeta potential of reverse osmosis mem-branes: implications for membrane performance, Water TreatmentTechnology Program Report No. 10. U.S. Bureau of Reclamation,1996.http://www.usbr.gov/pmts/water/media/pdfs/report010.pdf.


![ABA increases [Ca 2+ ] cyto influx through plasma membrane or release from internal compartments](https://img.pdfslide.us/doc/110x75/56814897550346895db5ae14/aba-increases-ca-2-cyto-influx-through-plasma-membrane-or-release-from-5697fd6181365.jpg)


![Lecture 17 Membrane separations - CHERIC · Lecture 17. Membrane Separations [Ch. 14] •Membrane Separation •Membrane Materials •Membrane Modules •Transport in Membranes-Bulk](https://img.pdfslide.us/doc/110x75/5e688f368fbb145949438f76/lecture-17-membrane-separations-cheric-lecture-17-membrane-separations-ch-14.jpg)