Embed Size (px)
Citation preview

TORDNIOWater
HUMBER TREATMENT PLANT
2018 Annual Report
March 28, 2019

~~ TORONTO Water CITY OF TORONTO WASTEWATER TREATMENT PLANT
ANNUAL REPORTS
HUMBER TREATMENT PLANT 2018 ANNUAL REPORT
EXECUTIVE SUMMARY
The Humber Treatment Plant (HTP) is one of four wastewater treatment facilities operated by the City of Toronto. This facility, located at 130 The Queensway, has a rated capacity of 473,000 m3/day or 473 ML/day, and serves an equivalent population of approximately 685,000. Humber Treatment Plant discharges into Lake Ontario and operates under Amended Environmental Compliance Approval No. 9032-ABZNYQ, issued on July 21, 2016.
The average daily flow rate in 2018 was 286.1 ML/day. Influent concentrations of Biochemical Oxygen Demand (BOD), Total Phosphorus (TP) and Total Suspended Solids (TSS) averaged 247.8 mg/L, 5.2 mg/L and 280.8 mg/L, respectively.
Humber Treatment Plant achieved the following effluent quality and loading rates in 2018 in comparison to ECA limits:
ECA1 2018 Final Effluent Total Suspended Solids (TSS) 25.0 mg/L 11.0 mg/L Carbonaceous Biochemical Oxygen Demand (CBOD5)
25.0 mg/L 5.9 mg/L
Total Phosphorus (TP) 1.0 mg/L 0.6 mg/L Escherichia Coli (E. Coli)2 200 CFU/100mL 68 CFU/100 mL pH 6.0-9.5 7.0 Total Residual Chlorine (TRC) (i.e. Dechlorination)
0.02 mg/L 0.010 mg/L
TP Loading Rate 473.0 kg/day 177.8 kg/day 1 Referenced from Condition 6 and 7 of ECA No. 9032-ABZNYQ, issued on July 21, 2016. 2 Arithmetic mean of monthly geometric mean data.
Sludge generated at the Humber Treatment Plant is transferred to the Ashbridges Bay Treatment Plant via the Mid-Toronto Interceptor (MTI) for further treatment and disposal. During 2018, an average of 4,208 m3/day of waste activated sludge was removed from the system. Of this, 3697 m3/day was thickened and stabilized prior to transfer and 511 m3/day was transferred directly. An average of 78 dry tonnes of biosolids and waste activated sludge was transferred per day.
Ferrous chloride consumption for phosphorus removal was 6.84 tonnes as iron (Fe) per 1000ML wastewater treated. There was no polymer consumption for waste activated sludge (WAS) thickening. Total sodium hypochlorite (12% w/v) consumption for disinfection totalled 42.54 per 1000 ML. Sodium Bisulphite (SBS) (38% w/w) consumption for effluent dechlorination totalled 5.55 m3 per 1000 ML.
- i -

~~ TORONTO Water CITY OF TORONTO WASTEWATER TREATMENT PLANT
ANNUAL REPORTS
HUMBER TREATMENT PLANT 2018 ANNUAL REPORT
There were 17 bypass occurrences in 2018 where each occurrence received preliminary, primary treatment, nutrient removal, as well as disinfection before being blended with fully treated plant effluent and exiting the plant through the plant outfall, upstream of the final effluent sampling point.
The plant continued with various capital projects. Notable projects included: PLC Migration, Secondary Treatment Upgrades, West Substation Upgrades, Operations Centre Upgrades, Cogeneration Facility, Odour Control Phase 1 Implementation, Digester 9 and 10 Cleaning and Upgrades, HVAC Upgrades, Premise Isolation Installation, Primary Pumping and Scum Systems Upgrades, and Waste Gas Burner Upgrades. A variety of scheduled, preventative, predictive and reactive maintenance activities was performed, including annual calibration of effluent monitoring equipment.
Total annual consumption of potable water, hydro, and natural gas was 401,173 m3, 48.7M kWh, and 2.8M scm, respectively. Plant direct operating cost for 2018 totalled $19.0M. In 2018, the Humber Treatment Plant had a staffing compliment of 60.5 employees. As of December 31st, 2018, there were four health and safety incidents and a total of five lost time days in 2018 due to work related injuries.
- ii -

~~ TORONTO Water CITY OF TORONTO WASTEWATER TREATMENT PLANT
ANNUAL REPORTS
HUMBER TREATMENT PLANT 2018 ANNUAL REPORT
TABLE OF CONTENTS
EXECUTIVE SUMMARY ..................................................................................................................... i TABLE OF CONTENTS.......................................................................................................................iii
GLOSSARY OF ABREVIATIONS AND DEFINITIONS............................................................................v
1 INTRODUCTION ....................................................................................................................... 1
2 PLANT PROCESS OVERVIEW .................................................................................................... 2
2.1 Influent ............................................................................................................................. 2
2.2 Preliminary Treatment ..................................................................................................... 2
2.3 Primary Treatment ........................................................................................................... 2
2.4 Secondary Treatment....................................................................................................... 2
2.5 Final Effluent .................................................................................................................... 3
2.6 Solids Handling ................................................................................................................. 3
3 PROCESS SUMMARY................................................................................................................ 5
3.1 Process Parameters.......................................................................................................... 5
3.2 Biosolids Management..................................................................................................... 7
3.3 Chemical Usage ................................................................................................................ 7
3.4 Bypasses, Overflows, Spills, and Abnormal Discharge Events ......................................... 8
3.4.1 Bypasses.................................................................................................................... 8
3.4.2 Overflows .................................................................................................................. 9
3.4.3 Spills .......................................................................................................................... 9
3.4.4 Abnormal Discharge Events .................................................................................... 10
3.5 Complaints...................................................................................................................... 10
3.6 Effluent Quality Assurance and Control Measures........................................................ 10
3.7 Odour Reduction Plan .................................................................................................... 11
4 CAPITAL PROJECTS................................................................................................................. 12
5 MAINTENANCE ...................................................................................................................... 14
6 UTILITIES ................................................................................................................................ 15
7 ADMINISTRATION.................................................................................................................. 17 - iii -

~~ TORONTO Water CITY OF TORONTO WASTEWATER TREATMENT PLANT
ANNUAL REPORTS
HUMBER TREATMENT PLANT 2018 ANNUAL REPORT
7.1 Operations and Maintenance Costs............................................................................... 17
7.2 Human Resources........................................................................................................... 18
7.3 Occupational Health & Safety ........................................................................................ 18
7.4 Staff Training and Development .................................................................................... 19
7.5 Utility Operator Certification ......................................................................................... 20
7.6 MECP/MOL Correspondence ......................................................................................... 20
APPENDICIES APPENDIX A – Plant Schematic APPENDIX B – Influent and Effluent 2018 Performance Charts APPENDIX C – Historical Performance Data APPENDIX D – Influent and Effluent Metal Concentrations APPENDIX E – Digested Sludge Analysis APPENDIX F – Odour Reduction Plan APPENDIX G – Maintenance Activities APPENDIX H – Staff Training Courses
LIST OF TABLES
Table 1: Final Effluent Parameters.................................................................................................. 5 Table 2: Process Summary .............................................................................................................. 6 Table 3: Chemical Usage and Chemical Cost Summary per 1000 ML Treated............................... 8 Table 4: Bypass Summary ............................................................................................................... 9 Table 5: Spills Summary ................................................................................................................ 10 Table 6: Capital Projects ............................................................................................................... 12 Table 7: Summary of Regulated Monitoring Equipment Calibration and Maintenance.............. 14 Table 8: Average Unit and Total Utility Cost................................................................................. 15 Table 9: Plant Staffing ................................................................................................................... 18 Table 10: Wastewater Treatment Certificates ............................................................................. 20 Table 11: Correspondence submitted to the MECP and MOL...................................................... 20
LIST OF FIGURES
Figure 1: Annual Utility Consumption (Water, Hydro, Gas) ......................................................... 15 Figure 2: Operations and Maintenance Cost Breakdown............................................................. 17 Figure 3: Humber Treatment Plant Health & Safety Injury Summary.......................................... 19
- iv -

~~ TORONTO Water CITY OF TORONTO WASTEWATER TREATMENT PLANT
ANNUAL REPORTS
HUMBER TREATMENT PLANT 2018 ANNUAL REPORT
GLOSSARY OF ABREVIATIONS AND DEFINITIONS
AAC Annual Average Concentration BOD5 Five-Day Biochemical Oxygen Demand CBOD5 Five-Day Carbonaceous Biochemical Oxygen Demand CEU Continuing Education Units CFU Colony Forming Units DAF Dissolved Air Flotation E. Coli Escherichia Coli ECA Environmental Compliance Approval Fe Iron HTP Humber Treatment Plant HP Horsepower HRT Hydraulic Retention Time kg kilogram kWh Kilowatt-hour MAC Monthly Average Concentration MGMD Monthly Geometric Mean Concentration MWh Megawatt-hour m3 Cubic metre m3 /day Cubic metre per day mA Milliamps mg/L Milligrams per litre mL Millilitre ML Megalitre (million litres) MECP Ministry of the Environment, Conservation and Parks Q Flow Rate RAS Return Activated Sludge SBS Sodium Bisulphite SBS (P) Sodium Bisulphite Presence scm Standard Cubic Metres SS Suspended Solids TRC Total Residual Chlorine TP Total Phosphorus TRS Total Residual Sulphate TS Total Solids TSS Total Suspended Solids TVS Total Volatile Solids TWAS Thickened Waste Activated Sludge μg/L Micrograms per litre WAS Waste Activated Sludge
- v -

~~ TORONTO Water CITY OF TORONTO WASTEWATER TREATMENT PLANT
ANNUAL REPORTS
HUMBER TREATMENT PLANT 2018 ANNUAL REPORT
Definitions
Bypass: A bypass is defined as a diversion of sewage around one or more unit processes within the plant with the diverted sewage flows being returned to the plant treatment train upstream of the final effluent sampling location, and discharging to the environment through the plant outfall.
Overflow: An overflow is defined as a discharge to the environment from the plant at a location other than the plant outfall downstream of the final effluent sampling station.
Spill: A spill is defined within the meaning of Part X of the Environmental Protection Act. "Spill", when used in reference to a pollutant, means a discharge,
a) into the natural environment, b) from or out of a structure, vehicle or other container, and c) that is abnormal in quality or quantity in light of the discharge.
Abnormal Discharge: A discharge of a pollutant designated by the regulations at a location designated by the regulations shall be deemed to be in a quantity or with a quality abnormal at the location. R.S.O. 1990, c. E.19, s. 91 (2).
𝑘𝑘𝐿𝐿 𝑚𝑚𝐿𝐿 𝑀𝑀𝐿𝐿 𝐿𝐿𝐿𝐿𝐿𝐿𝐿𝐿𝐿𝐿𝐿𝐿𝐿𝐿 � � = 𝐶𝐶𝐿𝐿𝐿𝐿𝐶𝐶𝐶𝐶𝐿𝐿𝐶𝐶𝐶𝐶𝐿𝐿𝐶𝐶𝐿𝐿𝐿𝐿𝐿𝐿 � � × 𝐹𝐹𝐹𝐹𝐿𝐿𝐹𝐹 � �
𝐿𝐿𝐿𝐿𝑑𝑑 𝐿𝐿 𝐿𝐿𝐿𝐿𝑑𝑑
𝐶𝐶𝐿𝐿𝐿𝐿𝐶𝐶𝐶𝐶𝐿𝐿𝐶𝐶𝐶𝐶𝐿𝐿𝐶𝐶𝐿𝐿𝐿𝐿𝐿𝐿 (𝐹𝐹𝐿𝐿𝐿𝐿𝐿𝐿𝐹𝐹)𝑃𝑃𝐶𝐶𝐶𝐶𝐶𝐶𝐶𝐶𝐿𝐿𝐶𝐶 𝑅𝑅𝐶𝐶𝑚𝑚𝐿𝐿𝑅𝑅𝐿𝐿𝐹𝐹 (%) = 1 −
𝐶𝐶𝐿𝐿𝐿𝐿𝐶𝐶𝐶𝐶𝐿𝐿𝐶𝐶𝐶𝐶𝐿𝐿𝐶𝐶𝐿𝐿𝐿𝐿𝐿𝐿 (𝐼𝐼𝐿𝐿𝐿𝐿𝐶𝐶𝐿𝐿𝐿𝐿𝐹𝐹)
𝑘𝑘𝐿𝐿 𝐶𝐶𝑐𝑐𝑐𝑐𝑐𝑐 (𝑄𝑄𝑃𝑃𝑃𝑃𝑃𝑃𝑃𝑃𝑃𝑃𝑃𝑃𝑃𝑃 𝐸𝐸𝐸𝐸𝐸𝐸𝐸𝐸𝐸𝐸𝐸𝐸𝐸𝐸𝐸𝐸 + 𝑄𝑄𝑅𝑅𝑅𝑅𝑅𝑅) × [𝐶𝐶𝑐𝑐𝑐𝑐𝑐𝑐5𝑝𝑝𝑃𝑃𝑃𝑃𝑃𝑃𝑃𝑃𝑃𝑃𝑃𝑃 𝐸𝐸𝐸𝐸𝐸𝐸𝐸𝐸𝐸𝐸𝐸𝐸𝐸𝐸𝐸𝐸 ]𝐴𝐴𝐶𝐶𝐶𝐶𝐿𝐿𝐶𝐶𝐿𝐿𝐿𝐿𝐿𝐿 𝐿𝐿𝐿𝐿𝐿𝐿𝐿𝐿𝐿𝐿𝐿𝐿𝐿𝐿 = � � = 𝑚𝑚3 𝐿𝐿𝐶𝐶𝐶𝐶𝐿𝐿𝐶𝐶𝐿𝐿𝐿𝐿𝐿𝐿 𝐶𝐶𝐿𝐿𝑐𝑐𝐿𝐿𝐶𝐶𝐿𝐿𝐶𝐶𝑑𝑑 𝑉𝑉𝑃𝑃𝐸𝐸𝑃𝑃𝑃𝑃𝐸𝐸𝑃𝑃𝑎𝑎𝐸𝐸 𝑇𝑇𝑃𝑃𝐸𝐸𝑇𝑇𝑇𝑇
𝐶𝐶𝐶𝐶𝐿𝐿𝐶𝐶𝐶𝐶𝐿𝐿𝐶𝐶𝐶𝐶𝐿𝐿𝐶𝐶 𝐹𝐹𝐶𝐶𝐶𝐶𝐿𝐿 𝑇𝑇𝑆𝑆 − 𝐶𝐶𝐶𝐶𝐿𝐿𝐶𝐶𝐶𝐶𝐿𝐿𝐶𝐶𝐶𝐶 𝑇𝑇𝑆𝑆𝑆𝑆 𝑆𝑆𝐿𝐿𝐹𝐹𝐿𝐿𝐿𝐿𝑆𝑆 𝐶𝐶𝐿𝐿𝑐𝑐𝐶𝐶𝐶𝐶𝐶𝐶𝐶𝐶 (%) = × 100
𝐶𝐶𝐶𝐶𝐿𝐿𝐶𝐶𝐶𝐶𝐿𝐿𝐶𝐶𝐶𝐶𝐿𝐿𝐶𝐶 𝐹𝐹𝐶𝐶𝐶𝐶𝐿𝐿 𝑇𝑇𝑆𝑆
- vi -

~~ TORONTO Water CITY OF TORONTO WASTEWATER TREATMENT PLANT
ANNUAL REPORTS
HUMBER TREATMENT PLANT 2018 ANNUAL REPORT
1 INTRODUCTION
The Humber Treatment Plant is one of four wastewater treatment facilities operated by the City of Toronto under the responsibility of the Wastewater Treatment section of Toronto Water. The facility is located at 130 The Queensway, on the border of the old City of Toronto and former City of Etobicoke near the mouth of the Humber River. This area contains an estimated connected population of 685,000. The Humber Treatment Plant has a rated capacity of 473,000 m3 per day or 473 ML/day.
Major treatment processes and equipment include screening and grit removal, primary treatment, secondary treatment, phosphorus removal with ferrous chloride, final effluent disinfection using sodium hypochlorite, and final effluent dechlorination using sodium bisulphite. Solids handling processes include stabilization by anaerobic digestion. The solids stabilized in these processes are primary (or raw) sludge as well as waste activated sludge thickened using high speed centrifuges. Treated effluent is discharged to Lake Ontario. Sludge (stabilized and non-thickened waste activated sludge) is transferred to the Ashbridges Bay Treatment Plant for disposal via the Mid-Toronto Interceptor (MTI). Numerous auxiliary systems are required for the proper operation of plant processes and include potable water, process water, HVAC, SCADA, electrical power distribution, natural gas, and, instrument air. Odour control is achieved by treating air through biofilters and granular activated carbon (GAC) filters located throughout the plant.
The Ministry of the Environment, Conservation and Parks (MECP) has classified the Humber Treatment Plant as a Class IV wastewater treatment facility under Regulation 129/04. The facility operates under Amended Environmental Compliance Approval No. 9032-ABZNYQ (July 21, 2016).
This report is a summary of plant operations and performance in 2018. Highlights of the report include a discussion of effluent quality and summaries of plant operations and maintenance, chemical and utility consumption, capital projects, operational costs and human resources.
1
~~ TORONTO Water CITY OF TORONTO WASTEWATER TREATMENT PLANT
ANNUAL REPORTS
HUMBER TREATMENT PLANT 2018 ANNUAL REPORT
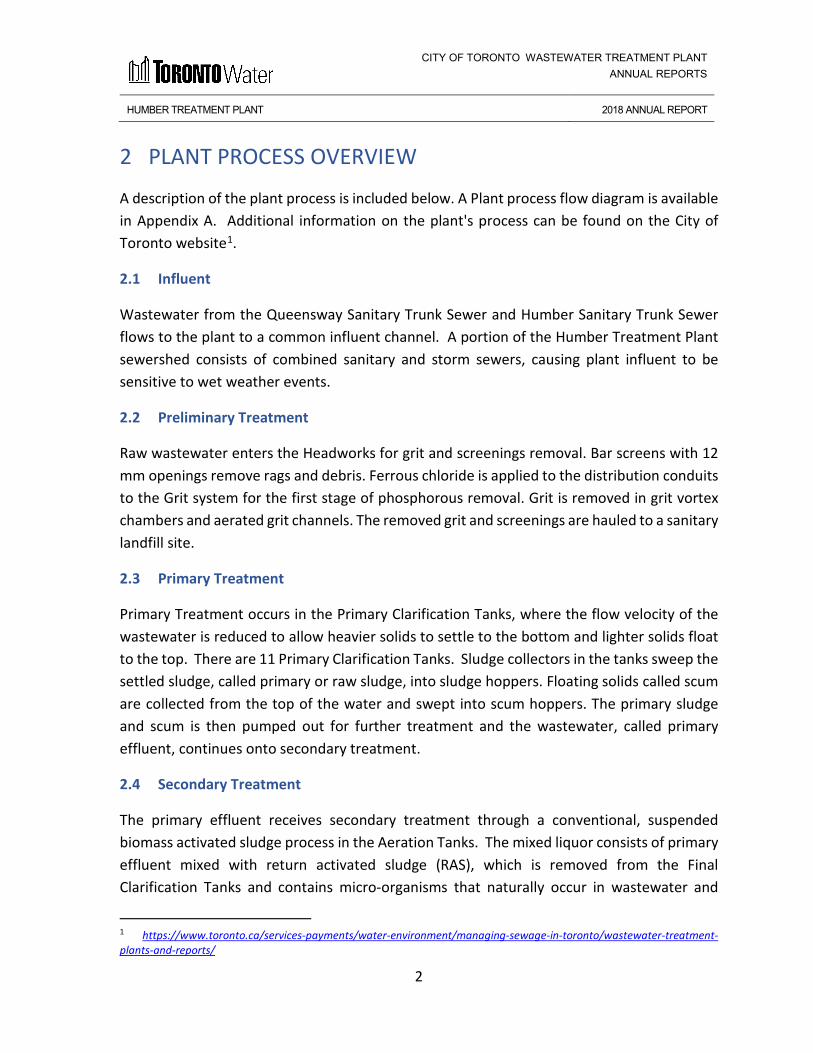
2 PLANT PROCESS OVERVIEW
A description of the plant process is included below. A Plant process flow diagram is available in Appendix A. Additional information on the plant's process can be found on the City of Toronto website1.
2.1 Influent
Wastewater from the Queensway Sanitary Trunk Sewer and Humber Sanitary Trunk Sewer flows to the plant to a common influent channel. A portion of the Humber Treatment Plant sewershed consists of combined sanitary and storm sewers, causing plant influent to be sensitive to wet weather events.
2.2 Preliminary Treatment
Raw wastewater enters the Headworks for grit and screenings removal. Bar screens with 12 mm openings remove rags and debris. Ferrous chloride is applied to the distribution conduits to the Grit system for the first stage of phosphorous removal. Grit is removed in grit vortex chambers and aerated grit channels. The removed grit and screenings are hauled to a sanitary landfill site.
2.3 Primary Treatment
Primary Treatment occurs in the Primary Clarification Tanks, where the flow velocity of the wastewater is reduced to allow heavier solids to settle to the bottom and lighter solids float to the top. There are 11 Primary Clarification Tanks. Sludge collectors in the tanks sweep the settled sludge, called primary or raw sludge, into sludge hoppers. Floating solids called scum are collected from the top of the water and swept into scum hoppers. The primary sludge and scum is then pumped out for further treatment and the wastewater, called primary effluent, continues onto secondary treatment.
2.4 Secondary Treatment
The primary effluent receives secondary treatment through a conventional, suspended biomass activated sludge process in the Aeration Tanks. The mixed liquor consists of primary effluent mixed with return activated sludge (RAS), which is removed from the Final Clarification Tanks and contains micro-organisms that naturally occur in wastewater and
1 https://www.toronto.ca/services-payments/water-environment/managing-sewage-in-toronto/wastewater-treatment-plants-and-reports/
2

~~ TORONTO Water CITY OF TORONTO WASTEWATER TREATMENT PLANT
ANNUAL REPORTS
HUMBER TREATMENT PLANT 2018 ANNUAL REPORT
facilitate its degradation. In the presence of oxygen, these micro-organisms break down organic material in the wastewater. Air is supplied to the Aeration Tanks through nine electrically driven blowers. There are a total of eight Aeration Tanks each equipped with fine bubble dome diffusers. Ferrous chloride is applied at the end of the aeration tanks prior to the Final Clarification Tanks for the second and final stage of phosphorous removal.
The mixed liquor from the Aeration Tanks flows to 21 large quiescent Final Clarification Tanks, where the Activated Sludge is allowed to settle. A controlled quantity of this sludge is returned to the Aeration Tanks as RAS in order to maintain a sufficient biomass concentration. The excess is removed as Waste Activated Sludge (WAS) and thickened using centrifuges.
2.5 Final Effluent
Sodium Hypochlorite is used to disinfect and kill pathogens in the final effluent. Sodium Bisulphite (SBS) is added after disinfection to remove excess chlorine (dechlorinate) from the wastewater; helping to protect the aquatic environment. The final effluent is discharged to Lake Ontario. The plant uses direct measurement of Total Residual Chlorine (TRC) in the final effluent for monitoring and compliance.
2.6 Solids Handling
Primary sludge and scum, from the Primary Clarification Tanks, is first fed into primary anaerobic digesters. Secondary sludge (WAS), from the Secondary Clarification Tanks, is thickened through centrifugation before it is also fed into primary digesters, where it undergoes the same process as primary sludge. Centrifugation reduces the volume of sludge by separating solids from liquid. The Thickening process consists of seven centrifuges. Unthickened WAS may also be pumped directly to the Ashbridges Bay Treatment Plant via the MTI.
Anaerobic digestion is the biological degradation (stabilization) of organic materials (sludge and scum) in the absence of oxygen – it reduces volume of solids, destroys pathogens and mitigates sludge odour. The process produces digester gas, made up predominantly of methane. This gas is used as a supplementary fuel for plant needs, including process and space heating and the generation of electricity via two cogeneration engines, thereby reducing the plant's operating costs and carbon footprint. The digesters are operated in the mesophilic temperature range (34 – 38oC). The target operating temperature for the digesters is 36oC.
3

~~ TORONTO Water CITY OF TORONTO WASTEWATER TREATMENT PLANT
ANNUAL REPORTS
HUMBER TREATMENT PLANT 2018 ANNUAL REPORT
The resulting anaerobically digested sludge (biosolids) is subsequently transferred to the secondary digesters for storage, until it is ultimately transferred to the Ashbridges Bay Treatment Plant via the MTI for further treatment.
4

-
~~ TORONTO Water CITY OF TORONTO WASTEWATER TREATMENT PLANT
ANNUAL REPORTS
HUMBER TREATMENT PLANT 2018 ANNUAL REPORT
3 PROCESS SUMMARY
3.1 Process Parameters
In 2018, the Humber Treatment Plant continued to produce a high quality effluent. A summary of key final effluent parameters against the ECA objectives and limits are shown in Table 1. Regulated parameters are highlighted. Influent and effluent performance charts are available in Appendix B. Historical performance data is included in Appendix C.
Table 1: Final Effluent Parameters
Parameter cBOD5
(mg/L) TSS (mg/L)
TP (mg/L) TRC (mg/L) E Coli (count/ 100mL)
January 7.0 10.0 0.8 0.008 136 February 6.0 8.0 0.6 0.009 55
March 6.0 10.0 0.6 0.010 68
April 8.3 11.9 0.5 0.013 80 May 5.0 9.0 0.5 0.014 52 June 5.0 10.0 0.6 0.014 24 July 5.0 11.0 0.7 0.010 50 August 5.0 12.4 0.6 0.017 67 September 5.0 18.0 0.7 0.006 92 October 5.0 10.0 0.8 0.011 28 November 6.0 10.0 0.5 0.007 55 December 7.0 12.0 0.6 0.006 106 Annual Average 5.9 11.0 0.6 0.010 68
Loading (kg/d) 1 1,678 3,157 177.8 N/A N/A Removal Efficiency2 (%) 97% 96% 88% N/A N/A
ECA Requirements3, 4, 5
Effluent Objective AAC: 15.0mg/L
AAC: 15.0 mg/L
MAC: 0.9 mg/L
MAC: non-detect
MGMD: 150 CFU/100 mL
Effluent Limit AAC: 25.0 mg/L
AAC: 25.0mg/L
MAC: 1.0 mg/L
MAC: 0.02 mg/L
MGMD: 200 CFU/100 mL
Average Waste Loading Limit1 N/A N/A
AAL: 473.0 kg/d
N/A N/A
1 Loading is calculated based on the flow rates as provided in Table 2. 2 cBOD = 0.8 * BOD assumed for removal efficiency calculatons 3 The ECA effluent objective and limit for pH is 6.5 to 8.5 and 6.0 to 9.5 respectively, inclusive, at all times. Effluent pH in 2018 was within the required objective and limit. 4 Referenced from Amended Environmental Compliance Approval No. 9032-ABZNYQ, issued on July 21, 2016. 5AAC refers to Annual Average Concentration, MAC refers to Monthly Average Concentration, MGMD revers to Monthly Geometric Mean Density, and AAL refers to Annual Average Daily Loading.
5

~~ TORONTO Water CITY OF TORONTO WASTEWATER TREATMENT PLANT
ANNUAL REPORTS
HUMBER TREATMENT PLANT 2018 ANNUAL REPORT
Influent and Final effluent concentrations of eleven select heavy metals have been included in Appendix D. Any discharge into City sewers must meet the sewer use By-law limits. Final effluent concentrations are presented to assess the treatment plant's removal capacity.
A summary of the annual averages of process parameters over the past three years are shown in Table 2.
Table 2: Process Summary Parameter Units 2018 2017 2016
Flow1 ML/day 286.1 331.7 257.3 Total Annual Flow1 ML 104,417 121,062 94,168 Influent Parameters Total Suspended Solids (TSS) mg/L 280.8 301.2 331.0 Biochemical Oxygen Demand (BOD5) mg/L 247.8 255.2 299.0 Total Phosphorus (TP) mg/L 5.2 5.3 5.8 Preliminary Treatment Grit and Screenings Tonnes/day 4.1 2.1 1.6 Primary Treatment TSS mg/L 95.7 102.0 94.0 cBOD5 mg/L 140.9 118.3 158.0 Secondary Treatment Aeration Loading kg
CBOD5/m3.day 0.44 0.41 0.38
Mixed Liquor Suspended Solids mg/L 2,839 2,842 2,953 Solids Handling Primary Sludge Treated m3/day 2,627 2,814 2,689 Primary Sludge TS % 2.1 1.9 2.0
Primary Sludge TVS % 76.7 73.6 70.6 WAS to Thickening m3/day 3,697 3,776 3,573 WAS SS mg/L 9,499 8,806 8,630 TWAS TS % 3.7 4.6 4.0 TWAS TVS % 74.9 77.6 75.0 TWAS Treated m3/day 961 6972 598 Digester Gas Volume m3/day 26,717 26,248 28,093
1 Flow monitoring is provided by influent flow meters. There are no effluent flow meters due to infrastructure limitations. 2 A data quality error resulted in the over reporting of TWAS Treated in the 2017 report. The correct value was 697 m3/day rather than 715 m3/day.
In 2018, the total annual influent flow decreased by 14% as compared to 2017. Over the past 5 years, sewage flow to Humber Treatment Plant has tended to decrease, with the exception
6

~~ TORONTO Water CITY OF TORONTO WASTEWATER TREATMENT PLANT
ANNUAL REPORTS
HUMBER TREATMENT PLANT 2018 ANNUAL REPORT
of 2017, when unusually high flows were experienced. The TP and TKN concentrations of the sewage have remained relatively constant over the last 5 years, while the BOD5 and TSS have decreased slightly.
The water content of the grit removed increased in 2018 due to process changes. This led to a higher volume of grit and screening being removed from the wastewater. The percent solids of the TWAS decreased as a result of centrifuge operations adjustments. This contributed to the increased volume of TWAS treated.
The objective for TRC is given as non-detect. The MECP gives a regulatory method detection limit (RMDL) of 0.01 mg/L for the recommended amperometric method. The Humber treatment plant uses an alternate approved method (colourimetric) for which the MECP does not give a RMDL but which has a lower measurement range, as specified by the manufacturer, of 0.002 mg/L. This allows for more significant figures to be reported. Considering the RMDL of 0.01 mg/L, the Humber Treatment Plant met the objective for TRC in all months except for August. In this month the average TRC was 0.017 mg/L, and still within the parameter's limit.
In 2018, the Humber Treatment Plant encountered no chronic operating problems, and continued to produce a high quality effluent which surpassed requirements of the effluent objectives as described in Condition 6 of the plant's ECA. This was achieved through continuous improvement in operations and maintenance of treatment processes, and infrastructure delivery. The plant also met Federal Government WSER requirements for un-ionized ammonia and acute toxicity.
3.2 Biosolids Management
The flow projections for 2019 do not exceed the plant rated capacity of 473 ML/day and are expected to generate a sludge volume that will be +/- 5% of the volume generated in 2018.
All sludge generated at the Humber Treatment Plant is transferred to the Ashbridges Bay Treatment Plant for further treatment. The sludge generated (WAS and biosolids) during 2018 averaged 4,017 m3/day (78 dry tonnes per day). A summary of the digested sludge parameter analysis is included in Appendix E.
3.3 Chemical Usage
Several chemicals are used during the treatment process at the plant. Table 3 outlines the chemical consumption for the current and previous year based on 1000ML of water treated in the facility for the past three years. Costs listed are plus applicable taxes.
7

~~ TORONTO Water CITY OF TORONTO WASTEWATER TREATMENT PLANT
ANNUAL REPORTS
HUMBER TREATMENT PLANT 2018 ANNUAL REPORT
Table 3: Chemical Usage and Chemical Cost Summary per 1000 ML Treated 2018 2018 2017 2017 2016 2016
Process Chemical Usage (/1000M L
Cost ($/1000 ML
Usage (/1000M L
Cost ($/1000 ML
Usage (/1000M L
Cost ($/1000 ML
treated) treated) treated) treated) treated) treated)
Phosphorus Removal
Ferrous Chloride as Fe
6.84 tonnes
5,471.96 4.82 tonnes
4,334.40 9.08 tonnes
8,199.24
Disinfection Sodium Hypochlorite (12% w/v)
42.54 m3 6,934.02 45.47 m3 6,006.00 50.17 m3 6,475.80
Dechlorination Sodium Bisulphite (32% w/w)
5.55 m3 1,559.55 5.21 m3 1,534.00 4.39 m3 1,289.20
WAS Thickening
Polymer 0.00 tonnes
-0.00 tonnes
-0.00 tonnes
-
Ferrous chloride usage increased in 2018 as a response to increasing effluent phosphorus concentrations and to maintain performance in times of reduced clarifier capacity due to secondary treatment process upgrades.
3.4 Bypasses, Overflows, Spills, and Abnormal Discharge Events
3.4.1 Bypasses
There were 17 bypass events in 2018. The total volume of bypass flow was 507 ML, or 0.49% of the annual flow. Bypass flow bypasses secondary treatment (i.e. the Aeration Tanks) but receives preliminary, primary treatment, nutrient removal, as well as disinfection and dechlorination, and exits the plant through the plant outfall before the final effluent sampling point. Secondary bypasses occur due to high wet weather flows that exceed the plant's secondary treatment capacity.. Each instance was reported to the MECP Spills Action Center and recorded into the plant's Monthly report. Secondary bypasses occur due to high wet weather flows that exceed the plant's secondary treatment capacity. Total precipitation in the Toronto area2 was 921 mm in 2018, a 17% increase from 2017.
2 Adapted from http://climate.weather.gc.ca/historical_data/search_historic_data_e.html, Toronto City Station
8

~~ TORONTO Water CITY OF TORONTO WASTEWATER TREATMENT PLANT
ANNUAL REPORTS
HUMBER TREATMENT PLANT 2018 ANNUAL REPORT
Table 4: Bypass Summary
Date Start of Event
End of Event Active Duration1
(hr) Duration (hr)
Volume (m3)
January 11-12, 2018
19:50 January 12th
13:30 4.70 17.6 13,249 February 20, 2018 00:30 15:25 7.60 14.9 14,131 February 21, 2018 08:00 11:20 3.3 3.3 956
April 3-4, 2018 23:30 April 4th
06:00 6.5 6.5 31,962
April 16-18, 2018 02:00 April 18th
00:30 46.5 46.5 332,131 April 25, 2018 19:10 23:45 4.6 4.6 14,265 June 13, 2018 17:41 18:28 0.75 0.75 1,200 June 24, 2018 11:13 14:40 3.5 3.5 23,772 July 5, 2018 21:50 23:20 1.5 1.5 8,983
July 22, 2018 10:20 10:50 0.5 0.5 1,377 July 24, 2018 20:40 21:15 0.6 0.6 325
August 6, 2018 19:10 23:45 1.8 1.8 11,556 August 7-8, 2018 22:05 18:30 5.70 20.4 35,581 August 17, 2018 17:25 18:15 0.83 0.83 2,207 August 21, 2018 11:05 14:20 3.25 3.25 13,499 September 10,
2018 09:50 12:30
2.7 2.7 1,428 October 2, 2018 09:06 09:20 0.2 0.2 418
1 In wet weather the plant may bypass intermittently. The active duration is the period for which the bypass was actively occurring, whereas the duration is the total duration for the event.
3.4.2 Overflows
There were no overflow events at the Humber Treatment Plant in 2018. An overflow is defined as a discharge to the environment from the plant at a location other than the plant outfall or into the plant outfall downstream of the final effluent sampling station.
3.4.3 Spills
There were three spills reported to the MECP in 2018; they are summarized in Table 5 below.
9

~~ TORONTO Water CITY OF TORONTO WASTEWATER TREATMENT PLANT
ANNUAL REPORTS
HUMBER TREATMENT PLANT 2018 ANNUAL REPORT
Table 5: Spills Summary
Date Duration (hr)
Volume (m3)
Nature of event Description
May 2, 2018 0.03 3 Unplanned hydraulic
restriction.
Primary effluent spill due to closing a gate that caused a hydraulic restriction during a planned construction activities.
August 6, 2018 0.66 1 High flows due
to rain.
Primary influent overtopped the influent channel, spilled onto the roadway, and entered a catchbasin which leads to the bypass channel. The plant was experiencing high flows due to rain which surcharged the primary influent channel. The entire volume was disinfected and dechlorinated before discharging to the lake.
October 1, 2018 1.08 1793 High flows due
to rain.
Due to process monitoring equipment failure a secondary bypass was initiated before the plant flows reached the secondary treatment capacity as per the ECA.
3.4.4 Abnormal Discharge Events
There were no abnormal discharge events at the Humber Treatment Plant in 2018.
3.5 Complaints
The Humber Treatment Plant received two complaints related to odour. These complaints were received on August 6th and August 13th. All complaints were recorded, investigated by Toronto Water Staff, reported to the MECP, and when possible, followed up on with the complainant. In each case the investigation did not identify any unusual odours, so no corrective action was warranted.
A table of correspondence related to complaints can be found in Section 7.6.
3.6 Effluent Quality Assurance and Control Measures
Analytical tests to monitor required parameters are performed by the Toronto Water Laboratory which is accredited to ISO/IEC 17025 by Canadian Association for Laboratory Accreditation Inc. Plant operation and performance is monitored by licensed operators as
10

~~ TORONTO Water CITY OF TORONTO WASTEWATER TREATMENT PLANT
ANNUAL REPORTS
HUMBER TREATMENT PLANT 2018 ANNUAL REPORT
well as by the facility management team. Standard Operation Procedures, emergency plans, equipment preventative and predictive maintenance, and a network of support staff, help ensure a rapid and effective response to issues, and maintain the high quality of the effluent and biosolids. A hybrid Quality and Environmental Management System is also in development and will be reported on in future Annual Reports.
3.7 Odour Reduction Plan
As per Section 8 (4) of the Humber Treatment Plant Amended ECA – Air No. 0858-AEXNV7 issued July 12, 2017, a review of the Odour Reduction Plan summarizing the work progress in 2018, including activities to reduce emissions of odour and total reduced sulphur, the estimated emissions reduction for each activity, and the schedule for completion of each activity can be found in Appendix F.
11

~~ TORONTO Water CITY OF TORONTO WASTEWATER TREATMENT PLANT
ANNUAL REPORTS
HUMBER TREATMENT PLANT 2018 ANNUAL REPORT
4 CAPITAL PROJECTS
Under Toronto Water’s capital program, the Humber Treatment Plant commenced or continued with the capital works projects and studies listed in Table 6 in 2018.
Table 6: Capital Projects
Project Name Project Description Project Stage (Dec 31, 2018)
Cogeneration Upgrades Refurbishment of cogeneration system to allow use of methane for the generation of electricity and heat.
Complete
Digester 9&10 Rehabilitation
Clean out and repair of digesters 9 and 10 including replacement of gas huts and some mechanical equipment
Complete
Odour Control Upgrades Preliminary treatment process improvements and odour control system replacement including construction of two new biofilters.
Commissioning
Premise Isolation Installation of two new backflow preventers for premise isolation and new potable water flow metres
Complete
Secondary Process Upgrades
Refurbishment of south aeration system including expanded return activated sludge pumping station, new plant water pumping station, new phosphorus removal system
Construction
West Substation Upgrades Electrical Upgrades to existing substation Construction ECS Site Office Prefabricated Building to accommodate City
project staff on site Construction
HVAC Upgrades Refurbishment of HVAC system and potable water system.
Construction
PLC Platform Upgrade Replacement of outdated control hardware for reliability
Construction
Primary Pumping and Scum Upgrade of north primary treatment sludge and scum systems
Construction
TW Operations Centre Expansion of the operations centre to meet current and future needs
Design
Waste Gas Burner Upgrades Replacement of existing waste gas burners to meet regulations and improve proves efficiency
Design
12

~~ TORONTO Water CITY OF TORONTO WASTEWATER TREATMENT PLANT
ANNUAL REPORTS
HUMBER TREATMENT PLANT 2018 ANNUAL REPORT
Project Name Project Description Project Stage (Dec 31, 2018)
Building Condition Assessment
Study to determine the condition of building on site in order to plan maintenance projects and capital upgrades.
Study
Flood Protection Study Study to determine the adequacy of current flood protection measures
Study
Wet Weather Flow Study Study to identify ways to handle increased flows and higher lake levels, as well as decrease the quantity and increase the quality of bypass flows.
Study
13

~~ TORONTO Water CITY OF TORONTO WASTEWATER TREATMENT PLANT
ANNUAL REPORTS
HUMBER TREATMENT PLANT 2018 ANNUAL REPORT
5 MAINTENANCE
Staff from the Humber Treatment Plant performed a variety of scheduled, preventative, predictive and reactive maintenance on a diverse spectrum of equipment. Equipment availability and reliability ensures operational requirements are achieved.
The annual calibration and maintenance records of flow meters and on-line analysers for regulated parameters was completed in 2018, and found to be within acceptable limits. A summary of effluent monitoring equipment calibration and maintenance performed in 2018 is included in Table 7.
Table 7: Summary of Regulated Monitoring Equipment Calibration and Maintenance Calibration and/or Maintenance Record Completion Date
Influent Flow Meter THR-PLT-FIT-2001A - Verification July 24, 2018
Aeration Flow Meter THR-AER-FIT-0602 - Verification October 23, 2018 Aeration Flow Meter THR-AER-FIT-0702 - Verification October 24, 2018 Aeration Flow Meter THR-AER-FIT-0802 - Verification October 25, 2018
Effluent pH analyzer THR-EPS-AIT-0055 - Calibration February 8, 2018 and August 15, 2018
Effluent pH analyzer THR-EPS-AIT-0055 - Verification February 8, 2018 and August 15, 2018
Effluent temperature analyzer THR-EPS-TIT-0053 -Verification
March 13, 2018 and September 28, 2018
The Humber Treatment Plant work areas include all major and auxiliary processes. In 2018, there were a total of 11,394 work orders completed; refer to Appendix G for a summary of maintenance activities as per Conditions 10(6)(c) of the ECA. None of the maintenance activities undertaken at the plant fell under Limited Operational Flexibility; as a result, no Notices of Modifications were submitted to the Water Supervisor as per Condition 10(6)(j) of the ECA. Regular safety inspections and preventative maintenance was performed on the life safety systems at the plant in 2018.
14

~~ TORONTO Water CITY OF TORONTO WASTEWATER TREATMENT PLANT
ANNUAL REPORTS
HUMBER TREATMENT PLANT 2018 ANNUAL REPORT
6 UTILITIES
A summary of monthly utility consumption for the previous three years at Humber Treatment Plant is provided in Figure 1. Table 8 below summarizes the total cost and average unit cost for water, hydro, and natural gas. Total annual consumption of potable water, hydro, and natural gas was 401,173 m3, 48.7M kWh, and 2.8M m3, respectively.
33.43
52.94
40.91
0
10
20
30
40
50
60
2018 2017 2016
m 3 /
mon
th x
103
Water Usage
4.06 3.86
4.39
0
1
2
3
4
5
2018 2017 2016
kWh/
mon
th x
106
Hydro Usage Natural Gas Usage
250
200
150
100
m3 /
mon
th x
103
50
0 2018 2017 2016
237.42
163.78
112
Figure 1: Annual Utility Consumption (Water, Hydro, Gas)
Table 8: Average Unit and Total Utility Cost Utility 2018 2017 2016
Water Unit Cost ($/m3) 4.00 3.81 3.63 Water Total Cost ($/year) 1.61M 2.42M 1.78M Hydro Unit Cost ($/kWh) 0.10 0.10 0.11 Hydro Total Cost ($/year) 4.84M 4.43M 5.59M Natural Gas Unit Cost ($/m3) 0.23 0.24 0.24 Natural Gas Total Cost ($/year) 648,304 470,741 317,335
There was a 37% decrease in potable water consumption in 2018 compared to 2017. For portions of 2017, the effluent reuse water system was out of service, requiring the use of potable water. The problems experienced in 2017 were corrected, reducing the need for potable water usage.
15

~~ TORONTO Water CITY OF TORONTO WASTEWATER TREATMENT PLANT
ANNUAL REPORTS
HUMBER TREATMENT PLANT 2018 ANNUAL REPORT
The 45% increase in natural gas is due to one digester-gas fed boiler being out of service during the winter. Because the digester gas could not be used, additional natural gas was needed for process and domestic heat.
16

~~ TORONTO Water
So.oo Ss,oooa , vo.oo
■
■
■
CITY OF TORONTO WASTEWATER TREATMENT PLANT ANNUAL REPORTS
HUMBER TREATMENT PLANT 2018 ANNUAL REPORT
7 ADMINISTRATION
7.1 Operations and Maintenance Costs
The 2018 plant direct operational costs are broken down into five categories: Salaries and Benefits, Materials and Supplies, New Equipment, Services and Rents, and Inter-Divisional Charges. Materials and Supplies is further segregated into Utilities, Machine & Equipment Parts, Chemicals and Other Materials and Supplies. A breakdown of annual operations and maintenance costs for the past three years is illustrated in Figure 2 . Overall, operational costs increased by 5.5% from 2017.
TOTAL PROGRAM COST
Salaries and Benefits
Utilities
Machine and Equipment Parts
Chemicals
Other Materials and Supplies
New Equipment
Services and Rents
Inter-Divisional Charges
$18,969,179.24
$6,947,540.14
$7,595,038.85
$987,857.53
$1,459,104.05
$683,356.00
$407,170.74
$670,767.59
$218,344.34
2018
2017
2016
Figure 2: Operations and Maintenance Cost Breakdown
17

~~ TORONTO Water CITY OF TORONTO WASTEWATER TREATMENT PLANT
ANNUAL REPORTS
HUMBER TREATMENT PLANT 2018 ANNUAL REPORT
7.2 Human Resources
Plant Staffing at the Humber Treatment Plant in 2018 is shown in Table 9.
Table 9: Plant Staffing
Position Number of FTE1
Plant Manager 1
Senior Engineer 2
Area Supervisors 4
Electrical & Instrumentation Specialist 1
Electricians 3
Plant Technicians 20
Industrial Millwrights 20
Electrical Instrumentation Control Technicians 7
Wastewater Treatment Plant Workers 6
Support Assistant/Materials Management 3
Engineering Technologist 1
Seasonal Temporary 1.5
Total FTE Positions 69.5 1 FTE refers to Full Time Equivalent staff. Seasonal staff are considered 0.5 FTE staff.
7.3 Occupational Health & Safety
Continuous efforts are made to ensure a safe working environment at the Humber Treatment Plant. The Joint Health and Safety Committee (JHSC) assists management in resolving issues through regular meetings and monthly workplace inspections. Plant Health and Safety statistics for the Humber Treatment Plant are included in Figure 3.
As of December 31, 2018, there were four health and safety incidents and a total of 5 lost time days in 2018 due to work related injuries.
18

~~ TORONTO Water
■
■
■
■
CITY OF TORONTO WASTEWATER TREATMENT PLANT ANNUAL REPORTS
HUMBER TREATMENT PLANT 2018 ANNUAL REPORT
2018 2017 2016 Lost Time 2 1 2 Medical Aid 2 0 1 Non Reportable
Injuries 0 0 0
Recurrence 0 0 0
0
1
2
3
4
5
Num
ber o
f Occ
urre
nces
Figure 3: Humber Treatment Plant Health & Safety Injury Summary3
7.4 Staff Training and Development
The Strategic Planning and Workforce Development unit of Toronto Water facilitates a comprehensive training program for all staff.
Training attended by Humber Treatment Plant operations and skilled trades staff in 2018 includes the list of courses shown in Appendix E. Some of these courses were eligible for Continuing Education Units (CEU’s) from the Ontario Environmental Training Consortium (OETC). Additional training related to the start-up and commissioning of new equipment/systems installed as part of the capital program was provided as required.
3 The previously reported values for 2017 and 2016 have been changed to reflect the status of those WSIB claims as of December 31st 2018.
19

~~ TORONTO Water CITY OF TORONTO WASTEWATER TREATMENT PLANT
ANNUAL REPORTS
HUMBER TREATMENT PLANT 2018 ANNUAL REPORT
7.5 Utility Operator Certification
Toronto Water trains and provides the required resources to ensure all operators achieve and maintain Class IV certifications. In addition, all skilled trade positions are required to achieve and maintain a Class I operator’s licence. As part of this initiative, general operational/process training was delivered in order to prepare staff for any certification examination that they need to write. Table 10 summarizes the status of operator certification at the Humber Treatment Plant in 2018.
Table 10: Wastewater Treatment Certificates
Class Level Number of Licenses
Class IV 16 Class III 2 Class II 4 Class I 15 O.I.T. 12
Total 49
7.6 MECP/MOL Correspondence
There were no orders issued by the Ministry of the Environment, Conservation and Parks (MECP). There was one order from the Ministry of Labour (MOL) regarding improper supplier labels on hazardous products. One time order was issued to label the products, which was complied with on the day of the visit.
Reports were submitted to the MECP for the two odour complaints received at the plant in 2018, one noise complaint, as well as the 17 bypass events. Table 11 summarizes the correspondence submitted to the MECP and MOL for the Humber Treatment Plant. Correspondence related to spills and bypassed can be referenced in sections 3.4.3 and 3.4.1.
Table 11: Correspondence submitted to the MECP and MOL Event Date
Type Description Resolution Resolution Date
09-May-18 Noise
Low continuous humming noise found to be due to vibration in the odour control air ductwork to the central biofilter.
Fan speed slightly lowered, which resulted in the elimination of the noise
09-May-18
20

-
~~ TORONTO Water CITY OF TORONTO WASTEWATER TREATMENT PLANT
ANNUAL REPORTS
HUMBER TREATMENT PLANT 2018 ANNUAL REPORT
Event Type Date
Description Resolution Resolution Date
06-Aug-18 Odour "Noxious gas" smell coming from plant was smelt from across the street.
Investigation by plant staff did not identify any unusual odours. Complainant was anonymous and therefore could not be contacted with this information.
06-Aug-18
13-Aug-18 Odour Complainant from a nearby business claimed odour was coming from the plant.
Investigation by plant staff did not identify any unusual odours. Complainant was anonymous and therefore could not be contacted with this information.
14-Aug-18
Consent Letters None Notice of Start up October 1, 2018
Aeration Tank 5
MECP Inspection No Inspection MOL Correspondence November 20, 2018
An order was issued to apply workplace labels to two sacks of materials stored on site.
The workplace labels were applied to the sacks immediately and a Notice of Compliance was sent by fax on the same day.
November 20, 2018
21

~~ TORONTO Water CITY OF TORONTO WASTEWATER TREATMENT PLANT
ANNUAL REPORTS
HUMBER TREATMENT PLANT 2018 ANNUAL REPORT
APPENDIX A – Plant Schematic

Femius Chloride Ferrous Chloride
INCOMING SEWERS
PRIMARY ~ GRIT REMOVAL SEDIMENTATION
'1~ 1 !~ --SCREENING I
I I I I
l FINAL DISINFECTION & AE~TION SEDIMENTATION DECHLORINATION
~ Retum Activated Slud e
Waste Activated Sludge I I I I I
Polymer
SLUDGE THICKENING
PRIMARY ANAEROBIC DIGESTERS
SECONDARY ANAEROBIC DIGESTERS
• TO -->• MIO-TORONTO INTERCEPTOR
Process Flow Diagram for Humber Wastewater Treatment Plant
APPENDIX A – Plant Schematic

~~ TORONTO Water CITY OF TORONTO WASTEWATER TREATMENT PLANT
ANNUAL REPORTS
HUMBER TREATMENT PLANT 2018 ANNUAL REPORT
APPENDIX B – Influent and Effluent 2018 Performance Charts

- - - -
APPENDIX B – Influent and Effluent 2018 Performance Charts
0
50
100
150
200
250
300
350
400
450
JANUARY FEBRUARY MARCH APRIL MAY JUNE JULY AUGUST SEPTEMBER OCTOBER NOVEMBER DECEMBER 0
50
100
150
200
250
300
350
400
450
500
Conc
entr
atio
n (m
g/L)
Flow
Rat
e (M
LD)
Influent Parameters
TSS BOD5 TP x 10 TKN TOTAL FLOW DAILY AVERAGE

- - - - -- - - - -
APPENDIX B – Influent and Effluent 2018 Performance Charts
0
50
100
150
200
250
300
350
400
450
500
0
20
40
60
80
100
120
140
160
JANUARY FEBRUARY MARCH APRIL MAY JUNE JULY AUGUST SEPTEMBER OCTOBER NOVEMBER DECEMBER
Flow
Rat
e (M
LD)
Conc
entr
atio
n (m
g/L)
Final Effluent Parameters
CBOD5 TSS TP x 10 AMMONIA Unionized Ammonia TRC x 1000 E. Coli CFU/100 mL pH Level Temperature AVERAGE DAILY FLOW

~~ TORONTO Water CITY OF TORONTO WASTEWATER TREATMENT PLANT
ANNUAL REPORTS
HUMBER TREATMENT PLANT 2018 ANNUAL REPORT
APPENDIX C – Historical Performance Data

-------------
APPENDIX C – Historical Performance Data
Units 2018 2017 2016 2015 2014 2013 2012 2011 2010 2009 2008 Influent Parameters Flow ML/day 286.1 331.7 257.3 269 280.5 312 287.5 379 362 300 331.3 Total Annual Flow ML 104,417 121,062 94,168 98,174 102,364 113,709 105,444 137,971 132,289 113,060 121,266 Total Suspended Solids (TSS) mg/L 281 301 331 369 356 318 405 446 290 354 323 Biochemical Oxygen Demand (BOD5) mg/L 248 255 299 318 295 238 261 267 250 212 164
Total Phosphorus (TP) mg/L 5.2 5.3 5.8 5.8 5 4.4 4.9 5.1 4.8 4.6 4.8 Total Kjeldahl Nitrogen (TKN) mg/L 40.0 39.8 45.2 42.7 38.4 39.31 43.42 40.4 35.17 35.9 33.3 Preliminary Treatment Grit and Screenings tonnes/day 4.1 2.1 1.6 2.2 2.1 3.4 1.8 2.2 14.5 2.4 2.7 Primary Treatment TSS mg/L 96 102 94 97 101 151 148 126 100 97 104 Carbonaceous Biochemical Oxygen Demand (cBOD5) mg/L 141 118 158 156 138 142 160 145 139 106 117
Secondary Treatment Aeration Loading kg CBOD5/ m3.day 0.44 0.41 0.38 0.39 0.37 0.4 0.47 0.57 0.45 0.32 0.36 Mixed Liquor Suspended Solids mg/L 2839 2842 2953 2838 2998 2885 2151 2741 2384 2238 1292 Final Effluent Final Effluent Daily Average Flow ML/day 285 321 257 268 276 306 288 380 361 308 332
TSS mg/L 11 13 13 11 12 13 15.7 13 12 14 16 TSS Loading Rate kg/day 3157 4322 3341 2952 3306 4050 4523 4970 4194 4200 5138 cBOD5 mg/L 5.9 6.6 5.7 5.4 4.8 6.0 6.0 7.6 6.1 7 6 cBOD5 Loading Rate kg/day 1678 2202 1465 1449 1322 1869 1728 2880 2209 2100 1989 TP mg/L 0.6 0.8 0.7 0.8 0.7 0.7 0.6 0.4 0.5 0.7 0.7 TP Loading Rate kg/day 178 250 180 210 210 202 184 166 179 210 232 Escherichia Coli (E. Coli) CFU/100 mL 68 72 29 52 30 31 26 51 46 24 14 pH - 7 8 7.2 7.4 7 7 7 7.6 7.5 7.3 7 Total Residual Chlorine mg/L 0.0065 SBS (P) /0.009 SBS (P) SBS (P) SBS (P) - - - - - -Total Kjeldahl Nitrogen (TKN) mg/L 3.3 3.2 2.66 2.2 2.1 2.0 3.2 5.8 4.3 9.7 12.2 Total Ammonia Nitrogen mg/L 1.7 1.6 1.2 1.4 0.9 0.7 1.0 3.0 5.4 6.6 10.0 Temperature degrees Celsius 20 15.8 17.6 18.9 18.7 20.0 21.0 19.6 20.3 19.5 19.7

APPENDIX C – Historical Performance Data
Units 2018 2017 2016 2015 2014 2013 2012 2011 2010 2009 2008 Solids Handling Primary Sludge Treated m3/day 2,627 2,813 2689 2723 3495 2639 2532 2368 2661 3100 2920 Primary Sludge Total Solids (TS) % 2.1 1.9 - - - - - - 1.69 2.19 1.84
Primary Sludge Total Volatile Solids (TVS) % 76.7 73.6 - - - - - - 78.7 71.29 76
Waste Activated Sludge (WAS) to Thickening m3/day 3,697 3,776 3573 3135 3782 2984 3779 4536 4794 3960 3780
WAS SS mg/L 9,499 8,806 8630 9448 8863 10391 9012 7580 6877 7078 5676 Thickened WAS (TWAS) TS % 3.7 4.6 4 4.2 4.4 5.3 4.7 4.7 4.1 4.80% 4.30% TWAS VS % 74.9 77.6 75 78.6 78 79 78.7 78.9 82.2 81% 79.80% TWAS Treated m3/day 961 714 598 350 512 464 726 739 937 850 940 Digested Solids to ABTP DT/day 73 80 59 57 64 57 54 48 39.1 40.6 38.8 WAS to ABTP DT/day 4.9 4.9 5.1 17 11.7 5.8 1.7 4.7 4 14.8 24.9 Digester Gas Generated 103 m3/day 26.7 26.2 28.1 25.4 24.6 20.3 21.3 17.5 15.6 15.5 23.2

~~ TORONTO Water CITY OF TORONTO WASTEWATER TREATMENT PLANT
ANNUAL REPORTS
HUMBER TREATMENT PLANT 2018 ANNUAL REPORT
APPENDIX D – Influent and Effluent Metal Concentrations

APPENDIX D – Influent and Effluent Metal Concentrations Influent (Daily Composite tested once/month for metals) Parameter Arsenic Cadmium Chromium Cobalt Copper Iron Lead Manganese Mercury Nickel Zinc Units mg/L mg/L mg/L mg/L
0.002 mg/L mg/L mg/L mg/L mg/L mg/L mg/L
January 0.005 0.002 0.00682 0.102 1.57 0.0025 0.068 0.00005 0.00912 0.168 February 0.005 0.002 0.0102 0.002 0.114 8.75 0.00511 0.112 0.00005 0.00971 0.161 March 0.005 0.002 0.00643 0.002 0.102 1.94 0.0025 0.0706 0.00005 0.00818 0.183 April 0.005 0.002 0.00571 0.002 0.106 1.04 0.0025 0.0633 0.00017 0.0142 0.166 May 0.005 0.002 0.00993 0.002 0.0904 2.63 0.0025 0.077 0.00005 0.00874 0.152 June 0.005 0.002 0.00593 0.002 0.105 1.21 0.0025 0.0606 0.000141 0.00724 0.158 July 0.005 0.002 0.00746 0.002 0.111 1.27 0.0025 0.0654 0.00005 0.00674 0.181 August 0.005 0.002 0.00521 0.002 0.0987 1.3 0.0025 0.0683 0.00005 0.0104 0.13 September 0.005 0.002 0.00727 0.002 0.103 1.55 0.00564 0.0648 0.00005 0.0121 0.146 October 0.005 0.002 0.0144 0.002 0.134 1.53 0.00611 0.0705 0.00005 0.0119 0.241 November 0.005 0.002 0.00737 0.002 0.123 1.26 0.00557 0.0677 0.000106 0.00823 0.255 December 0.005 0.002 0.00626 0.002 0.118 1.17 0.0025 0.0647 0.00005 0.0077 0.215 Annual Average 0.005 0.002 0.007749 0.002 0.10893 2.102 0.003536 0.071075 0.000072 0.00952 0.1797 Final Effluent (Daily Composite tested once/month for metals) Parameter Arsenic Cadmium Chromium Cobalt Copper Iron Lead Manganese Mercury Nickel Zinc Units mg/L mg/L mg/L mg/L mg/L mg/L mg/L mg/L mg/L mg/L mg/L January 0.005 0.002 0.002 0.002 0.0149 0.41 0.0025 0.0386 0.00005 0.00619 0.0485 February 0.005 0.002 0.002 0.002 0.0146 0.337 0.0025 0.0436 0.00005 0.00542 0.0453 March 0.005 0.002 0.002 0.002 0.0159 0.318 0.0025 0.0402 0.00005 0.00553 0.0524 April 0.005 0.002 0.002 0.002 0.0189 0.443 0.0025 0.0528 0.00005 0.00524 0.0525 May 0.005 0.002 0.002 0.002 0.0147 0.416 0.0025 0.0634 0.00005 0.00623 0.0443 June 0.005 0.002 0.002 0.002 0.0132 0.481 0.0025 0.0587 0.00005 0.00568 0.0393 July 0.005 0.002 0.002 0.002 0.0117 0.662 0.0025 0.0624 0.00005 0.00533 0.0335 August 0.005 0.002 0.002 0.002 0.0139 0.827 0.0025 0.0562 0.00005 0.00724 0.0322 September 0.005 0.002 0.002 0.002 0.0144 1.42 0.0025 0.0602 0.00005 0.00632 0.0304 October 0.005 0.002 0.002 0.002 0.0152 0.545 0.0025 0.0458 0.00005 0.00608 0.0338 November 0.005 0.002 0.002 0.002 0.0134 0.523 0.0025 0.0448 0.00005 0.0025 0.0317 December 0.005 0.002 0.002 0.002 0.0206 0.647 0.0025 0.0418 0.00005 0.00604 0.0349 Annual Average 0.005 0.002 0.002 0.002 0.01512 0.5858 0.0025 0.05071 0.00005 0.005650 0.03990 Data in red italics is half the MDL.

~~ TORONTO Water CITY OF TORONTO WASTEWATER TREATMENT PLANT
ANNUAL REPORTS
HUMBER TREATMENT PLANT 2018 ANNUAL REPORT
APPENDIX E – Digested Sludge Analysis

APPENDIX E – Digested Sludge Analysis
Arsenic Cadmium Cobalt Chromium Copper Mercury Molybdenum Nickel Lead Selenium Zinc Limit (1) 170 34 340 2800 1700 11 94 420 1100 34 4200 January 2.3 0.3 3.5 39.5 616 0.379 6.09 28.5 28.1 2.0 727 February March April 1.4 0.7 3.7 40.4 474 0.362 5.70 20.2 30.5 2.4 532 May 1.0 0.3 2.7 35.6 324 0.175 4.07 16.8 35.2 1.6 366 June 2.0 0.6 3.2 40.9 459 0.362 7.81 18.2 19.6 3.1 609 July
August 1.4 0.6 5.5 65.4 763 0.780 11.06 29.6 30.7 5.0 883 September October 0.83 0.3 2.0 23.0 270 0.305 4.45 12.5 13.4 0.8 260 November December Annual Average 1.5 0.47 3.43 40.8 484 0.39 6.53 21.0 26.2 2.50 563
All values are expressed in terms of mg metal / kg digested sludge dry weight (1) As per MECP regulations for sludge utilization on agricultural lands. All sludge from HTP received further treatment at Ashbridges Bay Treatment Plant

~~ TORONTO Water CITY OF TORONTO WASTEWATER TREATMENT PLANT
ANNUAL REPORTS
HUMBER TREATMENT PLANT 2018 ANNUAL REPORT
APPENDIX F – Odour Reduction Plan

Humber Treatment Plant Odour Reduction Report
Prepared by:
Vanessa Szonda, P.Eng Senior Engineer, Toronto Water
March 31, 2019

Table of Contents
Table of Figures.....................................................................................................................................................1
Purpose .................................................................................................................................................................2
Scope.....................................................................................................................................................................2
Background ...........................................................................................................................................................2
Odour Control Equipment ................................................................................................................................2
Process Upgrades..............................................................................................................................................3
2018 Progress .......................................................................................................................................................3
Odour Reductions Achieved in 2018 ....................................................................................................................7
Complaints Received in 2017................................................................................................................................8
Next Steps.............................................................................................................................................................8
Appendix A: Odour Reduction Plan ......................................................................................................................9
Appendix B: Odour Complaints...........................................................................................................................10
Table of Figures
Figure 1: The Central Biofilter fans .......................................................................................................................4
Figure 2: The GAC Unit..........................................................................................................................................5
Figure 3: The South Biofilter .................................................................................................................................5
Figure 4 The new headhouse loading bay (left) and screenings conveyor systems (right) .................................6
Figure 5: The North Grit Building loading bay has been commissioned...............................................................7
1

Purpose
This report is intended to detail the progress of the implementation of the Odour Reduction Plan, as required under Environmental Compliance Approval No. 0858-AEXNV7 (the ECA), issued July 12, 2017. A copy of the Odour Reduction Plan can be found in Appendix A: Odour Reduction Plan.
Scope
The scope of this report is to detail the progress of the installation of the Proposed Equipment, in the ECA which will impact odours at the plant.
The ECA also lists equipment which is not expected to have an impact on odour at the plant. This includes modifications to the aeration tanks, the disinfection facility, and the decommissioning of existing odour control equipment. As they are not anticipated to have any impact on odour, they are beyond the scope of this report.
Background
In 2010, the City of Toronto (the City) hired Stantec Consulting Inc. (Stantec) to provide engineering design, construction administration and post construction services of odour control facilities to drastically reduce nuisance odours at the facility's property line and beyond. This included several upgrades to process equipment and odour handling facilities at the plant.
Odour Control Equipment
A central component of the Odour Control Project is the construction of a centralized Biofilter to control emissions from the Headhouse and South Grit Building, the North Grit Building, and the north primary tanks influent and effluent channels. The biofilter includes:
Four cells, 15.5 m by 32.2 m, with an organic media depth of 1.22 m
An irrigation system
Two separate 2.2 m stacks extending 4.2 m above grade, with a maximum flow rate of 19.8 m3/s
In addition to the centralized biofilter, a second biofilter has been constructed at the south end of the south primary tanks. This biofilter treats air from the influent and effluent channels of the south primary tanks and will consist of:
3 cells, 8 m by 5.5 m, with an organic media depth of 1.22 m
An irrigation system
An open area discharge, with a maximum volumetric discharge of 2.36 m3/s
2

The third odour reducing component of the project includes a granular activated carbon (GAC) scrubber unit, which treats air from the Headhouse screen room. The GAC unit has:
45 m3 of GAC
A maximum discharge rate of 16 m3/s, through a 1.21 m stack, located 4 m above grade
Process Upgrades
The Headhouse and South Grit Building has undergone extensive renovations to ensure process reliability, as well as ensure that odours are contained and treated. The work in this area includes:
Replacement of 2 bar screens to increase reliability and enable them to be enclosed at all times
Replacement of the conveyor system to increase reliability and enable them to be enclosed at all times
Modifications to the vortex system replace the classifiers and air lift system with a grit pumping system and merge the grit slurry handling with the north grit facility
Decommission 4 general building exhaust systems
Installation of a new truck loading bay for screenings
Installation of a standby diesel generator to ensure continuous operation of critical equipment
Construction of a new electrical building
North Grit Building
Upgrades to the grit tanks to use a screw conveyor for grit removal
Installation of new grit handling pumps, hydrocyclones and classifiers
Installation of a new grit handling facility and loading bay
Construction of a new electrical building
Additionally, the project scope included decommissioning the existing HVAC and odour control equipment and allowing the aeration tanks to vent to atmosphere.
The project was tendered in late 2013, and the order to commence issued to Walsh Construction Canada (WCC) on April 14, 2014. The contract value is $58,640,220, with an original contract completion date of February 6, 2017. The completion date has been extended, and the project is expected to be completed by the second quarter of 2019. WCC, Stantec, and the City have been actively working to construct the works in an accordance with the tender documents and schedules, however the project continues to experience delays.
2018 Progress
In 2018, work on the Odour Control Project continued, and significant progress was made. The central biofilter has essentially been completed and is running under the control of the contractor. The biofilter and all associated systems and ductwork have been completed, including the balancing and commissioning of the system. The central
3

biofilter fans and ductwork can be seen in Figure 1. Note, the biofilter is located underground.
Figure 1: The Central Biofilter fans
The GAC unit continues to run and is currently treating building air from the headhouse at its intended capacity or 6 air changes per hour. Foul air is now being extracted from process equipment and treated through the central biofilter (Figure 2).
4

Figure 2: The GAC Unit
The construction of the south biofilter has been completed has been commissioned (Figure 3). A biomass has been established in the filter, which should result in a 20% reduction in odours at the property line. Odour reductions will be confirmed by source testing upon completion of the project.
Figure 3: The South Biofilter
5

All major upgrades have been completed and have been commissioned. These include:
Two new bar screens and associated conveyor systems
A new loading bay (Figure 4)
Three north grit tanks
The north grit loading bay, including classifiers and conveyors, (Figure 5)
Six south grit vortexes
Air handling equipment, including and testing and balancing of the system
Figure 4 The new headhouse loading bay (left) and screenings conveyor systems (right)
6

Figure 5: The North Grit Building loading bay has been commissioned
Odour Reductions Achieved in 2018
The GAC unit was commissioned in 2016 and was placed in its intended mode of operation. Overall, this should result in a 10% reduction in odour at the fence line.
The south biofilter was commissioned in the first quarter of 2017, and is currently treating the foul air from the influent and effluent toughs and channels of the south primary tanks. This should have resulted in a 20% decrease in odours at the property line. This will be confirmed by source testing upon completion of the project.
The central biofilter is has been commissioned and is running. This should result in a 60% reduction of odours at the fence line.
Odour reductions will be measured and confirmed by source testing once outstanding deficiencies on the project are addressed and the project reaches substantial completion.
7

Complaints Received in 2018
Two odour complaints were received in 2018. All complaints were investigated and
reported to the Water Supervisor as per the requirements in the ECA. A copy of the
complaint reports can be found in Appendix B: Odour Complaints.
Next Steps
The City continues to work with Stantec and WCC to move forward with the project. Construction and commissioning of process equipment is ongoing, and the project is expected to be completed by the second quarter of 2019. Once the project is complete, source testing will begin.
8

Appendix A: Odour Reduction Plan Location
Headhouse and South Grit
North Grit Building
North Primary Tanks
South Primary Tanks
Aeration Tanks
Disinfection Facility
Air Scrubbers/ Ozone
Plan
Replace remaining 2 bar screens to increase reliability and enable them to be enclosed at all times
Replace conveyor system to increase reliability and enable them to be enclosed at all times
Modify vortex system to no longer require the classifiers or an air lift system in this location
Decommission 4 general building exhaust systems
New centralized biofilter to treat foul process air
Construction of a standby diesel generator
New Activated Granular Carbon Unit to extract and treat foul building air
Collection and treatment of emissions from the 3 aerated grit tanks through the new centralized biofilter
Collection and treatment of emissions from the grit tank room and loading bay areas through the centralized biofilter
Decommission existing general building ventilation system
Decommission the existing exhaust system for aerated grit tanks
Installation of covers over the influent and effluent channels, effluent weirs, and overflow channel
Treatment of foul air from below the covers through a new centralized biofilter
Installation of covers over the influent and effluent troughs
Treatment of foul air from below the covers through a new south primary biofilter
New aeration piping and diffusers
New ventilation scheme that will involve vent stacks to allow air to discharge to the atmosphere
New Sodium Hypochlorite Tanks (1-3)
New Sodium Hypochlorite Tanks (4-8)
New welding fume hood
New standby diesel generator
Decomission chlorine gas scrubbers
Decommission air scrubbers and ozone building
Percent Odour Reduction
20%
10%
20%
20%
20%
N/A
N/A
N/A
Current Progress
Complete
Complete
Complete
Complete
Complete
Complete
Complete
Complete
Complete
Complete
Complete
Complete
Complete
Complete
Complete
Construction
Construction
Complete
Complete
Complete
Complete
Complete
Complete
Target date
N/A
N/A
N/A
Updated February 28, 2019 by V. Szonda
9

Appendix B: Odour Complaints
10

Vanessa Szonda Senior Engineer Humber Treatment Plant
130 The Queensway Tel: 416·392·2942 Etoblcoke, Ontario MBY 1H9 Fax: 416·392-4514
Environmental Compliance Approval 0858-AEXNV7
August 7, 2018
York-Durham District Office 230 Westney Rd. S. 5th floor Ajax ON L1S 7J5
Attn: Shannon Boland
Re: Humber Treatment Plant Noise Complaint
Dear Ms. Boland,
On Monday, August 6, 2018, an odour complaint was called in to 311. The complainant was at the Sobey's plaza across the street and noticed a "noxious gas smell" coming from the Humber Plant. The complaint was investigated by the Operator in Charge, and no unusual odours were detected. The odour complaint form is attached.
The complainant chose to remain anonymous and could not be contacted for a follow up.
Should you have any questions, please do not hesitate to contact me.
Best regards,
Vanessa Szonda, P.Eng Senior Engineer, Humber Treatment Plant City of Toronto, Toronto Water
CC: Voitke Kozakiewicz, P.Eng - Plant Manager, Humber Treatment Plant Satyanand Goolsarran - Environmental Health and Safety Representative Krishna Mahadeo - Area Supervisor Process Operations and Maintenance

--------------------------------- ----------------
---------------------------
Humber Treatment Plant MTIONIOWater
• □ Other: _____________Type of Complaint: ~ dor o Noise
Section A: Complaint Report
Section B: Investigation Report
Were there any remedial actions required and/or attempted? □ Yes Details:
• Resolution/Conclusion:
Section C: Follow-Up Report
Completed by: 7. def:Jzh,.·dJo Date: LiE..,.:? 06/t'cf ______ Time: ---'£.=.'.3=--' -=3-=0:;__' _______ Were others't!'cmtacted regarding the complaint? o Yes o,No Details:
Was a follow-up call made? □ Yes . o Date: ---:z.-+-_ _ __ Time: -......--.---Additional Notes: Coq fbImh t {,1.(/u )£)-' z_R',140 / '-' s(o ,l e
" /{~yn-,O,/$
Reviewed By: ~~ Date: ~. =t/18

Vanessa Szonda Senior Engineer Humber Treatment Plant OJillTDRONIDWater
130 The Queensway Tel: 416-392·2942 Etobicoke. Ontario MSY 1H9 Fax: 416-392-4514
Environmental Compliance Approval 0858-AEXNV7
August14,2018
York-Durham District Office 230 Westney Rd. S. 5th floor Ajax ON L1S 7J5
Attn: Shannon Boland
Re: Humber Treatment Plant Noise Complaint
Dear Ms. Boland,
On Monday, August 13, 2018, an odour complaint was called in to the plant control room. The complainant was at 150 Park Lawn Rd (Starbucks) and complained of a bad smell coming from the Humber Plant. The complaint was investigated by the Operator in Charge, and no unusual odours were detected. The odour complaint form is attached.
The complainant chose to remain anonymous and could not be contacted for a follow up.
Should you have any questions, please do not hesitate to contact me.
Best regards,
Vanessa Szonda, P.Eng Senior Engineer, Humber Treatment Plant City of Toronto, Toronto Water
CC: Voitke Kozakiewicz, P.Eng - Plant Manager, Humber Treatment Plant Satyanand Goolsarran - Environmental Health and Safety Representative Krishna Mahadeo - Area Supervisor Process Operations and Maintenance

-----------------------
Humber Treatment Plant UTORONIOWater
• o Other: ______________Type of Complaint: ¥ dor a Noise
Section A: Complaint Report
Received by:_ /'_ \.:...•.-,,:::f -,1fP~---------------------Complainant's Name: N~ Date of Complaint: -&......,.;L.;;....1 _,..a..,\~....,Z..... ....,d"--_____ Time of Complaint: _,),_-?.:...:,0,...0...._____5 Address: t5D ff\f.1'-liaw.c E>l Phone: tJA Complaint Details: &i ;;~or C@'.hQ'.:) tro.,n PJ(!jl+,
Section B: Investigation Report
Investigated by: :f.'rP . Date: bf) ~L,y . Time: .....JIL.£1-0;.!.,Q'-__________ Weather conditions: o Clear ~ Cloudy ..,-Humid o Inversion o Other: ________ Wind Direction: hl\lJ \Ql&«ilbc Wind intensity: _____ Temperature: 7er:, 0 C/
Were symptoms of the complaint evident at the time of the investigation: o Yes □ No
• Explain: No :r~,w o ,~Dl'-J •
Was the investigator able to determine the cause? o Yes ,¥No Details: ____________________________
Were there any remedial actions required and/or attempted? □ Yes
Details: ~1..J,.f;lCOLa~L-.IJ!a.....MU:20-J~~.....D.az..~µ!I::..J2Ua1/l..lllit--'~tHJ....a..L:::ll.ll..D.~µ~
Resolution/Conclusion:
Section C: Follow-Up Report
Completed by: ~ ·Sx ~ Date: ~U4"'(- \4 , ':) D~ Time: ~ ' ·· ___________~~=Qc~), Were others contacted regarding the complaint? o Yes 19"'1(Jo Details: _____________________________
Was a follow-up call made? □ Yes ~o Date: _______Time: _____
Additional Notes: Ne> ~ ,~f\MQ,,-V.Qr:-..,. (Wg,>..¥!,~

~~ TORONTO Water CITY OF TORONTO WASTEWATER TREATMENT PLANT
ANNUAL REPORTS
HUMBER TREATMENT PLANT 2018 ANNUAL REPORT
APPENDIX G – Maintenance Activities

APPENDIX G – Maintenance Activities
Solids Handling (Work Area 1)
Work Area 1 includes WAS thickening centrifuges, anaerobic digesters and gas collection, compression, and burner systems. A total of 2537 work orders were closed in this work area in 2018. The following maintenance on major structures, equipment, apparatus, mechanism or thing forming the Works was completed by Work Area 1 in 2018:
• Monthly valve exercise: o Centrate pump isolation valve. o Centrifuge feed pump valves. o MTI Line isolation valves. o TWAS Transfer Pump isolation valves.
• Monthly North Plant scum hopper chute and paddle cleaning. • Quarterly inspections:
o Waste gas burners. o TWAS transfer pumps. o MTI transfer pumps.
• Bi-annual cleaning and inspection of waste gas burner stack, thermal valve and flame arrestor.
• Bi-annual lubrication of bearings: o Sludge recirculation pumps. o MTI transfer pump. o Sludge transfer pumps.
• Bi-annual inspections: o Natural gas pilot pressure regulating valve. o Waste gas burners. o TWAS Transfer pumps (including motor lubrication). o MTI transfer pumps (including motor lubrication).
• Bi-annual North Plant scum collector cleaning and lubrication. • Annual lubrication and exercise of digester routing and sample valves. • Annual Inspections/maintenance:
o Centrate pump drive sheaves. o Centrifuge feed pumps. o Sludge recirculation pumps (including lubrication). o Sludge transfer pumps (including lubrication). o Centrifuge flexible chute connections. o MTI transfer pumps. o TWAS pumps.
• 2000 hour centrifuge inspection and lubrication on CF-4011, CF-4031, CF-4041, CF-4071.
• 4000 hour centrifuge lube oil filter change and oil reservoir level check CF-4031. • 2 year valve and piping inspections on primary and secondary digesters. • 3 year TWAS pump back plate and lobe inspection.

APPENDIX G – Maintenance Activities
• Added handles to P-3030 and P-3070 belt guard cover. • Overhaul of pump P-2368, P-3211, P-2369. • Installed guard rail around coffin covers for digester 8. • Replaced bearing housing on P-2531. • Replace seal pressure gage on P-3272. • Replaced Seal Water solenoid on P-2368, P-2369, P-3271, P-2318. • Replaced spools and elbows on digester transfer pumps P-3211, P-3212, P-3271, P-
3272. • Put Digester 9 back in service. • Modified all sludge transfer and recirculation pumps to accommodate cartridge
mechanical seals.
Liquid Primaries (Work Area 2)
Work Area 2 encompasses preliminary treatment processes including influent bar screens, aerated grit chambers, vortex grit chambers, and primary clarifiers. A total of 2272 work orders were closed in this work area in 2018. The following maintenance on major structures, equipment, apparatus, mechanism or thing forming the Works was completed by Work Area 2 in 2018:
• Monthly North Plant bridge lubrication. • Monthly scum transfer pump checks. • 2 month bar screen pillow block lubrication. • 2 month inspection and lubrication of bar screen rake switch and arm pivot
brushing. • 3 month bar screen carriage drive chain lubrication. • 6 month inspections:
o Bar screen conveyers. o Bar screen rake blades and shoes. o Primary scum pump (including lubrication). o Sludge transfer pump seal water line.
• 6 month North Plant scum collector cleaning and lubrication. • Annual inspection:
o South primary collector drives. o North primary bridges. o Sludge transfer pumps (and valve exercise). o Scum transfer pumps.
• Annual bar screen and compactor lubrication and parts replacement. • 2 year bar screen conveyor gearbox check and oil replacement on SC-0152. • 2 year scum and sludge long and cross collector gearbox lubrication check. • Chain repair on CM-0302, primary tank 3. • Replace deck plates on scum pump valve actuator for P-0130, P-0530, P-0730.

APPENDIX G – Maintenance Activities
• Hoist limit switches adjusted on North Plant primary bridges. • Desiccant breather replacement. • Teeth replacement on rake for bar screen SC-0142. • Replacement of flushing water valve actuator on bar screen SC-0152. • Replace broken sprocket cover/cap on CM-0101, primary tank 1. • Replace wiper teeth and leather on SC-0132, bar screen 4. • Replaced secondary rotary limit switches on CM-0902, primary tank 9.
Support Services (Work Area 3)
Work Area 3 includes support services around the plant, process air blowers, and the electrical system. A total of 4248 work orders were closed in this work area in 2018. The following maintenance on major structures, equipment, apparatus, mechanism or thing forming the Works was completed by Work Area 2 in 2018:
• Weekly Emergency generator inspection. • Biweekly boiler water testing. • Monthly:
o Test and verify emergency generator on load. o Blower inspection.
• 3 month: o Functional inspection of the phosphorus removal system pumps. o Waste gas burner inspections.
• 6 month : o Check of dechlorination pump VFD cabinet fan. o Verification of blower axial trip alarm operation. o Electrical generator inspection, testing and maintenance. o WAS pump inspection and motor bearing lubrication. o Testing of the blower motor bearings and auxiliary oil pump.
• Annual: o Calibration and functional check of sludge recirculation pumps and
instruments. o Electrical and instrumentation checks of centrifuges. o Centrifuge feed pump motor maintenance and functional resting of
discharge and suction pressure switch. o Check of sodium bisulphite piping heat trace and calibration of the
temperature transmitter. o Primary collector shutdown torque switch functional test. o Digester dome and tank instrument checks. o Centrate pump motor maintenance and testing of pressure switches. o Primary tank collector torque monitor calibration. o TWAS Pump motor maintenance and instrument calibration.

APPENDIX G – Maintenance Activities
o Sodium Bisulphite ultra-sonic level transmitter verification. o Megger testing of WAS and RAS pump motor and VFD inspection. o Functional testing of bar screen conveyer emergency trip circuit and rake
drive motor emergency shutdown circuit. o Blower soft start controller checks. o Generator control panel and instrumentation inspection. o Generator noise enclosure inspection. o Lubrication of diesel generator.
• 2 year 4.16 kV MCC checks. • 2000 hour Centrifuge RTD functional checks and motor lubrication. • Replaced lubrication oil cooler on blower BL-1311. • Overhauled discharge valve on blower BL-1401. • Replaced level sensors on Digesters 4, 6 ,7, 8, 9 and 10. • Replaced soft-start control on blowers. • Replaced VFDs on RAS pumps. • Repaired motor on MTI pumps. • Optimization and run process adjustment of the cogeneration system.
Liquid Secondaries (Work Area 4)
Work Area 4 encompasses secondary treatment processes including aeration, phosphorus removal and final clarification. A total of 2256 work orders were closed in this work area in 2018. The following maintenance on major structures, equipment, apparatus, mechanism or thing forming the Works was completed by Work Area 2 in 2018:
• Annual: o WAS/RAS pump and pump motor inspection. o Inspection of dechlorination spill tanks. o Condition check for sodium hypochlorite holding tanks. o Efficiency test of sodium hypochlorite dosing pump. o Final tank inspection of collector arms and main drives.
• Quarterly o Cleaning of sodium hypochlorite dosing pump inlet strainer. o Dechlorination sample pump inspection.
• 6 month o Scum and sludge collector gearbox oil check and inspection. o Scum tank inspection.
• Monthly o Sodium Hypochlorite tank inspection (detection holes and stave joints)
• Weekly o Inspection of suction and discharge pressure for dechlorination pumps
• Repair of sodium hypochlorite emergency feed line (T-9000). • Repair of collector arm on final tanks 6 and 13.

APPENDIX G – Maintenance Activities
• Rebuild of scum piping system on final tank 13. • Rebuild of final tank 18 collector gear box. • Rebuild of various scum and ferrous dosing pumps. • Repair of ferrous chloride P-0340 discharge pressure gauge.

~~ TORONTO Water CITY OF TORONTO WASTEWATER TREATMENT PLANT
ANNUAL REPORTS
HUMBER TREATMENT PLANT 2018 ANNUAL REPORT
APPENDIX H – Staff Training Courses
APPENDIX H– Staff Training Courses
Training attended by Humber Treatment Plant operations and skilled trades staff in 2018 includes the list of courses below.
Technical and Health and Safety Training:
• Activated Sludge • Aeration Tank 5 Gate Training • Aeration Tank 5 Grid and Mixer • Aeration Tank 5 Training • Aeration Tank 5 Valve Training • Air purifying Respirators (2017) • Air Quality and Your Health (May 2018 Tailgate) • Arc Flash for Non-Qualified Persons (2017) • Asbestos Awareness • Backflow Prevention Awareness (2016-2018) • Basic Vibration Analysis • Behavior and effects of Air in Water Distribution Systems • Centrifugal and Positive Displacement Pump Operation • Conductors (2016-2018) • Confined Space Awareness • Confined Space Awareness 1/2 day (2016-2018) • Confined Space Rescue - 2 day • Critical Pump Maintenance, Packing and Mechanical Seals • Cross Connection Specialist Backflow Tester - Certification • Designated Substances Awareness • Disinfection of Potable Water Piping (2016) • Electrical Safety for District Operations & Maintenance Operators (2016-2018) • Electrical Safety for Maintenance Staff (2016-2018) • Emergency First Aid Level 'A' CPR (2016-2018) • Fall Protection Awareness • Fire Hydrant Replacement (On-The-Job) • Fundamentals of Ladder Safety Awareness • Health and Safety Competency for Front-line Supervisors • Hot Work Permit System Awareness (2016-2018) • Incident reporting (2017) • In-Service Health & Safety Orientation • JHSC Recognition Event • Joint Health and Safety Committees - (JHSC) Certification Training Part I - Basic • Joint Health and Safety Committees - (JHSC) Certification Training Part II - Workplace
Specific Hazard Training

APPENDIX H– Staff Training Courses
• Lock Out, Tag Out & Test Awareness (2016-2018) • Lockout, Tag Out and Test Awareness • Logbook Entry (2017-2019) • Mathematics for Operators: Module 2 (2016-2018) • Mathematics for Operators: Module 3 (2017-2019) • MMR - Self Contained Breathing Apparatus (2018-2020) • Mould Awareness • North Primary Bridges Training for HVAC and Maintenance Mode • On the job: Humber WWTP Co-Gen System Operation • On the job: Humber WWTP Digestion Process Major Components • On the job: Humber WWTP Distribution and Grit Removal Process • On the job: Humber WWTP Sludge Thickening Process Overview • On the job: Humber WWTP Solids Work Area Overview • Plant Technician Training - Day 6 • Preliminary and Primary Aeration Diffuser Training • Preventing Back Injuries (August 2018 Tailgate) • Rigging Safety Awareness (2016-2018) • Safety Data Sheet Interpretation for WHMIS 2015 • Safety in a High Voltage Environment (2016-2018) • Safety on the Road (November 2018 Tailgate) • Scaffolding Awareness Course (2016-2018) • Secondary Upgrades Instrument Training • Standard First Aid - Level "C" CPR & AED - 2 Day (2016-2018) • SW ST Slips, Trips and Falls Prevention • SW ST Tipping Floor Traffic Management • Tailgate - Personal Protective Equipment Training • Tailgate-Ladders, Safety Procedure SP25 • Tailgate-Lifting Safely: Posture Matters • Toronto Water Orientation • Traffic Control Roadway Work (2016-2018) • Transport of Dangerous Goods (2016-2018) • Trenching and Excavation Awareness (2016-2018) • Water Leak Detection Listening Course • Water Valve Training, Selection, Operation, Maintenance • West Substation RPU • West Substation Upgrades- Humber TP • Winterwise: The Cold Hard Facts About Distribution Systems • WMS Avantis Workshop • WWT - MOECC Exam Prep for Wastewater Treatment Level 3 and 4

APPENDIX H– Staff Training Courses
Other Training:
• 2018 Equity Symposium - #Times Up - Working Together to end workplace sexual harassment
• Building Customer-Centric Culture from the Inside Out • Building Resilience While Facing Adversity in Work and Life • Customer Service Excellence for the Internal Customer • Human Rights in the Workplace • Leadership Skills for Non-Managers • Lean White Belt Training • Long Range Financial Planning • Outlook 2013: All About Outlook 2013 • Performance Management in a Unionized Environment • PFR - PK - Returning Employee Overview 2018 (REO) • Psychological and Mental Health in Our Workplace (Tailgate February 2018) • Respect in Our Workplace • Role of the Employee During Change • TPS New Employee Orientation Day (NEO) • Transition to Manager II: Implementing Your Plan • Understanding Your Leadership Capacity & How Emotions Play a Part • Wellness and Resiliency