Embed Size (px)
Citation preview
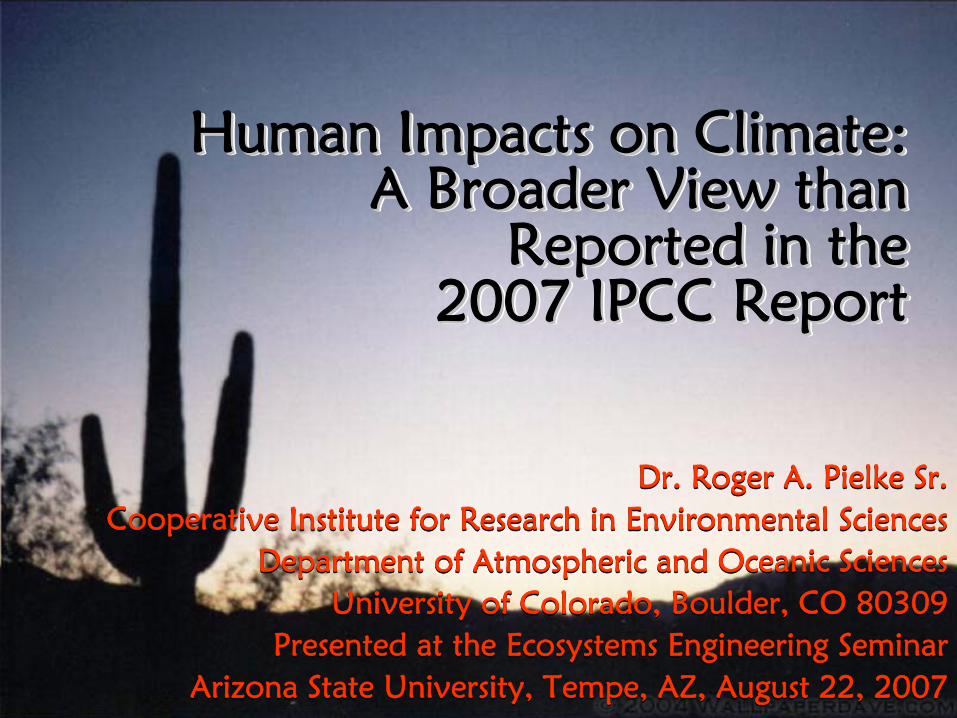
Dr. Roger A. Pielke Sr.Cooperative Institute for Research in Environmental Sciences
Department of Atmospheric and Oceanic Sciences University of Colorado, Boulder, CO 80309
Presented at the Ecosystems Engineering SeminarArizona State University, Tempe, AZ, August 22, 2007
Dr. Roger A. Pielke Sr.Cooperative Institute for Research in Environmental Sciences
Department of Atmospheric and Oceanic Sciences University of Colorado, Boulder, CO 80309
Presented at the Ecosystems Engineering SeminarArizona State University, Tempe, AZ, August 22, 2007
Human Impacts on Climate: A Broader View than
Reported in the 2007 IPCC Report
Human Impacts on Climate: Human Impacts on Climate: A Broader View than A Broader View than
Reported in the Reported in the 2007 IPCC Report2007 IPCC Report

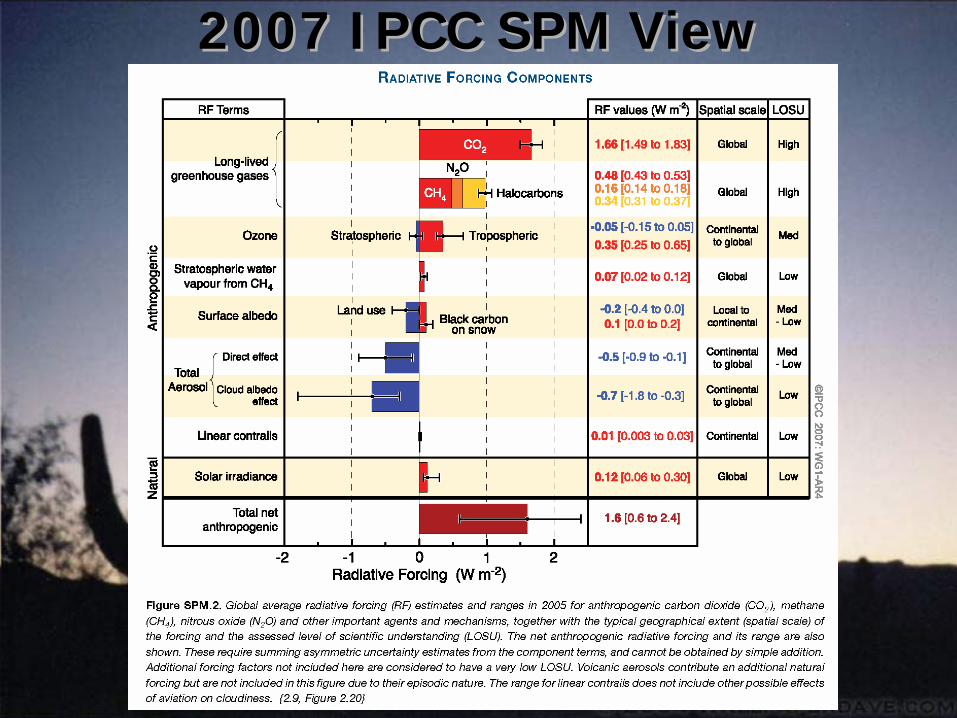
2007 IPCC SPM View2007 IPCC SPM View

FIGURE SPM-2. Global-average radiative forcing (RF) estimates and ranges in 2005 for anthropogenic carbon dioxide (CO2), methane (CH4), nitrous oxide (N2O) and other important agents and mechanisms, together with the typical geographical extent (spatial scale) of the forcing and the assessed level of scientific understanding (LOSU). The net anthropogenic radiative forcing and its range are also shown. These require summing asymmetric uncertainty estimates from the component terms, and cannot be obtained by simple addition. Additional forcing factors not included here are considered to have a very low LOSU.
Volcanic aerosols contribute an additional
natural forcing but are not included in this figure due to their episodic nature. Range for linear contrails does not include other possible effects of aviation on cloudiness.
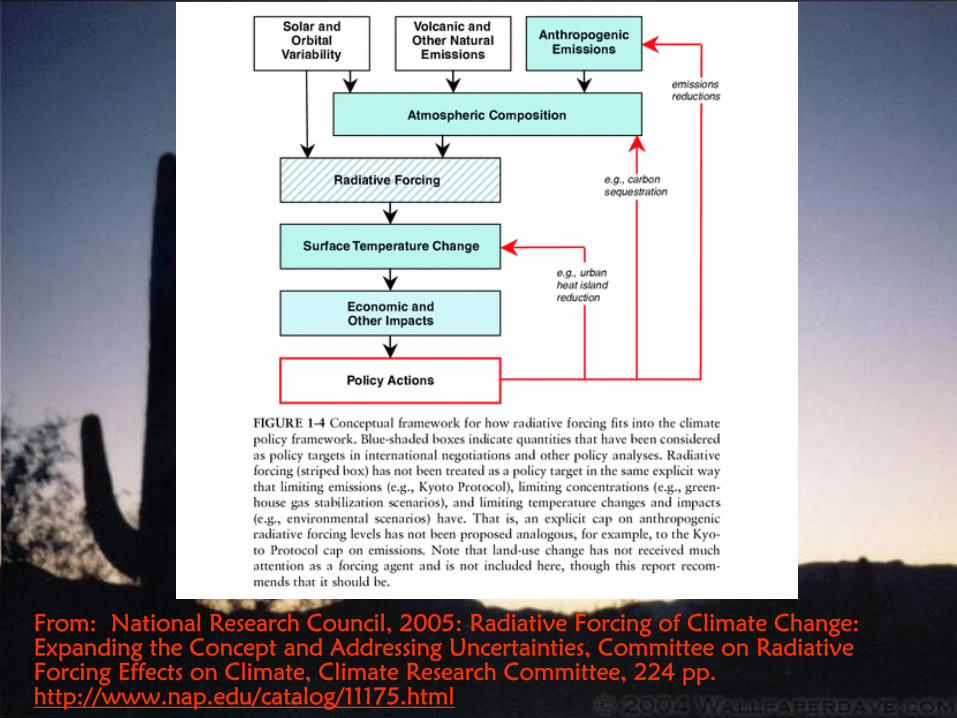
From: National Research Council, 2005: Radiative Forcing of Climate Change: Expanding the Concept and Addressing Uncertainties, Committee on
Radiative Forcing Effects on Climate, Climate Research Committee, 224 pp.
http://www.nap.edu/catalog/11175.html

Did The IPCC Did The IPCC AdequatelyAdequately
Consider All Consider All Significant PositiveSignificant Positive Radiative Forcings?Radiative Forcings?

Estimates of Positive Radiative Forcing [In Watts per meter squared]
Estimates of Positive Radiative ForcingEstimates of Positive Radiative Forcing [In Watts per meter squared][In Watts per meter squared]
Methane +0.8Short-wave albedo change +0.5Tropospheric ozone +0.3Aerosol black carbon +0.2Black carbon on snow and ice +0.3Semi-direct aerosol effect +0.1Glaciation effect +0.1Solar influences +0.25Dust ?
The CO2 contribution to the radiative warming decreases to 30% or less using the IPCC framework given in the 2001 IPCC
The Narrow Focus of the IPCC Assessment
The IPCC Authors are Climate Skeptics
The Narrow Focus of the The Narrow Focus of the IPCC AssessmentIPCC Assessment
The IPCC Authors are Climate Skeptics

Cotton, W.R. Cotton, W.R. and R.A. Pielke, and R.A. Pielke, 2007: 2007: Human Human
impacts on impacts on weather and weather and
climate, climate, Cambridge Cambridge University University
Press, 330 pp.Press, 330 pp.

Politicalization of Climate SciencePoliticalization of Climate SciencePoliticalization of Climate Science
The current focus is on carbon dioxide emissions from fossil fuel combustion (the IPCC view).
Since the climate forcing of CO2 is only one of a diverse set of first order human climate forcings, and global warming is only a subset of climate change (NRC,2005; IGBP-BAHC, 2004), the current IPCC focus is an ineffective climate policy.
The current IPCC focus is to use the focus on CO2 to promote changes in energy policy.
The use of carbon dioxide as the instrument to promote energy policy changes, however, is an inappropriately blunt instrument for this purpose, and can lead to poor energy policy decisions.

The Climate System Is Much More
Than Long-term Weather Statistics
The Climate System Is Much More
Than Long-term Weather Statistics
Climate Is Not A Boundary Value Problem But An
Initial Value Problem
Climate Is Not A Boundary Value Problem But An
Initial Value Problem
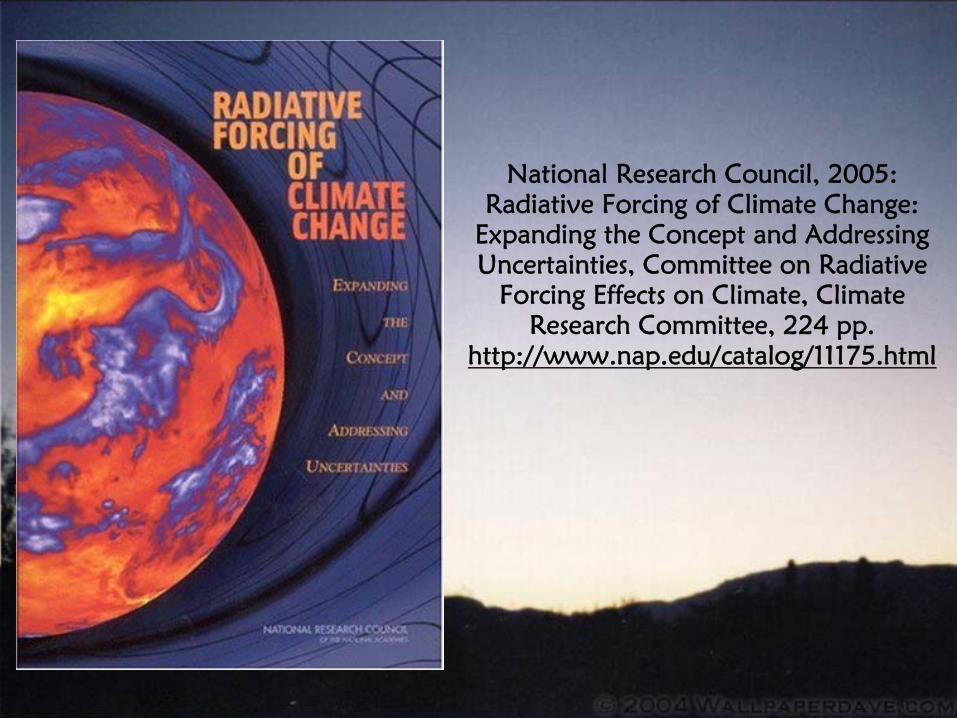
National Research Council, 2005: Radiative Forcing of Climate Change:
Expanding the Concept and Addressing Uncertainties, Committee on Radiative
Forcing Effects on Climate, Climate Research Committee, 224 pp.
http://www.nap.edu/catalog/11175.html

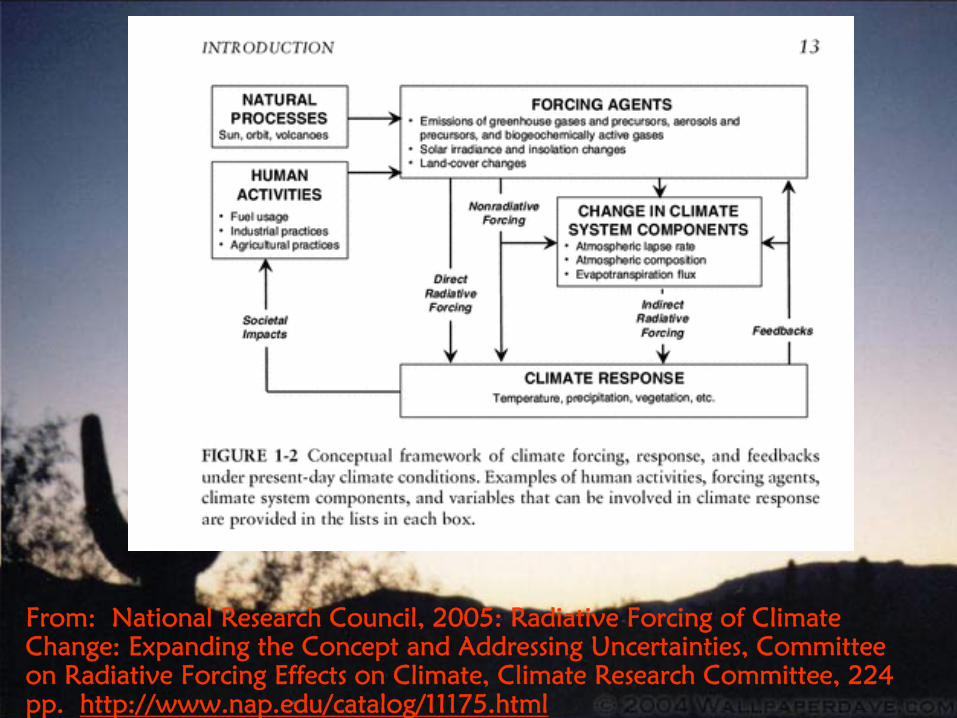
From: National Research Council, 2005: Radiative Forcing of Climate Change: Expanding the Concept and Addressing Uncertainties, Committee on
Radiative Forcing Effects on Climate, Climate Research Committee, 224 pp. http://www.nap.edu/catalog/11175.html
From: National Research Council, 2005: Radiative Forcing of Climate Change: Expanding the Concept and Addressing Uncertainties, Committee on Radiative Forcing Effects on Climate, Climate Research Committee, 224 pp. http://www.nap.edu/catalog/11175.html

EXPANDING THE RADIATIVE FORCING CONCEPT
(NRC 2005 Recommendations)
EXPANDING THE RADIATIVE FORCING CONCEPT
(NRC 2005 Recommendations)
Account for the Vertical Structure of Radiative Forcing Determine the Importance of Regional Variation in Radiative Forcing Determine the Importance of Nonradiative ForcingsProvide Improved Guidance to the Policy Community
Account for the Vertical Structure of Account for the Vertical Structure of Radiative Forcing Radiative Forcing Determine the Importance of Regional Determine the Importance of Regional Variation in Radiative Forcing Variation in Radiative Forcing Determine the Importance of Nonradiative Determine the Importance of Nonradiative ForcingsForcingsProvide Improved Guidance to the Policy Provide Improved Guidance to the Policy Community Community
Account for the Vertical Structure of Radiative Forcing
Account for the Vertical Structure of Radiative Forcing
National Research Council Report PRIORITY RECOMMENDATIONS
Test and improve the ability of climate models to reproduce the observed vertical structure of forcing for a variety of locations and forcing conditions.
National Research Council Report PRIORITY RECOMMENDATIONS
Test and improve the ability of climate models to reproduce the observed vertical structure of forcing for a variety of locations and forcing conditions.

Account for the Vertical Structure of Radiative Forcing
Account for the Vertical Structure of Radiative Forcing
National Research Council Report PRIORITY RECOMMENDATIONS
Undertake research to characterize the dependence of climate response on the vertical structure of radiative forcing.
National Research Council Report PRIORITY RECOMMENDATIONS
Undertake research to characterize the dependence of climate response on the vertical structure of radiative forcing.
Account for the Vertical Structure of Radiative Forcing
Account for the Vertical Structure of Radiative Forcing
National Research Council Report PRIORITY RECOMMENDATIONS
Report global mean radiative forcing at both the surface and the top of the atmosphere in climate change assessments.
National Research Council Report PRIORITY RECOMMENDATIONS
Report global mean radiative forcing at both the surface and the top of the atmosphere in climate change assessments.

Determine the Importance of Determine the Importance of Regional Variation in Regional Variation in
Radiative ForcingRadiative Forcing
National Research Council Report PRIORITY RECOMMENDATIONS
Use climate records to investigate relationships between regional radiative forcing (e.g., land use or aerosol changes) and climate response in the same region, other regions, and globally.
National Research Council Report PRIORITY RECOMMENDATIONS
Use climate records to investigate relationships between regional radiative forcing (e.g., land use or aerosol changes) and climate response in the same region, other regions, and globally.

Determine the Importance of Determine the Importance of Regional Variation in Regional Variation in
Radiative ForcingRadiative Forcing
National Research Council Report PRIORITY RECOMMENDATIONS
Quantify and compare climate responses from regional radiative forcings in different climate models and on different timescales (e.g., seasonal, interannual), and report results in climate change assessments.
National Research Council Report PRIORITY RECOMMENDATIONS
Quantify and compare climate responses from regional radiative forcings in different climate models and on different timescales (e.g., seasonal, interannual), and report results in climate change assessments.

National Research Council Report PRIORITY RECOMMENDATIONS
Improve understanding and parameterizations of aerosol-cloud thermodynamic interactions and land-atmosphere interactions in climate models in order to quantify the impacts of these nonradiative forcings on both regional and global scales.
National Research Council Report PRIORITY RECOMMENDATIONS
Improve understanding and parameterizations of aerosol-cloud thermodynamic interactions and land-atmosphere interactions in climate models in order to quantify the impacts of these nonradiative forcings on both regional and global scales.
Determine the Importance of Determine the Importance of Nonradiative ForcingsNonradiative Forcings

National Research Council Report PRIORITY RECOMMENDATIONS
Develop improved land-use and land-cover classifications at high resolution for the past and present, as well as scenarios for the future.
National Research Council Report PRIORITY RECOMMENDATIONS
Develop improved land-use and land-cover classifications at high resolution for the past and present, as well as scenarios for the future.
Determine the Importance of Determine the Importance of Nonradiative ForcingsNonradiative Forcings

National Research Council Report PRIORITY RECOMMENDATIONS
Encourage policy analysts and integrated assessment modelers to move beyond simple climate models based entirely on global mean TOA radiative forcing and incorporate new global and regional radiative and nonradiative forcing metrics as they become available.
Provide Improved Guidance Provide Improved Guidance to the Policy Communityto the Policy Community

Skillful Multi-decadal Climate Predictions On The Global,
Zonally-Averaged And Regional Scales Have Not Been Achieved
Skillful Multi-decadal Climate Predictions On The Global,
Zonally-Averaged And Regional Scales Have Not Been Achieved

Finding from
Temperature Trends in the Lower Atmosphere: Steps for Understanding and Reconciling Differences. Thomas R. Karl, Susan J. Hassol, Christopher D. Miller, and William L. Murray, editors, 2006. A Report by the Climate Change Science Program and the Subcommittee on Global Change Research, Washington, DC.
“Tropical Temperature Results (20°S to 20°N) Although the majority of observational data sets show
more warming at the surface than in the troposphere, some observational data sets show the opposite
behavior. Almost all model simulations show more warming in the troposphere than at the surface. This
difference between models and observations may arise from errors that are common to all models, from errors in the observational data sets, or from a combination of
these factors. The second explanation is favored, but the issue is still open.”
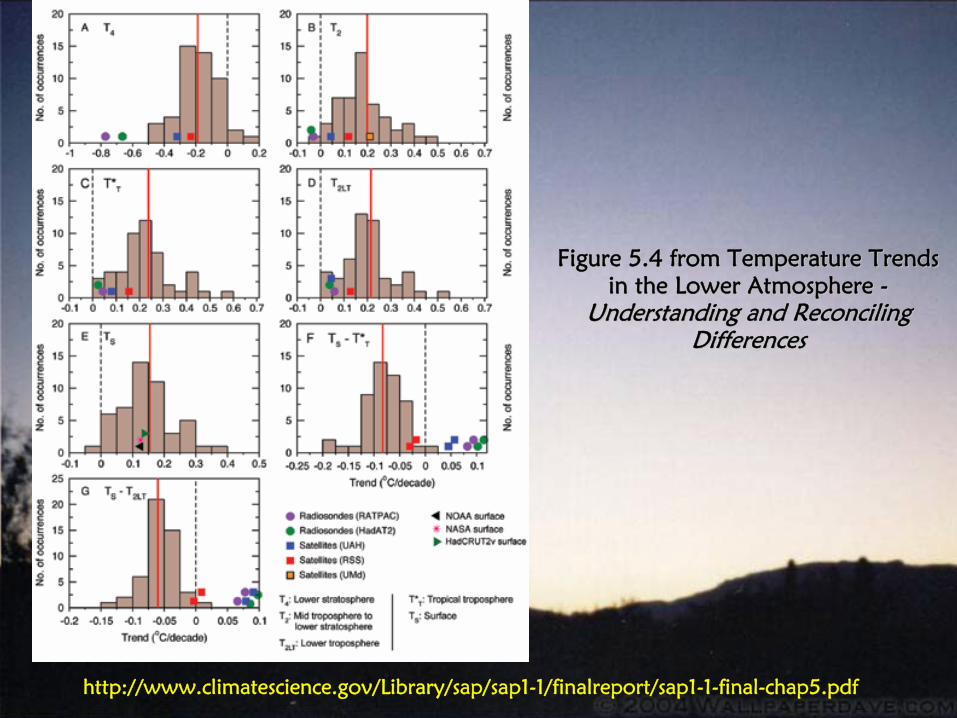
http://www.climatescience.gov/Library/sap/sap1-1/finalreport/sap1-1-final-chap5.pdf
Figure 5.4 from Temperature Trends Figure 5.4 from Temperature Trends in the Lower Atmosphere in the Lower Atmosphere --
Understanding and Reconciling Understanding and Reconciling
DifferencesDifferences
The Global-Averaged Surface Temperature
Trends Assessment Is An Inadequate Climate
Change Metric
The Global-Averaged Surface Temperature
Trends Assessment Is An Inadequate Climate
Change Metric

One of the objectives of the USHCN, however, as stated in Easterling
et al. (1996), ". . . was to detect temporal
changes in regional rather than local climate. Therefore, only stations not influenced to any substantial degree by
artificial changes in their local environments were included in the network."
Easterling, D. R., and T. C. Peterson, 1995: A new method for detecting undocumented discontinuities in climatological time series. Int. J. Climatol., 15, 369-377.
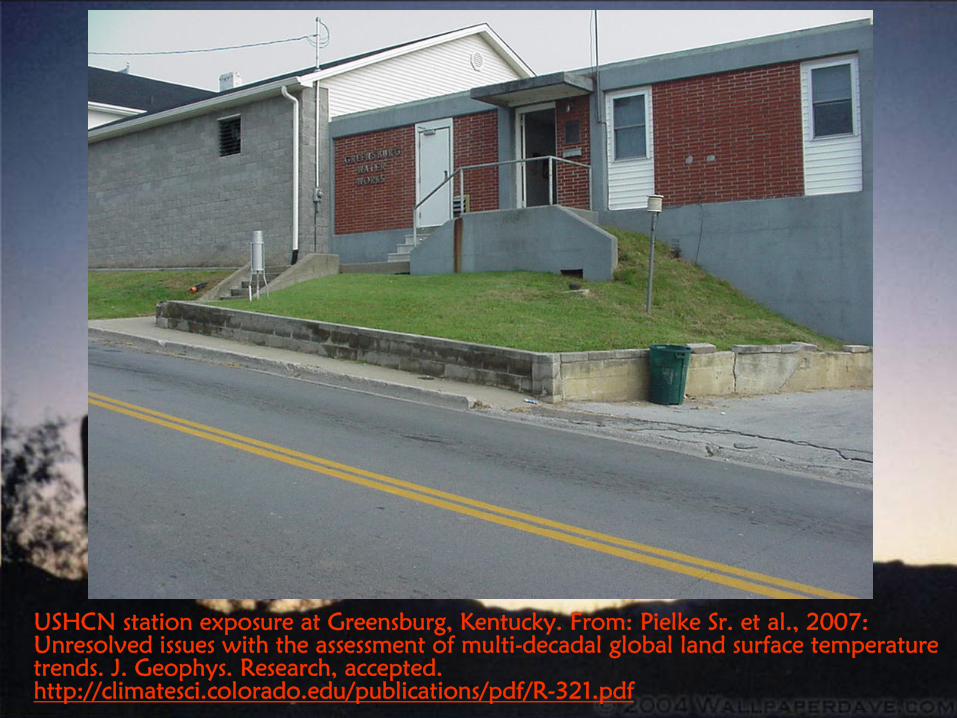
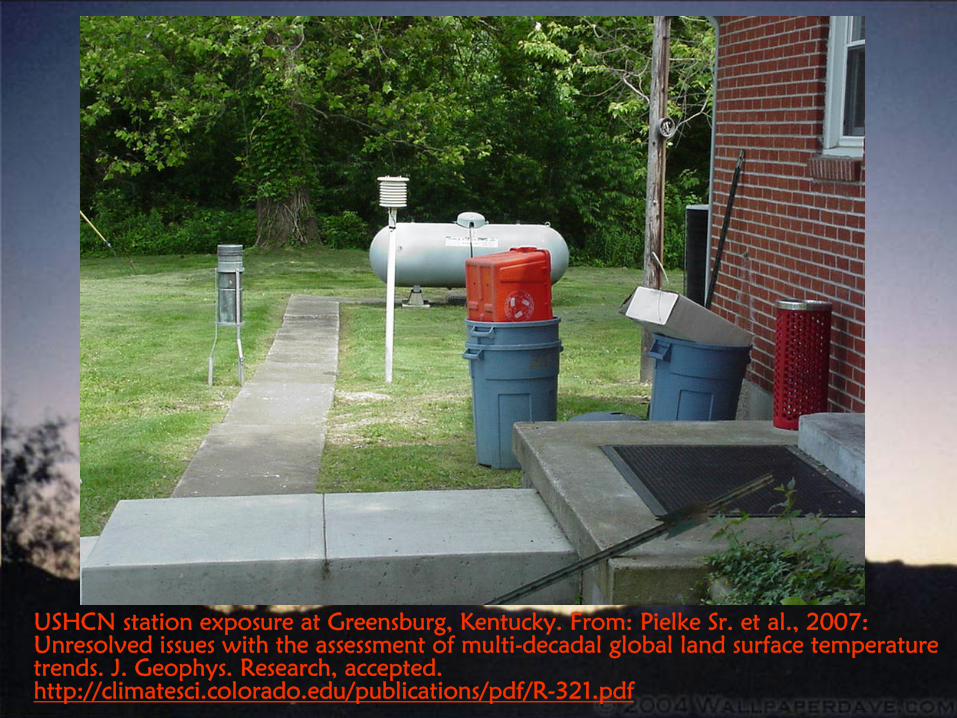
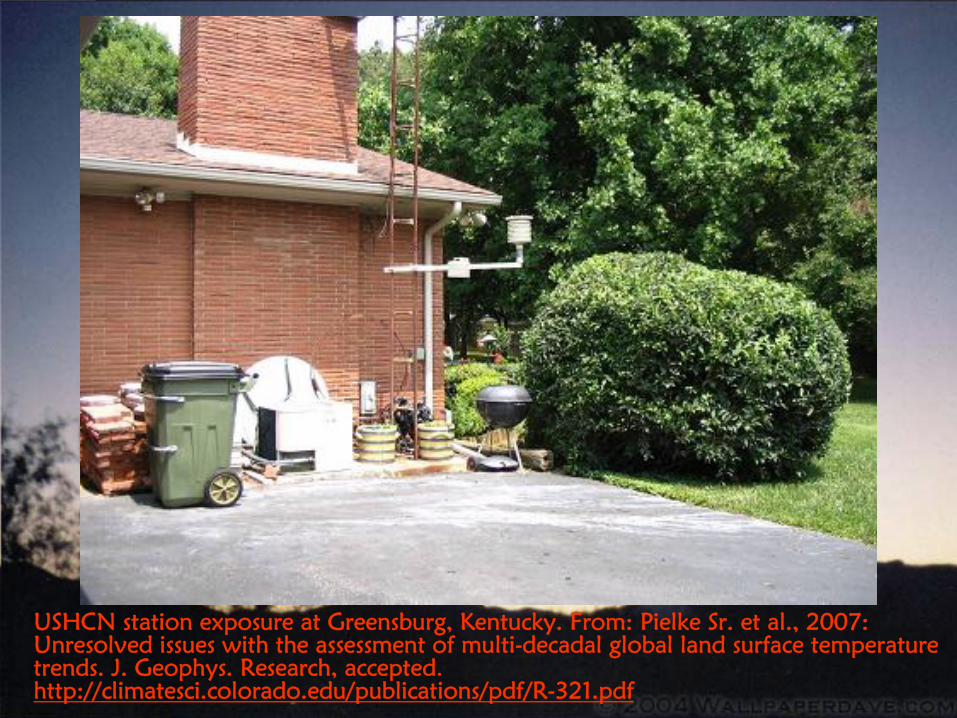
USHCN station exposure at Greensburg, Kentucky. From: Pielke Sr.
et al., 2007: Unresolved issues with the assessment of multi-decadal global land surface temperature trends. J. Geophys. Research, accepted. http://climatesci.colorado.edu/publications/pdf/R-321.pdf
USHCN station exposure at Greensburg, Kentucky. From: Pielke Sr.
et al., 2007: Unresolved issues with the assessment of multi-decadal global land surface temperature trends. J. Geophys. Research, accepted. http://climatesci.colorado.edu/publications/pdf/R-321.pdf

USHCN station exposure at Greensburg, Kentucky. From: Pielke Sr.
et al., 2007: Unresolved issues with the assessment of multi-decadal global land surface temperature trends. J. Geophys. Research, accepted. http://climatesci.colorado.edu/publications/pdf/R-321.pdf
USHCN station exposure at Greensburg, Kentucky. From: Pielke Sr.
et al., 2007: Unresolved issues with the assessment of multi-decadal global land surface temperature trends. J. Geophys. Research, accepted. http://climatesci.colorado.edu/publications/pdf/R-321.pdf
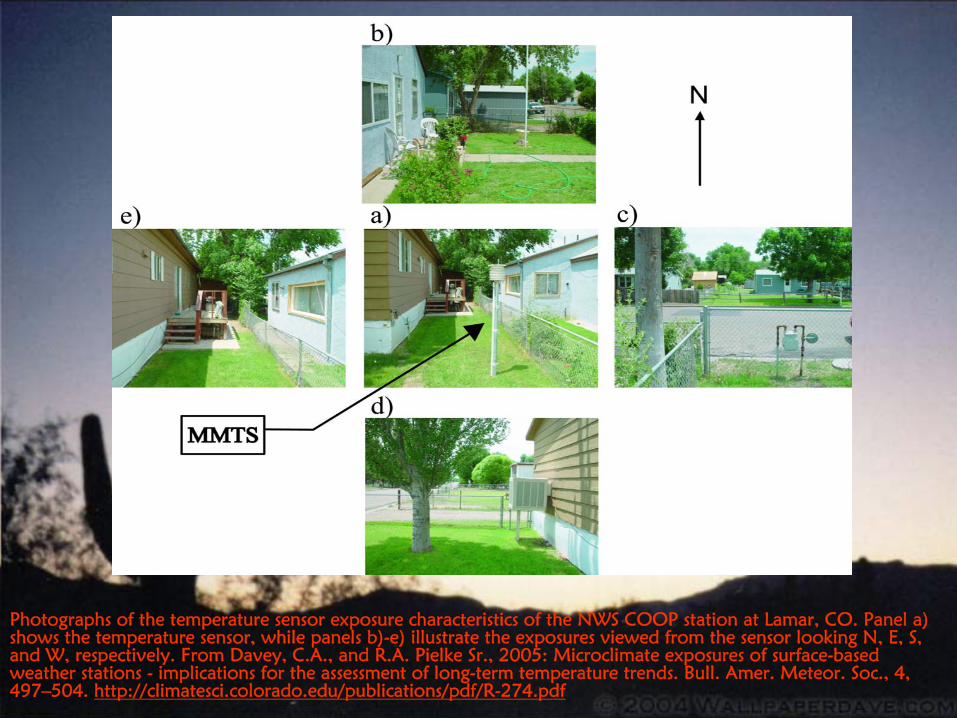
Photographs of the temperature sensor exposure characteristics of the NWS COOP station at Lamar, CO. Panel a) shows the temperature sensor, while panels b)-e) illustrate the exposures viewed from the sensor looking N, E,
S, and W, respectively. From Davey, C.A., and R.A. Pielke Sr., 2005: Microclimate exposures of surface-based weather stations -
implications for the assessment of long-term temperature trends. Bull. Amer. Meteor. Soc., 4, 497–504. http://climatesci.colorado.edu/publications/pdf/R-274.pdf

This is the climatological station of record for Odessa, Washington. It is at the residence of a COOP weather observer administered by NOAA. The photo was taken by surfacestations.org
volunteer surveyor Bob Meyer. From: http://www.norcalblogs.com/watts/

Photographs of the temperature sensor exposure characteristics for the NWS COOP station near Rocky Ford, Colorado. Panel a) shows the temperature sensor, while panels b)-e) illustrate the exposures viewed from the temperature sensor looking N, E, S, and W, respectively. (CRS-Cotton Region Shelter). From Davey, C.A., and R.A. Pielke Sr., 2005: Microclimate exposures of surface-
based weather stations -
implications for the assessment of long-term temperature trends. Bull. Amer. Meteor. Soc., 4, 497–504. http://climatesci.colorado.edu/publications/pdf/R-274.pdf
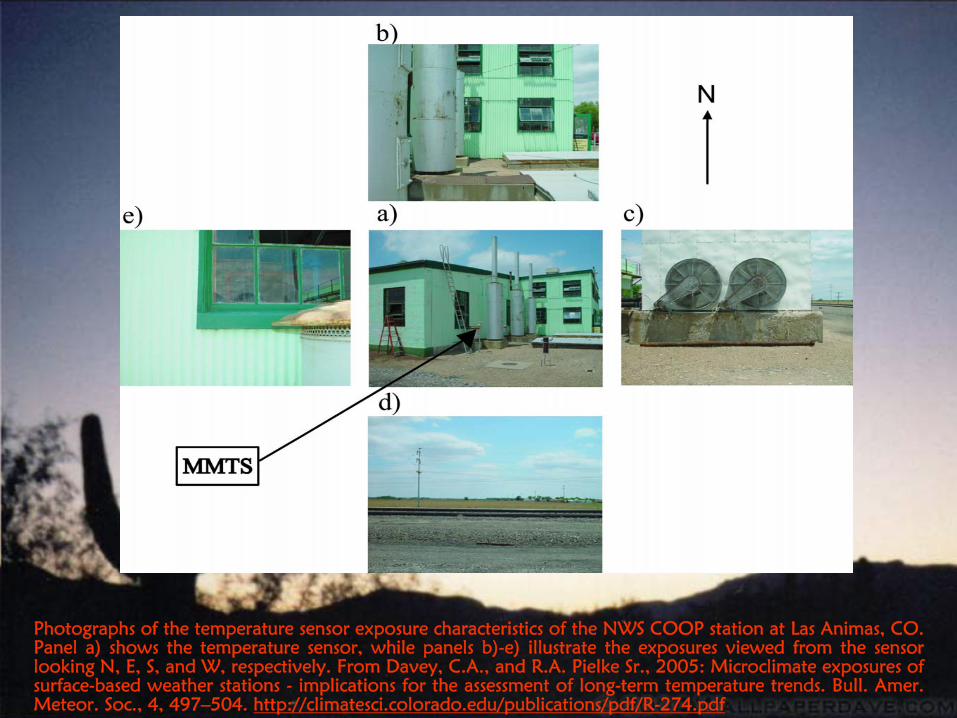
Photographs of the temperature sensor exposure characteristics of the NWS COOP station at Las Animas, CO. Panel a) shows the temperature sensor, while panels b)-e) illustrate the exposures viewed from the sensor looking N, E, S, and W, respectively. From Davey, C.A., and R.A. Pielke Sr., 2005: Microclimate exposures of surface-based weather stations -
implications for the assessment of long-term temperature trends. Bull. Amer. Meteor. Soc., 4, 497–504. http://climatesci.colorado.edu/publications/pdf/R-274.pdf
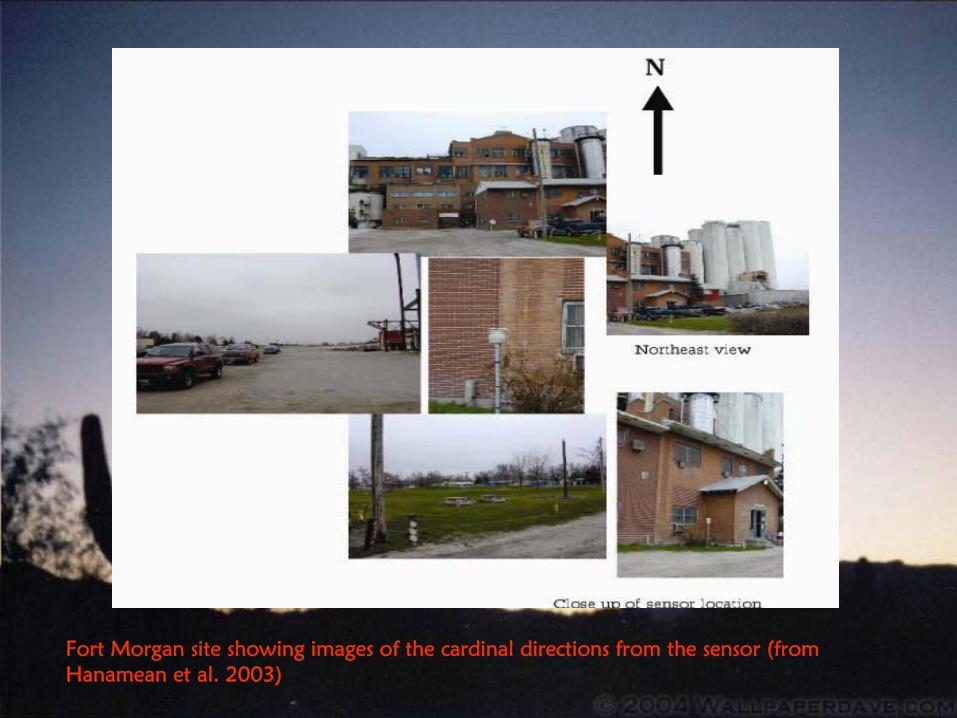
Fort Morgan site showing images of the cardinal directions from the sensor (from Hanamean et al. 2003)
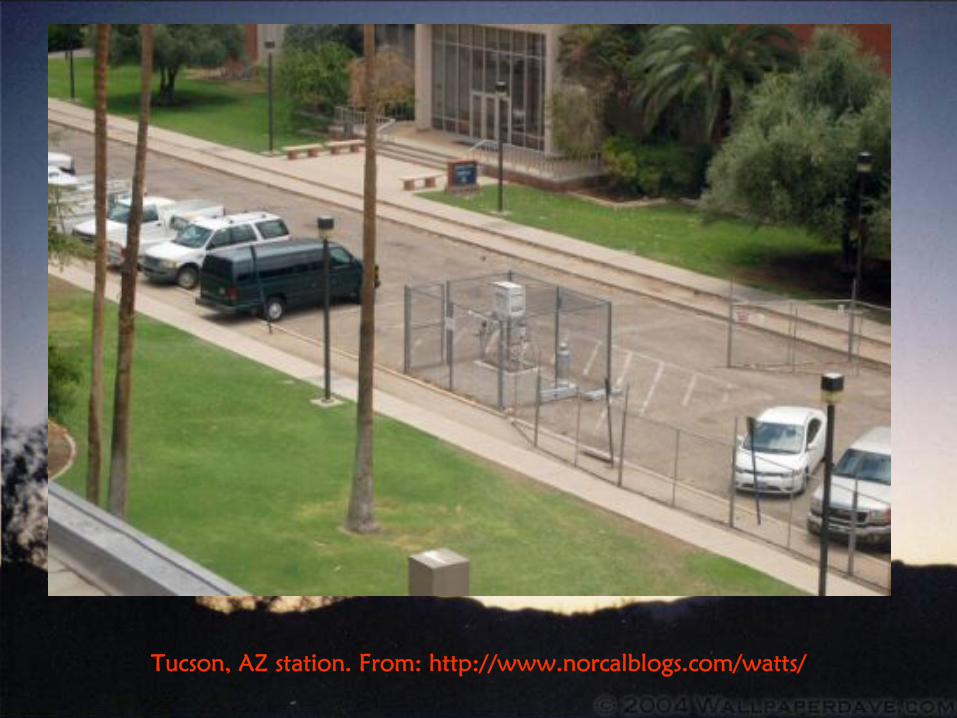
Tucson, AZ station. From: http://www.norcalblogs.com/watts/
Ocean Heat Content Ocean Heat Content Changes Over Time Changes Over Time
Provide An Effective Provide An Effective Metric To Diagnose Metric To Diagnose
The Radiative The Radiative Imbalance of the Imbalance of the
Climate SystemClimate System

From Lyman, J.M., J. Willis, and G. Johnson, 2006: Recent cooling of the upper ocean. Geophys Res. Lett., 33, L18604, doi:10.1029/2006GL027033. Correction completed April 2007 which eliminates cooling but finds no warming in recent years.

A Litmus Test For Global WarmingA Litmus Test For Global WarmingJoules must accumulate in the ocean each year at a more Joules must accumulate in the ocean each year at a more
or less monotonic rate of about 10or less monotonic rate of about 102222
Joules per yearJoules per year
2003 8 × 102003 8 × 102222 JoulesJoules2004 9 × 102004 9 × 102222 JoulesJoules2005 10 × 102005 10 × 102222 JoulesJoules2006 11 × 102006 11 × 102222 JoulesJoules2007 12 × 102007 12 × 102222 JoulesJoules2008 13 × 102008 13 × 102222 JoulesJoules2009 14 × 102009 14 × 102222 JoulesJoules2010 15 × 102010 15 × 102222 JoulesJoules2011 16 × 102011 16 × 102222 JoulesJoules2012 17 × 102012 17 × 102222 JoulesJoules
Correction to the Lyman et al. paper Correction to the Lyman et al. paper removes recent cooling but also removes recent cooling but also
does not show warmingdoes not show warming
Other data also show little if any Other data also show little if any global warming since 2002global warming since 2002
SSTs tropospheric temperaturesSSTs tropospheric temperatures [RSS and UAH MSU data][RSS and UAH MSU data]
2007 IPCC SPM View2007 IPCC SPM View
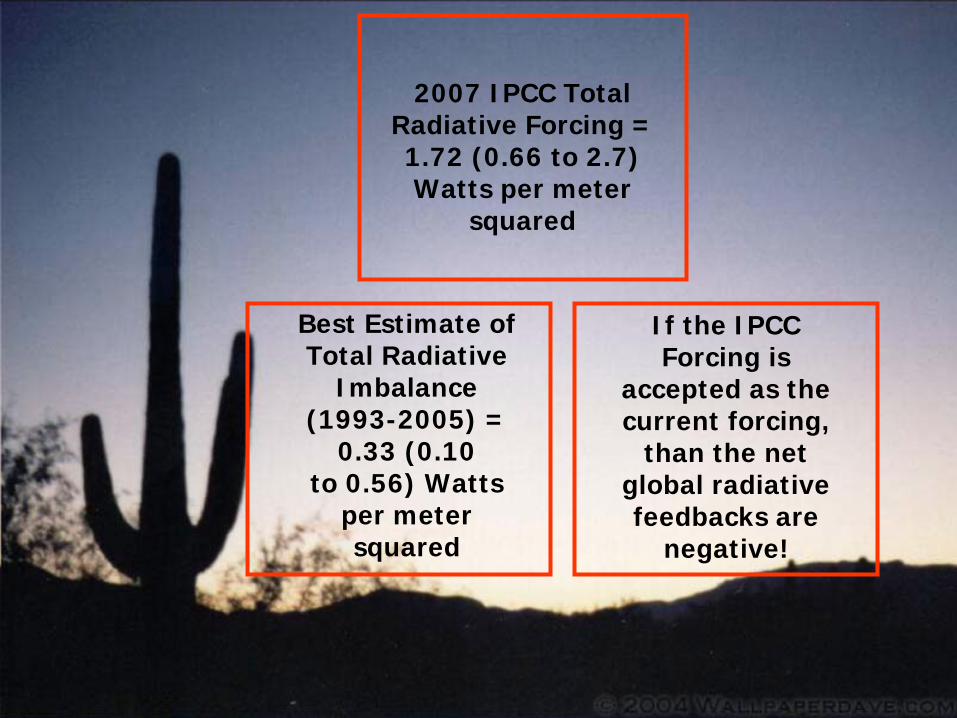
2007 IPCC Total Radiative Forcing = 1.72 (0.66 to 2.7) Watts per meter
squared
Best Estimate of Total Radiative
Imbalance (1993-2005) =
0.33 (0.10 to 0.56) Watts
per meter squared
If the IPCC Forcing is
accepted as the current forcing,
than the net global radiative feedbacks are
negative!
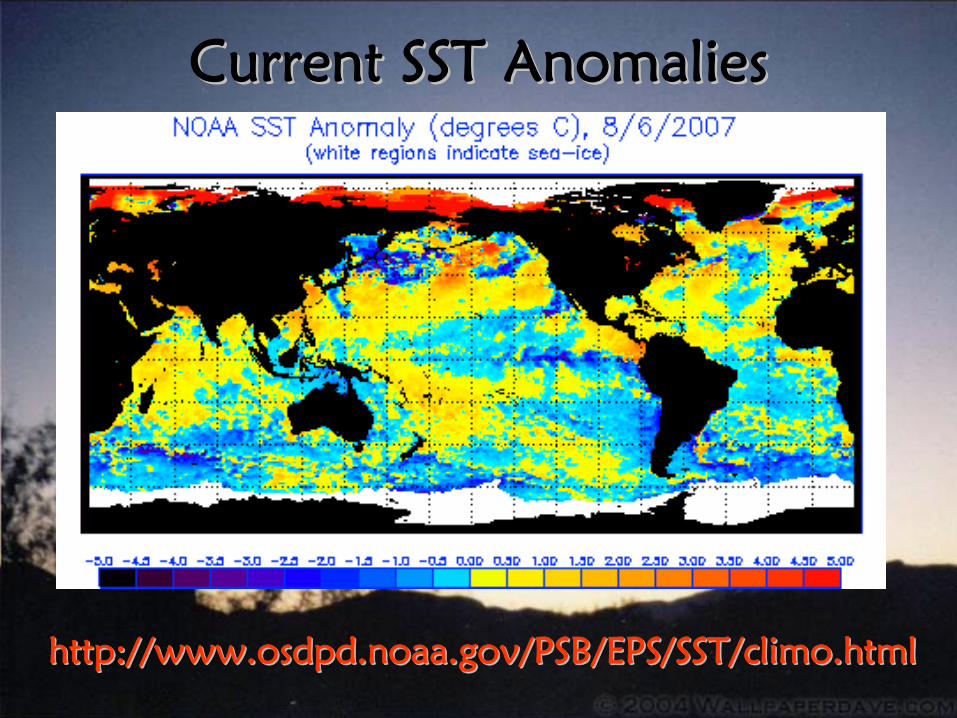
Current SST AnomaliesCurrent SST Anomalies
http://http://www.osdpd.noaa.gov/PSB/EPS/SST/climo.htmlwww.osdpd.noaa.gov/PSB/EPS/SST/climo.html
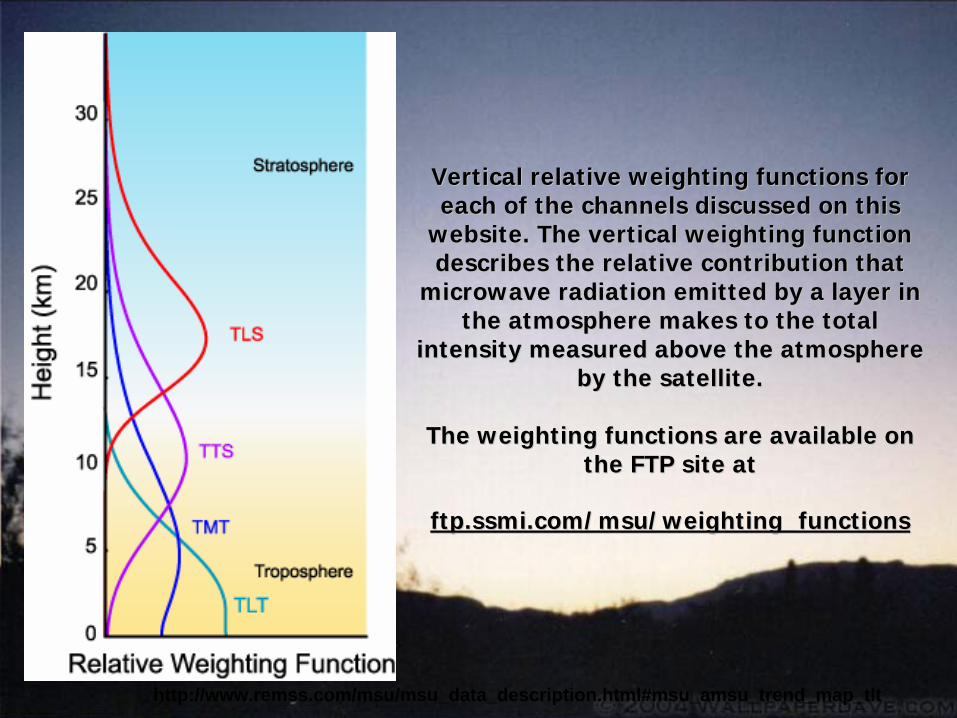
Vertical relative weighting functions for Vertical relative weighting functions for each of the channels discussed on this each of the channels discussed on this
website. The vertical weighting function website. The vertical weighting function describes the relative contribution that describes the relative contribution that
microwave radiation emitted by a layer in microwave radiation emitted by a layer in the atmosphere makes to the total the atmosphere makes to the total
intensity measured above the atmosphere intensity measured above the atmosphere by the satellite. by the satellite.
The weighting functions are available on The weighting functions are available on the FTP site at the FTP site at
ftp.ssmi.com/msu/weighting_functionsftp.ssmi.com/msu/weighting_functions
http://www.remss.com/msu/msu_data_description.html#msu_amsu_trend_map_tlt
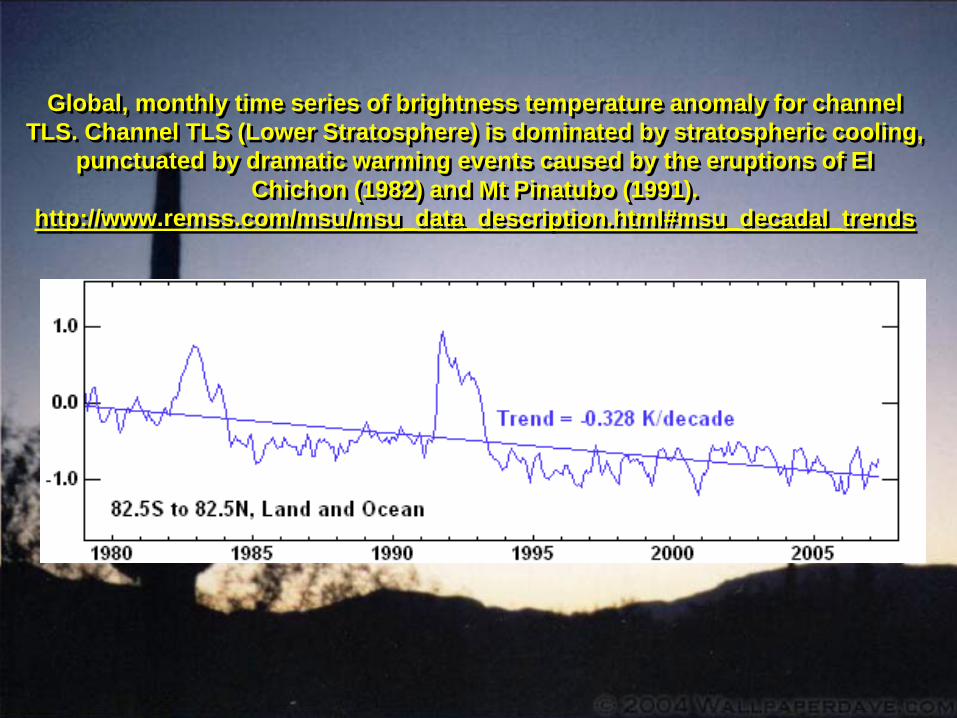
Global, monthly time series of brightness temperature anomaly for channel TLS. Channel TLS (Lower Stratosphere) is dominated by stratospheric cooling,
punctuated by dramatic warming events caused by the eruptions of El Chichon (1982) and Mt Pinatubo (1991).
http://www.remss.com/msu/msu_data_description.html#msu_decadal_trends
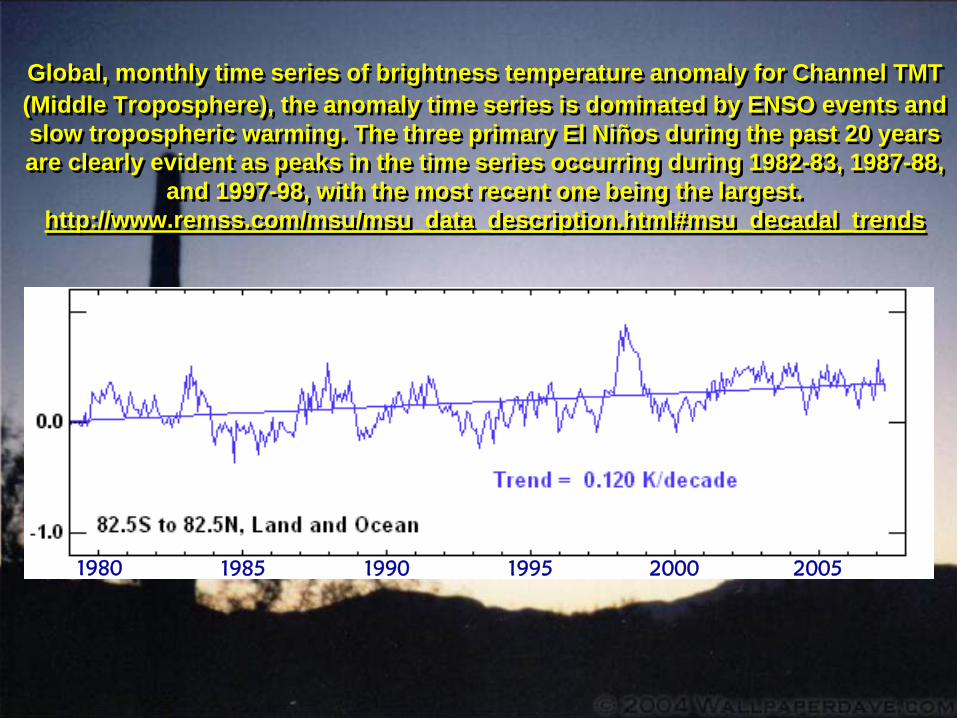
Global, monthly time series of brightness temperature anomaly for Channel TMT (Middle Troposphere), the anomaly time series is dominated by ENSO events and slow tropospheric warming. The three primary El Niños during the past 20 years are clearly evident as peaks in the time series occurring during 1982-83, 1987-88,
and 1997-98, with the most recent one being the largest. http://www.remss.com/msu/msu_data_description.html#msu_decadal_trends
1980 2000 1990 1995 2005 1985
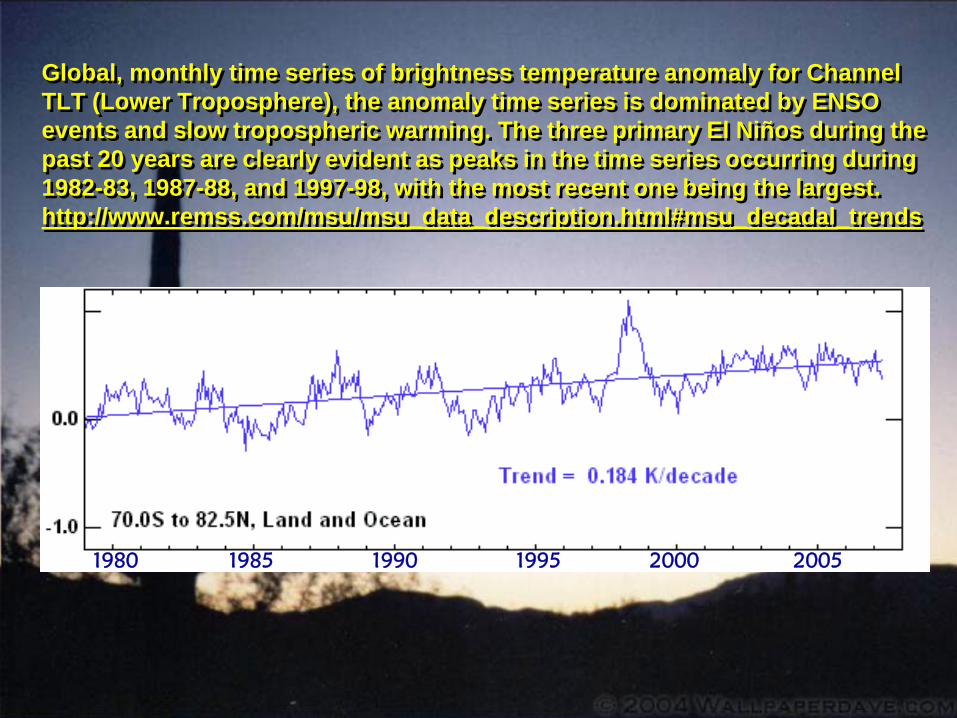
Global, monthly time series of brightness temperature anomaly for Channel TLT (Lower Troposphere), the anomaly time series is dominated by ENSO events and slow tropospheric warming. The three primary El Niños during the past 20 years are clearly evident as peaks in the time series occurring during 1982-83, 1987-88, and 1997-98, with the most recent one being the largest. http://www.remss.com/msu/msu_data_description.html#msu_decadal_trends
Global, monthly time series of brightness temperature anomaly for Channel TLT (Lower Troposphere), the anomaly time series is dominated by ENSO events and slow tropospheric warming. The three primary El Niños during the past 20 years are clearly evident as peaks in the time series occurring during 1982-83, 1987-88, and 1997-98, with the most recent one being the largest. http://www.remss.com/msu/msu_data_description.html#msu_decadal_trends
1980 1990 1995 2000 2005 1985

http://arctic.atmos.uiuc.edu:80/cryosphere/IMAGES/arctic.jpg

Northern Hemisphere Anomalies in
Extent
http://nsidc.org/data/seaice_index/n_extn.html

http://arctic.atmos.uiuc.edu/cryosphere/IMAGES/current.365.jpg
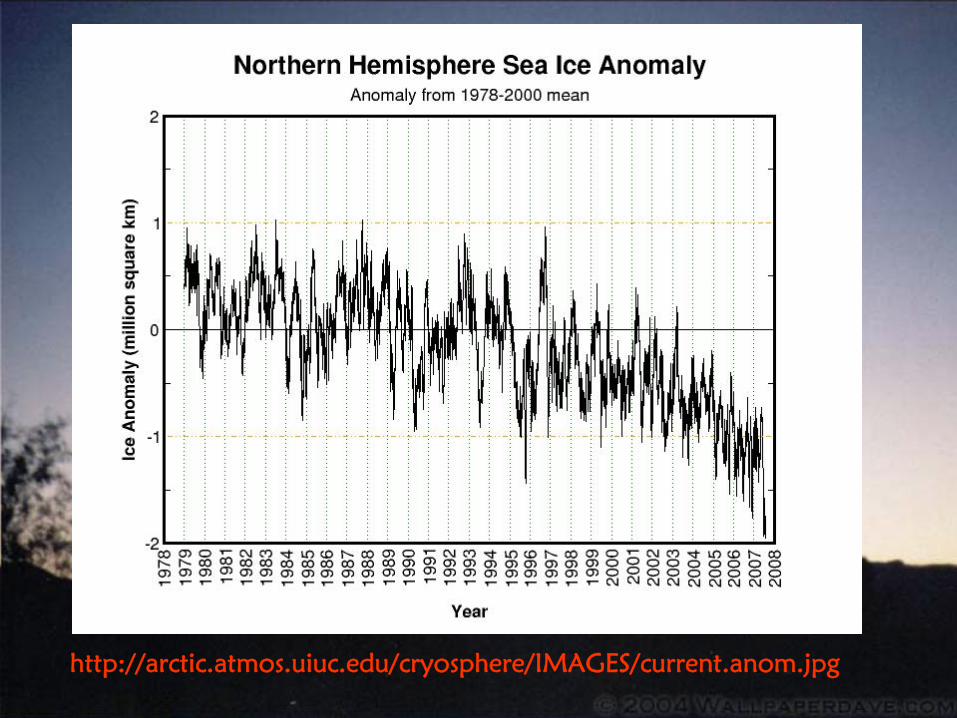
http://arctic.atmos.uiuc.edu/cryosphere/IMAGES/current.anom.jpg
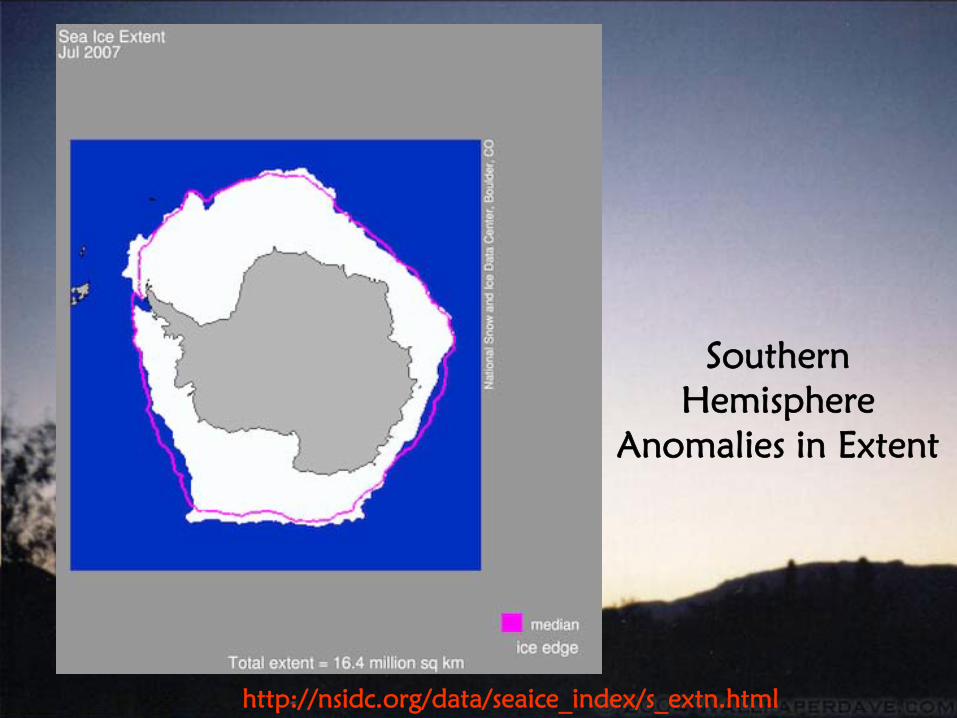
Southern Hemisphere
Anomalies in Extent
http://nsidc.org/data/seaice_index/s_extn.html
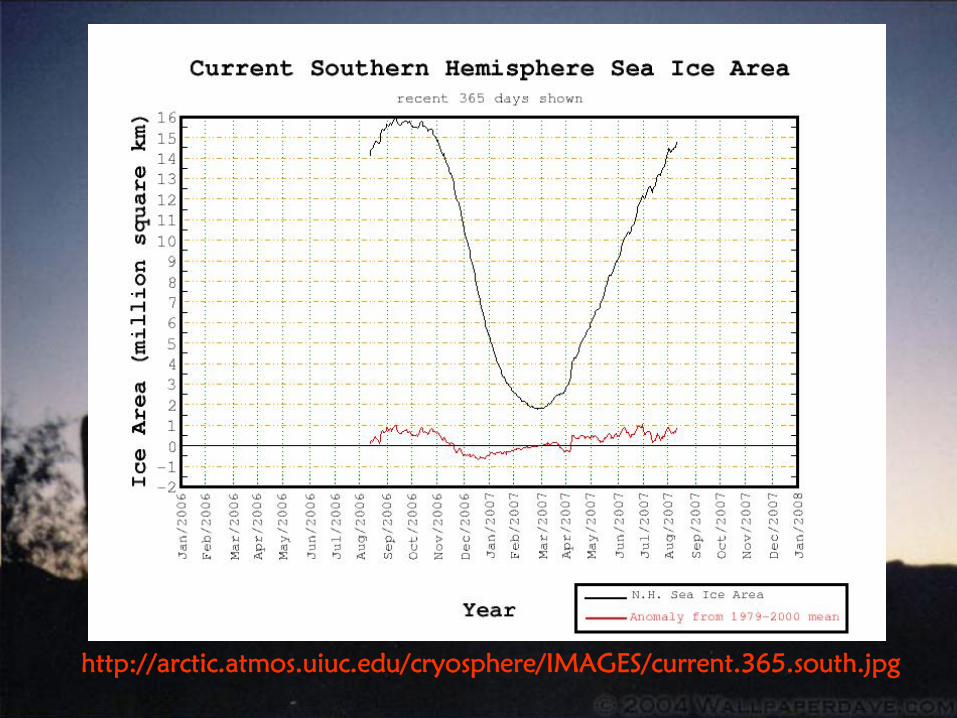
http://arctic.atmos.uiuc.edu/cryosphere/IMAGES/current.365.south.jpg
Human-Caused Global Warming Is Just A
Subset Of Human-Caused Climate Change
Human-Caused Global Warming Is Just A
Subset Of Human-Caused Climate Change

NEW OR UNDERNEW OR UNDER--RECOGNIZED RECOGNIZED HUMAN CLIMATE FORCINGSHUMAN CLIMATE FORCINGS
Biogeochemical Effect of CO2
Nitrogen DepositionLand-Use/Land-Cover ChangeGlaciation Effect of AerosolsThermodynamic Effect of AerosolsSurface Energy Budget Effect
Biogeochemical Effect of CO2
Nitrogen DepositionLand-Use/Land-Cover ChangeGlaciation Effect of AerosolsThermodynamic Effect of AerosolsSurface Energy Budget Effect
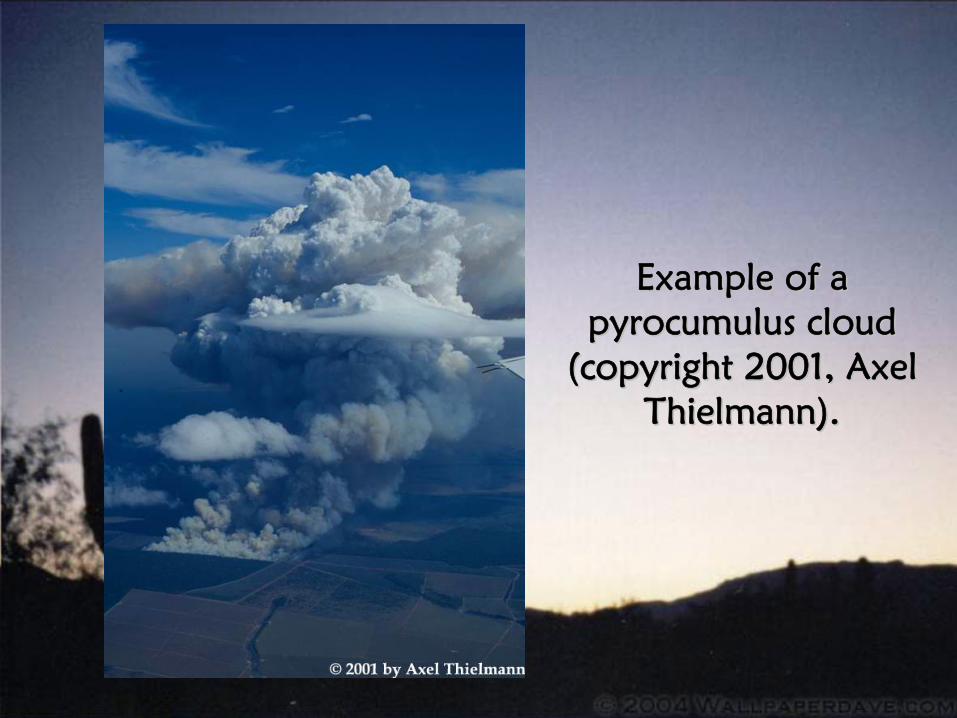
Example of a Example of a pyrocumulus cloud pyrocumulus cloud
(copyright 2001, Axel(copyright 2001, Axel Thielmann).Thielmann).
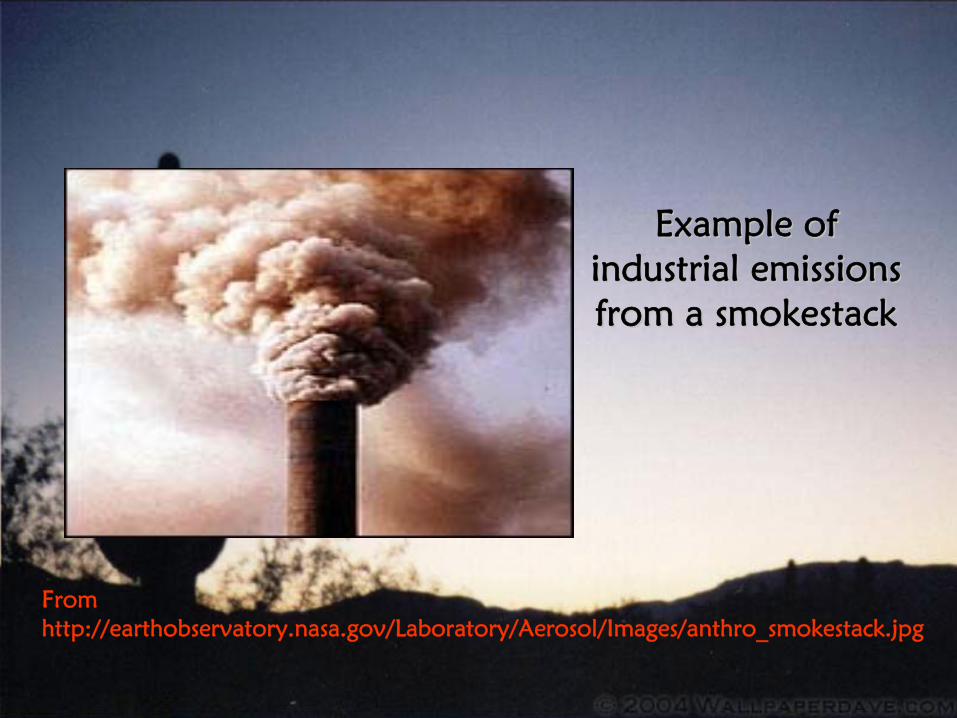
Example of Example of industrial emissions industrial emissions from a smokestackfrom a smokestack
From
http://earthobservatory.nasa.gov/Laboratory/Aerosol/Images/anthro_smokestack.jpg

From: National Research From: National Research Council, 2005: Radiative Council, 2005: Radiative Forcing of Climate Change: Forcing of Climate Change: Expanding the Concept and Expanding the Concept and Addressing Uncertainties, Addressing Uncertainties, Committee on Radiative Committee on Radiative Forcing Effects on Climate, Forcing Effects on Climate, Climate Research Climate Research Committee, 224 pp.Committee, 224 pp.
http://www.nap.edu/catalohttp://www.nap.edu/catalo
g/11175.htmlg/11175.html
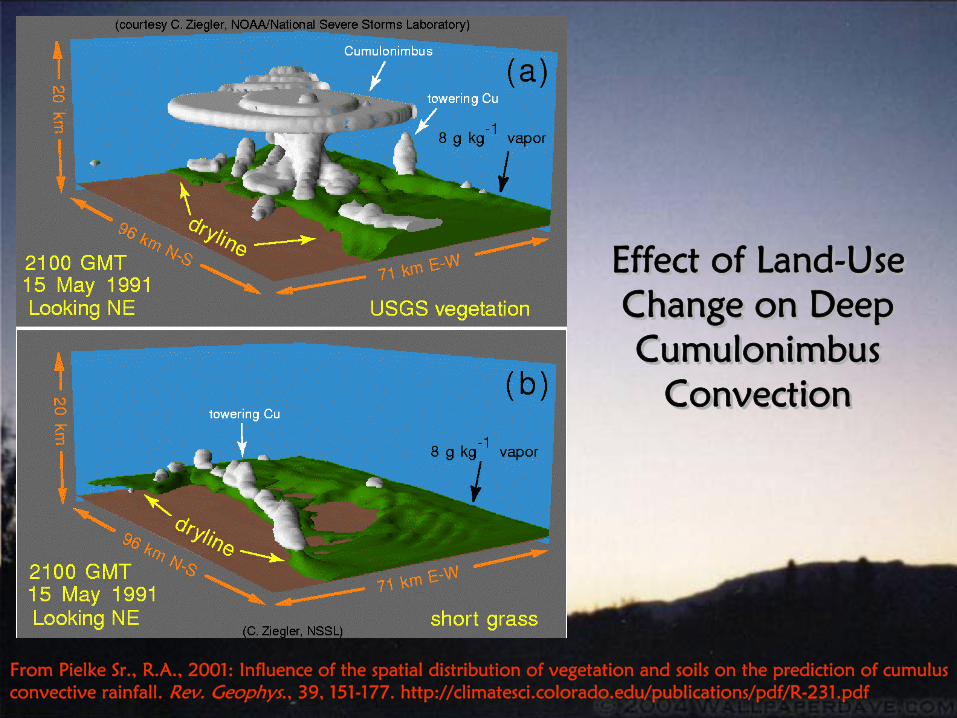
From Pielke Sr., R.A., 2001: Influence of the spatial distribution of vegetation and soils on the prediction of cumulus convective rainfall. Rev. Geophys., 39, 151-177. http://climatesci.colorado.edu/publications/pdf/R-231.pdf
Effect of Land-Use Change on Deep Cumulonimbus
Convection
Effect of Land-Use Change on Deep Cumulonimbus
Convection
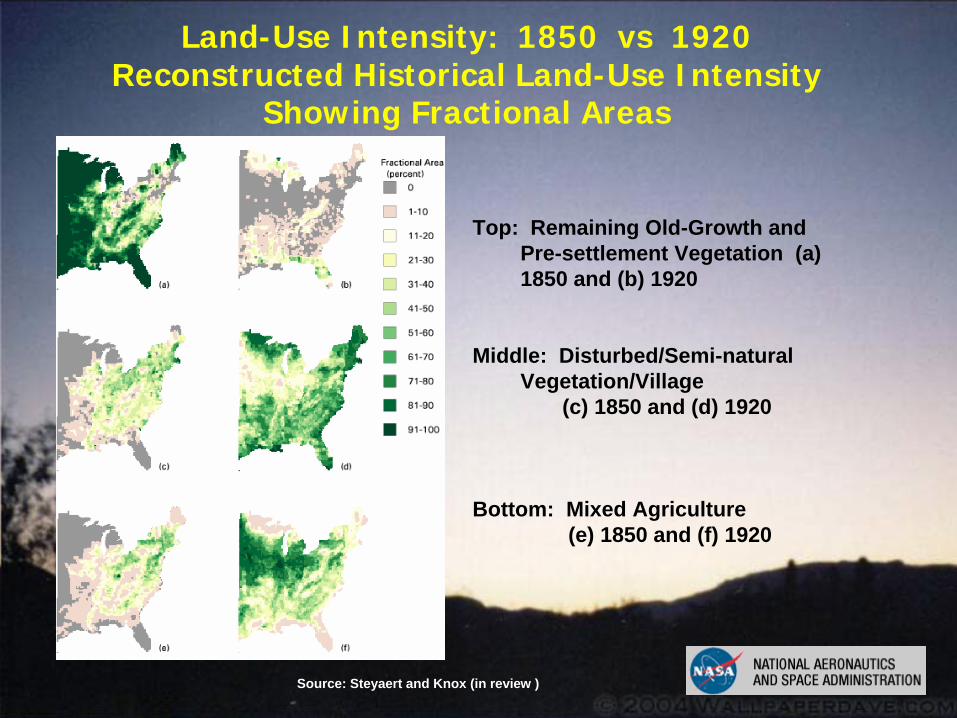
Land-Use Intensity: 1850 vs 1920 Reconstructed Historical Land-Use Intensity
Showing Fractional Areas
Top: Remaining Old-Growth and Pre-settlement Vegetation (a) 1850 and (b) 1920
Middle: Disturbed/Semi-natural Vegetation/Village
(c) 1850 and (d) 1920
Bottom: Mixed Agriculture(e) 1850 and (f) 1920
Source: Steyaert and Knox (in review )

Albedo: 1650, 1850, 1920, 1992
Historical Patterns of Broadband Solar Albedo:
(a) 1650
(b) 1850
(c) 1920
(d) 1992
Source: Steyaert and Knox (in review)
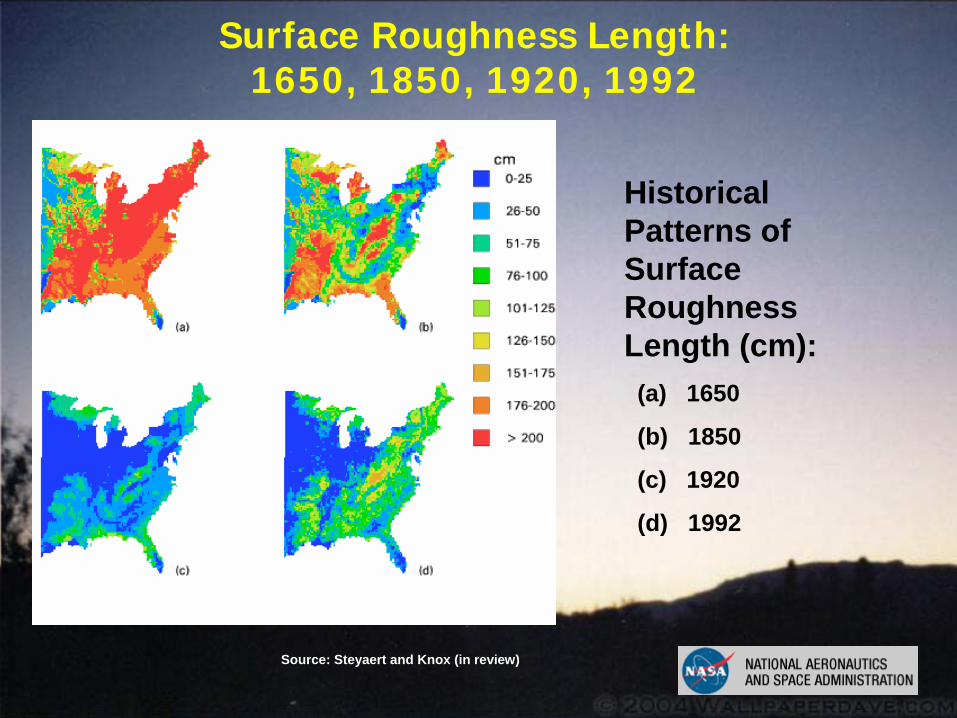
Surface Roughness Length: 1650, 1850, 1920, 1992
Historical Patterns of Surface Roughness Length (cm):(a) 1650
(b) 1850
(c) 1920
(d) 1992
Source: Steyaert and Knox (in review)

a.) Maximum temperature (ºC) with 1992 land cover. Dashed box shows area of region 1 and solid box shows area of region 2. Difference in maximum temperature between 1992
and b.) 1650, c.) 1850, d.) 1920. From Strack et al. 2007: Sensitivity of Summer Near-Surface Temperatures and Precipitation in the Eastern United States to Historical Land Cover Changes Since European Settlement, in preparation.
REGIONAL LANDREGIONAL LAND--USEUSE CHANGE EFFECTS ONCHANGE EFFECTS ON CLIMATE IN FLORIDA CLIMATE IN FLORIDA
IN THE SUMMERIN THE SUMMER
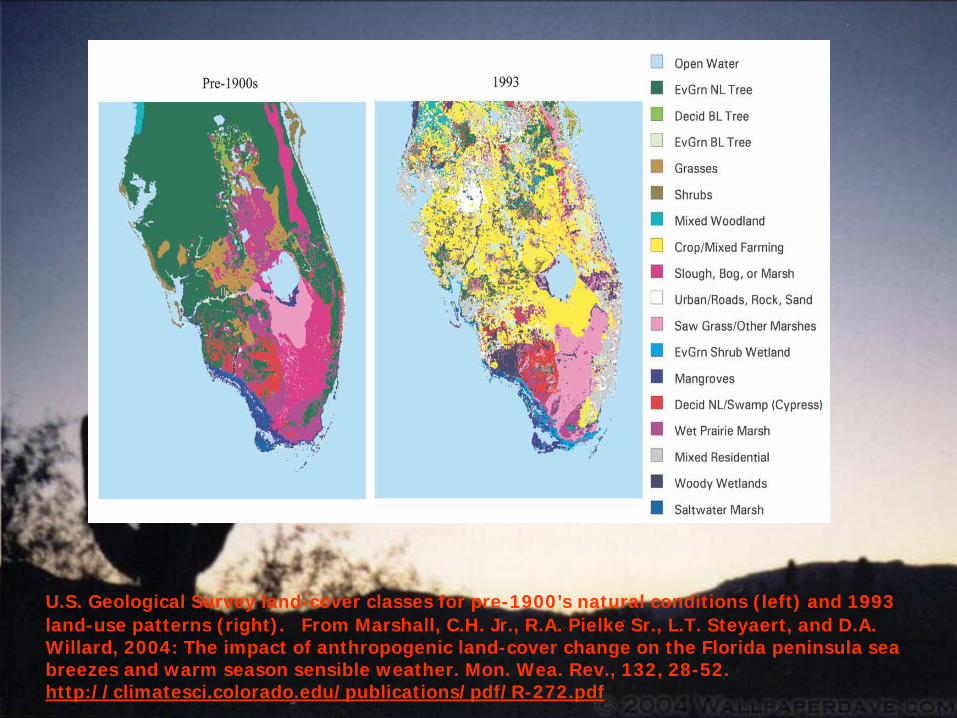
U.S. Geological Survey land-cover classes for pre-1900’s natural conditions (left) and 1993 land-use patterns (right). From Marshall, C.H. Jr., R.A. Pielke Sr., L.T. Steyaert, and D.A. Willard, 2004: The impact of anthropogenic land-cover change on the Florida peninsula sea breezes and warm season sensible weather. Mon. Wea. Rev., 132, 28-52. http://climatesci.colorado.edu/publications/pdf/R-272.pdf

From Marshall, C.H. Jr., R.A. Pielke Sr., L.T. Steyaert, and D.A. Willard, 2004: The impact of anthropogenic land-cover change on the Florida peninsula sea breezes and warm season sensible weather. Mon. Wea. Rev., 132, 28 52. http://climatesci.colorado.edu/publications/pdf/R-272.pdf
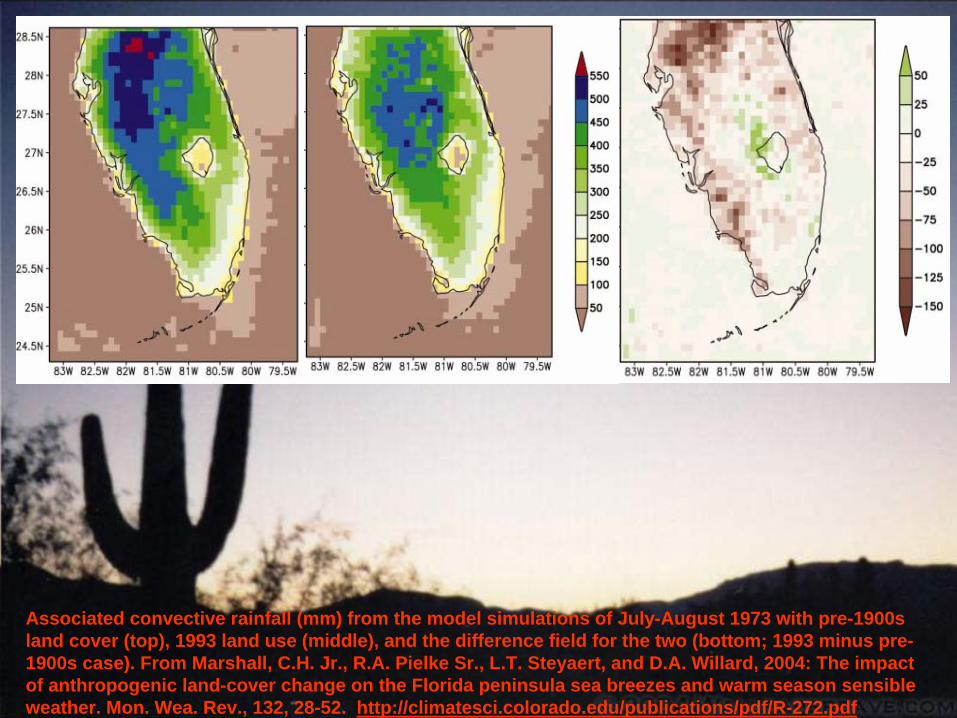
Associated convective rainfall (mm) from the model simulations of July-August 1973 with pre-1900s land cover (top), 1993 land use (middle), and the difference field for the two (bottom; 1993 minus pre- 1900s case). From Marshall, C.H. Jr., R.A. Pielke Sr., L.T. Steyaert, and D.A. Willard, 2004: The impact of anthropogenic land-cover change on the Florida peninsula sea breezes and warm season sensible weather. Mon. Wea. Rev., 132, 28-52. http://climatesci.colorado.edu/publications/pdf/R-272.pdf
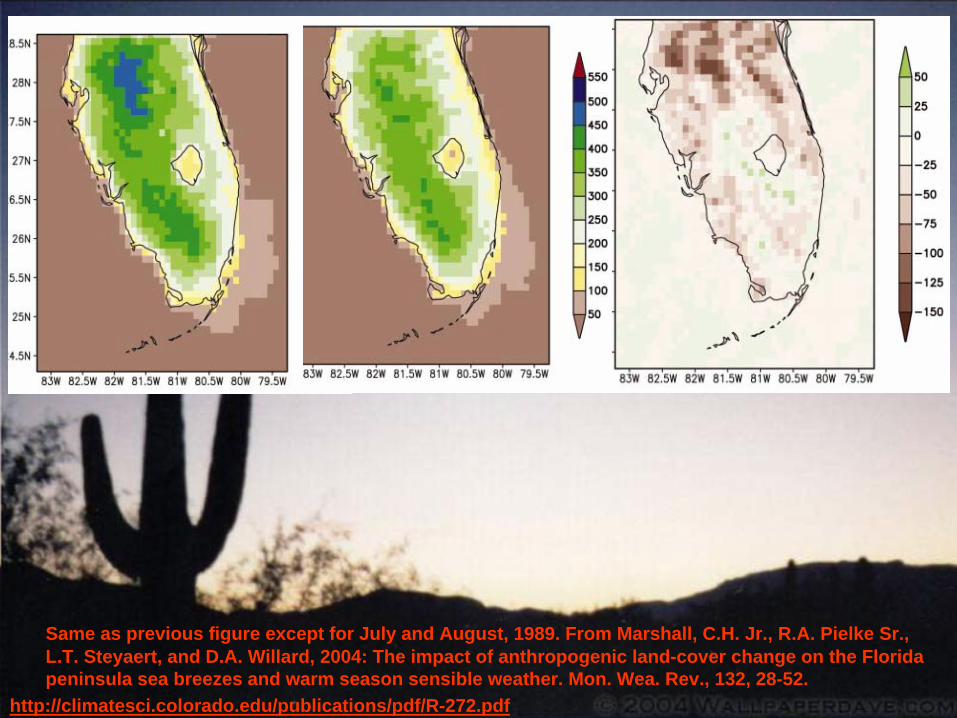
Same as previous figure except for July and August, 1989. From Marshall, C.H. Jr., R.A. Pielke Sr., L.T. Steyaert, and D.A. Willard, 2004: The impact of anthropogenic land-cover change on the Florida peninsula sea breezes and warm season sensible weather. Mon. Wea. Rev., 132, 28-52.
http://climatesci.colorado.edu/publications/pdf/R-272.pdf
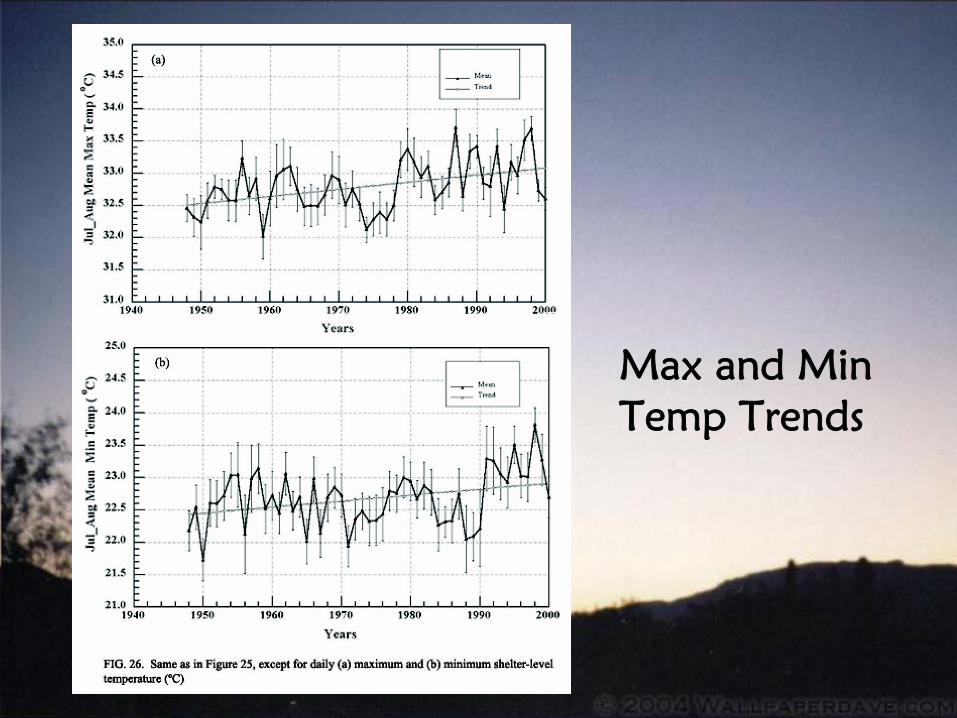
Max and Min Temp Trends
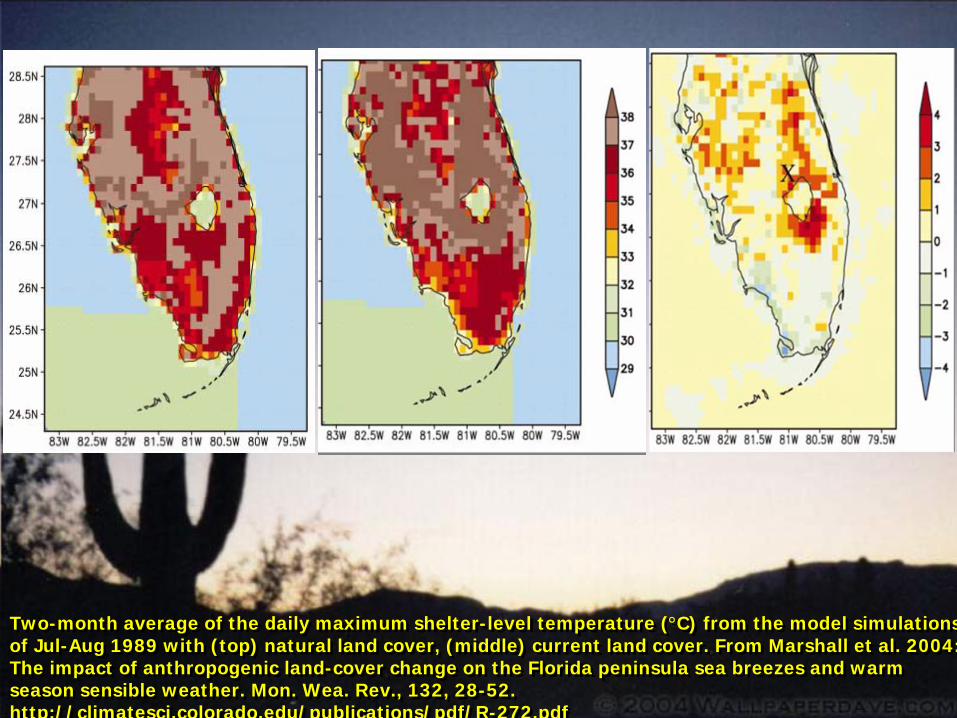
Two-month average of the daily maximum shelter-level temperature (°C) from the model simulations of Jul-Aug 1989 with (top) natural land cover, (middle) current land cover. From Marshall et al. 2004 The impact of anthropogenic land-cover change on the Florida peninsula sea breezes and warm season sensible weather. Mon. Wea. Rev., 132, 28-52. http://climatesci.colorado.edu/publications/pdf/R-272.pdf
Two-month average of the daily maximum shelter-level temperature (°C) from the model simulations of Jul-Aug 1989 with (top) natural land cover, (middle) current land cover. From Marshall et al. 2004: The impact of anthropogenic land-cover change on the Florida peninsula sea breezes and warm season sensible weather. Mon. Wea. Rev., 132, 28-52. http://climatesci.colorado.edu/publications/pdf/R-272.pdf
Global Land-Use Change Effects
On Climate
Global Land-Use Change Effects
On Climate

Vegetation classifications for (a) natural vegetation and (b) current vegetation in regions where current and natural vegetation differ (i.e., anthropogenically disturbed regions in the current case). From: Chase, T.N., R.A. Pielke, T.G.F. Kittel, R.R. Nemani, and S.W. Running, 2000: Simulated impacts of historical land cover changes on global climate in northern winter. Climate Dynamics, 16, 93-105. http://climatesci.colorado.edu/p ublications/pdf/R-214.pdf
Vegetation classifications for (a) natural vegetation and (b) current vegetation in regions where current and natural vegetation differ (i.e., anthropogenically disturbed regions in the current case). From: Chase, T.N., R.A. Pielke, T.G.F. Kittel, R.R. Nemani, and S.W. Running, 2000: Simulated impacts of historical land cover changes on global climate in northern winter. Climate Dynamics, 16, 93-105. http://climatesci.colorado.edu/p ublications/pdf/R-214.pdf
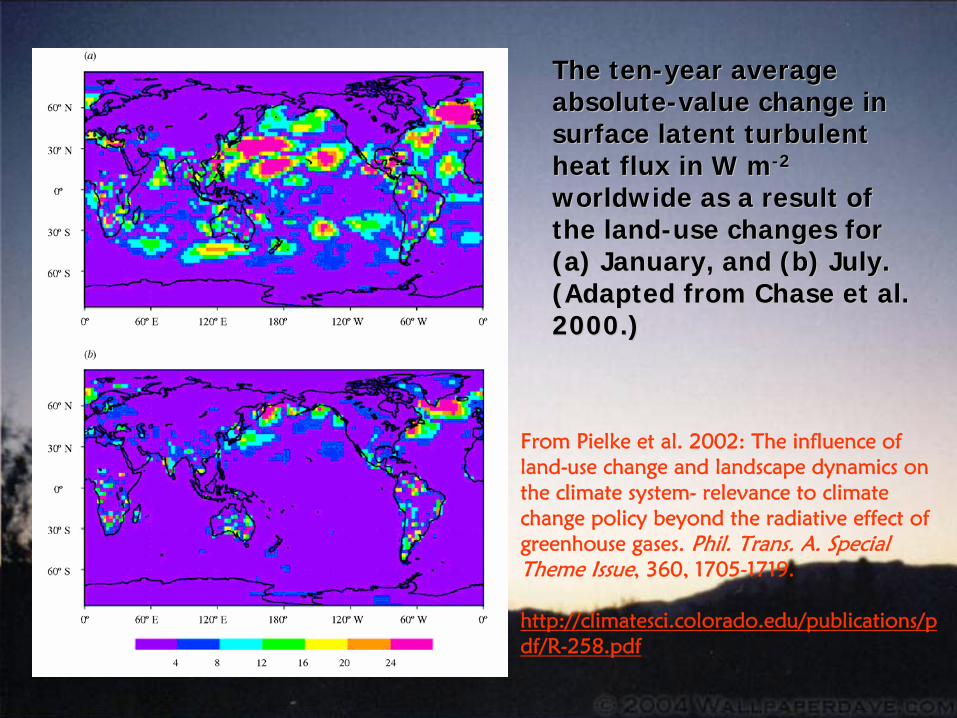
The tenThe ten--year average year average absoluteabsolute--value change in value change in surface latent turbulent surface latent turbulent heat flux in W mheat flux in W m--2 2
worldwide as a result of worldwide as a result of the landthe land--use changes for use changes for (a) January, and (b) July. (a) January, and (b) July. (Adapted from Chase et al. (Adapted from Chase et al. 2000.)2000.)
From Pielke et al. 2002: The influence of land-use change and landscape dynamics on the climate system-
relevance to climate change policy beyond the radiative effect of greenhouse gases. Phil. Trans. A. Special Theme Issue, 360, 1705-1719.
http://climatesci.colorado.edu/publications/p
df/R-258.pdf
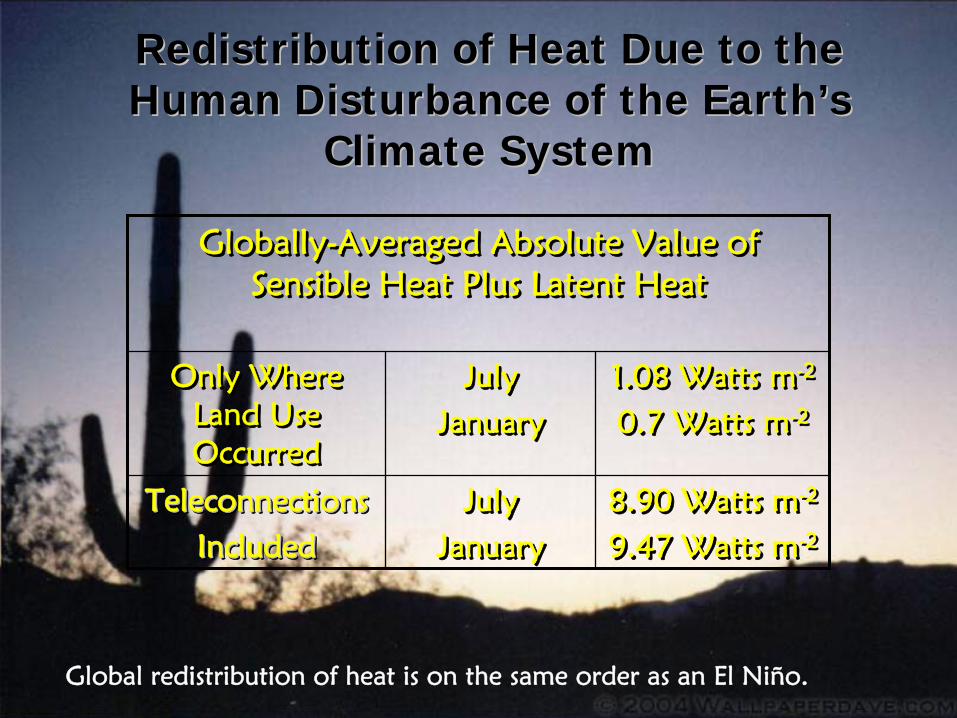
Redistribution of Heat Due to the Redistribution of Heat Due to the Human Disturbance of the Earth’s Human Disturbance of the Earth’s
Climate SystemClimate System
Globally-Averaged Absolute Value of Sensible Heat Plus Latent Heat
Globally-Averaged Absolute Value of Sensible Heat Plus Latent Heat
Only Where Land Use Occurred
Only Where Land Use Occurred
JulyJanuary
JulyJanuary
1.08 Watts m-2
0.7 Watts m-2
1.08 Watts m-2
0.7 Watts m-2
TeleconnectionsIncluded
TeleconnectionsTeleconnectionsIncludedIncluded
JulyJanuary
JulyJanuary
8.90 Watts m-2
9.47 Watts m-2
8.90 Watts m-2
9.47 Watts m-2
Global redistribution of heat is on the same order as an El Niño.

Global Water Cycle MetricGlobal Water Cycle Metric
Prepared by T.N. Chase, CU, Boulder, CO.
Absolute Value of Globally-Averaged Change is 1.2 mm/day.

Global Water Cycle MetricGlobal Water Cycle Metric
Prepared by T.N. Chase, CU, Boulder, CO.Absolute Value of Globally-Averaged Change is 0.6 mm/day
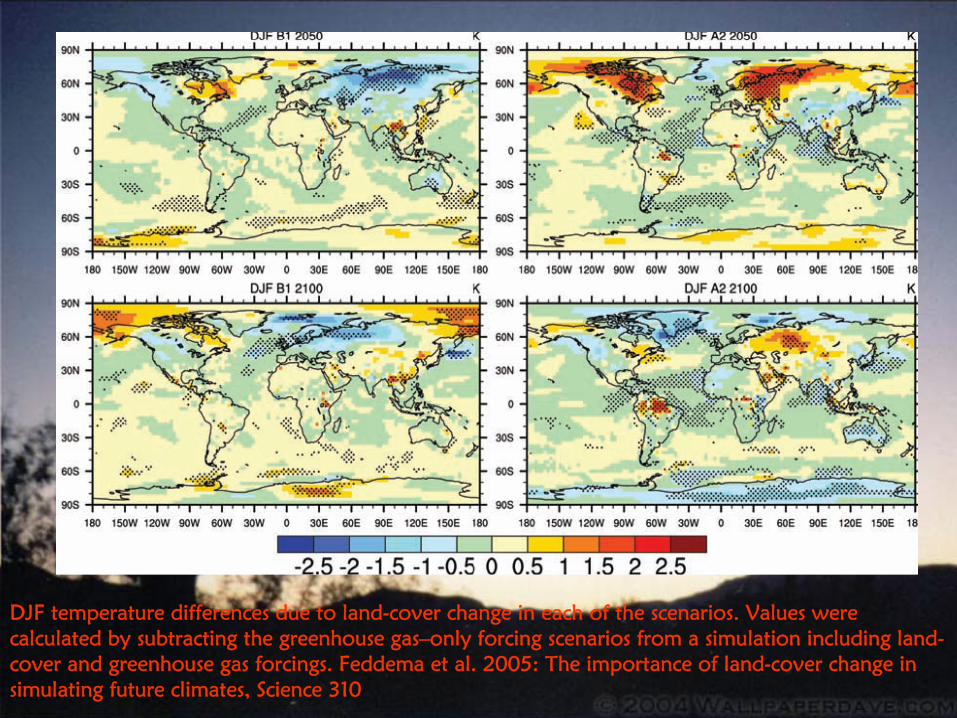
DJF temperature differences due to land-cover change in each of the scenarios. Values were calculated by subtracting the greenhouse gas–only forcing scenarios from a simulation including land-
cover and greenhouse gas forcings. Feddema
et al. 2005: The importance of land-cover change in simulating future climates, Science 310
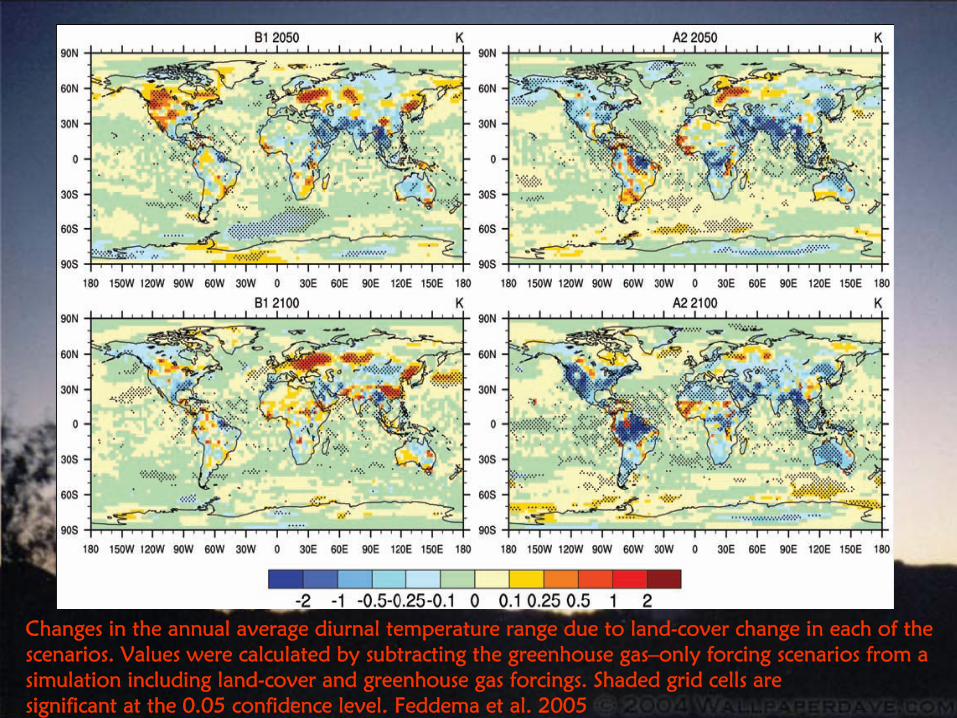
Changes in the annual average diurnal temperature range due to land-cover change in each of the scenarios. Values were calculated by subtracting the greenhouse gas–only forcing scenarios from a simulation including land-cover and greenhouse gas forcings. Shaded grid cells are
significant at the 0.05 confidence level. Feddema
et al. 2005
WHAT IS THE IMPORTANCE OF WHAT IS THE IMPORTANCE OF MORE HETEROGENEOUS MORE HETEROGENEOUS
CLIMATE FORCINGS RELATIVE CLIMATE FORCINGS RELATIVE TO MORE HOMOGENEOUS TO MORE HOMOGENEOUS
CLIMATE FORCING CLIMATE FORCING SUCH AS THE RADIATIVE SUCH AS THE RADIATIVE
FORCING OF COFORCING OF CO22
??

AN EXAMPLE FOR AN EXAMPLE FOR AEROSOL CLIMATEAEROSOL CLIMATE
FORCINGFORCING
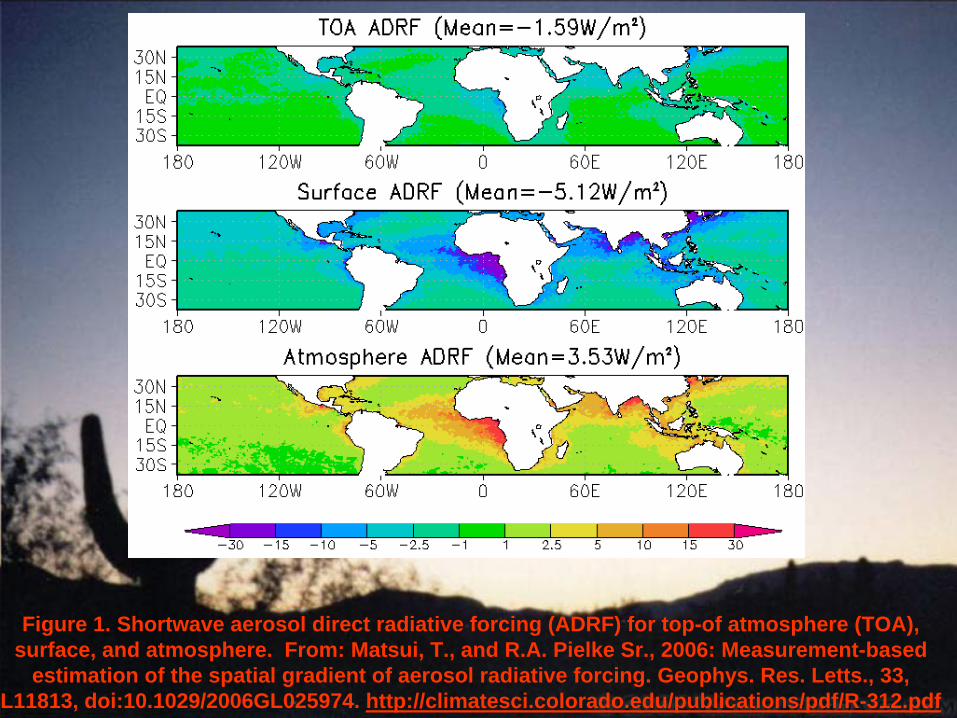
Figure 1. Shortwave aerosol direct radiative forcing (ADRF) for top-of atmosphere (TOA), surface, and atmosphere. From: Matsui, T., and R.A. Pielke Sr., 2006: Measurement-based
estimation of the spatial gradient of aerosol radiative forcing. Geophys. Res. Letts., 33, L11813, doi:10.1029/2006GL025974. http://climatesci.colorado.edu/publications/pdf/R-312.pdf
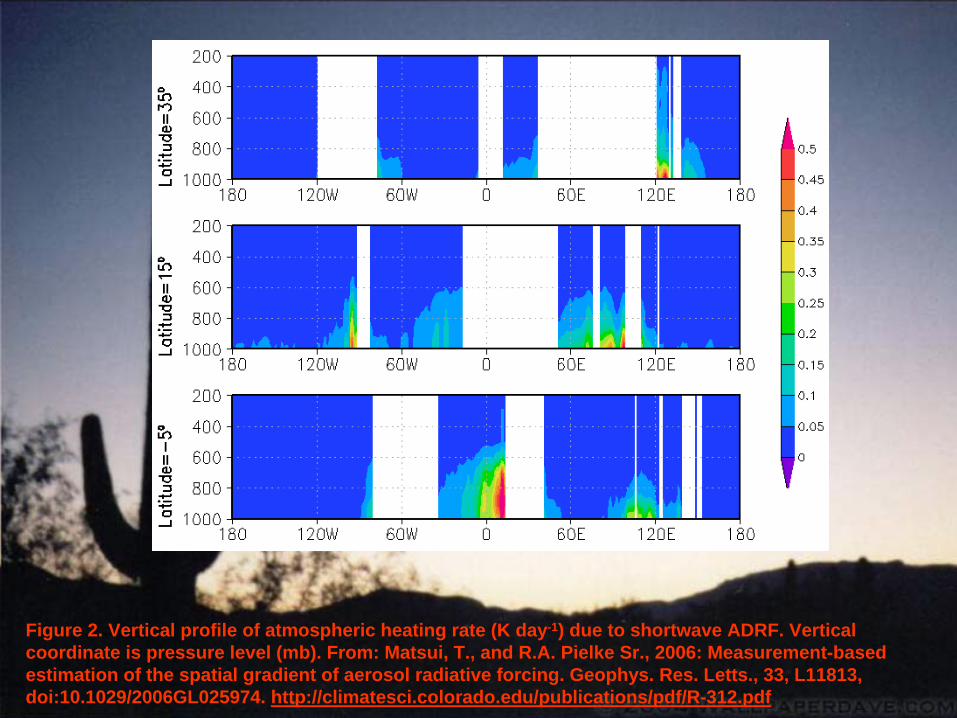
Figure 2. Vertical profile of atmospheric heating rate (K day-1) due to shortwave ADRF. Vertical coordinate is pressure level (mb). From: Matsui, T., and R.A. Pielke Sr., 2006: Measurement-based estimation of the spatial gradient of aerosol radiative forcing. Geophys. Res. Letts., 33, L11813, doi:10.1029/2006GL025974. http://climatesci.colorado.edu/publications/pdf/R-312.pdf
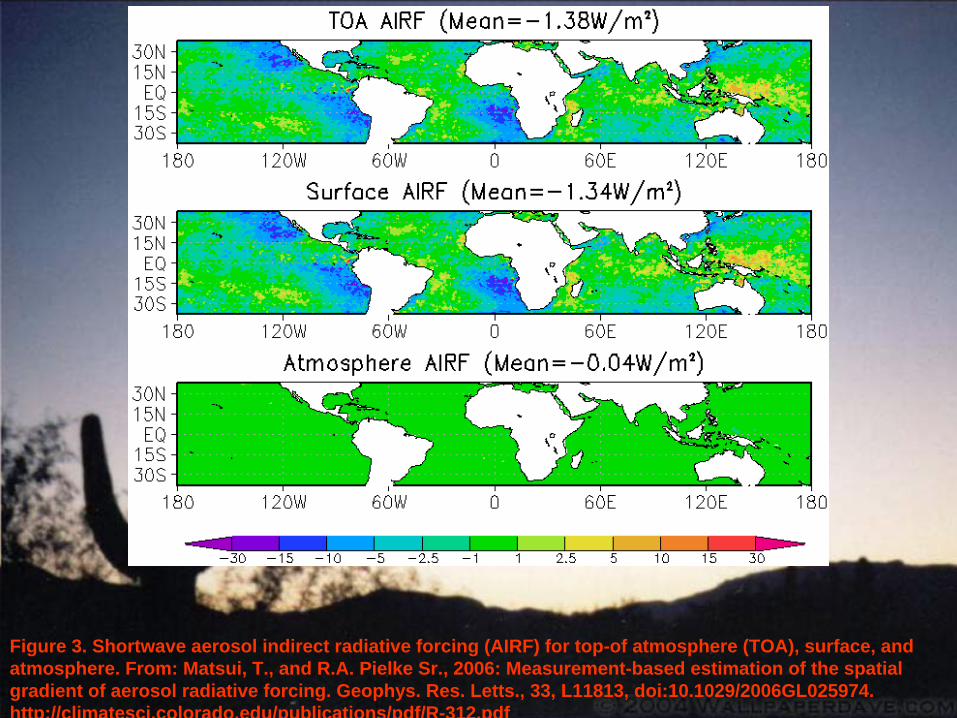
Figure 3. Shortwave aerosol indirect radiative forcing (AIRF) for top-of atmosphere (TOA), surface, and atmosphere. From: Matsui, T., and R.A. Pielke Sr., 2006: Measurement-based estimation of the spatial gradient of aerosol radiative forcing. Geophys. Res. Letts., 33, L11813, doi:10.1029/2006GL025974. http://climatesci.colorado.edu/publications/pdf/R-312.pdf

Figure 4. Comparison of Mean TOA radiative forcing between infrared GRF, shortwave ADRF, and shortwave AIRF. From: Matsui, T., and R.A. Pielke Sr., 2006: Measurement-based estimation of the spatial gradient of aerosol radiative forcing. Geophys. Res. Letts., 33, L11813, doi:10.1029/2006GL025974. http://climatesci.colorado.edu/publications/pdf/R-312.pdf
mean TOA radiative forcing
-1.38-1.591.7
-2
-1
0
1
2
GRF ADRF AIRF
radi
tive
forc
ing
(W/m
2)
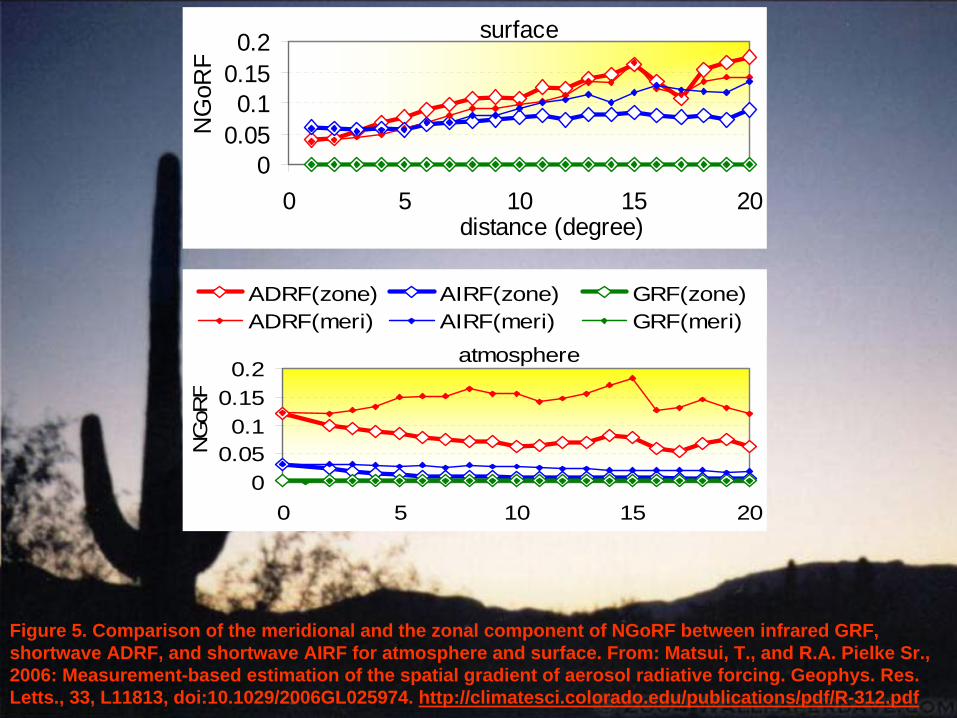
Figure 5. Comparison of the meridional and the zonal component of NGoRF between infrared GRF, shortwave ADRF, and shortwave AIRF for atmosphere and surface. From: Matsui, T., and R.A. Pielke Sr., 2006: Measurement-based estimation of the spatial gradient of aerosol radiative forcing. Geophys. Res. Letts., 33, L11813, doi:10.1029/2006GL025974. http://climatesci.colorado.edu/publications/pdf/R-312.pdf
atmosphere
00.050.1
0.150.2
0 5 10 15 20
NG
oRF
ADRF(zone) AIRF(zone) GRF(zone)ADRF(meri) AIRF(meri) GRF(meri)
surface
00.050.1
0.150.2
0 5 10 15 20distance (degree)
NG
oRF

Human-Caused Climate Change is
Just a Subset of Human-Caused Environmental
Change
Human-Caused Climate Change is
Just a Subset of Human-Caused Environmental
Change

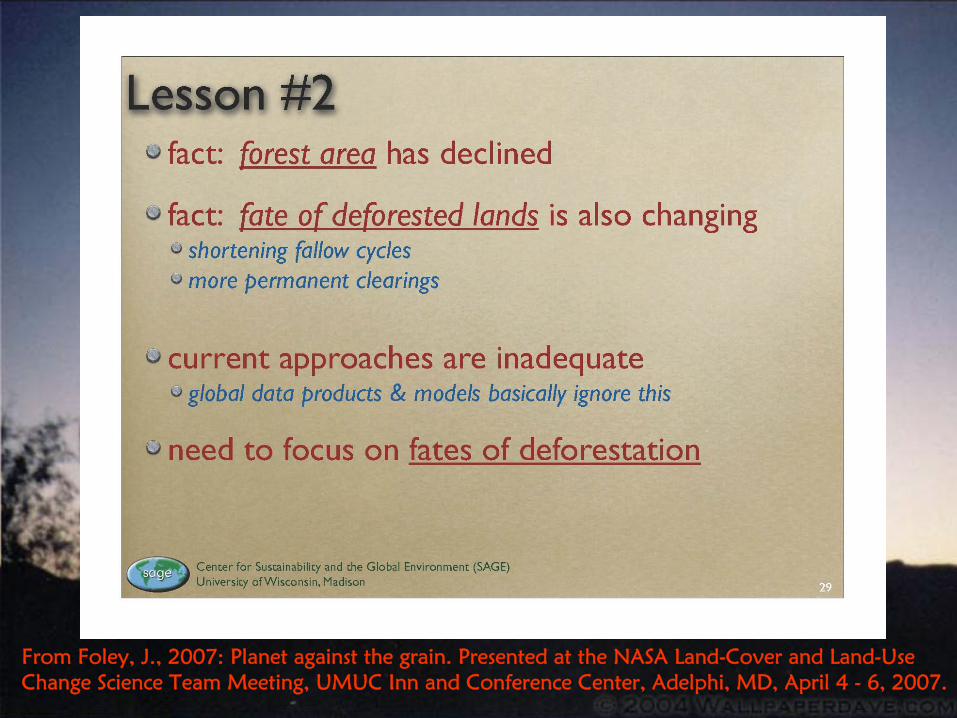
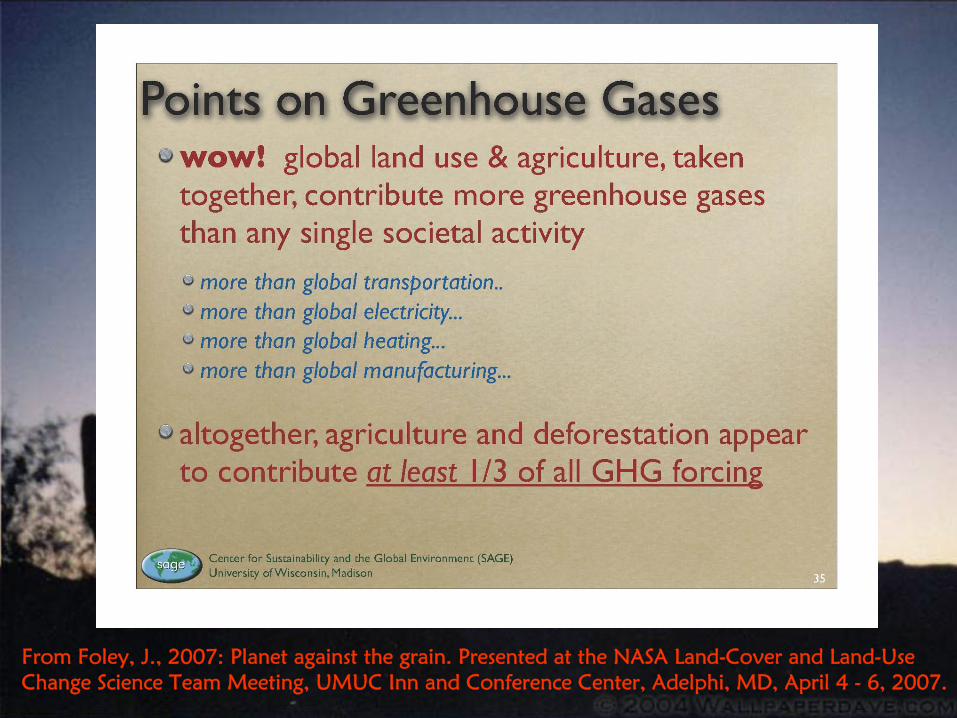
From Foley, J., 2007: Planet against the grain. Presented at the
NASA Land-Cover and Land-Use Change Science Team Meeting, UMUC Inn and Conference Center, Adelphi, MD, April 4 -
6, 2007.

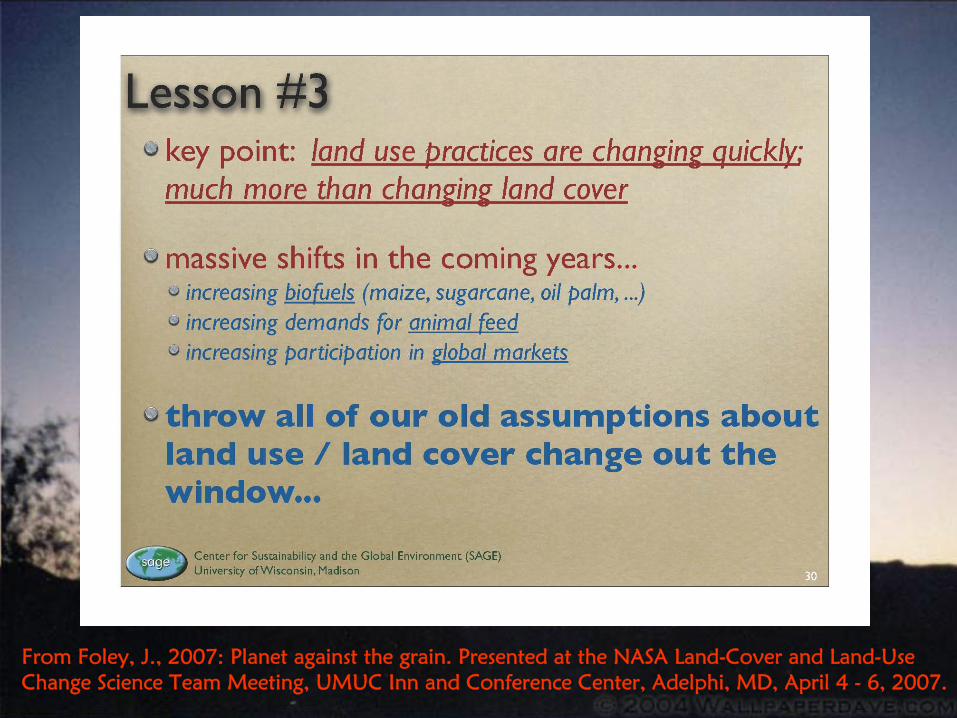
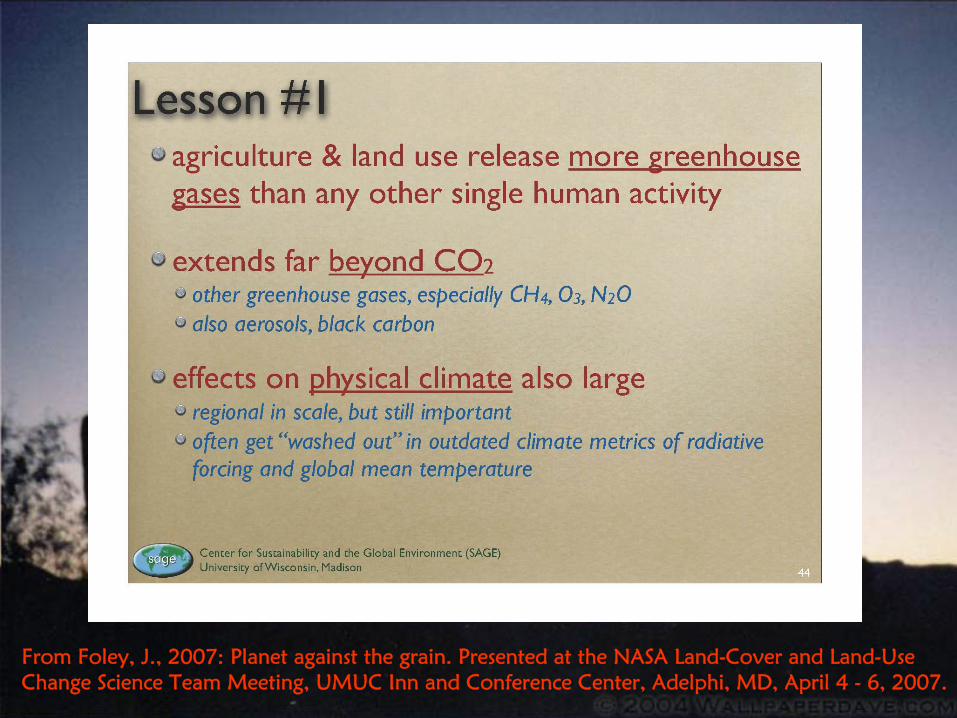
From Foley, J., 2007: Planet against the grain. Presented at the
NASA Land-Cover and Land-Use Change Science Team Meeting, UMUC Inn and Conference Center, Adelphi, MD, April 4 -
6, 2007.

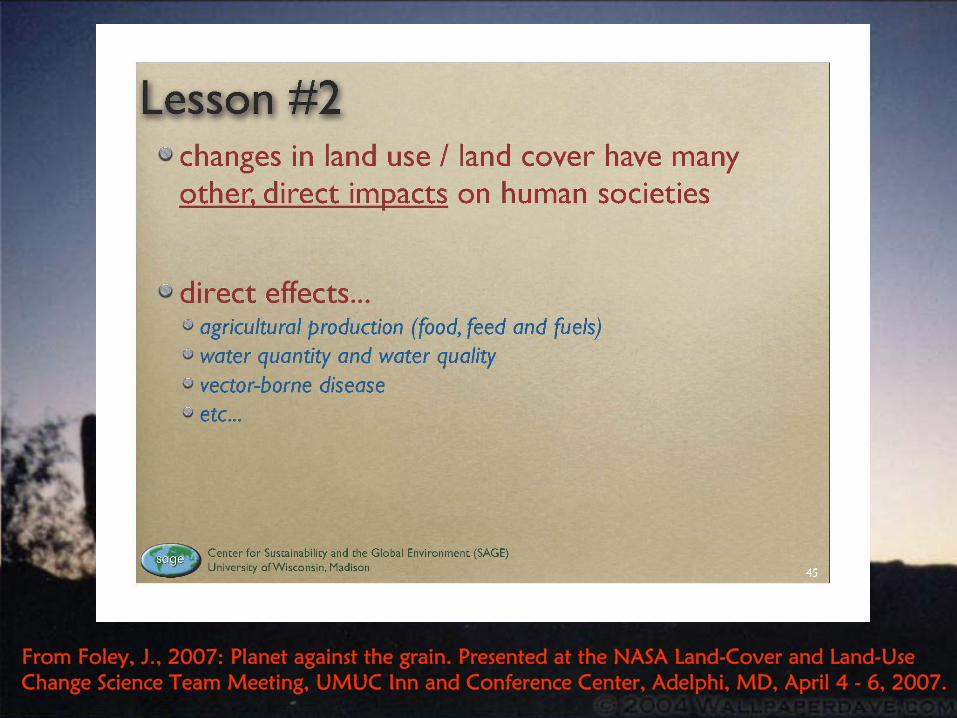
From Foley, J., 2007: Planet against the grain. Presented at the
NASA Land-Cover and Land-Use Change Science Team Meeting, UMUC Inn and Conference Center, Adelphi, MD, April 4 -
6, 2007.
From Foley, J., 2007: Planet against the grain. Presented at the
NASA Land-Cover and Land-Use Change Science Team Meeting, UMUC Inn and Conference Center, Adelphi, MD, April 4 -
6, 2007.
From Foley, J., 2007: Planet against the grain. Presented at the
NASA Land-Cover and Land-Use Change Science Team Meeting, UMUC Inn and Conference Center, Adelphi, MD, April 4 -
6, 2007.
From Foley, J., 2007: Planet against the grain. Presented at the
NASA Land-Cover and Land-Use Change Science Team Meeting, UMUC Inn and Conference Center, Adelphi, MD, April 4 -
6, 2007.

From Foley, J., 2007: Planet against the grain. Presented at the
NASA Land-Cover and Land-Use Change Science Team Meeting, UMUC Inn and Conference Center, Adelphi, MD, April 4 -
6, 2007.
From Foley, J., 2007: Planet against the grain. Presented at the
NASA Land-Cover and Land-Use Change Science Team Meeting, UMUC Inn and Conference Center, Adelphi, MD, April 4 -
6, 2007.
From Foley, J., 2007: Planet against the grain. Presented at the
NASA Land-Cover and Land-Use Change Science Team Meeting, UMUC Inn and Conference Center, Adelphi, MD, April 4 -
6, 2007.
From Foley, J., 2007: Planet against the grain. Presented at the
NASA Land-Cover and Land-Use Change Science Team Meeting, UMUC Inn and Conference Center, Adelphi, MD, April 4 -
6, 2007.
From Foley, J., 2007: Planet against the grain. Presented at the
NASA Land-Cover and Land-Use Change Science Team Meeting, UMUC Inn and Conference Center, Adelphi, MD, April 4 -
6, 2007.
From Foley, J., 2007: Planet against the grain. Presented at the
NASA Land-Cover and Land-Use Change Science Team Meeting, UMUC Inn and Conference Center, Adelphi, MD, April 4 -
6, 2007.

WE NEED A NEW PERSPECTIVE ON THE ROLE OF ENVIRONMENTAL VARIABILITY
AND CHANGE ON SOCIETY AND THE ENVIRONMENT
A FOCUS ON VULNERABILITY
WE NEED A NEW PERSPECTIVE ON THE ROLE OF ENVIRONMENTAL VARIABILITY
AND CHANGE ON SOCIETY AND THE ENVIRONMENT
A FOCUS ON VULNERABILITY
Schneider Stephen H, 1976: The Genesis Strategy Climate and
Global Survival. Plenum Press, 419 pp.
Schneider Stephen H, 1976: The Genesis Strategy Climate and
Global Survival. Plenum Press, 419 pp.
Pielke, Jr., R.A., 2007. The Honest Broker:
Making Sense of Science in Policy and Politics. Cambridge University
Press, 198 pp.
Pielke, Jr., R.A., 2007. The Honest Broker:
Making Sense of Science in Policy and Politics. Cambridge University
Press, 198 pp.
Prediction: Science, Decision Making and the Future of Nature
Edited by Daniel Sarewitz, Roger A. Pielke, Jr., and Radford Byerly, Jr., 2000: Island Press, Washington, DC, 400 pp
Prediction: Science, Decision Making and the Future of Nature
Edited by Daniel Sarewitz, Roger A. Pielke, Jr., and Radford Byerly, Jr., 2000: Island Press, Washington, DC, 400 pp

Schematic of the relation of water resource vulnerability to the spectrum of the environmental forcings and feedbacks (adapted from [3]). The arrows denote nonlinear interactions between and within natural and human forcings. From: Pielke, R.A. Sr., 2004: Discussion Forum: A broader perspective on climate change is needed. IGBP Newsletter, 59, 16-19. http://climatesci.colorado.edu/publications/pdf/NR-139.pdf

April 1 snowpack percent of average for the state of Colorado for years 1968 through 2007.
ftp://ftp-fc.sc.egov.usda.gov/CO/Snow/snow/watershed/monthly/aprstatetime.gif

Resource Specific Impact Level with Respect to Water Resources -
June 2004
Resource Specific Impact Level with Respect to Water Resources -
June 2004

QUESTION
If you were given 100 million Dollars to spend on environmental benefits in Arizona, where would you use that money?
1. subsidies for solar and wind power
2. subsidies for coal liquidification and pollution extraction
3. purchasing greenbelts (public parks) 4. more mass transit
QUESTION
If you were given 100 million Dollars to spend on environmental benefits in Arizona, where would you use that money?
1. subsidies for solar and wind power 2. subsidies for coal liquidification and
pollution extraction 3. purchasing greenbelts (public parks)
4. more mass transit
WHERE SHOULD THIS MONEY COME FROM?
1. higher gas taxes 2. mileage driven tax
3. lottery 4. luxury tax on large private vehicles
5. higher income taxes 6. square foot tax on residences
WHERE SHOULD THIS MONEY WHERE SHOULD THIS MONEY COME FROM?COME FROM?
1. higher gas taxes 2. mileage driven tax
3. lottery 4. luxury tax on large private vehicles
5. higher income taxes 6. square foot tax on residences
CONCLUSIONSCONCLUSIONS
The needed focus for the study of climate change and variability is on the regional and local scales. Global and
zonally-averaged climate metrics would only be
important to the extent that they provide useful
information on thesespace scales.
The needed focus for the study of climate change and variability is on the regional and local scales. Global and
zonally-averaged climate metrics would only be
important to the extent that they provide useful
information on thesespace scales.
Global warming is not equivalent to climate change. Significant,
societally important climate change, due to both natural-
and
human-
climate forcings, can occur without any global
warming or cooling.
Global warming is not equivalent to climate change. Significant,
societally important climate change, due to both natural-
and
human-
climate forcings,can occur without any global
warming or cooling.
The spatial pattern of ocean heat content change is the
appropriate metric to assess climate system heat changes
including global warming and cooling.
The spatial pattern of ocean heat content change is the
appropriate metric to assess climate system heat changes
including global warming and cooling.

Global and zonally-averaged surface temperature trend
assessments, besides having major difficulties in terms of how
this metric is diagnosed and analyzed, do not provide significant information on
climate change and variability on the regional and local scales.
Global and zonally-averaged surface temperature trend
assessments, besides having major difficulties in terms of how
this metric is diagnosed and analyzed, do not provide significant information on
climate change and variability on the regional and local scales.
In terms of climate change and variability on the regional and local
scale, the IPCC Reports, the CCSP Report on surface and tropospheric
temperature trends, and the U.S. National Assessment have
overstated the role of the radiative effect of the anthropogenic increase
of CO
2
relative to the role of the diversity of other human climate forcing on global warming, and
more generally, on climate variability and change.
In terms of climate change and variability on the regional and local
scale, the IPCC Reports, the CCSP Report on surface and tropospheric
temperature trends, and the U.S. National Assessment have
overstated the role of the radiative effect of the anthropogenic increase
of CO2
relative to the role of the diversity of other human climate forcing on global warming, and
more generally, on climate variability and change.
Global and regional climate models have not demonstrated
skill at predicting climate change and variability on multi-decadal time scales.
Global and regional climate models have not demonstrated
skill at predicting climate change and variability on multi-decadal time scales.

Attempts to significantly influence regional and local-
scale climate based on controlling CO2
emissions alone is an inadequate policy
for this purpose.
Attempts to significantly influence regional and local-
scale climate based on controlling CO2
emissions alone is an inadequate policy
for this purpose.

A vulnerability paradigm, focused on regional and local societal and environmental
resources of importance, is a more inclusive, useful, and scientifically robust framework to interact with policymakers, than is the focus on global multi-decadal climate predictions which are downscaled to the regional and
local scales. The vulnerability paradigm permits the evaluation of the entire spectrum
of risks associated with different social and environmental threats, including climate
variability and change.

Humans are significantly altering the global climate, but in a variety of diverse ways beyond the radiative effect of carbon dioxide. The IPCC
assessments have been too conservative in recognizing the importance of these human
climate forcings as they alter regional and global climate. These assessments have also not
communicated the inability of the models to accurately forecast the spread of possibilities of future climate. The forecasts, therefore, do not
provide any skill in quantifying the impact of different mitigation strategies on the actual climate
response that would occur.
The Current IPCC Focus is to Promote Energy Policy Changes, Not to Provide an Effective Climate Policy
Policymakers Need To Be Informed Of This Very Important Distinction
We Need To Separate Climate Policy From Energy Policy.
The Current IPCC Focus is to Promote Energy Policy Changes, Not to Provide an Effective Climate Policy
Policymakers Need To Be Informed Of This Very Important Distinction
We Need To Separate Climate Policy From Energy Policy.
Roger A. Pielke Sr. Research Group Weblog
http://climatesci.colorado.edu
Roger A. Pielke Sr. Website
http://cires.colorado.edu/science/groups/pielke
Roger A. Pielke Sr. Research Group Weblog
http://climatesci.colorado.edu
Roger A. Pielke Sr. Website
http://cires.colorado.edu/science/groups/pielke

PowerPoint Presentation Prepared byDallas Jean Staley
Research Assistant and WebmasterUniversity of Colorado
Boulder, Colorado [email protected]
PowerPoint Presentation Prepared byDallas Jean Staley
Research Assistant and WebmasterUniversity of Colorado
Boulder, Colorado [email protected]