Embed Size (px)
Citation preview
1
1
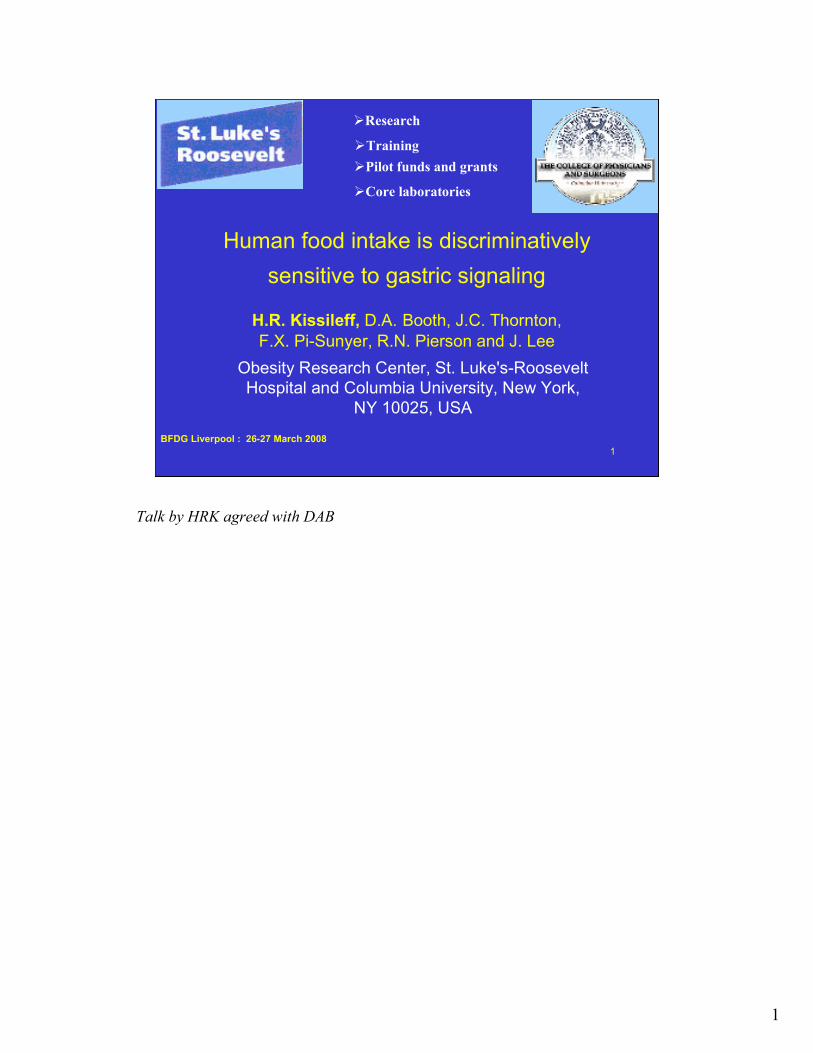
Human food intake is discriminatively
sensitive to gastric signaling
H.R. Kissileff, D.A. Booth, J.C. Thornton,
F.X. Pi-Sunyer, R.N. Pierson and J. Lee
Obesity Research Center, St. Luke's-Roosevelt
Hospital and Columbia University, New York,
NY 10025, USA
�Research
�Training
�Pilot funds and grants
�Core laboratories
BFDG Liverpool : 26-27 March 2008
Talk by HRK agreed with DAB
2
2
Long Range Goals
• The goal of the research in my laboratory is
to quantify the contributions of various signals
generated by consuming food that satisfy
appetite.
• In order to achieve this goal, we must
examine the separate and combined
biological consequences of consuming food.
Speaker = HRK
The collaborative study presented here develops my long-term interest in satiety
signals.
Each separate signal must be examined in context with signals it combines with.
3
3
Collaborative development
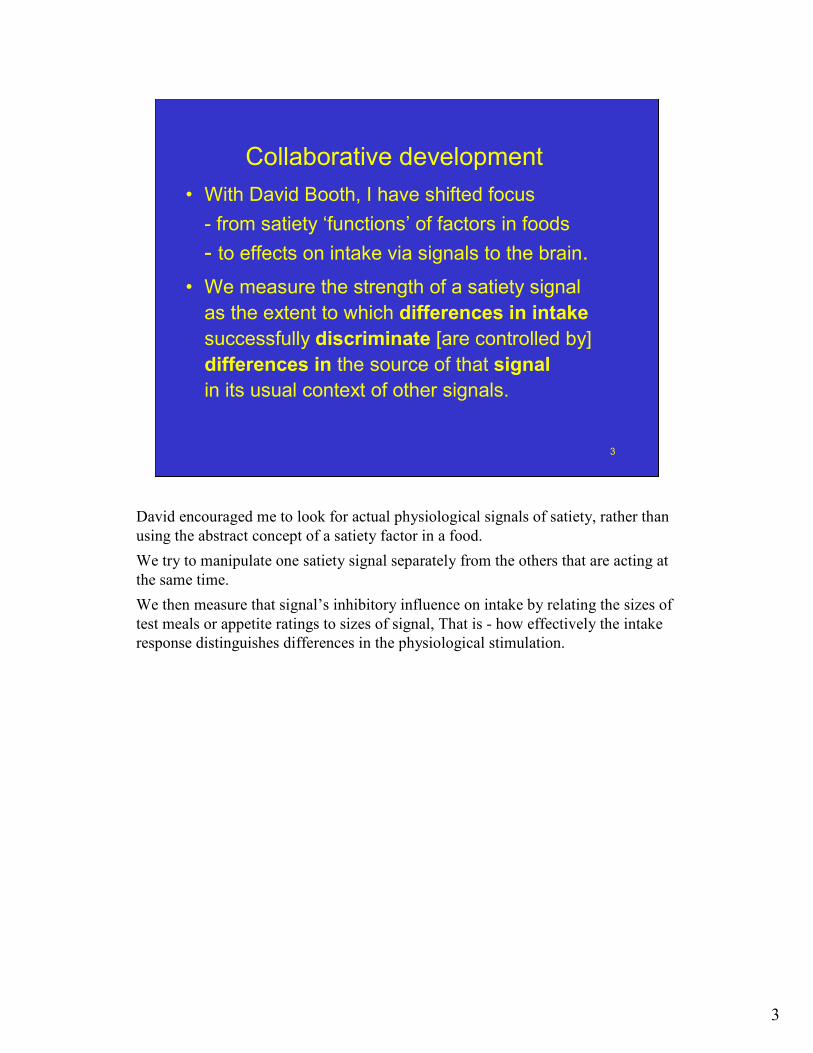
• With David Booth, I have shifted focus
- from satiety ‘functions’ of factors in foods
- to effects on intake via signals to the brain.
• We measure the strength of a satiety signal
as the extent to which differences in intake
successfully discriminate [are controlled by]
differences in the source of that signal
in its usual context of other signals.
David encouraged me to look for actual physiological signals of satiety, rather than
using the abstract concept of a satiety factor in a food.
We try to manipulate one satiety signal separately from the others that are acting at
the same time.
We then measure that signal’s inhibitory influence on intake by relating the sizes of
test meals or appetite ratings to sizes of signal, That is - how effectively the intake
response distinguishes differences in the physiological stimulation.
4
4
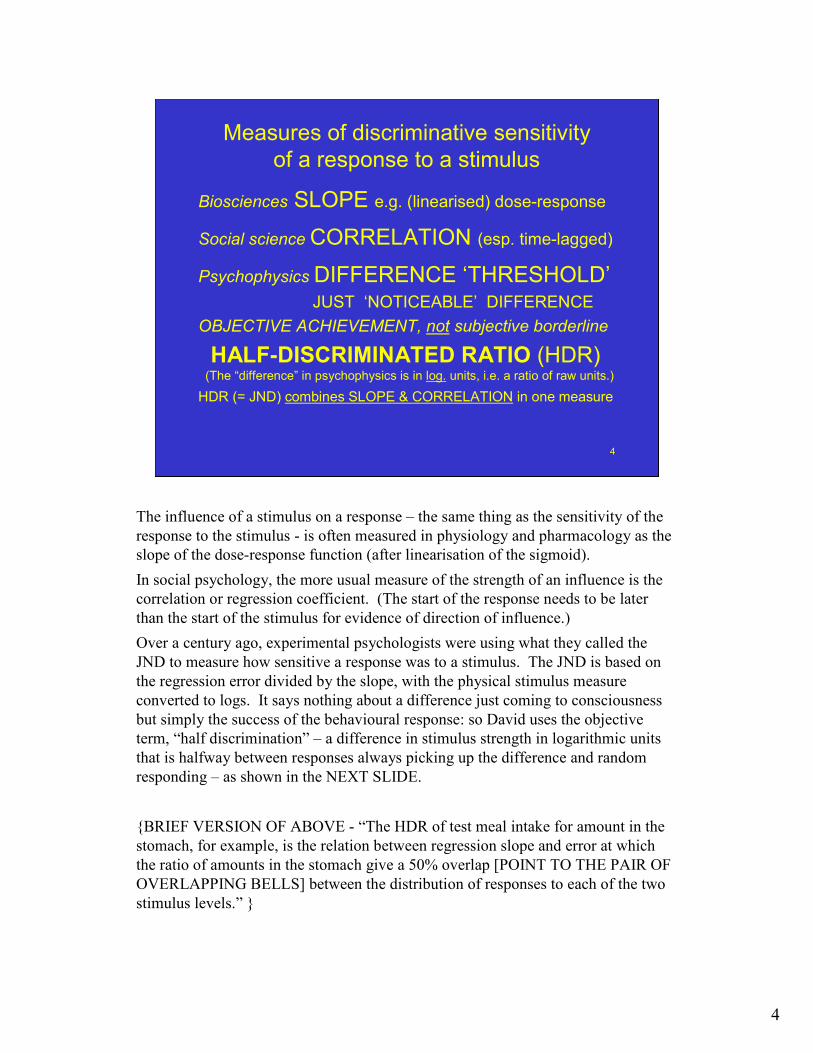
Measures of discriminative sensitivity
of a response to a stimulus
Biosciences SLOPE e.g. (linearised) dose-response
Social scienceCORRELATION (esp. time-lagged)
PsychophysicsDIFFERENCE ‘THRESHOLD’JUST ‘NOTICEABLE’ DIFFERENCE
OBJECTIVE ACHIEVEMENT, not subjective borderline
HALF-DISCRIMINATED RATIO (HDR)(The “difference” in psychophysics is in log. units, i.e. a ratio of raw units.)
HDR (= JND) combines SLOPE & CORRELATION in one measure
The influence of a stimulus on a response – the same thing as the sensitivity of the
response to the stimulus - is often measured in physiology and pharmacology as the
slope of the dose-response function (after linearisation of the sigmoid).
In social psychology, the more usual measure of the strength of an influence is the
correlation or regression coefficient. (The start of the response needs to be later
than the start of the stimulus for evidence of direction of influence.)
Over a century ago, experimental psychologists were using what they called the
JND to measure how sensitive a response was to a stimulus. The JND is based on
the regression error divided by the slope, with the physical stimulus measure
converted to logs. It says nothing about a difference just coming to consciousness
but simply the success of the behavioural response: so David uses the objective
term, “half discrimination” – a difference in stimulus strength in logarithmic units
that is halfway between responses always picking up the difference and random
responding – as shown in the NEXT SLIDE.
{BRIEF VERSION OF ABOVE - “The HDR of test meal intake for amount in the
stomach, for example, is the relation between regression slope and error at which
the ratio of amounts in the stomach give a 50% overlap [POINT TO THE PAIR OF
OVERLAPPING BELLS] between the distribution of responses to each of the two
stimulus levels.” }
5
5
Stimulus strength (gastric distention)
Response strength (intake at a test meal)
o
o
o
o
o
oo
Log(S1)Log(S
0)
R0
R1
The HDR is the difference
between two log. levels of
the stimulus which is
HALFway between perfect
and zero discrimination, I.e.
75% of responses to S1 are
indistinguishable from
25% of responses to So.
Theoretical graph of the Half-Discriminated Ratio (HDR)
o
o
o
o
0 |
SP
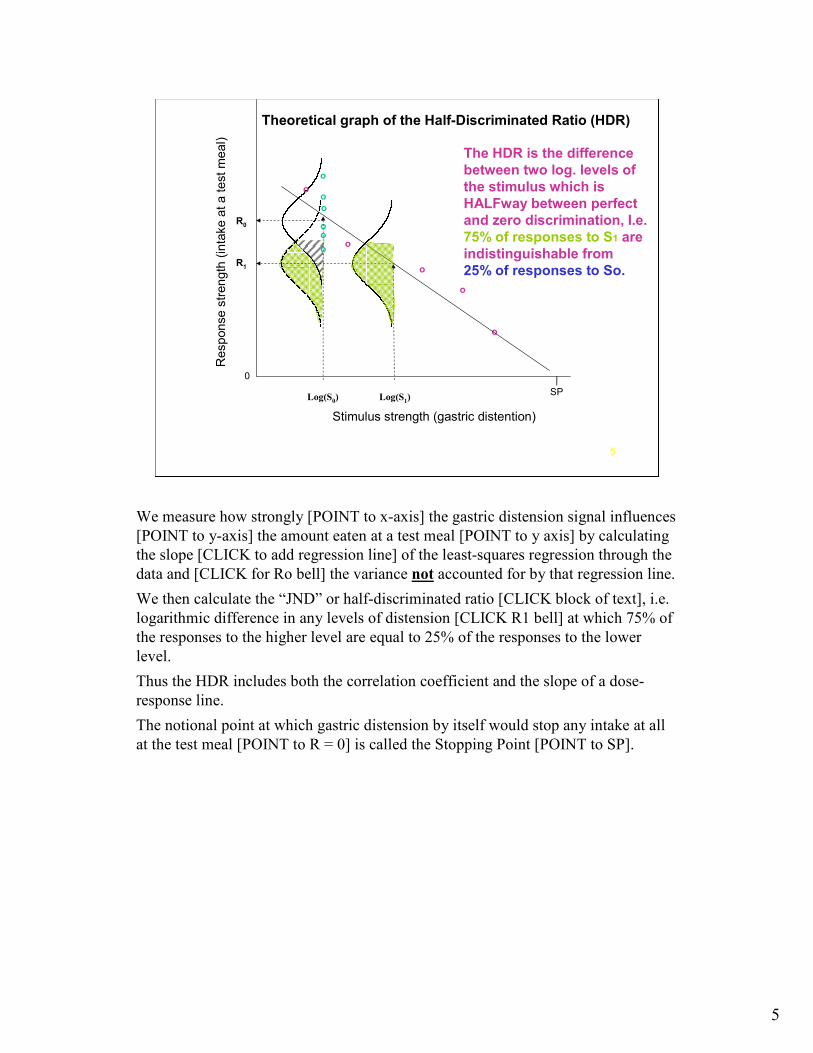
We measure how strongly [POINT to x-axis] the gastric distension signal influences
[POINT to y-axis] the amount eaten at a test meal [POINT to y axis] by calculating
the slope [CLICK to add regression line] of the least-squares regression through the
data and [CLICK for Ro bell] the variance not accounted for by that regression line.
We then calculate the “JND” or half-discriminated ratio [CLICK block of text], i.e.
logarithmic difference in any levels of distension [CLICK R1 bell] at which 75% of
the responses to the higher level are equal to 25% of the responses to the lower
level.
Thus the HDR includes both the correlation coefficient and the slope of a dose-
response line.
The notional point at which gastric distension by itself would stop any intake at all
at the test meal [POINT to R = 0] is called the Stopping Point [POINT to SP].
6
6
Gastric Stimulus & Intake Response
Amount in stomach at start of test meal:
• Tc99 labelled tomato soup at 11:30 AM,
tracked by gamma camera for 30 minutes.
• Six test days with 5 amounts of soup (160 -
800 g) or nothing; balanced sequences.
Amount eaten in test meal:
• Yogurt presented at 12 noon to complete that
day’s lunch, with intake tracked by UEM.
Participants: 12 men, 12 women; healthy BMIs.
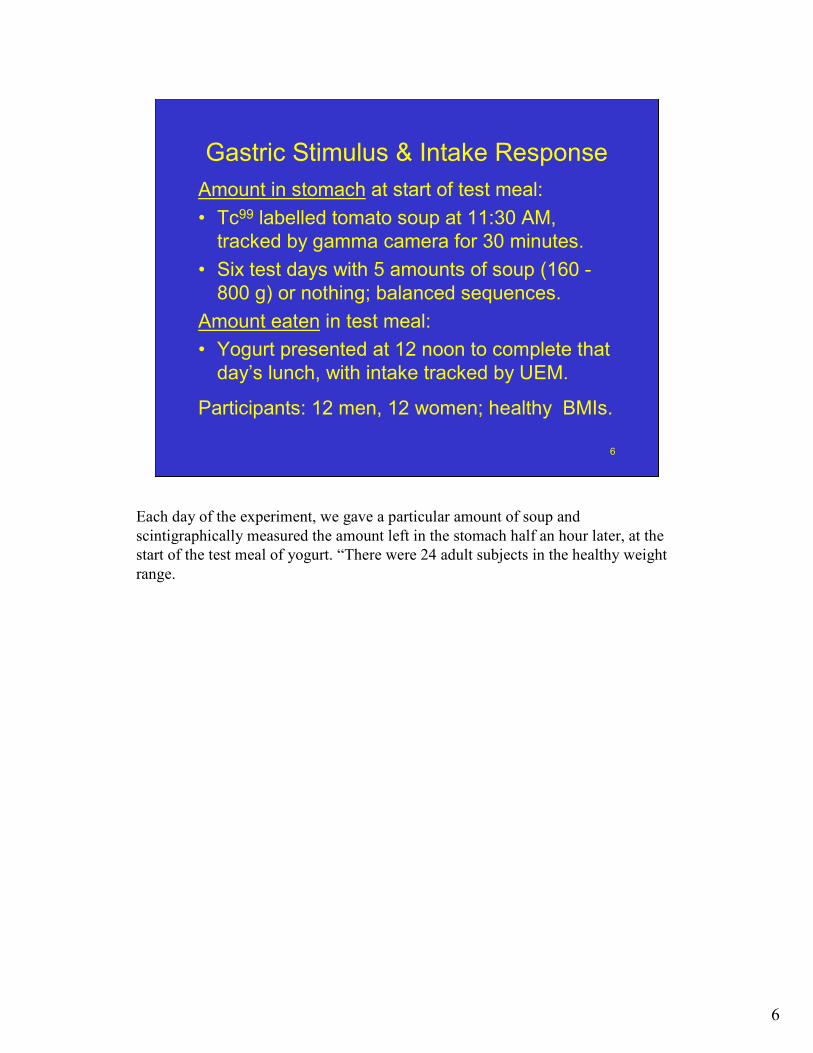
Each day of the experiment, we gave a particular amount of soup and
scintigraphically measured the amount left in the stomach half an hour later, at the
start of the test meal of yogurt. “There were 24 adult subjects in the healthy weight
range.
7
7
Log Survivor Plot of HDRs
Log10[1 –Rank / (N-1)]
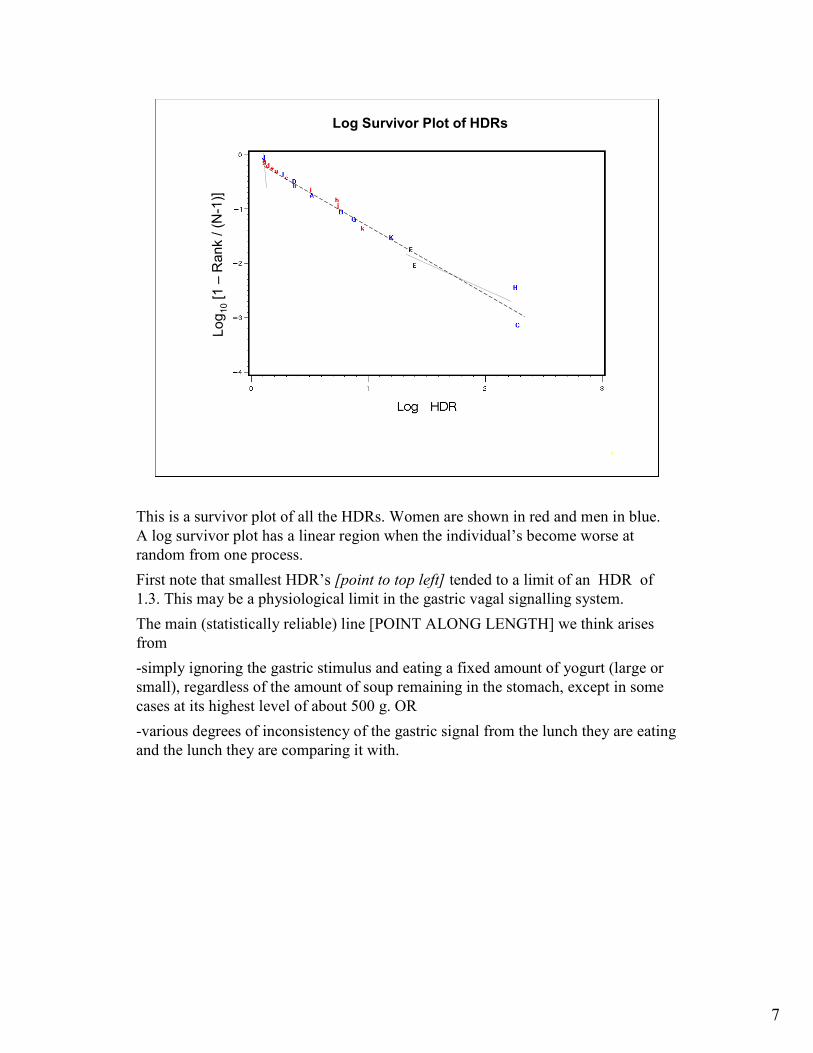
This is a survivor plot of all the HDRs. Women are shown in red and men in blue.
A log survivor plot has a linear region when the individual’s become worse at
random from one process.
First note that smallest HDR’s [point to top left] tended to a limit of an HDR of
1.3. This may be a physiological limit in the gastric vagal signalling system.
The main (statistically reliable) line [POINT ALONG LENGTH] we think arises
from
-simply ignoring the gastric stimulus and eating a fixed amount of yogurt (large or
small), regardless of the amount of soup remaining in the stomach, except in some
cases at its highest level of about 500 g. OR
-various degrees of inconsistency of the gastric signal from the lunch they are eating
and the lunch they are comparing it with.
8
8
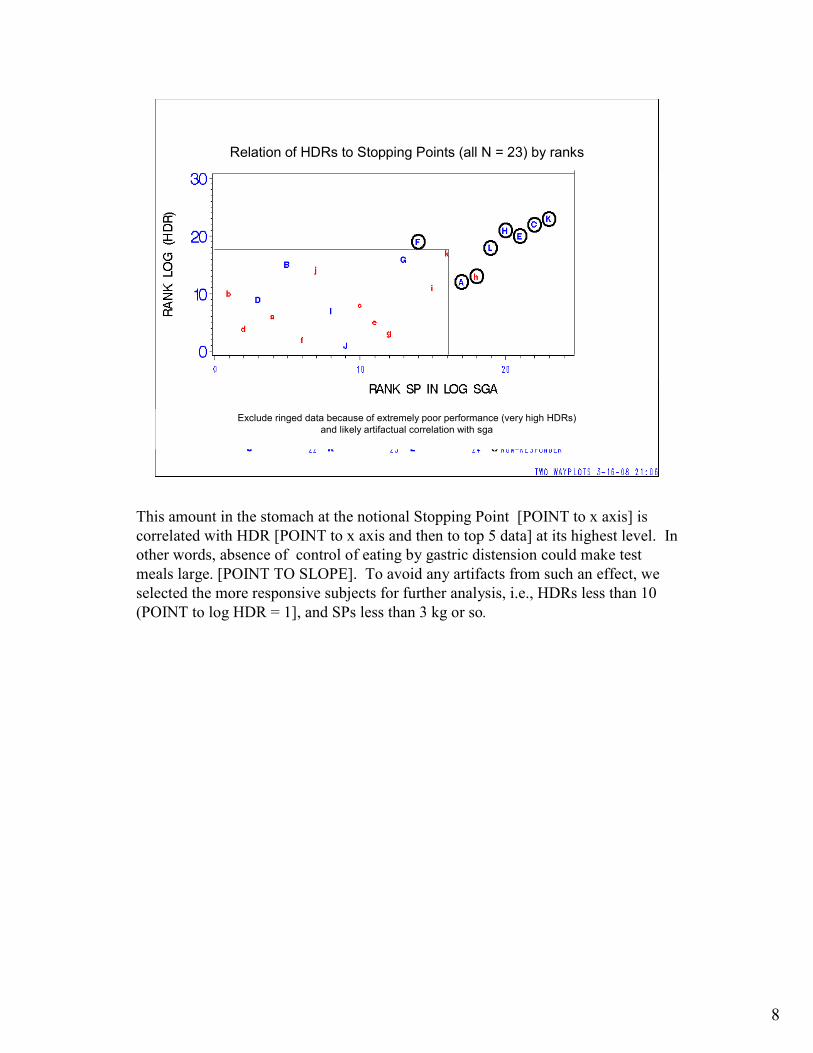
Exclude ringed data because of extremely poor performance (very high HDRs)
and likely artifactual correlation with sga
Relation of HDRs to Stopping Points (all N = 23) by ranks
This amount in the stomach at the notional Stopping Point [POINT to x axis] is
correlated with HDR [POINT to x axis and then to top 5 data] at its highest level. In
other words, absence of control of eating by gastric distension could make test
meals large. [POINT TO SLOPE]. To avoid any artifacts from such an effect, we
selected the more responsive subjects for further analysis, i.e., HDRs less than 10
(POINT to log HDR = 1], and SPs less than 3 kg or so.
9
9
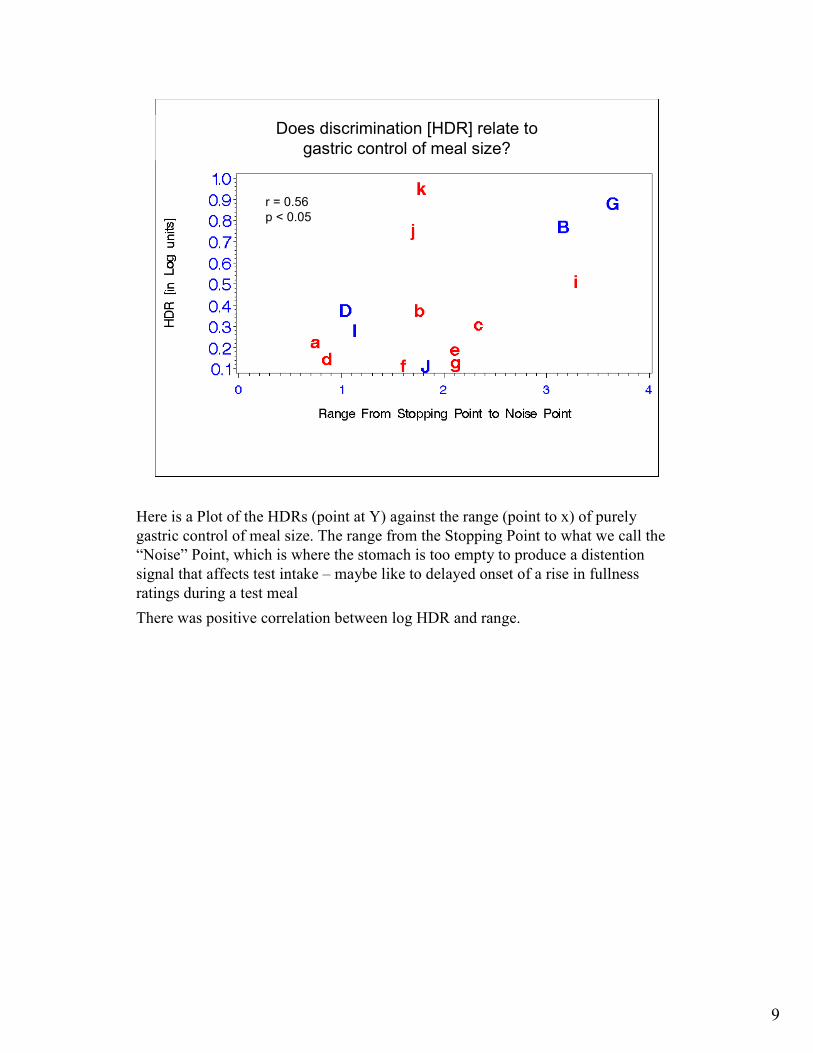
Does discrimination [HDR] relate to
gastric control of meal size?
r = 0.56
p < 0.05
Here is a Plot of the HDRs (point at Y) against the range (point to x) of purely
gastric control of meal size. The range from the Stopping Point to what we call the
“Noise” Point, which is where the stomach is too empty to produce a distention
signal that affects test intake – maybe like to delayed onset of a rise in fullness
ratings during a test meal
There was positive correlation between log HDR and range.
10
10
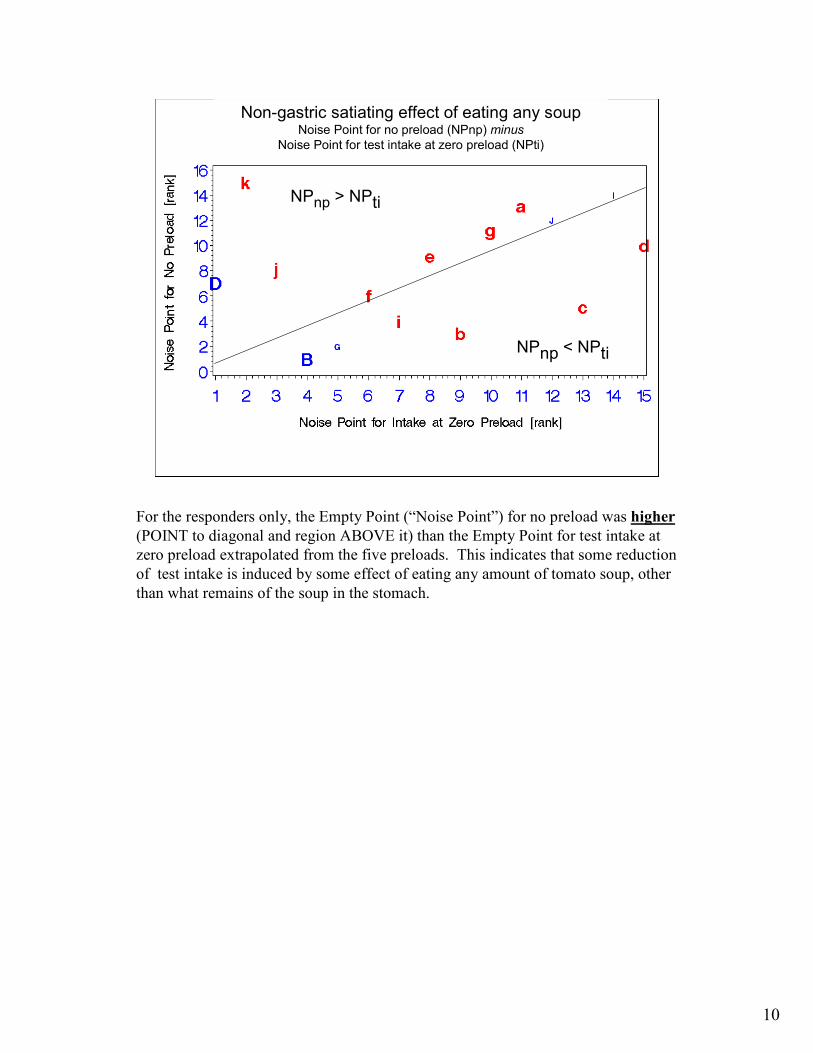
Non-gastric satiating effect of eating any soupNoise Point for no preload (NPnp) minus
Noise Point for test intake at zero preload (NPti)
NPnp > NPti
NPnp < NPti
For the responders only, the Empty Point (“Noise Point”) for no preload was higher
(POINT to diagonal and region ABOVE it) than the Empty Point for test intake at
zero preload extrapolated from the five preloads. This indicates that some reduction
of test intake is induced by some effect of eating any amount of tomato soup, other
than what remains of the soup in the stomach.
11
11
Summary of findings
• HDRs tended to a limit of 1.3 (30% increase),
perhaps the maximum of vagal sensitivity.
• Larger HDRs (worse discrimination) were associated
with wider ranges over which intakes responded to
the gastric signal: less consistency in comparisons
with normal lunch may lead to bigger test meals.
• Estimates of signal below response (‘noise’) were
smaller from meals with prior soup than without,
indicating that the earlier eating generates other
signals as well as gastric.
First, there was evidence of a physiological limit on discrimination at about 30%
increase in amount in the stomach.
Second, ignoring the gastric signal is one factor in larger test meals.
Third, the level of amount in the stomach at which the test meal begins to be
reduced by gastric distension depends on other after effect of eating some soup.
12
12
Tomato Soup Dose Response
PRELOAD SIZE (G)
0 200 400 600 800 1000
INTAKE (G)
400
500
600
700
800
900
1000
1100
MALESFEMALES
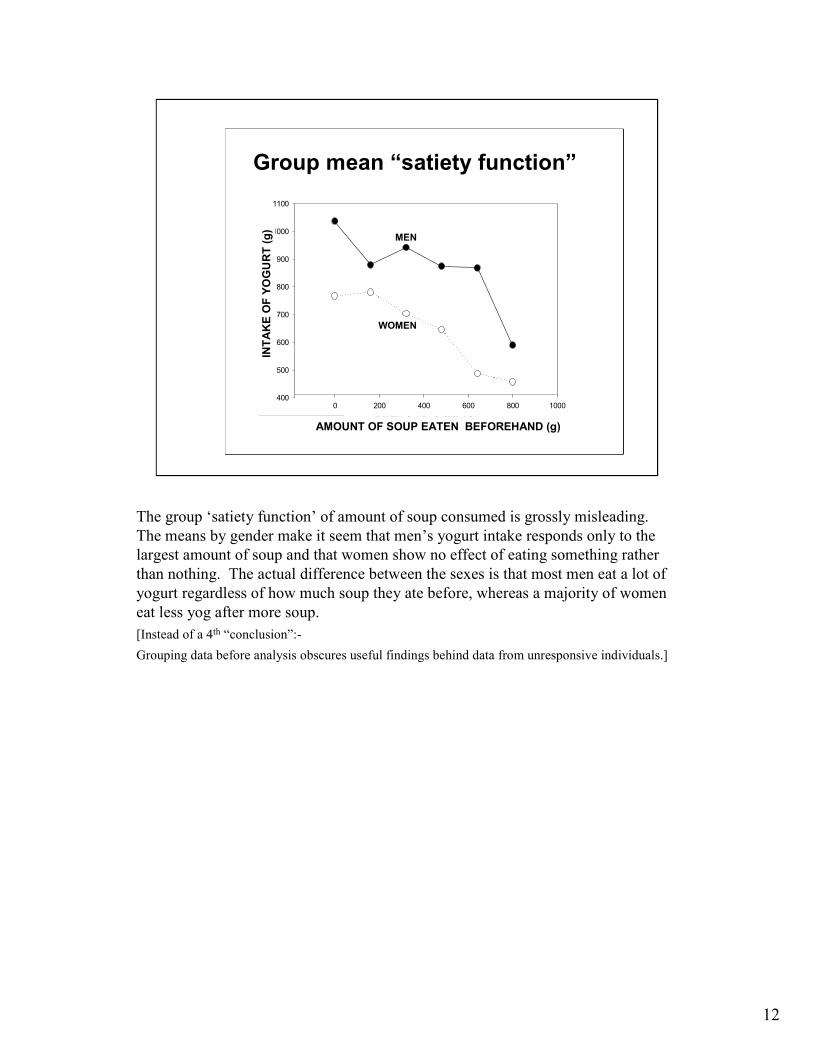
Group mean “satiety function”
MEN
WOMEN
INTAKE OF YOGURT (g)
AMOUNT OF SOUP EATEN BEFOREHAND (g)
The group ‘satiety function’ of amount of soup consumed is grossly misleading.
The means by gender make it seem that men’s yogurt intake responds only to the
largest amount of soup and that women show no effect of eating something rather
than nothing. The actual difference between the sexes is that most men eat a lot of
yogurt regardless of how much soup they ate before, whereas a majority of women
eat less yog after more soup.
[Instead of a 4th “conclusion”:-
Grouping data before analysis obscures useful findings behind data from unresponsive individuals.]