Embed Size (px)
Citation preview

Human Capital Formation and Economic Prosperity
Flávio Cunha
Rice University
February 10, 2017
Flávio Cunha (Rice University) Human Capital Formation and Economic Prosperity February 10, 2017 1 / 22

Human Capital in the USA
1 Human capital stocks in the USA are not growing at the same rateas in other developed countries.
Flávio Cunha (Rice University) Human Capital Formation and Economic Prosperity February 10, 2017 2 / 22

Tertiary Education in OECD Countries
A1
To what level have adults studied? – IndIcAtor A1 chapter A
Education at a Glance 2014: OECD Indicators © OECD 2014 33
Countries with relatively low upper secondary attainment rates can fall into one of two categories: either most individuals leave education before obtaining an upper secondary qualification (i.e. they have below upper secondary education), or they continue in education beyond this level until they earn a higher degree (i.e. they have attained tertiary education). In Australia, Canada, Ireland, Israel, Korea, New Zealand, the Russian Federation, Spain and the United Kingdom, tertiary attainment rates are higher than upper secondary attainment rates. In Luxembourg and Portugal, the rates for upper secondary and tertiary education are similar (Table A1.4a).
The gender gap in attainment rates has reversed among younger adults. On average, 25-34 year-old women have higher attainment rates in tertiary education than men of the same age. Some 84% of younger women have attained at least an upper secondary education while 81% of younger men have, on average (Tables A1.2b and A1.4b, available on line).
Tertiary attainmentChart A1.1 shows that across OECD countries, tertiary attainment (including advanced research programmes, i.e. ISCED levels 5A, 5B and 6) has increased by 10 percentage points since 2000. On average, 34% of adult women and 31% of adult men have attained tertiary education. Younger adults have spurred this growth, and the change is evenlarger among women: in all OECD countries, younger women have higher tertiary attainment rates than older womenby an average of more than 20 percentage points (Table A1.3b, available on line).
1 2 http://dx.doi.org/10.1787/888933114989
Chart A1.3. percentage of younger and older tertiary-educated adults (2012) 25-34 and 55-64 year-olds, and percentage-point difference between these two groups
70
60
50
40
30
20
10
0
-10
70
60
50
40
30
20
10
0
-10
%Percentage
points
Isra
elU
nite
d St
ates
Ger
man
yBr
azil
Esto
nia
Aus
tria
Rus
sian
Fed
erat
ion
Finl
and
Chi
le1
Turk
eyIt
aly
Den
mar
kM
exic
oSw
itze
rlan
dN
ew Z
eala
ndCa
nada
Slov
ak R
epub
licIc
elan
dA
ustr
alia
Gre
ece
Swed
enO
ECD
ave
rage
Nor
way
Hun
gary
Net
herl
ands
Czec
h R
epub
licU
nite
d K
ingd
omLa
tvia
Port
ugal
Belg
ium
Slov
enia
Spai
nFr
ance
Luxe
mbo
urg
Irel
and
Japa
nPo
land
Kor
ea
1. Year of reference 2011. Countries are ranked in ascending order of the percentage-point di�erence between the 25-34 and 55-64 year-old population with tertiary education.Source: OECD. Table A1.3a. See Annex 3 for notes (www.oecd.org/edu/eag.htm).
Di�erence between the 25-34 and 55-64 year-old population with tertiary education (right axis)
Proportion of the 25-34 year-old population with tertiary education (left axis)
Proportion of the 55-64 year-old population with tertiary education (left axis)
Chart A1.3 shows that in some countries, the difference between generations is substantial: over 20 percentage points in France, Ireland, Japan, Luxembourg, Poland and Spain. In Korea, there is a 52 percentage-point gap in tertiary attainment rates between these two age groups. By contrast, the gap in tertiary attainment rates between the two age groups is less than three percentage points in Germany, Israel and the United States (Table A1.3a).
The proportion of 25-34 year-olds with tertiary education is larger than 40% in most OECD and partner countries (the OECD average is 39%), while among 55-64 year-olds this is only the case in Canada, Israel, the Russian Federation and the United States. Data also show that only 14% of 25-34 year-olds in Brazil have a tertiary education, and less than 14% of 55-64 year-olds in Brazil, Chile, the Czech Republic, Italy, Mexico, Poland, Portugal and Turkey do.
Flávio Cunha (Rice University) Human Capital Formation and Economic Prosperity February 10, 2017 3 / 22

Human Capital in the USA
1 Human capital stocks in the USA are not growing at the same rateas in other developed countries.
2 College enrollment has increased but graduation rates havestayed constant.
Flávio Cunha (Rice University) Human Capital Formation and Economic Prosperity February 10, 2017 4 / 22

College Enrollment: NCES Dataset
0.
5.
10.
15.
20.
25.
FigureCollege enrollment in the United States from 1965 to 2014 and projections up to 2025 for
public and private colleges (in millions)Digest of Education Statistics 2015, table 303.10
Public Private
Flávio Cunha (Rice University) Human Capital Formation and Economic Prosperity February 10, 2017 5 / 22
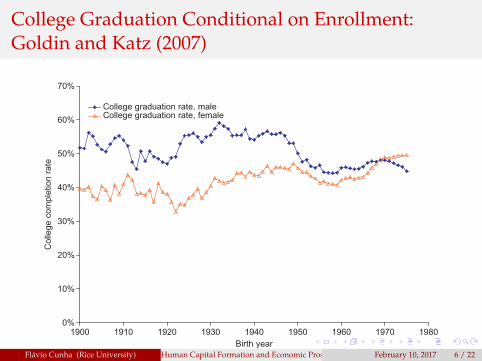
College Graduation Conditional on Enrollment:Goldin and Katz (2007)
Comparing across the panels shown in Fig. 8.3, it is clear that changes in collegedegree attainment have not followed changes in college enrollment consistently overthe course of the last 25 years. While college enrollment rates have increased fairly con-sistently, college degree attainment declined before increasing among more recentcohorts. Figure 8.4 presents the trend by birth cohort in the share of enrolled collegestudents who complete a BA degree—essentially the trend shown in Fig. 8.3c dividedby the trend in Fig. 8.3b. For both men and women, the rate of college completion hasbeen below 50% for nearly a half century, with this level appreciably below the rate ofcompletion achieved by men in the early part of the century.
A component of this stagnation has been a growing disparity in college completionrates by parental circumstances. For example, for high school students from the topquartile of the family income distribution, completion rates rose slightly from 67.4 to71% between those starting college in the early 1980s and those starting in the early1990s, while the college completion rates fell for students from other income groups(Bowen, Chingos, and McPherson (2009)). Indeed, for 1992 high school seniors whoenrolled in college, the difference in college completion rates between the students
0%
10%
20%
30%
40%
50%
60%
70%
1900 1910 1920 1930 1940 1950 1960 1970 1980Birth year
Col
lege
com
plet
ion
rate
College graduation rate, maleCollege graduation rate, female
Figure 8.4 Share of College Entrants Receiving BA Degree.
Notes: The completion rate presented in this figure represents the ratio of the number of college degreerecipients (Fig. 8.3c) to the number of individuals with at least some college (Fig. 8.3b). See Fig. 8.3 foradditional notes on the data.
Dropouts and Diplomas 579
Flávio Cunha (Rice University) Human Capital Formation and Economic Prosperity February 10, 2017 6 / 22
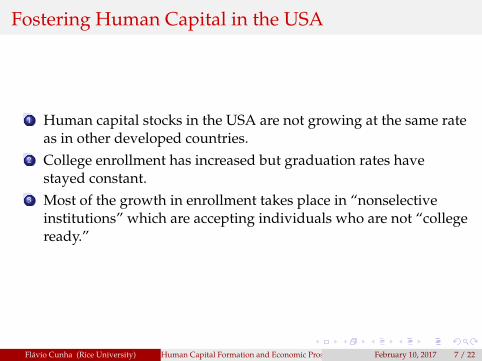
Fostering Human Capital in the USA
1 Human capital stocks in the USA are not growing at the same rateas in other developed countries.
2 College enrollment has increased but graduation rates havestayed constant.
3 Most of the growth in enrollment takes place in “nonselectiveinstitutions” which are accepting individuals who are not “collegeready.”
Flávio Cunha (Rice University) Human Capital Formation and Economic Prosperity February 10, 2017 7 / 22

Changing Selectivity: Hoxby (2009)
Mean SAT/ACT Percentile Score of Colleges, by Colleges' Selectivity in 1962
0
10
20
30
40
50
60
70
80
90
100
1962 1967 1972 1977 1982 1987 1992 1997 2002 2007
Year
Mean SA
T or ACT
Percentile
Score of C
olleges in the
Group
most selective in 1962: 4‐year colleges withselectivity in the 99th %ile in 1962
96th‐98th %ile in 1962
91st‐95th %ile in 1962
81st‐90th %ile in 1962
71st‐80th %ile in 1962
61st‐70th %ile in 1962
51st‐60th %ile in 1962
41st‐50th %ile in 1962
31st‐40th %ile in 1962
21st‐30th %ile in 1962
11th‐20th %ile in 1962
6th‐10th %ile in 1962
least selective in 1962: 4‐year colleges withselectivity in the 1st‐5th %iles in 1962
2 year colleges (estimated)
Figure 1
29
Flávio Cunha (Rice University) Human Capital Formation and Economic Prosperity February 10, 2017 8 / 22

College Graduation Conditional on Enrollment:Heckman et al (2006)
Model Human Critical Genes Model Est Causality Hetero Age 10 Summary
Figure 3: The Probability of Educational Decisions, by EndowmentLevels, Some College vs. 4-year college degree
Decile of Cognitive
1 2 3 4 5 6 7 8 9 10
Decile of Socio-Emotional12
34567
8910
Pro
bab
ility
0
0.2
0.4
0.6
0.8
1
Decile of Cognitive
1 2 3 4 5 6 7 8 9 10
Pro
bab
ility
0
0.2
0.4
0.6
0.8
1
Fra
ctio
n
0
0.05
0.1
0.15
0.2
0.25
0.3
0.35Probability
Decile of Socio-Emotional
1 2 3 4 5 6 7 8 9 10
Pro
bab
ility
0
0.2
0.4
0.6
0.8
1
Fra
ctio
n
0
0.05
0.1
0.15
0.2
0.25
0.3Probability
Source: Heckman, Humphries, Urzua, and Veramendi (2011).
James Heckman Economics and Econometrics of Human Development
Flávio Cunha (Rice University) Human Capital Formation and Economic Prosperity February 10, 2017 9 / 22

Human Capital in the USA
1 Human capital stocks in the USA are not growing at the same rateas in other developed countries.
2 College enrollment has increased but graduation rates havestayed constant.
3 Most of the growth in enrollment takes place in “nonselectiveinstitutions” which are accepting individuals who are not “collegeready.”
4 College readiness is a process that starts in childhood andcontinues during adolescence and early adulthood
Flávio Cunha (Rice University) Human Capital Formation and Economic Prosperity February 10, 2017 10 / 22

Evolution of Inequality in Cognitive SkillsIntroduction Simple Model Structural Model Data and Estimates Conclusion and Future Work
The Gaps in Skill Open Up at Early Ages: Carneiro andHeckman (2002).
-0.8000
-0.6000
-0.4000
-0.2000
0.0000
0.2000
0.4000
0.6000
0.8000
3 5 6 7 8 9 10 11 12 13 14
Age
Bottom Quartile Second Quartile Third Quartile Top Quartile
Flávio Cunha (Rice University) Human Capital Formation and Economic Prosperity February 10, 2017 11 / 22

Evolution of Inequality in Noncognitive Skills
Model Human Critical Genes Model Est Causality Hetero Age 10 Summary
Average percentile rank on anti-social behavior score, by income quartile
Polarization
Argument
Skills
Evidence
Critical and Sensitive Periods
Environment
Intuitive
Estimates
Illustration
Summary
Average Percentile Rank on Anti-Social Behavior Score, by Income Quartile
Third Income Quartile
55
30
35
45
40
50
25
20
Second Income Quartile Lowest Income Quartile
Highest Income Quartile
4 Yrs 6 Yrs 12 Yrs
Scor
e Pe
rcen
tile
8 Yrs 10 Yrs
Age
James Heckman Economics and Econometrics of Human DevelopmentFlávio Cunha (Rice University) Human Capital Formation and Economic Prosperity February 10, 2017 12 / 22

Human Capital in the USA
1 Human capital stocks in the USA are not growing at the same rateas in other developed countries.
2 College enrollment has increased but graduation rates havestayed constant.
3 Most of the growth in enrollment takes place in “nonselectiveinstitutions” which are accepting individuals who are not “collegeready.”
4 College readiness is a process that starts in childhood andcontinues during adolescence and early adulthood.
5 To increase college readiness in the USA, it is necessary to:1 Improve targeting of early childhood programs.2 Implement programs that promote the development of
non-cognitive skills.
Flávio Cunha (Rice University) Human Capital Formation and Economic Prosperity February 10, 2017 13 / 22

Technology of Skill Formation
In joint work with James Heckman and Susanne Schennach, wehave shown that the production function of human capital isroughly approximated by:
H1 = A
{(1− γL)
[γE (H0)
φE + (1− γE ) (IE )φE
] φLφE + γL (IL)
φL
} 1
φL
Our estimates are such that we cannot reject that1 > φE > 0 > φL>>-∞.
Flávio Cunha (Rice University) Human Capital Formation and Economic Prosperity February 10, 2017 14 / 22

Technology of Skill Formation
Note:
H1 = A
{(1− γL)
[γE (H0)
φE + (1− γE ) (IE )φE
] φLφE + γL (IL)
φL
} 1
φL
Our findings imply that:Early substitutability: The returns to early investments are higherfor children who have low levels of H0.Dynamic complementarity: The returns to late investments arehigher for children who have high levels of[
γE (H0)φE + (1− γE ) (IE )
φE
].
Flávio Cunha (Rice University) Human Capital Formation and Economic Prosperity February 10, 2017 15 / 22
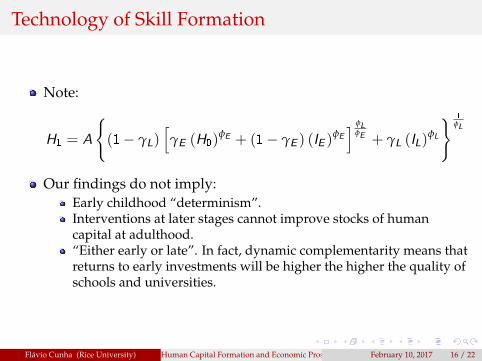
Technology of Skill Formation
Note:
H1 = A
{(1− γL)
[γE (H0)
φE + (1− γE ) (IE )φE
] φLφE + γL (IL)
φL
} 1
φL
Our findings do not imply:Early childhood “determinism”.Interventions at later stages cannot improve stocks of humancapital at adulthood.“Either early or late”. In fact, dynamic complementarity means thatreturns to early investments will be higher the higher the quality ofschools and universities.
Flávio Cunha (Rice University) Human Capital Formation and Economic Prosperity February 10, 2017 16 / 22

Example 1: Better Targeting of Early InterventionPrograms
We need to identify families who are at risk for investing too littlein their children.In different studies in Philadelphia and Houston, our team isworking to develop ways that we can easily separate at risk fromnot at risk families.
Flávio Cunha (Rice University) Human Capital Formation and Economic Prosperity February 10, 2017 17 / 22

LENA Natural Language Processing DeviceMeasuring Quality and Quantity of Time: LENA ProHouston HIPPY LENA Pilot Study
Flávio Cunha, Irma Elo, and Jennifer Culhane (Rice University, University of Pennsylvania, and Children’s Hospital of Philadelphia)Eliciting Maternal Beliefs about the Technology of Skill FormationApril 12, 2016 56 / 59
Flávio Cunha (Rice University) Human Capital Formation and Economic Prosperity February 10, 2017 18 / 22

How large are differences in language environments?
Preliminary results in Philadelphia indicate that:High-SES families spend more meaningful time, have higher AWCand CTC counts than low SES ones.Back of the envelope calculation: 350,000 more words per year and8,000 more turns per year.Comparing mean low-SES family with low-SES family who is onestandard deviation above: pretty much same difference.In other words, there are many low-SES families that invest as ifthey were high-SES families.
Why? Our research indicates that this is due to differences inexpectations about the returns to investments.
Flávio Cunha (Rice University) Human Capital Formation and Economic Prosperity February 10, 2017 19 / 22

Example 2: Noncognitive Skills in Schools
Nagaoka et al (2012) survey the literature on noncognitive skillsand academic performance. According to the literature, there isstrong and positive correlation between academic performance(including college graduation) and noncognitive factors such as:
Academic behaviorsAcademic perseveranceLearning strategies
Flávio Cunha (Rice University) Human Capital Formation and Economic Prosperity February 10, 2017 20 / 22

Example 2: Noncognitive Skills in Schools
Kautz and Zanoni (2014) provide an evaluation of noncognitiveskill formation program implemented in the Chicago PublicSchools.Program designed to do a few things:
Information on how to apply for college.Training and practice of how to build noncognitive skills.
Analysis by Kautz and Zanoni (2014) suggests that programimproves college persistence and college performance.
Flávio Cunha (Rice University) Human Capital Formation and Economic Prosperity February 10, 2017 21 / 22

Fostering Human Capital in the USA
1 The skills an individual acquires through a college education areimportant for economic prosperity and inequality.
2 So far, policy has attempted to increase access to college even forthose students who are not college-ready.
3 This has led to increase in enrollment, but not in graduation.4 To change this reality, it is necessary to promote college-readiness.5 Among other things, this will require better targeting of early
investments and a portfolio of interventions that foster alldimensions of human capital.
Flávio Cunha (Rice University) Human Capital Formation and Economic Prosperity February 10, 2017 22 / 22


![Social Capital USA [The First Wave Only] · 1 Social Capital USA [The First Wave Only] Codebook S. Survey Specifics Survey case # case_ Survey year year Survey month month Survey](https://img.pdfslide.us/doc/110x75/5e8b2e94640b2c04ce2a5b73/social-capital-usa-the-first-wave-only-1-social-capital-usa-the-first-wave-only.jpg)