Embed Size (px)
Citation preview
Hugo Hidalgo1, Tapash Das1, Dan Cayan1,2, David Pierce1, Tim Barnett1, Govindasamy Bala3, Art Mirin3, Andrew Wood4, Celine Bonfils3, Ben Santer3.
1) Scripps Institution of Oceanography2) United States Geological Survey3) Lawrence Livermore National Laboratory4) University of Washington
Detection and attribution of Climate Change in Streamflow Seasonality of the Western US

Acknowledgments
This research is supported by grants from the Lawrence
Livermore National Laboratory and the California
Energy Commission

Warming already has driven observable hydroclimatic change
Knowles et al.,2006
-2.2 std devsLESS as snowfall
+1 std devMORE as snowfall
Observed: Less snow/more rain
Observed: Less spring snowpack
Observed: Earliergreenup dates
Observed: Observed: Earlier Earlier snowmelt runoffsnowmelt runoff
Slide courtesy of M. Dettinger
TRENDS (1950-97) in April 1 snow-water content at
western snow courses
Mote 2003
Cayan et al. 2001
Stewart et al. 2005

Optimal detection & attribution
● Detection of climate change is the process of identifying if an observed change is significantly different from what would be expected from natural internal climate variability (Hegerl et al. 2006).
● Attribution of anthropogenic climate change is the process of identifying if the observed change is: a) consistent with the type of changes obtained from climate simulations that include external anthropogenic forcings and internal variability and b) inconsistent with other explanations of climate change (Hegerl et al. 2006).
Optimal detection & attribution
● Given a variable for detection, the basic idea is to reduce the problem of multiples dimensions (n) to a univariate or low-dimensional problem (Hegerl et al. 1996).
● In this low-dimensional space, a detection vector is used to compare the observations with the expected climate change pattern.

Previous D&A studies● Ocean heat content (Barnet et al. 2001; Levitus et
al. 2001; 2005; Reicher et al. 2002; Wong et al. 2001),
● ocean salinity (Wong et al. 1999; Curry et al. 2003), ● sea level pressure (Gillet et al. 2003), ● changes in sea ice extent (Tett et al. 1996), ● precipitation (Hegerl et al. 2006; Hoerling et al.
2006), ● tropopause height (Santer et al 2003) ● temperature (Santer et al. 1996a, 1996b; Hegerl et
al. 1996; 1997; 2000; 2006; 2007; Barnet et al. 1999; Tett et al. 1999; 2001; Mitchel and Karoly 2001; Stott et al. 2001; Stott 2003; Zwiers and Zhang 2003; Kalroy et al. 2003; Kalroy and Braganza 2005; Stone et al. 2007).

Modeling● Downscaled to 1/8 degree resolution using
method of constructed analogues (CA) or bias correction followed by spatial disaggregation (BCSD)
● Precipitation, tmax and tmin used as input to the variable infiltration capacity model (VIC; Liang et al. 1994)
● The VIC runoff and baseflow were routed using a computer program by Lohmann et al. (1996) to obtain daily streamflow data for the rivers
● The JFM streamflow fractions were computed
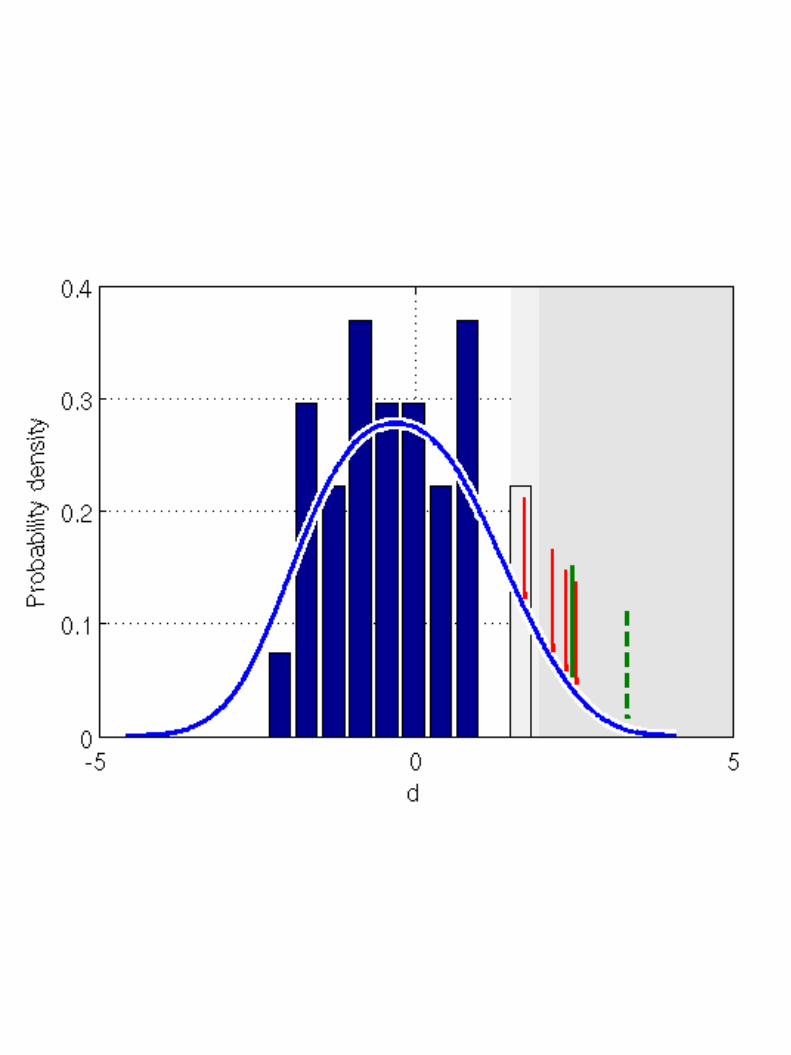
● Fingerprint was computed● The d parameters were computed for all
model runs (d parameter: trends projected into fingerprint).
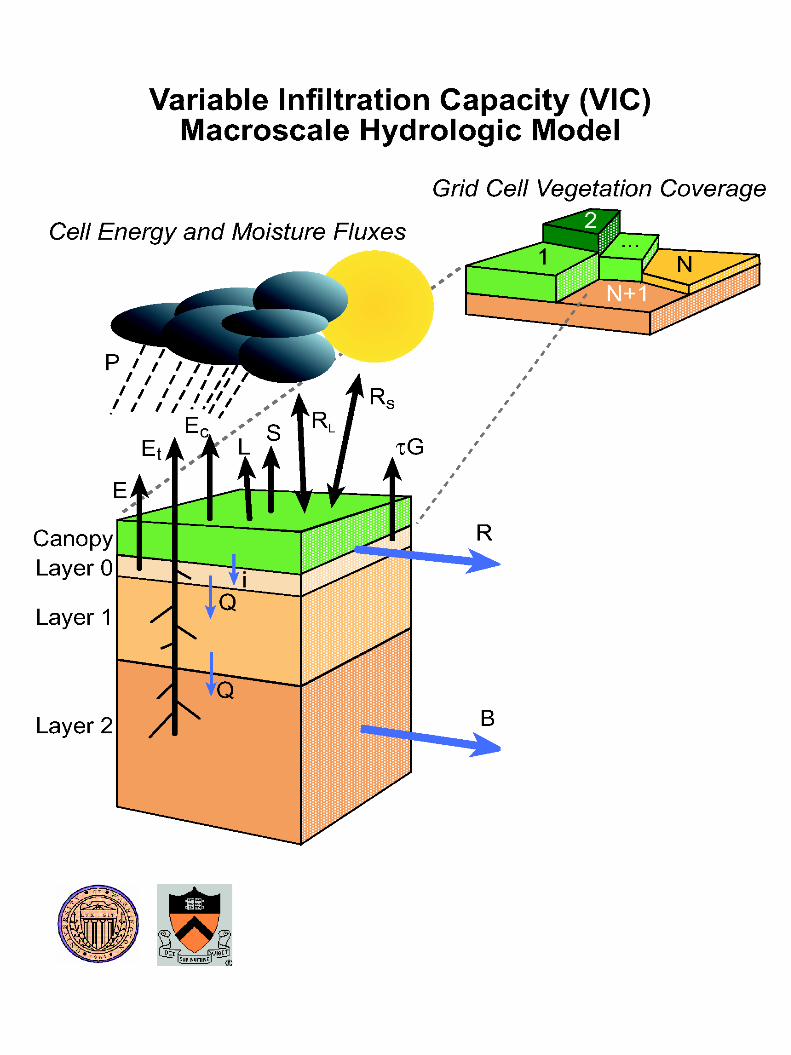
Defining characteristics of VIC are the probabilistic treatment of sub-grid soil moisture capacity distribution, the parameterization of baseflow as a nonlinear recession from the lower soil layer, and that the unsaturated hydraulic conductivity at each particular time step is a function of the degree of saturation of the soil (Sheffield et al. 2004; Campbell 1974; Liang et al. 1994)
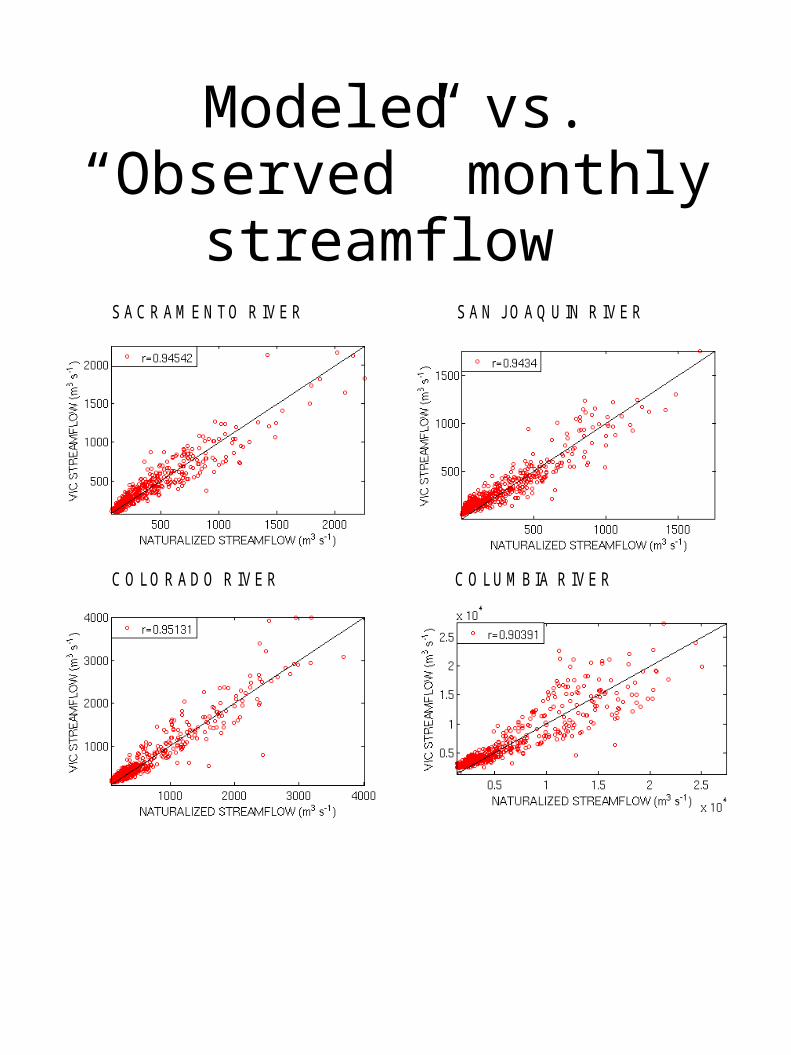
Modeled vs. “Observed” monthly streamflow
SACRAM ENTO R IVER SAN JO AQ UIN R IVER
CO LO RADO R IVER CO LUM BIA R IVER
F igu re 2 . S ca tte rp lo ts o f m o n th ly m o d e led v e rsu s n a tu ra liz ed s tream flo w fo r b as in s in th e w es te rn U S .
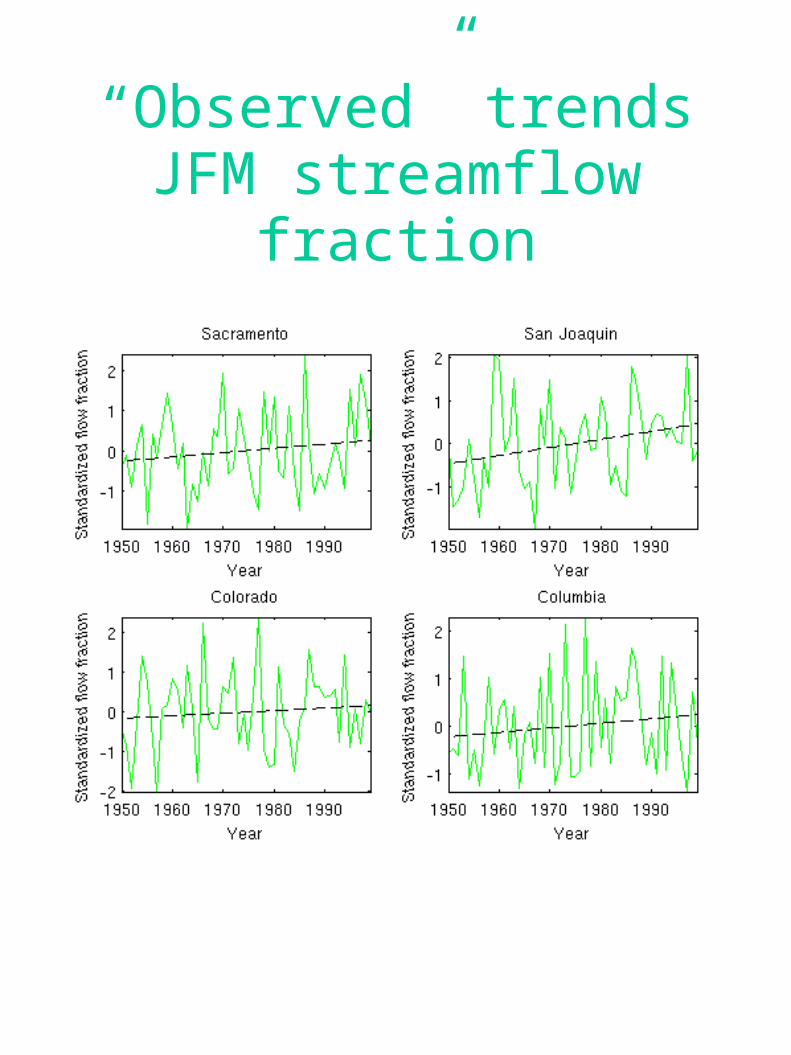
“Observed” trends JFM streamflow fraction
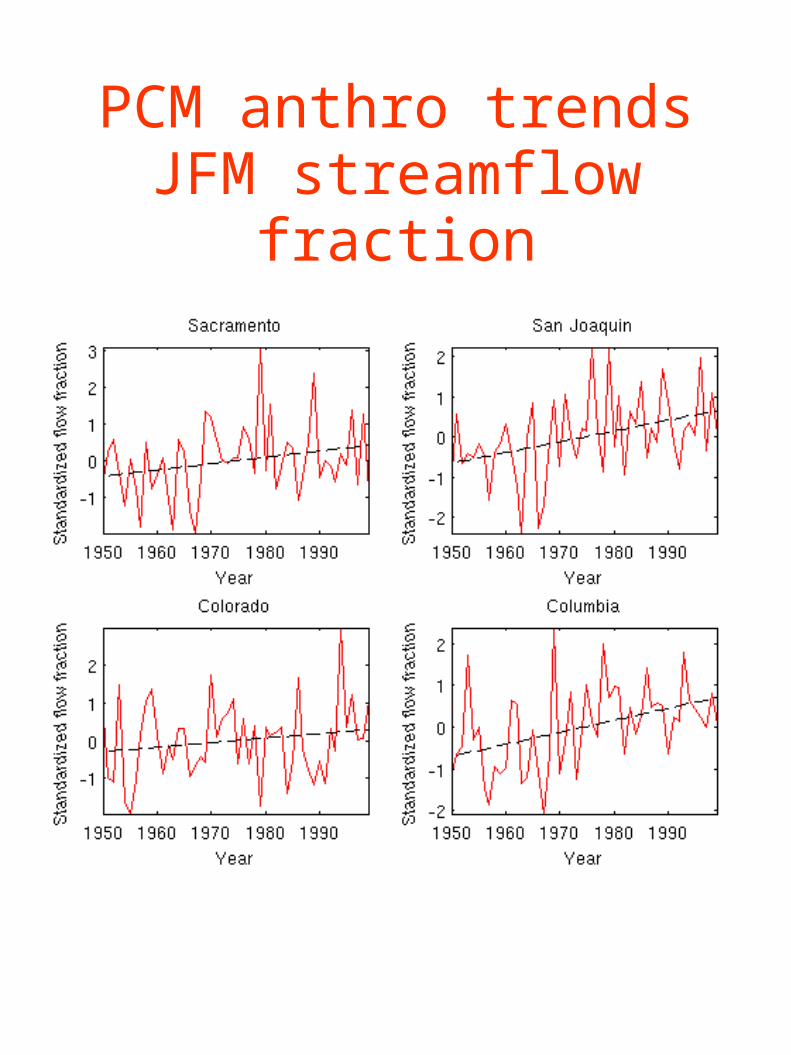
PCM anthro trends JFM streamflow fraction
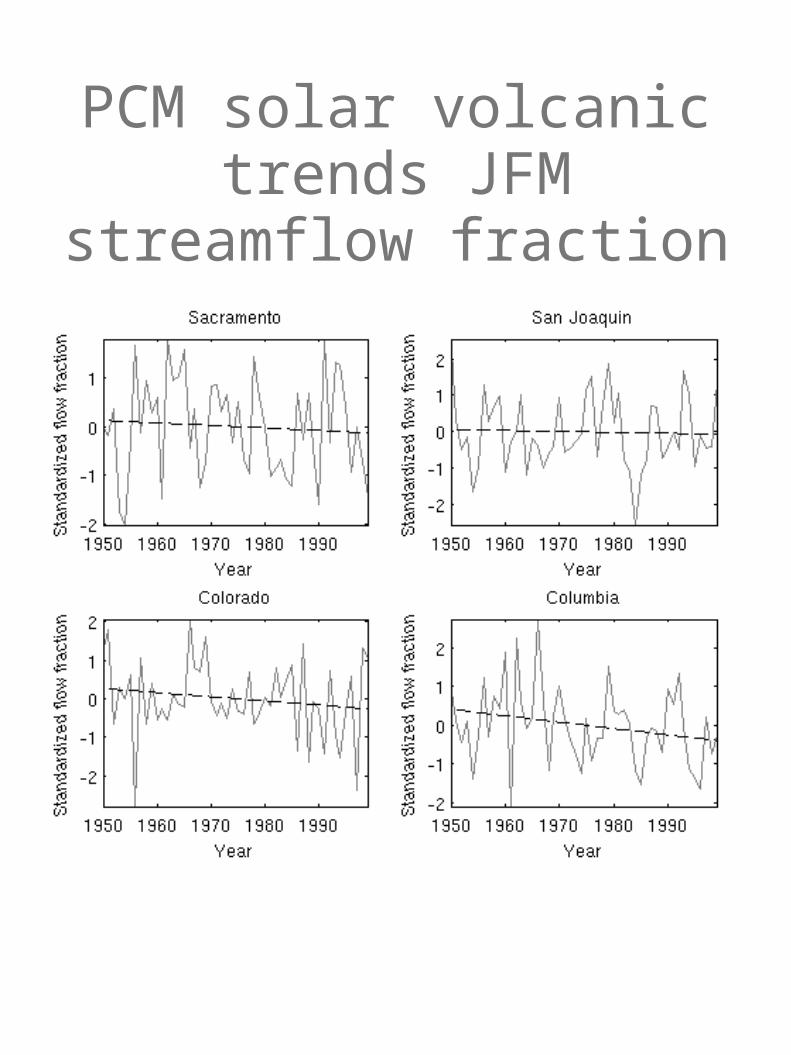
PCM solar volcanic trends JFM streamflow
fraction

FINGERPRINT: FIRST PRINCIPAL COMPONENT OF THE AVERAGE
JFM FRACTIONS FROM THE ANTHRO RUNS

DETECTION PLOT (JFM streamflow fraction)
CONTROL CCSM3-FV (CA)
ANTHROPCM (BCSD)
VIC
NATURALIZED
CONTROL PCM (BCSD)
SOLAR & VOLCANICPCM (CA)
ENSO and PDO out

FINGERPRINT: FIRST PRINCIPAL COMPONENT OF THE AVERAGE
JFM FRACTIONS FROM THE ANTHRO RUNS

DETECTION PLOT (JFM streamflow fraction)
CONTROL CCSM3-FV
ANTHROPCM VIC
NATURALIZED
CONTROL PCM

Center timing of streamflow
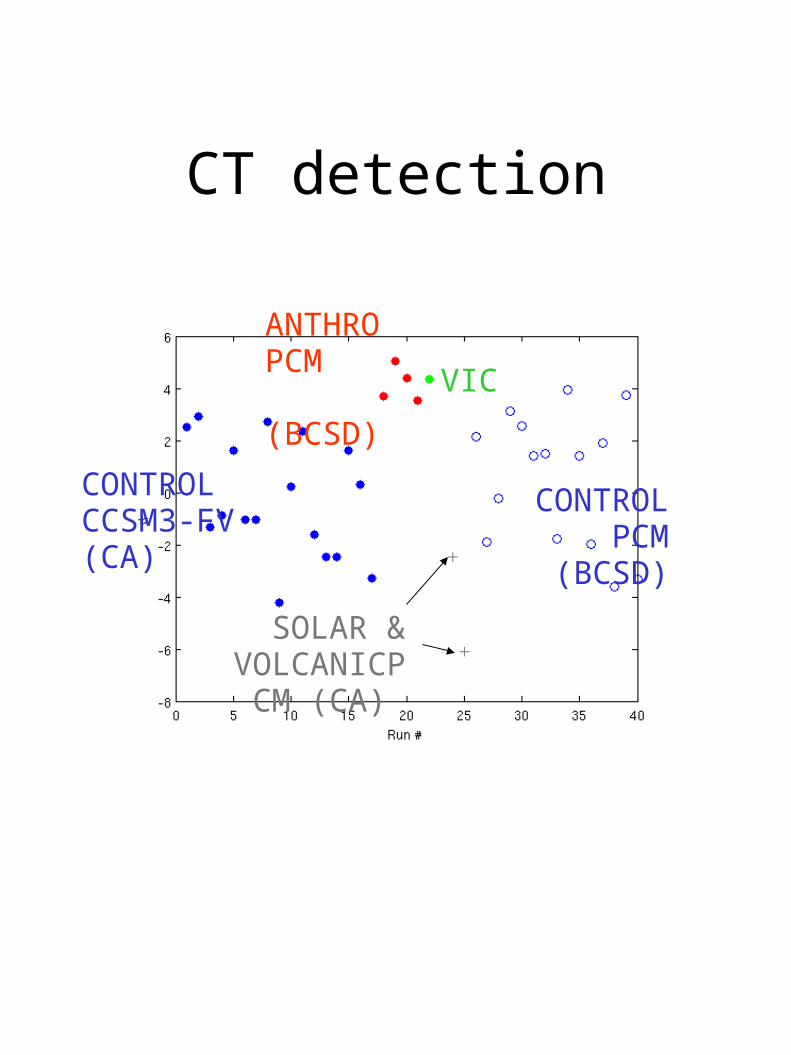
CT detection
CONTROL CCSM3-FV (CA)
ANTHROPCM (BCSD) VIC
CONTROL PCM (BCSD)
SOLAR & VOLCANICPCM (CA)

Columbia Out
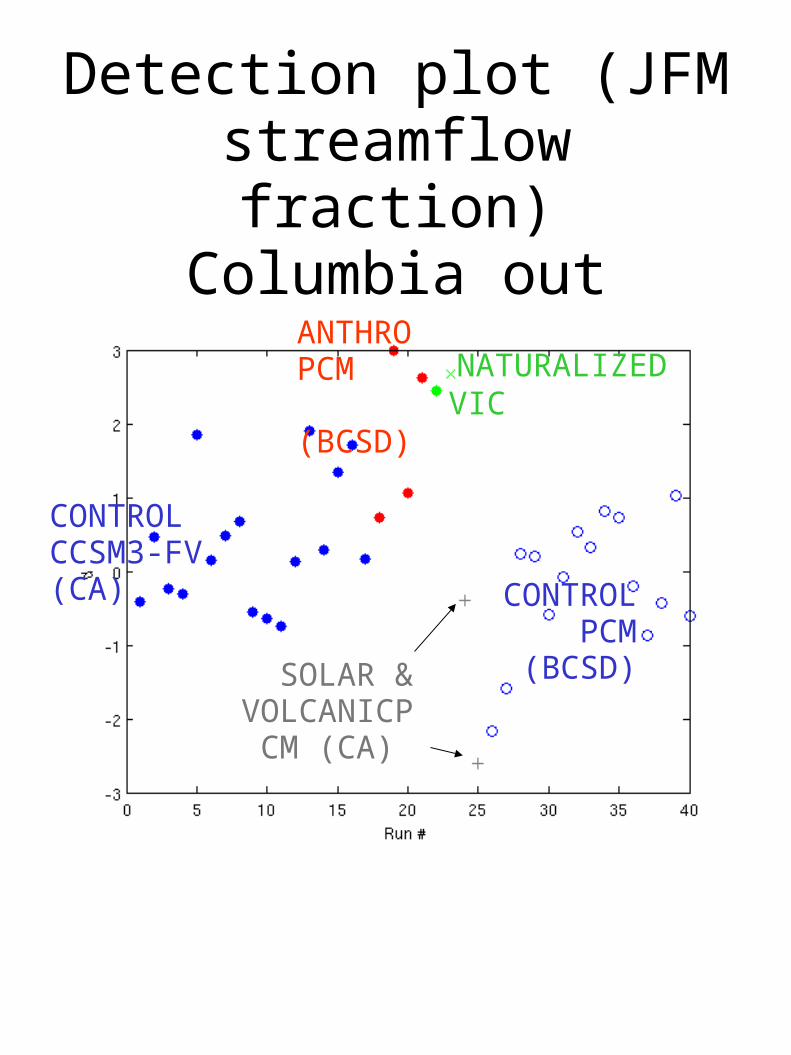
Detection plot (JFM streamflow fraction)
Columbia out
CONTROL CCSM3-FV (CA)
ANTHROPCM (BCSD) VIC
NATURALIZED
CONTROL PCM (BCSD)
SOLAR & VOLCANICPCM (CA)
MIROC runs

Detection plot (JFM streamflow fraction)
CONTROL CCSM3-FV
ANTHROPCM VIC
NATURALIZED
CONTROL PCM
SOLAR & VOLCANIC
PCM
ANTHROMIROC
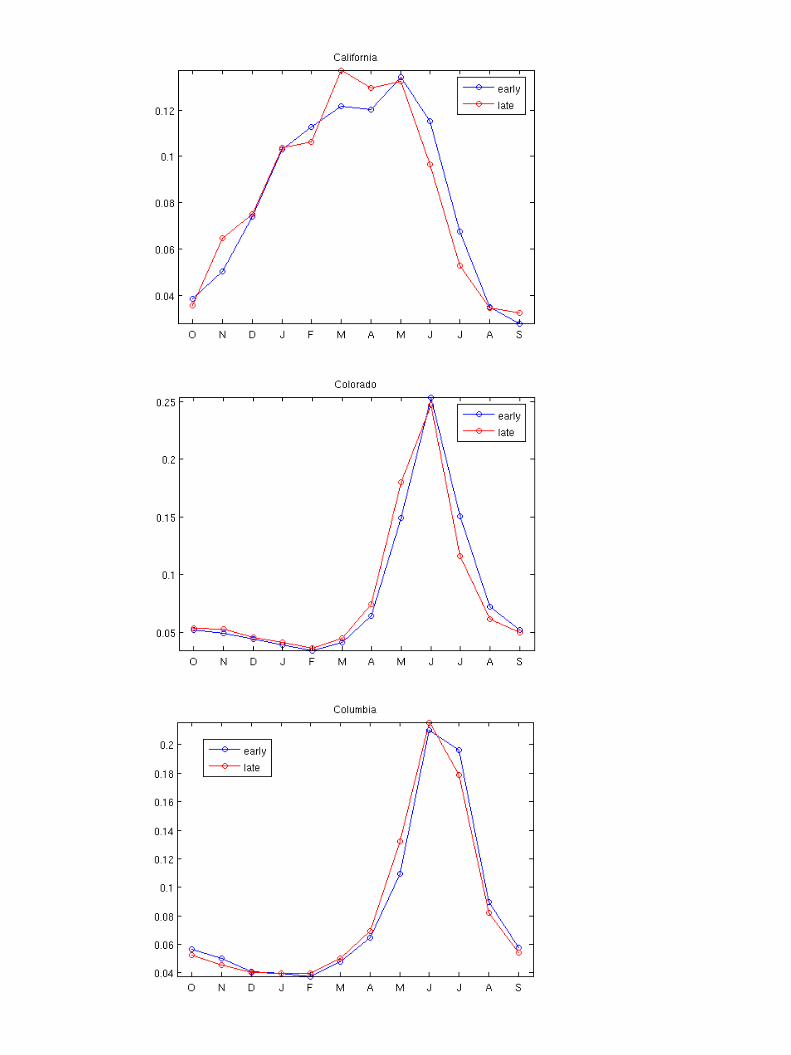
CALI
COLO
COLU
MIROC, RUN 8

Summer detection plot
CONTROL CCSM3-FV
ANTHROPCM
VIC
NATURALIZED
CONTROL PCM
SOLAR & VOLCANIC
PCM
ANTHROMIROC
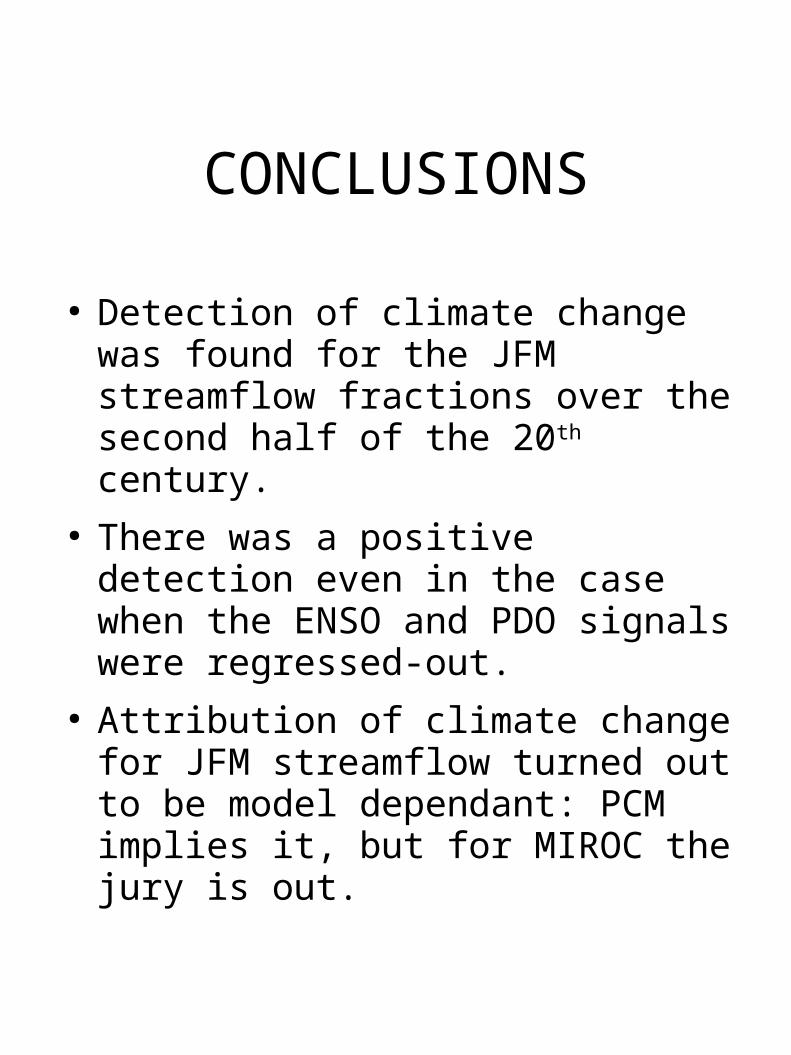
CONCLUSIONS
● Detection of climate change was found for the JFM streamflow fractions over the second half of the 20th century.
● There was a positive detection even in the case when the ENSO and PDO signals were regressed-out.
● Attribution of climate change for JFM streamflow turned out to be model dependant: PCM implies it, but for MIROC the jury is out.

Downscaling methods
• CA– Daily variability
is conserved– Tends to
produce textured weaker trends
• BCSD– Daily variability
is not conserved
– Tends to produce smooth stronger trends
T R E N D S IN JF M T A V G ( C /P E R D E C A D E )