Embed Size (px)
Citation preview
Dan Cayan Scripps Institution of Oceanography, Climate Research Division
and US Geological Survey
Climate Change in California: a threat to be contended with
California Energy Commission PIER programCalifornia Energy Commission PIER programNOAA Office of Global ProgramsNOAA Office of Global Programs www.meteora.ucsd.edu/~CAPwww.meteora.ucsd.edu/~CAP
•• Published in 2001Published in 2001•• Emphasizes information from the last 5 yearsEmphasizes information from the last 5 years•• Places climate change in the context of sustainablePlaces climate change in the context of sustainable
development, emphasizing equity issuesdevelopment, emphasizing equity issues•• Policy relevant, but not policy prescriptivePolicy relevant, but not policy prescriptive
IPCC Third Assessment ReportIPCC Third Assessment ReportKey Findings of Working Group IKey Findings of Working Group I
“An increasing body of observations gives“An increasing body of observations givesa collective picture of a warming worlda collective picture of a warming worldand other changes in the climateand other changes in the climatesystem.”system.”
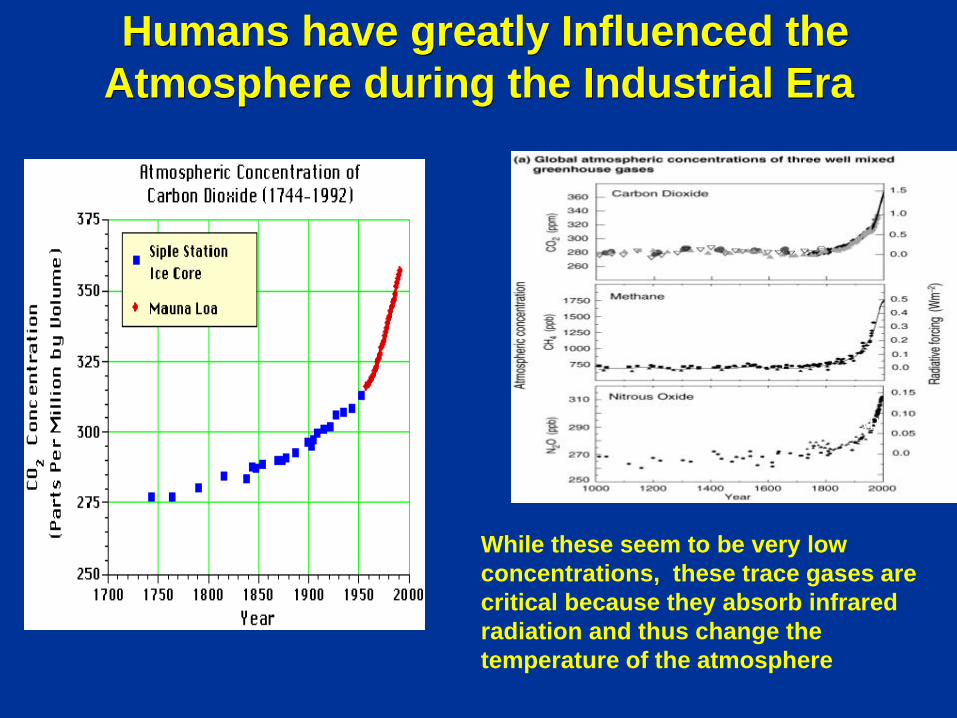
Humans have greatly Influenced the Humans have greatly Influenced theAtmosphere during the Industrial EraAtmosphere during the Industrial Era
Source: IPCC TAR 2001
While these seem to be very lowconcentrations, these trace gases arecritical because they absorb infraredradiation and thus change thetemperature of the atmosphere
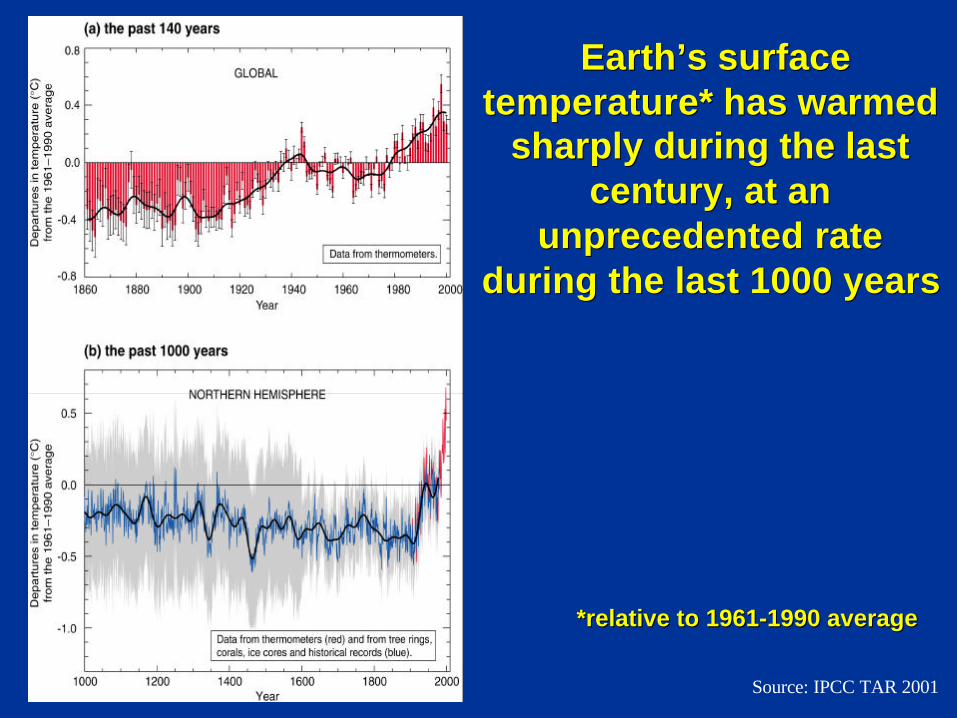
Source: IPCC TAR 2001
Earth’s surface Earth’s surfacetemperature* has warmedtemperature* has warmed
sharply during the lastsharply during the lastcentury, at ancentury, at an
unprecedented rateunprecedented rateduring the last 1000 yearsduring the last 1000 years
*relative to 1961-1990 average*relative to 1961-1990 average
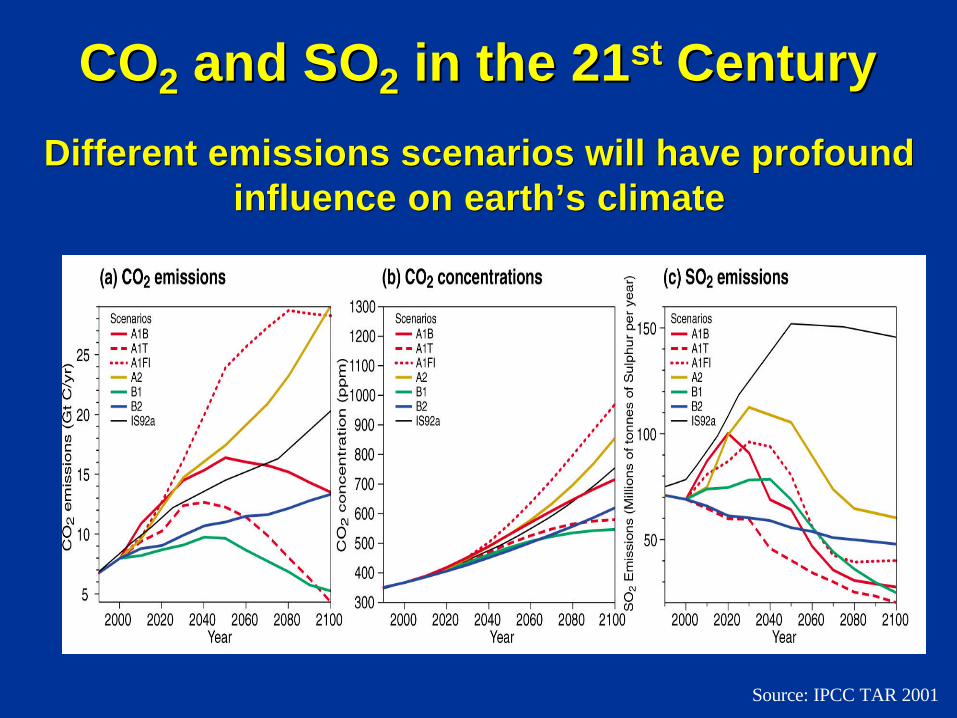
COCO22 and SO and SO22 in the 21 in the 21stst Century Century
Different emissions scenarios will have profoundDifferent emissions scenarios will have profoundinfluence on earth’s climateinfluence on earth’s climate
Source: IPCC TAR 2001
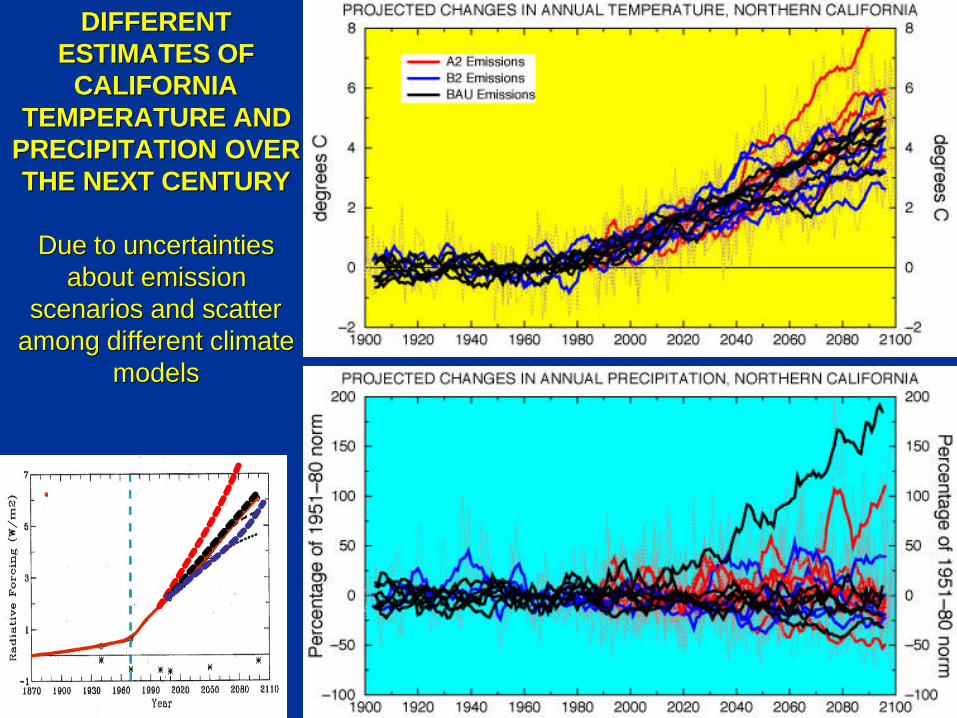
DIFFERENTDIFFERENTESTIMATES OFESTIMATES OF
CALIFORNIACALIFORNIATEMPERATURE ANDTEMPERATURE AND
PRECIPITATION OVERPRECIPITATION OVERTHE NEXT CENTURYTHE NEXT CENTURY
Due to uncertaintiesDue to uncertaintiesabout emissionabout emission
scenarios and scatterscenarios and scatteramong different climateamong different climate
modelsmodels
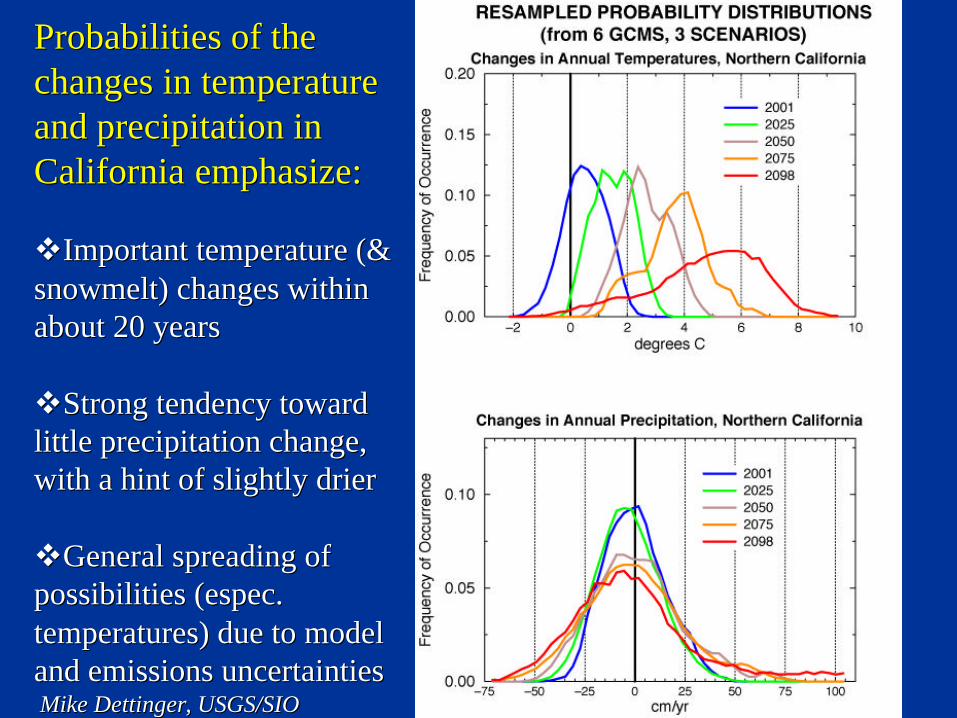
Probabilities of theProbabilities of thechanges in temperaturechanges in temperatureand precipitation inand precipitation inCalifornia emphasize:California emphasize:
vvImportant temperature (&Important temperature (&snowmelt) changes withinsnowmelt) changes withinabout 20 yearsabout 20 years
vvStrong tendency towardStrong tendency towardlittle precipitation change,little precipitation change,with a hint of slightly drierwith a hint of slightly drier
vvGeneral spreading ofGeneral spreading ofpossibilities (espec.possibilities (espec.temperatures) due to modeltemperatures) due to modeland emissions uncertaintiesand emissions uncertainties Mike Mike DettingerDettinger, USGS/SIO, USGS/SIO
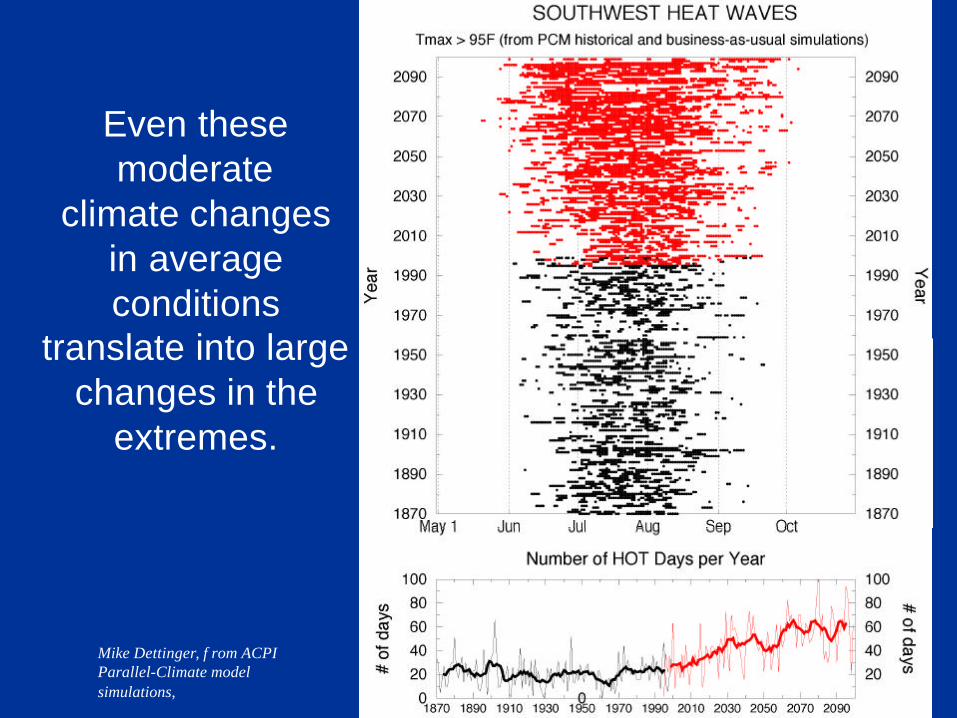
Even thesemoderate
climate changesin averageconditions
translate into largechanges in the
extremes.
Mike Dettinger, f rom ACPIParallel-Climate modelsimulations,
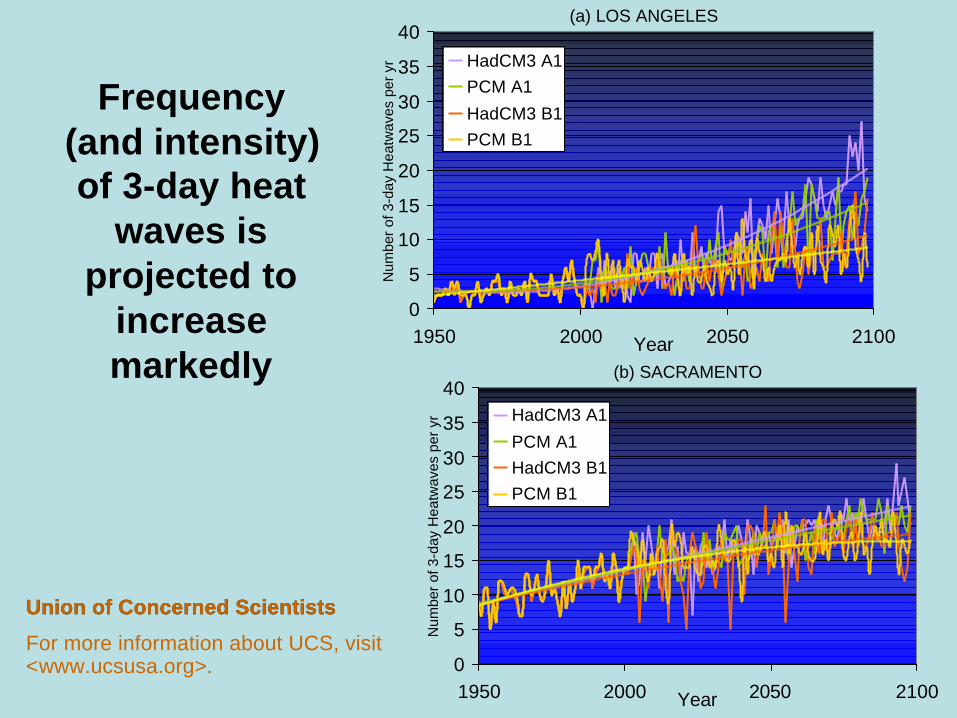
(a) LOS ANGELES
0
5
10
15
20
25
30
35
40
1950 2000 2050 2100Year
Num
ber
of 3
-day
Hea
twav
es p
er y
r HadCM3 A1PCM A1
HadCM3 B1PCM B1
(b) SACRAMENTO
0
5
10
15
20
25
30
35
40
1950 2000 2050 2100Year
Num
ber
of 3
-day
Hea
twav
es p
er y
r HadCM3 A1
PCM A1HadCM3 B1PCM B1
Frequency(and intensity)of 3-day heat
waves isprojected to
increasemarkedly
Union of Concerned ScientistsUnion of Concerned Scientists
For more information about UCS, visit<www.ucsusa.org>.
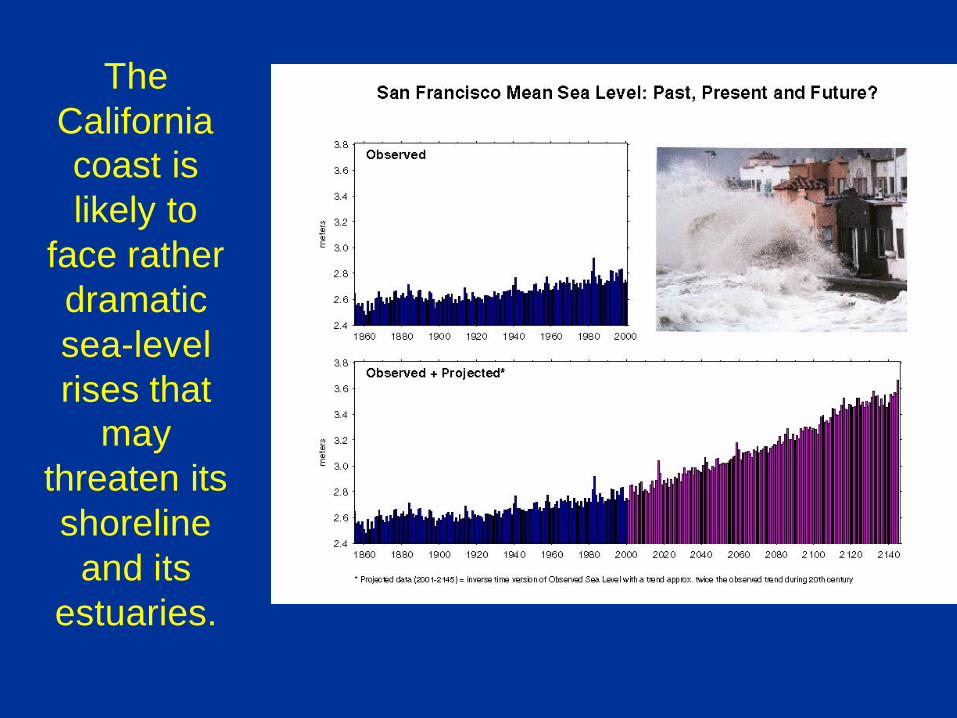
TheCaliforniacoast islikely to
face ratherdramaticsea-levelrises that
maythreaten itsshoreline
and itsestuaries.
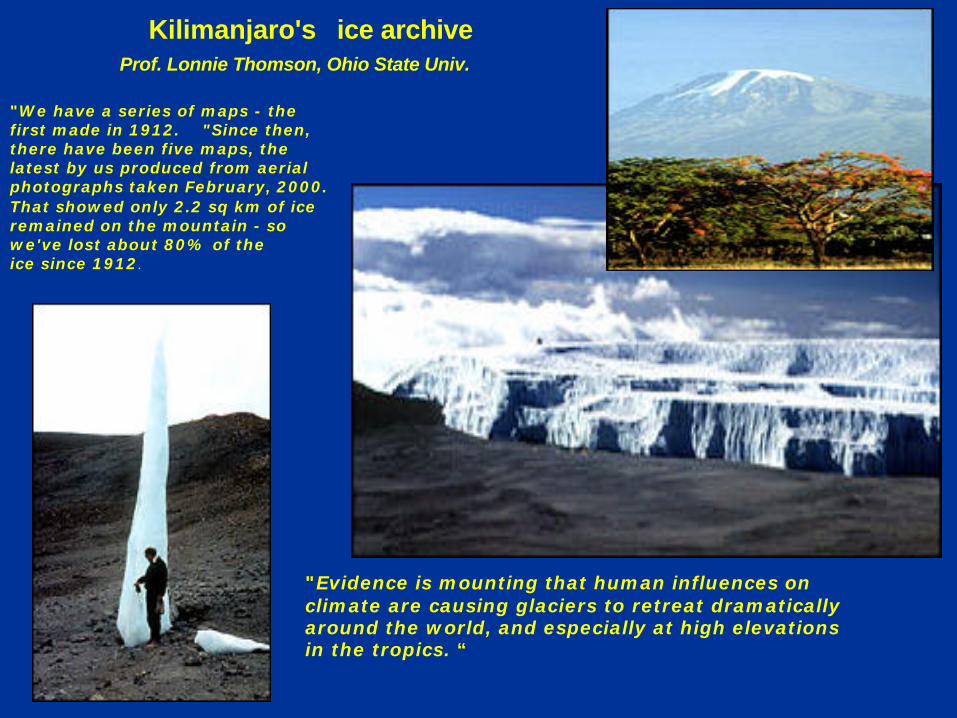
"Evidence is mounting that human influences onclimate are causing glaciers to retreat dramaticallyaround the world, and especially at high elevationsin the tropics. “
"We have a series of maps - thefirst made in 1912. "Since then,there have been five maps, thelatest by us produced from aerialphotographs taken February, 2000.That showed only 2.2 sq km of iceremained on the mountain - sowe've lost about 80% of theice since 1912.
Kilimanjaro's ice archive Prof. Lonnie Thomson, Ohio State Univ.
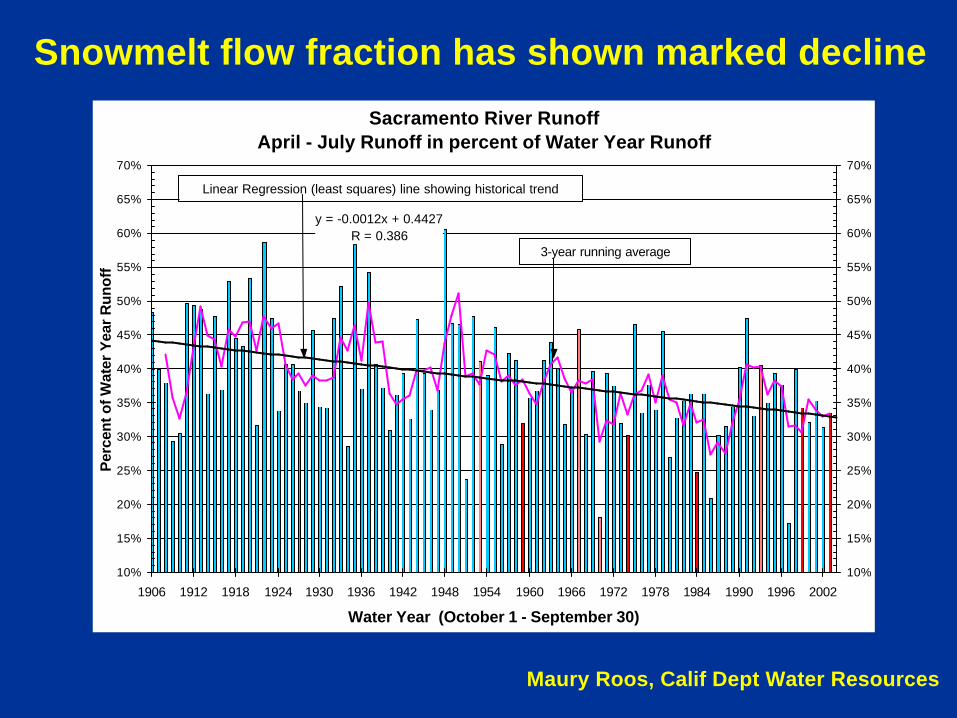
Sacramento River RunoffApril - July Runoff in percent of Water Year Runoff
y = -0.0012x + 0.4427R = 0.386
10%
15%
20%
25%
30%
35%
40%
45%
50%
55%
60%
65%
70%
1906 1912 1918 1924 1930 1936 1942 1948 1954 1960 1966 1972 1978 1984 1990 1996 2002
Water Year (October 1 - September 30)
Per
cent
of W
ater
Yea
r R
unof
f
10%
15%
20%
25%
30%
35%
40%
45%
50%
55%
60%
65%
70%
Linear Regression (least squares) line showing historical trend
3-year running average
Maury Roos, Calif Dept Water Resources
Snowmelt flow fraction has shown marked decline
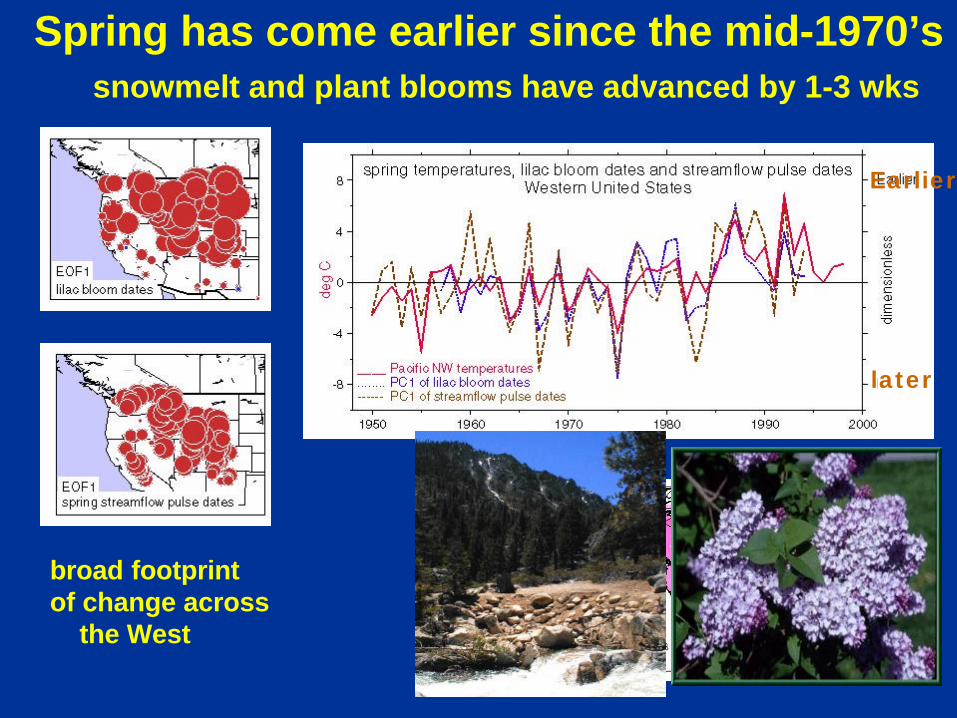
Spring has come earlier since the mid-1970’s snowmelt and plant blooms have advanced by 1-3 wks
Earlier
later
broad footprintof change across the West
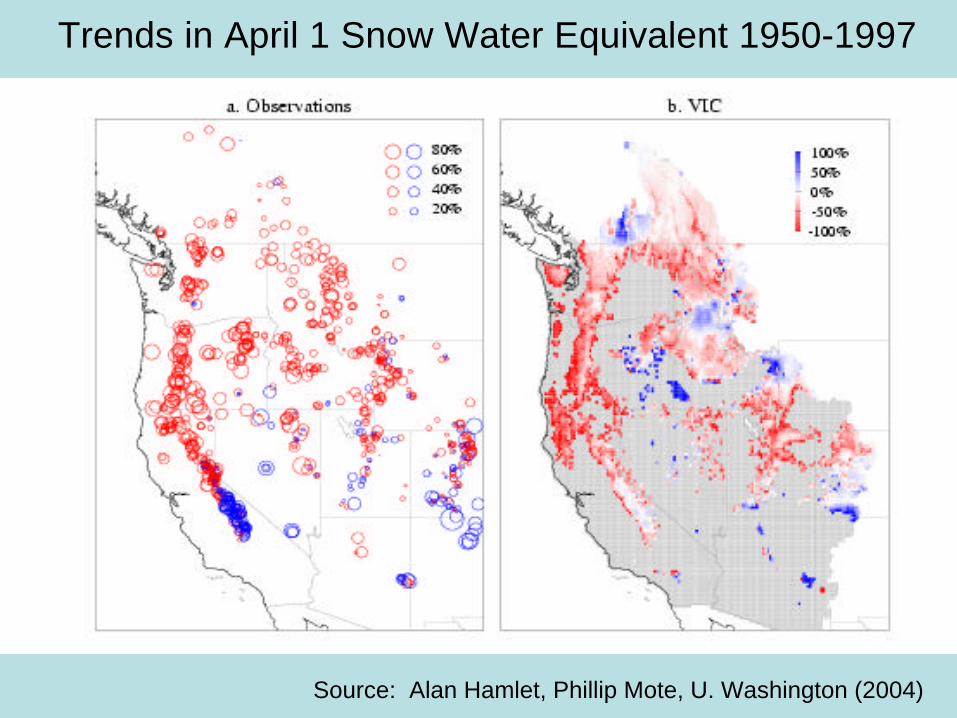
Source: Alan Hamlet, Phillip Mote, U. Washington (2004)
Trends in April 1 Snow Water Equivalent 1950-1997
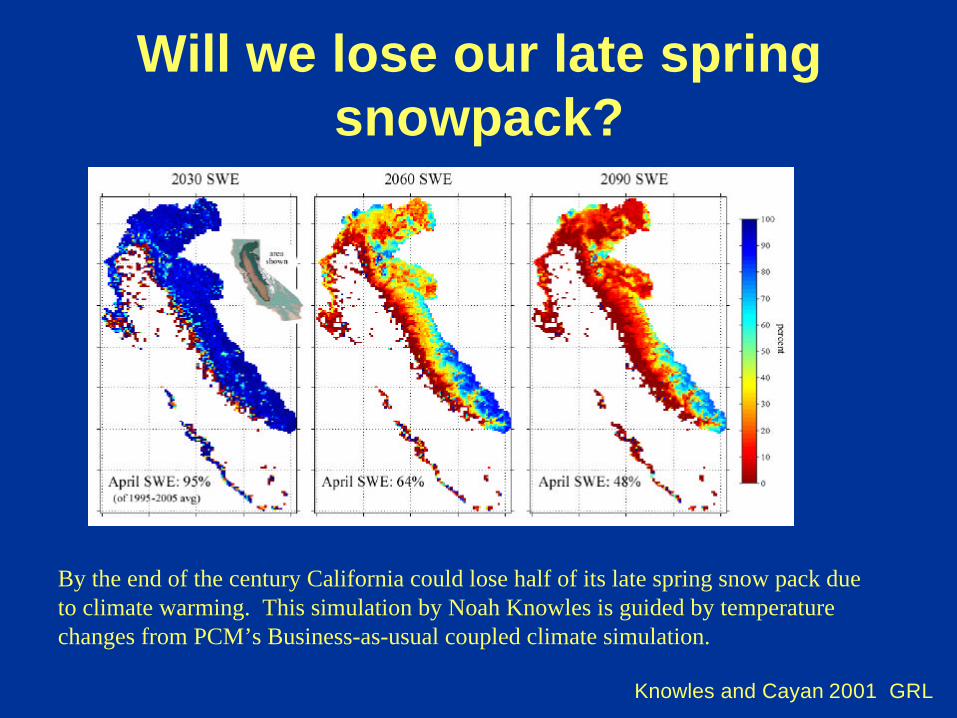
Will we lose our late springsnowpack?
By the end of the century California could lose half of its late spring snow pack dueto climate warming. This simulation by Noah Knowles is guided by temperaturechanges from PCM’s Business-as-usual coupled climate simulation.
Knowles and Cayan 2001 GRL
WHAT ARE OBSERVATIONS AND MODELSWHAT ARE OBSERVATIONS AND MODELSTRYING TO SAY?TRYING TO SAY?
Warming already underway and coming fast.Warming already underway and coming fast.
California temperature projections areCalifornia temperature projections arebroadly in consensus (+3 to +6 or more ºC by 2100),broadly in consensus (+3 to +6 or more ºC by 2100),
enough for earlier flows, more floods & drier summers.enough for earlier flows, more floods & drier summers.
California precipitation projections are a bit moreCalifornia precipitation projections are a bit morescattered, with MOST showing small (drier?) changes butscattered, with MOST showing small (drier?) changes but
with a couple of outliers much wetter.with a couple of outliers much wetter.
Estimated changes would likely have adverse impacts onEstimated changes would likely have adverse impacts onCalifornia resources, such as water, ecosystems,California resources, such as water, ecosystems,
coastlines, and human health.coastlines, and human health.
Careful Careful monitoringmonitoring and modeling crucially needed. and modeling crucially needed.