Embed Size (px)
Citation preview

http://www.cvphysiology.com/Arrhythmias/A009.htm
Electrocardiography-ECG/EKG
Is a transthoracic interpretation of the electrical activity of the heart over time captured and externally recorded by skin electrodes. It is a noninvasive recording produced by an electrocardiographic device
Electrocardiography: Introduction • Body fluids are good conductors (the body is a volume conductor) Fluctuations in potential (action potentials of myocardial fibers) can be recorded extracellularly with surface electrodesplaced on the skin
• The record of these potential fluctuations during the cardiac cycle is the electrocardiogram (ECG).
• The ECG provides information on: -
- Heart rate and rhythm - The pattern of electrical activation of the atria and ventricles - The approximate mass of tissue being activated - Possible damage of the heart muscle - Possible changes in the body’s electrolyte composition
Electrocardiography:
-ECG is a complex recording representing the overall spread of activity throughout the heart during depolarization and repolarization.
- The recording represents comparisons in voltage detected by electrodes at two different points on body surface, not the actual potential.
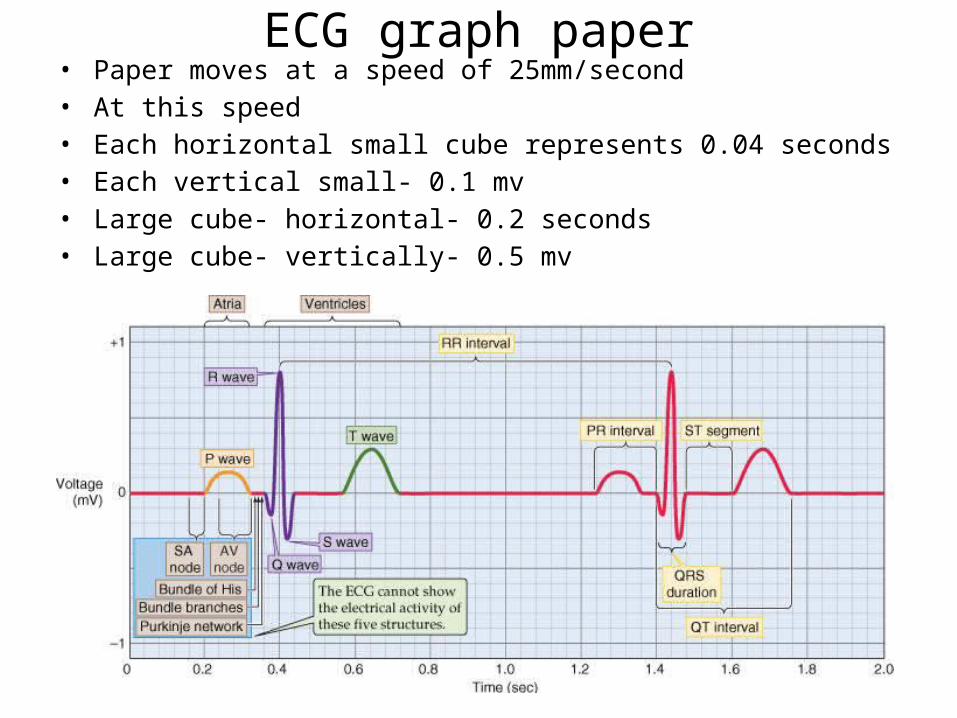
ECG graph paper• Paper moves at a speed of 25mm/second• At this speed• Each horizontal small cube represents 0.04 seconds• Each vertical small- 0.1 mv• Large cube- horizontal- 0.2 seconds• Large cube- vertically- 0.5 mv
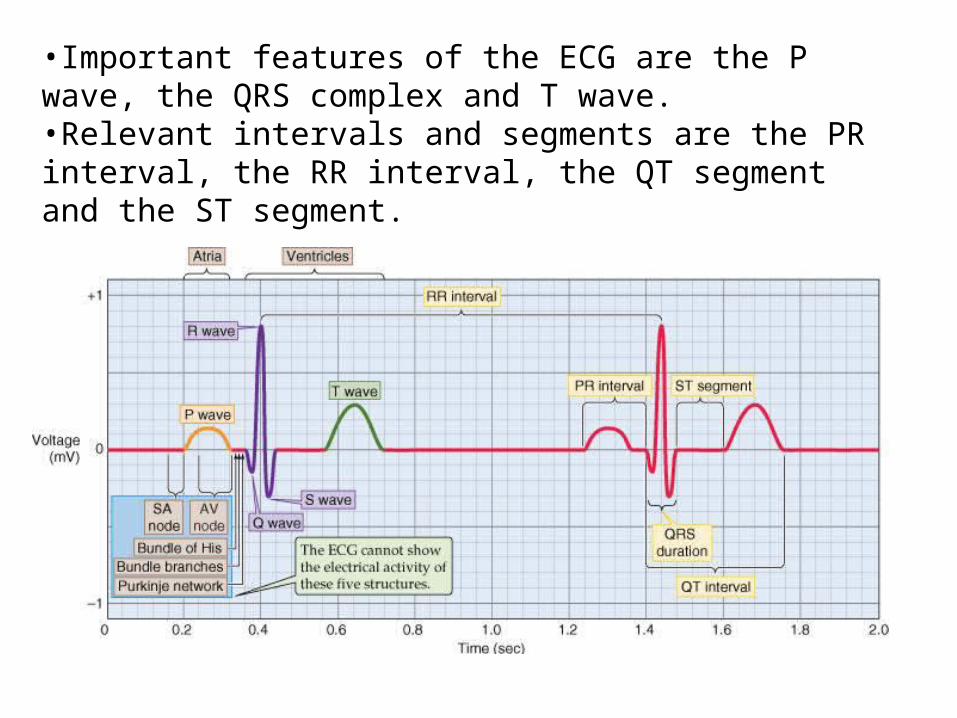
•Important features of the ECG are the P wave, the QRS complex and T wave.•Relevant intervals and segments are the PR interval, the RR interval, the QT segment and the ST segment.
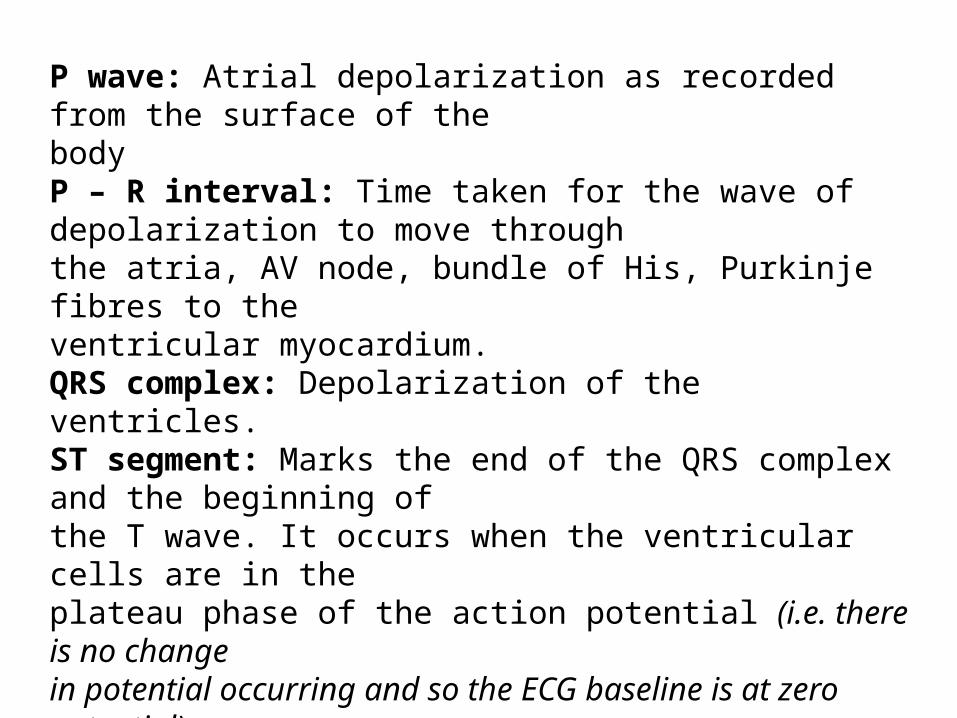
P wave: Atrial depolarization as recorded from the surface of thebodyP – R interval: Time taken for the wave of depolarization to move throughthe atria, AV node, bundle of His, Purkinje fibres to theventricular myocardium.QRS complex: Depolarization of the ventricles.ST segment: Marks the end of the QRS complex and the beginning ofthe T wave. It occurs when the ventricular cells are in theplateau phase of the action potential (i.e. there is no changein potential occurring and so the ECG baseline is at zeropotential)T wave: Repolarization of the ventricles (due to potential changesoccurring during phase 3 of the cardiac action potential)Q – T interval: Period during which ventricular systole occursR – R interval: This time is usually used to calculate the heart rate.
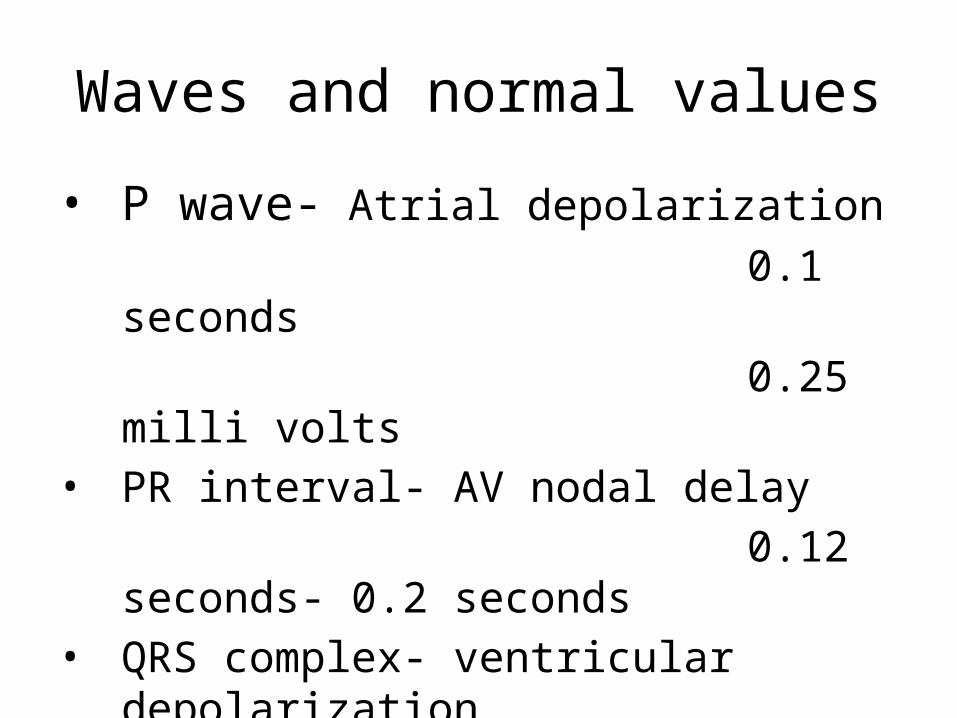
Waves and normal values
• P wave- Atrial depolarization 0.1 seconds 0.25 milli volts• PR interval- AV nodal delay 0.12 seconds- 0.2 seconds• QRS complex- ventricular depolarization 0.1-0.11 seconds
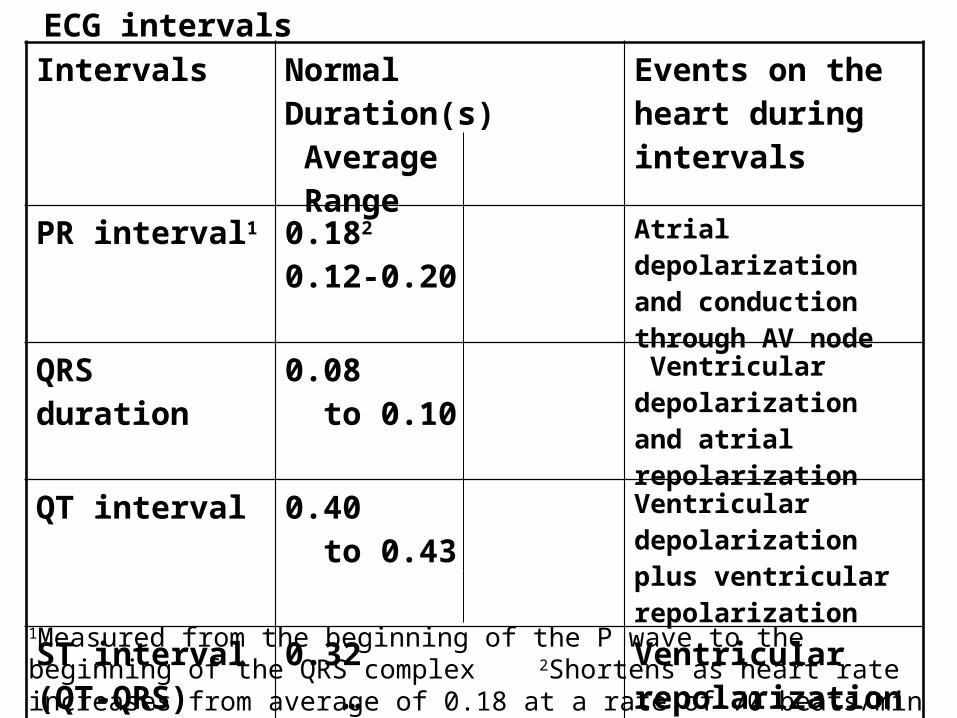
ECG intervalsIntervals Normal Duration(s)
Average RangeEvents on the heart during intervals
PR interval1 0.182 0.12-0.20 Atrial depolarization and conduction through AV node
QRS duration 0.08 to 0.10 Ventricular depolarization and atrial repolarization
QT interval 0.40 to 0.43 Ventricular depolarization plus ventricular repolarization
ST interval (QT-QRS)
0.32 … Ventricular repolarization
1Measured from the beginning of the P wave to the beginning of the QRS complex 2Shortens as heart rate increases from average of 0.18 at a rate of 70 beats/min to 0.14 at a rate of 130 beats/min
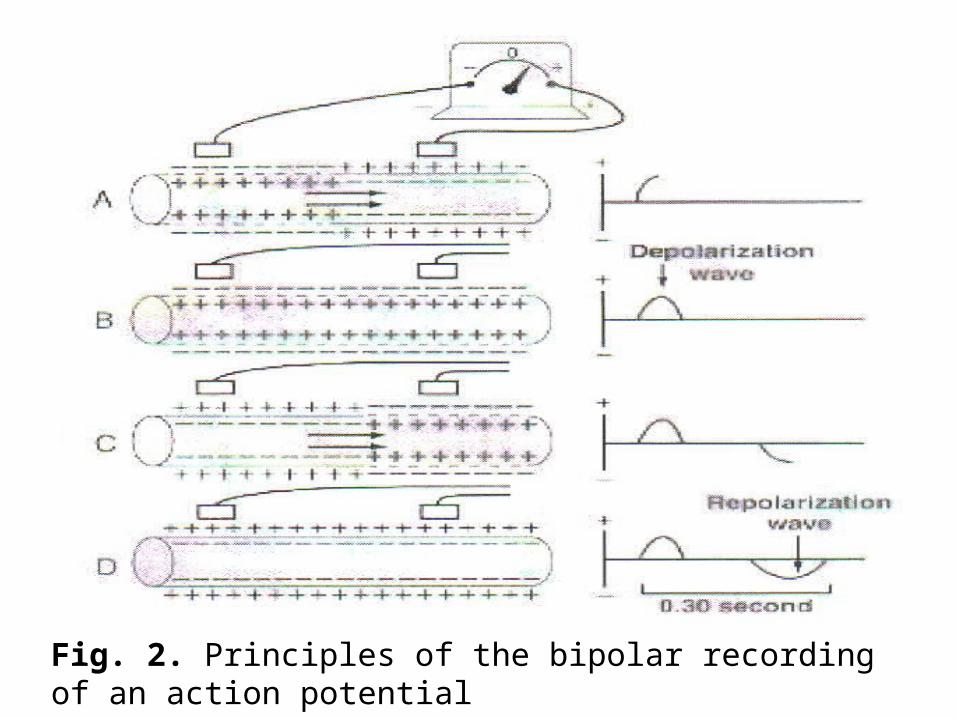
Fig. 2. Principles of the bipolar recording of an action potential
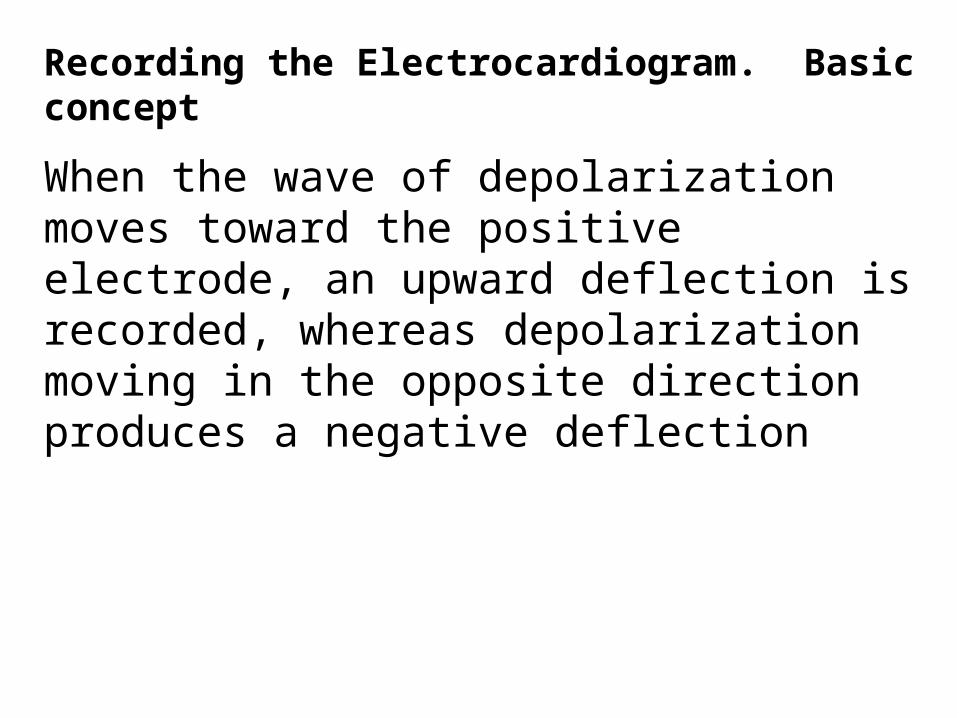
Recording the Electrocardiogram. Basic concept
When the wave of depolarization moves toward the positive electrode, an upward deflection is recorded, whereas depolarization moving in the opposite direction produces a negative deflection
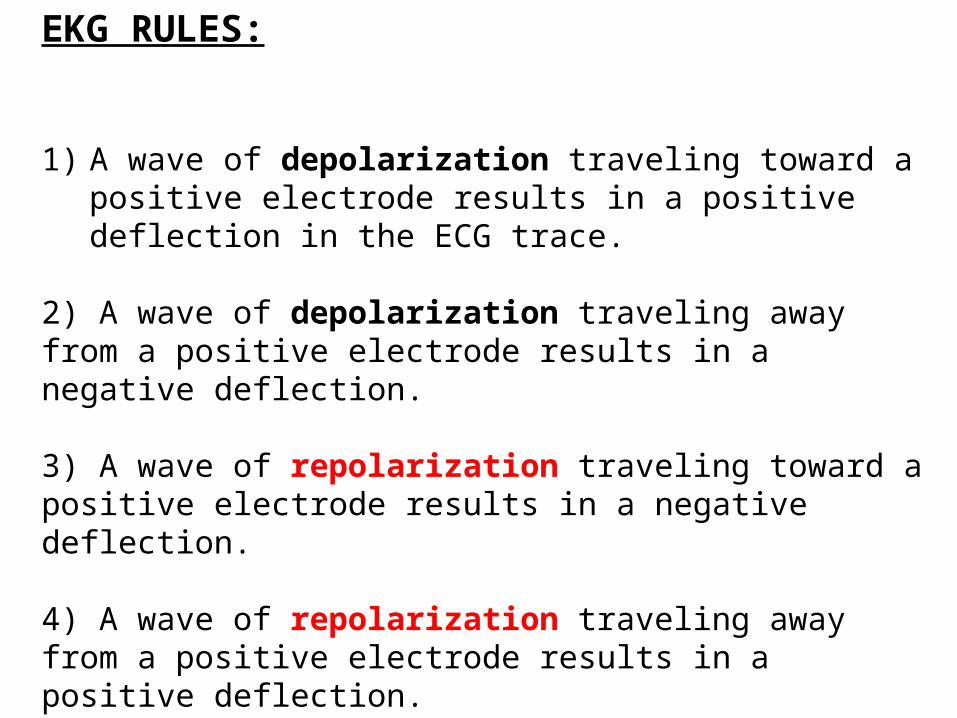
EKG RULES:
1) A wave of depolarization traveling toward a positive electrode results in a positive deflection in the ECG trace.
2) A wave of depolarization traveling away from a positive electrode results in a negative deflection.
3) A wave of repolarization traveling toward a positive electrode results in a negative deflection.
4) A wave of repolarization traveling away from a positive electrode results in a positive deflection.
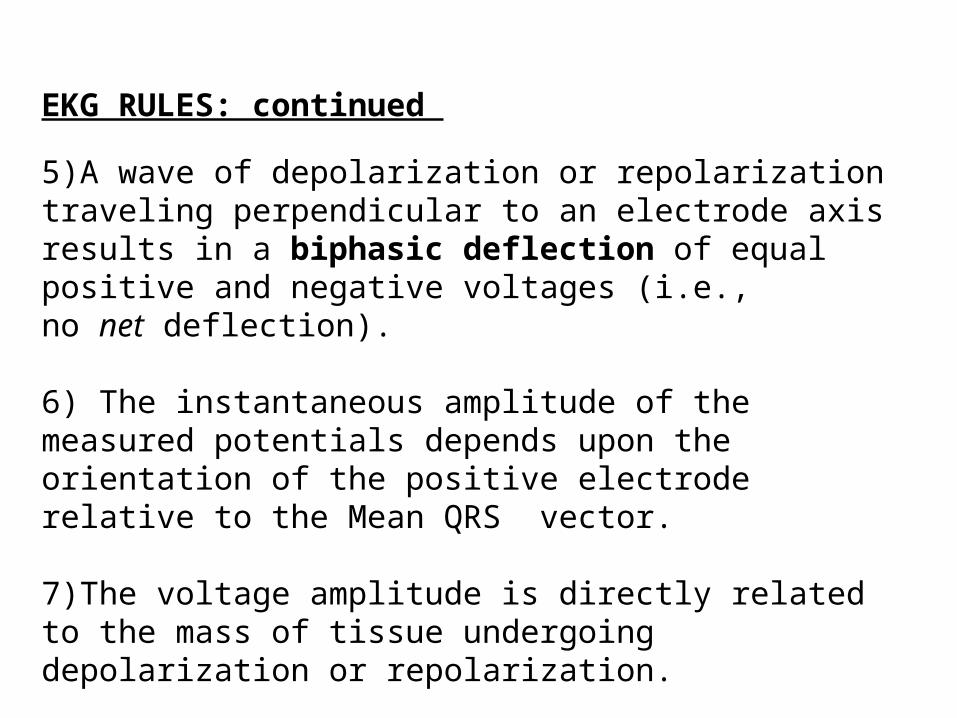
EKG RULES: continued
5)A wave of depolarization or repolarization traveling perpendicular to an electrode axis results in a biphasic deflection of equal positive and negative voltages (i.e., no net deflection).
6) The instantaneous amplitude of the measured potentials depends upon the orientation of the positive electrode relative to the Mean QRS vector.
7)The voltage amplitude is directly related to the mass of tissue undergoing depolarization or repolarization.
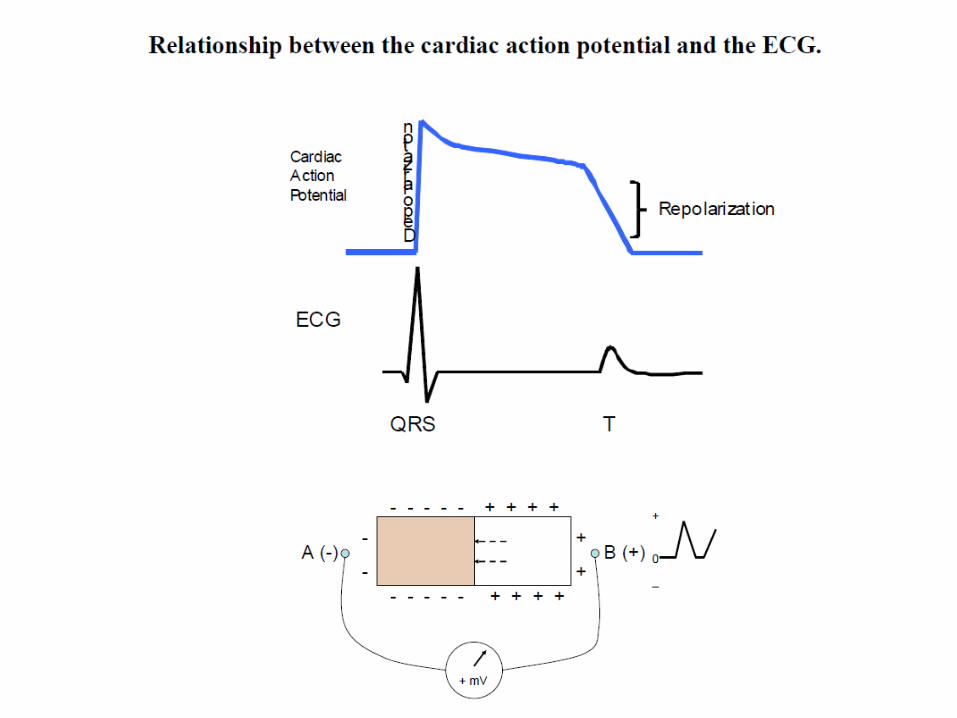
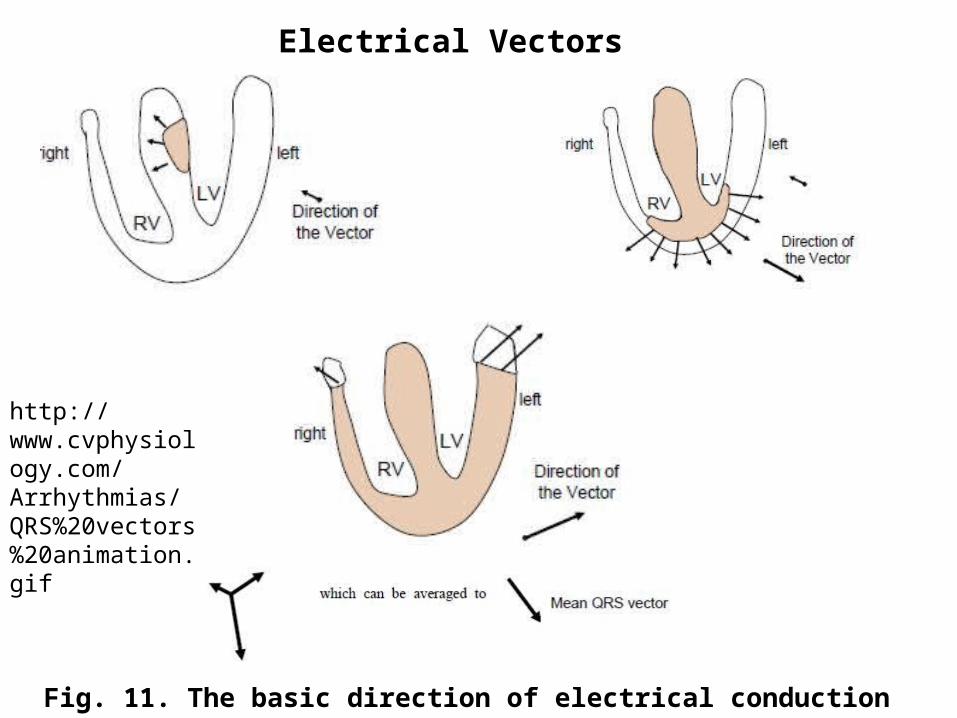
Fig. 11. The basic direction of electrical conduction through the heart
Electrical Vectors
http://www.cvphysiology.com/Arrhythmias/QRS%20vectors%20animation.gif
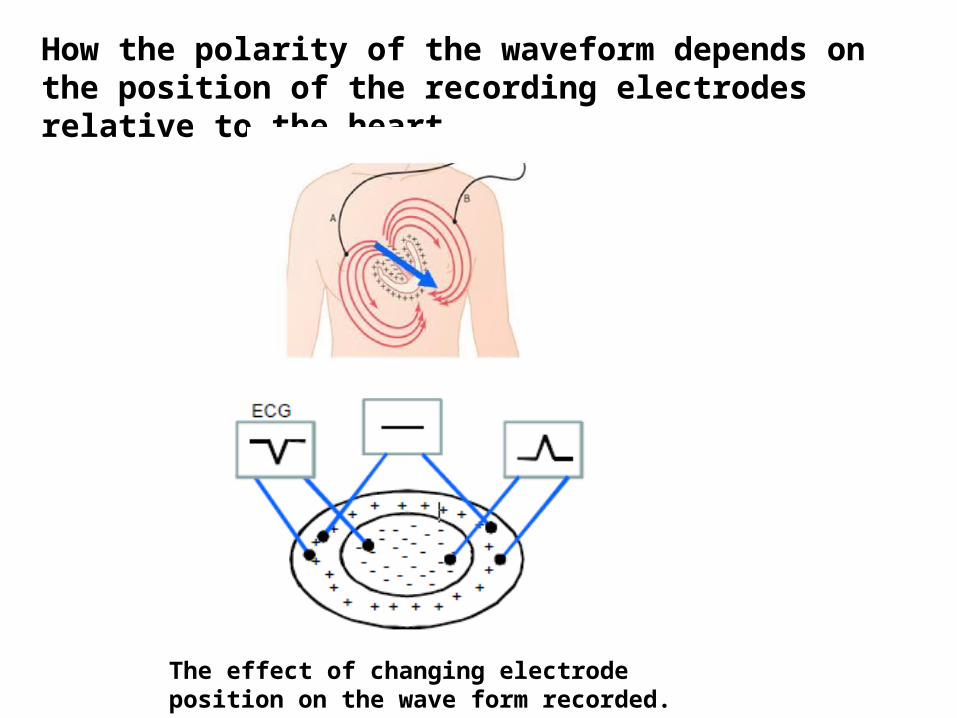
How the polarity of the waveform depends on the position of the recording electrodes relative to the heart.
The effect of changing electrode position on the wave form recorded.
EKG Leads
Leads are electrodes which measure the difference in electrical potential between either:
1. Two different points on the body (bipolar leads)
2. One point on the body and a virtual reference point with zero electrical potential, located in the center of the heart (unipolar leads)
EKG Leads
The standard EKG has 12 leads: 3 Standard Bipolar Limb Leads
3 Augmented Unipolar Limb Leads
6 Precordial Leads
The axis of a particular lead represents the viewpoint from which it looks at the heart.
https://www.youtube.com/watch?v=u53UAr19xcM
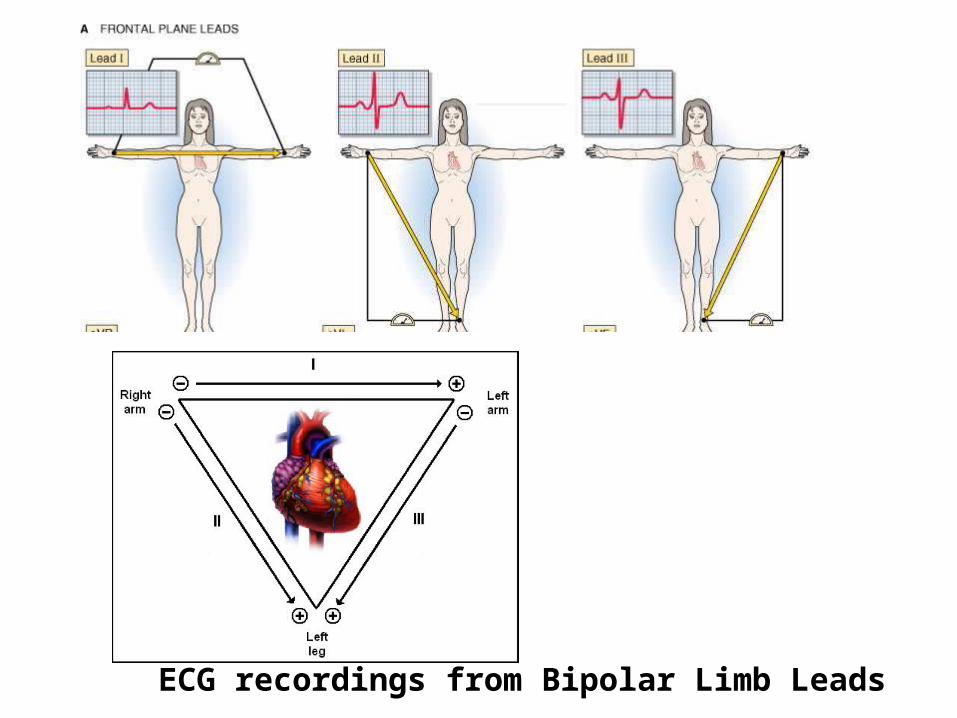
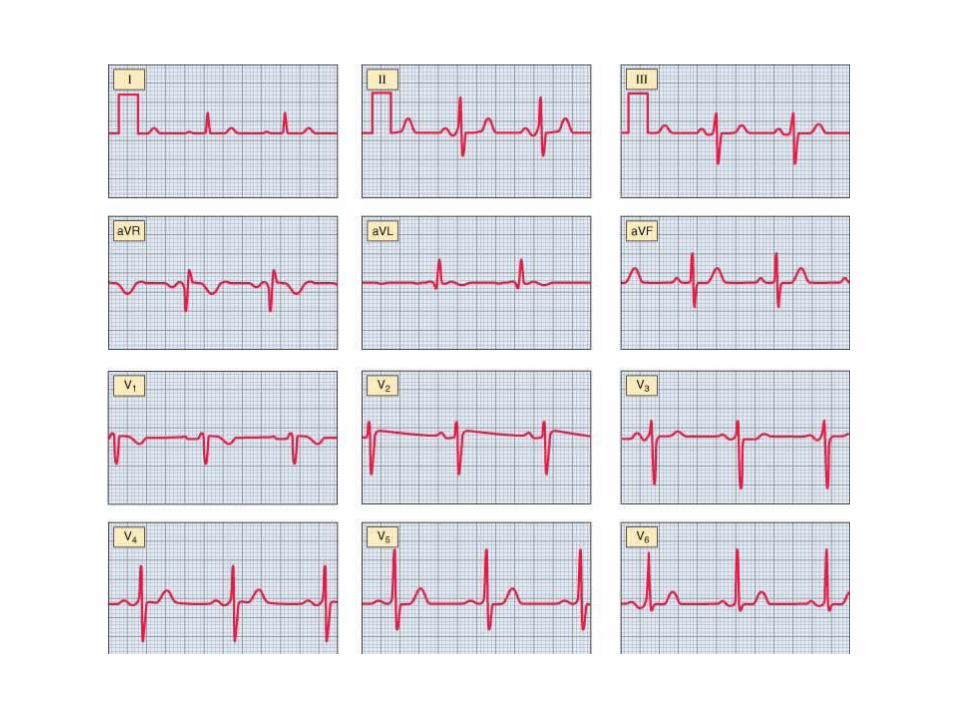
ECG recordings from Bipolar Limb Leads

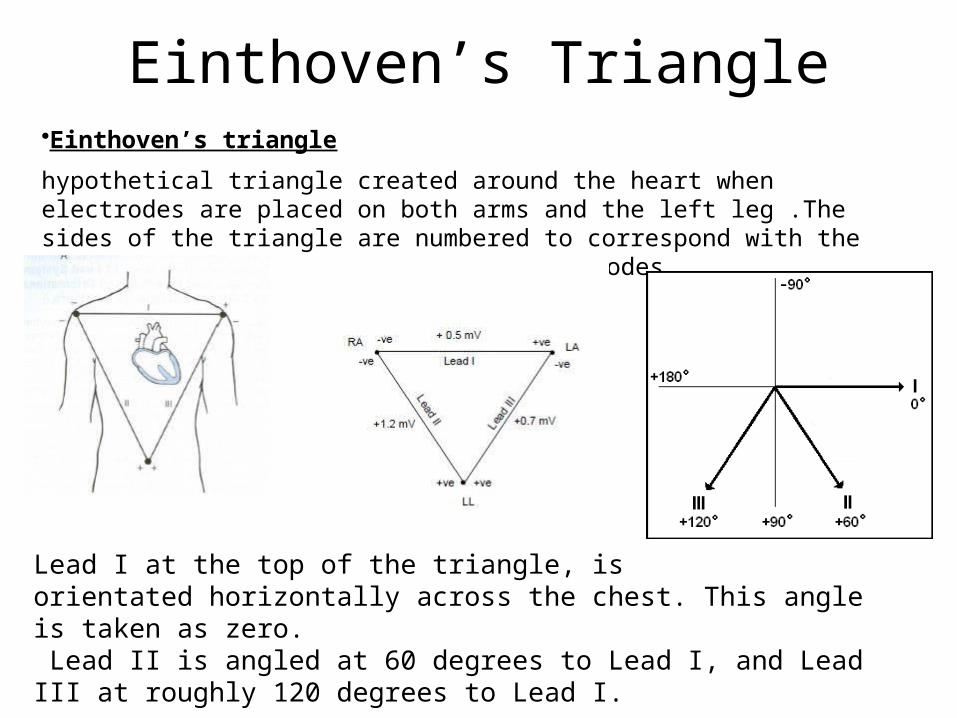
Einthoven’s Triangle•Einthoven’s triangle
hypothetical triangle created around the heart when electrodes are placed on both arms and the left leg .The sides of the triangle are numbered to correspond with the three leads ("leeds"), or pairs of electrodes.
Lead I at the top of the triangle, isorientated horizontally across the chest. This angle is taken as zero. Lead II is angled at 60 degrees to Lead I, and Lead III at roughly 120 degrees to Lead I.
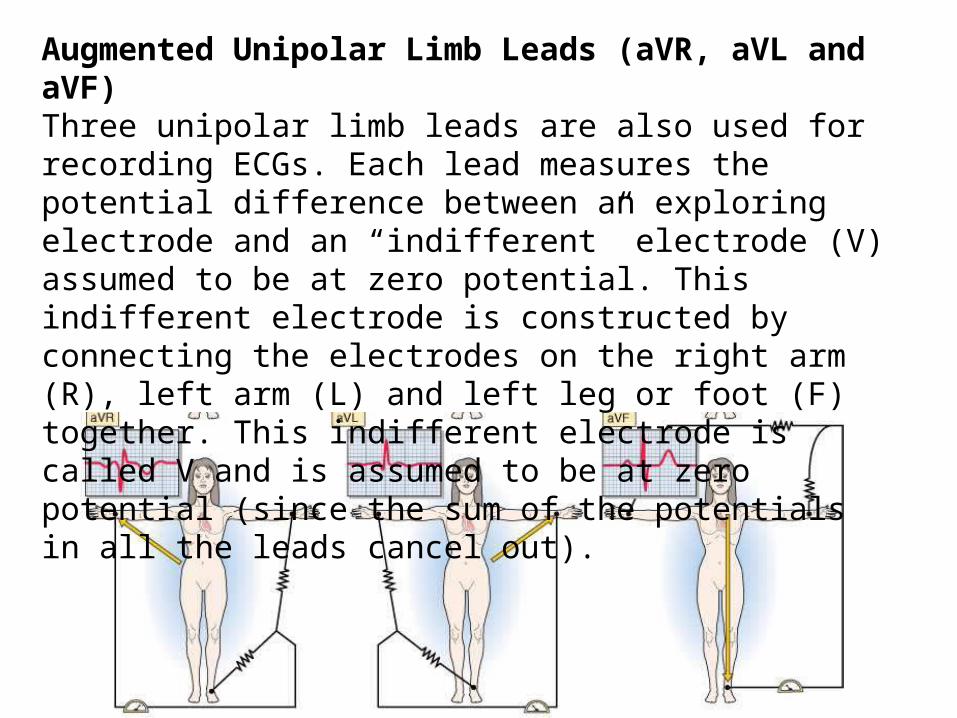
Augmented Unipolar Limb Leads (aVR, aVL and aVF)Three unipolar limb leads are also used for recording ECGs. Each lead measures the potential difference between an exploring electrode and an “indifferent” electrode (V) assumed to be at zero potential. This indifferent electrode is constructed by connecting the electrodes on the right arm (R), left arm (L) and left leg or foot (F) together. This indifferent electrode is called V and is assumed to be at zero potential (since the sum of the potentials in all the leads cancel out).
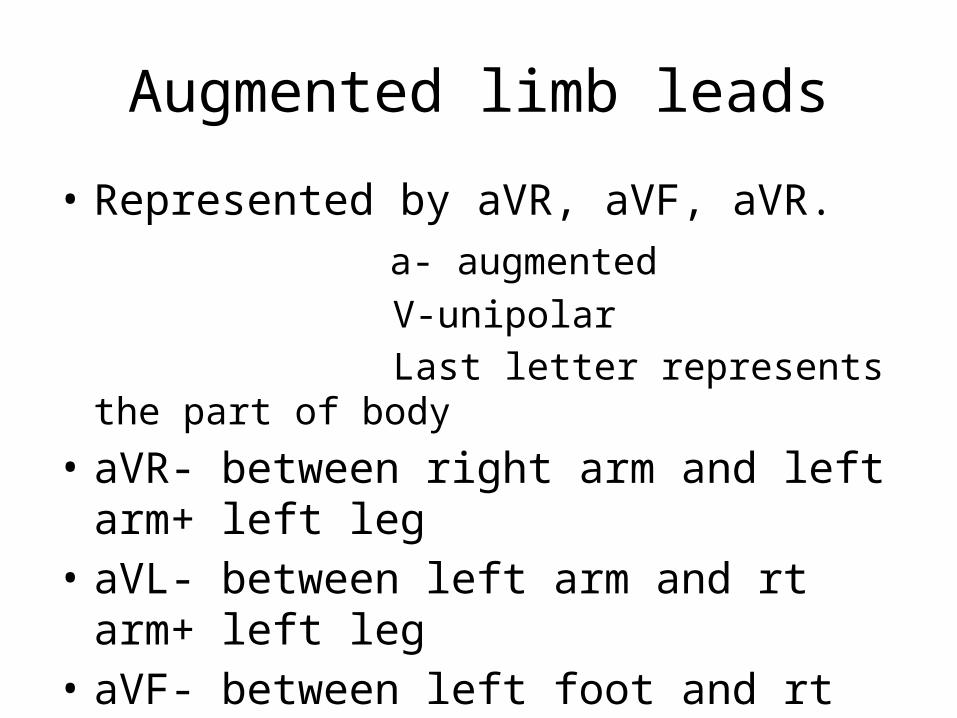
Augmented limb leads
• Represented by aVR, aVF, aVR. a- augmented V-unipolar Last letter represents the part of body• aVR- between right arm and left arm+ left leg• aVL- between left arm and rt arm+ left leg• aVF- between left foot and rt arm+ lt arm
Precordial Leads
Adapted from: www.numed.co.uk/electrodepl.html
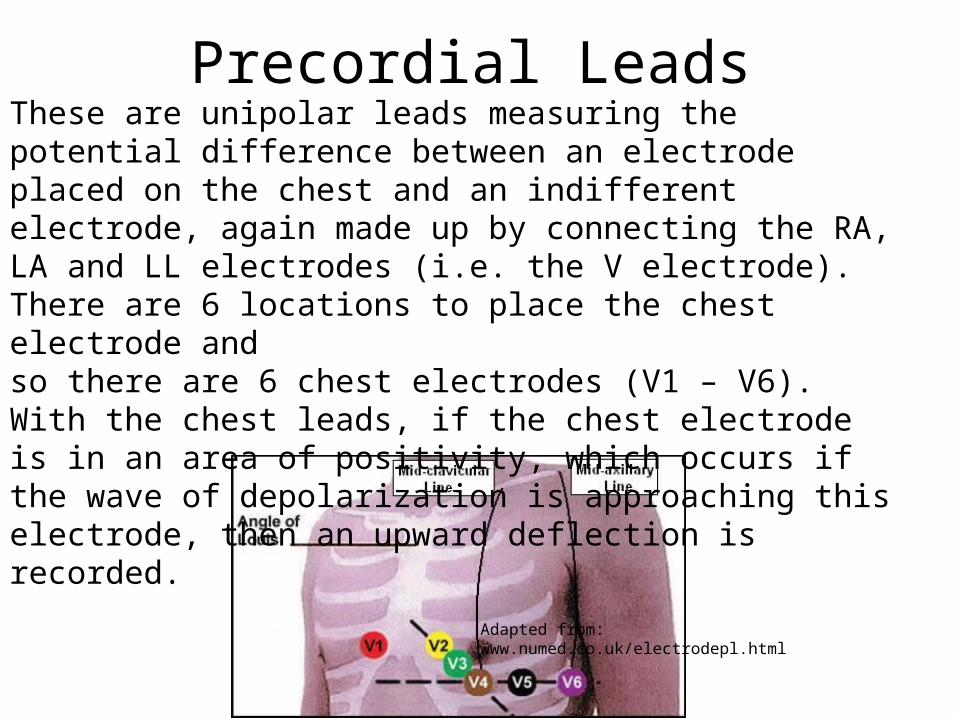
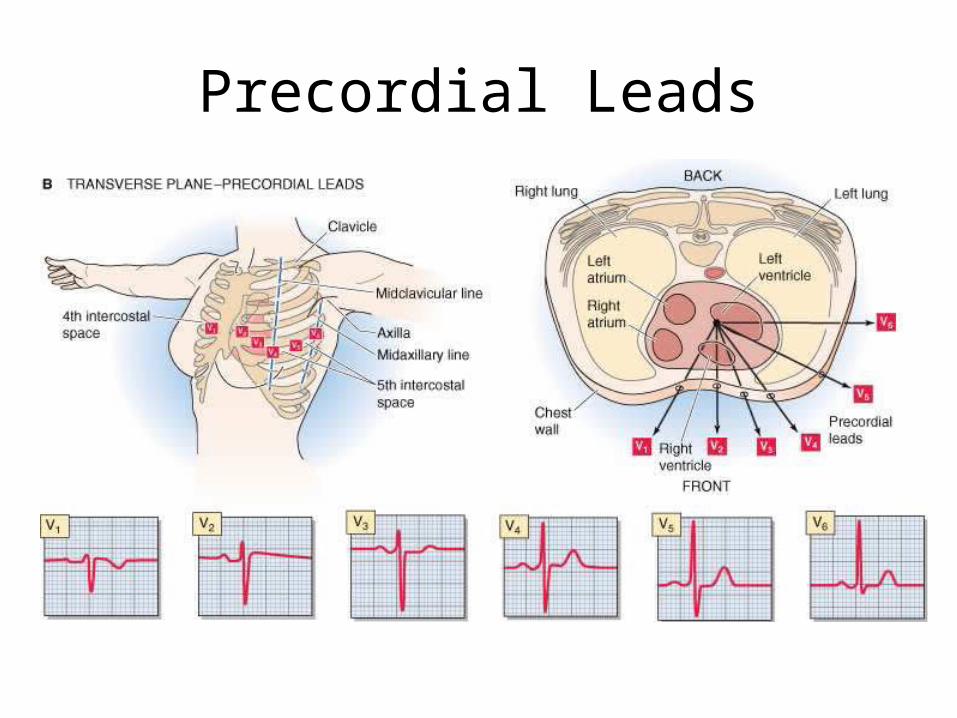
These are unipolar leads measuring the potential difference between an electrode placed on the chest and an indifferent electrode, again made up by connecting the RA, LA and LL electrodes (i.e. the V electrode). There are 6 locations to place the chest electrode andso there are 6 chest electrodes (V1 – V6).With the chest leads, if the chest electrode is in an area of positivity, which occurs if the wave of depolarization is approaching this electrode, then an upward deflection is recorded.
Precordial Leads
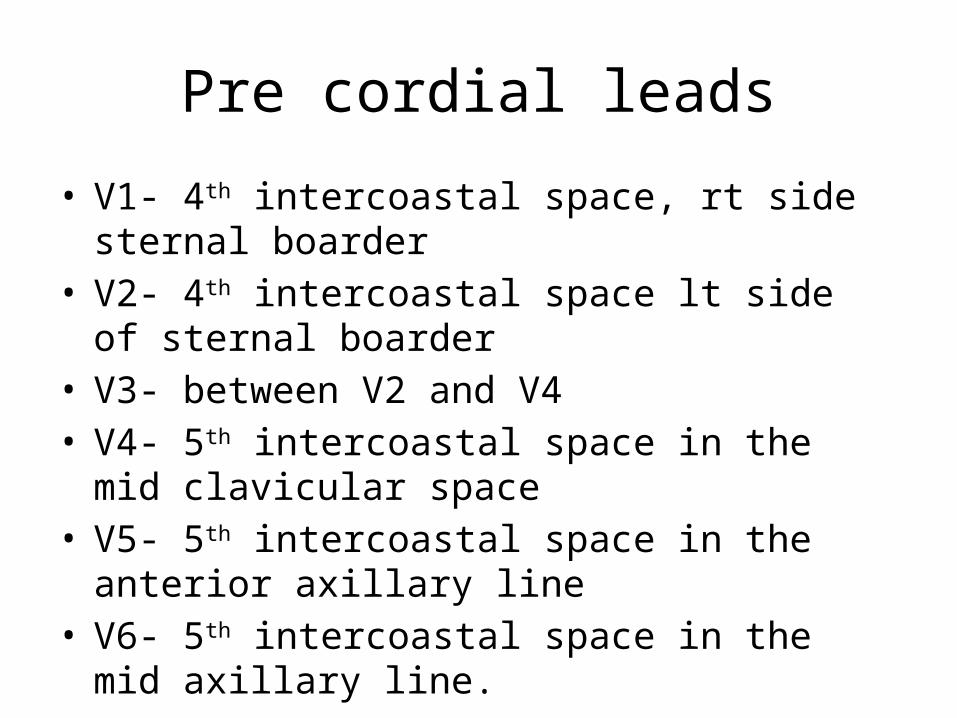
Pre cordial leads
• V1- 4th intercoastal space, rt side sternal boarder• V2- 4th intercoastal space lt side of sternal boarder• V3- between V2 and V4• V4- 5th intercoastal space in the mid clavicular space• V5- 5th intercoastal space in the anterior axillary line• V6- 5th intercoastal space in the mid axillary line.
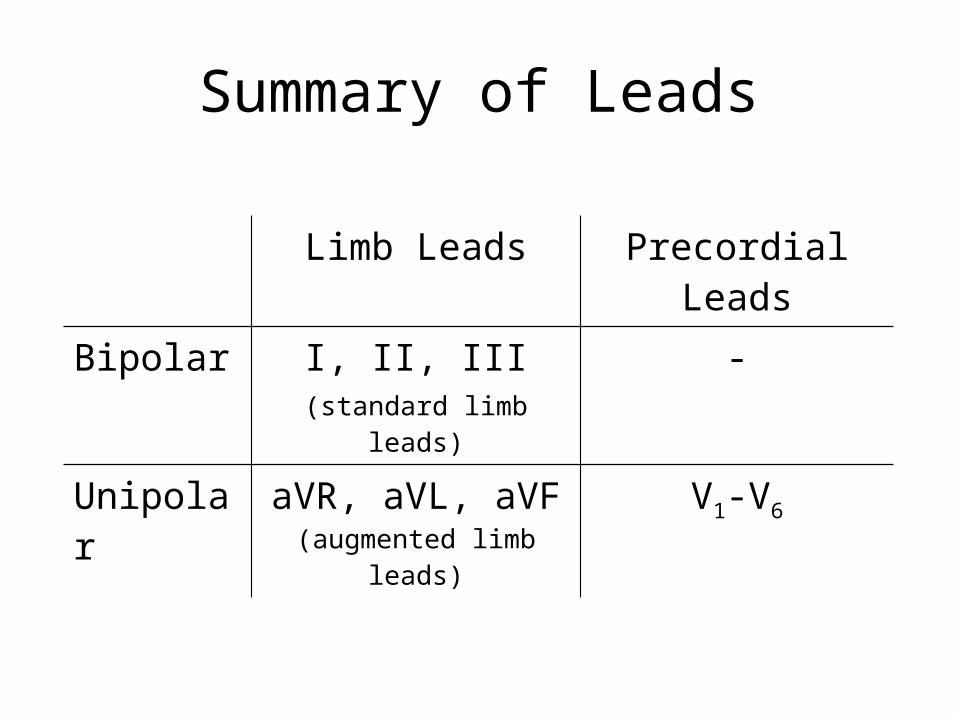
Summary of Leads
Limb Leads Precordial Leads
Bipolar I, II, III(standard limb leads)
-
Unipolar aVR, aVL, aVF (augmented limb leads)
V1-V6
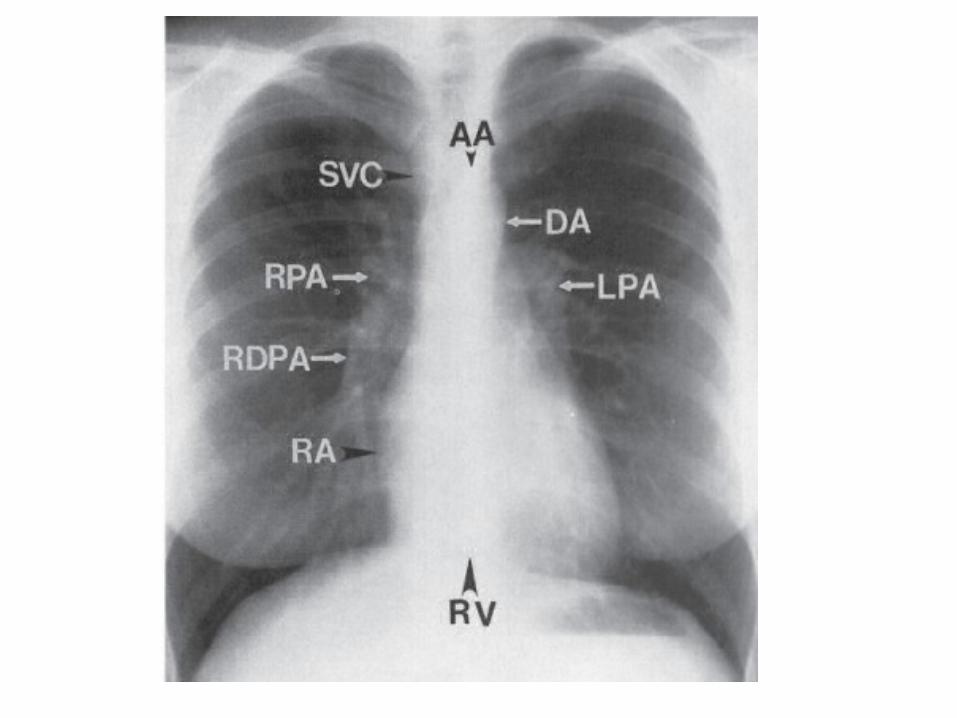
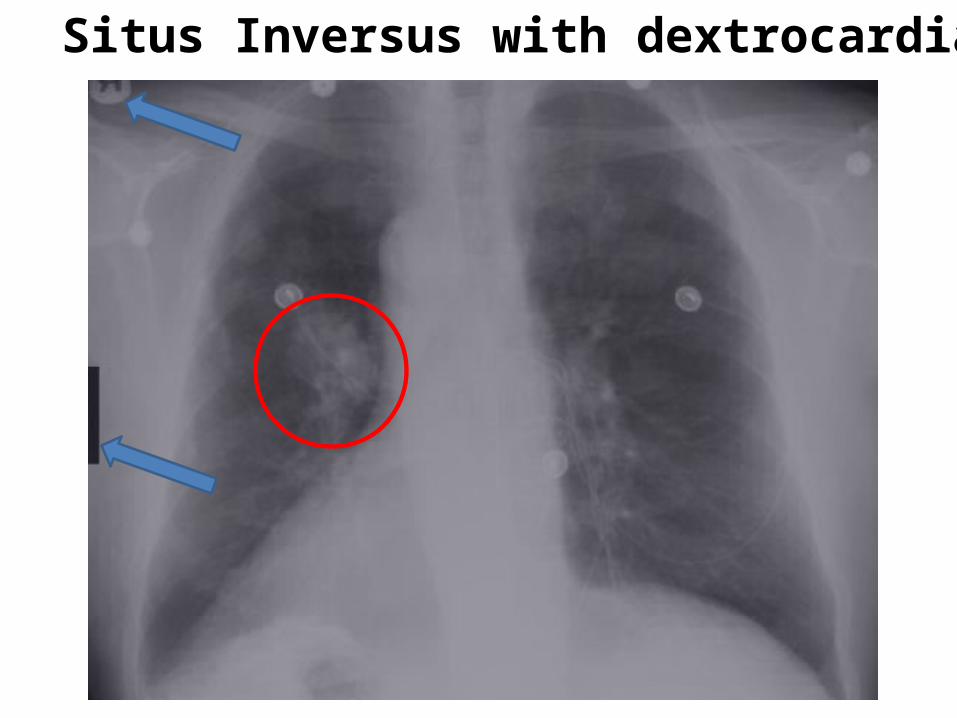
Situs Inversus with dextrocardia
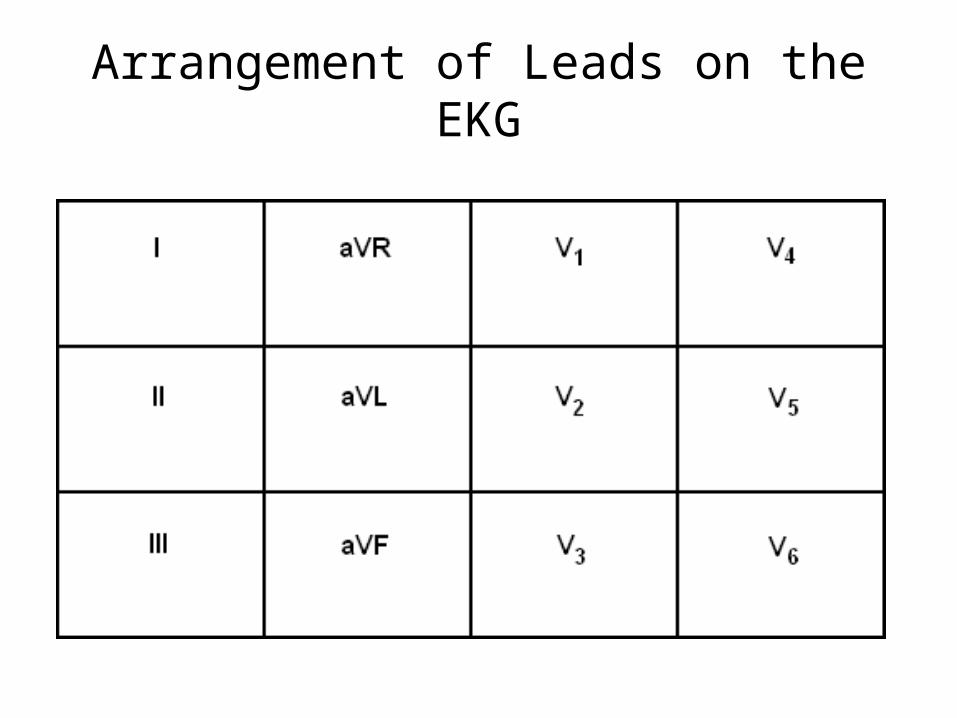
Arrangement of Leads on the EKG
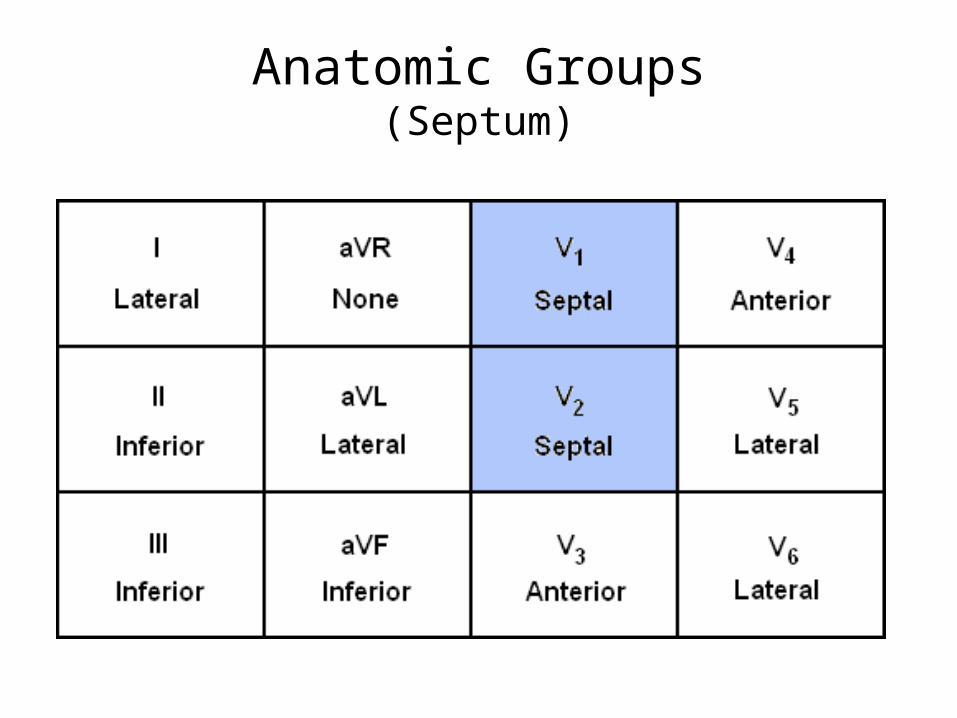
Anatomic Groups(Septum)
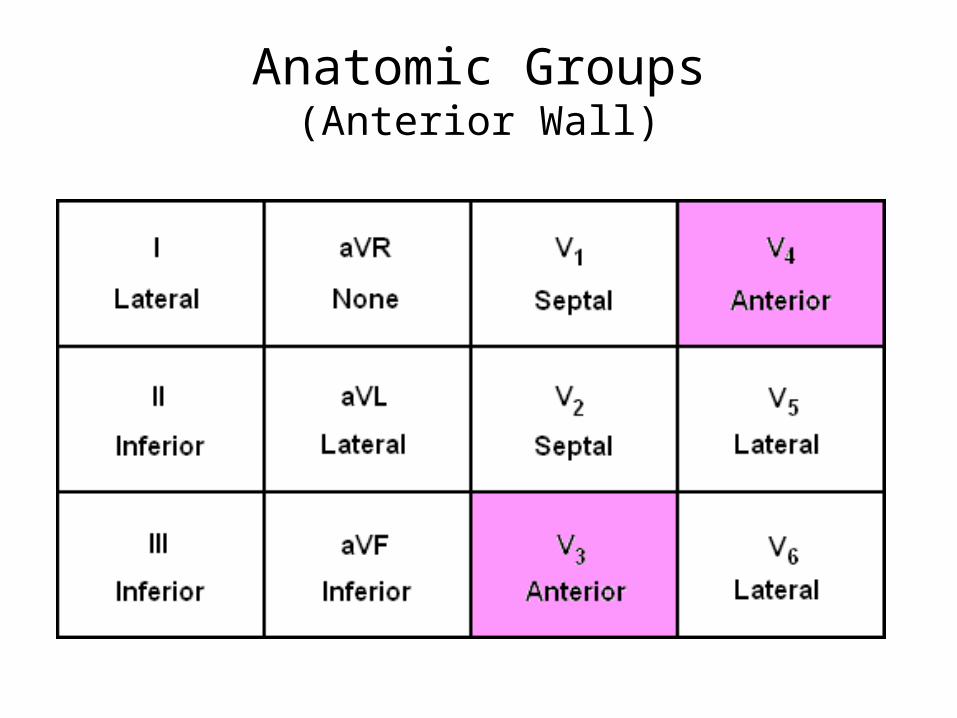
Anatomic Groups(Anterior Wall)
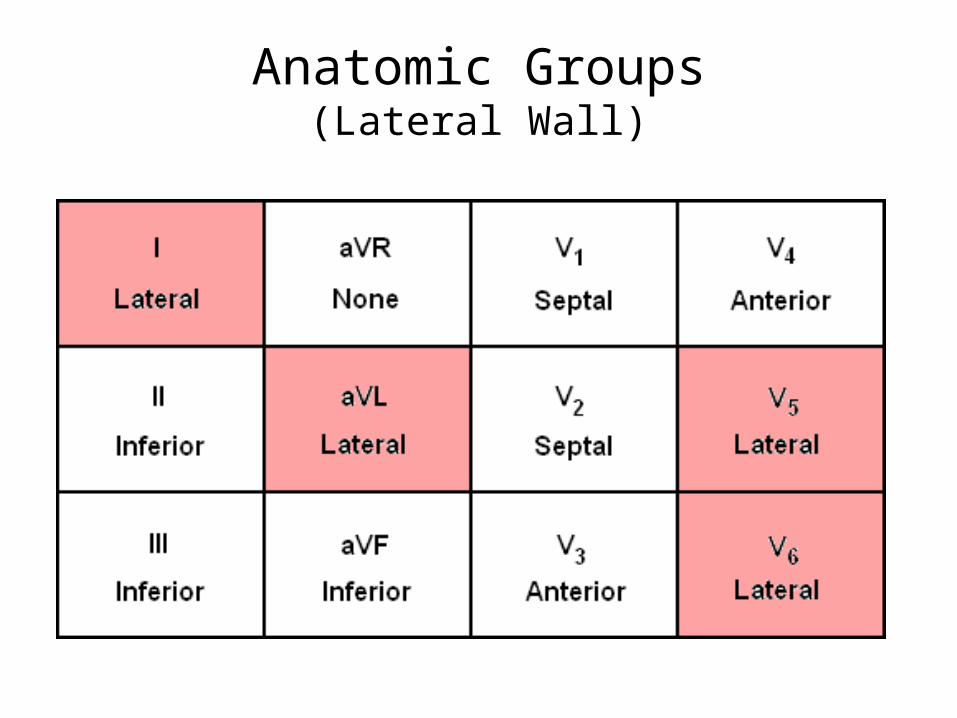
Anatomic Groups(Lateral Wall)
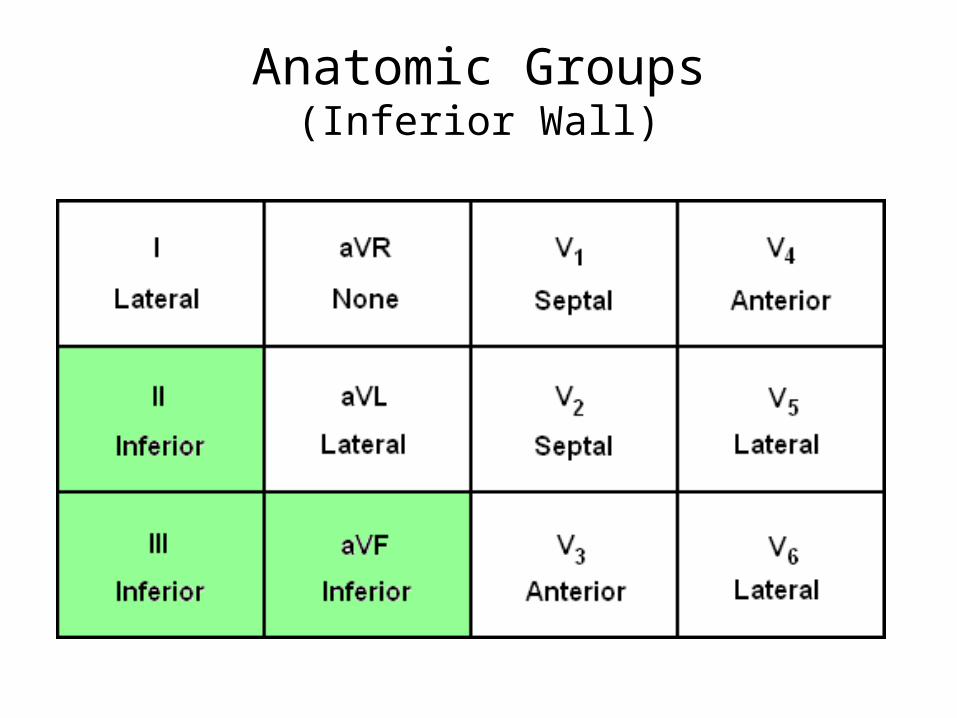
Anatomic Groups(Inferior Wall)
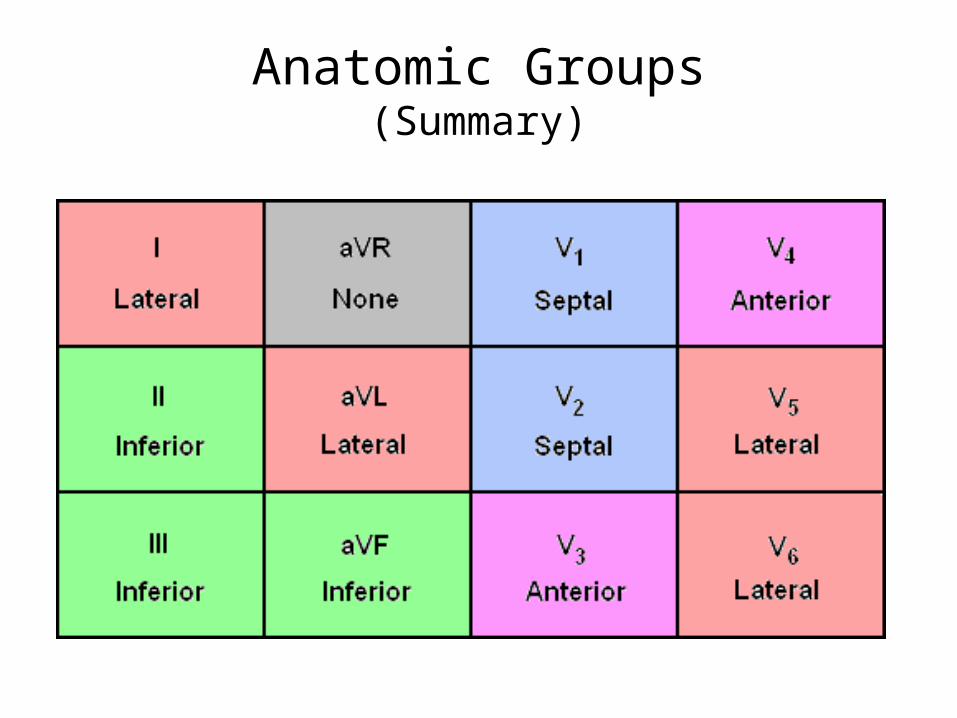
Anatomic Groups(Summary)
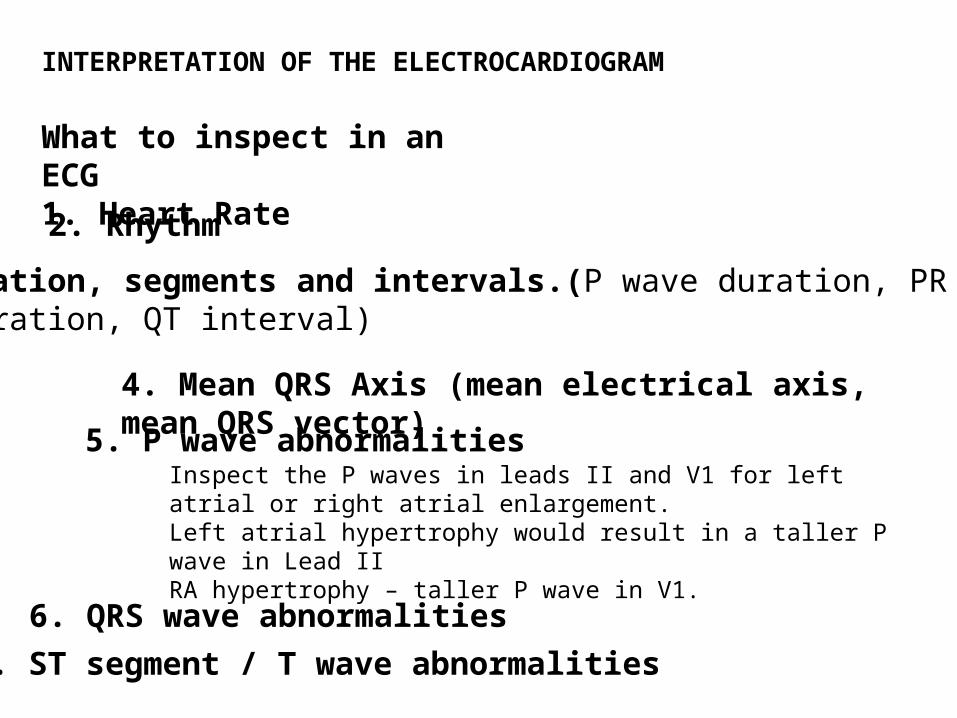
INTERPRETATION OF THE ELECTROCARDIOGRAM
What to inspect in an ECG1. Heart Rate
2. Rhythm
3. Duration, segments and intervals.(P wave duration, PR interval,QRS duration, QT interval)
4. Mean QRS Axis (mean electrical axis, mean QRS vector)
5. P wave abnormalities
6. QRS wave abnormalities7. ST segment / T wave abnormalities
Inspect the P waves in leads II and V1 for left atrial or right atrial enlargement.Left atrial hypertrophy would result in a taller P wave in Lead IIRA hypertrophy – taller P wave in V1.
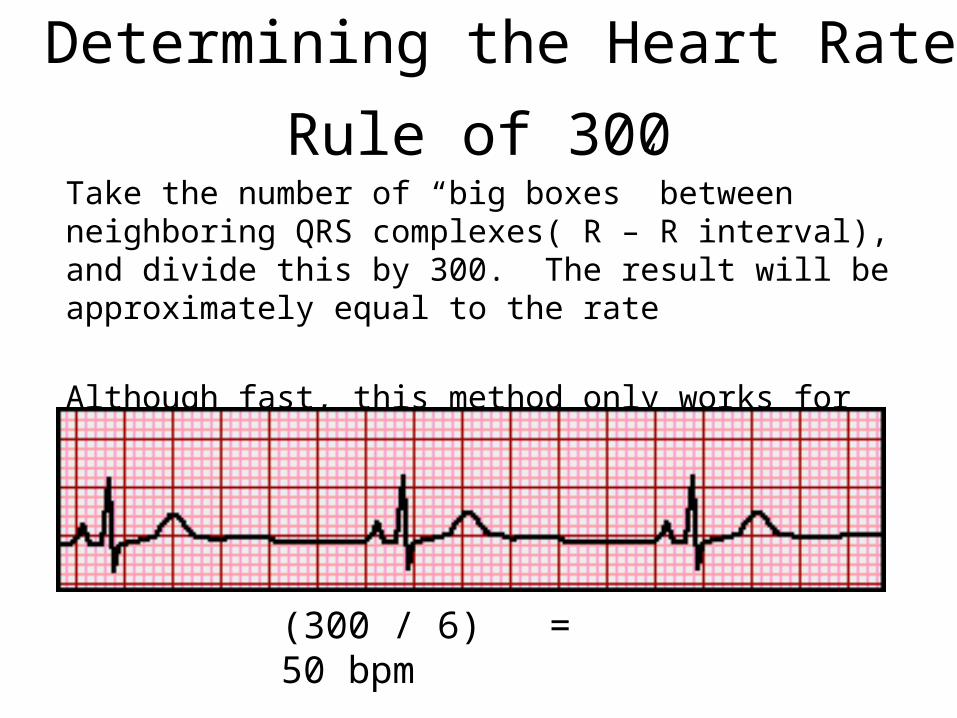
Rule of 300Take the number of “big boxes” between neighboring QRS complexes( R – R interval), and divide this by 300. The result will be approximately equal to the rate
Although fast, this method only works for regular rhythms.
Determining the Heart Rate
(300 / 6) = 50 bpm
(1500/30) = 50 bpm
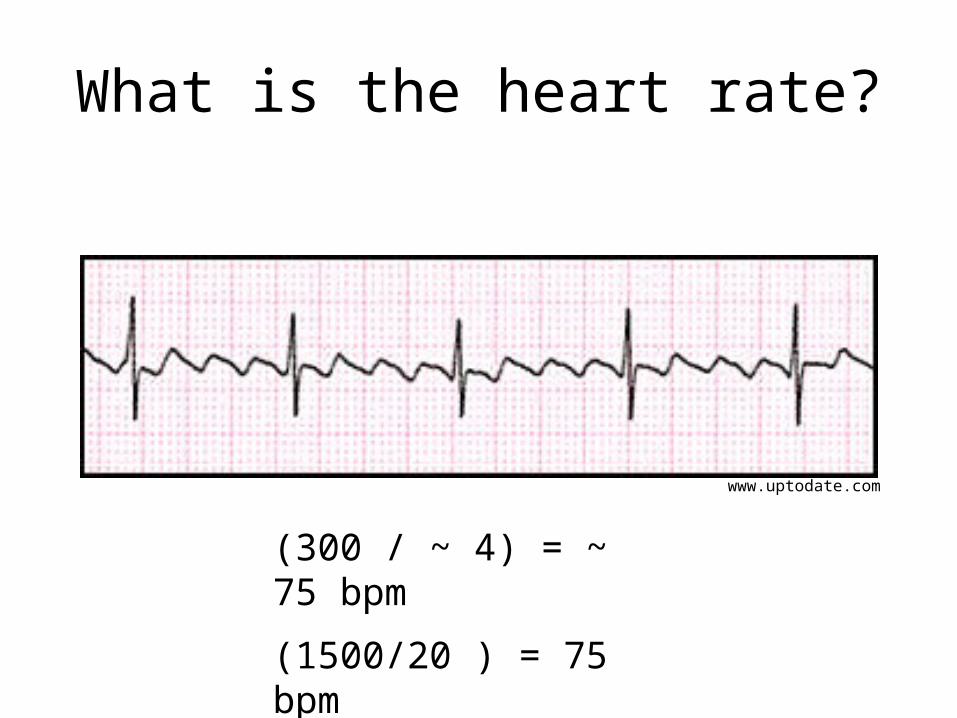
What is the heart rate?
(300 / ~ 4) = ~ 75 bpm
(1500/20 ) = 75 bpm
www.uptodate.com
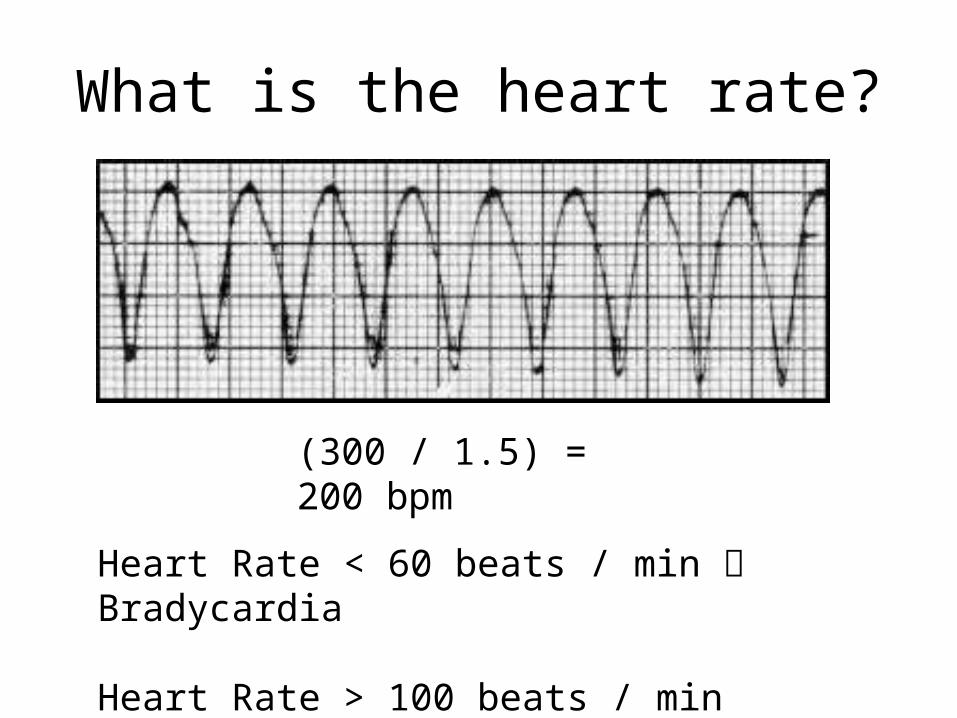
What is the heart rate?
(300 / 1.5) = 200 bpm
Heart Rate < 60 beats / min Bradycardia
Heart Rate > 100 beats / min Tachycardia
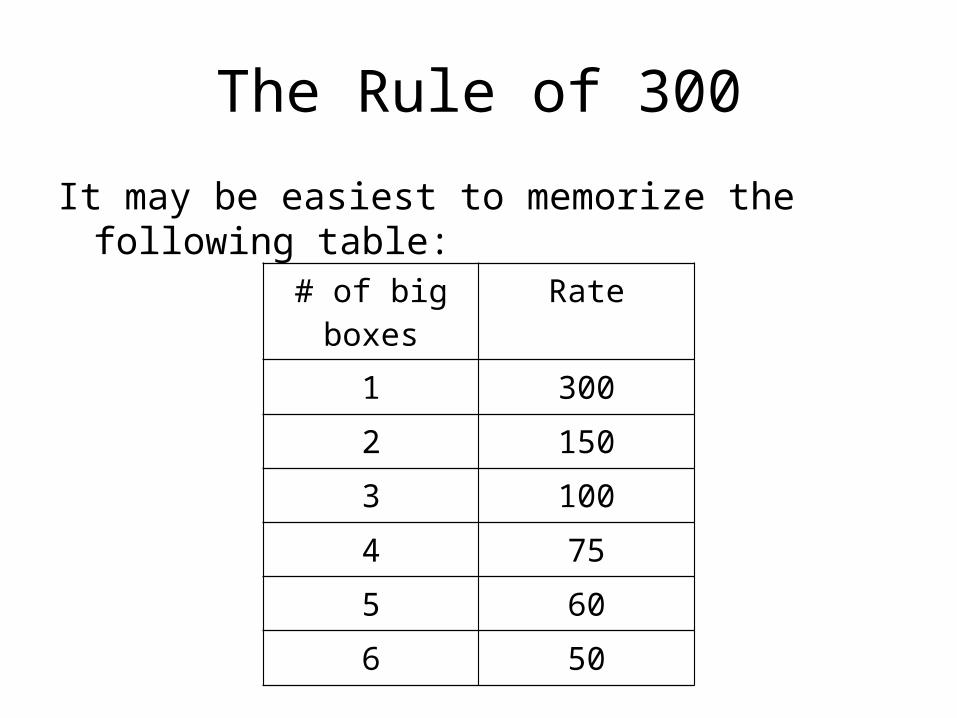
The Rule of 300
It may be easiest to memorize the following table:
# of big boxes
Rate
1 300
2 150
3 100
4 75
5 60
6 50
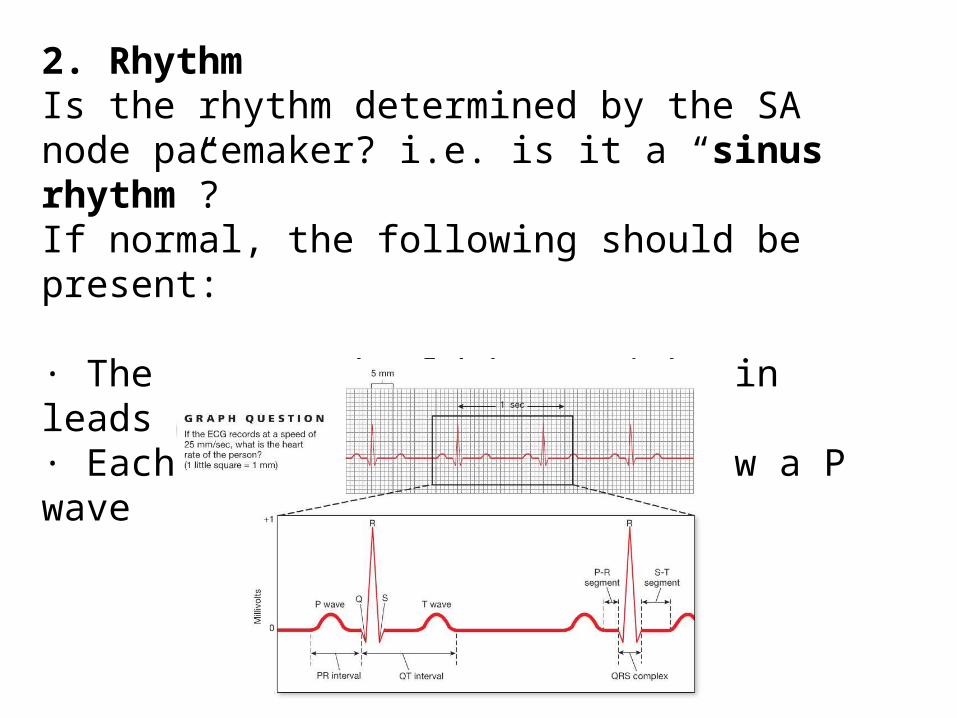
2. RhythmIs the rhythm determined by the SA node pacemaker? i.e. is it a “sinus rhythm”?If normal, the following should be present:
· The P wave should be upright in leads I, II and III.· Each QRS complex should follow a P wave
Einthoven’s Triangle•Einthoven’s triangle
hypothetical triangle created around the heart when electrodes are placed on both arms and the left leg .The sides of the triangle are numbered to correspond with the three leads ("leeds"), or pairs of electrodes.
Lead I at the top of the triangle, isorientated horizontally across the chest. This angle is taken as zero. Lead II is angled at 60 degrees to Lead I, and Lead III at roughly 120 degrees to Lead I.
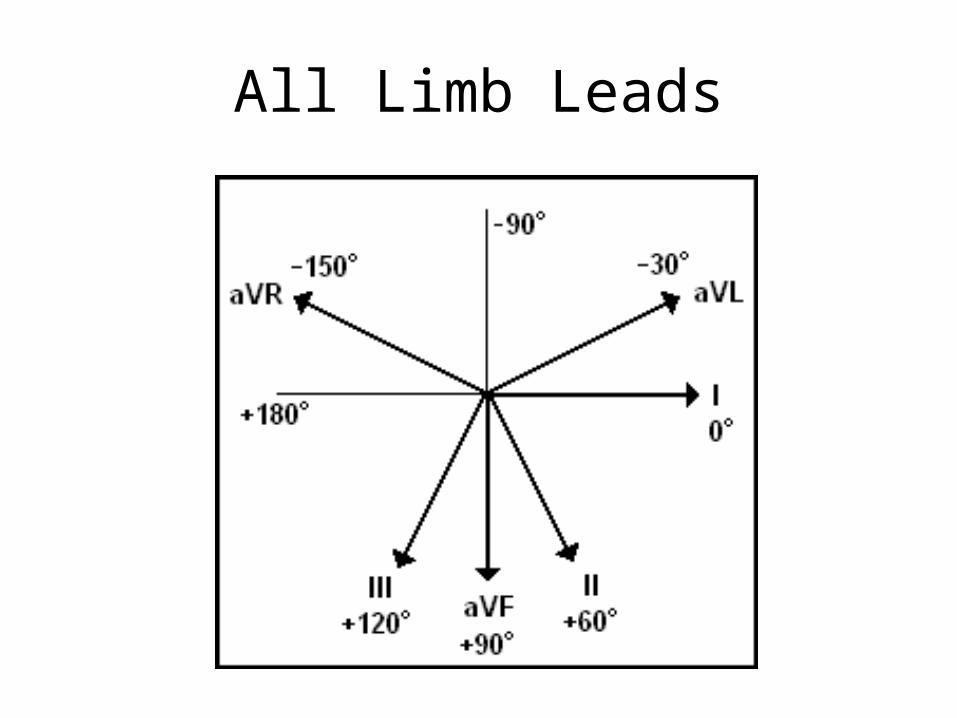
All Limb Leads
The QRS Axis
The QRS axis represents the net overall direction of the heart’s electrical activity.
Abnormalities of axis can hint at:Ventricular enlargementConduction blocks (i.e. hemiblocks)
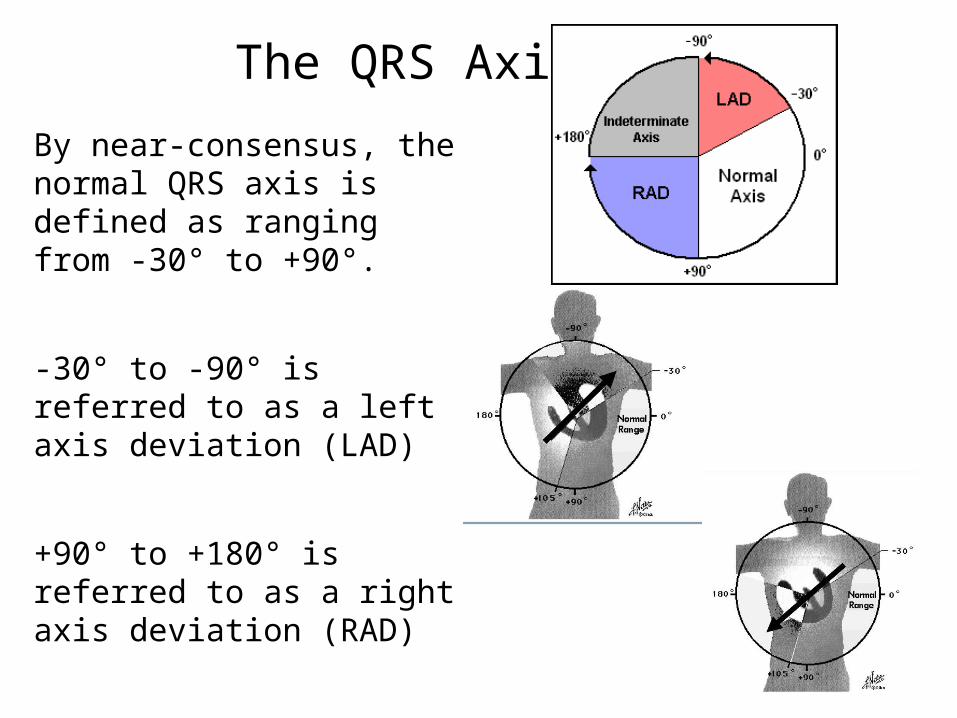
The QRS Axis
By near-consensus, the normal QRS axis is defined as ranging from -30° to +90°.
-30° to -90° is referred to as a left axis deviation (LAD)
+90° to +180° is referred to as a right axis deviation (RAD)
Determining the Axis
• The Quadrant Approach
• The Geometric method.
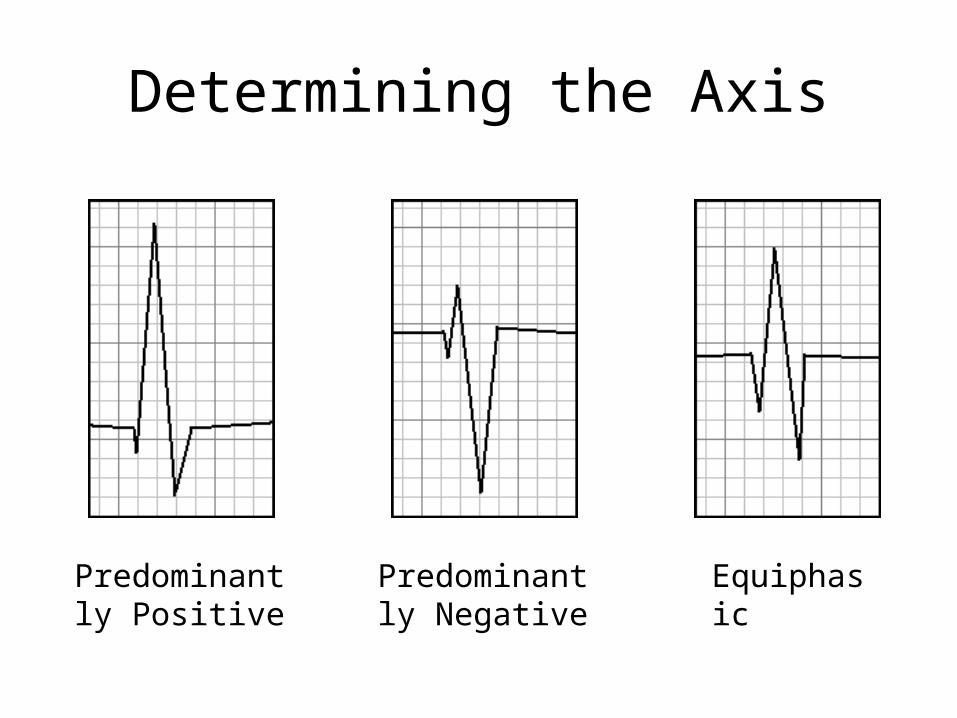
Determining the Axis
Predominantly Positive
Predominantly Negative
Equiphasic
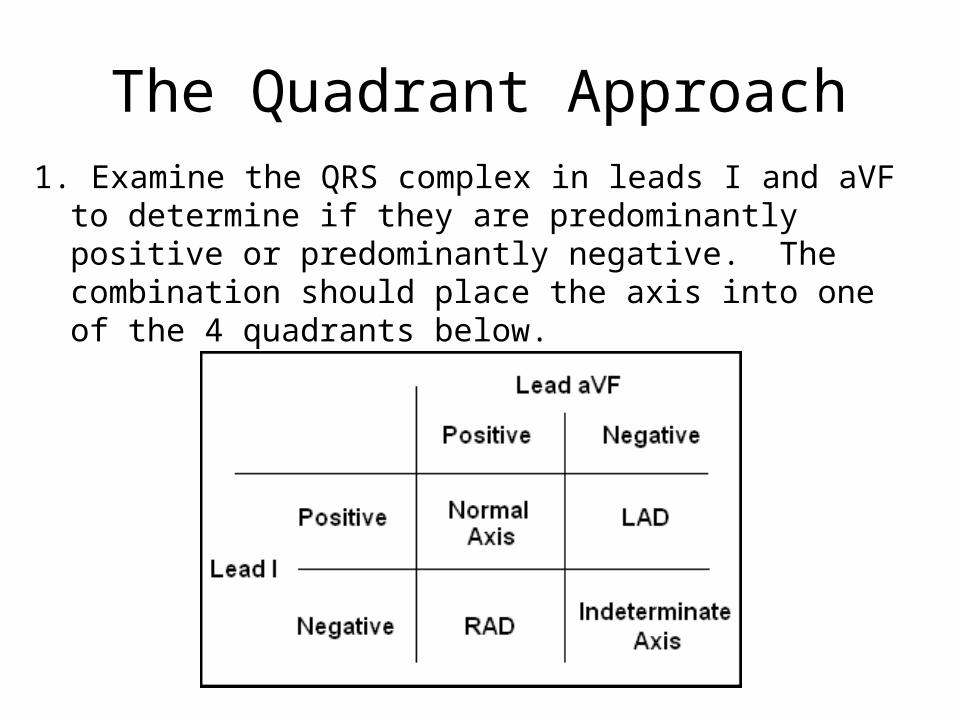
The Quadrant Approach1. Examine the QRS complex in leads I and aVF to determine if they
are predominantly positive or predominantly negative. The combination should place the axis into one of the 4 quadrants below.
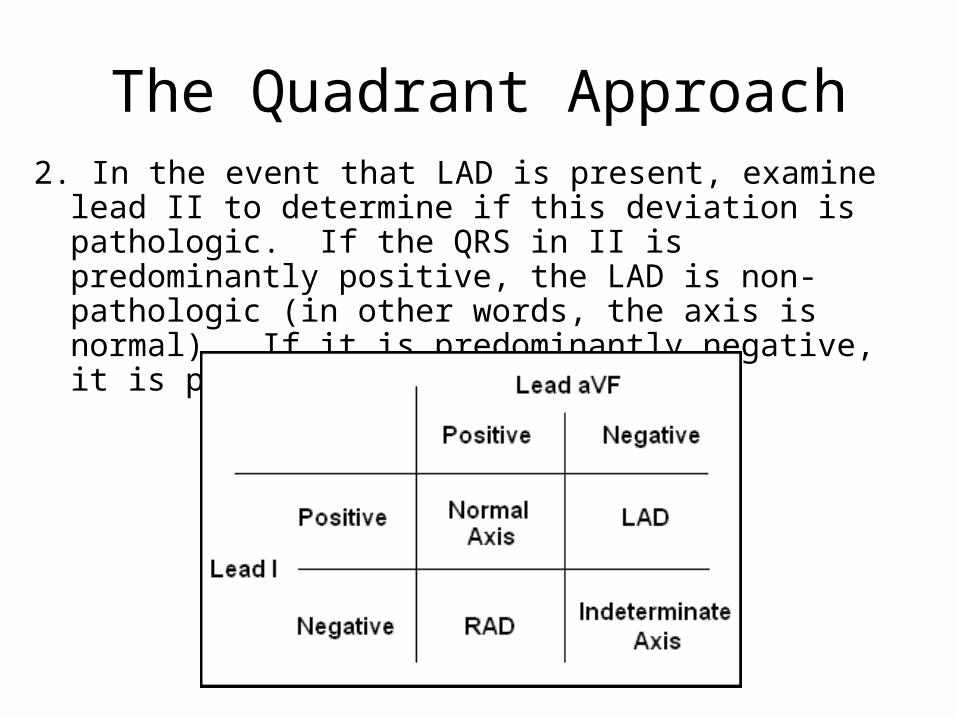
The Quadrant Approach2. In the event that LAD is present, examine lead II to determine if
this deviation is pathologic. If the QRS in II is predominantly positive, the LAD is non-pathologic (in other words, the axis is normal). If it is predominantly negative, it is pathologic.
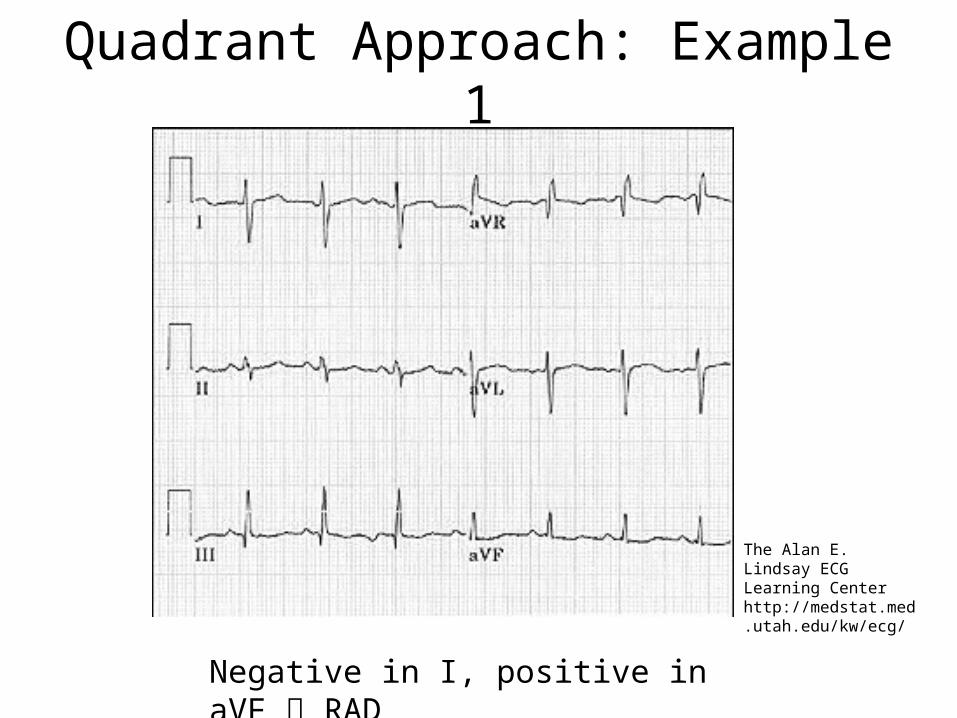
Quadrant Approach: Example 1
Negative in I, positive in aVF RAD
The Alan E. Lindsay ECG Learning Center http://medstat.med.utah.edu/kw/ecg/
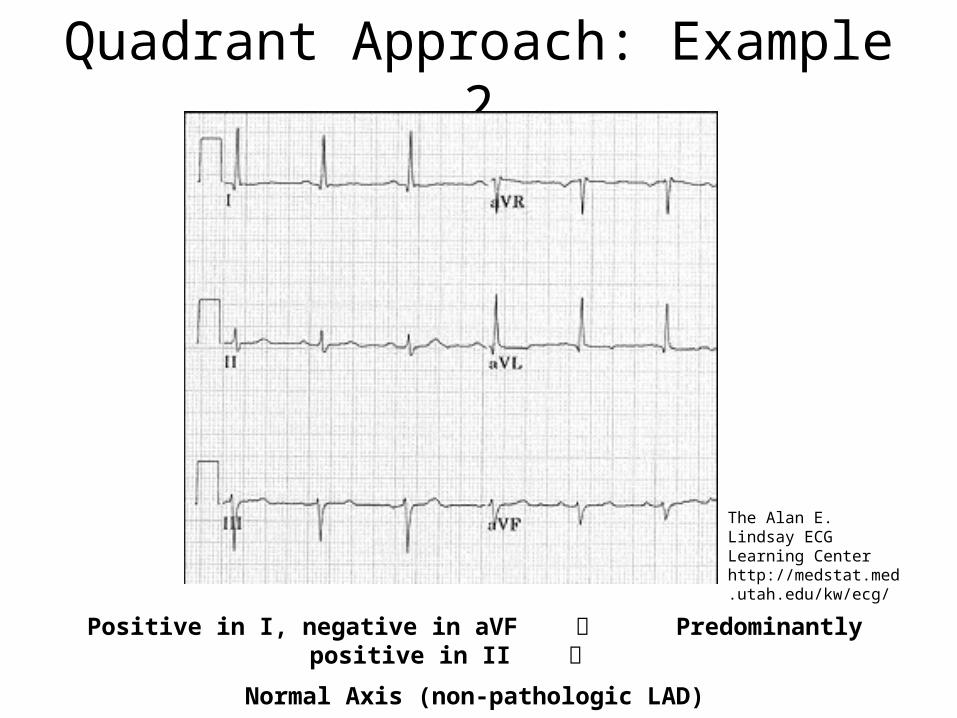
Quadrant Approach: Example 2
Positive in I, negative in aVF Predominantly positive in II
Normal Axis (non-pathologic LAD)
The Alan E. Lindsay ECG Learning Center http://medstat.med.utah.edu/kw/ecg/
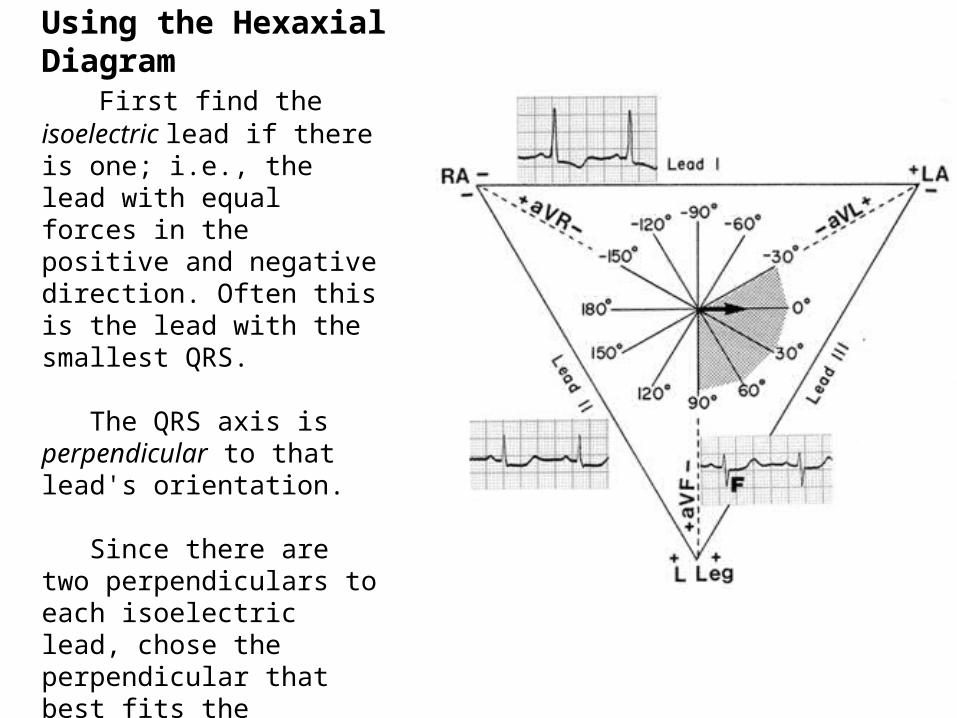
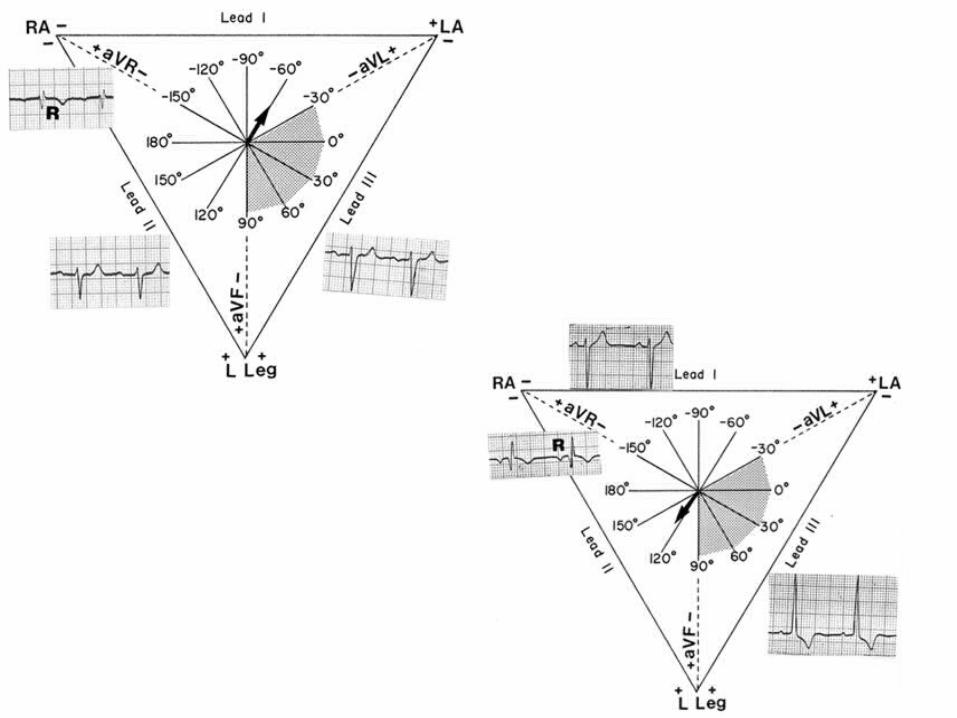
QRS Axis Determination- Using the Hexaxial Diagram First find the isoelectric lead if there is one; i.e., the lead with equal forces in the positive and negative direction. Often this is the lead with the smallest QRS.
The QRS axis is perpendicular to that lead's orientation.
Since there are two perpendiculars to each isoelectric lead, chose the perpendicular that best fits the direction of the other ECG leads.
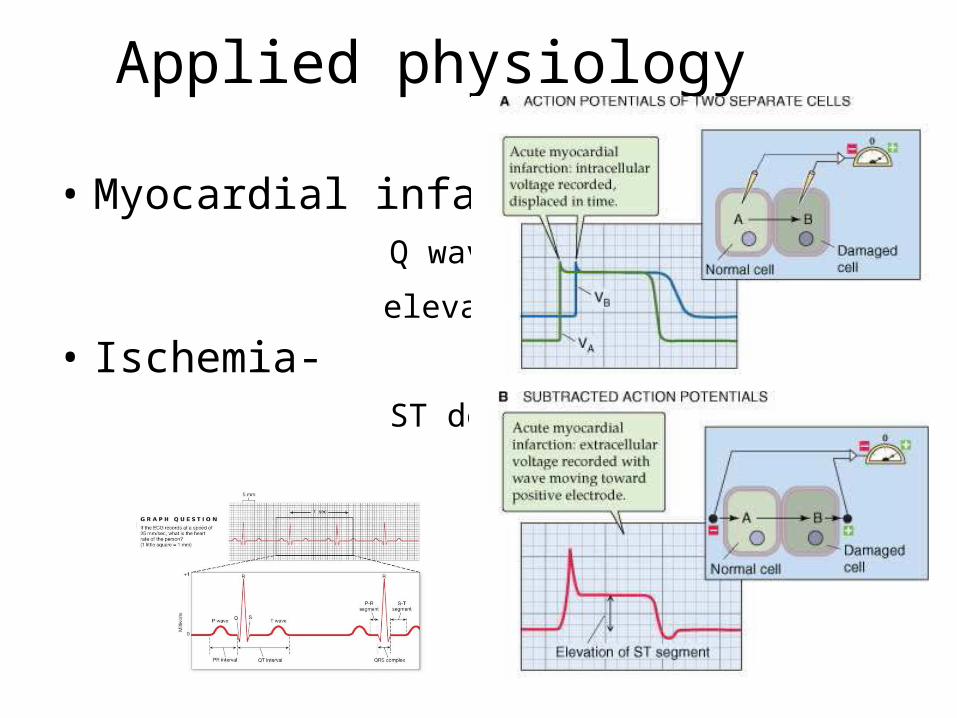
Applied physiology
• Myocardial infarction- Q wave
elevated ST segment • Ischemia- ST depression
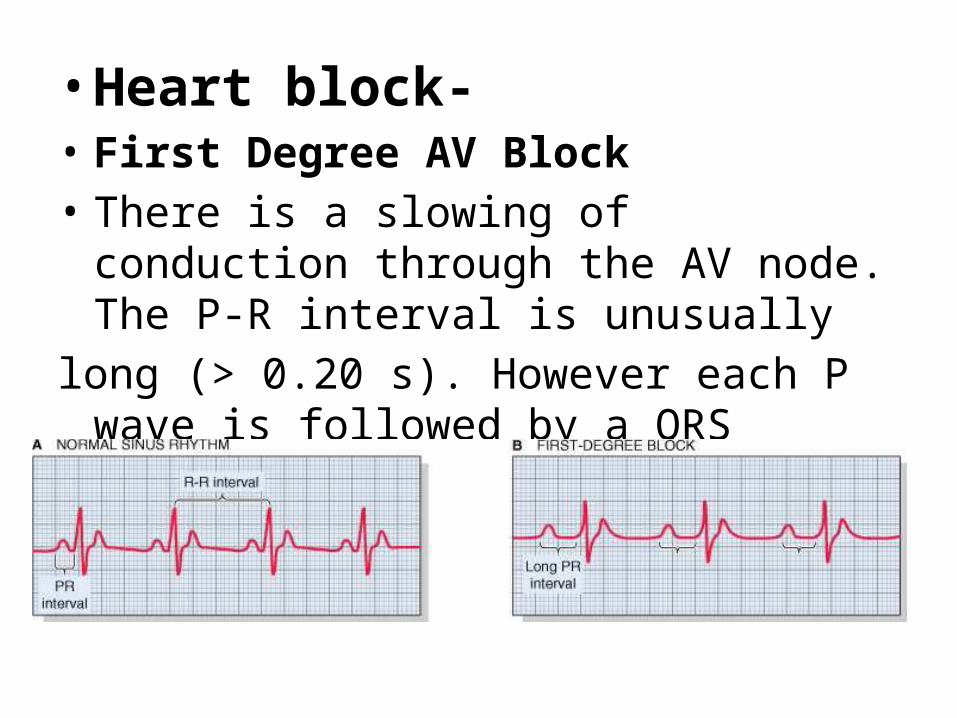
• Heart block- • First Degree AV Block• There is a slowing of conduction through the
AV node. The P-R interval is unusuallylong (> 0.20 s). However each P wave is followed
by a QRS complex.
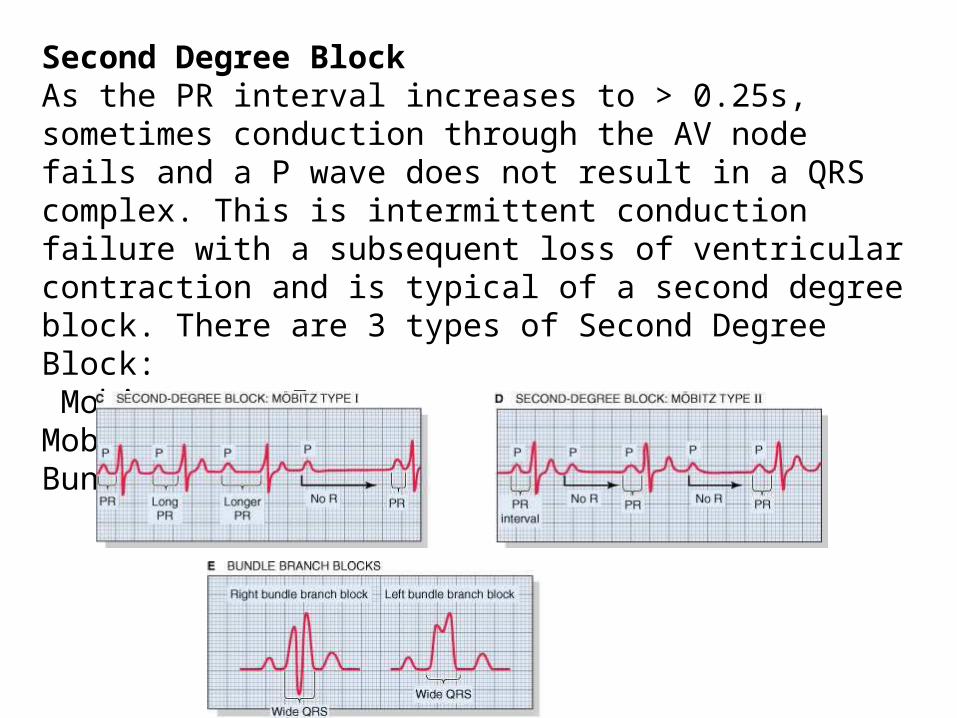
Second Degree BlockAs the PR interval increases to > 0.25s, sometimes conduction through the AV node fails and a P wave does not result in a QRS complex. This is intermittent conduction failure with a subsequent loss of ventricular contraction and is typical of a second degree block. There are 3 types of Second Degree Block: Mobitz type IMobitz type IIBundle Branch Block
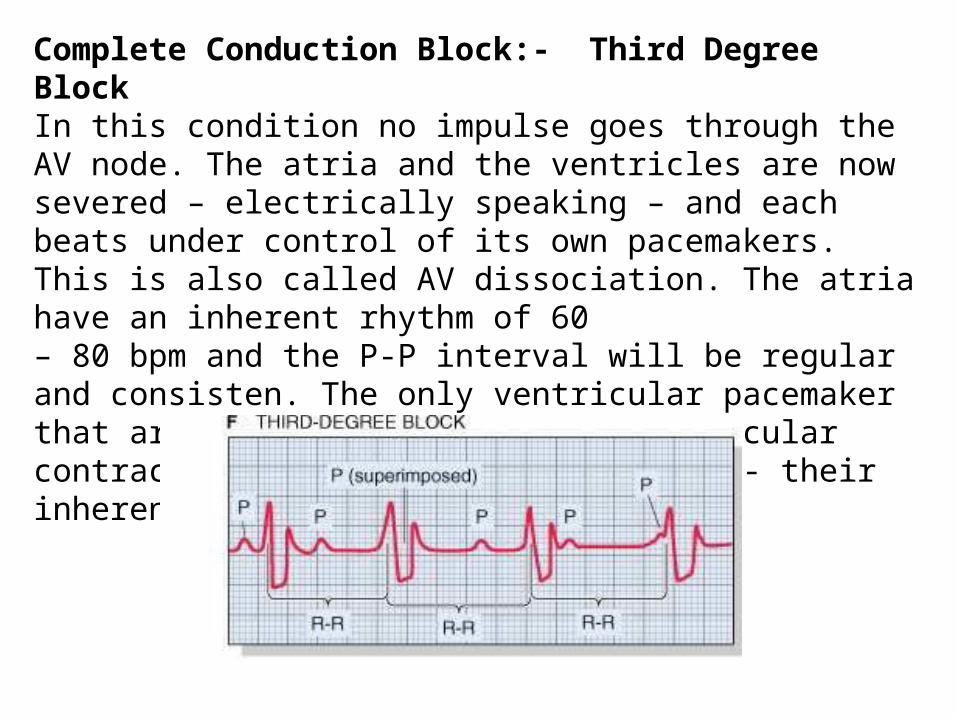
Complete Conduction Block:- Third Degree BlockIn this condition no impulse goes through the AV node. The atria and the ventricles are now severed – electrically speaking – and each beats under control of its own pacemakers. This is also called AV dissociation. The atria have an inherent rhythm of 60– 80 bpm and the P-P interval will be regular and consisten. The only ventricular pacemaker that are available to initiate ventricular contractions are the Purkinje fibres - their inherent rhythm is 20 – 40 bpm.
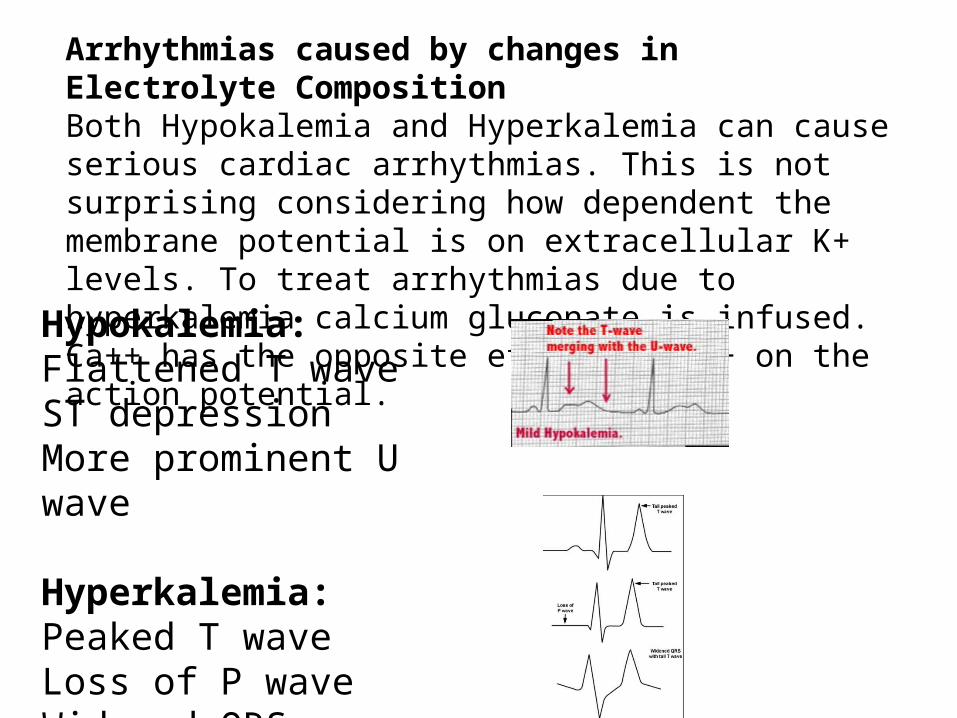
Arrhythmias caused by changes in Electrolyte CompositionBoth Hypokalemia and Hyperkalemia can cause serious cardiac arrhythmias. This is not surprising considering how dependent the membrane potential is on extracellular K+ levels. To treat arrhythmias due to hyperkalemia calcium gluconate is infused. Ca++ has the opposite effects to K+ on the action potential.
Hypokalemia: Flattened T waveST depressionMore prominent U wave
Hyperkalemia: Peaked T waveLoss of P waveWidened QRS


![Scannede dokumenter.pdf, ATT00001.htm, Scannede … · Attachments: Scannede dokumenter.pdf, ATT00001.htm, Scannede dokumenter.pdf, ATT00002.htm Fra: helen@lykke-moeller.dk [mailto:helen@lykke-moeller.dk]](https://img.pdfslide.us/doc/110x75/5f4cabce09b5fa18f70934c3/scannede-att00001htm-scannede-attachments-scannede-att00001htm-scannede.jpg)