Embed Size (px)
Citation preview

Hôpitaux Universitaires de Genève Point Prevalence Survey 2017 of healthcare-associated infections and antimicrobial use in Swiss acute care hospitals
Coordination Center Prevalence Study CH 22/01/2018
2
Contents
Abbreviations ........................................................................................................................ 6 Executive Summary .............................................................................................................. 7 Introduction ........................................................................................................................... 8
1. The impact of Healthcare-associated infections on healthcare .................................... 8 2. Prevalence surveys as a means to assess the burden of healthcare-associated infections .................................................................................................................... 8 3. The situation in Switzerland ........................................................................................ 8 4. Funding ....................................................................................................................... 9
Survey design and methodology ..........................................................................................10 1. Method and development of the Swiss PPS protocol .................................................10 2. Objectives ..................................................................................................................11 3. Inclusion and exclusion criteria for hospitals, wards, and patients ..............................11
Hospitals .......................................................................................................................11 Wards ............................................................................................................................11 Patients .........................................................................................................................11
4. Representative sample for comparison with the European countries participating in the ECDC-PPS ................................................................................................................12 5. Validation survey .......................................................................................................12
Implementation .....................................................................................................................13 1. List of participating hospitals ......................................................................................13 2. Swiss PPS website ....................................................................................................15 3. Training-the trainor courses .......................................................................................15 4. Data collection ...........................................................................................................16 5. Data management .....................................................................................................16
Results .................................................................................................................................17 1. Hospital-level data .....................................................................................................17
A. Hospital characteristics ...........................................................................................17 B. Isolation capacity ....................................................................................................22 C. Staffing, workload, bed occupation .........................................................................26 D. Hand hygiene .........................................................................................................29 E. Microbiological laboratory performance ..................................................................32 F. Post-prescription review of antimicrobials ...............................................................34 G. Organisation of infection prevention and control .....................................................34 H. Organisation of infection prevention and control .....................................................40

3
2. Patient level data .......................................................................................................42 A. Patient characteristics .............................................................................................42 B. Healthcare-associated infections ............................................................................56 C. Antimicrobial use ....................................................................................................85
References ......................................................................................................................... 103 Figures
Figure 1: Differences between point and periodic prevalence survey methods .....................10 Figure 2: Examples to include and exclude patients .............................................................12 Figure 4: Patient age by hospital size ...................................................................................42 Figure 5: Patient by hospital type .........................................................................................43 Figure 6: Prevalence of male gender by hospital size ...........................................................44 Figure 7: Prevalence of male gender by hospital type ..........................................................45 Figure 8: Patient McCabe score by hospital size ..................................................................46 Figure 9: Patient McCabe score by hospital type ..................................................................47 Figure 9: Patient McCabe score by hospital ownership ........................................................48 Figure 10: Length of stay to survey day ................................................................................49 Figure 11: Length of stay to survey day by hospital size .......................................................50 Figure 12: Length of stay to survey day by hospital type ......................................................51 Figure 13: Length of stay to survey day by University-Affiliation ...........................................52 Figure 14: Distribution of ward specialties ............................................................................53 Figure 15: Distribution of patient specialties .........................................................................54 Figure 16: Use of medical devices ........................................................................................55 Figure 17: HAI prevalence in Switzerland (with randomized and validated sample) ..............56 Figure 18: HAI prevalence by Canton ...................................................................................57 Figure 19: HAI prevalence by linguistic region ......................................................................58 Figure 20: HAI prevalence by Anresis Region ......................................................................59 Figure 21: HAI prevalence by hospital size ...........................................................................60 Figure 22: HAI prevalence by hospital type ..........................................................................61 Figure 23: HAI prevalence by hospital ownership .................................................................62 Figure 24: HAI prevalence by ward specialty ........................................................................63 Figure 25: HAI prevalence by age group ..............................................................................64 Figure 26: HAI prevalence by gender ...................................................................................65 Figure 27: HAI prevalence by McCabe score .......................................................................66 Figure 28: Prevalence of surgical site and device-associated infections ...............................68 Figure 29: Days to healthcare-associated infection ..............................................................69 Figure 30: Days to HAI by hospital size ................................................................................70 Figure 31: Days to HAI by hospital type ................................................................................71 Figure 32: Days to HAI by University-affiliation .....................................................................72 Figure 33: Distribution of HAI types (835 HAIs) ....................................................................73 Figure 34: Distribution of HAI types by hospital size .............................................................74

4
Figure 35: Distribution of HAI types by hospital type .............................................................75 Figure 36: Distribution of HAI types by University-affiliation ..................................................76 Figure 37: Source for bloodstream infections by hospital size ..............................................77 Figure 38: Source for bloodstream infections by hospital type ..............................................78 Figure 39: Source for bloodstream infections by University-affiliation ...................................79 Figure 40: HAI prevalence attributed to the current ward by hospital size .............................80 Figure 41: HAI prevalence attributed to the current ward by hospital type ............................81 Figure 42: Proportion of HAIs for which microbiological tests were ordered on total number of HAIs, and proportion of microbiologically documented HAIs .................................................82 Figure 43: Distribution of isolated microorganisms (by family name) ....................................83 Figure 44: Drug-resistant microorganisms among isolated microorganisms .........................84 Figure 45: Antimicrobial use, total and antimicrobial days ....................................................85 Figure 46: Antimicrobial use by canton .................................................................................86 Figure 47: Antimicrobial use by linguistic regions .................................................................87 Figure 48: Antimicrobial use by Anresis regions ...................................................................88 Figure 49: Antimicrobial use by hospital size ........................................................................89 Figure 50: Antimicrobial use by hospital type ........................................................................90 Figure 52: Antimicrobial use by hospital ownership ..............................................................91 Figure 51: Antimicrobial use by ward specialty .....................................................................92 Figure 52: Antimicrobial use by age group ............................................................................93 Figure 53: Patient on single antimicrobial or combination therapy ........................................94 Figure 54: Distribution of antimicrobials by indication ...........................................................95 Figure 55: Distribution of antimicrobials by medical diagnosis ..............................................96 Figure 56: Distribution of antimicrobial classes .....................................................................97 Figure 57: Distribution of antimicrobial classes used for community- and healthcare-acquired infections ..............................................................................................................................98 Figure 58: Ten most common antimicrobials ........................................................................99 Figure 59: Ten most common antimicrobials for therapeutic purposes ............................... 100 Figure 60: Ten most common antimicrobials for prophylactic purposes .............................. 101 Figure 61: Ten most common antimicrobials for surgical prophylaxis ................................. 102

5
Tables
Table 1: Participating hospitals by canton in alphabetic order ...............................................13 Table 2: Training-the trainor courses schedule .....................................................................16 Table 3: Hospital size and number of patients included in the CH-PPS ................................18 Table 4: Number of available beds and patients included in the CH-PPS .............................19 Table 5: Hospital discharges in a given year ........................................................................20 Table 6: Length of stay (days) ..............................................................................................21 Table 7: Hospital rooms ........................................................................................................22 Table 8: Beds per hospital room ...........................................................................................23 Table 9: Proportion of single rooms (among all rooms) .........................................................24 Table 10: Proportion of single rooms with toilet and shower (among single rooms) ..............25 Table 11: Nurses per 100 hospital beds ...............................................................................26 Table 12: Nursing assistants per 100 hospital beds ..............................................................27 Table 13: ICU nurses per ICU bed........................................................................................27 Table 14: ICU nursing assistant per ICU bed ........................................................................28 Table 15: Ward occupation at midnight ................................................................................28 Table 16: Alcohol-based handrub consumption ....................................................................29 Table 17: Alcohol-based handrub (dispensers) at the point of care ......................................30 Table 18: Observed hand hygiene opportunities per year and hospital .................................31 Table 19: Blood culture sets per 1000 patient-days ..............................................................32 Table 20: Stool tests for identifying Clostridium difficile infections per 1000 patient-days .....33 Table 21: Microbiological tests on weekends ........................................................................33 Table 22: Infection Prevention and Control – Annual plan ....................................................34 Table 23: Infection Prevention and Control – Annual report ..................................................35 Table 24: Infection Prevention and Control nurse – Full time equivalent per 250 beds .........36 Table 25: Infection Prevention and Control doctor – Full time equivalent per 1000 beds ......37 Table 26: Antimicrobial stewardship – Full time equivalent per hospital ................................38 Table 27: Surveillance activities ...........................................................................................39 Table 28: Multimodal strategies in intensive care: single elements .......................................40 Table 29: Multimodal strategies in intensive care: combination of elements .........................40 Table 30: Multimodal strategies outside intensive care: single elements ..............................41 Table 31: Multimodal strategies outside intensive care: combination of elements .................41 Table 32: Univariable and multivariable analysis of risk factors for HAI ................................67

6
Abbreviations
ABHR Alcohol-based hand rub AU Antimicrobial use BSI Bloodstream infection CAUTI Catheter-associated urinary tract infection CDI Clostridium difficile infection CRF Case Report Form CH Switzerland CH-PPS Swiss Point Prevalence Survey CLABSI Central line-associated bloodstream infection CVC Central venous catheter ECDC European Centre for Disease Prevention and Control EU European Union FOPH Federal Office of Public Health HAI Healthcare-associated infection HCW Healthcare worker HH Hand Hygiene HUG University Hospitals of Geneva (Hôpitaux Universitaires de Genève) ICU Intensive care IPC Infection Prevention and Control IQR Interquartile range KISS Krankenhaus Infektions Surveillance System LRTI Lower respiratory tract infection MDRO Multidrug-resistant organism NHSN National Healthcare Surveillance Network PABSI Peripheral line-associated bloodstream infection PPS Point Prevalence Survey PRIM Primary care PRIVFP Private ownership, for-profit PRIVNFP Private ownership, not-for-profit PROHIBIT Prevention of hospital infections by intervention and training PUB Public hospitals PVC Peripheral venous catheter SEC Secondary care SENIC Study on the Effectiveness of Nosocomial Infection Control SPEC Specialised care SSI Surgical site infection TERT Tertiary care UC Urinary catheter US United States UTI Urinary tract infection VENT Ventilator WHO World Health Organization 95%CI 95% confidence interval

7
Executive Summary
Between April and May 2017, 96 acute care hospitals in Switzerland performed a joint point prevalence survey on healthcare-associated infections (HAIs) and the use of antimicrobials. The average HAI-prevalence was 5.9% in 12’931 patients, and 33% received one or more antimicrobials on the day of survey. These numbers are similar to the past European Centre for Disease Prevention and Control (ECDC) point prevalence survey in 2011/2012. The most common healthcare-associated infections were surgical site infections (29%), lower respiratory tract infections (18%), urinary tract infections (15%), and bloodstream infections (13%). The highest proportions were identified in intensive care units (20.6%), in large hospitals (7.8%), in elderly patients (7.4%), in male patients (7.2%), and in patients with ultimately (9.3%) or rapidly (10.6%) fatal outcomes. Most antimicrobials on the day of survey were administered to treat infections (62%). The remainders were used for prophylaxis either before surgery (77%) or for medical purposes (23%). More patients in intensive care were on antimicrobials (62%) compared to surgery (44%), internal medicine (32%), and paediatrics (31%). These findings are in mid-range compared to Europe. Two thirds of the hospitals have formalized antimicrobial stewardship, but only 9% perform post-prescription review of antimicrobials, one of the key actions of antimicrobial stewardship. Only half of the hospitals (53%) had an annual plan for infection prevention and control (IPC), but two thirds (64%) produced an annual report summarizing IPC activities. Staffing of IPC nurses in Swiss hospitals was 1.5 per 250 hospital beds in 2017. This is higher compared to other European countries where average staffing is 1 per 250 hospital beds. Staffing for IPC doctors in Switzerland was 2.5 per 1000 hospital beds in 2017. Average consumption of alcohol-based handrub was 53 mL per patient-day. Although there is room for improvement, this was far more than the 21 mL per patient-day identified in past European surveys. The survey in 2017 was part of the priority given on HAI-prevention by the strategy “Gesundheit 2020/Santé 2020” of the Swiss Confederation. The survey was organised by Swissnoso with financial support by the Federal Office of Public Health. The last survey on HAI in Switzerland was performed in 2004. Although the methodologies between the two surveys in 2004 and 2017 were different and comparison of the results difficult, healthcare-associated infections are likely to have decreased since. The protocol of the survey in 2017 followed the ECDC methodology, which was developed jointly by different stakeholders, and which was used concurrently in surveys on HAI and antimicrobial use in other European countries. This will allow benchmarking with countries in Europe as soon as ECDC will publish the results by the end of 2018.

8
Introduction
1. The impact of Healthcare-associated infections on healthcare
Healthcare-associated infections (HAIs), also known as “nosocomial” or “hospital-acquired infections” are infections acquired in healthcare settings, which neither are present nor incubating at the time of hospital admission. They are associated with attributable mortality, and have a negative impact on clinical outcome, length of stay, and hospital costs. Healthcare-associated infections are accepted to have a major impact on patient safety, and today, a growing number of countries address HAIs as a priority patient safety topic. The overall HAI burden remains high, albeit much effort has been devoted to their prevention. According to the World Health Organization (WHO), 7% of patients in developed countries and 10% in developing countries will acquire at least one HAI at any one time, with attributable mortality estimated at 10%.1 2. Prevalence surveys as a means to assess the burden of healthcare-
associated infections
Prevalence surveys have a long tradition in the field of infection prevention and control (IPC). In the early 70's, the Center for Disease Control and Prevention (CDC) Study on the Effectiveness of Nosocomial Infection Control (SENIC) in the United States used repeated point prevalence surveys (PPSs) to measure the effectiveness of infection prevention and control programmes on a number of HAI outcomes such as surgical site infections (SSIs), bloodstream infections (BSIs), urinary tract infections (UTIs), and lower respiratory tract infections (LRTIs) in more than 300 US hospitals.2 Already in 1981, WHO experts recommended performing national PPSs as a tool to estimate the burden of HAI at reasonable cost.3 Although the response to this call was moderate at that time, a growing number of countries have conducted national surveys in subsequent years. In the 90’s and at the turn of the millennium, PPSs have gradually fallen into oblivion until the European Centre for Disease Prevention and Control (ECDC), and the US Center for Disease Control (CDC) performed large-scale, surveys in 2011/2012. The prevalence in the US and in the European Union (EU) was 4% and 6%, respectively.4-6 Between 2016 and 2017, ECDC performed its second PPS on HAI and antimicrobial use in the European Union, the European Economic Area, and EU candidate countries. 3. The situation in Switzerland
In Switzerland, a series of national HAI prevalence surveys had been carried out by Swissnoso in the past, the last in 2004.7-14 In contrast to most other countries using the point prevalence methodology, Switzerland used the period prevalence methodology, which did not allow benchmarking, neither to other surveys nor to the present CH-PPS. The period prevalence methodology inflates the number of identified HAI by providing a more appropriate distribution of HAI-types.15
9
In January 2013, the Swiss Federal Council approved the ‘Health 2020' plan, setting priorities in public health over the upcoming years. Within this plan, HAI prevention was given high priority, and as a consequence, the federal office of public health (FOPH) together with a large number of stakeholders from health delivery, defined the “Strategy NOSO”, which was validated by the Swiss Federal Council in 2016.16 The objective of the strategy is the reduction of HAIs and prevention of emerging resistance in Swiss acute-care health facilities. In order to get data on the burden of HAI in Switzerland, the FOPH encouraged and supported Swissnoso to perform a national PPS. Swissnoso on its part engaged the University of Geneva Hospitals (HUG) to coordinate the task. Given that ECDC was about performing its second PPS, Switzerland should provide comparable data still in 2017. 4. Funding
This survey was organized by Swissnoso in collaboration with the University of Geneva Hospitals. Swissnoso received financial support by the Swiss Federal Office of Public Health to conduct this study.

10
Survey design and methodology
1. Method and development of the Swiss PPS protocol
The applied method follows a classic point prevalence protocol. Compared to the period prevalence methodology used in the past, data are collected on one day only (snapshot), instead of looking at a time window of 7 days. While the period prevalence method captures more HAIs, particularly those of short duration, it is a mix between the concepts of “prevalence” and “incidence” and inflates the overall burden of HAI.15 Furthermore, it is also more time-consuming than PPS. The Swiss‐PPS used the standard version of the second ECDC-PPS as described in the ECDC Protocol version 5.3 for the ECDC‐PPS II.17 In addition to previous surveys, the second ECDC-PPS addressed hospital indicator data based on ten key components, identified by a large ECDC-initiated systematic review and expert consensus.18 The protocol was translated into the three official Swiss languages (German, French and Italian) by the coordinators and the IPC team at Lugano Civico Hospital. A few minor modifications were applied to adapt the protocol to the situation in Switzerland (particularly in the section about hospital indicators). The protocol, as well as the code lists for HAIs, microorganisms, and antimicrobials, can be downloaded from the CH-PPS website www.swissnoso.ch/prevalence. The protocol addresses four areas of interest: 1) hospital indicator data; 2) patients’ demographics, characteristics, and risk factors; 3) HAIs, and 4) antimicrobial use. Figure 1: Differences between point and periodic prevalence survey methods
Adapted from Zingg and colleagues 15

11
2. Objectives
The CH-PPS has the following objectives: - To obtain representative data on HAI in acute care hospitals in Switzerland - To obtain data on antimicrobial use in acute care hospitals in Switzerland - To establish a hospital network for future surveys in Switzerland - To benchmark data on HAI and antimicrobial consumption with the concurrently performed ECDC-PPS (once the data are officially available)
3. Inclusion and exclusion criteria for hospitals, wards, and patients
Hospitals
All acute care hospitals in Switzerland (and the Liechtenstein national hospital) were eligible to participate in the PPS on a voluntary basis. All 187 acute care hospitals were sent an invitation letter in December 2016. Concomitantly, local IPC professionals were informed via Email. Reminders were sent mid-January. Wards
All wards in n acute-care hospitals regardless of specialty were eligible, but hospitals were free to exclude wards (however, excluded wards had to be specified). Patients in the emergency room for more than 24 hours and patients hospitalized in psychiatry were excluded. Long-term rehabilitation and other long-term care facilities were included in the survey if they were an integral part of an acute-care hospital. Patients
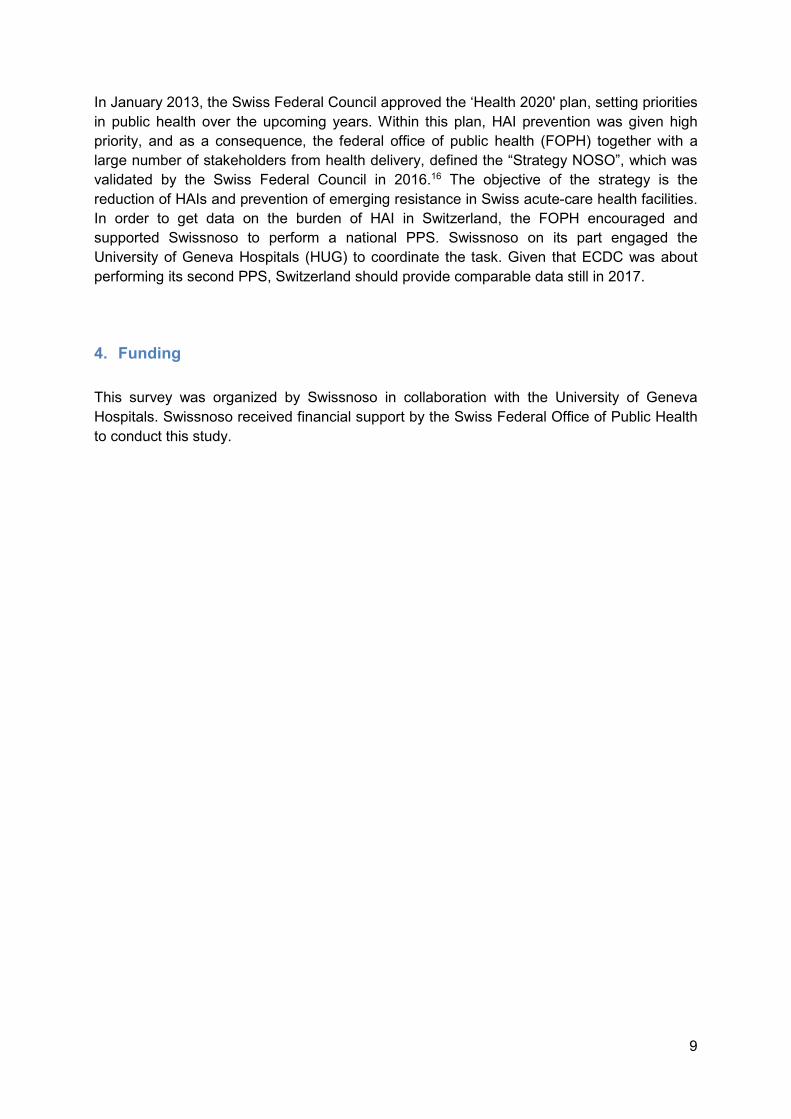
All patients (including children and neonates) were eligible to be included if admitted to the ward before or at 8 a.m. and not discharged (either home or to a different ward) during the day of the survey.
12
Figure 2: Examples to include and exclude patients
4. Representative sample for comparison with the European countries
participating in the ECDC-PPS
In order to obtain a representative sample to be benchmarked with the ECDC-PPS, a randomization process was performed based on the list of invited hospitals. The hospitals were allocated to three categories (<200 beds, 200-650 beds, >650 beds). Based on the final data of eligible hospitals and applying the methodology by ECDC (Design effect of 4.7; precision of +/- 1%; pooled HAI prevalence of 5.9; 95% confidence interval), a total of 8606 in 56 hospitals had to be included in the randomized sample. A list of each category was created in descending (bed size) order. Six randomised sequences were generated for each category (www.randomizer.org), and one of the sequences again was selected randomly. Two (out of 7 [7]), 10 (out of 26 [32]), and 44 (out of 63 [148]) hospitals were selected for large size, medium size, and small size hospitals, respectively. The distribution of the selected hospitals among hospital categories was similar to the invited hospitals. However, while all large size hospitals participated in the CH-PPS, only 26 of 32 (81.3%) medium size hospitals, and 63 of 148 (42.6%) small size hospitals contributed data to the CH-PPS. 5. Validation survey
In order to assess the sensitivity and specificity of the survey, a validation survey was performed in a limited number of participating hospitals in parallel. Six hospitals representing different categories were contacted and voluntarily accepted to participate in the validation survey: 1 university-affiliated hospital, two public medium size hospitals, two public small size hospitals, and one private hospital. Three investigators from the CH-PPS coordination center performed validation in 50 patients of each hospital, prioritizing high-prevalence areas such as intensive care units (ICUs).
13
Implementation
1. List of participating hospitals
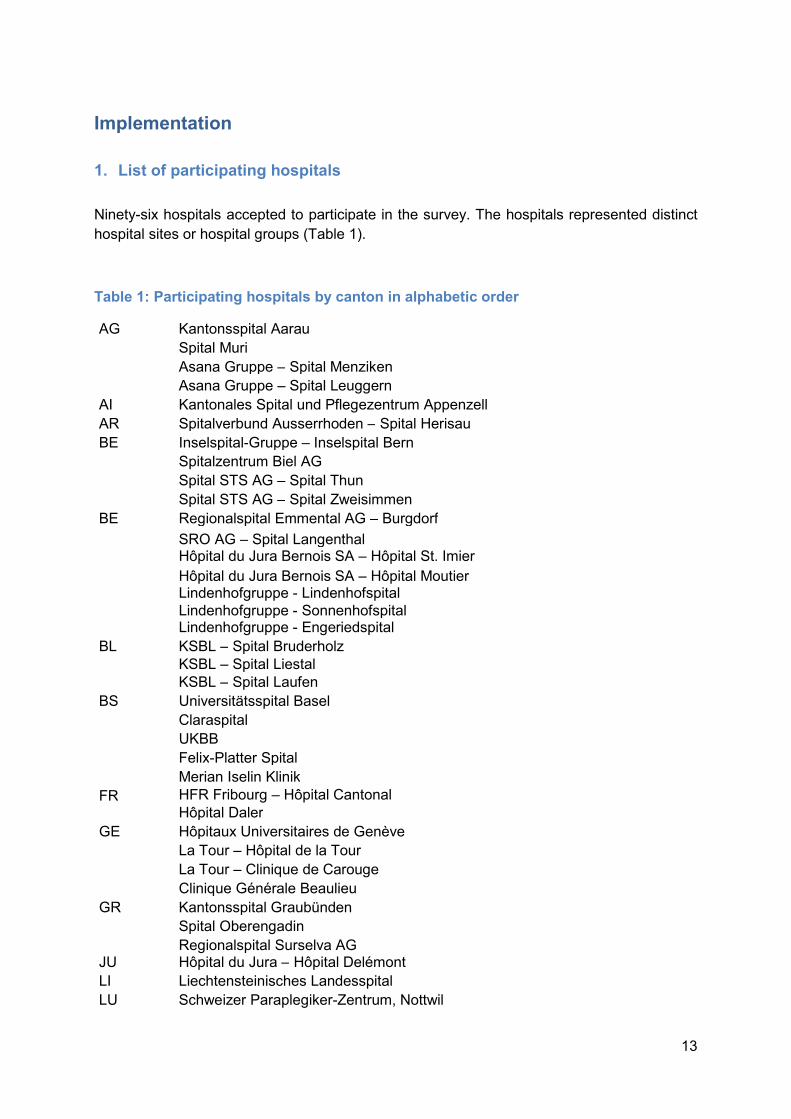
Ninety-six hospitals accepted to participate in the survey. The hospitals represented distinct hospital sites or hospital groups (Table 1).
Table 1: Participating hospitals by canton in alphabetic order
AG Kantonsspital Aarau Spital Muri Asana Gruppe – Spital Menziken Asana Gruppe – Spital Leuggern AI Kantonales Spital und Pflegezentrum Appenzell AR Spitalverbund Ausserrhoden – Spital Herisau BE Inselspital-Gruppe – Inselspital Bern Spitalzentrum Biel AG Spital STS AG – Spital Thun Spital STS AG – Spital Zweisimmen BE Regionalspital Emmental AG – Burgdorf SRO AG – Spital Langenthal Hôpital du Jura Bernois SA – Hôpital St. Imier Hôpital du Jura Bernois SA – Hôpital Moutier Lindenhofgruppe - Lindenhofspital Lindenhofgruppe - Sonnenhofspital Lindenhofgruppe - Engeriedspital BL KSBL – Spital Bruderholz KSBL – Spital Liestal KSBL – Spital Laufen BS Universitätsspital Basel Claraspital UKBB Felix-Platter Spital Merian Iselin Klinik FR HFR Fribourg – Hôpital Cantonal Hôpital Daler GE Hôpitaux Universitaires de Genève La Tour – Hôpital de la Tour La Tour – Clinique de Carouge Clinique Générale Beaulieu GR Kantonsspital Graubünden Spital Oberengadin Regionalspital Surselva AG JU Hôpital du Jura – Hôpital Delémont LI Liechtensteinisches Landesspital LU Schweizer Paraplegiker-Zentrum, Nottwil

14
NE Hôpital neuchâtelois – Neuchâtel Hôpital neuchâtelois – La Chaux-de-Fonds SG Kantonsspital St. Gallen – St. Gallen Kantonsspital St. Gallen – Flawil Kantonsspital St. Gallen – Rorschach SRFT – Spital Wil SRFT – Spital Wattwil SRWS – Spital Grabs SRWS – Spital Walenstadt SRWS – Spital Altstätten Ostschweizer Kinderspital Hirslanden Gruppe – Klinik Stephanshorn SO Solothurner Spitäler AG – Burgerspital Solothurn Solothurner Spitäler AG – Kantonsspital Olten Solothurner Spitäler AG – Spital Dornach Privatklinik Obach SZ Spital Lachen TG Spital Thurgau AG – Kantonsspital Münsterlingen Spital Thurgau AG – Kantonsspital Frauenfeld Klinik Seeschau TI EOC – Ospedale Civico di Lugano EOC – Ospedale Regionale Bellinzona e Valli EOC – Ospedale Regionale di Locarno EOC – Ospedale Regionale di Mendrisio EOC – Ospedale Regionale di Lugano Italiano Fondazione Cardiocentro Ticino Clinica Luganese Moncucco VD CHUV Hôpital ophtalmique Jules-Gonin eHnv – Hôpital de Yverdon-les-Bains eHnv – Hôpital Saint-Loup EHC – Hôpital Morges HRC – Hôpital Samaritain HRC – Hôpital Aigle HRC – Hôpital Vevey Providence HRC – Hôpital Montreux GHOL – Hôpital de Nyon GHOL – Hôpital de Rolle Hôpital intercantonal de la Broye Hôpital du Pays-d'Enhaut, Château d’Œx RSBJ – Sainte-Croix Clinique de La Source Hirslanden-Gruppe – Clinique Bois-Cerf Hirslanden-Gruppe – Clinique Cecil VS Centre Hospitalier du Valais Romand Spitalzentrum Oberwallis HRC – Hôpital Monthey Clinique de Valère ZG Kantonsspital Zug
15
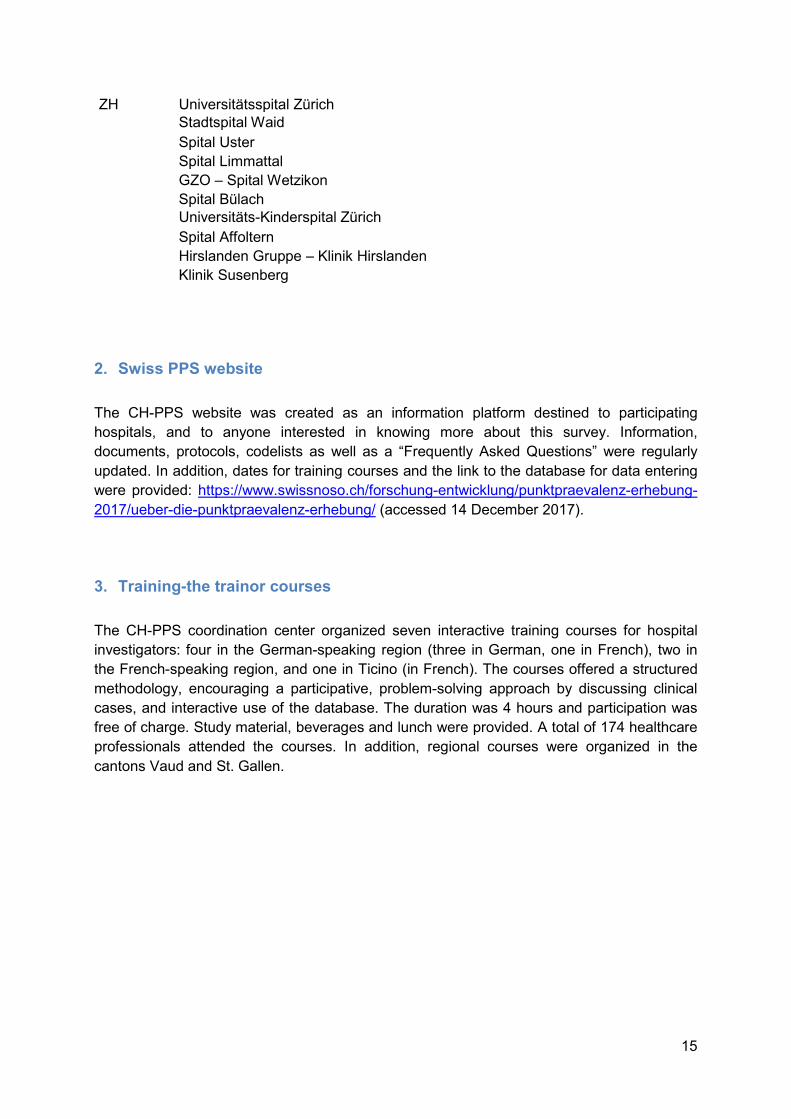
ZH Universitätsspital Zürich Stadtspital Waid Spital Uster Spital Limmattal GZO – Spital Wetzikon Spital Bülach Universitäts-Kinderspital Zürich Spital Affoltern Hirslanden Gruppe – Klinik Hirslanden Klinik Susenberg 2. Swiss PPS website
The CH-PPS website was created as an information platform destined to participating hospitals, and to anyone interested in knowing more about this survey. Information, documents, protocols, codelists as well as a “Frequently Asked Questions” were regularly updated. In addition, dates for training courses and the link to the database for data entering were provided: https://www.swissnoso.ch/forschung-entwicklung/punktpraevalenz-erhebung-2017/ueber-die-punktpraevalenz-erhebung/ (accessed 14 December 2017). 3. Training-the trainor courses
The CH-PPS coordination center organized seven interactive training courses for hospital investigators: four in the German-speaking region (three in German, one in French), two in the French-speaking region, and one in Ticino (in French). The courses offered a structured methodology, encouraging a participative, problem-solving approach by discussing clinical cases, and interactive use of the database. The duration was 4 hours and participation was free of charge. Study material, beverages and lunch were provided. A total of 174 healthcare professionals attended the courses. In addition, regional courses were organized in the cantons Vaud and St. Gallen.

16
Table 2: Training-the trainor courses schedule
Date Place Language 14.03.2017 Clinique romande de réadaptation, Sion FR 16.03.2017 Swiss Alcohol Board (SAB), Bern DE 21.03.2017 Inselspital, Bern FR 23.03.2017 Universitätsspital Zürich, Zürich DE 04.04.2017 Hôpitaux Universitaires de Genève, Geneva FR 06.04.2017 Allresto GmbH, Bern DE 27.04.2017 Ospedale Regionale di Lugano, Lugano FR 4. Data collection
Data collection was conducted from 1st April to 30 June 2017. Participating hospitals were free to choose a suitable date or time frame (of maximal 2 weeks) within this period. 5. Data management
After data collection by case report forms (CRFs), data were entered into the electronic CH-PPS database. Hospitals were free to enter data directly into the database without formally using paper CRFs. Data had to be entered on 31 July 2017. A data cleaning process was established, in which hospitals were contacted if necessary; the database was closed on 27 September 2017 for data entry. Hospitals had the option to download their own data (without benchmarking) in different formats (html, csv, pdf). Data were analyzed using STATA version 13 (STATA Corporation); validated PPS-data were provided by Carl Suetens from ECDC, applying the identical methodology used in the ECDC-PPS.
17
Results
1. Hospital-level data
Hospital indicator data were selected based on an ECDC-initiated systematic review on Hospital organization, management, and structure for the prevention of healthcare-associated infections (SIGHT), coordinated by the University of Geneva Hospitals (HUG).18 The systematic review identified ten key components for successful HAI-prevention: 1) organisation of infection control at the hospital level; 2) bed occupancy, staffing, workload, and employment of pool or agency nurses; 3) availability of and ease of access to materials and equipment and optimum ergonomics; 4) appropriate use of guidelines; 5) education and training; 6) auditing; 7) surveillance and feedback; 8) multimodal and multidisciplinary prevention programmes that include behavioural change; 9) engagement of champions; and 10) positive organisational culture. An expert committee agreed on a number of indicators to be allocated to the key components for surveillance purposes. In a multistep consultation process by the authors, the ECDC ARHAI (antibiotic resistance and healthcare-associated infection) coordinators, and EU/EEA national focal points on IPC, a number of indicators were selected to be addressed by the ECDC-PPS. The CH-PPS adopted these indicators in the protocol in order to benchmark the Swiss data to the ECDC data. A. Hospital characteristics
A total of 96 hospitals participated in the CH-PPS in 2017 (Tables 1, 3, 4). Median (Interquartile range [IQR]) duration of data collection was 2 (1-5) days, with three hospitals using more than 14 days. All adult and mixed university-affiliated hospitals participated in the CH-PPS. However, only two of three free-standing children’s hospitals participated, and one mixed university hospital did not collect data on children.
18
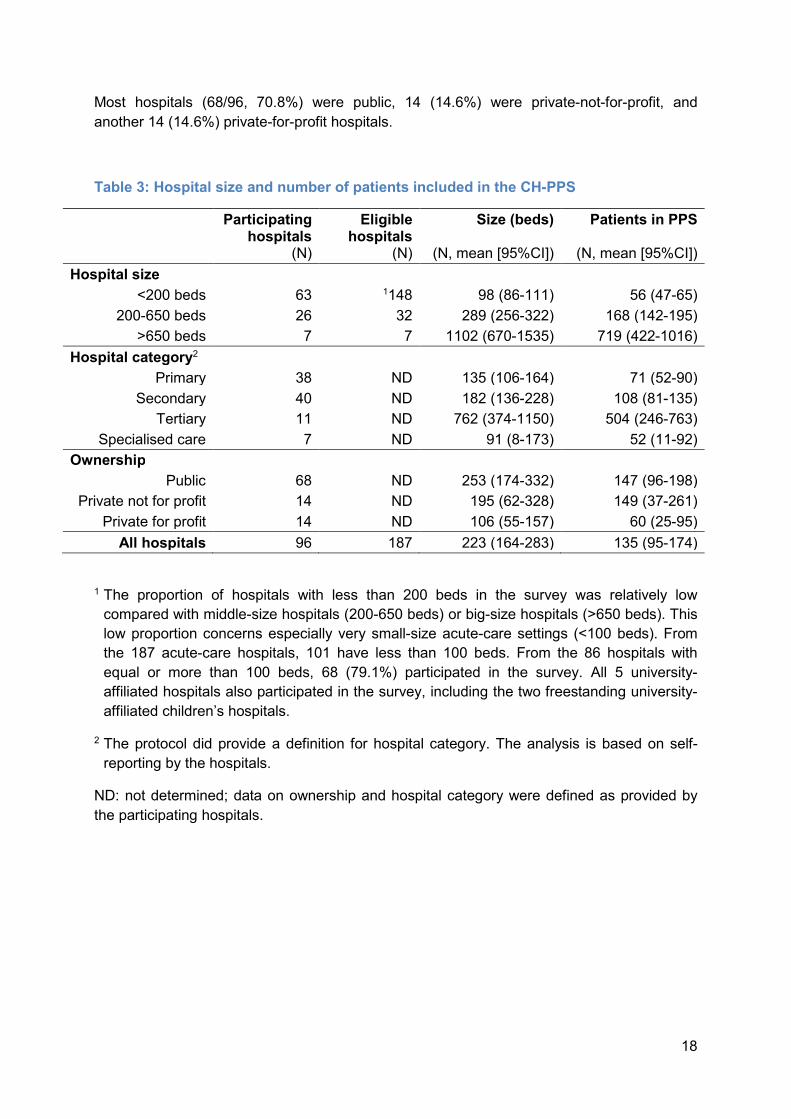
Most hospitals (68/96, 70.8%) were public, 14 (14.6%) were private-not-for-profit, and another 14 (14.6%) private-for-profit hospitals. Table 3: Hospital size and number of patients included in the CH-PPS
Participating hospitals (N)
Eligible hospitals (N)
Size (beds) (N, mean [95%CI]) Patients in PPS (N, mean [95%CI])
Hospital size <200 beds 63 1148 98 (86-111) 56 (47-65) 200-650 beds 26 32 289 (256-322) 168 (142-195) >650 beds 7 7 1102 (670-1535) 719 (422-1016) Hospital category2 Primary 38 ND 135 (106-164) 71 (52-90) Secondary 40 ND 182 (136-228) 108 (81-135) Tertiary 11 ND 762 (374-1150) 504 (246-763) Specialised care 7 ND 91 (8-173) 52 (11-92) Ownership Public 68 ND 253 (174-332) 147 (96-198) Private not for profit 14 ND 195 (62-328) 149 (37-261) Private for profit 14 ND 106 (55-157) 60 (25-95)
All hospitals 96 187 223 (164-283) 135 (95-174) 1 The proportion of hospitals with less than 200 beds in the survey was relatively low compared with middle-size hospitals (200-650 beds) or big-size hospitals (>650 beds). This low proportion concerns especially very small-size acute-care settings (<100 beds). From the 187 acute-care hospitals, 101 have less than 100 beds. From the 86 hospitals with equal or more than 100 beds, 68 (79.1%) participated in the survey. All 5 university-affiliated hospitals also participated in the survey, including the two freestanding university-affiliated children’s hospitals. 2 The protocol did provide a definition for hospital category. The analysis is based on self-reporting by the hospitals. ND: not determined; data on ownership and hospital category were defined as provided by the participating hospitals.

19
The 96 hospitals participating in the survey provided data on 12’931 patients (Table 4).
Table 4: Number of available beds and patients included in the CH-PPS
Hospitals (N) Total beds (N) Total patients in PPS (N) Hospital size <200 beds 63 6194 3516 200-650 beds 26 7514 4380 >650 beds 7 7717 5035 Hospital category Primary 38 5132 2694 Secondary 40 7279 4325 Tertiary 11 8378 5549 Specialised care 7 636 363 Ownership Public 68 17215 10009 Private not for profit 14 2728 2082 Private for profit 14 1482 840 All hospitals 96 21425 12931 The numbers of patients included in the PPS is lower compared to the number of total beds due to bed occupation, and the specific inclusion/exclusion criteria for patients (e.g. patients to be discharged during the day, or new admissions after 8.00 were excluded). The proportion of included patients to total beds is in line with the experience of the CH-PPS coordinating centre with previous local PPSs.

20
Tables 5 and 6 summarize indicator data on the participating hospitals, stratified by hospital size, hospital category, and ownership. Table 5: Hospital discharges in a given year
*Data source: number of hospitals contributing to the results
Results median (IQR) *Data source (N) Hospital size <200 beds 3999 (2338-6568) 62 200-650 beds 11828 (10506-14486) 26 >650 beds 40349 (28701-47522) 7 Hospital category Primary 5125 (2432-7993) 37 Secondary 7608 (3547-11470) 40 Tertiary 27750 (17564-47522) 11 Specialised care 1271 (798-2874) 7 Ownership Public 7039 (3073-11871) 67 Private not for profit 6304 (4106-7902) 14 Private for profit 4042 (2000-7350) 14 Total CH 6455 (2950-11360) 95
21
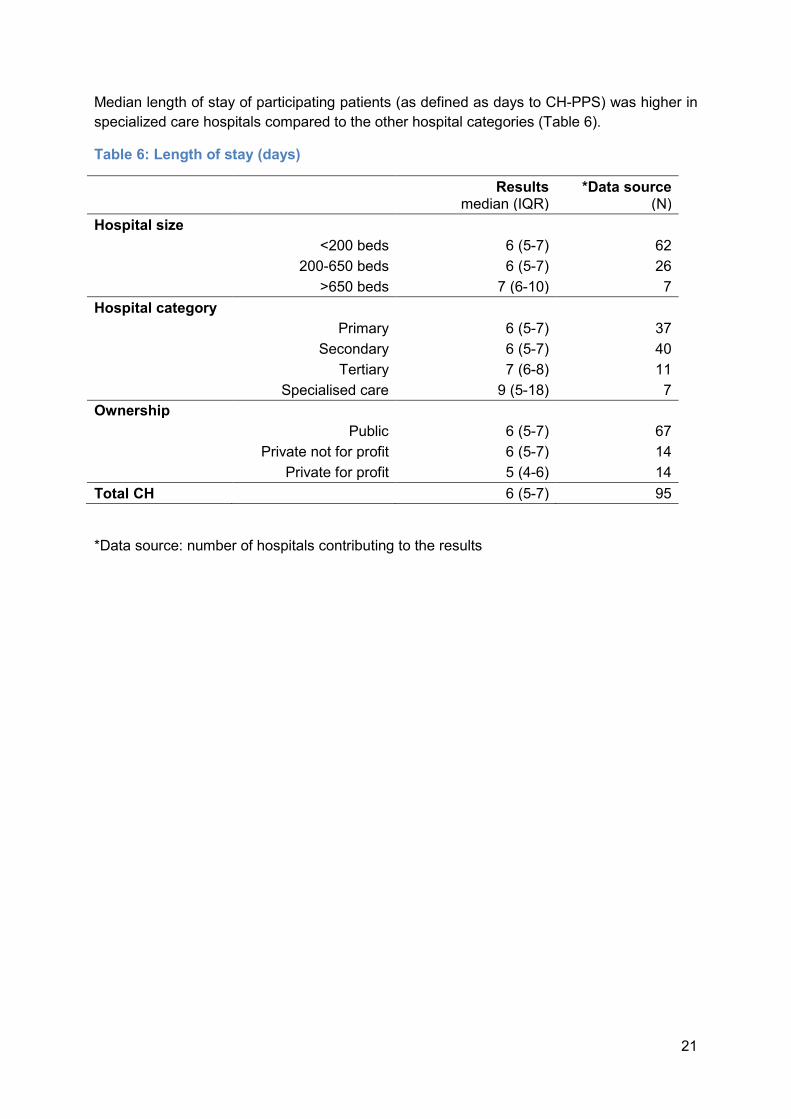
Median length of stay of participating patients (as defined as days to CH-PPS) was higher in specialized care hospitals compared to the other hospital categories (Table 6). Table 6: Length of stay (days)
*Data source: number of hospitals contributing to the results
Results median (IQR) *Data source (N) Hospital size <200 beds 6 (5-7) 62 200-650 beds 6 (5-7) 26 >650 beds 7 (6-10) 7 Hospital category Primary 6 (5-7) 37 Secondary 6 (5-7) 40 Tertiary 7 (6-8) 11 Specialised care 9 (5-18) 7 Ownership Public 6 (5-7) 67 Private not for profit 6 (5-7) 14 Private for profit 5 (4-6) 14 Total CH 6 (5-7) 95

22
B. Isolation capacity Tables 7 to 10 summarize the isolation capacity of hospitals, stratified by hospital size, hospital category, and ownership. Data on the number of hospital rooms and single rooms were provided only by 40 and 41 hospitals, respectively. This limits generalisability for Switzerland. Table 7: Hospital rooms
*Data source: number of hospitals contributing to the results
Results mean (95%CI) *Data source (N) Hospital size <200 beds 52 (41-64) 26 200-650 beds 157 (101-212) 12 >650 beds 412 (NA) 2 Hospital category Primary 60 (40-81) 15 Secondary 111 (63-159) 16 Tertiary 246 (24-467) 5 Specialised care 39 (7-70) 4 Ownership Public 124 (70-179) 23 Private not for profit 76 (39-112) 10 Private for profit 64 (27-101) 7 Total CH 102 (69-135) 40
23
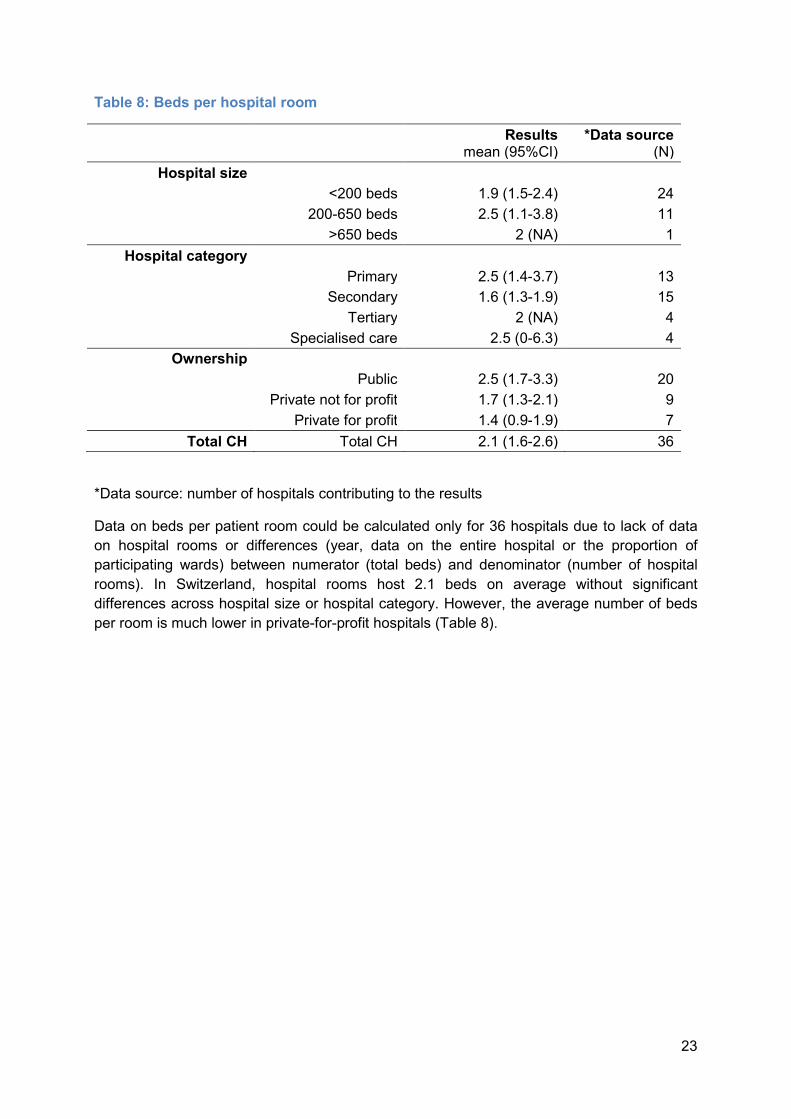
Table 8: Beds per hospital room
*Data source: number of hospitals contributing to the results Data on beds per patient room could be calculated only for 36 hospitals due to lack of data on hospital rooms or differences (year, data on the entire hospital or the proportion of participating wards) between numerator (total beds) and denominator (number of hospital rooms). In Switzerland, hospital rooms host 2.1 beds on average without significant differences across hospital size or hospital category. However, the average number of beds per room is much lower in private-for-profit hospitals (Table 8).
Results mean (95%CI) *Data source (N) Hospital size <200 beds 1.9 (1.5-2.4) 24 200-650 beds 2.5 (1.1-3.8) 11 >650 beds 2 (NA) 1
Hospital category Primary 2.5 (1.4-3.7) 13 Secondary 1.6 (1.3-1.9) 15 Tertiary 2 (NA) 4 Specialised care 2.5 (0-6.3) 4 Ownership Public 2.5 (1.7-3.3) 20 Private not for profit 1.7 (1.3-2.1) 9 Private for profit 1.4 (0.9-1.9) 7
Total CH Total CH 2.1 (1.6-2.6) 36
24
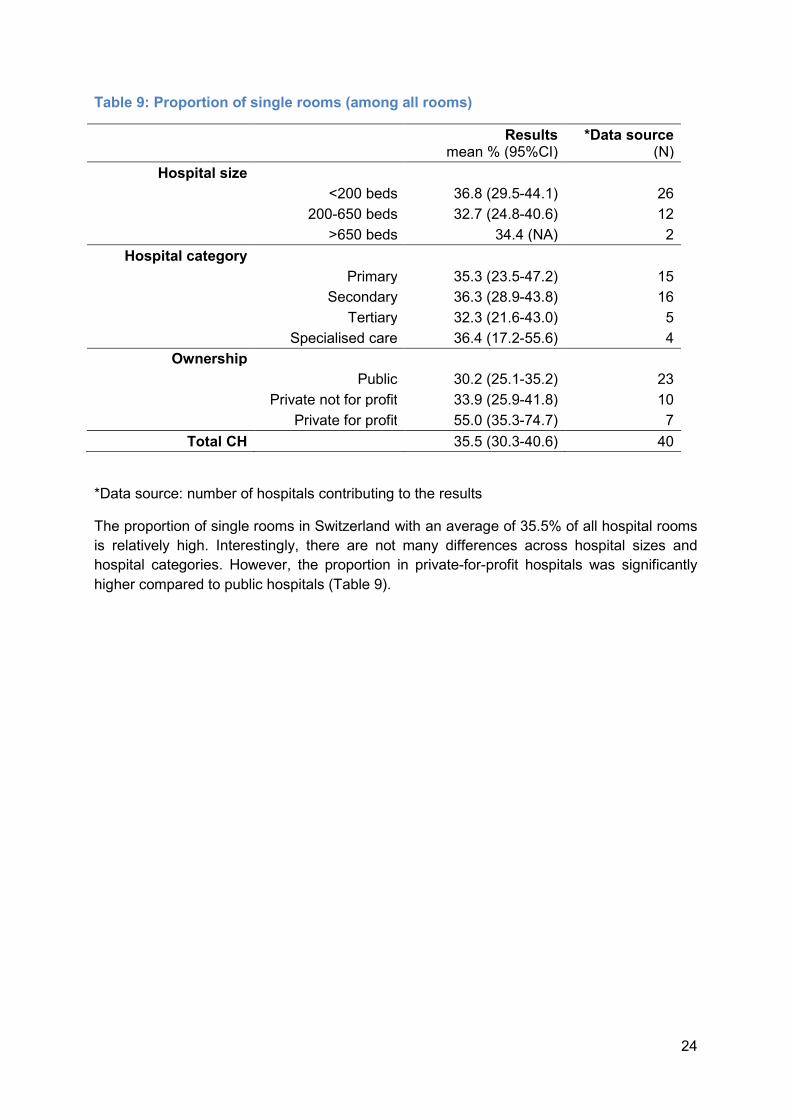
Table 9: Proportion of single rooms (among all rooms)
*Data source: number of hospitals contributing to the results
The proportion of single rooms in Switzerland with an average of 35.5% of all hospital rooms is relatively high. Interestingly, there are not many differences across hospital sizes and hospital categories. However, the proportion in private-for-profit hospitals was significantly higher compared to public hospitals (Table 9).
Results mean % (95%CI) *Data source (N) Hospital size <200 beds 36.8 (29.5-44.1) 26 200-650 beds 32.7 (24.8-40.6) 12 >650 beds 34.4 (NA) 2
Hospital category Primary 35.3 (23.5-47.2) 15 Secondary 36.3 (28.9-43.8) 16 Tertiary 32.3 (21.6-43.0) 5 Specialised care 36.4 (17.2-55.6) 4 Ownership Public 30.2 (25.1-35.2) 23 Private not for profit 33.9 (25.9-41.8) 10 Private for profit 55.0 (35.3-74.7) 7
Total CH 35.5 (30.3-40.6) 40

25
Table 10: Proportion of single rooms with toilet and shower (among single rooms)
*Data source: number of hospitals contributing to the results
Most single rooms in Switzerland are equipped with toilet and shower. Even in public hospitals, this proportion is around 80%; in private-for-profit hospitals, almost all single rooms are equipped with individual toilet and shower.
Results mean % (95%CI) *Data source (N) Hospital size <200 beds 83.9 (74.4-93.4) 27 200-650 beds 86.6 (75.5-97.7) 12 >650 beds 90.5 (NA) 2
Hospital category Primary 87.3 (76.4-98.1) 16 Secondary 83.8 (75.0-92.5) 16 Tertiary 75.5 (22.7-100.0) 5 Specialised care 92.9 (79.7-100.0) 4 Ownership Public 80.5 (69.5-91.5) 23 Private not for profit 87.7 (78.1-97.3) 10 Private for profit 94.6 (82.8-100.0) 8
Total CH 85.0 (78.2-91.8) 41

26
C. Staffing, workload, bed occupation Staffing (at the frontline) adapted to the acuity of care has been shown to be associated with fewer HAIs. High bed occupation was shown to have a negative impact on the transmission of multidrug-resistant organisms (MDROs).18 Tables 11 to 14 summarize nurse-to-bed ratio for the entire hospital and the ICU both for registered nurses and nursing assistants. The data are stratified by hospital size, hospital type, and ownership. Table 11: Nurses per 100 hospital beds
*Data source: number of hospitals contributing to the results
Large size and tertiary care hospitals show the most favorable nurse-to-bed ratio. Interestingly, private-for-profit hospitals have (non-significant) lower ratios for registered nurses, but higher ratios for nursing assistants (Table 12).
Results mean (95%CI) *Data source (N) Hospital size <200 beds 95.4 (84.0-106.8) 60 200-650 beds 113.7 (88.0-139.4) 22 >650 beds 132.8 (86.1-179.6) 6 Hospital category Primary 93.3 (76.2-110.3) 36 Secondary 102.7 (88.8-116.6) 36 Tertiary 142.3 (110.1-174.5) 10 Specialised care 90.7 (22.8-158.5) 6 Ownership Public 105.6 (92.7-118.6) 63 Private not for profit 96.5 (75.5-117.4) 11 Private for profit 93.3 (65.3-121.3) 14 Total CH 102.5 (92.2-112.8) 88

27
Table 12: Nursing assistants per 100 hospital beds
*Data source: number of hospitals contributing to the results
Table 13: ICU nurses per ICU bed
*Data source: number of hospitals contributing to the results Large size and tertiary care hospitals show the most favorable nurse-to-bed ratio in the ICU. Employment of nursing assistants in this area is low and there are only a few differences.
Results mean (95%CI) *Data source (N) Hospital size <200 beds 24.8 (19.8-29.7) 58 200-650 beds 18.2 (10.7-25.6) 20 >650 beds 24.5 (7.6-41.4) 6 Hospital category Primary 23.8 (17.0-30.6) 33 Secondary 22.3 (17.1-27.5) 35 Tertiary 19.2 (7.5-30.9) 10 Specialised care 31.3 (0.0-63.5) 6 Ownership Public 22.0 (17.5-26.5) 59 Private not for profit 23.1 (9.9-36.3) 11 Private for profit 28.1 (16.0-40.3) 14 Total CH 23.2 (19.2-27.1) 84
Results mean (95%CI) *Data source (N) Hospital size <200 beds 3.1 (2.9-3.4) 26 200-650 beds 3.5 (2.8-4.2) 20 >650 beds 4.6 (2.6-6.7) 6 Hospital category Primary 3.1 (2.6-3.5) 16 Secondary 3.6 (3.0-4.1) 24 Tertiary 3.9 (2.6-5.2) 10 Specialised care 3.2 (0.0-11.4) 2 Ownership Public 3.6 (3.1-4.0) 40 Private not for profit 2.9 (2.4-3.4) 7 Private for profit 3.3 (2.6-4.1) 5 Total CH 3.5 (3.1-3.8) 52

28
Table 14: ICU nursing assistant per ICU bed
*Data source: number of hospitals contributing to the results
Table 15: Ward occupation at midnight
*Data source: number of hospitals contributing to the results
Ward occupation corresponds to the number of hospital beds occupied at midnight on the day of survey (or any day during data collection if longer than one day). This variable was
Results mean (95%CI) *Data source (N) Hospital size <200 beds 0.4 (0.3-0.5) 26 200-650 beds 0.3 (0.2-0.4) 17 >650 beds 0.7 (0.2-1.2) 6 Hospital category Primary 0.4 (0.2-0.5) 14 Secondary 0.4 (0.3-0.5) 24 Tertiary 0.5 (0.1-0.9) 9 Specialised care 0.7 (NA) 2 Ownership Public 0.4 (0.3-0.5) 38 Private not for profit 0.4 (0.2-0.6) 6 Private for profit 0.4 (0.2-0.6) 5 Total CH 0.4 (0.3-.05) 49
Results mean % (95%CI) *Data source (N) Hospital size <200 beds 81.7 (74.1-89.4) 25 200-650 beds 86.6 (77.4-95.7) 10 >650 beds 91.7 (NA) 2 Hospital category Primary 76.2 (64.8-87.6) 14 Secondary 89.8 (83.3-96.3) 14 Tertiary 85.8 (68.8-100) 5 Specialised care 84.7 (49.9-100) 4 Ownership Public 82.7 (74.8-90.5) 7 Private not for profit 82.2 (69.8-94.6) 9 Private for profit 88.1 (71.0-100) 21 Total CH 83.6 (78.0-89.2) 37

29
collected separately due to the criteria to include or exclude patients in the survey. Data are available only for a third of participating hospitals. Occupation is highest in large size and in private-for-profit hospitals.
D. Hand hygiene Hand hygiene (HH) is considered the most important action in HAI prevention. As an isolated measure, its association has been shown only in a small number of studies. However, HH is part of all bundle or multimodal prevention programmes, and thus, contributes to the overall effectiveness of such strategies. HH can be measured by direct observation or by calculating consumption of alcohol-based handrub (ABHR). The European FP7 project PROHIBIT (Prevention of hospital infections by intervention and training, https://plone.unige.ch/prohibit/) found a median hospital-wide handrub consumption of 21 mL per patient-day in 232 European hospitals.19 The first ECDC-PPS found an average of 19 ml per patient-day. The purpose of the CH-PPS was to obtain both data on hand rubbing (ABHR consumption), and data on investing in HH promotion (number of observed HH opportunities) per year. Table 16: Alcohol-based handrub consumption
*Data source: number of hospitals contributing to the results
Data on ABHR consumption were obtained by 83 hospitals, most frequently based on pharmacy data, either ordered or delivered. Formally, we asked for Liters per 1000 patient-days; however, this ratio is identical to mL per patient-day (as reported by PROHIBIT and the ECDC-PPS). Tertiary care hospitals consume more ABHR than other hospitals, as do private-for-profit hospitals compared to other hospitals.
Results mean liters/1000 patient-days (95%CI) *Data source (N)
Hospital size <200 beds 48.9 (39.6-58.3) 55 200-650 beds 60.2 (47.9-72.6) 23 >650 beds 57.6 (14.6-100.0) 5 Hospital category Primary 44.3 (37.5-51.1) 33 Secondary 49.4 (41.6-57.2) 35 Tertiary 82.0 (57.4-106.6) 9 Specialised care 72.5 (0-165.4) 6 Ownership Public 51.8 (45.3-58.3) 60 Private not for profit 44.7 (26.9-62.6) 11 Private for profit 63.6 (23.7-103.5) 12 Total CH 52.6 (45.3-59.8) 83
30
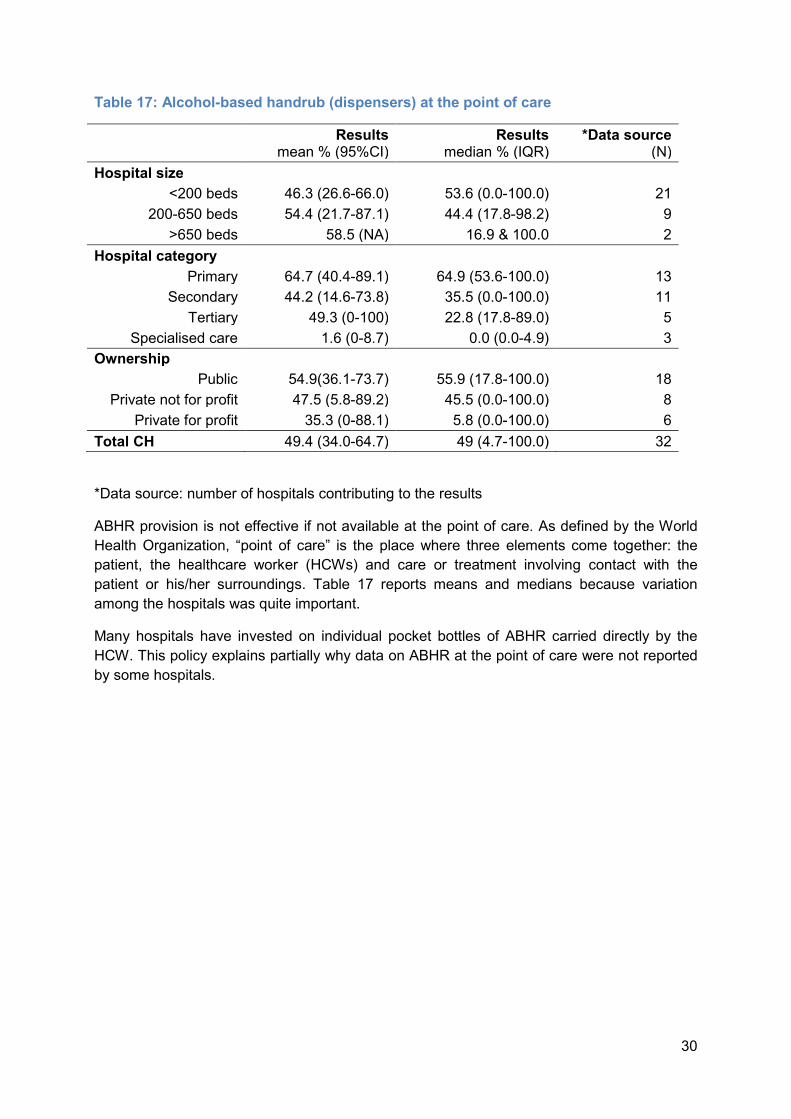
Table 17: Alcohol-based handrub (dispensers) at the point of care
*Data source: number of hospitals contributing to the results
ABHR provision is not effective if not available at the point of care. As defined by the World Health Organization, “point of care” is the place where three elements come together: the patient, the healthcare worker (HCWs) and care or treatment involving contact with the patient or his/her surroundings. Table 17 reports means and medians because variation among the hospitals was quite important. Many hospitals have invested on individual pocket bottles of ABHR carried directly by the HCW. This policy explains partially why data on ABHR at the point of care were not reported by some hospitals.
Results mean % (95%CI) Results median % (IQR) *Data source (N) Hospital size <200 beds 46.3 (26.6-66.0) 53.6 (0.0-100.0) 21 200-650 beds 54.4 (21.7-87.1) 44.4 (17.8-98.2) 9 >650 beds 58.5 (NA) 16.9 & 100.0 2 Hospital category Primary 64.7 (40.4-89.1) 64.9 (53.6-100.0) 13 Secondary 44.2 (14.6-73.8) 35.5 (0.0-100.0) 11 Tertiary 49.3 (0-100) 22.8 (17.8-89.0) 5 Specialised care 1.6 (0-8.7) 0.0 (0.0-4.9) 3 Ownership Public 54.9(36.1-73.7) 55.9 (17.8-100.0) 18 Private not for profit 47.5 (5.8-89.2) 45.5 (0.0-100.0) 8 Private for profit 35.3 (0-88.1) 5.8 (0.0-100.0) 6 Total CH 49.4 (34.0-64.7) 49 (4.7-100.0) 32
31
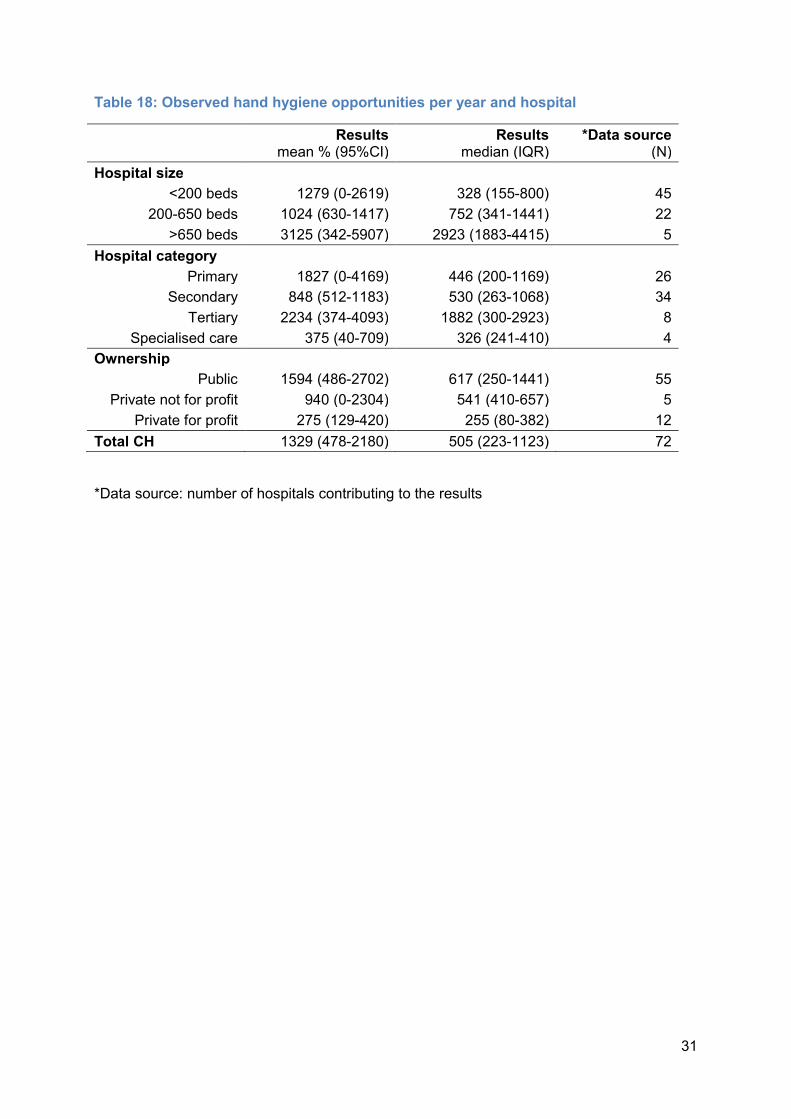
Table 18: Observed hand hygiene opportunities per year and hospital
*Data source: number of hospitals contributing to the results
Results mean % (95%CI) Results median (IQR) *Data source (N) Hospital size <200 beds 1279 (0-2619) 328 (155-800) 45 200-650 beds 1024 (630-1417) 752 (341-1441) 22 >650 beds 3125 (342-5907) 2923 (1883-4415) 5 Hospital category Primary 1827 (0-4169) 446 (200-1169) 26 Secondary 848 (512-1183) 530 (263-1068) 34 Tertiary 2234 (374-4093) 1882 (300-2923) 8 Specialised care 375 (40-709) 326 (241-410) 4 Ownership Public 1594 (486-2702) 617 (250-1441) 55 Private not for profit 940 (0-2304) 541 (410-657) 5 Private for profit 275 (129-420) 255 (80-382) 12 Total CH 1329 (478-2180) 505 (223-1123) 72
32
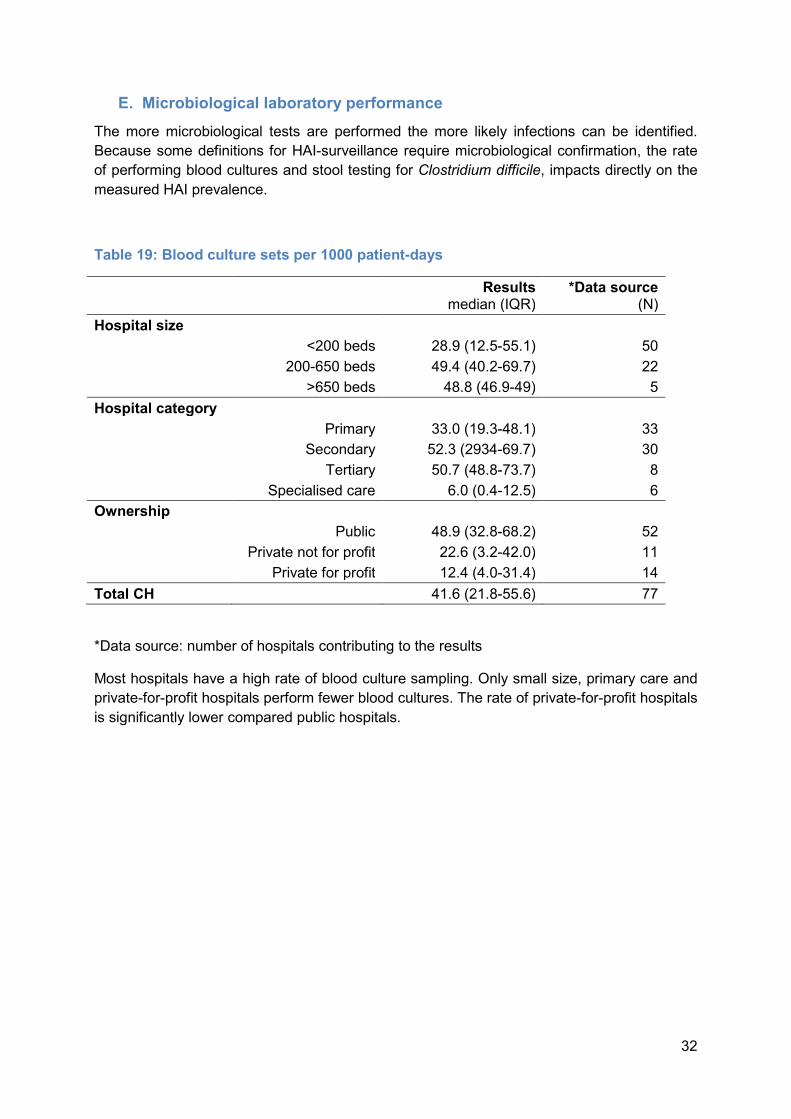
E. Microbiological laboratory performance The more microbiological tests are performed the more likely infections can be identified. Because some definitions for HAI-surveillance require microbiological confirmation, the rate of performing blood cultures and stool testing for Clostridium difficile, impacts directly on the measured HAI prevalence. Table 19: Blood culture sets per 1000 patient-days
*Data source: number of hospitals contributing to the results
Most hospitals have a high rate of blood culture sampling. Only small size, primary care and private-for-profit hospitals perform fewer blood cultures. The rate of private-for-profit hospitals is significantly lower compared public hospitals.
Results median (IQR) *Data source (N) Hospital size <200 beds 28.9 (12.5-55.1) 50 200-650 beds 49.4 (40.2-69.7) 22 >650 beds 48.8 (46.9-49) 5 Hospital category Primary 33.0 (19.3-48.1) 33 Secondary 52.3 (2934-69.7) 30 Tertiary 50.7 (48.8-73.7) 8 Specialised care 6.0 (0.4-12.5) 6 Ownership Public 48.9 (32.8-68.2) 52 Private not for profit 22.6 (3.2-42.0) 11 Private for profit 12.4 (4.0-31.4) 14 Total CH 41.6 (21.8-55.6) 77

33
Table 20: Stool tests for identifying Clostridium difficile infections per 1000 patient-days
*Data source: number of hospitals contributing to the results
There is no difference in school testing for Clostridium difficile among hospital sizes and hospital types. Only private-for-profit hospitals perform less testing. Availability of microbiological service also on weekends is important to manage isolation precaution measures. If screening tests are not reported, patients remain too long in isolation or may not be isolated at first place. Table 21: Microbiological tests on weekends
Clinical tests Screening tests Saturday 87/96 (90.6%) 84/96 (87.5%) Sunday 76/96 (79.2%) 72/96 (75.0%) Saturday and Sunday 76/96 (79.2%) 72/96 (75.0%) All hospitals provided information to this question. There is no difference between clinical tests and screening tests; however, reporting is less common on Sundays than on Saturdays.
Results median (IQR) *Data source (N) Hospital size <200 beds 4.7 (1.8-6.4) 48 200-650 beds 5.3 (3.6-5.8) 22 >650 beds 4.8 (4.6-8.5) 5 Hospital category Primary 4.7 (2.6-6.1) 32 Secondary 5.5 (3.9-6.4) 30 Tertiary 5.3 (4.6-7.5) 8 Specialised care 2.6 (2-2.6) 5 Ownership Public 5.5 (4.3-6.4) 52 Private not for profit 2.3 (0.6-3.2) 11 Private for profit 1.3 (0.5-5.4) 12 Total CH 5 (2.3-6.2) 75

34
F. Post-prescription review of antimicrobials Nine of the 96 hospitals (9.4%) have post-prescription review at 72 hours either in the entire hospital (3), in the ICU (3), or elsewhere (3). The Ostschweizer Kinderspital is the only tertiary care hospital with a post-prescription review of antimicrobials. No other tertiary care or large size hospital reported to have such review formally established. The nine hospitals with the post-prescription review are primary and secondary care, small size and medium size hospitals.
G. Organisation of infection prevention and control Annual plans in IPC help to set priorities and targets both to improve quality and to save resources. In order to be effective, an annual plan should be produced by the IPC but approved by the hospital management. Table 22: Infection Prevention and Control – Annual plan
*Data source: number of hospitals contributing to the results
Annual plans for IPC are produced predominantly in large size hospitals.
Results mean % (95%CI) *Data source (N) Hospital size <200 beds 52.4 (39.7-65.1) 63 200-650 beds 46.2 (25.6-66.7) 26 >650 beds 85.750.8-100.0) 7 Hospital category Primary 47.4 (30.7-64.0) 38 Secondary 57.541.5-73.5) 40 Tertiary 45.5 (10.4-80.5) 11 Specialised care 71.426.3-100.0) 7 Ownership Public 57.4 (45.3-69.4) 68 Private not for profit 35.7 (7.0-64.4) 14 Private for profit 50.0 (20.0-80.0) 14 Total CH 53.1 (43.0-63.3) 96
35
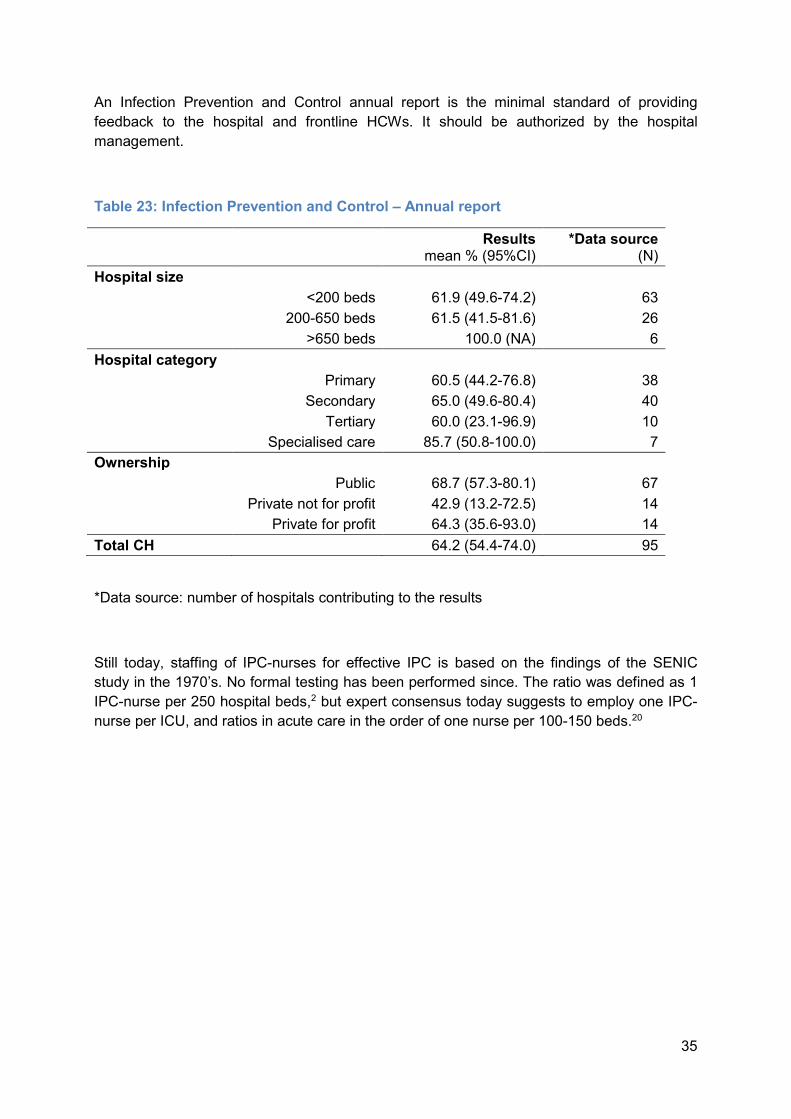
An Infection Prevention and Control annual report is the minimal standard of providing feedback to the hospital and frontline HCWs. It should be authorized by the hospital management. Table 23: Infection Prevention and Control – Annual report
*Data source: number of hospitals contributing to the results Still today, staffing of IPC-nurses for effective IPC is based on the findings of the SENIC study in the 1970’s. No formal testing has been performed since. The ratio was defined as 1 IPC-nurse per 250 hospital beds,2 but expert consensus today suggests to employ one IPC-nurse per ICU, and ratios in acute care in the order of one nurse per 100-150 beds.20
Results mean % (95%CI) *Data source (N) Hospital size <200 beds 61.9 (49.6-74.2) 63 200-650 beds 61.5 (41.5-81.6) 26 >650 beds 100.0 (NA) 6 Hospital category Primary 60.5 (44.2-76.8) 38 Secondary 65.0 (49.6-80.4) 40 Tertiary 60.0 (23.1-96.9) 10 Specialised care 85.7 (50.8-100.0) 7 Ownership Public 68.7 (57.3-80.1) 67 Private not for profit 42.9 (13.2-72.5) 14 Private for profit 64.3 (35.6-93.0) 14 Total CH 64.2 (54.4-74.0) 95

36
Table 24: Infection Prevention and Control nurse – Full time equivalent per 250 beds
*Data source: number of hospitals contributing to the results FTE: full-time equivalent With 1.5 IPC nurse per 250 beds, Switzerland has a more favorable ratio than identified in the TRICE (Training in infection control) surveillance by the ECDC that found an average of 1 IPC nurse per 250 beds in Europe.21, 22
Results mean (95%CI) *Data source (N) Hospital size <200 beds 1.6 (1.1-2.0) 63 200-650 beds 1.3 (1.0-1.6) 26 >650 beds 1.3 (0.8-1.7) 7 Hospital category Primary 1.2 (0.9-1.5) 38 Secondary 1.5 (1.2-1.8) 40 Tertiary 1.4 (0.9-1.8) 11 Specialised care 3.0 (0.0-7.1) 7 Ownership Public 1.3 (1.1-1.5) 68 Private not for profit 1.6 (1.1-2.2) 14 Private for profit 2.3 (0.5-4.1) 14 Total CH Total CH 1.5 (1.2-1.8) 96

37
There is no consensus about the ratio of IPC doctors per hospital beds. While the original SENIC study suggested that a hospital should have at least one doctor with some IPC training, there is some agreement that 1 doctor per 1000 beds is preferred. Table 25: Infection Prevention and Control doctor – Full time equivalent per 1000 beds
*Data source: number of hospitals contributing to the results FTE: full-time equivalent Hospitals providing specialized care and private-for-profit hospitals have lower IPC doctor to hospital bed ratios compared to other hospitals.
Results mean (95%CI) *Data source (N) Hospital size <200 beds 1.2 (0.6-1.8) 63 200-650 beds 5.7 (0.0-13.0) 26 >650 beds 2.3 (1.3-3.3) 7 Hospital category Primary 4.0 (0.0-8.9) 38 Secondary 1.2 (0.7-1.7) 40 Tertiary 3.5 (0.6-6.3) 11 Specialised care 0.4 (0.0-1.5) 7 Ownership Public 2.8 (0.1-5.5) 68 Private not for profit 2.9 (0.4-5.5) 14 Private for profit 0.4 (0.1-0.8) 14 Total CH 2.5 (0.6-4.4) 96

38
Table 26: Antimicrobial stewardship – Full time equivalent per hospital
*Data source: number of hospitals contributing to the results **One hospital with 0.1 FTE antibiotic stewardship FTE: full-time equivalent In a time of emerging microbiological resistance, judicious use of antimicrobials is key to offer effective antimicrobial treatment in the future. Antimicrobial prescription in hospitals must be rational and based on best practice. Given that antimicrobials are prescribed by most doctors seeing patients, their use must be monitored and inappropriate use minimised. This task should formally be allocated to an antimicrobial stewardship consultant for optimal results. In the CH-PPS we were interested to know about such formal employment of antimicrobial stewardship consultants.
Results mean (95%CI) *Data source (N) Hospital size <200 beds 0.1 (0.1-0.2) 63 200-650 beds 1.7 (0.0-3.9) 26 >650 beds 2.6 (1.1-4.1) 7 Hospital category Primary 1.1 (0.0-2.6) 38 Secondary 0.2 (0.1-0.2) 40 Tertiary 2.0 (1.0-3.1) 11 **Specialised care 0.0 (0.0-0.0) 7 Ownership Public 0.9 (0.1-1.8) 68 Private not for profit 0.7 (0-1.3) 14 Private for profit 0.1 (0.0-0.1) 14 Total CH 0.8 (0.2-1.3) 96

39
Table 27: Surveillance activities
CH Hospital size Hospital type Outcome *All %
<200 % 200-650 % >650 % PRIM % SEC %
TERT % SPEC %
SSI 94.8 93.7 96.2 100.0 94.7 97.5 100.0 71.4 HAI in ICU 4.2 3.2 7.7 0.0 7.9 2.5 0.0 0.0
CDI 10.4 7.9 7.7 42.9 10.5 7.5 27.3 0.0 AMR 59.4 57.1 57.7 85.7 57.9 60.0 81.8 28.6
AM-use 44.8 36.5 50.0 100.0 36.8 52.5 72.7 0.0 *Data from all 96 hospitals
AM-use: consumption of antimicrobials; AMR: antimicrobial resistance; CDI: Clostridium difficile infection; HAI: healthcare-associated infection; PRIM: primary care; SEC: secondary care; SPEC: special care; SSI: surgical site infection; TERT: tertiary care
This table presents the percentage of hospitals participating in the aforementioned surveillance activities, either these activities are organized in a local or wider/national level. Some hospitals specified other surveillance activities:
- 12 hospitals in SG and TI: CleanHands - 18 hospitals in VD; 2 hospitals in NE; and 1 hospital in JU: cantonal surveillance of AMR, BSI, HAI-prevalence - 2 Hospitals in VS: Swissnoso intervention module Surveillance (with timely feedback and as part of a surveillance network) has been shown to be effective in HAI prevention.18 The coordination of outcome surveillance usually is done by the IPC team. In Switzerland, a number of national and international surveillance networks are available for hospitals: Swissnoso SSI-surveillance, ICU-HAI surveillance in the German KISS (Krankenhaus Infektions Surveillance System), AMR (antimicrobial resistance) with anresis, AM-use (Consumption of antimicrobials) with anresis and global antibiotic use networks, CDI-surveillance with KISS.23, 24 In the CH-PPS we addressed surveillance as part of a network. Hospitals still may have established local surveillance activities with prospective benchmarking rather than comparing the results with other hospitals.
40
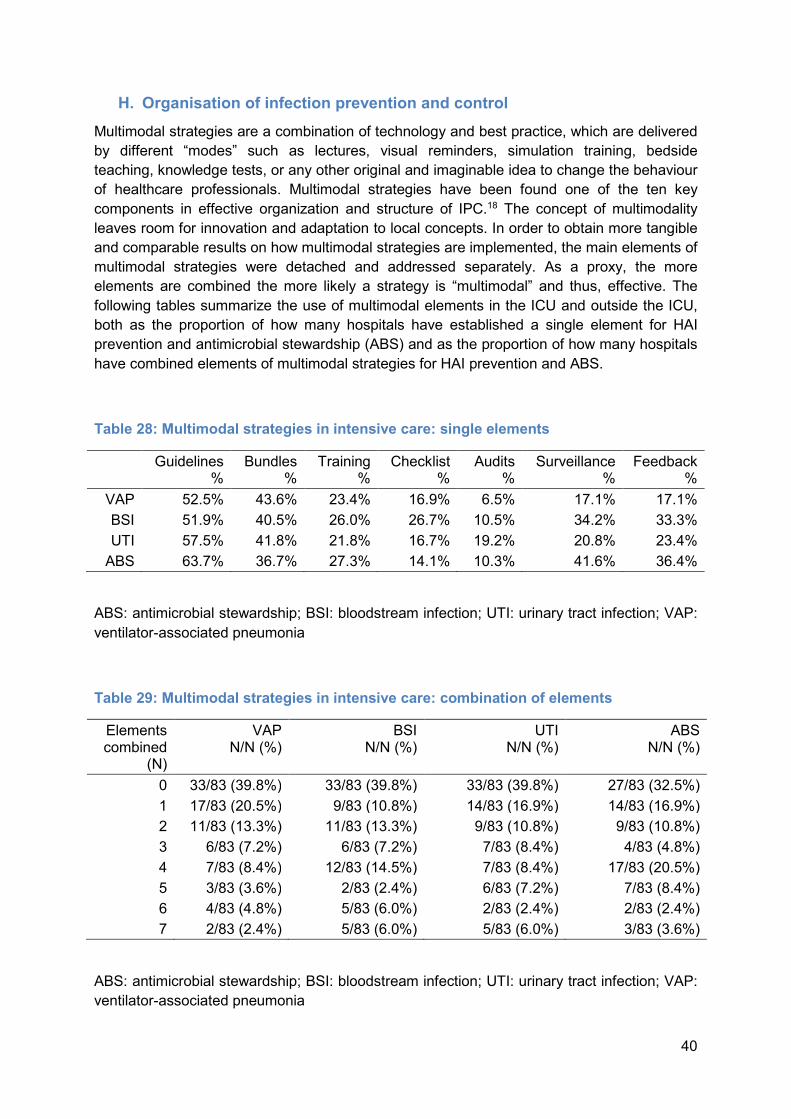
H. Organisation of infection prevention and control Multimodal strategies are a combination of technology and best practice, which are delivered by different “modes” such as lectures, visual reminders, simulation training, bedside teaching, knowledge tests, or any other original and imaginable idea to change the behaviour of healthcare professionals. Multimodal strategies have been found one of the ten key components in effective organization and structure of IPC.18 The concept of multimodality leaves room for innovation and adaptation to local concepts. In order to obtain more tangible and comparable results on how multimodal strategies are implemented, the main elements of multimodal strategies were detached and addressed separately. As a proxy, the more elements are combined the more likely a strategy is “multimodal” and thus, effective. The following tables summarize the use of multimodal elements in the ICU and outside the ICU, both as the proportion of how many hospitals have established a single element for HAI prevention and antimicrobial stewardship (ABS) and as the proportion of how many hospitals have combined elements of multimodal strategies for HAI prevention and ABS. Table 28: Multimodal strategies in intensive care: single elements
Guidelines % Bundles % Training % Checklist % Audits % Surveillance % Feedback % VAP 52.5% 43.6% 23.4% 16.9% 6.5% 17.1% 17.1% BSI 51.9% 40.5% 26.0% 26.7% 10.5% 34.2% 33.3% UTI 57.5% 41.8% 21.8% 16.7% 19.2% 20.8% 23.4% ABS 63.7% 36.7% 27.3% 14.1% 10.3% 41.6% 36.4%
ABS: antimicrobial stewardship; BSI: bloodstream infection; UTI: urinary tract infection; VAP: ventilator-associated pneumonia
Table 29: Multimodal strategies in intensive care: combination of elements
Elements combined (N) VAP N/N (%) BSI N/N (%) UTI N/N (%) ABS N/N (%)
0 33/83 (39.8%) 33/83 (39.8%) 33/83 (39.8%) 27/83 (32.5%) 1 17/83 (20.5%) 9/83 (10.8%) 14/83 (16.9%) 14/83 (16.9%) 2 11/83 (13.3%) 11/83 (13.3%) 9/83 (10.8%) 9/83 (10.8%) 3 6/83 (7.2%) 6/83 (7.2%) 7/83 (8.4%) 4/83 (4.8%) 4 7/83 (8.4%) 12/83 (14.5%) 7/83 (8.4%) 17/83 (20.5%) 5 3/83 (3.6%) 2/83 (2.4%) 6/83 (7.2%) 7/83 (8.4%) 6 4/83 (4.8%) 5/83 (6.0%) 2/83 (2.4%) 2/83 (2.4%) 7 2/83 (2.4%) 5/83 (6.0%) 5/83 (6.0%) 3/83 (3.6%) ABS: antimicrobial stewardship; BSI: bloodstream infection; UTI: urinary tract infection; VAP: ventilator-associated pneumonia

41
Table 30: Multimodal strategies outside intensive care: single elements
Guidelines %
Bundles % Training % Checklist % Audits % Surveillance % Feedback % PN 37.9% 23.3% 14.0% 4.5% 4.3% 5.5% 6.5% BSI 49.5% 33.3% 20.4% 13.6% 9.8% 30.8% 30.8% SSI 71.3% 68.8% 27.7% 32.3% 40.4% 88.2% 83.0% UTI 63.4% 47.3% 29.3% 21.1% 21.5% 22.8% 24.2% ABS 70.5% 37.2% 30.8% 15.2% 10.8% 41.3% 38.2% ABS: antimicrobial stewardship; BSI: bloodstream infection; PN: pneumonia; SSI: surgical site infection; UTI: urinary tract infection
Table 31: Multimodal strategies outside intensive care: combination of elements
EC (N) PN N/N (%) BSI N/N (%) SSI N/N (%) UTI N/N (%) ABS N/N (%) 0 45/95 (47.4%) 30/95 (31.6%) 7/95 (7.4%) 26/95 (27.4%) 21/95 (22.1%) 1 27/95 (28.4%) 22/95 (23.2%) 4/95 (4.2%) 23/95 (24.2%) 20/95 (21.1%) 2 13/95 (13.7%) 12/95 (12.6%) 10/95 (10.5%) 11/95 (11.6%) 14/95 (14.7%) 3 6/95 (6.3%) 13/95 (13.7%) 11/95 (11.6%) 6/95 (6.3%) 8/95 (8.4%) 4 3/95 (3.2%) 9/95 (9.5%) 21/95 (22.1%) 9/95 (9.5%) 17/95 (17.9%) 5 0/95 (0.0%) 4/95 (4.2%) 22/95 (23.2%) 12/95 (12.6%) 7/95 (7.4%) 6 1/95 (1.1%) 3/95 (3.2%) 6/95 (6.3%) 3/95 (3.2%) 5/95 (5.3%) 7 0/95 (0.0%) 2/95 (2.1%) 14/95 (14.7%) 5/95 (5.3%) 3/95 (3.2%) ABS: antimicrobial stewardship; BSI: bloodstream infection; EC: number of combined elements; PN: pneumonia; SSI: surgical site infection; UTI: urinary tract infection

42
2. Patient level data
A. Patient characteristics A total of 12’931 patients were included by the 96 hospitals participating in the CH-PPS. Patient data were collected using an individual patient form (ECDC standard protocol) that includes demographic information, data on risk factors for HAI, data on AU, HAI, and microbiology. The following figures summarize patient indicators such as age, gender, McCabe score, length of stay (defined as days from admission to CH-PPS), ward speciality, and patient speciality. Figure 3: Patient age by hospital size
CH: Switzerland; IQR: interquartile range
0102030405060708090
100
Age
CH <200 200-650 >650
Age (Median, IQR) by Hospital Size

43
Figure 4: Patient by hospital type
CH: Switzerland; IQR: interquartile range; PRIM: primary care; SEC: secondary care; TERT: tertiary care; SPEC: specialized care
0102030405060708090
100
Age
CH PRIM SEC TERT SPEC
Age (Median, IQR) by Hospital Type
44
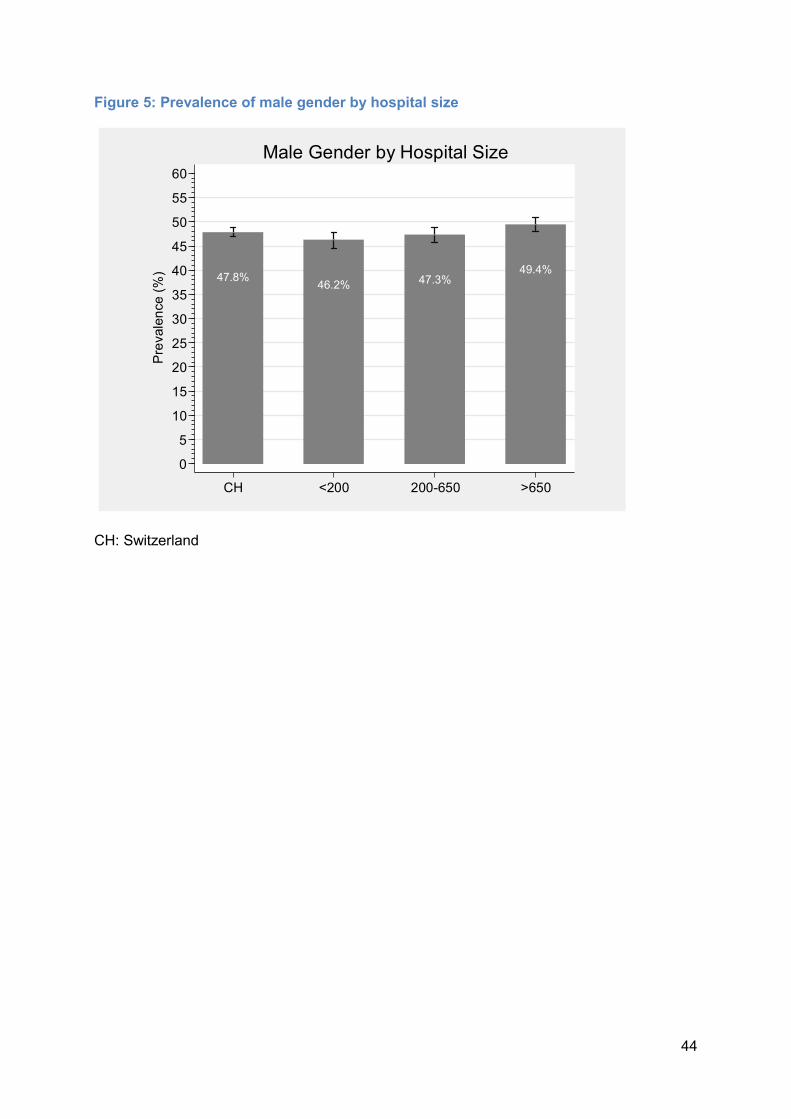
Figure 5: Prevalence of male gender by hospital size
CH: Switzerland
47.8% 46.2% 47.3% 49.4%
05
1015202530354045505560
Prevalen
ce (%)
CH <200 200-650 >650
Male Gender by Hospital Size

45
Figure 6: Prevalence of male gender by hospital type
CH: Switzerland; PRIM: primary care; SEC: secondary care; TERT: tertiary care; SPEC: specialized care
47.8% 46.0% 46.5% 49.4% 53.4%
05
1015202530354045505560
Prevalen
ce (%)
CH PRIM SEC TERT SPEC
Male Gender by Hospital Type

46
Figure 7: Patient McCabe score by hospital size
CH: Switzerland; McCabe score categories: rapidly fatal (grey): <1 year; ultimately fatal (light grey): 1-4 years; non-fatal (dark grey): >5 years Large size hospitals (>650 beds) had more patients with rapidly fatal disease than medium size or small size hospitals.
80.8
13.85.3
83.4
13.23.4
81.2
15.03.8
78.7
13.38.0
0102030405060708090
100
Distributi
on (%)
CH <200 200-650 >650
McCabe Score by Hospital Size
mean of non_fatal mean of ultimately_fatalmean of rapidly_fatal

47
Figure 8: Patient McCabe score by hospital type
CH: Switzerland; PRIM: primary care; SEC: secondary care; TERT: tertiary care; SPEC: specialized care; McCabe score categories: rapidly fatal (grey): <1 year; ultimately fatal (light grey): 1-4 years; non-fatal (dark grey): >5 years Tertiary care hospitals had more patients with rapidly fatal disease than primary care, secondary care or specialized care hospitals.
80.8
13.85.3
85.8
11.42.8
81.7
14.63.7
78.0
14.17.9
77.9
18.53.6
0102030405060708090
100
Distributi
on (%)
CH PRIM SEC TERT SPEC
McCabe Score by Hospital Type
mean of non_fatal mean of ultimately_fatalmean of rapidly_fatal
48
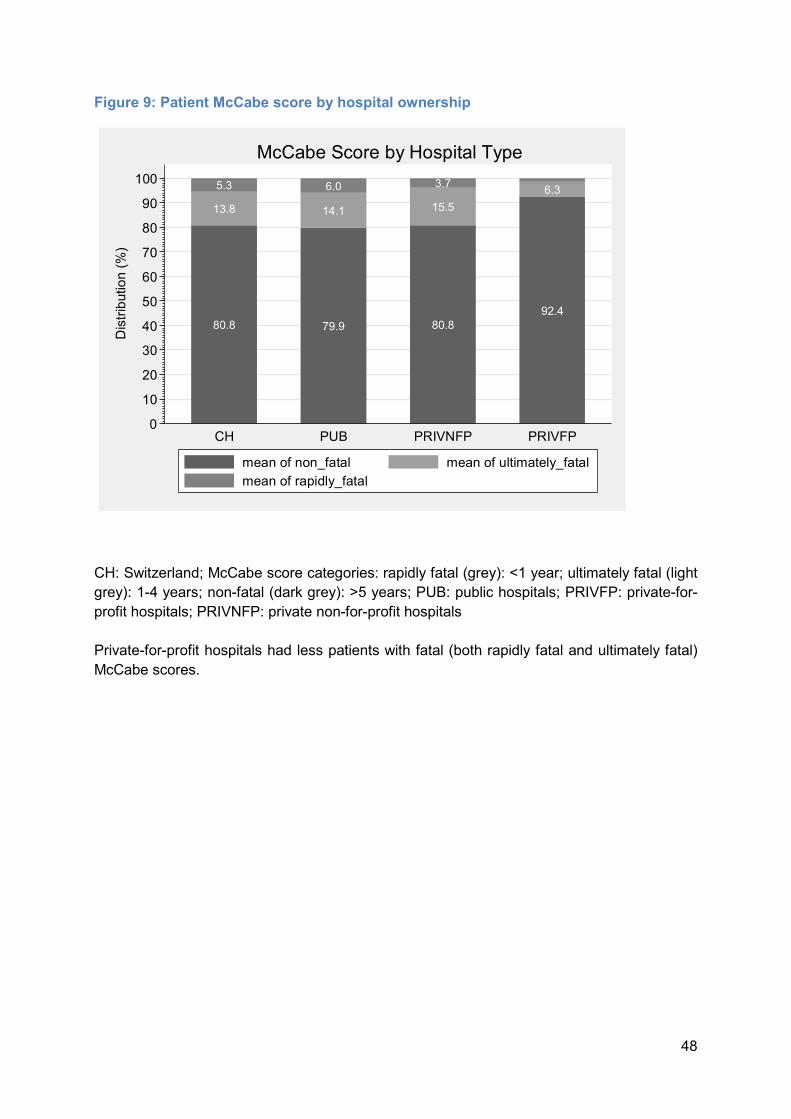
Figure 9: Patient McCabe score by hospital ownership
CH: Switzerland; McCabe score categories: rapidly fatal (grey): <1 year; ultimately fatal (light grey): 1-4 years; non-fatal (dark grey): >5 years; PUB: public hospitals; PRIVFP: private-for-profit hospitals; PRIVNFP: private non-for-profit hospitals Private-for-profit hospitals had less patients with fatal (both rapidly fatal and ultimately fatal) McCabe scores.
80.8
13.85.3
79.9
14.16.0
80.8
15.53.7
92.4
6.3
0102030405060708090
100
Distributi
on (%)
CH PUB PRIVNFP PRIVFP
McCabe Score by Hospital Type
mean of non_fatal mean of ultimately_fatalmean of rapidly_fatal

49
Figure 10: Length of stay to survey day
0.50: median quantile, censoring at 100 days The median length of stay (median quantile) of patients before PPS day was 5 days.
0.000.100.200.300.400.500.600.700.800.901.00
0 5 10 15 20 25 30 35 40 45 50 55 60 65 70 75 80 85 90 95 100Censored at day 100
Days to Point Prevalence Survey

50
Figure 11: Length of stay to survey day by hospital size
0.50: median quantile, censored at 100 days Patients hospitalized in large size hospitals (>650 beds) had longer stay (6.5 days) before PPS than patients in medium size or small size hospitals (3.5 days and 4 days, respectively).
0.000.100.200.300.400.500.600.700.800.901.00
0 5 10 15 20 25 30 35 40 45 50 55 60 65 70 75 80 85 90 95 100<200 200-650>650
Censored at day 100
Days to Point Prevalence Survey by Hospital Size

51
Figure 12: Length of stay to survey day by hospital type
0.50: median quantile, censored at 100 days PRIM: primary care; SEC: secondary care; TERT: tertiary care; SPEC: specialized care Patients in hospitals offering specialized care had longer stay before PPS (9 days) than patients in tertiary care (6 days) and primary/secondary care (4 days) hospitals.
0.000.100.200.300.400.500.600.700.800.901.00
0 5 10 15 20 25 30 35 40 45 50 55 60 65 70 75 80 85 90 95 100Primary care Secondary careSpecialised care Tertiary care
Censored at day 100
Days to Point Prevalence Survey by Hospital Type
52
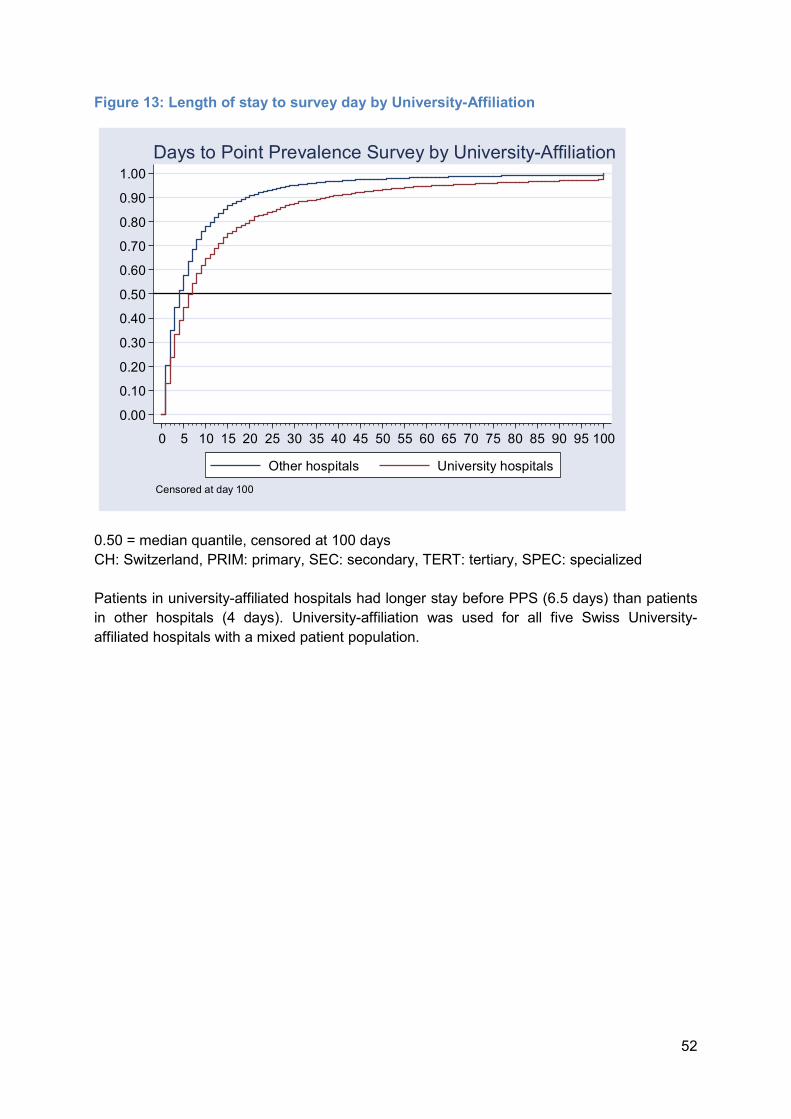
Figure 13: Length of stay to survey day by University-Affiliation
0.50 = median quantile, censored at 100 days CH: Switzerland, PRIM: primary, SEC: secondary, TERT: tertiary, SPEC: specialized Patients in university-affiliated hospitals had longer stay before PPS (6.5 days) than patients in other hospitals (4 days). University-affiliation was used for all five Swiss University-affiliated hospitals with a mixed patient population.
0.000.100.200.300.400.500.600.700.800.901.00
0 5 10 15 20 25 30 35 40 45 50 55 60 65 70 75 80 85 90 95 100Other hospitals University hospitals
Censored at day 100
Days to Point Prevalence Survey by University-Affiliation
53
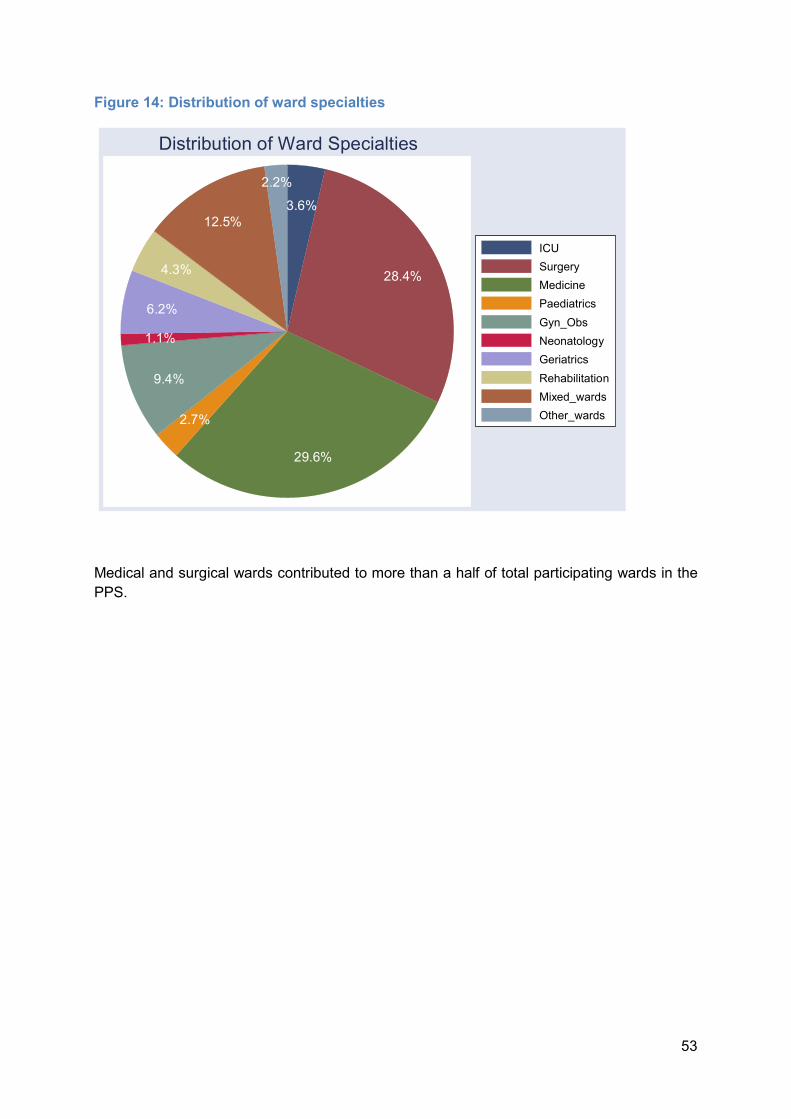
Figure 14: Distribution of ward specialties
Medical and surgical wards contributed to more than a half of total participating wards in the PPS.
3.6%
28.4%
29.6%2.7%
9.4%1.1%6.2%
4.3%12.5%
2.2%
ICUSurgeryMedicinePaediatricsGyn_ObsNeonatologyGeriatricsRehabilitationMixed_wardsOther_wards
Distribution of Ward Specialties

54
Figure 15: Distribution of patient specialties
Most patients were medical or surgical, accumulating to almost ¾ of the entire population.
4.1%
36.1%
36.3%
2.7%5.0%
2.9%2.4%5.6% 4.6%0.2%
ICUSurgeryMedicinePaediatricsObstetricsNewbornsGynaecologyGeriatricsRehabilitationOther_wards
Distribution of Patient Specialties

55
Figure 16: Use of medical devices
CVC: central venous catheter, PVC: peripheral venous catheter, UC: urinary catheter, VENT: ventilator Almost half of the patients had a peripheral venous catheter in place on the day of PPS.
10.5%
48.6%
16.4%
1.6%05
101520253035404550
Prevalen
ce (%)
CVC PVC UC VENTn(tot): total number of devices
Prevalence of Medical Devices

56
B. Healthcare-associated infections Healthcare-associated infections (HAIs) are one of the most common adverse events during hospital stay, resulting in substantial morbidity and mortality. HAI prevalence is defined as the number of patients presenting one or more HAIs on the day of PPS compared to the total number of patients included in the survey. The prevalence of HAI is reported in different formats: pooled all-cause HAI from all participating hospitals (96), HAI without taking into account infections attributed to other hospitals, all-cause HAI from a randomized subsample of participating hospitals (56), and validated HAI prevalence, taking into account the results of validation and case-mix. Table 17 summarizes the different HAI prevalence formats. Figure 17: HAI prevalence in Switzerland (with randomized and validated sample)
The figure reports the different HAI formats:
- All participating hospitals and patients (All HAI) - Randomized sample of hospitals and patients (All HAIr) - All participating hospitals and patients but excluding HAI attributed to other hospitals (HAI*) - Randomized sample of hospitals and patients but excluding HAI attributed to other hospitals (HAIr*) - Validated and adjusted HAI of all participating hospitals and patients (HAIv)
5.9% 5.4% 5.2% 4.6%
7.2%
0123456789
1011
Prevalen
ce (%)
All HAI All HAIr HAI* HAIr* HAIv*no HAIs from other hospitals; r: randomized sample, v: validated sample
HAI Prevalence in Switzerland

57
Figure 18: HAI prevalence by Canton
AG: Aargau; BE: Bern; BL: Basel-Landschaft; BS: Basel-Stadt; GE: Geneva; GR: Grisons; SG: St. Gallen; SO: Solothurn; TG: Thurgau; VD: Vaud; VS: Valais; ZH: Zürich This table reports HAI prevalence by cantons participating with three or more hospitals. Cantons with fewer hospitals are not included in this figure.
6.1%5.1% 5.6%
8.7%
5.6% 5.3%6.3%
3.6% 3.3%
5.4%
8.3%
6.5%
4.9%
0123456789
1011
Prevalen
ce (%)
AG BE BL BS GE GR SG SO TG TI VD VS ZH
HAI - prevalence by Canton

58
Figure 19: HAI prevalence by linguistic region
DE: German; FR: French; IT: Italian; HAI: healthcare-associated infection This figure summarizes patients with one or more HAI on the day of survey, stratified by language regions (Deutschschweiz, Romandie, Ticino).
5.7%6.5%
5.4%
01234567
Prevalen
ce (%)
DE FR IT
HAI - prevalence by Language Region
59
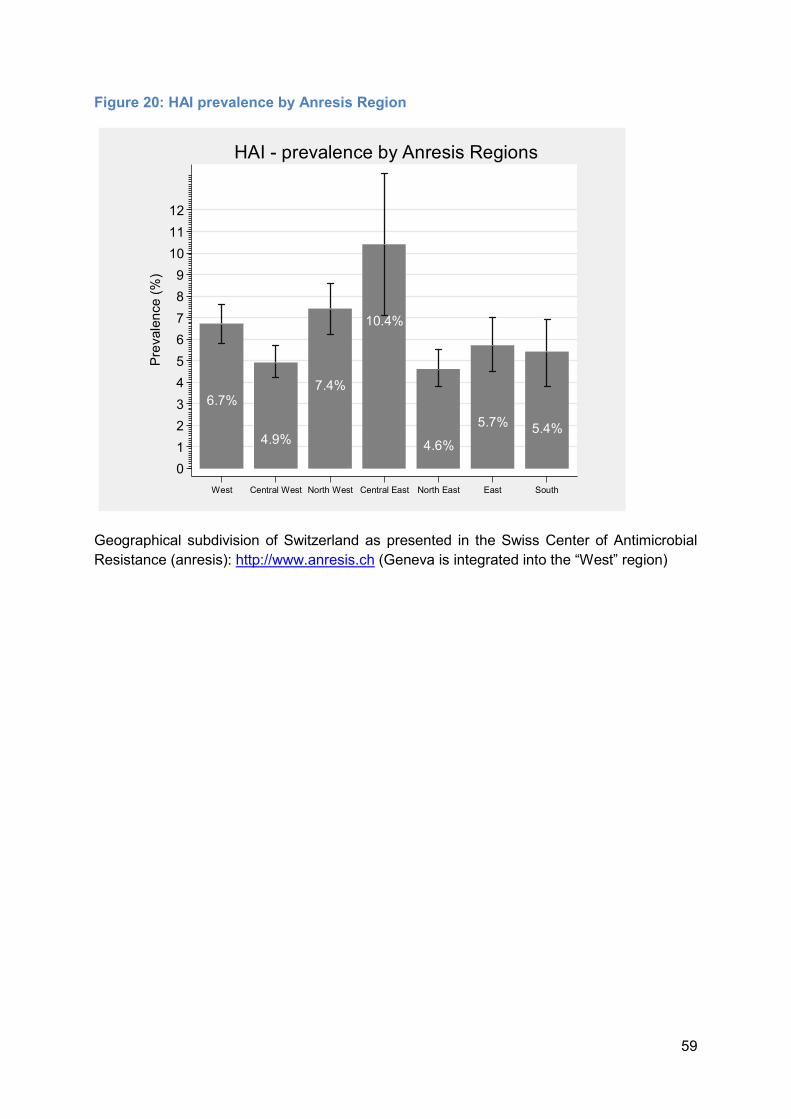
Figure 20: HAI prevalence by Anresis Region
Geographical subdivision of Switzerland as presented in the Swiss Center of Antimicrobial Resistance (anresis): http://www.anresis.ch (Geneva is integrated into the “West” region)
6.7%4.9%
7.4%
10.4%
4.6% 5.7% 5.4%0123456789
101112Prev
alence (%
)
West Central West North West Central East North East East South
HAI - prevalence by Anresis Regions
60
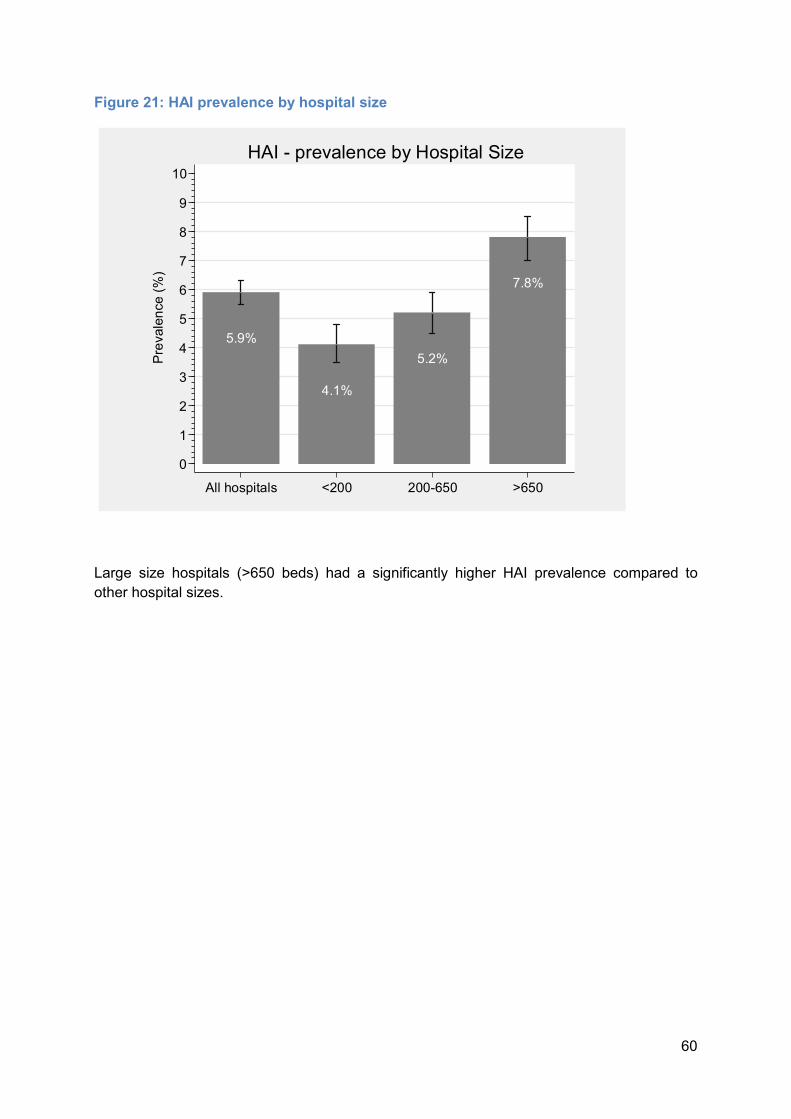
Figure 21: HAI prevalence by hospital size
Large size hospitals (>650 beds) had a significantly higher HAI prevalence compared to other hospital sizes.
5.9%4.1%
5.2%
7.8%
0123456789
10Prev
alence (%
)
All hospitals <200 200-650 >650
HAI - prevalence by Hospital Size
61
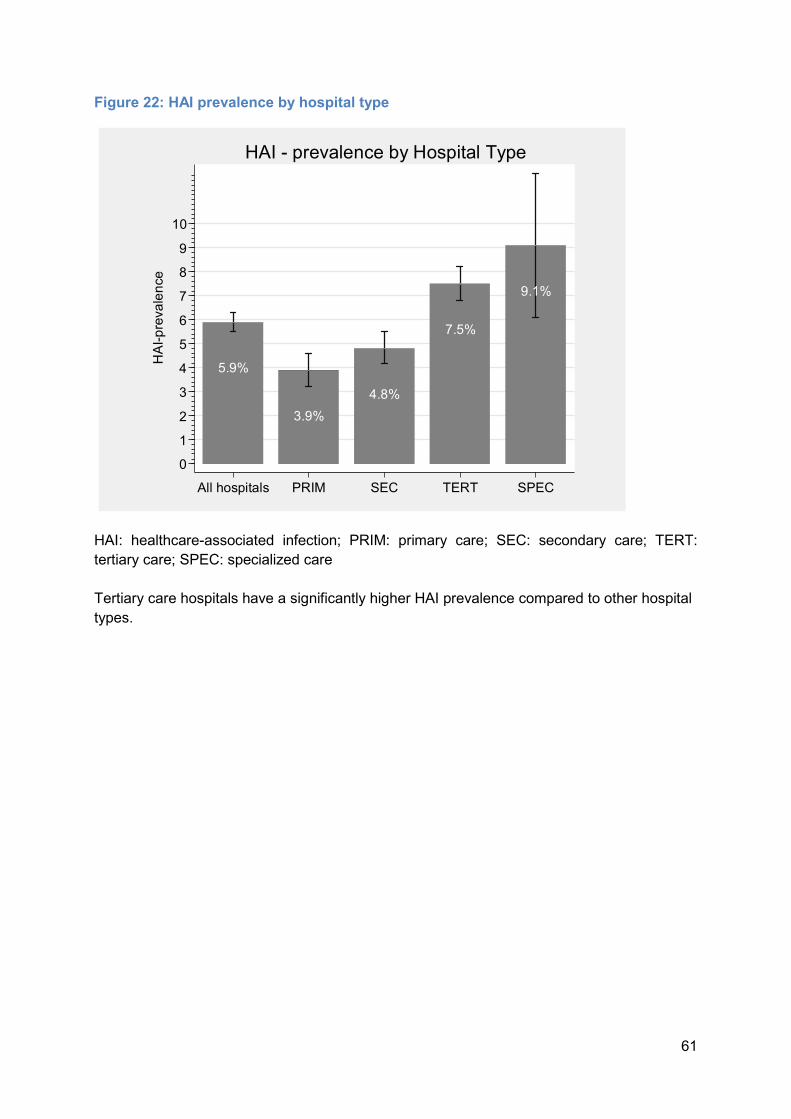
Figure 22: HAI prevalence by hospital type
HAI: healthcare-associated infection; PRIM: primary care; SEC: secondary care; TERT: tertiary care; SPEC: specialized care Tertiary care hospitals have a significantly higher HAI prevalence compared to other hospital types.
5.9%3.9% 4.8%
7.5%9.1%
0123456789
10
HAI-prev
alence
All hospitals PRIM SEC TERT SPEC
HAI - prevalence by Hospital Type

62
Figure 23: HAI prevalence by hospital ownership
HAI: healthcare-associated infection; PUB: public hospitals; PRIVNFP: private ownership, non-for-profit; PRIVFP: private ownership, for-profit Private-for-profit hospitals have a significantly lower HAI prevalence compared to other hospitals. This difference does not hold in multivariable analysis (Table 32).
5.9% 6.1% 6.3%
2.9%0123456789
10HAI-
prevalen
ce
All hospitals PUB PRIVNFP PRIVFP
HAI - prevalence by Hospital Ownership

63
Figure 24: HAI prevalence by ward specialty
ICU: Intensive care unit; SUR: surgery; MED: medicine; PED: pediatrics; GO: gynecology/obstetrics; NEO: neonatology; GER: geriatrics; RHB: rehabilitation; MIX: mixed specialties; OTH: other specialties The highest prevalence was found in the ICU, followed by surgery, geriatrics, rehabilitation, and medicine. The difference compared to other ward specialties is significant (Table 32).
20.6%
7.2%5.5%
2.0% 1.3%4.3%
6.5% 6.2%4.5%
1.7%02468
1012141618202224
Prevalen
ce (%)
ICU SUR MED PED GO NEO GER RHB MIX OTH
HAI - prevalence by Ward Specialty
64
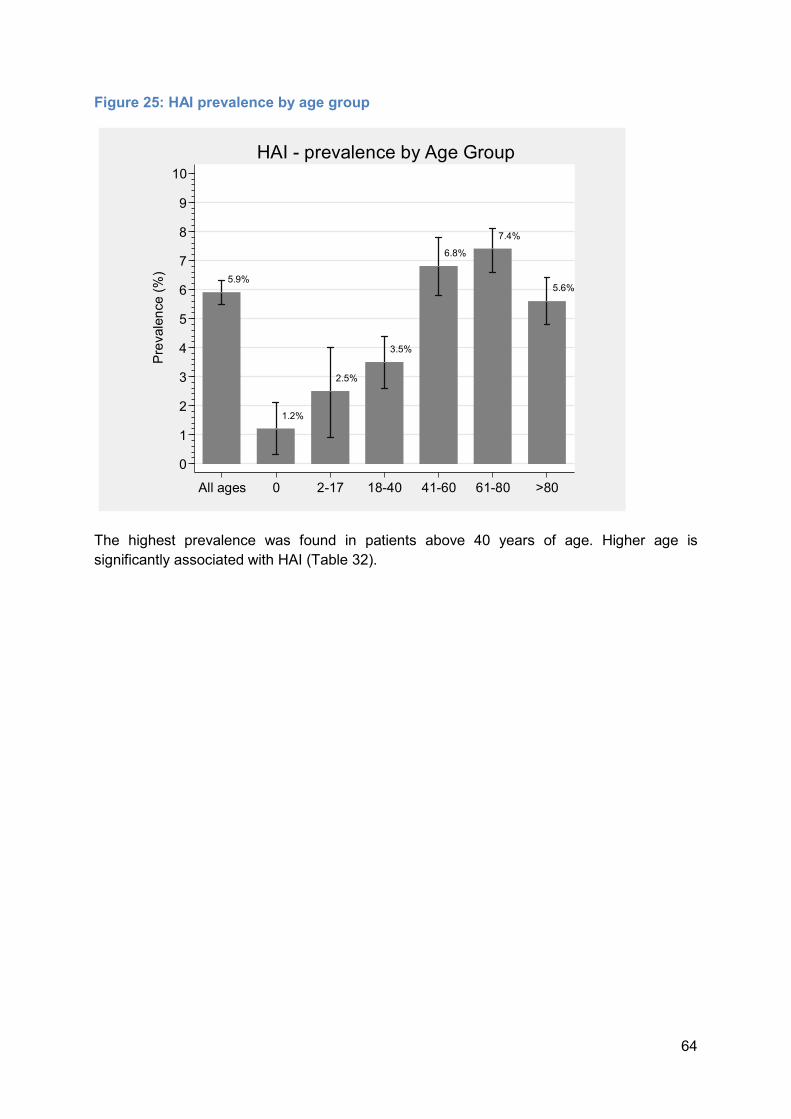
Figure 25: HAI prevalence by age group
The highest prevalence was found in patients above 40 years of age. Higher age is significantly associated with HAI (Table 32).
5.9%
1.2%2.5%
3.5%
6.8%7.4%
5.6%
0123456789
10Prev
alence (%
)
All ages 0 2-17 18-40 41-60 61-80 >80
HAI - prevalence by Age Group

65
Figure 26: HAI prevalence by gender
Male gender is a significant risk factor HAI (Table 32).
5.9%4.7%
7.2%
0123456789
10Prev
alence (%
)
All patients Female Male
HAI - prevalence by Gender

66
Figure 27: HAI prevalence by McCabe score
Ultimately and rapidly fatal McCabe scores significantly predict HAI (Table 32)
5.9% 5.0%
9.3%10.6%
0123456789
10
Prevalen
ce (%)
All patients Non fatal Ultimately fatal Rapidly fatal
HAI - prevalence by McCabe
67
As shown in figures 21-27, the HAI prevalence depends on a number of variables. Table 32 summarizes formal uni- and multivariable testing using logistic regression analysis with the outcome HAI (1/0). The following variables were tested in uni- and multivariable regression analysis (on patient level), clustered on the hospital level. A two-sided p-value <0.05 was considered statistically significant.
Table 32: Univariable and multivariable analysis of risk factors for HAI
Variable Univariable analysis Multivariable analysis OR (95%CI) P-value OR (95%CI) P-value Large hospitals1 1.70 (1.27-2.28) <0.001 1.33 (1.07-1.66) 0.011 Tertiary care 1.65 (1.24-2.20) 0.001 1.23 (1.00-1.52) 0.045 Private-for-profit2 0.45 (0.29-0.70) <0.001 0.63 (0.39-1.02) 0.059 Intensive care unit 4.58 (3.53-5.93) <0.001 4.17 (3.13-5.55) <0.001 Fatal McCabe score3 2.01 (1.66-2.43) <0.001 1.68 (1.40-2.03) <0.001 Male gender 1.58 (1.38-1.81) <0.001 1.45 (1.29-1.64) <0.001 Age group4 1.20 (1.14-1.26) <0.001 1.18 (1.10-1.24) <0.001 1Large hospitals: hospitals >650 beds 2Private-for-profit: private-for-profit hospitals compared to other hospital ownerships (public, private-non-for-profit) 3Fatal McCabe score: ultimately and rapidly fatal McCabe score combined 4Age groups: 0 years, 2-17 years, 18-40 years, 41-60 years, 61-80 years, >80 years All predictive variables for HAI were also significant in the multivariable analysis, except private-for-profit ownership. This is due to a more favourable case-mix of patients in private-for-profit hospitals: fewer patients with ultimately or rapidly fatal McCabe score (7.50% vs. 19.32%; p<0.001 [Chi2-test]); lower median age (64 years vs. 68 years; p<0.001 [ranksum test]); there were no significant differences for number of ICU-patients and male gender.

68
Figure 28: Prevalence of surgical site and device-associated infections
SSI: surgical site infection; CLABSI: central line-associated bloodstream infection; PABSI: peripheral line-associated bloodstream infection; CAUTI: catheter-associated urinary tract infection; LRTI: lower respiratory tract infection This figure reports specific HAI-types, potentially associated with surgery or the use of medical devices. SSI was analyzed for all in-hospital SSI in patients undergoing NHSN (National Healthcare Surveillance Network) class surgery before PPS. All other HAI types were analyzed in patients with a relevant medical device in place at PPS.
2.8%1.4%
0.1%1.8%
5.7%
0123456789
10Prev
alence (%
)
SSI* CLABSI° PABSI° CAUTI° LRTI°*After NHSN surgery in hospitalisation; °Infection with relevant device use
Surgery - / Device - associated Infections
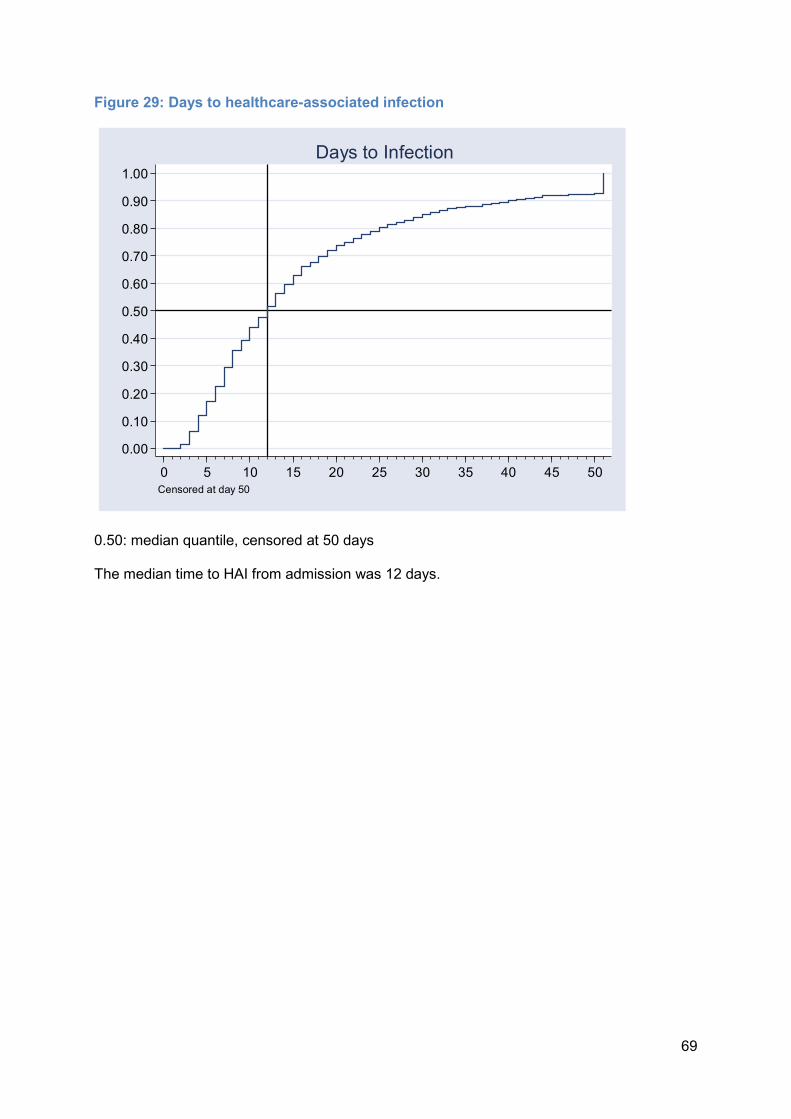
69
Figure 29: Days to healthcare-associated infection
0.50: median quantile, censored at 50 days The median time to HAI from admission was 12 days.
0.000.100.200.300.400.500.600.700.800.901.00
0 5 10 15 20 25 30 35 40 45 50Censored at day 50
Days to Infection
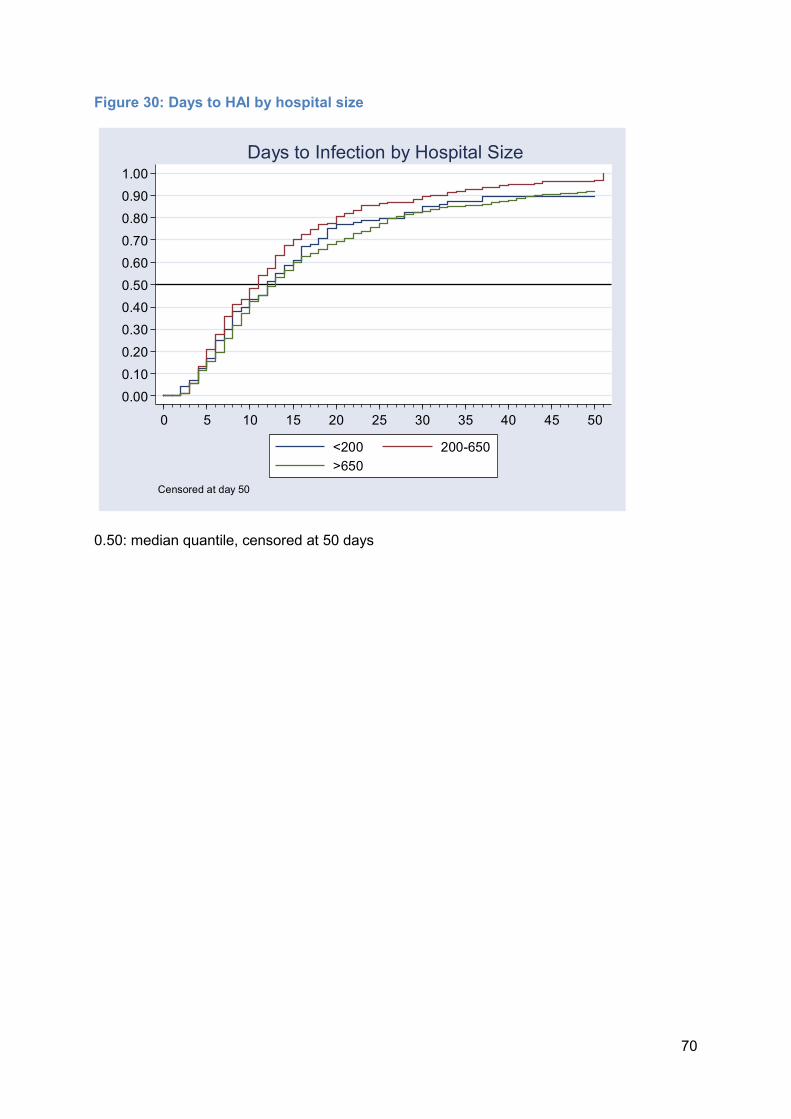
70
Figure 30: Days to HAI by hospital size
0.50: median quantile, censored at 50 days
0.000.100.200.300.400.500.600.700.800.901.00
0 5 10 15 20 25 30 35 40 45 50<200 200-650>650
Censored at day 50
Days to Infection by Hospital Size

71
Figure 31: Days to HAI by hospital type
0.50: median quantile, censored at 50 days Patients in specialized hospitals had a longer stay when an HAI occurred than in other type hospitals.
0.000.100.200.300.400.500.600.700.800.901.00
0 5 10 15 20 25 30 35 40 45 50Primary care Secondary careSpecialised care Tertiary care
Censored at day 50
Days to Infection by Hospital Type

72
Figure 32: Days to HAI by University-affiliation
0.50: median quantile, censored at 50 days
0.000.100.200.300.400.500.600.700.800.901.00
0 5 10 15 20 25 30 35 40 45 50Other hospitals University hospitals
Censored at day 50
Days to Infection by University-Affiliation
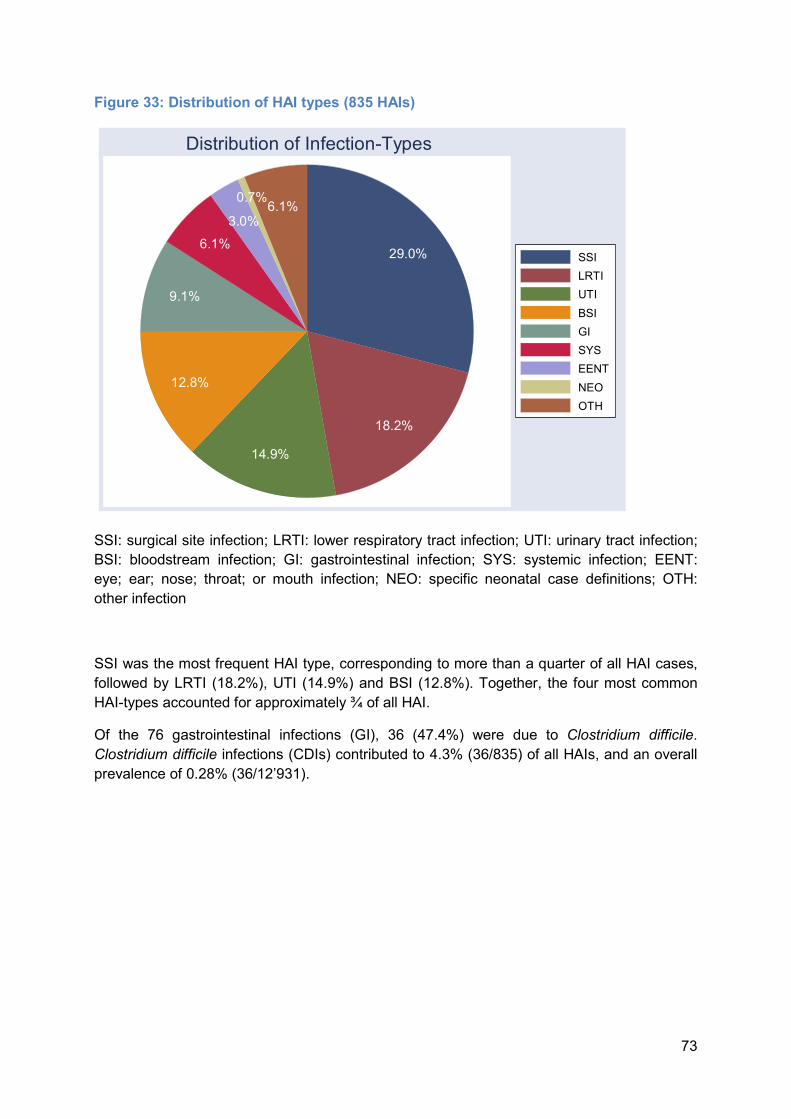
73
Figure 33: Distribution of HAI types (835 HAIs)
SSI: surgical site infection; LRTI: lower respiratory tract infection; UTI: urinary tract infection; BSI: bloodstream infection; GI: gastrointestinal infection; SYS: systemic infection; EENT: eye; ear; nose; throat; or mouth infection; NEO: specific neonatal case definitions; OTH: other infection SSI was the most frequent HAI type, corresponding to more than a quarter of all HAI cases, followed by LRTI (18.2%), UTI (14.9%) and BSI (12.8%). Together, the four most common HAI-types accounted for approximately ¾ of all HAI. Of the 76 gastrointestinal infections (GI), 36 (47.4%) were due to Clostridium difficile. Clostridium difficile infections (CDIs) contributed to 4.3% (36/835) of all HAIs, and an overall prevalence of 0.28% (36/12’931).
29.0%
18.2%14.9%
12.8%
9.1%6.1%3.0%
0.7%6.1%SSILRTIUTIBSIGISYSEENTNEOOTH
Distribution of Infection-Types

74
Figure 34: Distribution of HAI types by hospital size
SSI: surgical site infection; LRTI: lower respiratory tract infection; UTI: urinary tract infection; BSI: bloodstream infection; GI: gastrointestinal infection; SYS: systemic infection; EENT: eye; ear; nose; throat; or mouth infection; NEO: specific neonatal case definitions; OTH: other infection SSI was the most frequent HAI type in all hospital types.
31.4%
25.2%11.3%
18.2%
6.9% 2.5%1.9%2.5%
36.1%
14.9%10.4%
19.9%
6.2%5.8%
0.8% 5.8%
24.2%
17.5%
14.7%10.8%
11.5%
4.8%7.8%0.9%7.6%
<200 beds 200-650 beds
>650 beds
SSILRTIBSIUTIGIEENTSYSNEOOTH
Graphs by hospreport
HAI Types by Hospital Size
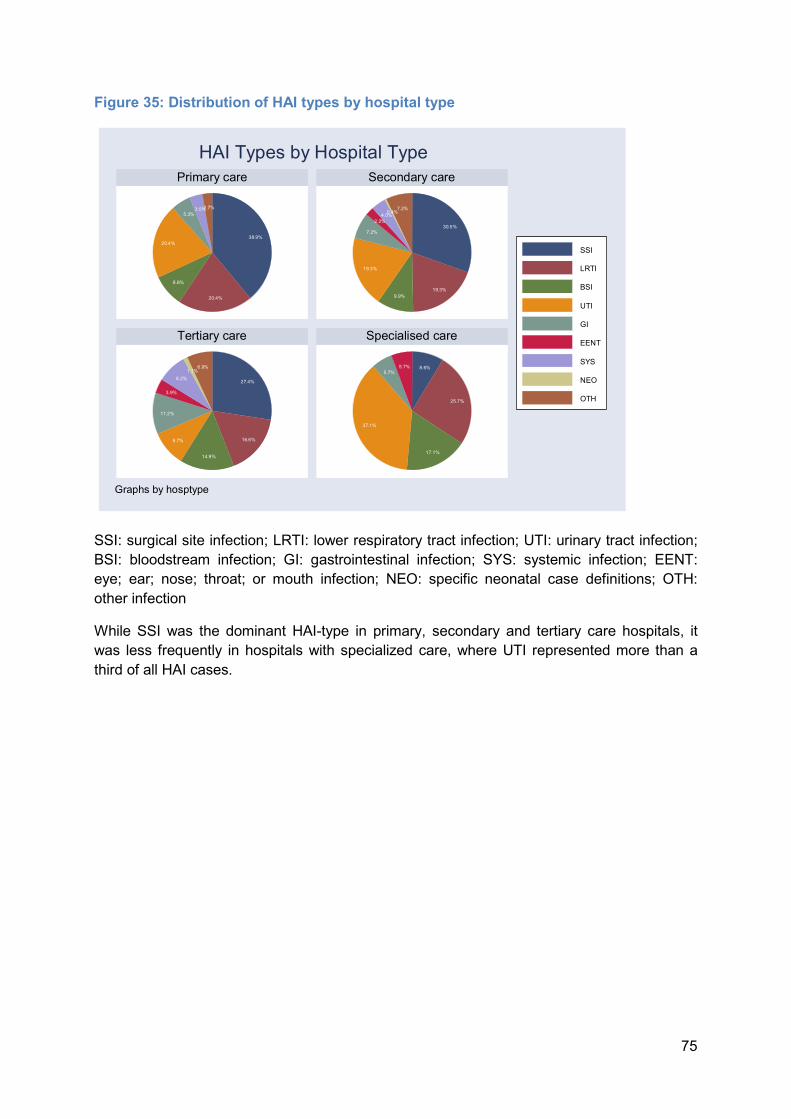
75
Figure 35: Distribution of HAI types by hospital type
SSI: surgical site infection; LRTI: lower respiratory tract infection; UTI: urinary tract infection; BSI: bloodstream infection; GI: gastrointestinal infection; SYS: systemic infection; EENT: eye; ear; nose; throat; or mouth infection; NEO: specific neonatal case definitions; OTH: other infection While SSI was the dominant HAI-type in primary, secondary and tertiary care hospitals, it was less frequently in hospitals with specialized care, where UTI represented more than a third of all HAI cases.
38.9%
20.4%8.8%
20.4%
5.3%3.5%2.7%30.5%
19.3%9.9%
19.3%
7.2%2.2%4.0%0.4%7.2%
27.4%
16.6%14.9%
9.7%
11.2%
3.9%8.2%1.1%6.9% 8.6%
25.7%
17.1%
37.1%
5.7% 5.7%
Primary care Secondary care
Tertiary care Specialised care
SSILRTIBSIUTIGIEENTSYSNEOOTH
Graphs by hosptype
HAI Types by Hospital Type

76
Figure 36: Distribution of HAI types by University-affiliation
SSI: surgical site infection; LRTI: lower respiratory tract infection; UTI: urinary tract infection; BSI: bloodstream infection; GI: gastrointestinal infection; SYS: systemic infection; EENT: eye; ear; nose; throat; or mouth infection; NEO: specific neonatal case definitions; OTH: other infection
32.3%
18.8%11.6%
17.9%
8.0%2.1%3.6%0.4%5.3%
24.7%
17.5%
14.4%10.8%
10.6%
4.2%
9.4%1.1% 7.2%
Other hospitals University hospitals
SSILRTIBSIUTIGIEENTSYSNEOOTH
Graphs by hospreport
HAI Types by University-affiliation

77
Figure 37: Source for bloodstream infections by hospital size
CVC: central venous catheter; PVC: peripheral venous catheter; Sec_GI: secondary to gastrointestinal infection; Sec_LRTI: secondary to lower respiratory tract infection; Sec_SST_ secondary to skin and soft tissue infection; Sec_SSI: secondary to surgical site infection; Sec_UTI: secondary to urinary tract infection; Sec_Other: secondary to other infection A mixed pattern was also observed in BSI sources by hospital size.
7.1%7.1%7.1%
7.1%7.1%
35.7%
28.6% 14.3%14.3%4.8%4.8%4.8%19.0%
4.8%14.3%
19.0%
8.7%4.3%15.2%4.3%6.5%
19.6%4.3%13.0%
23.9%
<200 beds 200-650 beds
>650 beds
CVCPVCSec_GISec_OtherSec_LRTISec_SSISec_SSTSec_UTIUnknown
Graphs by hospsize
BSI Source by Hospital Size

78
Figure 38: Source for bloodstream infections by hospital type
CVC: central venous catheter; PVC: peripheral venous catheter; Sec_GI: secondary to gastrointestinal infection; Sec_LRTI: secondary to lower respiratory tract infection; Sec_SST_ secondary to skin and soft tissue infection; Sec_SSI: secondary to surgical site infection; Sec_UTI: secondary to urinary tract infection; Sec_Other: secondary to other infection Tertiary hospitals had a lower prevalence of BSIs caused by CVC when compared with primary and secondary hospitals; while they appeared to have a similar prevalence of PVC- related BSIs when compared with primary settings.
25.0%
12.5%25.0%
12.5%
25.0% 16.7%
16.7%5.6%5.6%11.1%11.1%
16.7%
16.7%
6.1%6.1%14.3%4.1%6.1%
20.4%6.1%12.2%
24.5%
66.7%
33.3%
Primary care Secondary care
Tertiary care Specialised care
CVCPVCSec_GISec_OtherSec_LRTISec_SSISec_SSTSec_UTIUnknown
Graphs by hosptype
BSI Source by Hospital Type

79
Figure 39: Source for bloodstream infections by University-affiliation
CVC: central venous catheter; PVC: peripheral venous catheter; Sec_GI: secondary to gastrointestinal infection; Sec_LRTI: secondary to lower respiratory tract infection; Sec_SST_ secondary to skin and soft tissue infection; Sec_SSI: secondary to surgical site infection; Sec_UTI: secondary to urinary tract infection; Sec_Other: secondary to other infection
11.9%11.9%
7.1%2.4%
7.1%11.9%2.4%
21.4%
23.8%7.7%2.6%
15.4%
5.1%5.1%
23.1%5.1%
12.8%
23.1%
Other hospitals University hospitals
CVCPVCSec_GISec_OtherSec_LRTISec_SSISec_SSTSec_UTIUnknown
Graphs by hospreport
BSI Source by University-Affiliation

80
Figure 40: HAI prevalence attributed to the current ward by hospital size
This figure summarizes the proportion of HAI attributed to the current ward a patient was hospitalised on the day of survey.
63.0% 63.5% 55.2%67.1%
0102030405060708090
100Prev
alence (%
)
All hospitals <200 beds 200-650 beds >650 bedsHAI: healthcare-associated infection
HAI on Current Ward by Hospital Size

81
Figure 41: HAI prevalence attributed to the current ward by hospital type
PRIM: primary care; SEC: secondary care; TERT: tertiary care; SPEC: specialized care
63.0%51.3%
64.1% 64.4%74.3%
0102030405060708090
100HAI-
prevalen
ce
All hospitals PRIM SEC TERT SPECHAI: healthcare-associated infection
HAI on Current Ward by Hospital Type

82
Microorganisms Microbiology including antibiotic susceptibility for selected antibiotics was collected for all HAI. Figure 42: Proportion of HAIs for which microbiological tests were ordered on total number of HAIs, and proportion of microbiologically documented HAIs
This figure summarizes how many HAIs were investigated (left hand side) and among the microbiological tests, how many were positive (right hand side).
67.7%, n(tot) 835
93.1%, n(tot) 565
0102030405060708090
100
Examined
/Positive
(%)
HAI Examined Positive ExaminationsHAI: healthcare-associated infection
Microbiological Documentation

83
Figure 43: Distribution of isolated microorganisms (by family name)
Enterobac: Enterobacteriaceae; gramposcoc: Gram positive cocci; gramnegbac: Gram negative bacteria; anaerobic bacteria; gramposbac: Gram positive bacteria; gramnegcoc: Gram negative cocci; otherbac: other bacteria Gram-negative bacteria and Gram-positive cocci represented more than 80% of isolated microorganisms.
45.7%
36.6%
5.5%5.3% 4.3%
0.8%0.4%0.9%0.5%
enterobacgramposcocgramnegbacanaerobfungigramposbacgramnegcocvirusesotherbac
Distribution of Pathogens
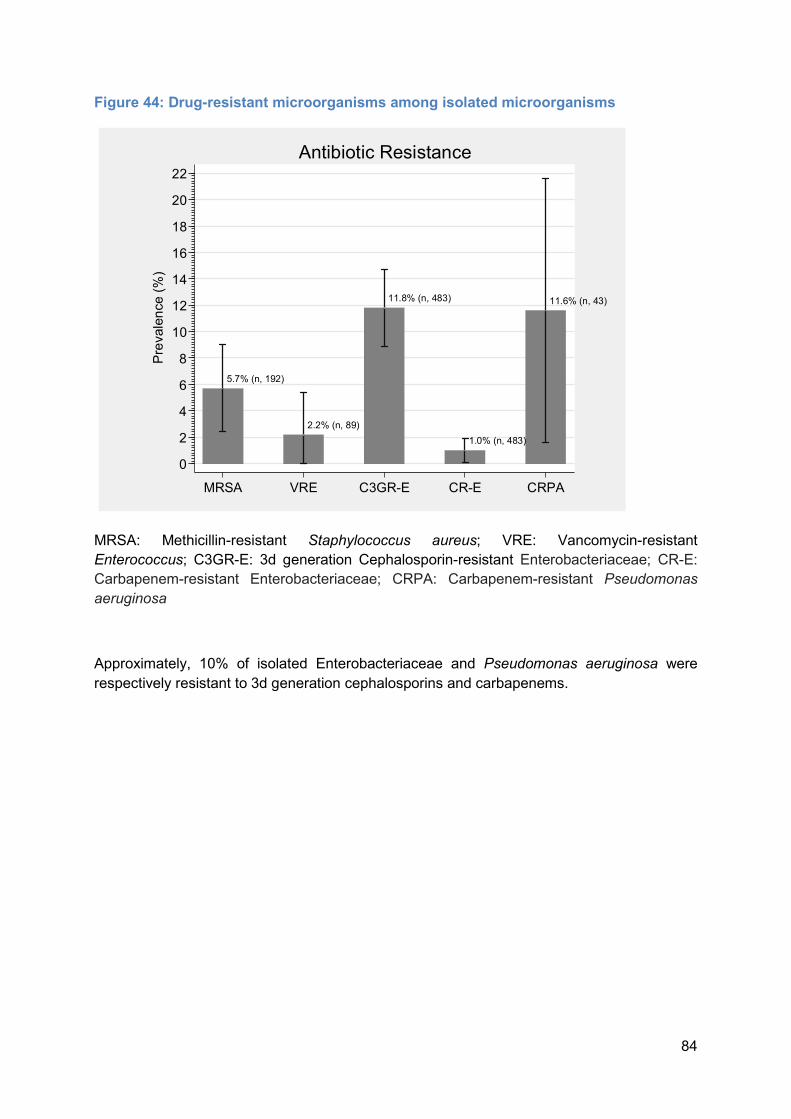
84
Figure 44: Drug-resistant microorganisms among isolated microorganisms
MRSA: Methicillin-resistant Staphylococcus aureus; VRE: Vancomycin-resistant Enterococcus; C3GR-E: 3d generation Cephalosporin-resistant Enterobacteriaceae; CR-E: Carbapenem-resistant Enterobacteriaceae; CRPA: Carbapenem-resistant Pseudomonas aeruginosa Approximately, 10% of isolated Enterobacteriaceae and Pseudomonas aeruginosa were respectively resistant to 3d generation cephalosporins and carbapenems.
5.7% (n, 192)
2.2% (n, 89)
11.8% (n, 483)
1.0% (n, 483)
11.6% (n, 43)
02468
10121416182022
Prevalen
ce (%)
MRSA VRE C3GR-E CR-E CRPA
Antibiotic Resistance

85
C. Antimicrobial use Antimicrobial use (AU) data consists of a numerator of substantial interest as it allows assessing their overall use and understanding the indications and reasons of change of treatment. The sequential pattern of AU report was conceived in a way that the treatment choice (name of antimicrobial) follows the clinical decision of frontline physicians (indication, diagnosis, reason for change, dosage). Figure 45: Antimicrobial use, total and antimicrobial days
This figure summarizes how many patients received one or more antimicrobials on the day of survey (left-hand side), and how many days on one or more antimicrobials accumulated between admission and day of survey (right-hand side). Overall, 1 out of three hospitalized patients included in the survey was under at least one antimicrobial.
33.0%
15.2%
01020304050
Prevalen
ce (%)
Patients on Antimicrobials Antimicrobial Days**Days on one or more antimicrobials per hospital-days
Antimicrobial Use

86
Figure 46: Antimicrobial use by canton
AG: Aargau, BE: Bern, BL: Basel-Landschaft, BS: Basel-Stadt, GE: Geneva, GR: Graubünden, SG: St.Gallen, SO: Solothurn, TG: Thurgau, VD: Vaud, VS: Valais, ZH: Zürich This table reports antimicrobial use by cantons participating with three or more hospitals. Cantons with fewer hospitals are not included in this figure.
36.1% 36.0% 35.3% 33.0%
21.6%
33.3% 34.1% 33.9%
42.8%
35.5% 35.8%
28.5%33.3%
05
101520253035404550
Prevalen
ce (%)
AG BE BL BS GE GR SG SO TG TI VD VS ZH
Antimicrobial use by Canton

87
Figure 47: Antimicrobial use by linguistic regions
DE: German, FR: French, IT: Italian This figure summarized patients receiving one or more antimicrobials, stratified by language regions (Deutschweiz, Romandie, Ticino).
34.6%29.2%
35.5%
05
101520253035404550
Prevalen
ce (%)
DE FR IT
Antimicrobial use by Language Region
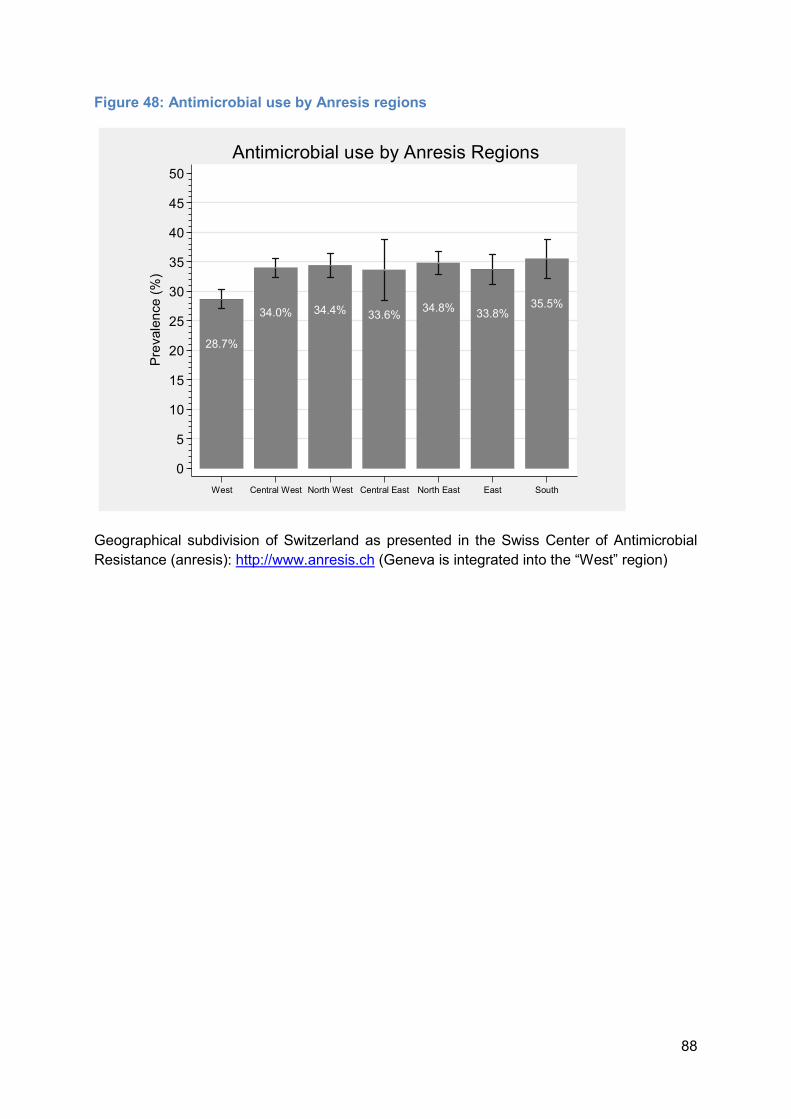
88
Figure 48: Antimicrobial use by Anresis regions
Geographical subdivision of Switzerland as presented in the Swiss Center of Antimicrobial Resistance (anresis): http://www.anresis.ch (Geneva is integrated into the “West” region)
28.7%34.0% 34.4% 33.6% 34.8% 33.8% 35.5%
05
101520253035404550
Prevalen
ce (%)
West Central West North West Central East North East East South
Antimicrobial use by Anresis Regions
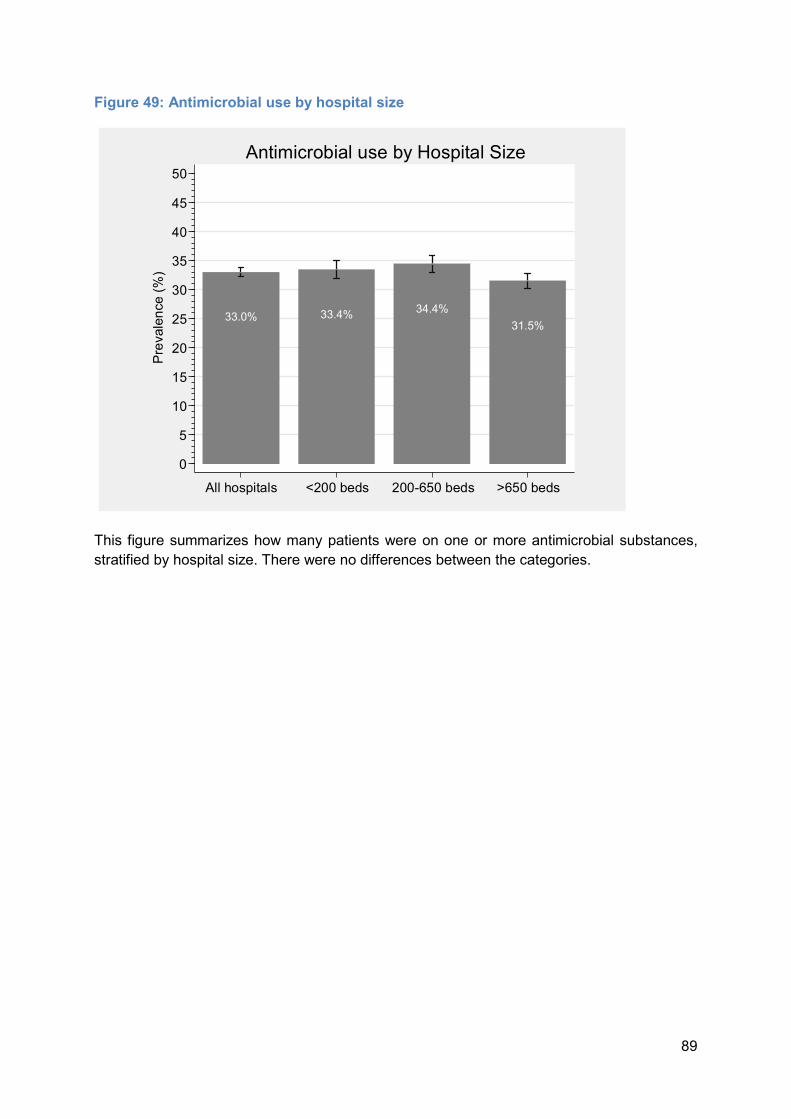
89
Figure 49: Antimicrobial use by hospital size
This figure summarizes how many patients were on one or more antimicrobial substances, stratified by hospital size. There were no differences between the categories.
33.0% 33.4% 34.4% 31.5%
05
101520253035404550
Prevalen
ce (%)
All hospitals <200 beds 200-650 beds >650 beds
Antimicrobial use by Hospital Size

90
Figure 50: Antimicrobial use by hospital type
PRIM: primary care; SEC: secondary care; TERT: tertiary care; SPEC: specialized care This figure summarizes how many patients were on one or more antimicrobial substances, stratified by hospital type. There were no differences between the categories.
33.0% 32.1% 33.9% 32.6% 34.4%
05
101520253035404550
Prevalen
ce (%)
All PRIM SEC TERT SPEC
Antimicrobial use by Hospital Type
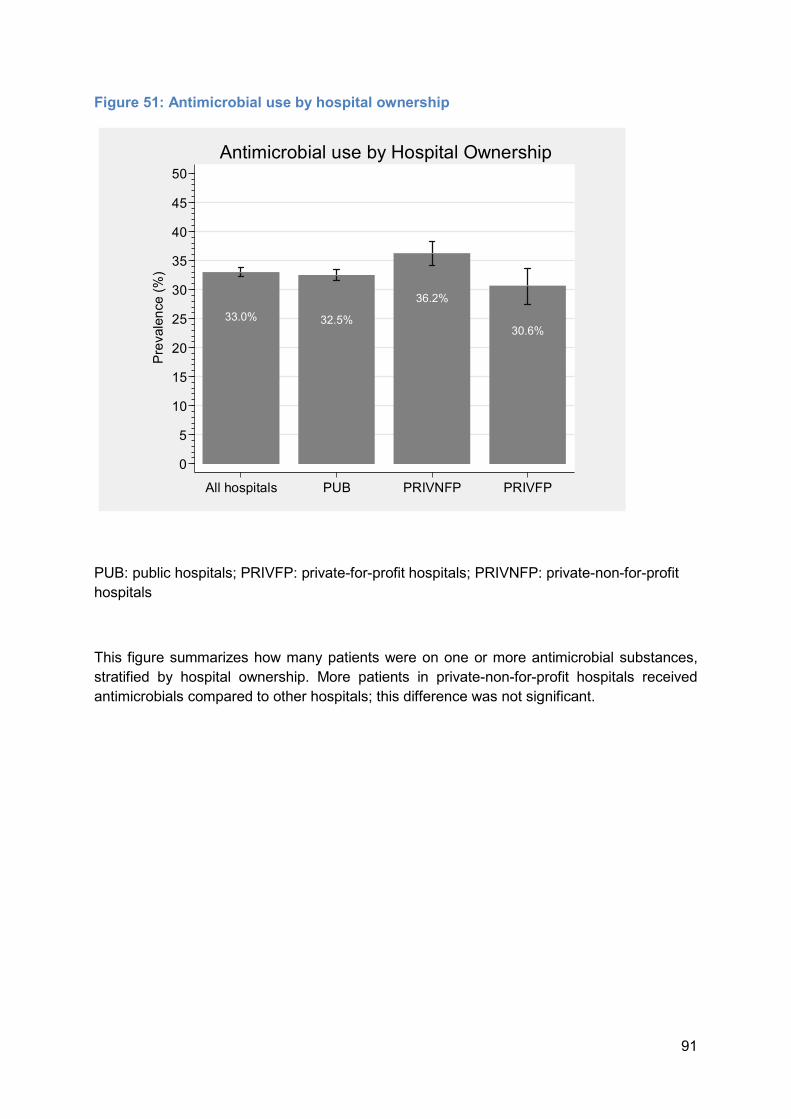
91
Figure 51: Antimicrobial use by hospital ownership
PUB: public hospitals; PRIVFP: private-for-profit hospitals; PRIVNFP: private-non-for-profit hospitals This figure summarizes how many patients were on one or more antimicrobial substances, stratified by hospital ownership. More patients in private-non-for-profit hospitals received antimicrobials compared to other hospitals; this difference was not significant.
33.0% 32.5%36.2%
30.6%
05
101520253035404550
Prevalen
ce (%)
All hospitals PUB PRIVNFP PRIVFP
Antimicrobial use by Hospital Ownership

92
Figure 52: Antimicrobial use by ward specialty
ICU: Intensive care unit, SUR: surgery, MED: medicine, PED: pediatrics, GO: gynecology/ obstetrics, NEO: neonatology, GER: geriatrics, RHB: rehabilitation, MIX: mix, OTH: other Antimicrobials were more frequently used in ICU, followed by surgical, mix, medical and pediatric units.
62.0%
43.5%
31.9% 30.9%
12.5% 9.2%17.1%
11.8%
37.4%
27.3%
0510152025303540455055606570
Prevalen
ce (%)
ICU SUR MED PED GO NEO GER RHB MIX OTH
Antimicrobial use by Ward Specialty

93
Figure 53: Antimicrobial use by age group
Patients belonging to the age range between 41 and 60 years received more antimicrobials than in the other age groups (medical and surgical prophylaxis included).
4.8%
31.9% 30.3%
41.1%36.5%
28.3%
05
101520253035404550
Prevalen
ce (%)
0 2-17 18-40 41-60 61-80 >80
Antimicrobial use by Age Group

94
Figure 54: Patient on single antimicrobial or combination therapy
This figure summarizes how many patients being treated with antimicrobials received one, two or more antimicrobial substances.
82.4%
14.9%2.7%
0102030405060708090
100Prev
alence (%
)
Single Double Three or more
Combination Therapy

95
Figure 55: Distribution of antimicrobials by indication
Community: community-acquired infection; Healthcare: Healthcare-acquired infection; Longterm_care: Long-term care-acquired infection; Surgical_prophylaxis_1_dose: Surgical prophylaxis (single dose administration); Surgical_prophylaxis_1_day: Surgical prophylaxis (one day administration); Surgical_prophylaxis_ongoing: Surgical prophylaxis (more than one day administration) The most frequent reason for AU is a community-acquired infection (42%).
42.0%
18.5%1.5%
8.1%
15.3%
3.4%7.9% 3.3%
CommunityHealthcareLongterm_careMedical_prophylaxisSurgical_prophylaxis_1_doseSurgical_prophylaxis_1_daySurgical_prophylaxis_ongoingOther_indication
Indications for Antimicrobial Use

96
Figure 56: Distribution of antimicrobials by medical diagnosis
BSI: bloodstream infection; LRTI: lower respiratory tract infection; UTI: Urinary tract infection; SSI: Surgical site infection; GI: Gastrointestinal infection; IA: intra-abdominal infection; BJ: bone and joint infection; SST: skin and soft tissue infection; ENT: eye; ear; nose; throat or mouth infection; FN: febrile neutropenia or other form of manifestation of infection in immunocompromised host (e.g. HIV; chemotherapy; etc.) with no clear anatomical site; SIRS: systemic inflammatory response with no clear anatomical site; OTH: other infection The most frequent diagnosis for antimicrobial use was LRTI, followed by UTI, SSI, SST, IA, and BSI.
7.9%
24.3%
16.1%10.5%
4.2%9.5%
5.0%
9.9%2.4%2.1%2.4% 5.8%
BSILRTIUTISSIGIIABJSSTENTFNSIRSOTH
Diagnoses for Antimicrobial Use
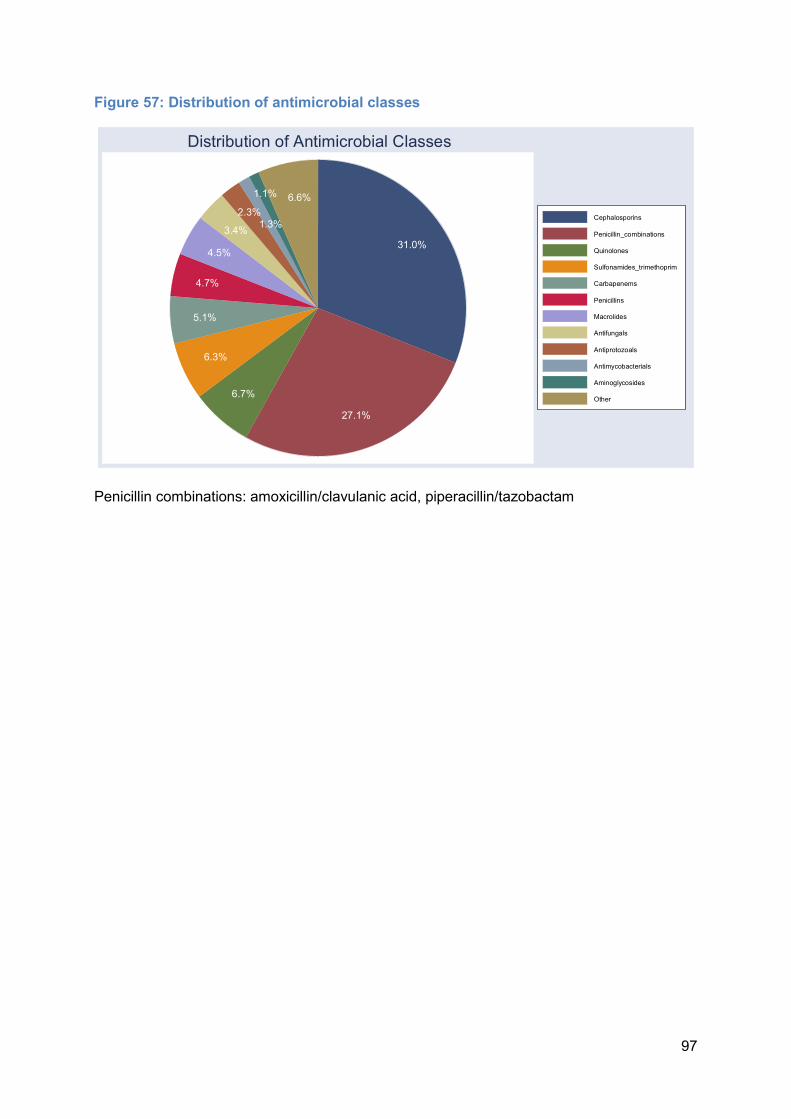
97
Figure 57: Distribution of antimicrobial classes
Penicillin combinations: amoxicillin/clavulanic acid, piperacillin/tazobactam
31.0%
27.1%6.7%
6.3%5.1%4.7%
4.5%3.4%
2.3%1.3%1.1% 6.6%
CephalosporinsPenicillin_combinationsQuinolonesSulfonamides_trimethoprimCarbapenemsPenicillinsMacrolidesAntifungalsAntiprotozoalsAntimycobacterialsAminoglycosidesOther
Distribution of Antimicrobial Classes

98
Figure 58: Distribution of antimicrobial classes used for community- and healthcare-acquired infections
Penicillin combinations: amoxicillin/clavulanic acid, piperacillin/tazobactam
23.4%
34.9%7.0%2.8%
5.6%6.7%
5.5%2.2%3.0%
1.8%1.5%5.7% 15.5%
32.6%
8.7%3.8%11.8%
4.5%3.0%
5.9%3.8%2.1%1.0% 7.4%
Community-acquired Healthcare-associatedCephalosporinsPenicillin_combinationsQuinolonesSulfonamidesCarbapenemsPenicillinsMacrolidesAntifungalsAntiprotozoalsAntimycobacterialsAminoglycosidesOther
Graphs by hospreport
Antimicrobials for Community- and Healthcare Infections

99
Figure 59: Ten most common antimicrobials
Co-Amoxiclav: amoxicillin/clavulanic acid; Pip-Taz: piperacillin/tazobactam Together, these antimicrobials account for 71.8% of all antimicrobial use.
OtherAmoxicillin
Vancomycin*Metronidazole
CefazolinCiprofloxacine
BactrimPip-Taz
CeftriaxoneCefuroxime
Co-Amoxiclav
0 5 10 15 20 25 30*parenteral use
Ten Most Common Antimicrobials

100
Figure 60: Ten most common antimicrobials for therapeutic purposes
Co-Amoxiclav: amoxicillin/clavulanic acid; Pip-Taz: piperacillin/tazobactam Together, these antimicrobials account for 71.4% of all antimicrobial treatment.
OtherAmoxicillin
*Metronidazole**Metronidazole
CefepimeMeropenem
*VancomycineCiprofloxacin
Pip-TazCeftriaxone
Co-Amoxiclav
0 5 10 15 20 25 30*parenteral use; **oral use
Ten Most Common Antimicrobials for Treatment
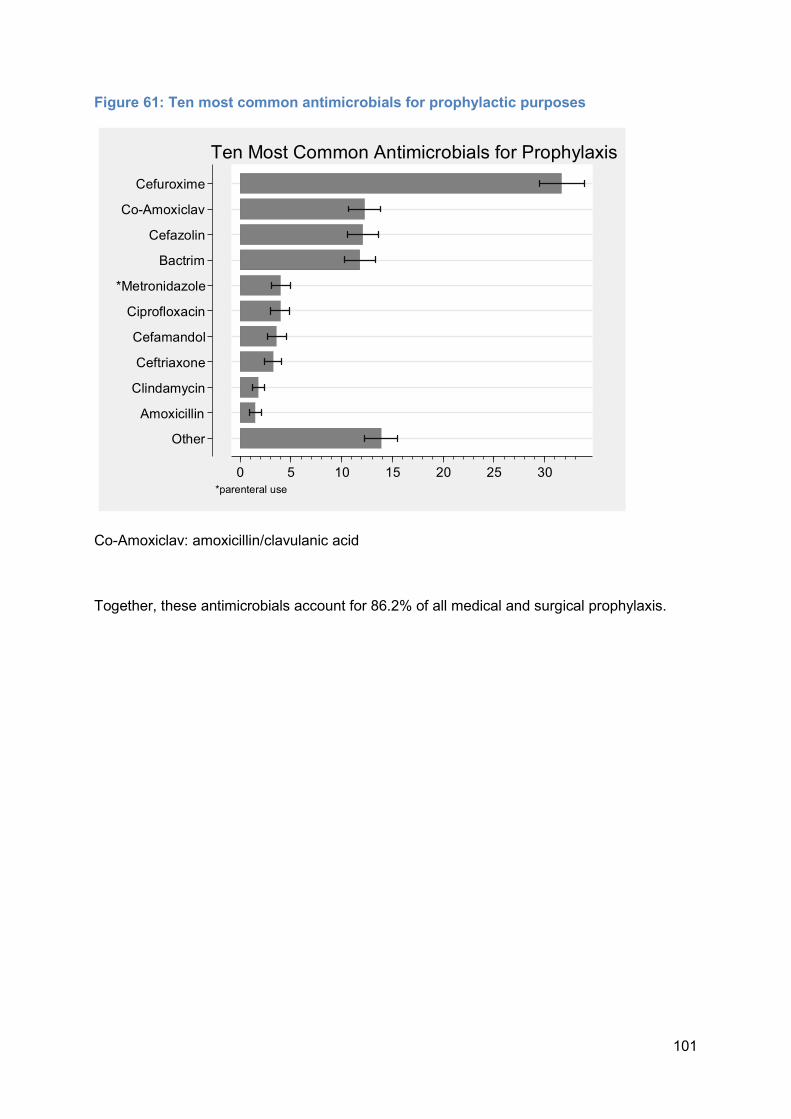
101
Figure 61: Ten most common antimicrobials for prophylactic purposes
Co-Amoxiclav: amoxicillin/clavulanic acid Together, these antimicrobials account for 86.2% of all medical and surgical prophylaxis.
OtherAmoxicillin
ClindamycinCeftriaxoneCefamandol
Ciprofloxacin*Metronidazole
BactrimCefazolin
Co-AmoxiclavCefuroxime
0 5 10 15 20 25 30*parenteral use
Ten Most Common Antimicrobials for Prophylaxis

102
Figure 62: Ten most common antimicrobials for surgical prophylaxis
Co-Amoxiclav: amoxicillin/clavulanic acid Together, these antimicrobials account for 95.9% of all surgical prophylaxis.
OtherAmoxicillin
ClindamycinBactrim
CeftriaxoneCiprofloxacin
*MetronidazoleCefamandol
Co-AmoxiclavCefazolin
Cefuroxime
0 5 10 15 20 25 30*parenteral use
Common Antimicrobials for Surgical Prophylaxis

103
References
1. Allegranzi B, Bagheri Nejad S, Combescure C, Graafmans W, Attar H, Donaldson L, et al. Burden of endemic health-care-associated infection in developing countries: systematic review and meta-analysis. Lancet 2011; 377: 228-241. 2. Haley RW, Culver DH, White JW, Morgan WM, Emori TG, Munn VP, et al. The efficacy of infection surveillance and control programs in preventing nosocomial infections in US hospitals. Am J Epidemiol 1985; 121: 182-205. 3. Mayon-White RT, Ducel G, Kereselidze T, Tikomirov E. An international survey of the prevalence of hospital-acquired infection. J Hosp Infect 1988; 11 Suppl A: 43-48. 4. ECDC. European Centre for Disease Prevention and Control. Point prevalence survey of healthcare-associated infections and antimicrobial use in European acute care hospitals. Stockholm: ECDC; 2013. 5. Zingg W, Hopkins S, Gayet-Ageron A, Holmes A, Sharland M, Suetens C. Health-care-associated infections in neonates, children, and adolescents: an analysis of paediatric data from the European Centre for Disease Prevention and Control point-prevalence survey. Lancet Infect Dis 2017; 17: 381-389. 6. Magill SS, Edwards JR, Bamberg W, Beldavs ZG, Dumyati G, Kainer MA, et al. Multistate point-prevalence survey of health care-associated infections. New Engl J Med 2014; 370: 1198-1208. 7. Pittet D, Harbarth S, Ruef C, Francioli P, Sudre P, Petignat C, et al. Prevalence and risk factors for nosocomial infections in four university hospitals in Switzerland. Infect Control Hosp Epidemiol 1999; 20: 37-42. 8. Sax H, Hugonnet S, Harbarth S, Herrault P, Pittet D. Variation in nosocomial infection prevalence according to patient care setting:a hospital-wide survey. J Hosp Infect 2001; 48: 27-32. 9. Sax H, Pittet D. Interhospital differences in nosocomial infection rates: importance of case-mix adjustment. Arch Intern Med 2002; 162: 2437-2442. 10. Sax H. [Nationwide surveillance of nosocomial infections in Switzerland--methods and results of the Swiss Nosocomial Infection Prevalence Studies (SNIP) in 1999 and 2002]. Ther Umschau 2004; 61: 197-203. 11. Sax H, Ruef C, Pittet D. Resultate der Schweizerischen Präalenzstudie nosokomialer Infektionen 2003 (snip03). Swissnoso Bulletin 2004; 11: 1-8. 12. Sax H, Pittet D. Resultate der Schweizerischen Präalenzstudie der nosokomialen Infektionen 2004 (snip04). Swissnoso Bulletin 2005; 12: 1-8. 13. Harbarth S, Ruef C, Francioli P, Widmer A, Pittet D. Nosocomial infections in Swiss university hospitals: a multi-centre survey and review of the published experience. Swiss-Noso Network. Schweiz Med Wochenschr 1999; 129: 1521-1528. 14. Muhlemann K, Franzini C, Aebi C, Berger C, Nadal D, Stahelin J, et al. Prevalence of nosocomial infections in Swiss children's hospitals. Infect Control Hosp Epidemiol 2004; 25: 765-771. 15. Zingg W, Huttner BD, Sax H, Pittet D. Assessing the burden of healthcare-associated infections through prevalence studies: what is the best method? Infect Control Hosp Epidemiol 2014; 35(6): 674-684. 16. Report on the National Strategy for the Monitoring, Prevention and Control of Healthcare-Associated Infections (NOSO Strategy); BAG; 2016. Available from https://www.bag.admin.ch/bag/en/home/service/publikationen/broschueren/publikationen-uebertragbare-krankheiten/publikation-nationale-strategie-noso.html, (accessed 3 January 2018)
104
17. ECDC. European Centre for Disease Prevention and Control. Point prevalence survey of healthcareassociated infections and antimicrobial use in European acute care hospitals – protocol version 5.3. Stockholm: ECDC; 2016. 18. Zingg W, Holmes A, Dettenkofer M, Goetting T, Secci F, Clack L, et al. Hospital organisation, management, and structure for prevention of health-care-associated infection: a systematic review and expert consensus. Lancet Infect Dis 2015; 15: 212-224. 19. Hansen S, Schwab F, Gastmeier P, Pittet D, Zingg W, Sax H, et al. Provision and consumption of alcohol-based hand rubs in European hospitals. Clin Microbiol Infect 2015; 21: 1047-1051. 20. O'Boyle C, Jackson M, Henly SJ. Staffing requirements for infection control programs in US health care facilities: Delphi project. Am J Infect Control 2002; 30: 321-333. 21. Brusaferro S, Arnoldo L, Cattani G, Fabbro E, Cookson B, Gallagher R, et al. Harmonizing and supporting infection control training in Europe. J Hosp Infect 2015; 89: 351-356. 22. Hansen S, Zingg W, Ahmad R, Kyratsis Y, Behnke M, Schwab F, et al. Organization of infection control in European hospitals. J Hosp Infect 2015; 91: 338-345. 23. Gastmeier P, Sohr D, Schwab F, Behnke M, Zuschneid I, Brandt C, et al. Ten years of KISS: the most important requirements for success. J Hosp Infect 2008; 70 Suppl 1: 11-16. 24. Schroder C, Schwab F, Behnke M, Breier AC, Maechler F, Piening B, et al. Epidemiology of healthcare associated infections in Germany: Nearly 20 years of surveillance. Int J Med Microbiol 2015; 305: 799-806.