Embed Size (px)
Citation preview
© 2016 eprentise. All rights reserved.
Helene Abrams, CEO
eprentise
How to Cost Justify Your Proposal for an
EBS Remodeling Project and Avoid a
Reimplementation
© 2016 eprentise. All rights reserved.
Learning Objectives
Objective 1: Identify the steps and tools to develop a strong
cost-benefit analysis.
Objective 2: Understand the time/resource/cost/risk model
for determining the approach for an IT project.
Objective 3: Develop the cost of a reimplementation effort
and compare to a remodeling approach example.
| 2
Overall, we want to be able to deliver a compelling business
case that makes a “go forward” decision a reality
© 2016 eprentise. All rights reserved.
Agenda
Introduction
What is a cost-benefit analysis,
and why do you need it?
How do you build a cost-benefit
analysis?
What are the requirements?
Single Consolidated Instance
Shared Services Center
What are the costs?
Reimplementation Example
How do you calculate costs?
What are the benefits?
Comparison of Remodeling to
Reimplementation
How do you measure them?
What are the risks?
| 3

© 2016 eprentise. All rights reserved.
eprentise Can… …So Our Customers Can: Consolidate Multiple EBS Instances
Change Underlying Structures and
Configurations
Chart of Accounts, Other Flexfields
Inventory Organizations
Operating Groups, Legal Entities,
Ledgers
Calendars
Costing Methods
Resolve Duplicates, Change Sequences,
IDs
Separate Data
Introduction: Finished but not Done
: Transformation Software for E-Business Suite
Reduce Operating Costs and Increase
Efficiencies
Shared Services
Data Centers
Adapt to Change
Align with New Business Initiatives
Mergers, Acquisitions, Divestitures
Pattern-Based Strategies
• Make ERP an Adaptive
Technology
Avoid a Reimplementation
Reduce Complexity and Control Risk
Improve Business Continuity, Service
Quality and Compliance
Establish Data Quality Standards and a
Single Source of Truth
Company Overview: Established 2006 l Helene Abrams, CEO
| 4

© 2016 eprentise. All rights reserved.
Employ A Structured Methodology To
Develop the Business Case
Document
today’s
practices
Develop
high level
visions
Build detailed
staffing models
Build
process
flows
Build detailed
one-time cost
estimates
Develop an
implementation
approach
Compare
to best
practices
Develop new
organization
model
| 5

© 2016 eprentise. All rights reserved.
Oracle
EBS
Reporting
Accuracy
Asset
Valuation
Accounting
Efficacy
User
Acceptance
IT Costs
3rd Party
Consultants
R12
Migration
Business
Processes
What Troubles You About This?
Times change, companies change, ERP must change.
Transformations are NOT EASY!
R12
11i, 11g …
10. … 9. … 8.
N Instances
L Languages
M Ledgers
S Locations
X COA’s
Y Spreadsheets
Reporting
Interfaces
Integrations
Customizations
Other
???
Consultants
3rd Party Firms
3rd Party software
Oracle support?
IT Investments;
computers, networking,
other?
| 6
© 2016 eprentise. All rights reserved.
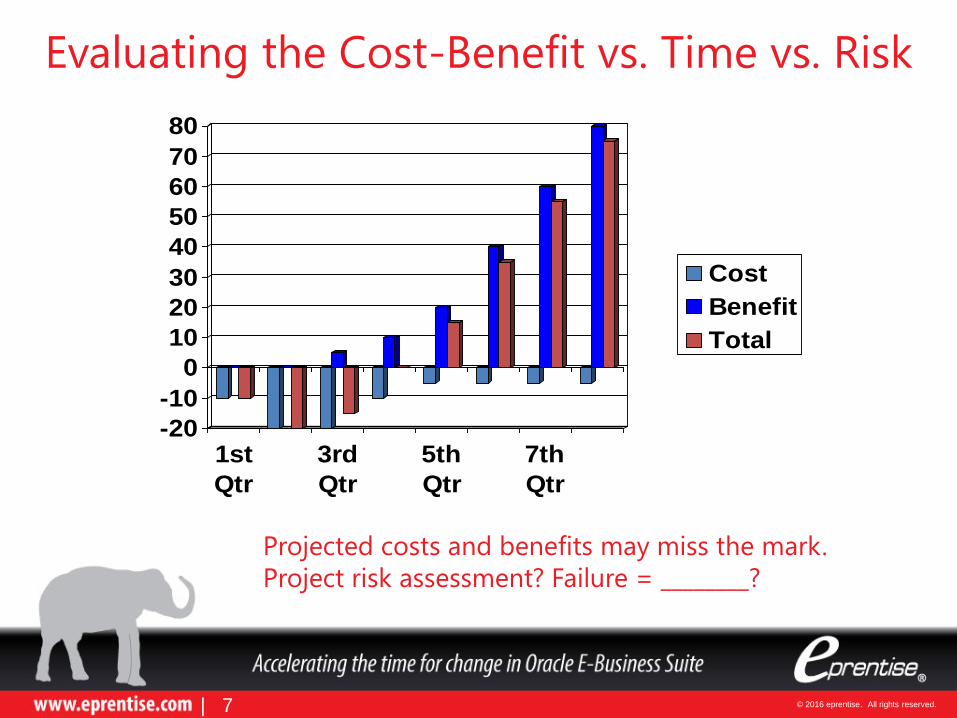
Evaluating the Cost-Benefit vs. Time vs. Risk
-20
-10
0
10
20
30
40
50
60
70
80
1st
Qtr
3rd
Qtr
5th
Qtr
7th
Qtr
Cost
Benefit
Total
Projected costs and benefits may miss the mark.
Project risk assessment? Failure = ________?
| 7
© 2016 eprentise. All rights reserved.
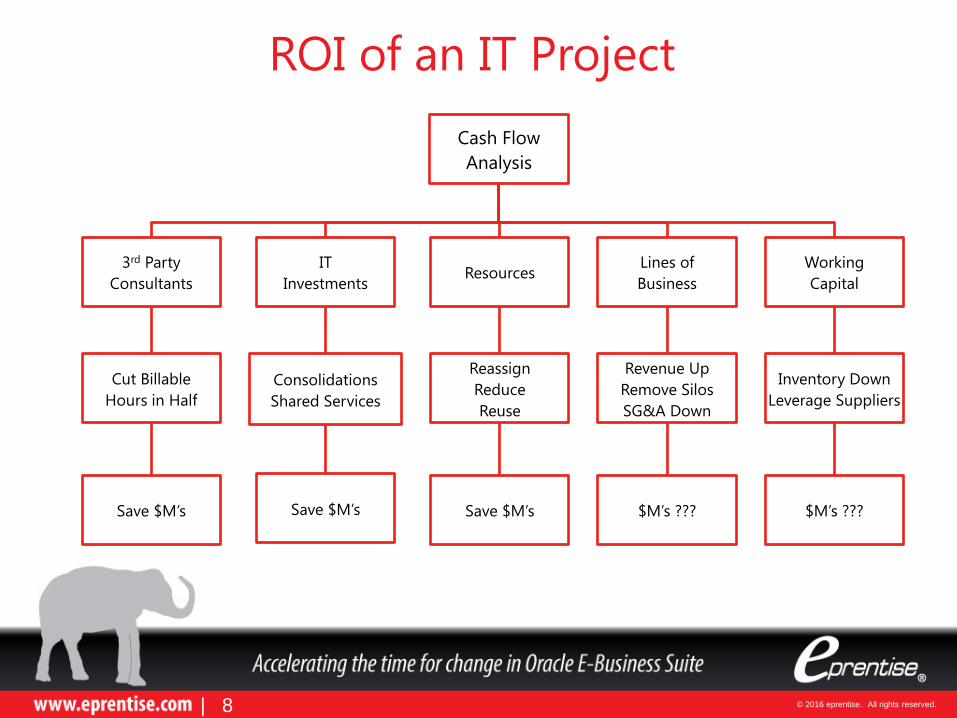
Cash Flow
Analysis
3rd Party
Consultants
Cut Billable
Hours in Half
Save $M’s
IT
Investments
Consolidations
Shared Services
Save $M’s
Resources
Reassign
Reduce
Reuse
Save $M’s
Lines of
Business
Revenue Up
Remove Silos
SG&A Down
$M’s ???
Working
Capital
Inventory Down
Leverage Suppliers
$M’s ???
ROI of an IT Project
| 8
© 2016 eprentise. All rights reserved.
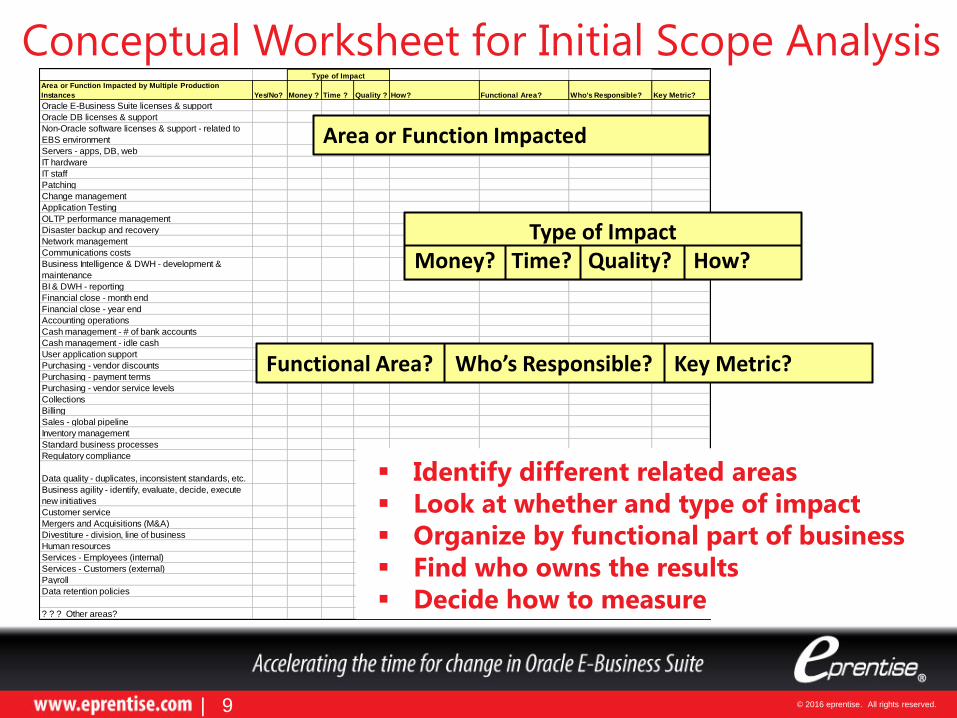
Conceptual Worksheet for Initial Scope Analysis
Area or Function Impacted by Multiple Production
Instances Yes/No? Money ? Time ? Quality ? How? Functional Area? Who's Responsible? Key Metric?
Oracle E-Business Suite licenses & support
Oracle DB licenses & support
Non-Oracle software licenses & support - related to
EBS environment
Servers - apps, DB, web
IT hardware
IT staff
Patching
Change management
Application Testing
OLTP performance management
Disaster backup and recovery
Network management
Communications costs
Business Intelligence & DWH - development &
maintenance
BI & DWH - reporting
Financial close - month end
Financial close - year end
Accounting operations
Cash management - # of bank accounts
Cash management - idle cash
User application support
Purchasing - vendor discounts
Purchasing - payment terms
Purchasing - vendor service levels
Collections
Billing
Sales - global pipeline
Inventory management
Standard business processes
Regulatory compliance
Data quality - duplicates, inconsistent standards, etc.
Business agility - identify, evaluate, decide, execute
new initiatives
Customer service
Mergers and Acquisitions (M&A)
Divestiture - division, line of business
Human resources
Services - Employees (internal)
Services - Customers (external)
Payroll
Data retention policies
? ? ? Other areas?
Type of Impact
Identify different related areas
Look at whether and type of impact
Organize by functional part of business
Find who owns the results
Decide how to measure
| 9
Area or Function Impacted
Type of Impact Money? Time? Quality? How?
Functional Area? Who’s Responsible? Key Metric?
© 2016 eprentise. All rights reserved.
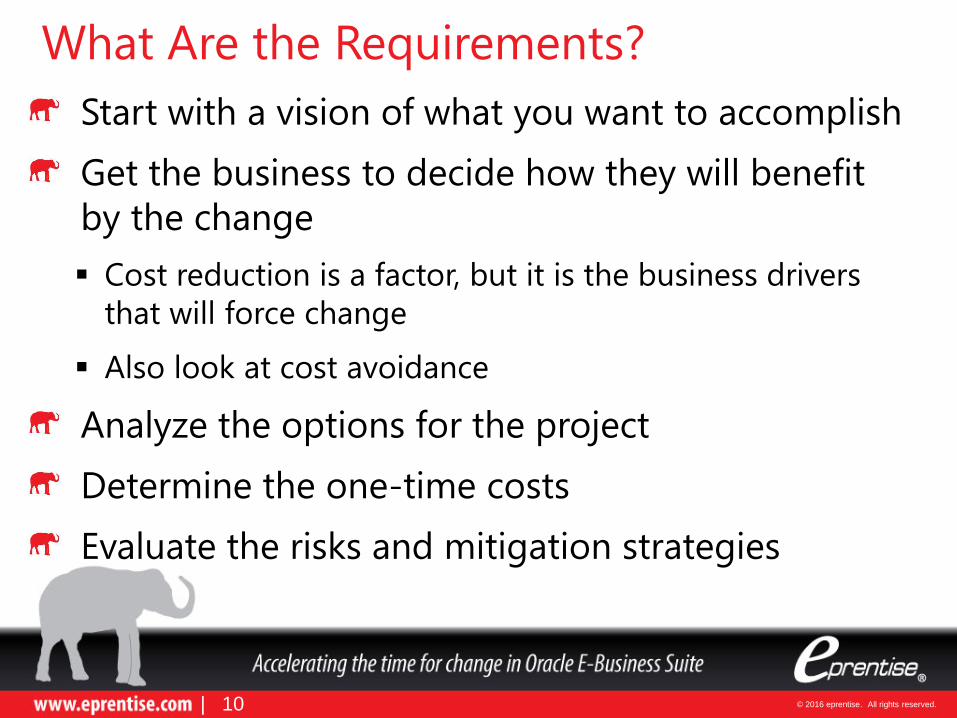
What Are the Requirements?
Start with a vision of what you want to accomplish
Get the business to decide how they will benefit
by the change
Cost reduction is a factor, but it is the business drivers
that will force change
Also look at cost avoidance
Analyze the options for the project
Determine the one-time costs
Evaluate the risks and mitigation strategies
| 10
© 2016 eprentise. All rights reserved.
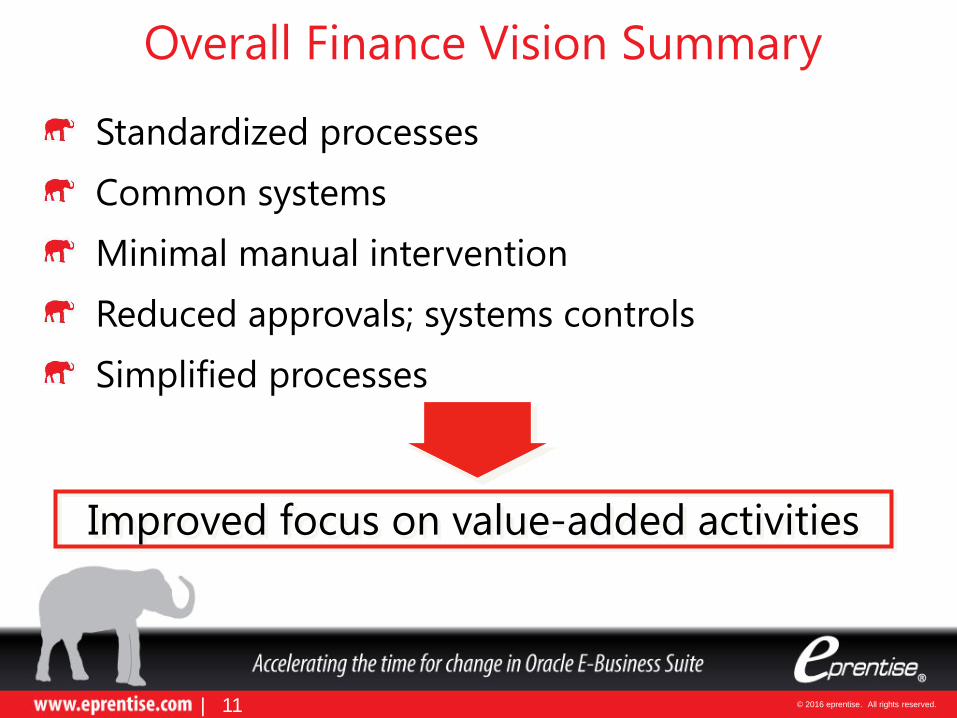
Overall Finance Vision Summary
Standardized processes
Common systems
Minimal manual intervention
Reduced approvals; systems controls
Simplified processes
Improved focus on value-added activities
| 11
© 2016 eprentise. All rights reserved.
Location
Suppliers
Employees
Decision-
Makers
Customers
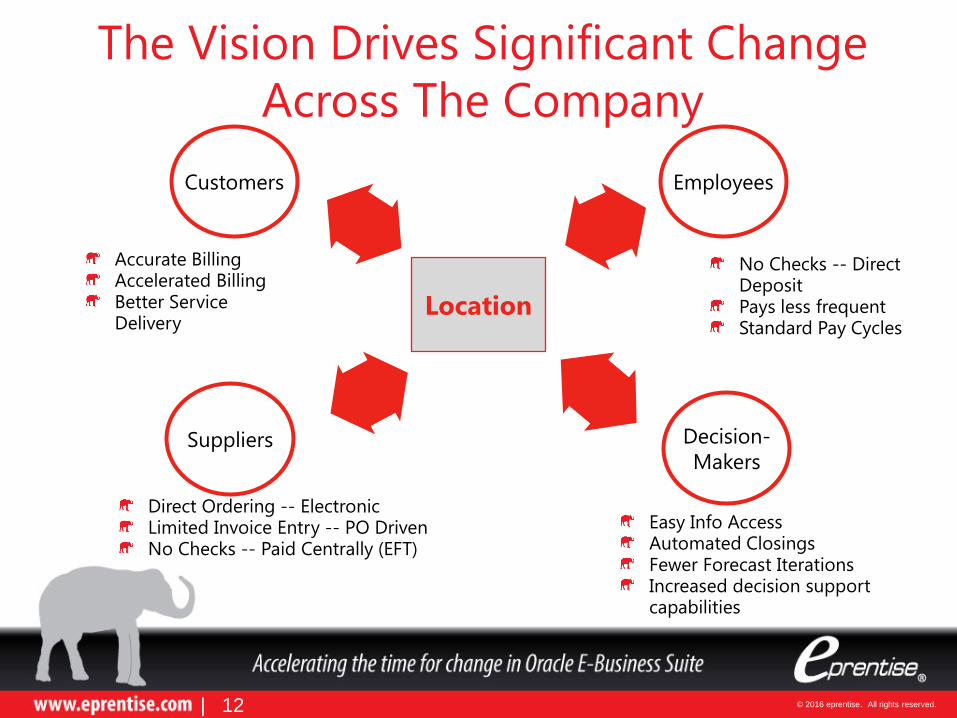
Accurate Billing Accelerated Billing Better Service Delivery
Direct Ordering -- Electronic Limited Invoice Entry -- PO Driven No Checks -- Paid Centrally (EFT)
Easy Info Access Automated Closings Fewer Forecast Iterations Increased decision support capabilities
The Vision Drives Significant Change
Across The Company
No Checks -- Direct Deposit Pays less frequent Standard Pay Cycles
| 12

© 2016 eprentise. All rights reserved.
Develop High-Level Visions For Key Processes
One common system company-wide integrated to manufacturing, purchasing,
receiving and the general ledger.
EFT payments covering all currencies with dual automated links with banks.
Establish company-wide, acceptable tolerance limits and eliminate adjustments
below certain amount.
Utilize procurement card or T&E system for small-dollar purchases and sundry
items throughout all operating units.
Worldwide database from purchasing to payments as a tool to improve
negotiation with supplier.
Generate intercompany A/R and A/P automatically through one single
transaction.
Utilize blanket orders and formal purchase orders for large-dollar purchases.
One level of approval for requisitions for each division.
| 13
© 2016 eprentise. All rights reserved.
Business Case Benefits
| 15
© 2016 eprentise. All rights reserved.
Example – Business Case for Consolidation
| 16
© 2016 eprentise. All rights reserved.
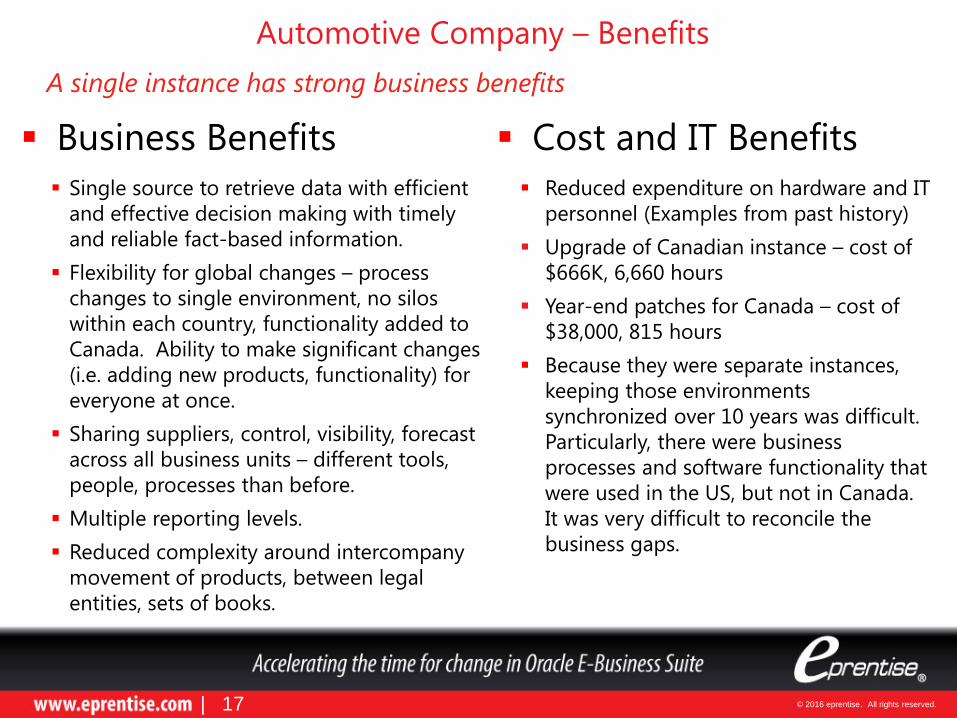
Automotive Company – Benefits
Business Benefits
Single source to retrieve data with efficient
and effective decision making with timely
and reliable fact-based information.
Flexibility for global changes – process
changes to single environment, no silos
within each country, functionality added to
Canada. Ability to make significant changes
(i.e. adding new products, functionality) for
everyone at once.
Sharing suppliers, control, visibility, forecast
across all business units – different tools,
people, processes than before.
Multiple reporting levels.
Reduced complexity around intercompany
movement of products, between legal
entities, sets of books.
Cost and IT Benefits
Reduced expenditure on hardware and IT
personnel (Examples from past history)
Upgrade of Canadian instance – cost of
$666K, 6,660 hours
Year-end patches for Canada – cost of
$38,000, 815 hours
Because they were separate instances,
keeping those environments
synchronized over 10 years was difficult.
Particularly, there were business
processes and software functionality that
were used in the US, but not in Canada.
It was very difficult to reconcile the
business gaps.
| 17
A single instance has strong business benefits
© 2016 eprentise. All rights reserved.
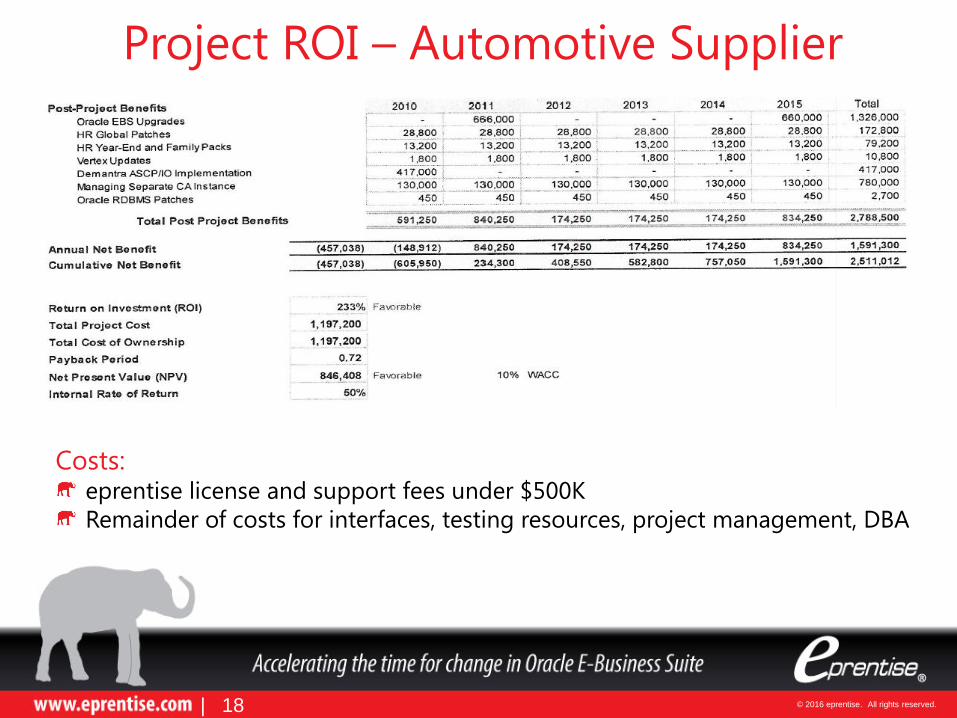
Project ROI – Automotive Supplier
Costs: eprentise license and support fees under $500K
Remainder of costs for interfaces, testing resources, project management, DBA
| 18
© 2016 eprentise. All rights reserved.
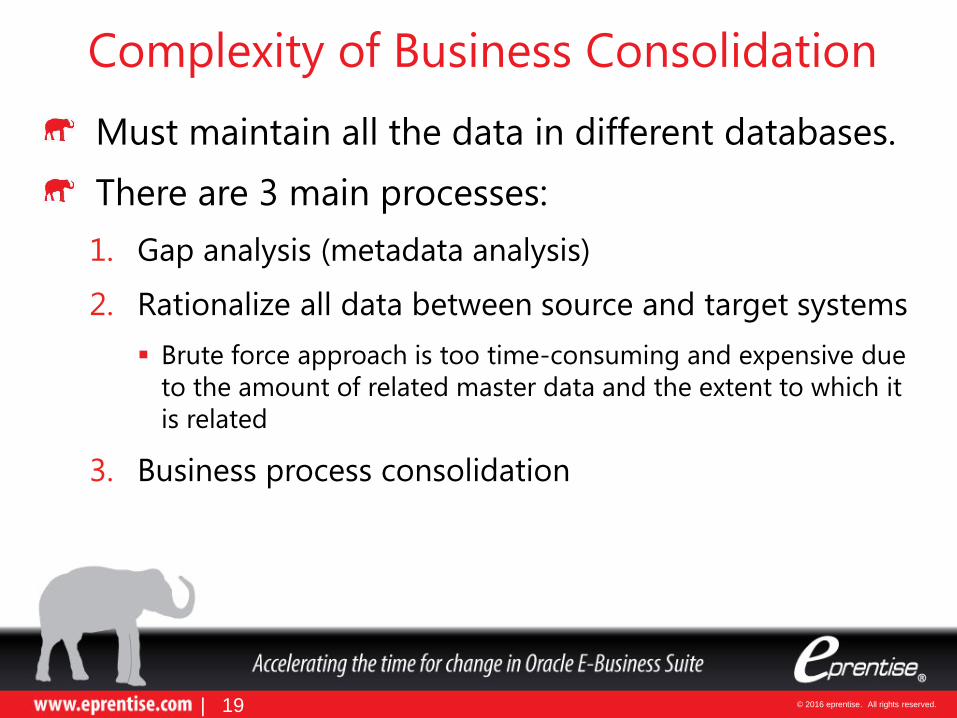
Complexity of Business Consolidation
Must maintain all the data in different databases.
There are 3 main processes:
1. Gap analysis (metadata analysis)
2. Rationalize all data between source and target systems
Brute force approach is too time-consuming and expensive due
to the amount of related master data and the extent to which it
is related
3. Business process consolidation
| 19

© 2016 eprentise. All rights reserved.
ROI of Business Consolidation A business consolidation effort that retains and integrates
all historical data offers ROI in many ways:
Old systems do not need to be warehoused or archived and then revived to
meet the needs of queries against historical data.
Rapid responses can be generated without the need for an extraordinary
expenditure of resources.
There exists a greater guarantee of accuracy – and therefore compliance –
due to the completeness of the data consolidation effort and the resulting
simplicity of the query and reporting process.
2 Ways of Understanding Business Consolidation ROI:
Relative cost differentials vs. a “brute force” effort
Business value of certain areas can be enhanced by the new capabilities
enabled through a business consolidation
| 20

© 2016 eprentise. All rights reserved.
Factors that Contribute to the Total Cost
of Ownership of Oracle E-Business Suite Problem Results in
Multiple Instances Infrastructure Costs
Resources
Customizations, Interfaces, Application
Integration
Support, Maintenance, Upgrades
Data Quality Ongoing Transformations for Analytics
Customer, Supplier, Employee Inconsistencies
Governance
Multiple Charts of Accounts Complexity to Reconcile
Statutory and Regulatory Compliance
Long Close Cycle
Lack of Common Business
Processes
Training
Lack of Visibility
Redundant Processes
| 21
© 2016 eprentise. All rights reserved.
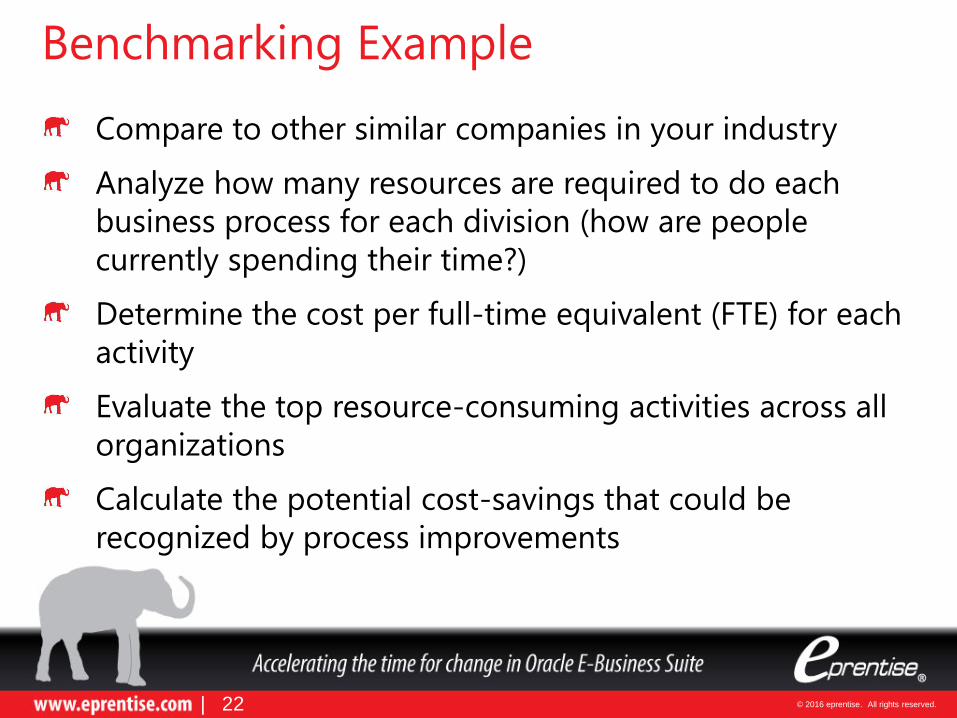
Benchmarking Example
Compare to other similar companies in your industry
Analyze how many resources are required to do each
business process for each division (how are people
currently spending their time?)
Determine the cost per full-time equivalent (FTE) for each
activity
Evaluate the top resource-consuming activities across all
organizations
Calculate the potential cost-savings that could be
recognized by process improvements
| 22
© 2016 eprentise. All rights reserved.
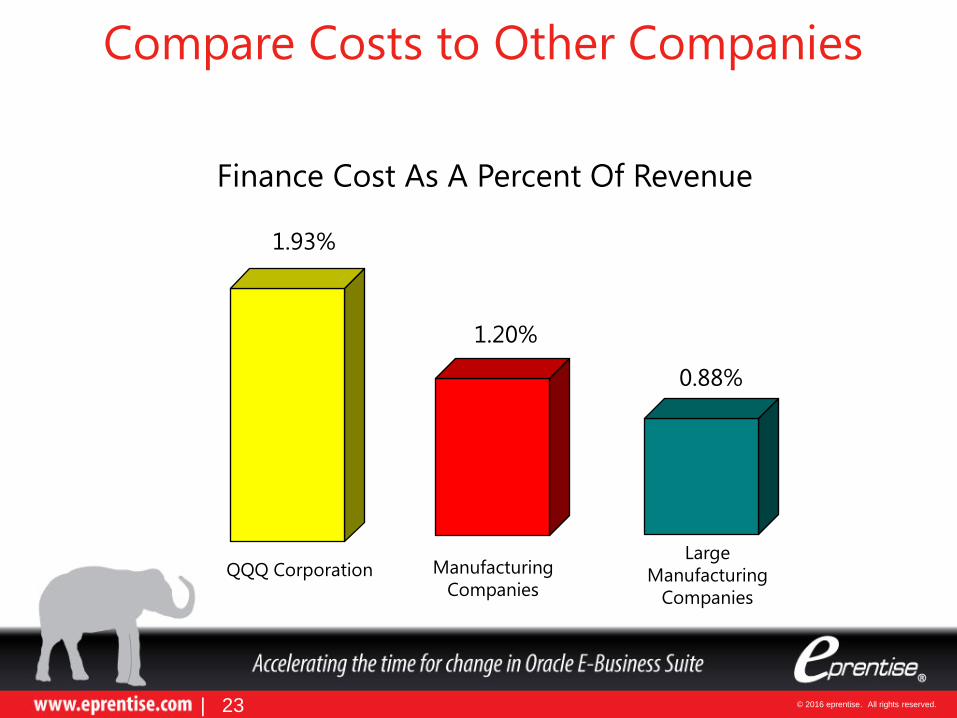
Compare Costs to Other Companies
Finance Cost As A Percent Of Revenue
Large
Manufacturing
Companies
1.93%
1.20%
0.88%
QQQ Corporation Manufacturing
Companies
| 23

© 2016 eprentise. All rights reserved.
Plant Computer Office Secretaries Receptionists Payroll Cost Acctg. A/P Receiving Invoicing Shipping/ Knitting Cutting Blch/Dye
Plant Accountants Operators Clerks Clerks Clerks Clerks Clerks Clerks BOL Clerks Clerks Clerks Clerks Total
CMT Jamestown 2 4 1 2 4 2 2 2 7 1 5 4 36
CMT Campbellsville 2 2 2 1 8 1 3 4 4 1 1 1 30
D. C. Campbellsville D. C. 2 1 1 1 1 3 2 5 16
CMT Frankfort 1 1 1 1 1 1 2 2 10
CMT Osceola 1 1 1 4 1 1 1 1 1 1 13
D. C. Bowling Green D. C. 3 1 1 3 2 4 3 17
CMT Jeanerette 0.4 1 1 4 1 1 1 4 3 16.4
CMT Martin Mills 0.4 1 1 2 7 2 2 4 1 5 3 28.4
CMT Port Barre 0.4 1 2 2 2 7.4
CMT Abbeville 0.4 1 2 1 9 1 14.4
D. C. Vidalia D. C. 0.4 1 1 1 1 4.4
CMT Harlingen 1 4 1 6 2 2 2 4 1 4 27
CMT Raymondville 1 1 2 4
CMT Rockingham 2 1 1 3 1 2 1 5 16
D. C. Sherman 1 1 1 1 4
D. C. Jacksonville D. C. 1 1 1 1 1 1 1 7
CMT Greenville 1 1 1 3 1 1 1 1 1 1 12
YARN Jacksonville (Union Yarn) #1 1 1 1 4
YARN Leesburg # 1 2 2 1 2 1 9
YARN Aliceville # 1 1 2 1 1 6
YARN Williamston # 1 1 1 1 1 1 6
YARN Fayette # 1 2 2 1 2 8
YARN Rabun Gap # 1 2 1 2 1 2 1 2 1 1 4 4 22
YARN Winfield # 1 1 2 1 5
YARN York # 1 1 1 1 1 5
YARN Whitmire # 1 1
HOS. Star 1 1 3 1 1 7
HOS. Fort Payne ** 2 1 2 2 1 1 9
HOS. Whitmire Hosiery 1 1 2
HOS. Clinton Hosiery 1 1 1 3
TOTALS 17 21 0 17 25 66 17 39 44 21 42 7 19 15 350
** = Fort Payne lists 9 Employees under a "General Clerk" category.
These were spread based upon approach used by Peter Davids to spread "Office Clerks" at yarn mills.
# = Peter Davids judgementally spread employees categorized as "Office Clerks" (4/16/96).
* Secretaries and receptionists perform various accounting clerical activities
General Observations All Processes Summary Report By Plant
| 24
© 2016 eprentise. All rights reserved.
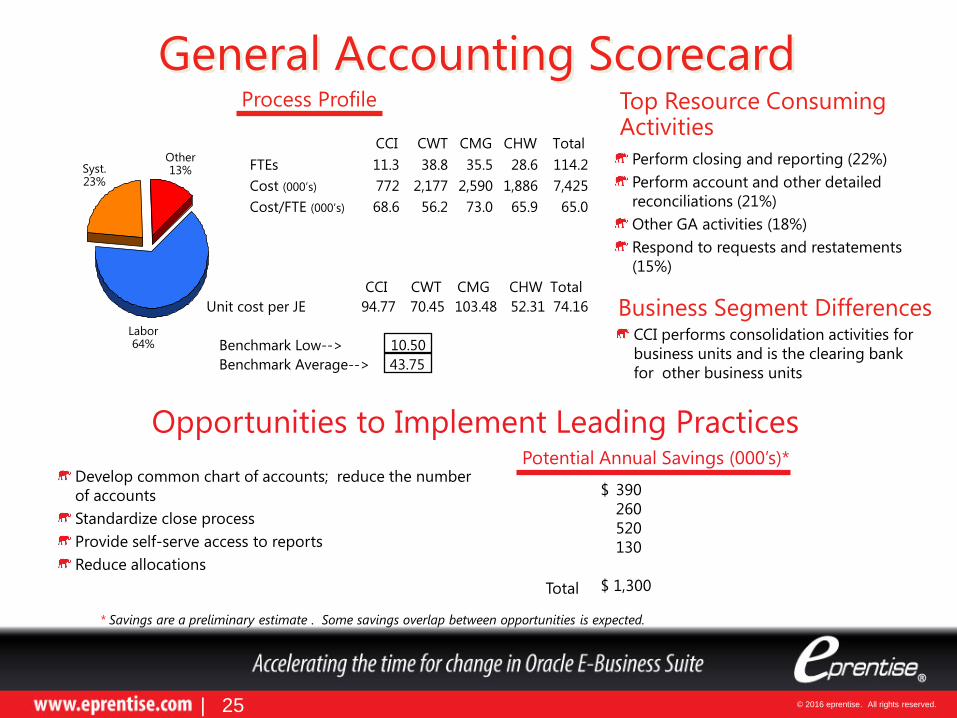
Unit cost per JE 94.77 70.45 103.48 52.31 74.16
Benchmark Low--> 10.50
Benchmark Average--> 43.75
General Accounting Scorecard
Perform closing and reporting (22%)
Perform account and other detailed
reconciliations (21%)
Other GA activities (18%)
Respond to requests and restatements
(15%)
Develop common chart of accounts; reduce the number
of accounts
Standardize close process
Provide self-serve access to reports
Reduce allocations
Business Segment Differences
FTEs 11.3 38.8 35.5 28.6 114.2
Cost (000’s) 772 2,177 2,590 1,886 7,425
Cost/FTE (000’s) 68.6 56.2 73.0 65.9 65.0
Top Resource Consuming Activities
Labor 64%
Syst. 23%
Other 13%
Process Profile
CCI CWT CMG CHW Total
CCI CWT CMG CHW Total
CCI performs consolidation activities for
business units and is the clearing bank
for other business units
Opportunities to Implement Leading Practices Potential Annual Savings (000’s)*
$ 390
260
520
130
$ 1,300 Total
| 25
* Savings are a preliminary estimate . Some savings overlap between opportunities is expected.
© 2016 eprentise. All rights reserved.
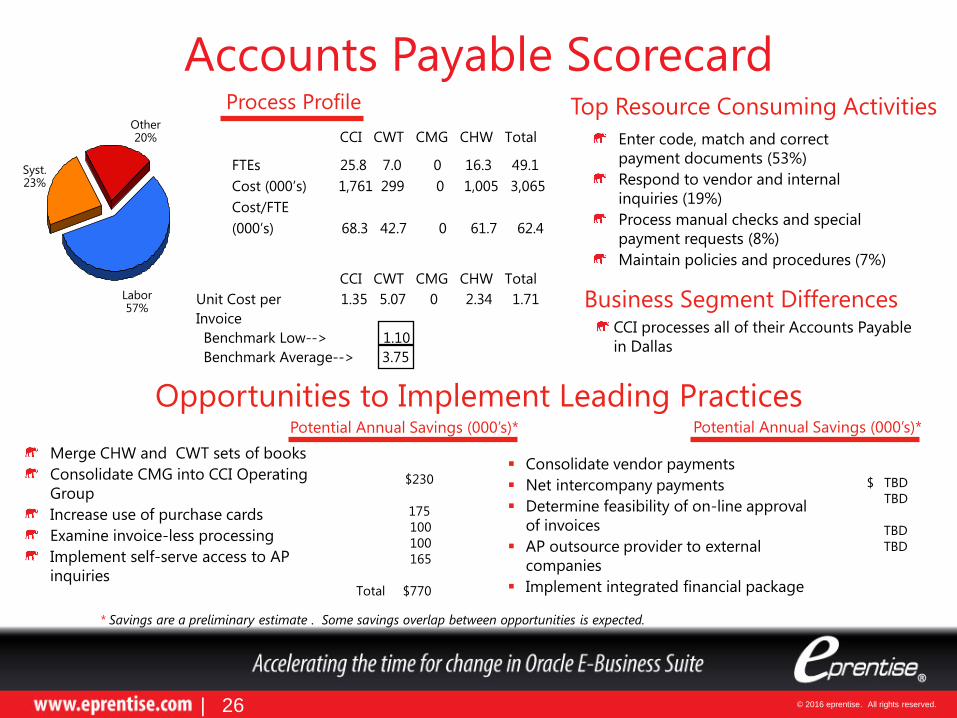
Unit Cost per 1.35 5.07 0 2.34 1.71
Invoice
Benchmark Low--> 1.10
Benchmark Average--> 3.75
Enter code, match and correct
payment documents (53%)
Respond to vendor and internal
inquiries (19%)
Process manual checks and special
payment requests (8%)
Maintain policies and procedures (7%)
Process Profile
Merge CHW and CWT sets of books
Consolidate CMG into CCI Operating
Group
Increase use of purchase cards
Examine invoice-less processing
Implement self-serve access to AP
inquiries
FTEs 25.8 7.0 0 16.3 49.1
Cost (000’s) 1,761 299 0 1,005 3,065
Cost/FTE
(000’s) 68.3 42.7 0 61.7 62.4
Labor 57%
Syst. 23%
Other 20% CCI CWT CMG CHW Total
CCI CWT CMG CHW Total
CCI processes all of their Accounts Payable
in Dallas
Consolidate vendor payments
Net intercompany payments
Determine feasibility of on-line approval
of invoices
AP outsource provider to external
companies
Implement integrated financial package
Accounts Payable Scorecard
Business Segment Differences
Top Resource Consuming Activities
Opportunities to Implement Leading Practices Potential Annual Savings (000’s)*
$230
175
100
100
165
$770
$ TBD
TBD
TBD
TBD
Total
Potential Annual Savings (000’s)*
| 26
* Savings are a preliminary estimate . Some savings overlap between opportunities is expected.
© 2016 eprentise. All rights reserved.
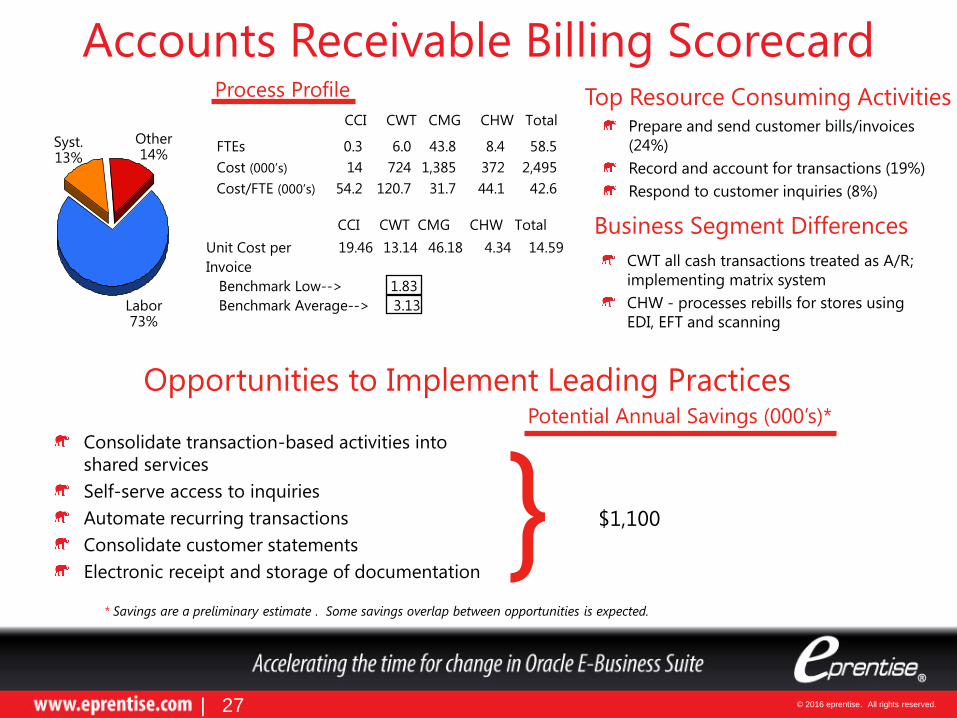
Unit Cost per 19.46 13.14 46.18 4.34 14.59
Invoice
Benchmark Low--> 1.83
Benchmark Average--> 3.13
Accounts Receivable Billing Scorecard
Prepare and send customer bills/invoices
(24%)
Record and account for transactions (19%)
Respond to customer inquiries (8%)
Process Profile
Consolidate transaction-based activities into
shared services
Self-serve access to inquiries
Automate recurring transactions
Consolidate customer statements
Electronic receipt and storage of documentation
FTEs 0.3 6.0 43.8 8.4 58.5
Cost (000’s) 14 724 1,385 372 2,495
Cost/FTE (000’s) 54.2 120.7 31.7 44.1 42.6
Labor 73%
Syst. 13%
Other 14%
CCI CWT CMG CHW Total
CWT all cash transactions treated as A/R;
implementing matrix system
CHW - processes rebills for stores using
EDI, EFT and scanning
* Savings are a preliminary estimate . Some savings overlap between opportunities is expected.
Business Segment Differences
Top Resource Consuming Activities
Opportunities to Implement Leading Practices Potential Annual Savings (000’s)*
$1,100 }
CCI CWT CMG CHW Total
| 27
© 2016 eprentise. All rights reserved.
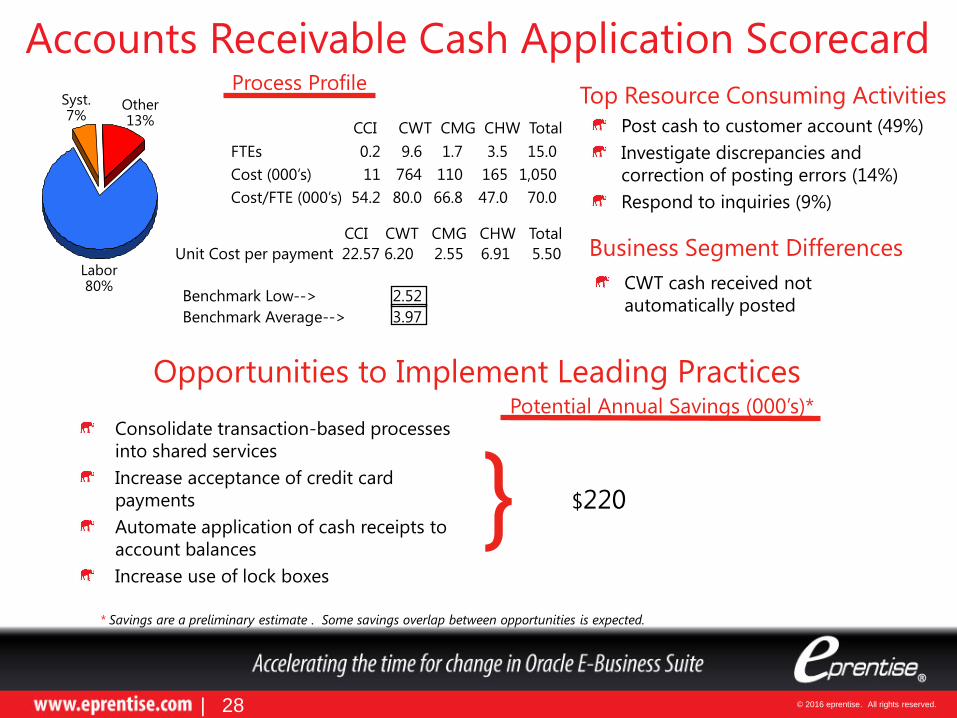
Unit Cost per payment 22.57 6.20 2.55 6.91 5.50
Benchmark Low--> 2.52
Benchmark Average--> 3.97
Accounts Receivable Cash Application Scorecard
Post cash to customer account (49%)
Investigate discrepancies and
correction of posting errors (14%)
Respond to inquiries (9%)
Process Profile
Consolidate transaction-based processes
into shared services
Increase acceptance of credit card
payments
Automate application of cash receipts to
account balances
Increase use of lock boxes
FTEs 0.2 9.6 1.7 3.5 15.0
Cost (000’s) 11 764 110 165 1,050
Cost/FTE (000’s) 54.2 80.0 66.8 47.0 70.0
Labor 80%
Syst. 7%
Other 13%
CCI CWT CMG CHW Total
CCI CWT CMG CHW Total
CWT cash received not
automatically posted
Business Segment Differences
Top Resource Consuming Activities
Opportunities to Implement Leading Practices Potential Annual Savings (000’s)*
$220 }
| 28
* Savings are a preliminary estimate . Some savings overlap between opportunities is expected.
© 2016 eprentise. All rights reserved.
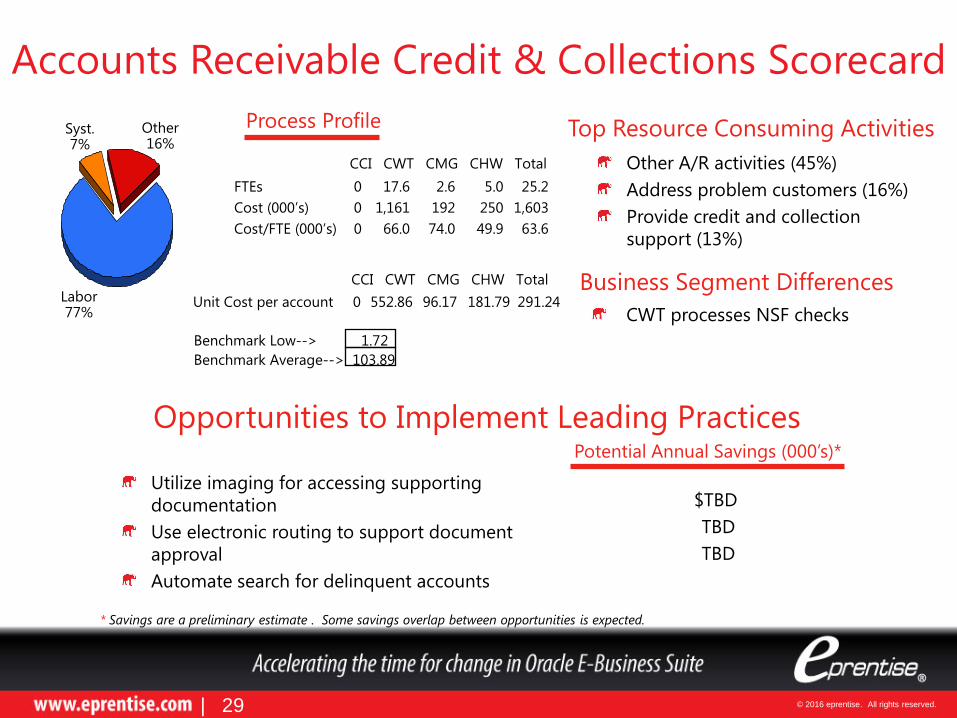
Accounts Receivable Credit & Collections Scorecard
Other A/R activities (45%)
Address problem customers (16%)
Provide credit and collection
support (13%)
Process Profile
Utilize imaging for accessing supporting
documentation
Use electronic routing to support document
approval
Automate search for delinquent accounts
FTEs 0 17.6 2.6 5.0 25.2
Cost (000’s) 0 1,161 192 250 1,603
Cost/FTE (000’s) 0 66.0 74.0 49.9 63.6
Labor 77%
Syst. 7%
Other 16%
Unit Cost per account 0 552.86 96.17 181.79 291.24
Benchmark Low--> 1.72
Benchmark Average--> 103.89
CCI CWT CMG CHW Total
CCI CWT CMG CHW Total
CWT processes NSF checks
Business Segment Differences
Top Resource Consuming Activities
Opportunities to Implement Leading Practices Potential Annual Savings (000’s)*
$TBD
TBD
TBD
| 29
* Savings are a preliminary estimate . Some savings overlap between opportunities is expected.
© 2016 eprentise. All rights reserved.
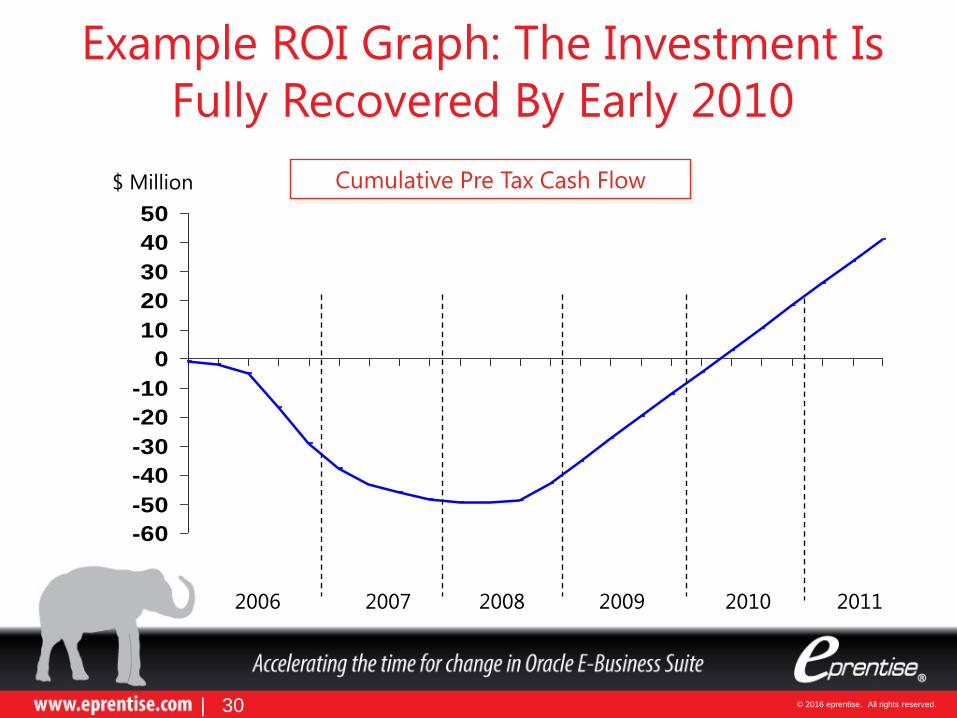
Example ROI Graph: The Investment Is
Fully Recovered By Early 2010
-60
-50
-40
-30
-20
-10
0
10
20
30
40
50
2006 2007 2008 2009
$ Million
2010
Cumulative Pre Tax Cash Flow
2011
| 30
© 2016 eprentise. All rights reserved.
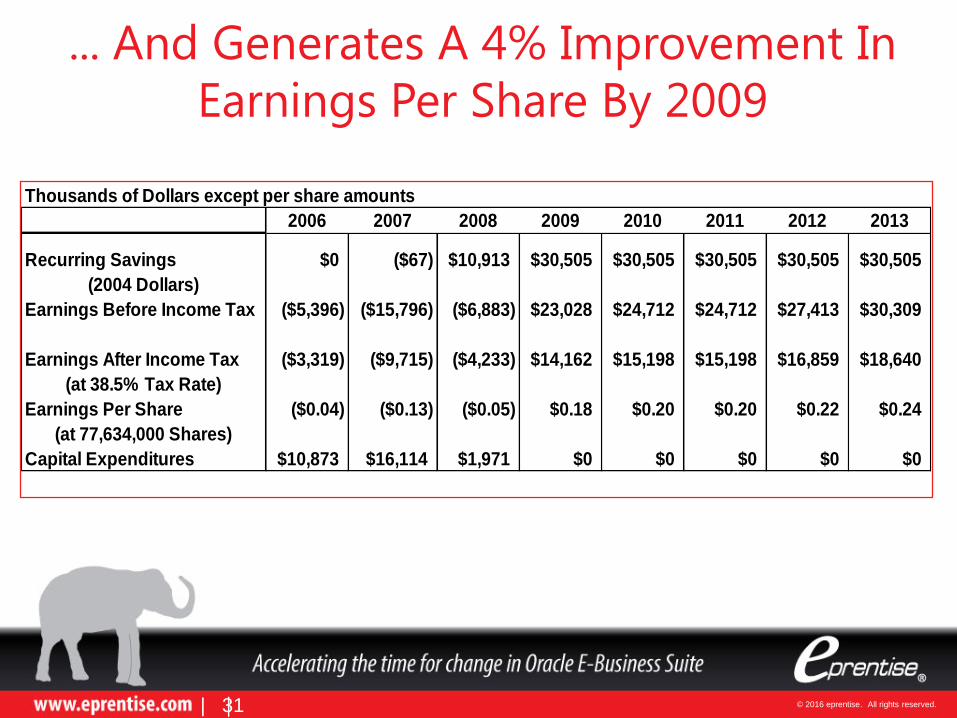
... And Generates A 4% Improvement In
Earnings Per Share By 2009
Thousands of Dollars except per share amounts
2006 2007 2008 2009 2010 2011 2012 2013
Recurring Savings $0 ($67) $10,913 $30,505 $30,505 $30,505 $30,505 $30,505
(2004 Dollars)
Earnings Before Income Tax ($5,396) ($15,796) ($6,883) $23,028 $24,712 $24,712 $27,413 $30,309
Earnings After Income Tax ($3,319) ($9,715) ($4,233) $14,162 $15,198 $15,198 $16,859 $18,640
(at 38.5% Tax Rate)
Earnings Per Share ($0.04) ($0.13) ($0.05) $0.18 $0.20 $0.20 $0.22 $0.24
(at 77,634,000 Shares)
Capital Expenditures $10,873 $16,114 $1,971 $0 $0 $0 $0 $0
| | 31
© 2016 eprentise. All rights reserved.
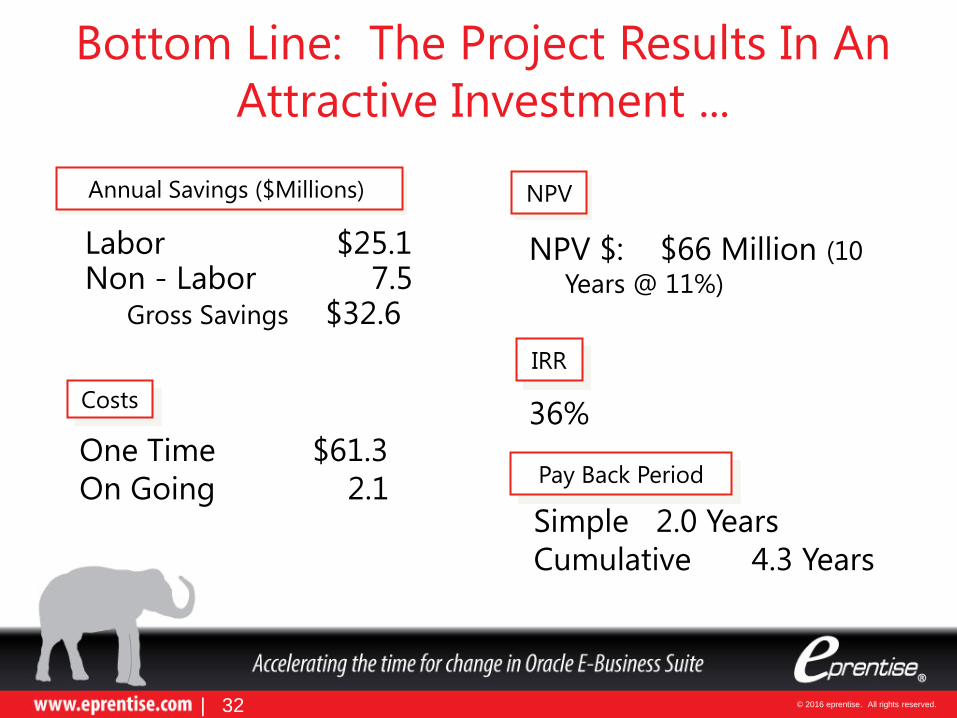
Bottom Line: The Project Results In An
Attractive Investment ...
NPV $: $66 Million (10
Years @ 11%)
36%
Labor $25.1 Non - Labor 7.5
Gross Savings $32.6
Annual Savings ($Millions)
Costs
NPV
IRR
Pay Back Period
Simple 2.0 Years
Cumulative 4.3 Years
One Time $61.3
On Going 2.1
| 32
© 2016 eprentise. All rights reserved.
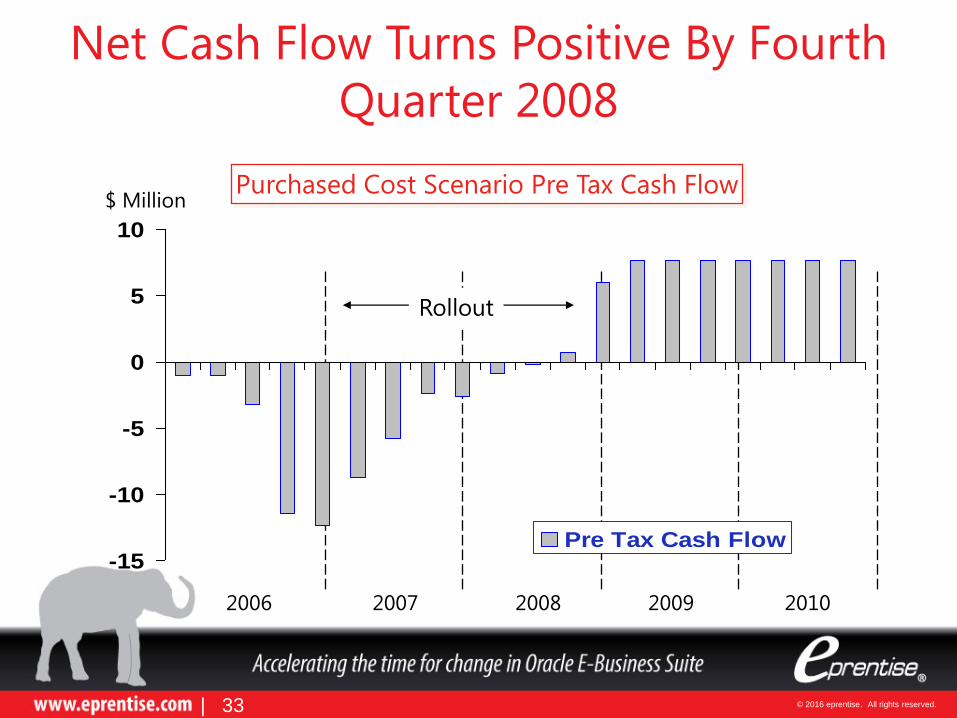
Net Cash Flow Turns Positive By Fourth
Quarter 2008
2006 2007 2008 2009
$ Million
2010
-15
-10
-5
0
5
10
Pre Tax Cash Flow
Purchased Cost Scenario Pre Tax Cash Flow
Rollout
| 33
© 2016 eprentise. All rights reserved.
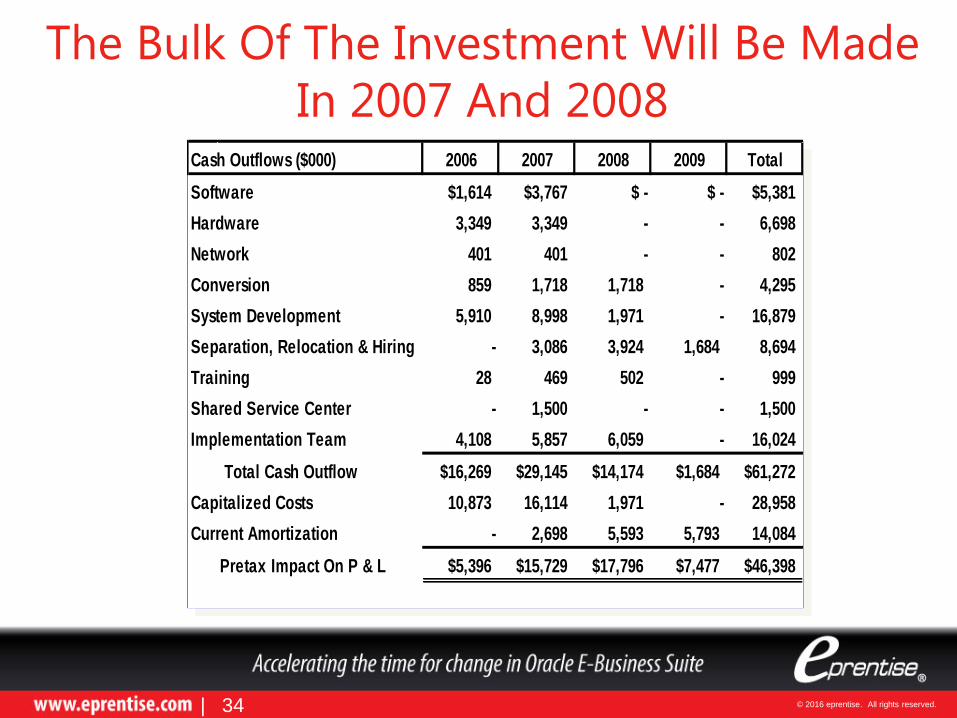
The Bulk Of The Investment Will Be Made
In 2007 And 2008 Cash Outflows ($000) 2006 2007 2008 2009 Total
Software $1,614 $3,767 $ - $ - $5,381
Hardware 3,349 3,349 - - 6,698
Network 401 401 - - 802
Conversion 859 1,718 1,718 - 4,295
System Development 5,910 8,998 1,971 - 16,879
Separation, Relocation & Hiring - 3,086 3,924 1,684 8,694
Training 28 469 502 - 999
Shared Service Center - 1,500 - - 1,500
Implementation Team 4,108 5,857 6,059 - 16,024
Total Cash Outflow $16,269 $29,145 $14,174 $1,684 $61,272
Capitalized Costs 10,873 16,114 1,971 - 28,958
Current Amortization - 2,698 5,593 5,793 14,084
Pretax Impact On P & L $5,396 $15,729 $17,796 $7,477 $46,398
| 34
© 2016 eprentise. All rights reserved.
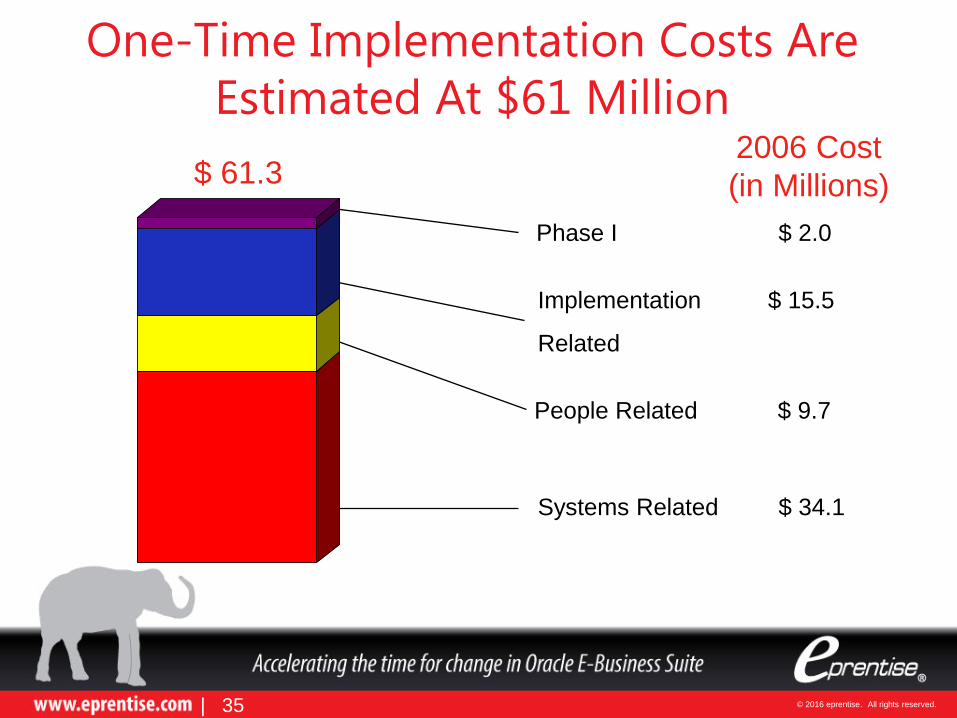
Systems Related $ 34.1
One-Time Implementation Costs Are
Estimated At $61 Million
$ 61.3
People Related $ 9.7
Implementation $ 15.5
Related
2006 Cost
(in Millions)
Phase I $ 2.0
| 35

© 2016 eprentise. All rights reserved.
Calculating the Cost of a Reimplementation
Reimplementation
Tasks
To Implement
or
Reimplement
(person days)
Cost based on
$800/day
Assumptions
Configuration of New Instance 60
3 Business Cycles (purchase-to-pay, order-to-cash,
hire-to-retire),
One month,2 functional resources per business
cycle
Create Extract Scripts 240 2 technical resources, 2 months per business cycle
Create Transformation Code 180 3 technical resources, 1 month per business cycle
Create Load Scripts 240 2 technical resources, 2 months per business cycle
Unit Test Scripts/Code 180 3 technical resources, 1 month per business cycle
Resolve Exceptions 90 3 technical resources, .5 month per business cycle
Implementation Conference Room Pilot I 60
One month,2 functional resources per business
cycle
Changes for Conference Room Pilot I 30
One month,.5 functional resource per business
cycle
Integration Testing 60
One month, 2 functional resources per business
cycle
Implementation Conference Room Pilot II 60
One month, 2 functional resources per business
cycle
Changes for Conference Room Pilot II 30
One month,.5 functional resource per business
cycle
UAT 180
One month, 3 functional resources per business
cycle
Production Go Live Cutover 45 3 resources 15 days
Total Person Days 1455 $1,164,000.00 Duration approximately 14 months
Copyright © 2011 eprentise. All
rights reserved.
36
Example for a single instance

© 2016 eprentise. All rights reserved.
Evaluate Results of a Reimplementation Compared to a
Technical Upgrade with Remodeling
Usually 1 year of history
Maintain sunset instance
Extract, Transform and Load for
retrieval for reconciliation, reports,
statutory requirements, business
intelligence, data warehouse to align
with R12 instance
Redundant operations, maintenance
Silos of information with different
business processes, inconsistent data
Standards difficult to enforce
All history
No sunset instance
Merge like operations
Transparency from balances to
detailed transactions with
complete, consistent data
Common processes and shared
data across the enterprise
Inconsistencies identified and
resolved
| 37
Reimplementation Technical Upgrade with Remodeling
A Business Decision not an IT Decision
© 2016 eprentise. All rights reserved.
Risks
Acceptance of change
Working with new technologies
Cooperation of stakeholders to implement vision
Conflicting business interests may influence priority
of project
Cooperation of key suppliers and customers
| 38
© 2016 eprentise. All rights reserved.
... And Plan To Mitigate Them
Mitigation Plans
Provide adequate dedicated resources
Involve users
Identify and use “champions” at implementation
sites
Implement standardized policies & procedures
Educate personnel in new processes
Obtain support and commitment of related
functional areas
| 39
© 2016 eprentise. All rights reserved.
There Are Compelling Reasons To Move
Forward ... Provides an attractive investment
Minimizes increase in future finance costs
Accelerates and simplifies integration of new acquisitions
Improves focus on value-added activities
Makes better, faster information available for decision-
making
Fosters culture of change to meet competitive challenges
| 40
© 2016 eprentise. All rights reserved.
... And There Are Significant Risks Of Delay
Hinders ability to provide adequate
information for global decision making
Decreases ability to respond rapidly to
changing conditions and opportunities
Impedes ability to create enhanced and
streamlined relationships with customers and
suppliers
Perpetuates duplicative and disjointed
improvement initiatives
| 41
© 2016 eprentise. All rights reserved.
Success Hinges Upon These Critical
Factors Critical Success Factors
Senior management support with leadership by example
Acceptance of standard systems, procedures, data definitions and higher levels of materiality
A willingness to embrace change and an openness toward mistakes
Sufficient resource allocation and financial support
Dissemination and selling of vision
| 42

© 2016 eprentise. All rights reserved.
In Conclusion:
This Is A Compelling Business
Case That Makes The
“Go Forward”
Decision A Reality
| 43
© 2016 eprentise. All rights reserved.
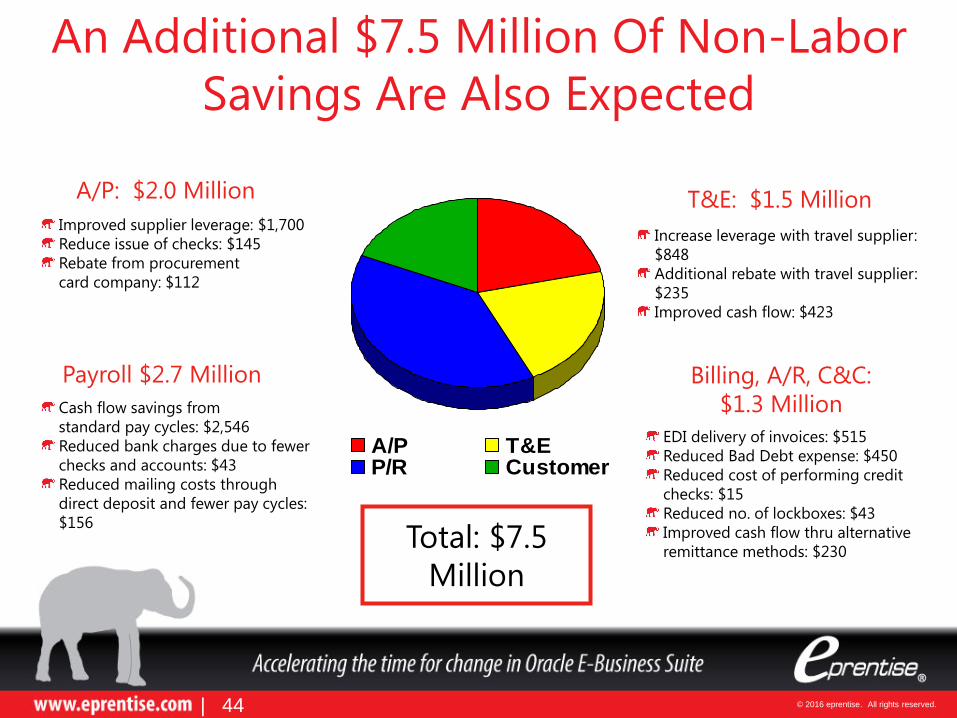
An Additional $7.5 Million Of Non-Labor
Savings Are Also Expected
A/P T&EP/R Customer
EDI delivery of invoices: $515
Reduced Bad Debt expense: $450
Reduced cost of performing credit
checks: $15
Reduced no. of lockboxes: $43
Improved cash flow thru alternative
remittance methods: $230
Billing, A/R, C&C:
$1.3 Million
A/P: $2.0 Million
Total: $7.5
Million
Payroll $2.7 Million
Cash flow savings from
standard pay cycles: $2,546
Reduced bank charges due to fewer
checks and accounts: $43
Reduced mailing costs through
direct deposit and fewer pay cycles:
$156
T&E: $1.5 Million
Increase leverage with travel supplier:
$848
Additional rebate with travel supplier:
$235
Improved cash flow: $423
Improved supplier leverage: $1,700
Reduce issue of checks: $145
Rebate from procurement
card company: $112
| 44
© 2016 eprentise. All rights reserved.
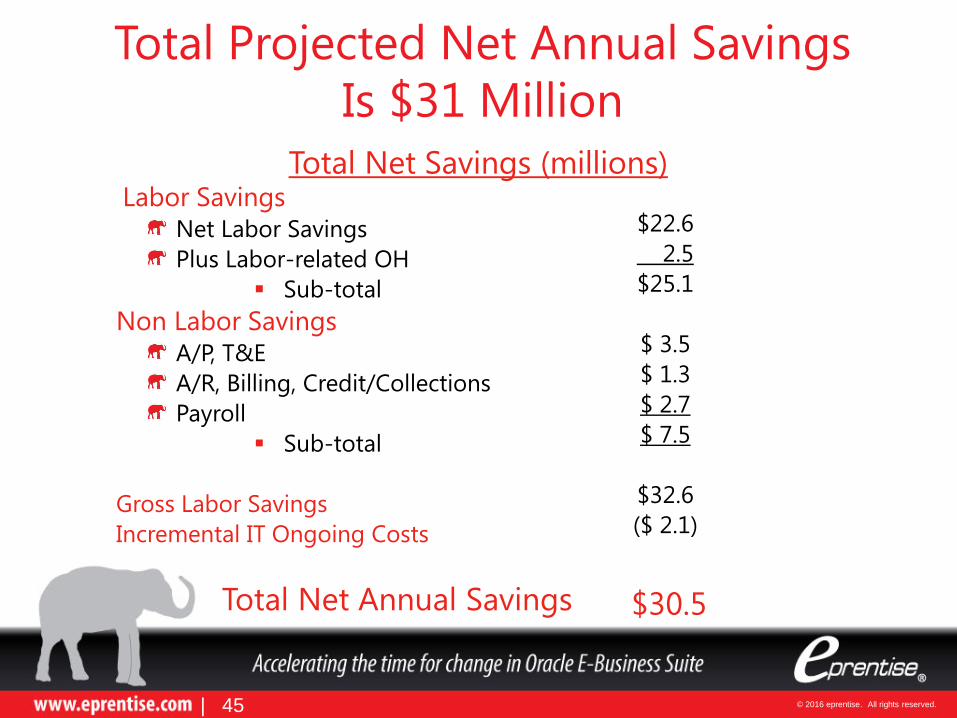
Total Projected Net Annual Savings
Is $31 Million
$22.6
2.5
$25.1
$ 3.5
$ 1.3
$ 2.7
$ 7.5
$32.6
($ 2.1)
$30.5
Total Net Savings (millions) Labor Savings
Net Labor Savings
Plus Labor-related OH
Sub-total
Non Labor Savings A/P, T&E
A/R, Billing, Credit/Collections
Payroll
Sub-total
Gross Labor Savings
Incremental IT Ongoing Costs
Total Net Annual Savings
| 45
© 2016 eprentise. All rights reserved.
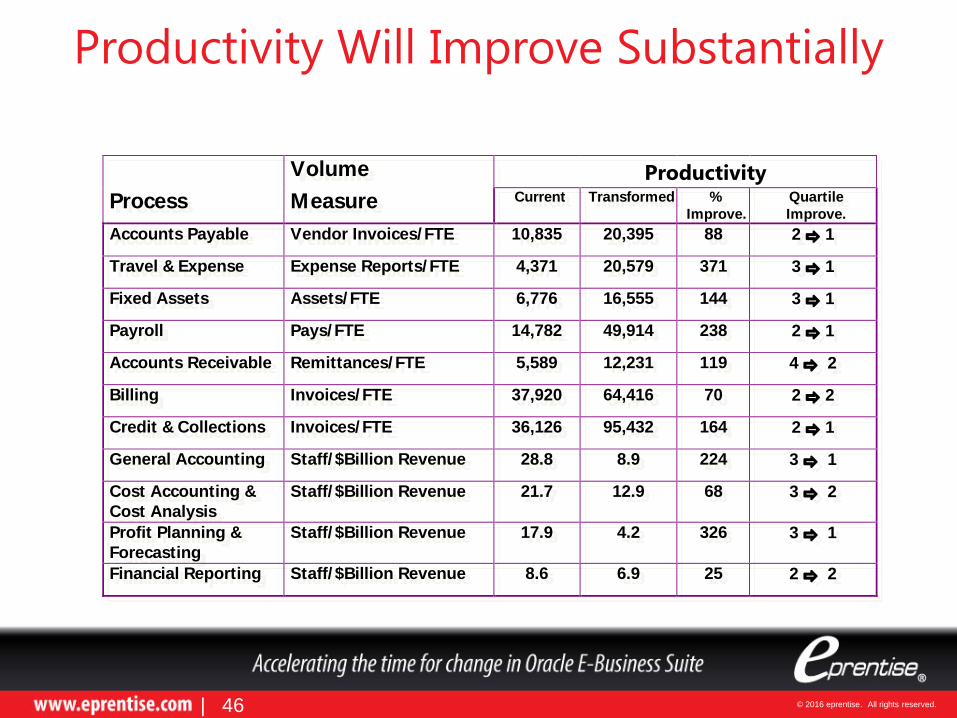
Productivity Will Improve Substantially
Volume
Process Measure Current Transformed %
Improve.
Quartile
Improve.
Accounts Payable Vendor Invoices/ FTE 10,835 20,395 88 2 1
Travel & Expense Expense Reports/ FTE 4,371 20,579 371 3 1
Fixed Assets Assets/ FTE 6,776 16,555 144 3 1
Payroll Pays/ FTE 14,782 49,914 238 2 1
Accounts Receivable Remittances/ FTE 5,589 12,231 119 4 2
Billing Invoices/ FTE 37,920 64,416 70 2 2
Credit & Collections Invoices/ FTE 36,126 95,432 164 2 1
General Accounting Staff/ $Billion Revenue 28.8 8.9 224 3 1
Cost Accounting &
Cost Analysis
Staff/ $Billion Revenue 21.7 12.9 68 3 2
Profit Planning &
Forecasting
Staff/ $Billion Revenue 17.9 4.2 326 3 1
Financial Reporting Staff/ $Billion Revenue 8.6 6.9 25 2 2
Productivity
| 46
© 2016 eprentise. All rights reserved.
The Project Will Generate Other
Significant Benefits Minimizes the growth of future finance costs
Reduces cost of finance processes at future acquisitions
Eliminates disjointed improvement program costs
Establishes an infrastructure which would be leveraged
(Manufacturing, Purchasing, HR, etc.)
Develops a European IT infrastructure
Reduces external/internal audit costs
Foundation for new process roll-outs in other countries
Foundation for migration of other departments to SSC
| 47
© 2016 eprentise. All rights reserved.
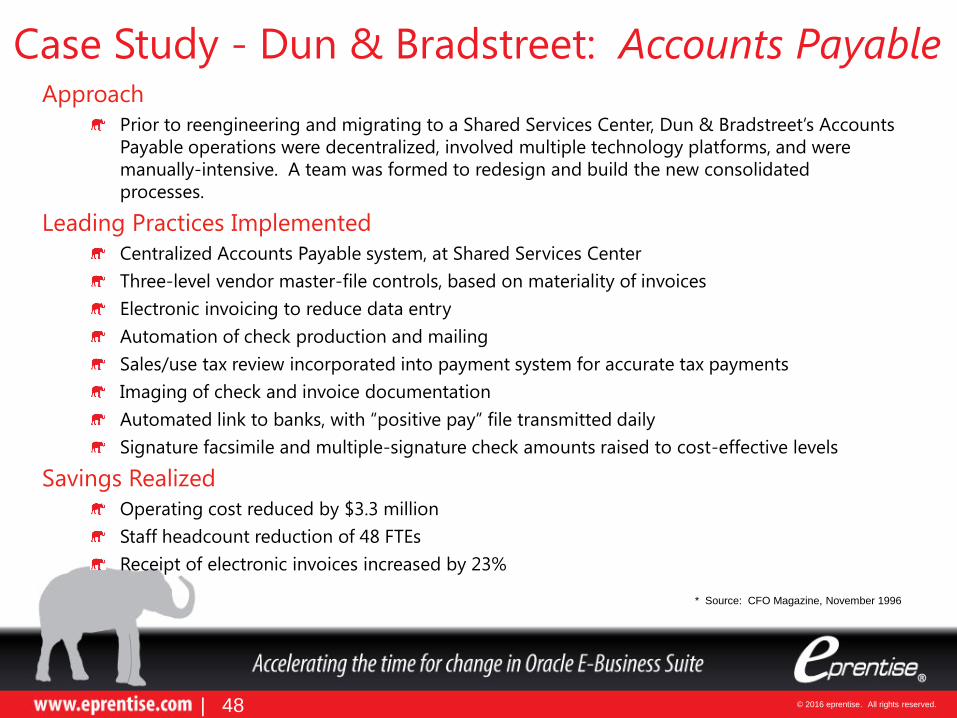
Case Study - Dun & Bradstreet: Accounts Payable
* Source: CFO Magazine, November 1996
Approach
Prior to reengineering and migrating to a Shared Services Center, Dun & Bradstreet’s Accounts
Payable operations were decentralized, involved multiple technology platforms, and were
manually-intensive. A team was formed to redesign and build the new consolidated
processes.
Leading Practices Implemented
Centralized Accounts Payable system, at Shared Services Center
Three-level vendor master-file controls, based on materiality of invoices
Electronic invoicing to reduce data entry
Automation of check production and mailing
Sales/use tax review incorporated into payment system for accurate tax payments
Imaging of check and invoice documentation
Automated link to banks, with “positive pay” file transmitted daily
Signature facsimile and multiple-signature check amounts raised to cost-effective levels
Savings Realized
Operating cost reduced by $3.3 million
Staff headcount reduction of 48 FTEs
Receipt of electronic invoices increased by 23%
| 48
© 2016 eprentise. All rights reserved.
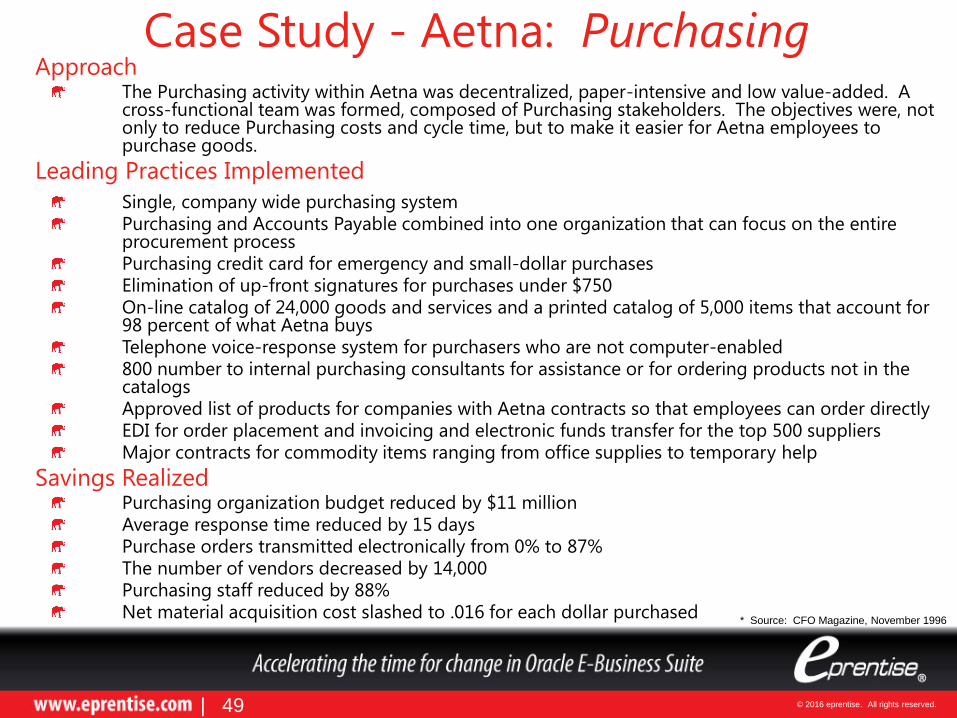
Case Study - Aetna: Purchasing
* Source: CFO Magazine, November 1996
Approach The Purchasing activity within Aetna was decentralized, paper-intensive and low value-added. A cross-functional team was formed, composed of Purchasing stakeholders. The objectives were, not only to reduce Purchasing costs and cycle time, but to make it easier for Aetna employees to purchase goods.
Leading Practices Implemented
Single, company wide purchasing system
Purchasing and Accounts Payable combined into one organization that can focus on the entire procurement process Purchasing credit card for emergency and small-dollar purchases Elimination of up-front signatures for purchases under $750 On-line catalog of 24,000 goods and services and a printed catalog of 5,000 items that account for 98 percent of what Aetna buys Telephone voice-response system for purchasers who are not computer-enabled 800 number to internal purchasing consultants for assistance or for ordering products not in the catalogs Approved list of products for companies with Aetna contracts so that employees can order directly EDI for order placement and invoicing and electronic funds transfer for the top 500 suppliers Major contracts for commodity items ranging from office supplies to temporary help
Savings Realized Purchasing organization budget reduced by $11 million
Average response time reduced by 15 days Purchase orders transmitted electronically from 0% to 87% The number of vendors decreased by 14,000 Purchasing staff reduced by 88% Net material acquisition cost slashed to .016 for each dollar purchased
| 49