Embed Size (px)
Citation preview
RESEARCH ARTICLE
Copyright Verdiyeva N. This is an open access article distributed under the terms of the Creative Commons Attribution License (CC-BY 4.0), which permits unrestricted use, distribution, and reproduction in any medium, provided the original author and source are credited.
Population and Economics 3(3): 43–73
DOI 10.3897/popecon.3.e47233
How the population of the Republic of Azerbaijan is ageing: causes and potential for social and economic development
Nailya Verdiyeva1
1 Ministry of Labour and Social Protection of Population of the Republic of Azerbaijan Baku, AZ1000, Republic of Azerbaijan
Received 21 July 2019 ♦ Accepted 24 September 2019 ♦ Published 30 September 2019
Citation: Verdiyeva N (2019) How the population of the Republic of Azerbaijan is ageing: causes and potential for social and economic development. Population and Economics 3(3): 43–73. https://doi.org/10.3897/po-pecon.3.e47233
AbstractThe article deals with the trends of population ageing in the Republic of Azerbaijan. The author con-siders the stages of change in population size and age structure in the 20th and the 21st centuries as a result of historical evolution of birth rate and death rate. Based on the analysis of fertility trends and life expectancy, it is shown that the decline in fertility has so far been the most important factor in the population ageing, whereas the decline in the mortality in older ages is only beginning to contribute to this process. It is emphasized that anomalies in the sex ratio at birth lead to accelerated ageing of the population. The gradual ageing and reduction of the share of the working-age population, as well as the growth of the dependency ratio and the exhaustion of the potential of the first demographic dividend, are also analysed in the paper.
KeywordsAzerbaijan; age structure; life expectancy; fertility; population ageing; population growth rate; popu-lation size
JEL Codes: J10, J11, J13
Introduction
Population ageing is a topical issue that has consistently been addressed in the context of sus-tainable development, economic growth and social well-being. Population ageing in Azerba-ijan is also widely discussed by politicians and researchers. Nevertheless, the factors and con-
Nailya Verdiyeva: How the population of the Republic of Azerbaijan is ageing...44
sequences of the population ageing in Azerbaijan remain poorly studied, the recent works on the trends of this process are few (Efendiev and Gözalova 2018; Efendiev and Mutalibova 2019) and they are of a quite descriptive rather than research nature, which do not reveal the mechanisms and patterns of population ageing in Azerbaijan. Development of population of the country in different historical periods was analysed in the works of K. Mamedov (1982), Sh. Muradov (2008), M. Mәmmәdova (2007), Kerimov and Gasimova (2013), and others.
Keen interest in these issues is not accidental, as the development strategy of the country (The Development Concept “Azerbaijan 2020: Looking to the Future”) aims to achieve sus-tainable economic growth and high social well-being, taking into account existing opportu-nities and resources.
The impact of demographic factors on socio-economic development has been discussed for a long time by many representatives of social sciences and economists. As a result of the debate on this issue, three points of view emerged. Some believe that population growth is an impediment to economic growth (Coale and Hoover 1959; Bloom et al. 2011). Others believe that population growth and economic growth are directly dependent on each other. In other words, population growth gives impetus to sustained economic growth, or slower population growth leads to lower economic growth (Baker et al 2005; Linden 2017). The third point of view suggests that economic growth and population growth are hardly linked (Kelley 2001). Adherents of each point of view find evidence in favour of their hypothesis. However, despite conflicting views, most theorists and practitioners focus on population growth rates and age structure, recognizing its the primary variable for assessing the impact of the population dynamics on economic growth.
Here, we analyze the dynamics of the population size and age structure of the Republic of Azerbaijan. The analysis is based on the official data of the State Statistics Committee (SSC) of the Republic of Azerbaijan. Calculations are also based on the SSC data. For comparative characteristics of different countries information from the UN database is used (UN Popu-lation 2017).
Stages of population size and structure change
Without going into the historical essay on the first data on the population of Azerbaijan, we will start counting from the Russian Empire Population Census of 1897.The SSC publicati-ons also take the 1897 Population Census data as the starting point. In 1897, Georgia was the largest country in terms of population size in the South Caucasus. However, according to the 1970 USSR Population Census, Azerbaijan was ranked the first Caucasus republic in terms of population size (5.1 million) while Gergia was ranked second (4.7 million).
In general, since the first census of 1897 up to date, the population of Azerbaijan1 has grown by over 5.5 times from 1.8 million2 to 10 million persons. The population of Georgia increased by 1.9 times, Armenia — by 3.7 times, and according to the national statistical ser-
1 Data are given on the basis of officially published data on population movement by the SSC of Azerbaijan. The SSC publications do not officially explain which provinces (gubernii) are stipulated, but most likely, it is about Baku, Elisavetpol and partially Erivan provinces. URL: http://elib.shpl.ru/ru/nodes/12632-pervaya-vseobschaya-perepis-naseleniya-rossiyskoy-imperii-1897-goda-spb-1897-1905.
2 https://www.stat.gov.az/source/demoqraphy/az/001_4-6.xls.

Population and Economics 3(3): 43–73 45
vices of these countries in the beginning of 2019 amounted to 3.7 and 3.0 million persons, respectively.
The development of the population of Azerbaijan for the period from 1897 can be condi-tionally divided into several stages that have their own characteristics. We will characterize them in more detail.
Intensive development of the oil (oil production, and later oil refining) industry and transport infrastructure in the late 19th and early 20th centuries in Azerbaijan largely pre-determined the demographic development of that period. The population of the country has grown steadily. If in 1863 the total population of Azerbaijan was estimated at 1,129,900 peo-ple, according to the census of 1897 it was already 1,807 thousand, and by 1913 it increased to 2,339,200 people. The natural movement of the population was characterized by high numbers of births and deaths. Migration contributed greatly to the country’s population growth. According to the data given by Vorobyova and Lezhenkina (2008), 44.2% of the total population growth of the country for the period 1886-1913 was provided due to a significant influx of labour migrants to Azerbaijan due to the rapidly developing oil industry. The posi-tive balance of migration for the periods 1886–1887 and 1897–1913 increased from 133.4 to 219.8 thousand persons (Alekseev and Karachurina 1998).
Since 1914, the population of Azerbaijan began to decline. It is obvious that the plight of the population during the First World War, the intervention, the inter-ethnic conflects, along with the economic recession, affected the decline in fertility, increased mortality and significant migration outflow (between 1914 and 1920 the negative migration balance of migration amounted to 481 thousand people and caused absolute reduction of the popula-tion). The population of the country decreased by 17% (-387 thousand people) and by 1920 amounted to 1,952 thousand persons (Vorobyova and Lezhenkina 2008).
In subsequent years before the First USSR Population Census, the population, having increased by 18.5% (362 thousand people), amounted to 2,313,700 persons by 1926. Despite the fact that this period of establishment of Soviet power in Azerbaijan is described as diffi-cult in the destiny of the country, it is positively reflected in demographic indicators.
According to the 1939 census, the population of Azerbaijan had increased by 891,200 persons since 1926, and reached 3,205,200 persons. The average annual population growth rate for this period was 2.5 per cent. That period was characterized by increase in population growth due to natural growth. According to Vorobyova and Lezhenkina (2008), inter-re-publican migration in 1926–1939 had a positive balance, but the intensity of flows slowed down. Data show that in the general population increase between 1926 and 1939 natural growth accounted for 67.8%, and migration - 32.2%. From the early 1950s, the migration balance became steadily negative until 2008; some periods between the mid-1970s and mid-1990s differ in intensity of out-flow, which could be the subject of separate study.
In the next decade, starting from 1942, Azerbaijan experienced a decrease in the po-pulation size caused by the Second World War. The population decreased by almost 15% (472,600 persons) and was 2,732,600 persons in 1949. After 1949, the population began to grow, and by 1955 reached its pre-war size.
In the following years, the trend of population growth continued in the following years. During the period 1950–1959, with an average annual growth of 2.93%, the population in-creased by 35% (965,000 persons). The increase in population size was mainly the result of the natural growth, as in all subsequent periods.
During the intercensal period of 1960–1969, Azerbaijan had the highest population growth of 31% (1,194,000 persons). The average annual population growth rate was 2.98%.
Nailya Verdiyeva: How the population of the Republic of Azerbaijan is ageing...46
However, during this period the intensity of migration flows decreased and the migration balance, as noted above, became negative.
In 1970–1979 the population growth rate stabilized. Since 1975, the negative migration balance began to increase, as a result of which the overall population growth gradually slo-wed down and the average annual growth for the period 1970–1979 amounted to 1.8%. In general, the population increased by 18% (911,000 persons).
Migration outflow of the population, which was accelerating since the early 1980s, con-tinued to remain quite high until the mid-1990s. Despite this, natural growth in 1980–1989 increased the population by 15 per cent (907,000 persons), with an average annual growth rate of 1.5%.
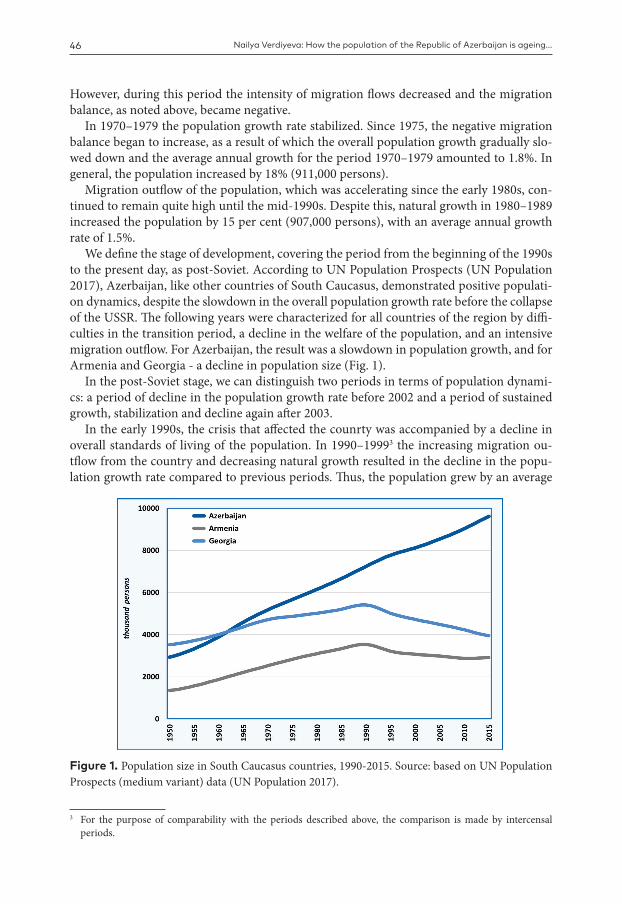
We define the stage of development, covering the period from the beginning of the 1990s to the present day, as post-Soviet. According to UN Population Prospects (UN Population 2017), Azerbaijan, like other countries of South Caucasus, demonstrated positive populati-on dynamics, despite the slowdown in the overall population growth rate before the collapse of the USSR. The following years were characterized for all countries of the region by diffi-culties in the transition period, a decline in the welfare of the population, and an intensive migration outflow. For Azerbaijan, the result was a slowdown in population growth, and for Armenia and Georgia - a decline in population size (Fig. 1).
In the post-Soviet stage, we can distinguish two periods in terms of population dynami-cs: a period of decline in the population growth rate before 2002 and a period of sustained growth, stabilization and decline again after 2003.
In the early 1990s, the crisis that affected the counrty was accompanied by a decline in overall standards of living of the population. In 1990–19993 the increasing migration ou-tflow from the country and decreasing natural growth resulted in the decline in the popu-lation growth rate compared to previous periods. Thus, the population grew by an average
3 For the purpose of comparability with the periods described above, the comparison is made by intercensal periods.
Figure 1. Population size in South Caucasus countries, 1990-2015. Source: based on UN Population Prospects (medium variant) data (UN Population 2017).

Population and Economics 3(3): 43–73 47
of 1.2 per cent per annum during the period of 1990–1999 and increased totally by 12% (822,000 persons).
Then, since 2003, the country entered an era of large-scale reforms aimed at increasing economic growth and improving the social status of the population. At this time, a steady trend of population growth was observed in the country, and in the whole for the period between 2000 and 2009, the average annual population growth was 1.1% and the population increased by 11% (864,000 persons). Like in previous periods, the contribution of positive net migration to overall population growth during this period was declining. However, du-ring this period there was a remarkable change: since 2008 the value of the migration balan-ce changed from negative to positive and remained so for all subsequent years.
Between 2010 and 2018, the population continued to grow, with an average annual growth rate of 1.1%. According to the official data of the SSC of the Republic of Azerbaijan, as of January 1, 2019, the population of the country amounted to 9,981,200 people; the increase was 40% compared to the beginning of 19904 and 24% compared to the beginning of 2000.
Today, the population growth rate of Azerbaijan can be characterized as stable, and at this stage, unlike other countries of the South Caucasus region, the country does not face an acu-te threat of its decline. Despite this, maintaining sustainable and stable population growth that meets geopolitical and national interests remains one of the priorities of the country’s development. The Development Concept “Azerbaijan 2020: Looking to the Future” states this as follows: “Quantitative and qualitative indicators of the population and its structures are the main elements of the force of the nation, and issues such as preservation of the gene pool of the Azerbaijani people, migration and demography, are important in terms of natio-nal security” (Development Concept... 2012: 13).
After the collapse of the USSR and gaining of independence by the countries of the South Caucasus, the population of Azerbaijan, Armenia and Georgia was changing in different ways. According to UN estimates, between 1990 and 2015 the population of Azerbaijan
4 According to the explanations of the SSC of the Republic of Azerbaijan, data on the population of Nagorny Karabakh are given on the basis of the 1989 census, as well as current records of internally displaced persons.
Figure 2. Population growth in Azerbaijan and neighbouring countries (1990-2015). Source: based on UN Population Prospects (medium variant) data (UN Population 2017).
Nailya Verdiyeva: How the population of the Republic of Azerbaijan is ageing...48
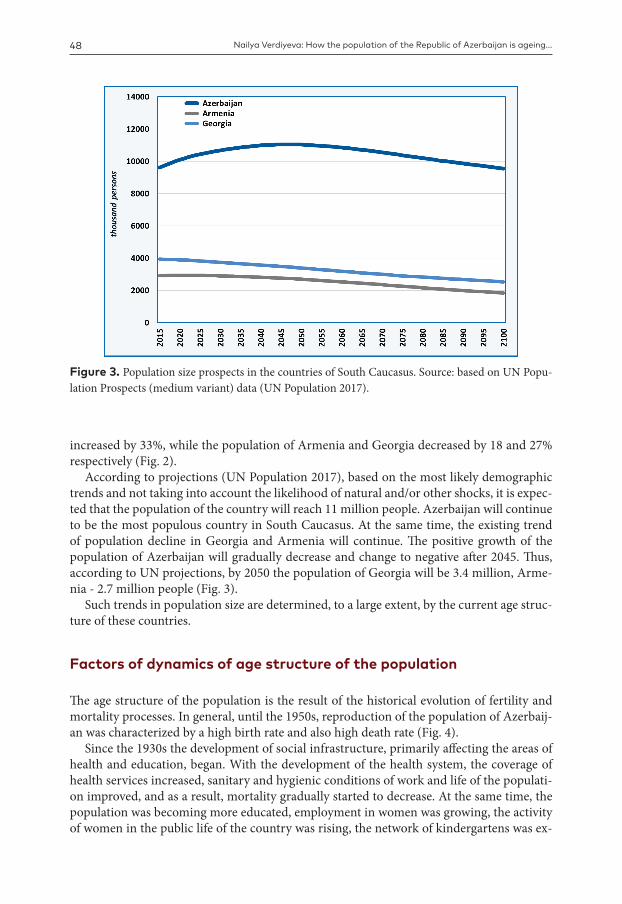
increased by 33%, while the population of Armenia and Georgia decreased by 18 and 27% respectively (Fig. 2).
According to projections (UN Population 2017), based on the most likely demographic trends and not taking into account the likelihood of natural and/or other shocks, it is expec-ted that the population of the country will reach 11 million people. Azerbaijan will continue to be the most populous country in South Caucasus. At the same time, the existing trend of population decline in Georgia and Armenia will continue. The positive growth of the population of Azerbaijan will gradually decrease and change to negative after 2045. Thus, according to UN projections, by 2050 the population of Georgia will be 3.4 million, Arme-nia - 2.7 million people (Fig. 3).
Such trends in population size are determined, to a large extent, by the current age struc-ture of these countries.
Factors of dynamics of age structure of the population
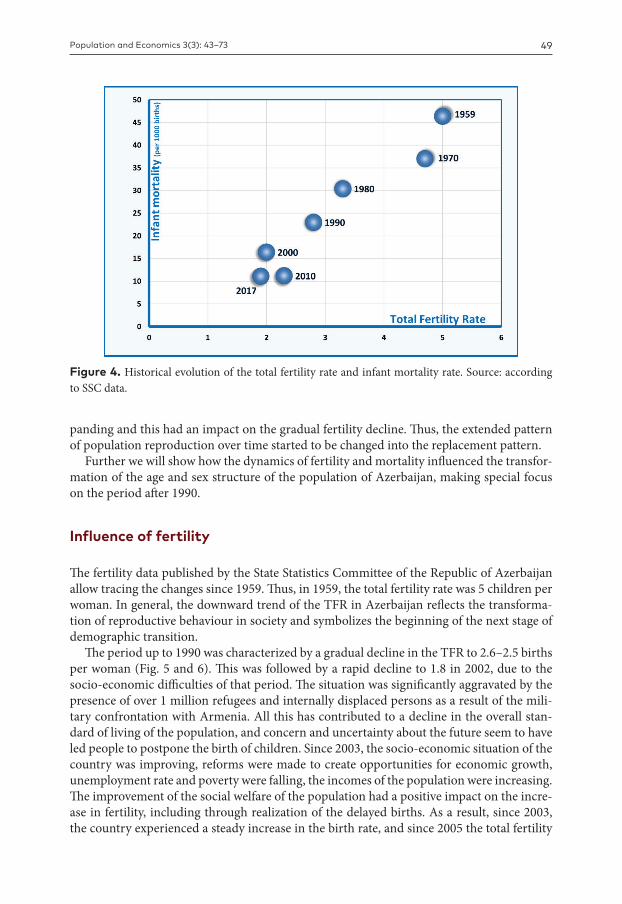
The age structure of the population is the result of the historical evolution of fertility and mortality processes. In general, until the 1950s, reproduction of the population of Azerbaij-an was characterized by a high birth rate and also high death rate (Fig. 4).
Since the 1930s the development of social infrastructure, primarily affecting the areas of health and education, began. With the development of the health system, the coverage of health services increased, sanitary and hygienic conditions of work and life of the populati-on improved, and as a result, mortality gradually started to decrease. At the same time, the population was becoming more educated, employment in women was growing, the activity of women in the public life of the country was rising, the network of kindergartens was ex-
Figure 3. Population size prospects in the countries of South Caucasus. Source: based on UN Popu-lation Prospects (medium variant) data (UN Population 2017).
Population and Economics 3(3): 43–73 49
panding and this had an impact on the gradual fertility decline. Thus, the extended pattern of population reproduction over time started to be changed into the replacement pattern.
Further we will show how the dynamics of fertility and mortality influenced the transfor-mation of the age and sex structure of the population of Azerbaijan, making special focus on the period after 1990.
Influence of fertility
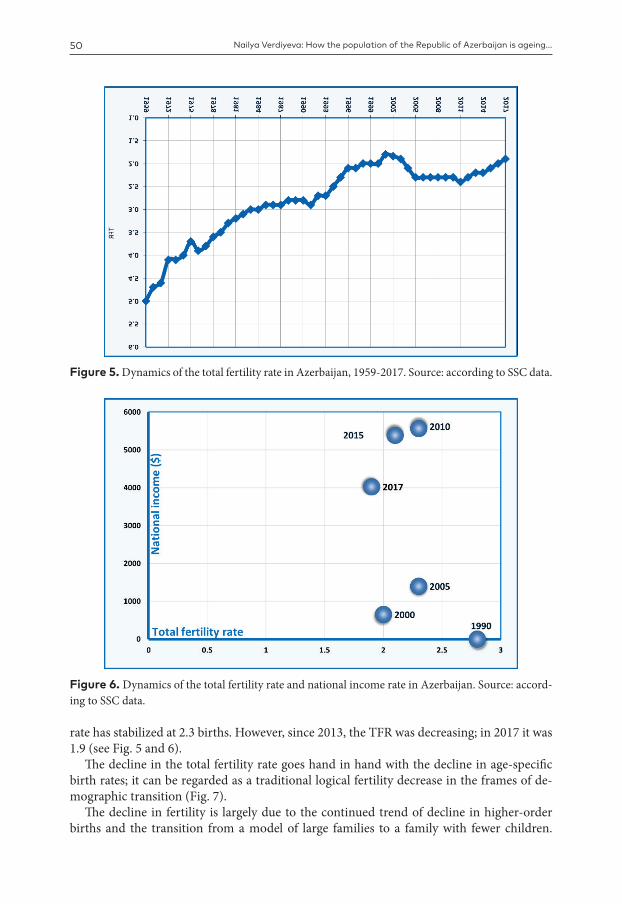
The fertility data published by the State Statistics Committee of the Republic of Azerbaijan allow tracing the changes since 1959. Thus, in 1959, the total fertility rate was 5 children per woman. In general, the downward trend of the TFR in Azerbaijan reflects the transforma-tion of reproductive behaviour in society and symbolizes the beginning of the next stage of demographic transition.
The period up to 1990 was characterized by a gradual decline in the TFR to 2.6–2.5 births per woman (Fig. 5 and 6). This was followed by a rapid decline to 1.8 in 2002, due to the socio-economic difficulties of that period. The situation was significantly aggravated by the presence of over 1 million refugees and internally displaced persons as a result of the mili-tary confrontation with Armenia. All this has contributed to a decline in the overall stan-dard of living of the population, and concern and uncertainty about the future seem to have led people to postpone the birth of children. Since 2003, the socio-economic situation of the country was improving, reforms were made to create opportunities for economic growth, unemployment rate and poverty were falling, the incomes of the population were increasing. The improvement of the social welfare of the population had a positive impact on the incre-ase in fertility, including through realization of the delayed births. As a result, since 2003, the country experienced a steady increase in the birth rate, and since 2005 the total fertility
Figure 4. Historical evolution of the total fertility rate and infant mortality rate. Source: according to SSC data.
Nailya Verdiyeva: How the population of the Republic of Azerbaijan is ageing...50
rate has stabilized at 2.3 births. However, since 2013, the TFR was decreasing; in 2017 it was 1.9 (see Fig. 5 and 6).
The decline in the total fertility rate goes hand in hand with the decline in age-specific birth rates; it can be regarded as a traditional logical fertility decrease in the frames of de-mographic transition (Fig. 7).
The decline in fertility is largely due to the continued trend of decline in higher-order births and the transition from a model of large families to a family with fewer children.
Figure 5. Dynamics of the total fertility rate in Azerbaijan, 1959-2017. Source: according to SSC data.
Figure 6. Dynamics of the total fertility rate and national income rate in Azerbaijan. Source: accord-ing to SSC data.

Population and Economics 3(3): 43–73 51
Figure 7. Dynamics of the age-specific birth rates in Azerbaijan, 1970-2017. Source: according to SSC data.
Table 1. Changes in the number of children in families between the 1999 and 2009 censuses.
Households with children under 18 years of age (thousands)total urban areas rural areas
2009 compared to 1999
2009 compared to 1999
2009 compared to 1999
Total 1314.5 +2,8% 680.7 +3,3% 633.8 +2,2%Of which:with 1 child 396.0 +37,4% 226.9 +31,8% 169.1 +45,7%with 2 children 529.9 +17,6% 276.6 +11,3% 253.2 +25,3%with 3 children 261.9 -19,7% 120.3 -19,3% 141.6 -20,1%with 4 or more children 126.7 -40,8% 58.8 -36,3% 69.9 -44,0%
Households with children under 18 years of age (%)2009 1999 2009 1999 2009 1999
Total 100 100 100 100 100 100Of which:with 1 child 30.1 22.5 33.3 26.1 26.7 18.7with 2 children 40.3 35.2 40.7 37.7 40.0 32.6with 3 children 19.9 25.5 17.7 22.6 22.3 28.6with 4 or more children 9.7 16.7 8.3 13.5 11.0 20.1
Source: according to SSC data.
According to the 1999 and 2009 censuses, despite an overall increase (by 3%) in the number of families (households) with children under 18 years of age, the number of families with three or more children decreased by 20%, the number of families with four or more children decreased by 41% (Table 1). During the same period, the proportion of families with three or
Nailya Verdiyeva: How the population of the Republic of Azerbaijan is ageing...52
more children fell from 26 to 20%, and the proportion of families with four or more children fell from roughly 17 to 10%.
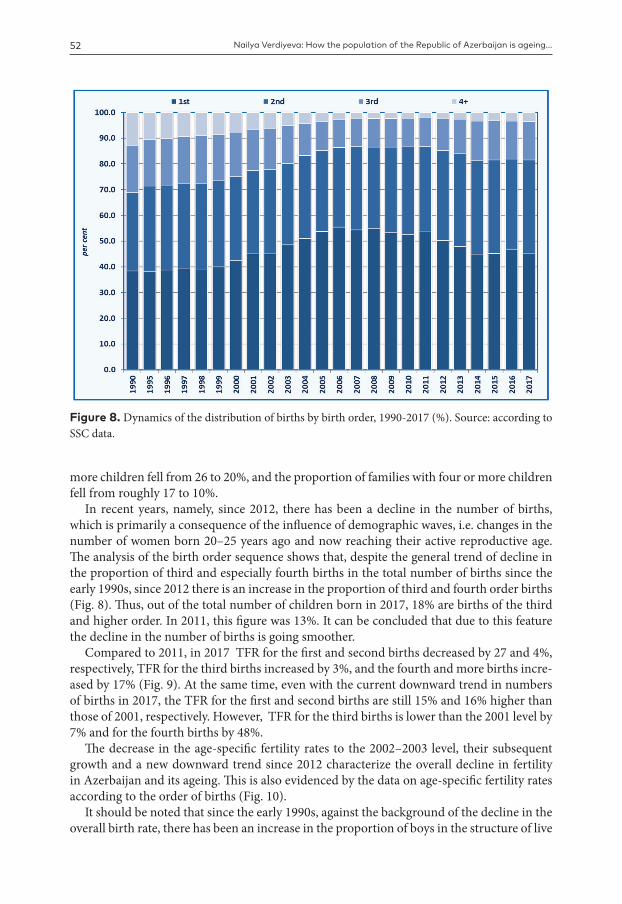
In recent years, namely, since 2012, there has been a decline in the number of births, which is primarily a consequence of the influence of demographic waves, i.e. changes in the number of women born 20–25 years ago and now reaching their active reproductive age. The analysis of the birth order sequence shows that, despite the general trend of decline in the proportion of third and especially fourth births in the total number of births since the early 1990s, since 2012 there is an increase in the proportion of third and fourth order births (Fig. 8). Thus, out of the total number of children born in 2017, 18% are births of the third and higher order. In 2011, this figure was 13%. It can be concluded that due to this feature the decline in the number of births is going smoother.
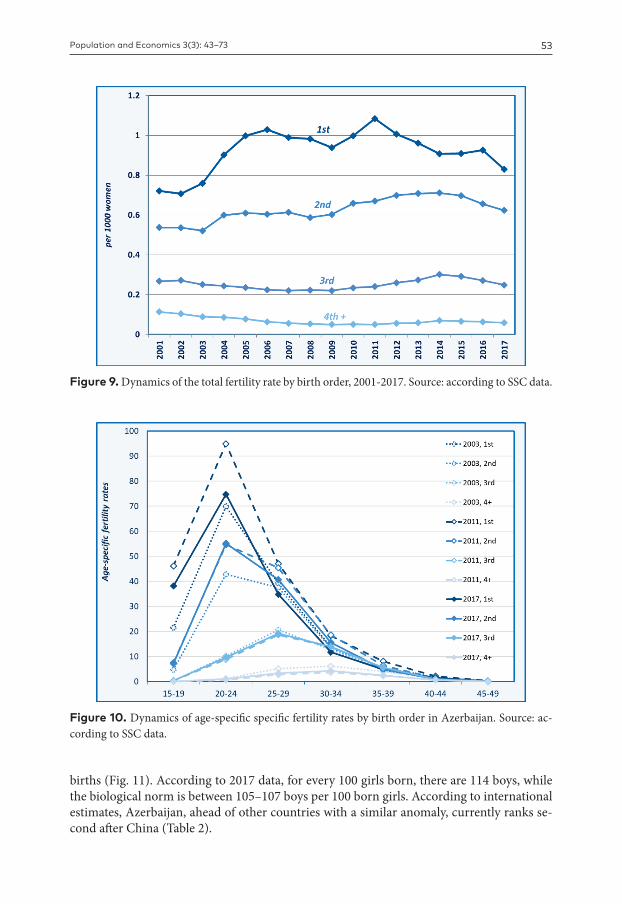
Compared to 2011, in 2017 TFR for the first and second births decreased by 27 and 4%, respectively, TFR for the third births increased by 3%, and the fourth and more births incre-ased by 17% (Fig. 9). At the same time, even with the current downward trend in numbers of births in 2017, the TFR for the first and second births are still 15% and 16% higher than those of 2001, respectively. However, TFR for the third births is lower than the 2001 level by 7% and for the fourth births by 48%.
The decrease in the age-specific fertility rates to the 2002–2003 level, their subsequent growth and a new downward trend since 2012 characterize the overall decline in fertility in Azerbaijan and its ageing. This is also evidenced by the data on age-specific fertility rates according to the order of births (Fig. 10).
It should be noted that since the early 1990s, against the background of the decline in the overall birth rate, there has been an increase in the proportion of boys in the structure of live
Figure 8. Dynamics of the distribution of births by birth order, 1990-2017 (%). Source: according to SSC data.
Population and Economics 3(3): 43–73 53
Figure 9. Dynamics of the total fertility rate by birth order, 2001-2017. Source: according to SSC data.
Figure 10. Dynamics of age-specific specific fertility rates by birth order in Azerbaijan. Source: ac-cording to SSC data.
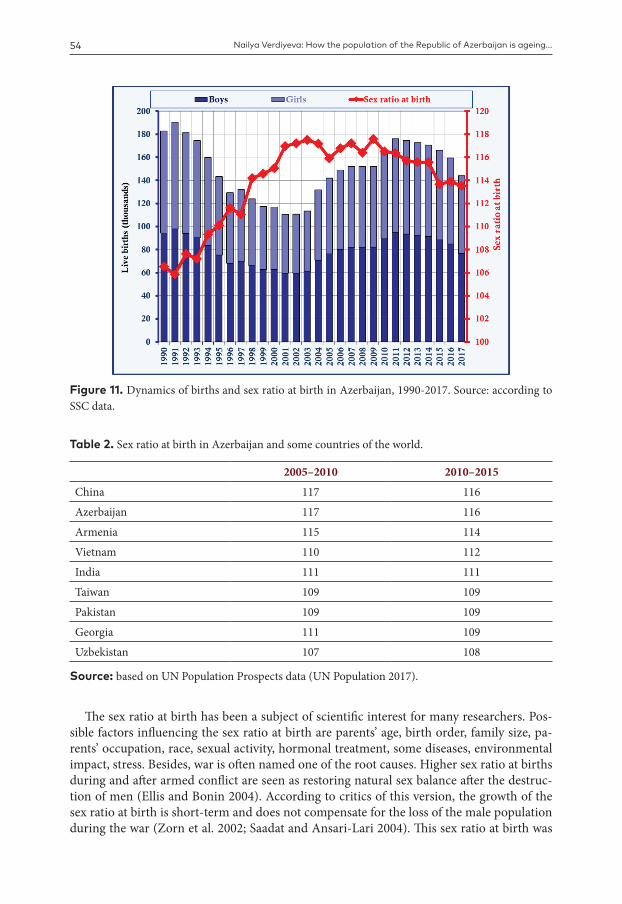
births (Fig. 11). According to 2017 data, for every 100 girls born, there are 114 boys, while the biological norm is between 105–107 boys per 100 born girls. According to international estimates, Azerbaijan, ahead of other countries with a similar anomaly, currently ranks se-cond after China (Table 2).
Nailya Verdiyeva: How the population of the Republic of Azerbaijan is ageing...54
The sex ratio at birth has been a subject of scientific interest for many researchers. Pos-sible factors influencing the sex ratio at birth are parents’ age, birth order, family size, pa-rents’ occupation, race, sexual activity, hormonal treatment, some diseases, environmental impact, stress. Besides, war is often named one of the root causes. Higher sex ratio at births during and after armed conflict are seen as restoring natural sex balance after the destruc-tion of men (Ellis and Bonin 2004). According to critics of this version, the growth of the sex ratio at birth is short-term and does not compensate for the loss of the male population during the war (Zorn et al. 2002; Saadat and Ansari-Lari 2004). This sex ratio at birth was
Figure 11. Dynamics of births and sex ratio at birth in Azerbaijan, 1990-2017. Source: according to SSC data.
Table 2. Sex ratio at birth in Azerbaijan and some countries of the world.
2005–2010 2010–2015
China 117 116
Azerbaijan 117 116
Armenia 115 114
Vietnam 110 112
India 111 111
Taiwan 109 109
Pakistan 109 109
Georgia 111 109
Uzbekistan 107 108
Source: based on UN Population Prospects data (UN Population 2017).
Population and Economics 3(3): 43–73 55
observed in Europe and the United States during the First and Second World Wars (Graf-felman and Hoekstra 2000; Mathews and Hamilton 2005), as well as in the United States during the Korean and Vietnam Wars (Ellis and Bonin 2004). However, the analysis of data from the countries of the former Yugoslavia for 1991–1995 (Polasek 2006), as well as data on birth rates in Iran during the Iran-Iraq war (Ansari-Lari and Saadat 2002) did not reveal a similar pattern.
Due to the fact that no such studies were conducted on the basis of data on Azerbaijan, the degree of influence of any of the above-mentioned factors is difficult to reliably estima-te. At the same time, a number of authors (Duthé et al. 2012; Meslé et al. 2007; Guilmoto 2015) addressed to high values of sex ratio at birth, which is true not only for Azerbaijan, but also for other South Caucasus countries. Regretfully,studies conducted on the basis of population censuses, population registration systems and DHS, tend to draw attention to this subject without examining the root causes of the phenomenon (Yüksel-Kaptanoğlu et al. 2014).
High values of sex ratio at birth are not new for Azerbaijan. In the 1930s similar changes in the sex ratio of the newborn were observed in Azerbaijan (Mamedov 1982). It could be the result of the incomplete registration of newborns at that time, or maybe there are other explanations. One of the most probable reasons for the abnormally high proportion of boys in the structure of newborns in Azerbaijan today is the preference of families to have a male child in the family, believing that this is the basis and guarantee of financial stability in old age.
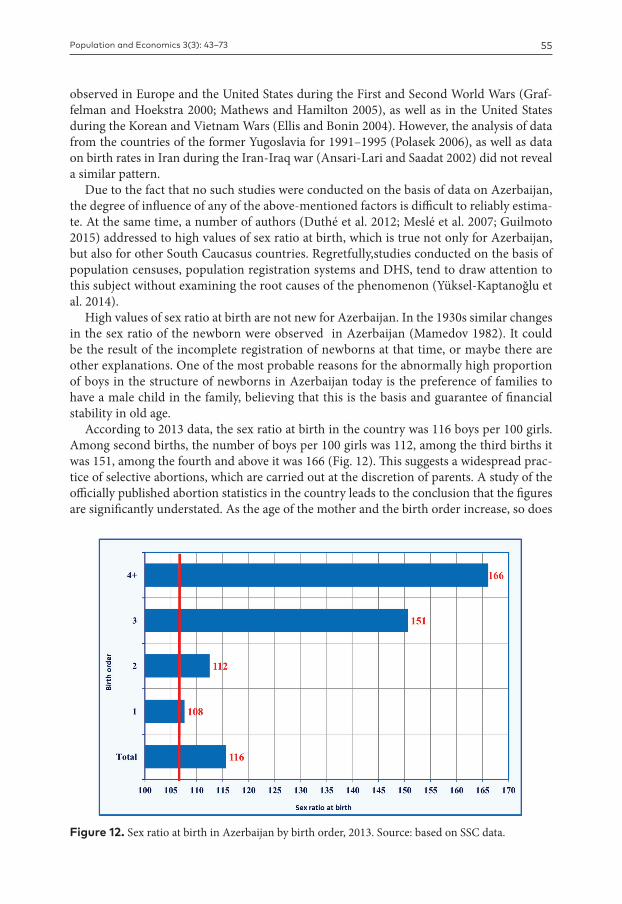
According to 2013 data, the sex ratio at birth in the country was 116 boys per 100 girls. Among second births, the number of boys per 100 girls was 112, among the third births it was 151, among the fourth and above it was 166 (Fig. 12). This suggests a widespread prac-tice of selective abortions, which are carried out at the discretion of parents. A study of the officially published abortion statistics in the country leads to the conclusion that the figures are significantly understated. As the age of the mother and the birth order increase, so does
Figure 12. Sex ratio at birth in Azerbaijan by birth order, 2013. Source: based on SSC data.

Nailya Verdiyeva: How the population of the Republic of Azerbaijan is ageing...56
this rate. No studies on Azerbaijan analyzing the reasons for this feature have been found, and therefore we can only state this fact.
In Azerbaijan, as in all post-Soviet countries, abortion was first legalized in 1920, then, as part of the pro-natalist measures, abortion was banned in 1936. In 1955 abortion for non-medical reasons was again legalized throughout the former Soviet Union. To date, abortion laws in Azerbaijan are liberal and allow women to have an abortion before the 12th week of pregnancy and for life-threatening reasons - up to 28 weeks. According to official data, 8 abortions per 1,000 women aged 15–49 were reported in 2000, compared to 14 in 2017.
According to the Demography and Health Survey (DHS) in Azerbaijan, among women who decided to have an abortion in 2006, 62% declared that the reason was the reluctance to have more children (in 2011 - 65%) (DHS 2006, 2011). Among the reasons for abortion only 3% of women in 2006 and 4% in 2011 indicated that they did so because of the choice of the sex of the child. The vast majority of women (68%) performed selective abortions in the most active reproductive age (20–34 years). Within this age group, the largest number is for the age between 25 and 29 years, and this is the age when women in Azerbaijan are mostly already giving birth to children of the second and higher order. Thus, the figures shown above in the graph are indirectly confirmed: with the increase in the order of births parents become more resolute in action and through selective abortions begin to choose the sex of the future child. The survey indicates that mothers with the lowest level of education and the lowest level of well-being are least inclined to choose the sex of the child through selective abortion, probably due to the lower availability of this “service” for this category of persons.
Abortion is usually seen as a means of terminating an unwanted pregnancy. Undoubted-ly, it can have a negative impact on women’s reproductive health, especially in young ages. According to data on the prevalence of contraceptive methods among women aged 15 to 49 who are married or in a partnership in Azerbaijan, only 13.9% of women use modern methods. For comparison, we will give data on the prevalence of modern methods of con-traception in other countries: in Georgia — 35%, Armenia — 27%, Iran — 77%, Turkey — 46%, Russia — 55%, Kazakhstan — 50%, Uzbekistan — 63%.
The significant and persistent disparities in the structure of births in the country over the past decades have a direct impact on the overall sex structure of the population. According to the 1989 census, there were 1,051 women per 1,000 men in the country; 1,048 women in the 1999 census; and 1,021 women in the 2009 census. In 2017, there were already 1004 women per 1000 men. Of course, the narrowing of the gap between life expectancy of men and women due to the positive trends in the reduction of mortality, especially of men, also has some effect, but it is gender disparities among births that affect these indicators most. For comparison, in 1990 among population over 60 years old there were 1,052 women per 1000 men, in 2017 — 1,272.
If we assume that the situation will not change (and it has not changed for over 28 years) and these trends will continue, Azerbaijan would face insufficient number of fertile-age wo-men able to maintain stable birth rate; this would have a negative impact on the sustaina-bility of the country’s demographic development. According to experts, imbalance of the sex structure of the population and the prevalence of men can lead to instability in society, deterioration of the criminal situation and violence. Given that the average age of marriage is 28 years for men and 24 years for women, Azerbaijan may face a shortage of brides in the near future. Today, with young-age mortality declining, the gender imbalance between men and women persists for longer periods. If in 1990 the equalization of the number of men and
Population and Economics 3(3): 43–73 57
women occurred by the age of 20-21, then, according to 2017 data, the balance is reached by 26-27 years. At the same time in the age group of 19-29 years there were 1,059 women per 1,000 men in 1990, in 2017 — 954. In the 19-34 age group, there were 1,063 women per 1,000 men in 1990, and 978 women in 2017.
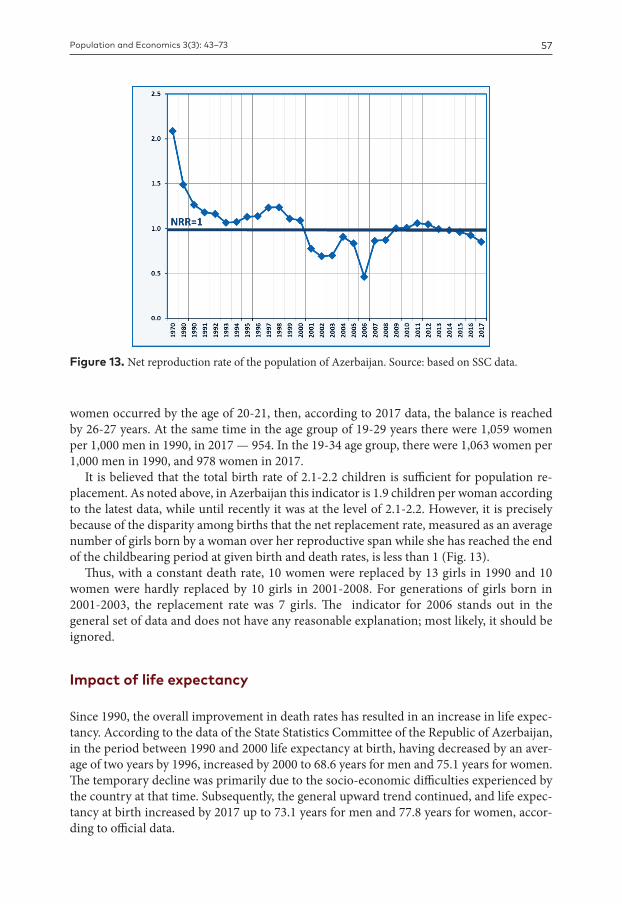
It is believed that the total birth rate of 2.1-2.2 children is sufficient for population re-placement. As noted above, in Azerbaijan this indicator is 1.9 children per woman according to the latest data, while until recently it was at the level of 2.1-2.2. However, it is precisely because of the disparity among births that the net replacement rate, measured as an average number of girls born by a woman over her reproductive span while she has reached the end of the childbearing period at given birth and death rates, is less than 1 (Fig. 13).
Thus, with a constant death rate, 10 women were replaced by 13 girls in 1990 and 10 women were hardly replaced by 10 girls in 2001-2008. For generations of girls born in 2001-2003, the replacement rate was 7 girls. The indicator for 2006 stands out in the general set of data and does not have any reasonable explanation; most likely, it should be ignored.
Impact of life expectancy
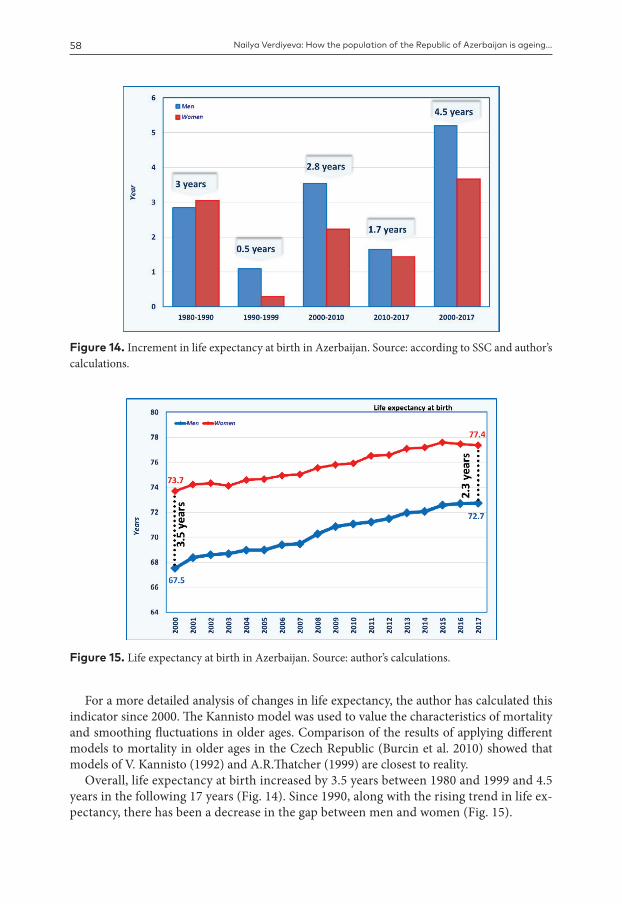
Since 1990, the overall improvement in death rates has resulted in an increase in life expec-tancy. According to the data of the State Statistics Committee of the Republic of Azerbaijan, in the period between 1990 and 2000 life expectancy at birth, having decreased by an aver-age of two years by 1996, increased by 2000 to 68.6 years for men and 75.1 years for women. The temporary decline was primarily due to the socio-economic difficulties experienced by the country at that time. Subsequently, the general upward trend continued, and life expec-tancy at birth increased by 2017 up to 73.1 years for men and 77.8 years for women, accor-ding to official data.
Figure 13. Net reproduction rate of the population of Azerbaijan. Source: based on SSC data.
Nailya Verdiyeva: How the population of the Republic of Azerbaijan is ageing...58
For a more detailed analysis of changes in life expectancy, the author has calculated this indicator since 2000. The Kannisto model was used to value the characteristics of mortality and smoothing fluctuations in older ages. Comparison of the results of applying different models to mortality in older ages in the Czech Republic (Burcin et al. 2010) showed that models of V. Kannisto (1992) and A.R.Thatcher (1999) are closest to reality.
Overall, life expectancy at birth increased by 3.5 years between 1980 and 1999 and 4.5 years in the following 17 years (Fig. 14). Since 1990, along with the rising trend in life ex-pectancy, there has been a decrease in the gap between men and women (Fig. 15).
Figure 14. Increment in life expectancy at birth in Azerbaijan. Source: according to SSC and author’s calculations.
Figure 15. Life expectancy at birth in Azerbaijan. Source: author’s calculations.
Population and Economics 3(3): 43–73 59
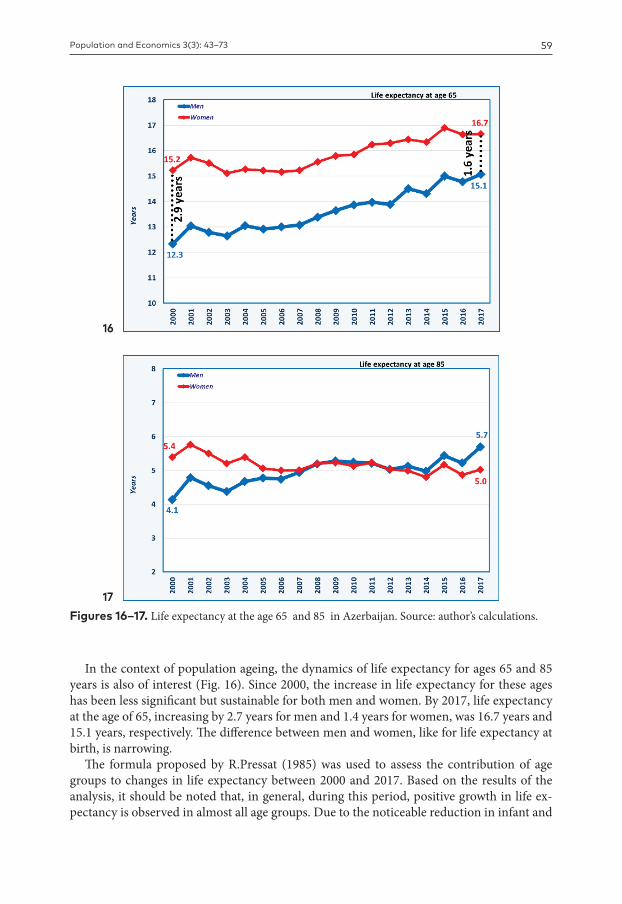
In the context of population ageing, the dynamics of life expectancy for ages 65 and 85 years is also of interest (Fig. 16). Since 2000, the increase in life expectancy for these ages has been less significant but sustainable for both men and women. By 2017, life expectancy at the age of 65, increasing by 2.7 years for men and 1.4 years for women, was 16.7 years and 15.1 years, respectively. The difference between men and women, like for life expectancy at birth, is narrowing.
The formula proposed by R.Pressat (1985) was used to assess the contribution of age groups to changes in life expectancy between 2000 and 2017. Based on the results of the analysis, it should be noted that, in general, during this period, positive growth in life ex-pectancy is observed in almost all age groups. Due to the noticeable reduction in infant and
Figures 16–17. Life expectancy at the age 65 and 85 in Azerbaijan. Source: author’s calculations.
16
17

Nailya Verdiyeva: How the population of the Republic of Azerbaijan is ageing...60
child mortality, the age group under 5 contributed significantly (about 1 year) to the total increase in life expectancy (19 and 24% of the total increase for men and women respecti-vely; Fig. 17).
However, to a greater extent, the increase is due to the growth in the life expectancy of the population over 60 years of age. Over the period of 2000–2017, the contribution of this age group was 2.4 years (46% of the total increase) for men and 1.6 years (43% of the total increase) for women.
In Azerbaijan, as in many other countries, the most frequent causes of death are di-seases of the circulatory system (59%) and neoplasms (15%). Prophylaxis and better tre-atment in the early stages of disease can be assumed to be the main factors in reducing mortality.
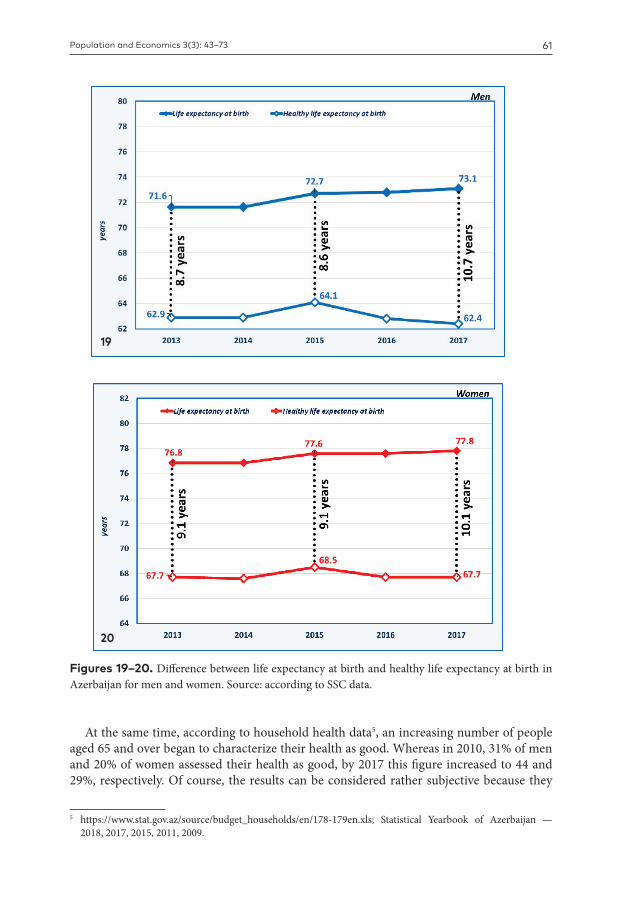
According to data of the SSC of the Republic of Azerbaijan, between 2013 and 2017 life expectancy at birth for men increased by 1.5 years (Fig. 19) and by 1 year for women (Fig. 20). At the same time, healthy life expectancy at birth was precarious, and as a re-sult, it remained unchanged for women within four years, and even decreased for men (see Fig. 19–20).
In 2013, the difference between life expectancy at birth and healthy life expectancy for men was 8.7 years and 9.1 years for women. In 2017, the difference between these indicators increased to 10.7 years for men and 10.1 years for women (see Fig. 18). Thus, despite the steady increase in life expectancy, due to health problems, additional years of healty life are difficult to be achieved.
Figure 18. Contribution of age groups to the increase in life expectancy in Azerbaijan between 2000 and 2017. Source: author’s calculations.
Population and Economics 3(3): 43–73 61
At the same time, according to household health data5, an increasing number of people aged 65 and over began to characterize their health as good. Whereas in 2010, 31% of men and 20% of women assessed their health as good, by 2017 this figure increased to 44 and 29%, respectively. Of course, the results can be considered rather subjective because they
5 https://www.stat.gov.az/source/budget_households/en/178-179en.xls; Statistical Yearbook of Azerbaijan — 2018, 2017, 2015, 2011, 2009.
Figures 19–20. Difference between life expectancy at birth and healthy life expectancy at birth in Azerbaijan for men and women. Source: according to SSC data.
19
20
Nailya Verdiyeva: How the population of the Republic of Azerbaijan is ageing...62
depend heavily on the respondents’ own perception of health status, but they can provide an idea of possible future mortality trends.
Thus, based on the above mentioned trends, we can argue that in recent years Azerbaijan has experienced ageing “from the top”, which will later only accelerate due to the growth of the longevity in older ages and increase in healthy life expectancy. The downward trend in the total fertility rate will contribute to the population ageing.
Age structure of the population of Azerbaijan in the 21st century
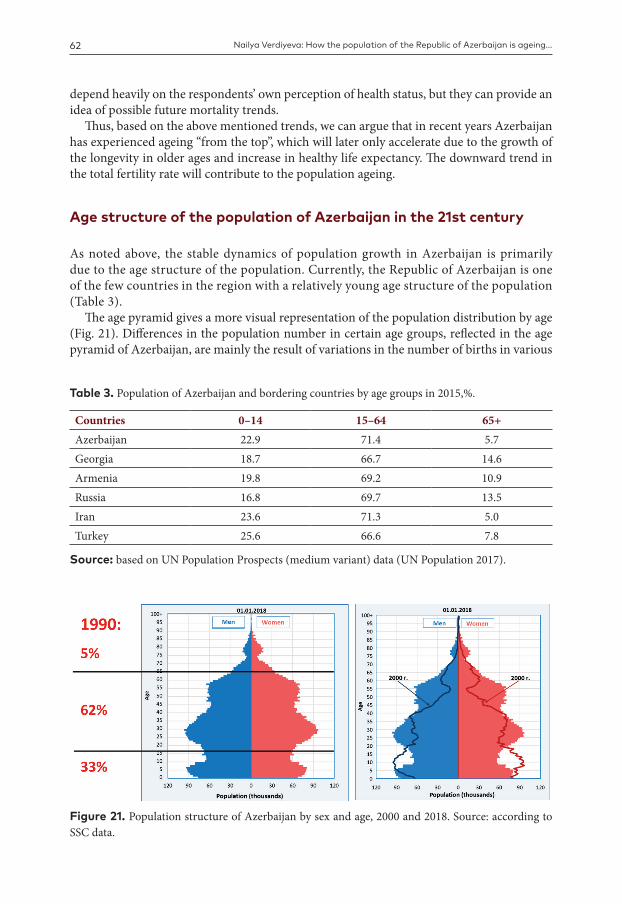
As noted above, the stable dynamics of population growth in Azerbaijan is primarily due to the age structure of the population. Currently, the Republic of Azerbaijan is one of the few countries in the region with a relatively young age structure of the population (Table 3).
The age pyramid gives a more visual representation of the population distribution by age (Fig. 21). Differences in the population number in certain age groups, reflected in the age pyramid of Azerbaijan, are mainly the result of variations in the number of births in various
Table 3. Population of Azerbaijan and bordering countries by age groups in 2015,%.
Countries 0–14 15–64 65+Azerbaijan 22.9 71.4 5.7Georgia 18.7 66.7 14.6Armenia 19.8 69.2 10.9Russia 16.8 69.7 13.5Iran 23.6 71.3 5.0Turkey 25.6 66.6 7.8
Source: based on UN Population Prospects (medium variant) data (UN Population 2017).
Figure 21. Population structure of Azerbaijan by sex and age, 2000 and 2018. Source: according to SSC data.
Population and Economics 3(3): 43–73 63
periods. The highest number of births in the country was observed from the mid-1950s to the late 1960s, as evidenced in the age pyramid by the more numerous cohorts in the age groups of 47–60 years.
After the Second World War, as in many countries that experienced compensatory incre-ases in the number of births, Azerbaijan also witnessed an increase in this indicator. At the same time, numerous generations born in the 1930s began to enter the active reproductive age and also contributed to the increase in the number of births. As already noted, after the 1930s the country began a gradual modernization of the health care system, and this resulted in the decreasing mortality rate. However, the decrease in mortality was not follo-wed by a decrease in the birth rate until the middle of the 1960s, in Azerbaijan the large-fa-mily model dominated at that time, the total fertility rate was 5 children per woman (1959). 1963–1964 could be called peak years, when the number of births reached the maximum value of 175,000–177,000.
In subsequent years, a gradual reduction in the number of births (to 138,000 births in 1972) led to the formation of smaller groups of the population on the pyramid in ages 42–46 years old. In 1985–1986 the decline was again replaced by growth, the number of births reached maximum values of 187,000–184,000. The steady growth of the number of births continued until the early 1990s, as evidenced by numerous cohorts in the ages of 23–33. At the same time, the dynamics of the total fertility rate, as noted above, is generally characte-rized by a steady gradual decline.
Later, against the background of the difficult situation in the political life of the country, as well as acute social and economic problems, the birth rate again began to decrease and the total fertility rate fell to 1.8 children per woman in 2001–2002. As a result, in these years the lowest annual number of births was recorded (110,000–113,000). On the current age pyramid this failure is clearly traced in age groups of 10–18 years.
Since 2003, political stability, large-scale socio-economic transformations and, as a result, the growth of prosperity of the country have become a guarantee of stable life and confi-dence in the future for citizens. These changes contributed to the gradual increase and then stabilization of the number of births, but, in large part, the increase in the number of births was due to demographic waves and compensation for delayed births. In 2004 alone, the number of births increased by 16% to 132,000. As a result of the upward trend, the number of births increased from year to year and in 2011–2012 reached a value of 176,000–175,000. Thus, in the overall steady trend of decline in the total fertility rate, the variations in the number of births were mainly determined by the influence of changes in the age structure of fertility-age women.
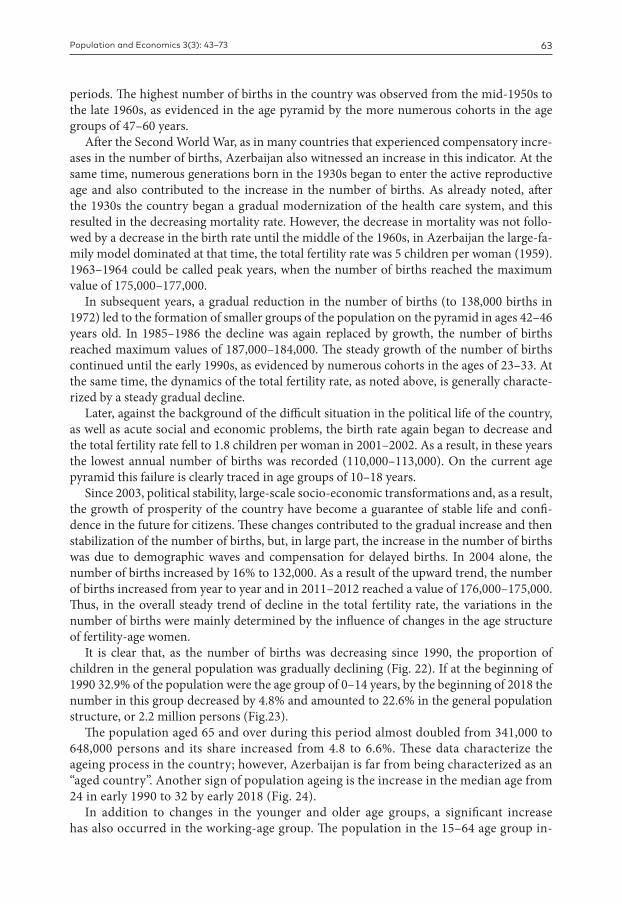
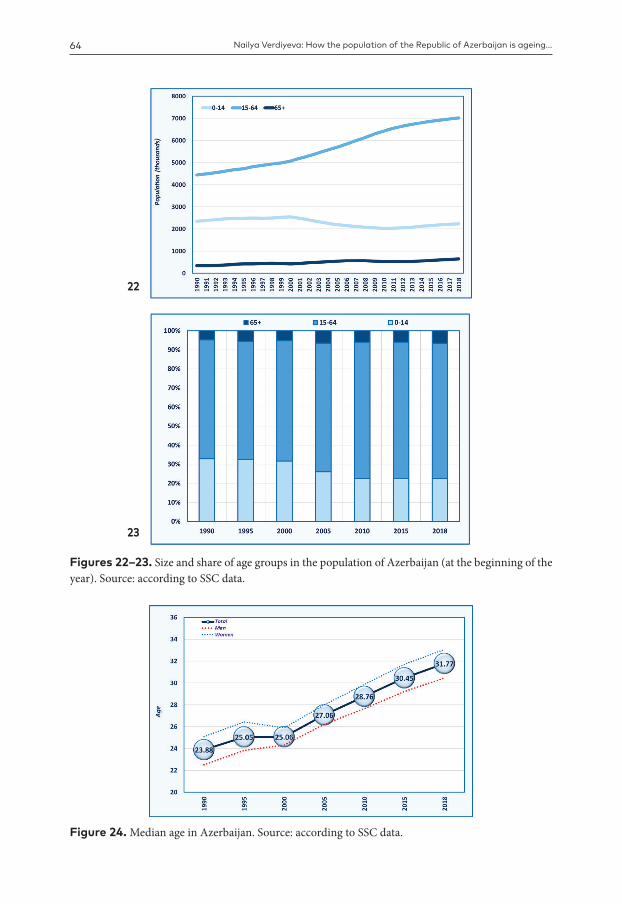
It is clear that, as the number of births was decreasing since 1990, the proportion of children in the general population was gradually declining (Fig. 22). If at the beginning of 1990 32.9% of the population were the age group of 0–14 years, by the beginning of 2018 the number in this group decreased by 4.8% and amounted to 22.6% in the general population structure, or 2.2 million persons (Fig.23).
The population aged 65 and over during this period almost doubled from 341,000 to 648,000 persons and its share increased from 4.8 to 6.6%. These data characterize the ageing process in the country; however, Azerbaijan is far from being characterized as an “aged country”. Another sign of population ageing is the increase in the median age from 24 in early 1990 to 32 by early 2018 (Fig. 24).
In addition to changes in the younger and older age groups, a significant increase has also occurred in the working-age group. The population in the 15–64 age group in-
Nailya Verdiyeva: How the population of the Republic of Azerbaijan is ageing...64
Figures 22–23. Size and share of age groups in the population of Azerbaijan (at the beginning of the year). Source: according to SSC data.
22
23
Figure 24. Median age in Azerbaijan. Source: according to SSC data.

Population and Economics 3(3): 43–73 65
creased by 58%, changing the proportion of this age group from 62.3% to 70.9% in the total population structure. In absolute terms, the value was 7 million people. The peak of 72% of the population in working age, recorded at the beginning of 2012, is gradually beginning to decline, and the potential of the demographic dividend is declining. The annual rate of population growth in this age group is wavelength, reflecting the gender and age structure of the population. Between 1990 and 2000, the average annual growth was 1.3%; between 2000 and 2010 it was 2.3%, then the growth rate began to fall again to an average of 1.2% per year.
Dependency ratio
An important and widely used indicator of population development is dependency ratio, i.e. number of dependents (youngest and oldest age groups) per 100 population of working age (15-64 in Azerbaijan). As a result of changes in the age structure, the dependency ratio has decreased from 61 dependents per 100 persons aged 15-64 years in early 1990 to 41 by early 2018 (Fig. 25).
The dependency rate for children (the number of children aged 0-14 per 100 persons aged 15–64) has changed significantly since 1990. It decreased from 53 in 1990 to 32 by the beginning of 2018. According to the projected changes in the age structure of the popula-tion, this downward trend will continue, and by 2050 this rate will be 27 persons of 0–14
years per 100 persons of working age. Over the same period, the dependency ratio for the
Figure 25. Dependency ratio in Azerbaijan (at the beginning of the year). Source: according to SSC data.
Nailya Verdiyeva: How the population of the Republic of Azerbaijan is ageing...66
elderly (population aged 65 and over per 100 persons aged 15–64) changed from 7.7 to 9.2. It is reasonable to forsee that this ratio will continue to grow and by 2050 it will be 356.
It is projected that by 2050 the total dependency ratio will increase to 63. Despite roughly the same dependency ratio values in 1990 and 2050, the significant difference lies in the structure of the indicator. In 1990, the majority of the burden was formed at the expense of younger age groups, while in 2050 the main contribution will be made by older persons.
In this context, the topic of “demographic dividend”, or “demographic window”, should be addressed. It is known that a country with a high proportion of the working-age popu-lation, if it creates opportunities for the fullest use of this labour potential through effective and productive employment, has additional opportunities for economic growth (Bloom et al. 2011).
In the 1970s Azerbaijan moved to the stage when the birth rate began to decline gradu-ally, and in the age structure of the population the share of younger age groups began to decrease. At the same time, the proportion of the population in the older age have not yet be-gun to grow significantly. Noteworthily, the population of the age group 15–64 was steadily growing. This trend continued until 2012 and for the period of 1970–2012 the growth was 258%. Despite the emergence of a downward trend after 2012, the proportion of the group aged 15–64 is still high. In 1970, the share of this age group in the total population was 50%, in 1980 - 60%, in 1990 - 62%, in 2000 - 63%, in 2010 - almost 72%, in 2017 - 71%. In other words, preconditions for a “demographic dividend”, or a “demographic window of opportu-nity” appeared in the country.
Over time, a decline in fertility, a decline in mortality and an increase in life expectan-cy, especially in older ages, will inevitably lead to an increase in the share of elderly pop-ulation, i.e. accelerate the process of population ageing in Azerbaijan. As this progresses, labour resources growth will decline. In turn, a high proportion of the population of pre- and post-working age or dependents would require enormous resources; this would restrain economic growth. As a result, other things being equal, per capita income will grow more slowly and the dividend received will begin to gain a negative value (Mason 2005).
Labour resources in the context of population ageing
Between 1990 and 2018 labour resources of Azerbaijan increased by 60% and reached 6.4 million persons7. The share of the labour resources in the total population was 65%, compa-red to 56% in 1990 when the age structure was younger.
Here in the paper, we understand labour resources as the population aged 15–64 years, which slightly deffers fron the internationally recognized definition.
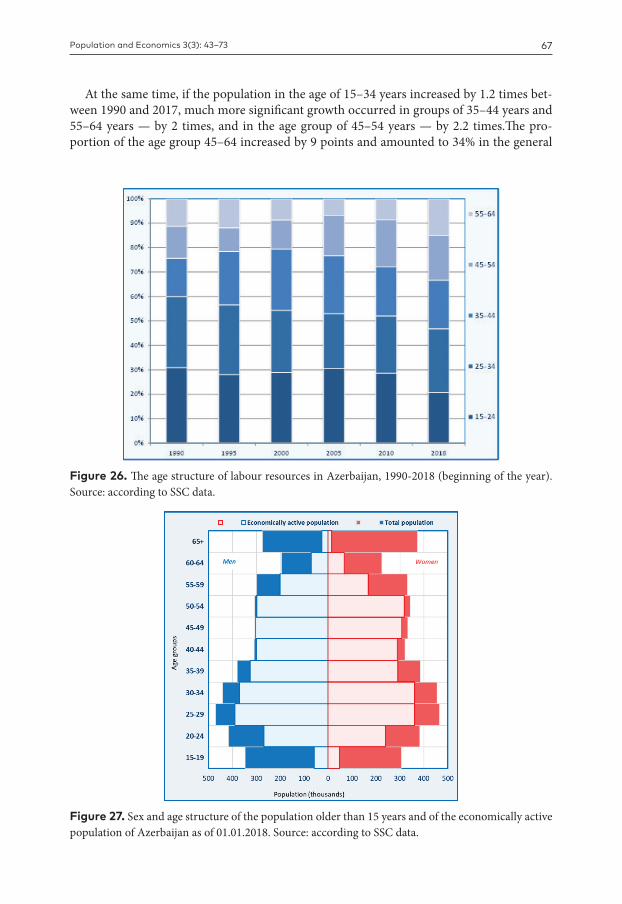
Growing in size is characteristic of all age groups shown in Fig. 26, but reflecting the general trend of changes in the age structure of the country’s population, a gradual decline in the proportion of younger group in the labour force is noticeable. In 1990, out of the total population aged 15–64, 47% were under 29 years old, in 2017 only 34%.
6 Unpublished data of the demographic forecast of the Republic of Azerbaijan (2017), elaborated within the framework of cooperation of the Ministry of Labour and Social Protection of the Population of the Republic of Azerbaijan with the United Nations Population Fund and Charles University.
7 The labour resources is the total number of the population of working age defined by the relevant legislation as well as employed persons of pre- and over working age. �mәk bazarı, Statistical Yearbook, Baku-2018. Methodological explanations.
Population and Economics 3(3): 43–73 67
At the same time, if the population in the age of 15–34 years increased by 1.2 times bet-ween 1990 and 2017, much more significant growth occurred in groups of 35–44 years and 55–64 years — by 2 times, and in the age group of 45–54 years — by 2.2 times.The pro-portion of the age group 45–64 increased by 9 points and amounted to 34% in the general
Figure 26. The age structure of labour resources in Azerbaijan, 1990-2018 (beginning of the year). Source: according to SSC data.
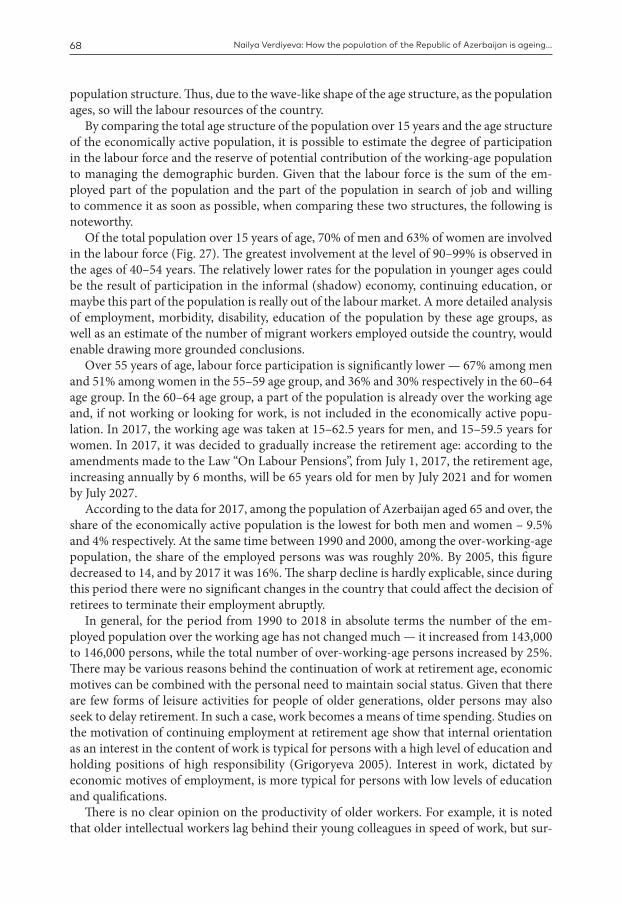
Figure 27. Sex and age structure of the population older than 15 years and of the economically active population of Azerbaijan as of 01.01.2018. Source: according to SSC data.
Nailya Verdiyeva: How the population of the Republic of Azerbaijan is ageing...68
population structure. Thus, due to the wave-like shape of the age structure, as the population ages, so will the labour resources of the country.
By comparing the total age structure of the population over 15 years and the age structure of the economically active population, it is possible to estimate the degree of participation in the labour force and the reserve of potential contribution of the working-age population to managing the demographic burden. Given that the labour force is the sum of the em-ployed part of the population and the part of the population in search of job and willing to commence it as soon as possible, when comparing these two structures, the following is noteworthy.
Of the total population over 15 years of age, 70% of men and 63% of women are involved in the labour force (Fig. 27). The greatest involvement at the level of 90–99% is observed in the ages of 40–54 years. The relatively lower rates for the population in younger ages could be the result of participation in the informal (shadow) economy, continuing education, or maybe this part of the population is really out of the labour market. A more detailed analysis of employment, morbidity, disability, education of the population by these age groups, as well as an estimate of the number of migrant workers employed outside the country, would enable drawing more grounded conclusions.
Over 55 years of age, labour force participation is significantly lower — 67% among men and 51% among women in the 55–59 age group, and 36% and 30% respectively in the 60–64 age group. In the 60–64 age group, a part of the population is already over the working age and, if not working or looking for work, is not included in the economically active popu-lation. In 2017, the working age was taken at 15–62.5 years for men, and 15–59.5 years for women. In 2017, it was decided to gradually increase the retirement age: according to the amendments made to the Law “On Labour Pensions”, from July 1, 2017, the retirement age, increasing annually by 6 months, will be 65 years old for men by July 2021 and for women by July 2027.
According to the data for 2017, among the population of Azerbaijan aged 65 and over, the share of the economically active population is the lowest for both men and women – 9.5% and 4% respectively. At the same time between 1990 and 2000, among the over-working-age population, the share of the employed persons was was roughly 20%. By 2005, this figure decreased to 14, and by 2017 it was 16%. The sharp decline is hardly explicable, since during this period there were no significant changes in the country that could affect the decision of retirees to terminate their employment abruptly.
In general, for the period from 1990 to 2018 in absolute terms the number of the em-ployed population over the working age has not changed much — it increased from 143,000 to 146,000 persons, while the total number of over-working-age persons increased by 25%. There may be various reasons behind the continuation of work at retirement age, economic motives can be combined with the personal need to maintain social status. Given that there are few forms of leisure activities for people of older generations, older persons may also seek to delay retirement. In such a case, work becomes a means of time spending. Studies on the motivation of continuing employment at retirement age show that internal orientation as an interest in the content of work is typical for persons with a high level of education and holding positions of high responsibility (Grigoryeva 2005). Interest in work, dictated by economic motives of employment, is more typical for persons with low levels of education and qualifications.
There is no clear opinion on the productivity of older workers. For example, it is noted that older intellectual workers lag behind their young colleagues in speed of work, but sur-
Population and Economics 3(3): 43–73 69
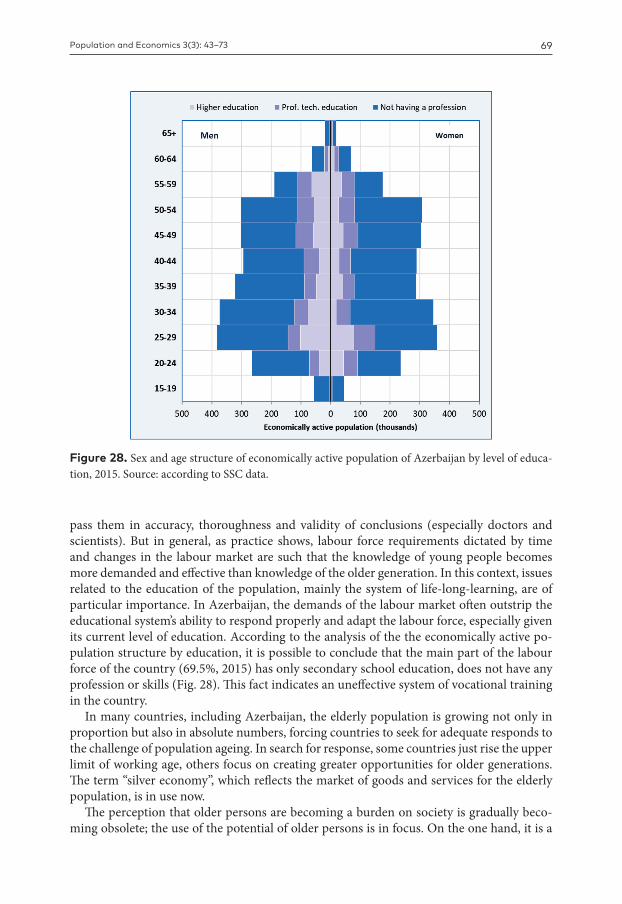
pass them in accuracy, thoroughness and validity of conclusions (especially doctors and scientists). But in general, as practice shows, labour force requirements dictated by time and changes in the labour market are such that the knowledge of young people becomes more demanded and effective than knowledge of the older generation. In this context, issues related to the education of the population, mainly the system of life-long-learning, are of particular importance. In Azerbaijan, the demands of the labour market often outstrip the educational system’s ability to respond properly and adapt the labour force, especially given its current level of education. According to the analysis of the the economically active po-pulation structure by education, it is possible to conclude that the main part of the labour force of the country (69.5%, 2015) has only secondary school education, does not have any profession or skills (Fig. 28). This fact indicates an uneffective system of vocational training in the country.
In many countries, including Azerbaijan, the elderly population is growing not only in proportion but also in absolute numbers, forcing countries to seek for adequate responds to the challenge of population ageing. In search for response, some countries just rise the upper limit of working age, others focus on creating greater opportunities for older generations. The term “silver economy”, which reflects the market of goods and services for the elderly population, is in use now.
The perception that older persons are becoming a burden on society is gradually beco-ming obsolete; the use of the potential of older persons is in focus. On the one hand, it is a
Figure 28. Sex and age structure of economically active population of Azerbaijan by level of educa-tion, 2015. Source: according to SSC data.

Nailya Verdiyeva: How the population of the Republic of Azerbaijan is ageing...70
form of active ageing strategy, and on the other hand, it is a contribution to strengthening the stability of the social protection mechanism for older persons. In any case, new opportu-nities for active participation of these groups in both the economic and social life of society are the focus of research and practice. Active and productive ageing implies that any paid and unpaid work, whether related to the production of goods and services or not, care for other family members, assistance to young people, hobbies and other activities carried out by older persons are considered productive.
When more numerous generations in Azerbaijan, who make up today’s working-age po-pulation, shift to retirement ages, the burden on the pension system and health care system will increase. However, at that time it will be possible to benefit from the second demo-graphic dividend (Mason 2005). Obtaining this dividend implies the creation the system that would encourage the working population, especially older workers, to save. Thus, there is a gradual shift towards a new approach in which older persons are seen as a resource for economic development.
Conclusion
The trend of gradual increase in the number and share of the elderly population in the Re-public of Azerbaijan will most likely be continuing. Because of the age structure, population ageing will accelerate as the most numerous generations are approaching to the age of 65.
Besides, the proportion of the population over 65 years of age is expected to rise in the long run, owing to the steady decline in the number of younger age groups. This is due to the age structure of the population. The overall decline in birth rate is spurred by the sex structure imbalance in favour of boys/men. The decline in fertility due to changes in the reproductive patterns of society is difficult to reliably estimate, it can only be assumed that due to historical traditional family attitudes transition to small one-child families in the short term is unlikely. Due to the positive effects of reducing mortality, life expectancy will continue to increase, especially in older ages. It is likely that this factor will have the greatest impact on accelerating the population ageing in the country.
Not all the strategic policy documents of recent years take into account the demographic factor, current and prospective trends in this area, while they largely determine the course and pace of national development. Changes in the age structure of the population already now require revision of the national strategy of sustainable development; it seems necessary to amend the list of priorities to be taken into account in the elaboration of the State budget. It should also be borne in mind that changes in the age structure of the population also lead to changes in consumption patterns and, as a consequence, new approaches in the formula-tion of strategy development of the country’s economy and employment policy are required.
Reference list
Alekseev AI, Karachurina LB (1998) Vynuzhdennye migranty i territorial’nye obshhnosti v Rossii [Forced migrants and territorial communities in Russia]. In: Narodonaselenie: sovremennoe sos-tojanie i perspektivy razvitija nauchnogo znanija [Population: current state and prospects of de-velopment of scientific knowledge] Lomonosov Moscow State University. Faculty of Economics. Dialogue-MGU, Moscow: 50–58. (in Russian)
Population and Economics 3(3): 43–73 71
Ansari-Lari M, Saadat M (2002) Changing sex ratio in Iran, 1976–2000. Journal of Epidemiology & Community Health 56(8): 622–623 URL: https://jech.bmj.com/content/56/8/622.
Avdeev A (2015) Population situation analysis: Beyond the Demographic Transition in Azerbaijan. UNFPA/UNDP, Baku. 180 pp.
Baker D, Delong JB, Krugman PR (2005) Asset returns and economic growth. Brookings Papers on Economic Activity 1: 289–330.
Bongaarts J. (2013) The implementation of preferences of male offspring. Population and Develop-ment Review 39(2): 185–208.
Bloom DE, Canning D, Fink G (2011) Implications of Population Aging for Economic Growth. Oxford Review of Economic Policy 26(4): 583–612.
Burcin B, Tesárková T, Šídlo L (2010) Nejpoužívanější metody vyrovnávání a extrapolace křivky úmrt-nosti a jejich aplikace na českou populace. Demografie 53: 77—89. (in Czech)
Coale JA, Hoover ME (1959) Population growth and economic development in low-income countries: a case study of India’s prospects. The American Economic Review 49(3): 436 - 438.
Development Concept “Azerbaijan 2020: Looking to the Future” (2012) URL: https://president.az/files/future_ru.pdf (in Russian)
DHS Azerbaijan (2006) URL: https://dhsprogram.com/pubs/pdf/FR195/FR195.pdf. DHS Azerbaijan (2011) URL: https://www.isim.az/upload/File/docs/Demographic_and_Health_Sur-
vey-2011._Azerbaijan._Final_Report.pdf.Dyson T (2012) Causes and Consequences of Skewed Sex Ratios. Annual Review of Sociology 38(1):
443–461.Efendiev R, Gözalova A (2018) Nekotorye aspekty demograficheskogo starenija naselenija v Azerbaj-
dzhane [Some aspects of demographic ageing of the population in Azerbaijan]. AMEA İqtisadiyyat İnstitutu, Elmi �sәrlәr, 5: 23–29. URL: https://www.researchgate.net/publication/324889222_Ne-kotorye_aspekty_demograficeskogo_starenia_naselenia_v_Azerbajdzane. (in Russian)
Efendiev R, Mutalibova L (2019) Demograficheskoe starenie naselenija v Azerbajdzhane: vyzovy, os-obennosti i posledstvija [Demographic ageing of the population in Azerbaijan: challenges, features and consequences]. Lap Lambert Academic Publishing, 60 pp. URL: https://www.researchgate.net/publication/330994625_Demograficeskoe_starenie_naselenia_v_Azerbajdzane_vyzovy_osoben-nosti_i_posledstvia. (in Russian)
Ellis L, Bonin S (2004) War and the Secondary Sex Ratio: Are They Related?/ Social Science Informa-tion 43(1): 115–122.
Graffelman J, Hoekstra RF (2000) A statistical analysis of the effect of warfare on the human secondary sex ratio. Human Biology 72(3): 433–45.anging sex ratio in Iran, 1976–2000. Journal IA (2005) Prioritety social’noj politiki: pozhilye ljudi [Priorities of social policy: elderly people]. Zhurnal sociologii i social’noj antropologii [Journal of sociology and social anthropology] VIII(3): 131–145. URL: http://old.jourssa.ru/2005/3/6aGrigoryevaa.pdf. (in Russian)
Guilmoto CZ (2015) The Masculinization of Births. Overview and Current Knowledge. Population 70(2): 185–243.
Heady DD, Hodge A (2009) The effect of population growth on economic growth: A meta-regression analysis of the macroeconomic literature. Population and Development Review 35(2): 221–248.
Hesketh T, Xing Z W (2006) Abnormal sex ratios in human populations: Causes and consequences. Proceedings of the National Academy of Sciences (PNAS). 103(36): 13271–13275.
James WH (1987) The human sex ratio. Part 1: A review of the literature. Human Biology 59(5): 721–52.
Kannisto V (1992) Presentation at a workshop on old-age mortality. Odense University, Odense, Den-mark.
Nailya Verdiyeva: How the population of the Republic of Azerbaijan is ageing...72
Kerimov R, Gasimova Z (2013) Dinamika izmenenija rozhdaemosti i smertnosti naselenija Azerbajdzha-na (za period 1960–2012 gg.) [Dynamics of changes in the birth rate and mortality of the population of Azerbaijan (for the period 1960–2012)] Izvestija NAN Azerbajdzhana [Proceedings of the NAS of Azerbaijan]. 2: 69–76. URL: https://www.academia.edu/14373583/%D0%94%D0%B8%D0%B-D % D 0 % B 0 % D 0 % B C % D 0 % B 8 % D 0 % B A % D 0 % B 0 _ % D 0 % B 8 % D 0 % B 7 % D 0 % B -C%D0%B5%D0%BD%D0%B5%D0%BD%D0%B8%D1%8F_%D1%80%D0%BE%D0%B6%D0%B4%D0%B0%D0%B5%D0%BC%D0%BE%D1%81%D1%82%D0%B8_%D0%B8_%D1%81%D0%BC%D0%B5%D1%80%D1%82%D0%BD%D0%BE%D1%81%D1%82%D0%B8_%D0%B-D%D0%B0%D1%81%D0%B5%D0%BB%D0%B5%D0%BD%D0%B8%D1%8F_%D0%9-0%D0%B7%D0%B5%D1%80%D0%B1%D0%B0%D0%B9%D0%B4%D0%B6%D0%B0%D0%BD%D0%B0_%D0%B7%D0%B0_%D0%BF%D0%B5%D1%80%D0%B8%D0%BE%D0%B4_1960-2012_%D0%B3%D0%B3._ (in Russian)
Kelley A (2001) The Population Debate in Historical Perspective: Revisionism Revised. In: Birdsall N, Kelley AC, Sinding SW (Eds.) Population Matters: Demographic Change, Economic Growth, and Poverty in the Developing World. Oxford University Press, Oxford: 24–54.
Linden E (2017) Remember the population bomb? It’s still ticking. New York Times: Sunday Review, 4.Mamedov KV (1982) Naselenie Azerbajdzhanskoj SSR za 60 let [Population of the Azerbaijan SSR for
60 years]. Azerneshr, Baku. 112 pp. (in Russian)Mason A (2005) Demographic Transition and Demographic Dividends in Developed and Developing
Countries, United Nations expert group meeting on social and economic implications of changing population age structures: 81–101.
Mathews TJ, Hamilton B (2005) Trend analysis of the sex ratio at birth in the United States, National vital statistics reports: from the Centers for Disease Control and Prevention, National Center for Health Statistics, National Vital Statistics System. 53(20): 1–17.
Medkov VM (2002) Demografija [Demography] Manual. Phoenix, Rostov-on-Don. 448 pp. (in Rus-sian)
Meslé F, Vallin J, Badurashvili I (2007) A sharp increase in sex ratio at birth in the Caucasus. Why? How? In: Attane I, Guilmoto CZ (Eds.) Watering the neighbour’s garden: The growing demo-graphic female deficit in Asia. Committee for International Cooperation in National Research in Demography CICRED. Paris, France: 73–88.
Mәmmәdova MN et al. (2007) Azәrbaycanda demoqrafik inkişafın xüsusiyyәtlәri vә perspektiv mey-llәri [Features and perspective estimates of the demographic development in Azerbaijan]. Sәda, Bakı. 244 pp. (in Azerbaijani)
Muradov Ş (2008) Azәrbaycan Respublikası әhalisinin dinamikası vә quruluşu: әsas demoqrafik vә etno-demoqrafik dәyişikliklәr (1897–2007-ci illәr) [Dynamics and structure of population of the Republic of Azerbaijan: basic demographic and ethno-demographic changes (1897–2007)]. Elm, Bakı. 240 pp. URL:https://www.azstat.org/Kitweb/zipfiles/00579.pdf. (in Azerbaijani)
Pervaja vseobshhaja perepis’ naselenija Rossijskoj imperii 1897 g. [The first general census of the population of the Russian Empire in 1897] (1897), St. Petersburg. URL: http://elib.shpl.ru/ru/nodes/12632-pervaya-vseobschaya-perepis-naseleniya-rossiyskoy-imperii-1897-go-da-spb-1897-1905. (in Russian)
Peterson E, Wesley F (2017) The Role of Population in Economic Growth. SAGE Open 7(4): 1–15. DOI:10.1177/2158244017736094.
Polasek O (2006) Did the 1991–1995 wars in the former Yugoslavia affect sex ratio at birth? European Journal of Epidemiology 21: 61–64.

Population and Economics 3(3): 43–73 73
Pressat R. (1985) Contribution des écarts de mortalité par âge à la différance des vies moyennes [The significance of variations in mortality by age on differences in life expectancy]. Population 4–5: 766–770.
Sen A (2003) Missing women – revisited. The BMJ 327(7427):1297–1298. URL: Saadat M, Ansari-Lari M (2004) Sex ratio of birth during wartime and psychological tensions. Human
Reproduction 19(2): 465.State Statistical Committee of the Republic of Azerbaijan. URL: www.stat.gov.az.Thatcher AR, Kannistö V, Vaupel JW (1998) The Force of Mortality at Ages 80 to 120. Odense Mono-
graphs on Population Aging 5. Odense University Press, 104 pp.Thatcher AR (1999) The long-term pattern of adult mortality and the highest attained age. Journal of
the Royal Statistical Society. Series A (Statistics in Society) 162(1): 5–43.UN Population Prospects, Revision 2017. URL: https://population.un.org/wpp/.Vorobyova OD, Lezhenkina ON (2008) Obmen naseleniem mezhdu Rossiej i Zakavkaz’em, ih sovre-
mennye migracionnye problemy [Exchange of population between Russia and Transcaucasia, their modern migration problems] In: Rybakovsky LL (Ed.) Transformacija migracionnyh processov na postsovetskom prostranstve [Transformation of migration processes in the post-Soviet space]. Academia. Moscow. 488 pp. URL: https://search.rsl.ru/ru/record/01004230746. (in Russian)
Yüksel-Kaptanoğlu I et al. (2014) Mechanisms behind the Skewed Sex Ratio at Birth in Azerbaijan: Qualitative and Quantitative Analyses. UNFPA Azerbaijan, Baku. 78 pp.
Zorn B, Sucur V, Stare J, Meden-Vrtovec H (2002) Decline in sex ratio at birth after 10-day war in Slovenia: brief communication. Human Reproduction 17(12): 3173–3177.
Information about the author
� Naila Verdiyeva, Head of the Demography and Population Development Sector, Depart-ment of Employment Policy and Demography of the Ministry of Labour and Social Pro-tection of Population of the Republic of Azerbaijan. E-mail : [email protected]