Embed Size (px)
Citation preview

DISCUSSION BRIEF
How limiting oil production could help California meet its climate goals
By many measures, the U.S. State of California has put in place climate policies that stand among the world’s most ambitious. Over the last 15 years, the state has adopt-ed (and extended) the nation’s largest cap-and-trade pro-gram on greenhouse gases, stringent vehicle fuel efficiency standards, and strong urban planning guidelines. In 2018, it will hold a special climate summit for leaders around the world – with the support of Christiana Figueres, the for-mer executive secretary of the United Nations Framework Convention on Climate Change (UNFCCC).
But even climate leaders like California will have to go well beyond existing actions to achieve the goals of the Paris Agreement – namely, keeping warming well below 2 degrees, plus reaching net zero emissions globally by the second half of the century. Indeed, in adopting its new climate action Scoping Plan in December 2017, Califor-nia’s Air Resources Board resolved to “continue to evalu-ate and explore opportunities to achieve significant cuts in greenhouse gas emissions from all sources, including supply-side opportunities to reduce production of energy sources.”1 In other words, the State has tasked itself not only to assess ways to increase the ambition of its climate action, but to consider how reducing energy production might also help achieve its climate goals.
This briefing paper examines how the state could limit the production of its principal energy product – oil – and the resulting implications for global GHG emissions. It also considers how such actions might fit in the state’s climate portfolio, taking into account cost-effectiveness, equity, and other key considerations.
Though it is beginning to gain traction, limiting oil (or any fossil fuel) production is still relatively new as an element of jurisdictional climate strategies.i While there is less research available on the effectiveness and economics of reducing oil supply as compared with other GHG emission reduction strategies, there is nonetheless a sufficient body of theory and work to enable reasonable estimates, which we provide below.3
We find that restricting California oil production would likely decrease global GHG emissions by an amount similar to other key policies in the state’s recently adopted climate Scoping Plan. We identify several policy approaches to limiting oil production that the state could consider with varying levels of emissions reductions, cost-effectiveness, equity implications, and political feasibility. ii These op-tions range from stopping the issuance of new permits for
i For example, in 2016, President Obama cited climate change as a rationale for withdrawing the Arctic from oil exploration and development,2 as did President Macron of France in 2017.
ii Note that we limit our focus here to oil extraction, and do not look at in-state oil refining.
oil production, to establishing thresholds for the GHG-intensity of oil produced, to focusing on regions of oil pro-duction where co-benefits, such as environmental justice, are greatest. These measures deserve further considera-tion by policy-makers in California.
California uses, produces, and refines a lot of oilFor most of the last century, oil has been central to Cali-fornia’s economy. Californians long used more gasoline, diesel, and jet fuel in aggregate each year than any other U.S. state – a distinction only recently eclipsed, by Texas in 2014.4 California has also been a dominant crude oil producer; for decades it was the top crude producer in the nation; it currently ranks third, behind Texas and North Dakota.5 The vast majority of the crude extracted in Cali-fornia is consumed in-state, though some byproducts, such as petcoke, are exported to countries in Asia.6
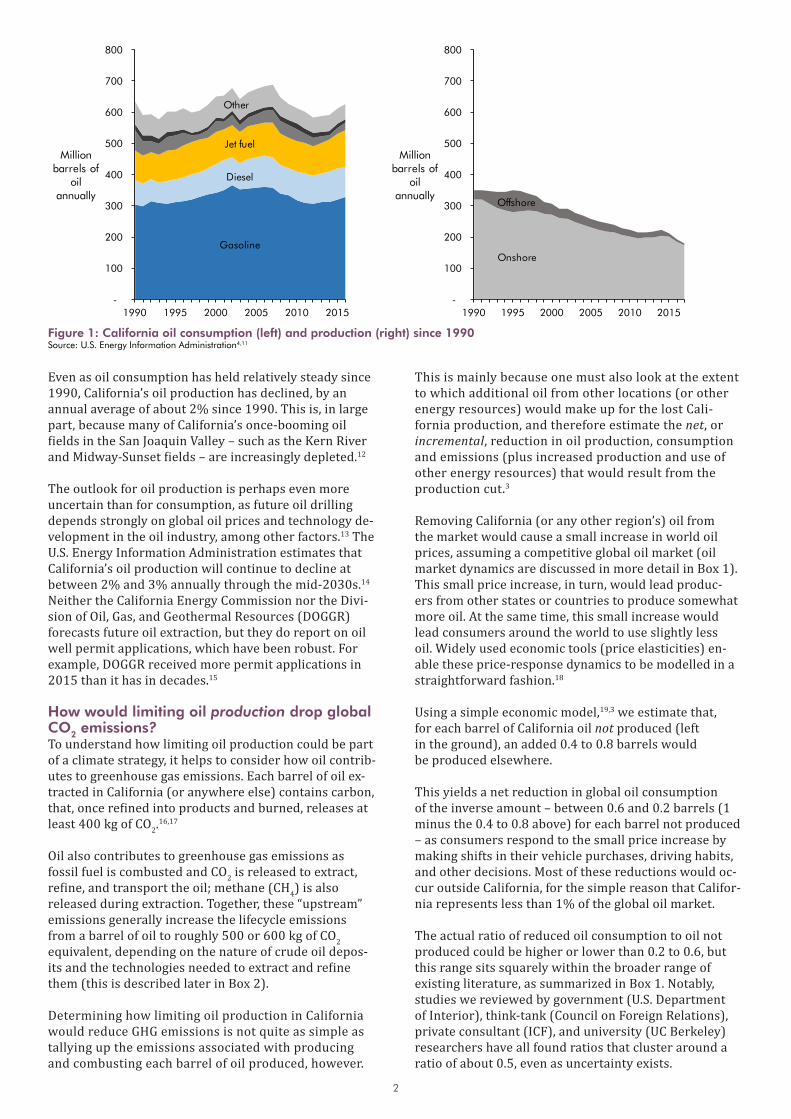
Since 1990 – the base year for tracking California’s cli-mate change goals – the state’s oil consumption has held relatively steady at between 600 million and 700 mil-lion barrels per year (Figure 1). Most of this oil is refined in-state and consumed as gasoline, diesel, and jet fuel. Together, burning of oil-derived products is the dominant contributor to California’s carbon dioxide (CO2) emissions (about 60%). Continued reliance on oil is a major reason why the state’s CO2 emissions have also held relatively steady, at between 300 and 350 million (metric) tons CO2 for the past 25 years.7 How oil consumption will evolve in the future is subject to economic, policy, and social developments in the state, including how quickly the state’s residents adopt electric vehicles, a topic of intense current interest.iii
iii Current reference-case forecasts by California state agencies and the U.S. Energy Information Administration indicate that, absent new, more-ambitious climate policy, California’s oil consumption would hold fairly steady in the future. In these forecasts, continuous declines in gasoline use (e.g., dropping 3 to 4% each year) are foreseen to be offset by modest gains in diesel, jet fuel, and other oils (such as liquid petroleum gas, or LPG).8,9,10
Three pumpjacks move in synchrony as an oil worker looks on. They are located in the Kern River Oil Field outside Bakersfield, California.
© S
arah
Cra
ig /
Fac
es o
f Fra
ckin
g
2
Even as oil consumption has held relatively steady since 1990, California’s oil production has declined, by an annual average of about 2% since 1990. This is, in large part, because many of California’s once-booming oil fields in the San Joaquin Valley – such as the Kern River and Midway-Sunset fields – are increasingly depleted.12
The outlook for oil production is perhaps even more uncertain than for consumption, as future oil drilling depends strongly on global oil prices and technology de-velopment in the oil industry, among other factors.13 The U.S. Energy Information Administration estimates that California’s oil production will continue to decline at between 2% and 3% annually through the mid-2030s.14 Neither the California Energy Commission nor the Divi-sion of Oil, Gas, and Geothermal Resources (DOGGR) forecasts future oil extraction, but they do report on oil well permit applications, which have been robust. For example, DOGGR received more permit applications in 2015 than it has in decades.15
How would limiting oil production drop global CO2 emissions?To understand how limiting oil production could be part of a climate strategy, it helps to consider how oil contrib-utes to greenhouse gas emissions. Each barrel of oil ex-tracted in California (or anywhere else) contains carbon, that, once refined into products and burned, releases at least 400 kg of CO2.16,17
Oil also contributes to greenhouse gas emissions as fossil fuel is combusted and CO2 is released to extract, refine, and transport the oil; methane (CH4) is also released during extraction. Together, these “upstream” emissions generally increase the lifecycle emissions from a barrel of oil to roughly 500 or 600 kg of CO2 equivalent, depending on the nature of crude oil depos-its and the technologies needed to extract and refine them (this is described later in Box 2).
Determining how limiting oil production in California would reduce GHG emissions is not quite as simple as tallying up the emissions associated with producing and combusting each barrel of oil produced, however.
This is mainly because one must also look at the extent to which additional oil from other locations (or other energy resources) would make up for the lost Cali-fornia production, and therefore estimate the net, or incremental, reduction in oil production, consumption and emissions (plus increased production and use of other energy resources) that would result from the production cut.3
Removing California (or any other region’s) oil from the market would cause a small increase in world oil prices, assuming a competitive global oil market (oil market dynamics are discussed in more detail in Box 1). This small price increase, in turn, would lead produc-ers from other states or countries to produce somewhat more oil. At the same time, this small increase would lead consumers around the world to use slightly less oil. Widely used economic tools (price elasticities) en-able these price-response dynamics to be modelled in a straightforward fashion.18
Using a simple economic model,19,3 we estimate that, for each barrel of California oil not produced (left in the ground), an added 0.4 to 0.8 barrels would be produced elsewhere.
This yields a net reduction in global oil consumption of the inverse amount – between 0.6 and 0.2 barrels (1 minus the 0.4 to 0.8 above) for each barrel not produced – as consumers respond to the small price increase bymaking shifts in their vehicle purchases, driving habits, and other decisions. Most of these reductions would oc-cur outside California, for the simple reason that Califor-nia represents less than 1% of the global oil market.
The actual ratio of reduced oil consumption to oil not produced could be higher or lower than 0.2 to 0.6, but this range sits squarely within the broader range of existing literature, as summarized in Box 1. Notably, studies we reviewed by government (U.S. Department of Interior), think-tank (Council on Foreign Relations), private consultant (ICF), and university (UC Berkeley) researchers have all found ratios that cluster around a ratio of about 0.5, even as uncertainty exists.
Figure 1: California oil consumption (left) and production (right) since 1990Source: U.S. Energy Information Administration4,11
Gasoline
Diesel
Jet fuel
Other
-
100
200
300
400
500
600
700
800
1990 1995 2000 2005 2010 2015
Million barrels of
oil annually
1.5%
5.9%
3.0%
Ann
ual i
ncre
ase
2012
-201
6
Onshore
Offshore
-
100
200
300
400
500
600
700
800
1990 1995 2000 2005 2010 2015
Million barrels of
oil annually
-5.4%
-32%
Ann
ual d
eclin
e20
14-2
017

3
Taking into account all but the outlier findings explored in Box 1 – that is, assuming a wide uncertainty range for this ratio of between 0.2 and 0.6 – it follows directly that for each barrel of oil left undeveloped in California, global oil consumption would be reduced by 0.2 to 0.6 barrels. Multiplying by the carbon content of crude oil noted above (400 kg CO2/barrel), each barrel of oil not extracted from California would lead to a reduction in global emissions of 80 to 240 kg CO2.
For illustration, phasing out an amount of oil equiva-lent to half of California’s recent annual oil production – about 100 million barrels per year – could lead to a global emission reduction of 8 to 24 million tons CO2 per year. This amount is similar to the savings associated with the sector-specific climate strategies in California’s action plan, which range from 3 to 35 million tons CO2e per year in 2030. Below, we identify some of the poli-cies for managing a decline in oil production that the State may wish to consider in order to achieve additional
emissions cuts of about this scale. First, however, we touch on cost-effectiveness and other considerations that State policy-makers may wish to take into account.
Still, before leaving the question of how reduced oil pro-duction would lead to emissions savings, it is worth not-ing the overall emissions benefit would be even greater to the extent that reduced oil consumption also leads to avoiding upstream GHG emissions, or those associ-ated with producing, transporting, and processing that oil (See Box 2). At the same time, another effect could hamper the overall emissions benefit: the potential for consumers to substitute other GHG-emitting fuels, such as biofuels, compressed natural gas (CNG) or coal-fired electricity, for the oil not produced.
However, prior analysis suggests that the upstream emissions effect would likely be more significant than the fuel substitution effect, thus increasing by at least 25% the emissions savings per barrel of oil not extract-
Box 1: How restricting the supply of California oil reduces global oil consumption
Drop in global oil consumption as fraction of avoided U.S. oil production across several studies(Multiple circles of same color indicate alternate scenarios presented by same authors. Smaller circles represent sensitivity or high/low values)
Source: SEI analysis based on U.S. Department of Interior (Wolvovsky and Anderson 2016)30 Council on Foreign Relations (Metcalf 2016)31, Rhodium Group (Bordoff and Houser 2015)24, SEI (Erickson and Lazarus 2014)19, ICF/Ensys 201432 as included in Bordoff and Houser, and UC Berkeley (Rajagopal and Plevin 2013)27. The mean, median, and mode of results in this figure are all 0.5.
At the most extreme end, if each barrel of oil not pro-duced in California was instead produced somewhere else (and with similar emissions associated with extract-ing each barrel), then global emissions would not change at all – a game of “perfect substitution” or, as some have called it, “whack-a-mole”.20,21
However, this argument of perfect substitution defies ba-sic economics of supply and demand. If there is less of a commodity available – such as oil – less of it will be con-sumed. Exactly how much less is not knowable with abso-lute certainty, since the changes are moderated through markets and prices; still, the presence of uncertainty does not mean the effect does not exist.22
Here, we use a combination of literature review and our own simple economic model to estimate that for each barrel of oil not produced in California, global oil con-sumption would drop by 0.2 to 0.6 barrels.3 This result is robust against a wide range of supply and demand elasticities. The 0.2 value would be consistent with an oil market with an elasticity of supply of 1 and an elasticity of demand of -0.25. Alternately, the ratio of 0.6 would be consistent with an elasticity of supply of 0.2 and an elas-
ticity of demand of -0.3. (The ratio of change in consump-tion to change in oil supply is defined in our model as the ratio of the elasticity of demand to the difference between the elasticities of supply and demand. This means that any elasticities of supply and demand that are the same magnitude but opposite signs – indicating that both oil producer and consumers are similarly price-responsive – would yield a ratio of 0.5 barrels not consumed for each barrel not produced.23,21)
Our estimate that global oil consumption would drop by 0.2 to 0.6 barrels for each barrel not produced is consist-ent with the findings of other assessments of the global oil market.24,25,26,27 As shown in the chart below, several studies find a ratio near 0.5. The more far-ranging alter-native outcomes – i.e., the ratios of less than 0.2 or over 0.6 – require particular views of the world oil market. For example, Bordhoff and Houser’s scenario of zero impact on global oil consumption requires the very strong as-sumption that OPEC makes up for each and every bar-rel of avoided U.S. oil production, one-for-one. This is despite evidence that OPEC has dramatically diminished ability to control production and, in turn, prices, through enforced production quotas.28,29
0 0.2 0.4 0.6 0.8 1
Wolvovsky and Anderson 2016 Metcalf 2016Bordoff and Houser 2015 Erickson and Lazarus 2014ICF / Ensys 2014 Rajagopal and Plevin 2013

4
ed.iv For simplicity of the analysis, and to be conservative, we do not consider these effects in detail here. We do note, however, that even if all of the California oil not pro-duced was replaced (globally) with other sources, there would still likely be emissions benefits, since California’s largest oil fields are more GHG-emissions-intensive than most other global crudes (Box 2).
Limiting oil production is comparable in costs to many of California’s other CO2 reduction measures.The analysis above demonstrates that phasing out oil supply from California could make significant contribu-tions to global CO2 emission reductions, barrel for barrel, and likely reduce global emissions by many millions of tons CO2 in 2030.
Still, besides the amount of CO2 emissions abatement, the Air Resources Board (ARB) also uses other criteria to gauge the merits of particular climate policies. One cen-tral criterion is cost-effectiveness. As applied by ARB and many other climate policy analysts, cost-effectiveness is defined as the net direct cost of a measure (amortized over its lifetime) divided by the emission reductions that would result from the measure.
It is not obvious how to assess the costs of a measure that would reduce emissions by constraining oil supply. One documented approach is to consider the costs of such a policy as the lost profits to the companies that would have extracted the oil.35
This approach – counting the costs of this climate policy measure as lost profits – is a clear analogue to how abate-ment costs are estimated for more traditional climate
iv If we were to include both this fuel substitution effect and the upstream emissions effect, the net impact would be to increase our estimated range of emissions savings for each barrel of oil not extracted from 80 to 240 kg CO2 up to 170 to 300 kg CO2. For details on this calculation, see this online link: https://tinyurl.com/y7ue4dqp
policies, such as for energy efficiency investments. In both cases, there is a change made to both an upfront investment as well as to a future cash flow stream, and the cost is determined as the amortized difference in costs between the new case (the change in invest-ment or practice) and the old case (what would have happened otherwise).
For this reason, we apply a similar approach here. For a measure that would limit oil production, a company would forego the costs of drilling and pumping oil, but also forego the revenue of doing so. We therefore con-sider the direct “cost” of the climate policy to be the net of these two cash flow streams – i.e., the lost profits to the industry. This definition does not imply that the companies would be reimbursed for that cost – indeed, as with many other aspects of climate policy, the entities affected could be expected to bear those costs because of a societal duty to address the problem of climate change. Furthermore, this approach does not consider many other factors that could be included in a broader cost-benefit analysis, such as the avoided health impacts and other damages associated with CO2 emissions, the potential for lost employment or tax revenues in an area, or other externalities.
Regardless, to estimate production costs, we start with estimates of the investment and operating costs associ-ated with each California oil field. We draw this from a database of oil fields – Rystad Energy’s UCube – that is widely used for analysis of oil resources and markets.24,36
Analysis of these cost estimates indicates that about one-third of California’s oil fields are expected to “break even” at relatively low oil prices – e.g. less than $50 per barrel. These include parts of the Lost Hills, Cymric, and Elk Hills oil fields, each of which is expected to produce at least 5 million barrels of oil in 2030 at below $50 per barrel (Figure 2). Another third of California’s oil breaks even at $50 to $70 per barrel, including the long-lived,
Box 2: Reducing oil production would lead to cuts in GHG emissions from extracting, refining, and transporting oil
Our estimate of the CO2 emissions benefit of reducing California’s oil production only counts the savings that would result from burning less oil, i.e. as gasoline, diesel, jet fuel, and other end uses in global fuel markets. How-ever, were we to consider other GHG emissions associ-ated with “upstream” (extracting) and “midstream” (refin-ing and transporting) activities, the estimate of emission reductions could be greater.19
First, for each barrel of oil not consumed, emissions would be reduced by not producing, refining, and transporting crude oil. The exact decrease would depend on the likely marginal sources of crude oil. An average “blend” of crudes is associated with about 500 kg CO2e per barrel across the full “life cycle”.33 Thus in addition to 400 kg CO2 from fuel combustion, each barrel not consumed would save another 100 kg CO2e in emissions.
Second, due to the widespread use of enhanced recov-ery techniques, such as energy-intensive steam flooding, California’s most productive oil fields are more GHG emissions-intensive than the average blend of crude oil.12 For example, the full life cycle of producing, refining, trans-porting, and combusting a barrel of crude oil from Cali-fornia’s three most productive fields – Midway-Sunset, Kern River, and South Belridge – yields emissions of 725, 650, and 690 kg CO2e, respectively.33 For comparison, this is at least 15% more emissions-intensive than other crudes refined in California at similar volumes (at least 20 million barrels annually): Saudi Arabia (493 kg CO2e); Ecuador (532 kg CO2e); Alaska (564 kg CO2e); Colombia (507 kg CO2e); and Kuwait (510 kg CO2e).34 This means that reducing production of California oil would likely have global GHG emissions benefits, regardless of how much California production was replaced by other crude oils.

5
historic fields in Kern County (Midway-Sunset, Kern River) and fields in the Los Angeles area (Wilmington and Inglewood). Finally, the last, highest-cost third is dominated by newer fields (e.g. Monterey shale), plus older fields that are now being re-developed using newer technologies. That includes the South Belridge field, which is expected to be the dominant producer in 2030, yielding about 25 million barrels of oil, in part due to fracking.5
Comparing the breakeven prices displayed in Figure 2 – which are, essentially, the “cost” to these producers of drilling and operating new wells – with an estimate of future oil prices enables the calculation of future profits. In the EIA’s reference case, for example, oil prices rise to $89 per barrel in 2030.10 Subtracting the breakeven prices in Figure 2 from this 2030 price yields an esti-mate of potential lost profits, e.g. about $26 per barrel for the Wilmington, Inglewood, and Los Angeles fields.
This estimate of lost profits assumes an oil price, $89 per barrel, that is about one-third higher than levels of $60 to $70 per barrel in early 2018. This could very well be too high. In particular, if and as the world proceeds to rapidly displace oil-based vehicles with electric vehicles, to avoid vehicle travel, and to implement other policies – as California is doing – then oil prices may not rise sig-nificantly from current levels on a sustained basis. Under such a scenario of lower future oil prices, lost profits would be far lower; in fact, many fields might not yield the expected returns to investors, and could even oper-ate at a loss. From that perspective, avoiding investment in new oil wells and associated infrastructure could help provide a net benefit to the industry (i.e., avoid financial ‘stranding’) as well as avoid locking in more oil pro-duction than needed.
Nonetheless, a measure of cost effectiveness can be cal-culated by dividing lost profits (as a proxy for costs) by the drop in global CO2 emissions for each barrel not pro-duced: 80 to 240 kg CO2 as estimated above. For example, the cost-effectiveness of limiting California oil production from the Wilmington, Inglewood, and Los Angeles fields would be $110 to $330 per t CO2 ($26 per barrel divided by 0.08 to 0.24 t CO2 per barrel). Under a low-carbon fu-ture (i.e. one in which oil prices are closer to $60 per bar-rel, as also indicated in Figure 2), limiting oil production might instead even yield economic benefits, if the risks of stranded assets associated with investments in higher-cost fields, like South Belridge, are thereby avoided.
To put these costs in perspective, the cost-effectiveness of reductions in California’s Scoping Plan range from “cost negative” (or yielding profits, as in the case of low-cost energy efficiency measures) to costs nearing $200 per t CO2e. For example, the liquid biofuels measures associat-ed with the Low Carbon Fuel Standard (LCFS) cost $150 per t CO2e and a more aggressive renewable portfolio standard (RPS) for power supply cost $175 per t CO2e.8
Equity and international considerationsThe scale of GHG reductions and the cost-effectiveness of those reductions are just two criteria that policy-makers may need to consider in assessing potential climate poli-cies. Other important considerations are environmental justice and equity. In fact, California legislation requires the consideration of equity in state climate policy; for example, state agencies have been directed (by the Global Warming Solutions Act of 2006) to identify and invest in disadvantaged communities. Equity is also a cornerstone of the international climate negotiations; further, policies seen as equitable can also be more effective. As described by the Intergovernmental Panel on Climate Change
Figure 2: Cost curve for California’s crude oil production in 2030Source: Rystad Energy, assuming a 10% nominal discount rate.5
90
40 6515 25
20
40
80
70 80 100
140
10
50
60
70
50 60 90 10595
0
30
100
130
5535 11010 300 205 45 8575
110
120
115
Cumulative oil production in 2030, million barrels
Break-even oil price, US$ / barrel
Cymric (Kern
County)
Lost Hills (Kern
County)
Midway-Sunset (Kern
County)
KernRiver(Kern
County)
Monterey Shale
South Belridge
(Kern County)
Wilmington (Offshore,
Los Angeles County)
Assumed 2030 oil price: $89 per barrel
2030 oil price consistent with 2° limit: ~$60
Elk Hills (Kern
County)
Los Angeles (Los Angeles
County)
Ventura (Ventura County)
Paris Valley (Monterey County)
Inglewood (Los Angeles
County)

6
(IPCC), an “arrangement that is perceived to be fair has greater legitimacy and is more likely to be internationally agreed and domestically implemented.”37
In this respect, phasing out California’s oil production may also have an important contribution to make. This is because many of California’s oil fields are located in areas of the state that are disproportionally burdened by pollution – both because of the presence of pollutants as well as due to adverse environmental conditions and socioeconomic factors.
For example, the oil fields in Los Angeles extend across communities that have been rated by the State’s Office of Environmental Health Hazard Assessment as being among the census tracts that are most (95th percentile) disproportionately burdened in the State,38 and where 630,000 people live within 800 meters (about 2,600 feet) of an active oil well.39 The Lost Hills and South Belridge oil fields extend across communities – namely, the com-munity of Lost Hills and neighbouring parts of unincor-porated Kern County – that are in the worst fifth (80th percentile) of census tracts across the state in terms of pollution-vulnerability. These communities in Los Ange-les and near Lost Hills may therefore be at greater risk for any possible health effects associated with proximity to oil (and gas) development.40
More broadly, limiting California oil production may have an even more basic benefit. It unambiguously moves in the direction needed to meet low-carbon goals: away from fossil fuels. This act of naming and address-ing a major source of CO2 emissions – oil – may also help build popular interest and support for a serious low-carbon transition.41,42,43
This support could also reasonably be extended beyond California’s borders, as policy-makers in other states and countries with substantial oil supplies could take similar steps. As some economists have suggested, jurisdictions could even form a coalition of territories dedicated to phasing out fossil fuel production44, thereby demonstrat-ing the policy steps needed to realize the physical reality that, to keep global warming within the agreed goal of “well below” 2°C, most fossil fuel reserves will need to remain undeveloped.45
Gaining recognition for cuts to global, not just in-state, CO2 emissionsHow California would be recognized for emission re-ductions that result due to cuts in oil supply is another matter. Most of the emission reductions planned in Cali-fornia’s Scoping Plan would accrue to California’s official account –its inventory – of its GHG emissions. However, few of the cuts attributed to phasing out oil produc-tion would accrue to that inventory. This is because the bulk of those reductions would occur in other states and countries, as slightly higher global oil prices lead to lower oil consumption.
This accounting challenge, however, is a solvable problem. To address it, California could begin a complementary, parallel accounting, to track the estimated GHG emission reductions due to limits in oil production. Similar paral-
lel accounting frameworks have already been proposed for the UNFCCC,42 which is the forum – along with the IPCC – from which California modelled its own GHG emissions accounting.
Accounting for cuts to oil supply separately, in a report on emission reductions that are not captured by the state inventory, would also be a way to address the uncertainty associated with the global CO2 emission reductions. For example, California could (1) specify the measure it is taking – e.g. stopping the permitting of new oil wells; (2) estimate how many barrels of oil would be left unde-veloped as a result of the policy, and their associated total GHG emissions; and (3) estimate, with transparent assumptions, the global GHG emissions benefits of the action. These estimates could then be reported, shared, and subjected to international scrutiny, much like current, IPCC-based GHG emissions inventories.v
What policies could limit California’s oil production? So far, we have shown that limiting California’s oil produc-tion could yield substantial additional emission reduc-tions (e.g. 8 to 24 million tCO2 per year in 2030 in the ex-ample above) at costs that are comparable to many other measures in the California Scoping Plan. In this section, we explore policy options that California could pursue to achieve these reductions and how they might align with other policy considerations and priorities.
Table 1 identifies and summarizes six discrete options for limiting oil production that California policy-makers could consider, noting the climate rationale, fraction of total state oil production that could be affected, feasibility, and other considerations. The first option is the simplest: California could stop issuing new oil well permits. If this measure were adopted, production would decline slowly as existing fields were depleted, and by 2030, it could drop by 60-70% relative to current and forecast levels. (The particular fields that would be most affected are ex-plored in more detail below). The California Environmen-tal Quality Act (CEQA) could provide the basis for DOGGR to deny permits based on their climate, health, and other environmental risks.
The State could also elect to restrict permitting of oil pro-duction in areas that already suffer from high pollution vulnerability. The California Council on Science and Tech-nology, in its 2015 study of state-wide fracking and well stimulation, noted that the scientific literature supports the need for minimum distances between homes and oil wells -- called setbacks -- to limit exposure to air pollution from all oil and gas wells, and recommended that the state promptly implement setbacks and other measures to reduce exposure.39,47 The State’s Office of Environmental Health Hazard Assessment has also conducted an assess-ment of disproportionate pollution vulnerability for each census tract in the state that could be used to suggest where further oil production should be constrained.38
v CARB’s Scoping Plan describes how the agency “has begun exploring how to build an accounting framework that also utilizes existing program data to better reflect the broader benefits of our policies that may be happening outside of the State.” The emissions reductions that result from constraining oil supply could be addressed in such an accounting framework.

7
Table 1: Policy options for limiting oil production in California
Policy that would limit oil production
Climate rationaleApproximate fraction of California’s oil production affected (in 2030)
Feasibility and other considerations
Cease issuance of new oil well permits
New oil wells are not consistent with Paris goals
~60-70%
New permits issued by DOGGR are subject to CEQA and may be denied based on their environmental risks and harms
Limit oil production in areas with disproportionate pollution vulnerability, e.g. using setbacks
Climate change already places disproportionate burdens on vulnerable communities
~40%, based on regions in the 80th percentile or more for pollution vulnerability
The CCST recommended that the state develop setbacks and other measures to limit exposure to air pollution from oil and gas wells
Charge a carbon ‘adder’ on oil extraction
A carbon adder could be charged at the wellhead to cover a portion (e.g. 50%) of the damages associated with burning each barrel of oil, similar to CEA 201646
~25% would no longer be economic, based on adder equivalent to $50/tCO2 or ~ $20/bbl and oil price of $89/bbl
Could be structured as a severance tax or similar fee and provide revenue for a just transition away from fossil fuel extraction
Remove state-level subsidies (or counteract existing federal subsidies) for oil production
Subsidies, including U.S. federal tax preferences, increase oil production (and profits), increasing emissions
Up to 50%36
Would require defining in-state subsidies and a detailed understanding of field or well cost data, usually proprietary
Phase out GHG-intensive oil production through an emissions performance standard (e.g., total life cycle GHG emissions cannot exceed 600 kg CO2e/barrel)
Maximizes overall GHG savings per barrel not produced; achieves some emissions reductions regardless of level of substitution
~70-80% is from fields currently > 600 kg CO2e/bbl
Requires estimates of GHG-intensity for each oil field; could lead to on-site emissions mitigation measures instead of reduced production
Phase out high-cost oil (e.g., oil that requires a breakeven price of $60 per barrel or greater without subsidies3)
Better aligns CA oil production with 2 degree target; reduces risk of stranded assets as high-cost oil may not be financially viable in a low-carbon transition
~40%
Requires understanding of field or well-level cost data, usually proprietary and subject to change with technology advancement over time
Another option would be to place a carbon adder or price on the carbon in oil that is extracted, which could be implemented in the form of a severance tax (which many states apply), and could be used to support tran-sitions for workers and communities more dependent on oil. This type of approach was assessed (for coal) by the White House Council of Economic Advisors in 2016 and could apply similarly to oil.48,46
The State could also choose to create thresholds or criteria for issuing new permits or for continued operations. The State could implement an emissions performance standard for oil production – by requir-ing producers, for example, to limit emissions to 600 kg CO2e per barrel. This would be similar to its Low Carbon Fuel Standard (by incorporating full life cycle emissions) and its Emissions Performance Standard for power plants.
An emissions performance standard, however could result in fewer GHG emission reductions if it doesn’t stop production – and instead encourages producers to take more modest steps to reduce the GHG-intensity of production to just below the threshold. For example, the large South Belridge field could reduce emissions-intensity of each of its barrels from an estimated 690 kg CO2e to 600 kg CO2e, achieving a 90 kg CO2e reduc-tion per barrel. But ceasing production would reduce those emissions by at least that much, plus 80 kg to 240 kg per barrel from reduced oil consumption.
Another type of threshold – a cost-based threshold – would help make future investment and production more consistent with global climate goals and reduce the risks of stranded assets. For example, research has indicated that the price of oil could be in the range of $60 per bar-rel or less in an economy where oil demand is reduced to levels consistent with a 2-degree warming goal, suggest-ing that new oil fields or wells that break even above this level may become ‘stranded’.3
As Table 1 and this discussion illustrates, there are a number of practical measures that State decision-makers could consider as part of integrating limits on oil produc-tion in its overall climate strategy. In doing so, the further examination of key implications – from the cost and feasi-bility to interactions with other California policies such as the cap-and-trade program – would be valuable.
Illustrating how a phase-out of permitting might workIn this section, we explore the option of phasing out new well permits in more detail. Figure 3 displays a scenario of how these new permits – about 2,500 issued each year – determine the state’s future oil production. In this figure, the state’s total oil production is taken from U.S. EIA’s reference case scenario that already sees California oil production declining steadily, as stated above. We then assume that production from already operating wells declines at 10% per year (based on well-specific data available in the Drillinginfo database), and that the

8
balance of production comes from fields that have domi-nated recent (2013-2017) well completion trends in the state, based on DOGGR data.49
If DOGGR were to cease issuance of new permits from 2018, California oil would continue its decline and by 2030, it would avoid the production of about 80 million barrels of oil annually, compared to the EIA’s reference scenario.
As described earlier, these reductions in California oil production would lead, via small increases in the global
price of oil, to lower global oil consumption, mostly out-side California. Still, these cuts to California oil produc-tion would presumably not be taken in isolation. Rather, California is also taking aggressive steps to reduce oil demand. Taken together, acting on both the demand and supply side could lead to almost no net effect on global oil prices; in other words, there would be no net effect if California supply and demand were both cut by the same amount as a result of the state’s climate and energy policy. In this way, supply- and demand-side policies reinforce each other. Either type of policy implemented on its own could result in carbon leakage, an outcome in
Figure 3: Scenario of California’s future oil productionSource: EIA Annual Energy Outlook 2018 (top line, reference case oil production); Drillinginfo database (decline rate for existing wells of 10%). DOGGR well permitting data for 2013-2017 was used to estimate approximate share of new production. Given substantial uncertainty, this scenario should not be interpreted as a forecast.
-
50
100
150
200
2015 2020 2025 2030
Million barrels of
oilannually
Offshore (state)
All other onshore
Kern Front
Poso Creek
Coalinga
Elk Hills
Cymric
Lost Hills
Kern River
Midway-Sunset
Belridge, South
Existing wells
Wells drilled in 2018 and beyond
EIA Annual Energy Outlook 2018 reference scenario
EIA historical data
Oil derricks pump oil in a field in Bakersfield, California.
© G
etty
/ A
lizad
aStu
dios

9
which an action to reduce emissions in one region leads to increased emissions in other region. If supply- and demand-side policies are implemented together, this effect is diminished.
In this way, reducing carbon leakage – and the inherent GHG benefit that reduced leakage brings50 – presents another rationale for limiting California’s oil supply. Indeed, the California Air Resources Board requires its climate policies “to minimize emissions leakage to the extent possible.”8 However, the Scoping Plan includes no obvious measures to address leakage associated with reduced oil consumption, and indeed does not estimate the emissions leakage that would occur due to any changes in oil prices. Limiting oil production provides a means to address leakage associated with reduced oil consumption, and could therefore help fill a hole in California’s existing emission-reduction policies.
Multiple criteria and policies could be used togetherThe policy approaches to limiting oil production in Cali-fornia shown in Table 1 are not mutually exclusive. The State could, for example, choose to use multiple criteria for determining where and how to constrain future oil production. Figure 4 below shows one possible way to consider multiple objectives together. In this chart, oil fields could be identified that are some combination of high cost (horizontal axis), high GHG-intensity (vertical axis), large producers (bubble size), and with substantial environmental justice concerns (bubble color). Policy-makers could then use such information to sequence
Figure 4: Multiple factors could inform a policy approach to limiting oil productionSource: SEI analysis. Seven largest 2030 oil fields shown, representing 70% of 2030 production (bubble size proportional to production), with costs and quantities as in Figure 2. Colors indicate CalEnviroScreen 3.0 Percentiles of overlying census tracts;38 Red= 90th percentile of CES 3.0 score and higher; Orange=80th to 90th percentile; yellow-orange = 60th to 80th percentile. GHG-intensity estimates from Oil Climate Index.51 Low-carbon two degree oil prices as summarized in Erickson and Lazarus (2018).3
a phase-down of oil production. Figure 4 suggests, for example, that the South Belridge field not only combines high life-cycle GHG emissions and a high breakeven oil price, but also extends across an area that is already between the 80th and 90th percentiles in high pollution vulnerability. The State could elect, for instance, to begin a phase-down here. A severance tax or carbon adder could further provide funding to support transitioning businesses and workers to other productive enterprises.
ConclusionsThe State of California and Governor Jerry Brown are perceived as global leaders in the effort to limit the dan-gers caused by climate change. But as the governor him-self has noted, “what we are doing is relatively limited [compared] to the existential threat that we face.”52
As this analysis has shown, phasing out California’s oil production is one way to increase the state’s ambition. In so doing, it could also perhaps serve as a model policy tool to be considered by the states and nations who come to San Francisco for the September 2018 Climate Sum-mit. Indeed, addressing fossil fuel production is a policy approach that – in addition to its tangible CO2 reduction benefits – can also capture the public’s attention in mov-ing towards a low-carbon economy, and thus encourage greater support for climate action writ large.53,23
Phasing down California’s oil production can also demon-strate global leadership for the required phase-out of fos-sil fuels. Equity principles suggest that relatively wealthy regions like California should be the first to start weaning
South Belridge
Elk Hills
Kern River
Midway-Sunset
WilmingtonLost Hills
0
100
200
300
400
500
600
700
800
900
$- $20 $40 $60 $80 $100
Total GHG emissions per
barrel(kg CO2e / bbl)
Breakeven oil price ($/barrel)
491
~$60/bblOil price in a world that stays within 2 degrees:
GHG emissions of Saudi oil
GHG emissions of Canadian oil sands
Cymric
Los Angeles
CES 3.0 rating(higher percentile = more disproportionately vulnerable to pollution)
90th percentile
80-90th60-80th

10
off fossil fuel extraction, easing the transition for poorer producing regions with fewer resources and options for diversifying their economies.54,55,56
Indeed, even the U.S. Department of Interior has consid-ered that a fixed, global carbon budget may mean pur-posefully limiting U.S. oil production.30
And two countries – France and Costa Rica – have an-nounced phase-downs of their oil production. California – and Jerry Brown – could therefore demonstrate to the world that they are also ready to lead by being among the first areas to start phasing down oil supply.
Former President Obama set a precedent for such a policy in his rejection of the Keystone XL pipeline, stating that “we’re continuing to lead by example because ulti-mately if we’re going to prevent large parts of this Earth from becoming not only inhospitable but uninhabitable in our lifetimes, we’re going to have to keep some fossil fuels in the ground.”57
Limiting oil production also can help fill a hole in Califor-nia’s existing emission-reduction policies, by addressing carbon leakage that could arise from the state’s plans for reducing oil consumption.
Without question, there are political headwinds against such a policy anywhere in the U.S., even in California. But in the long term, the transition away from fossil fuels will need to be managed – actively – in order to be orderly and fair to the workers and communities involved in, and impacted by, oil production. This process will no doubt require approaches beyond those that have been de-signed or, certainly, legislated to date. Should policy-mak-ers in California seek to further encourage this transition, our analysis shows that there could be several benefits to doing so, and several policy approaches already available.
Endnotes1. CARB (2017). 2017 Climate Change Scoping Plan Update:
Resolution 17-46. State of California Air Resources Board, Sacramento, CA
2. DOI (2016). Fact Sheet: President Obama Protects 125 Million Acres of the Arctic Ocean. U.S. Department of Interior https://www.doi.gov/sites/doi.gov/files/uploads/2016_arctic_withdrawal_fact_sheet_for_release.pdf
3. Erickson, P. and Lazarus, M. (2018). Would constraining US fossil fuel production affect global CO2 emissions? A case study of US leasing policy. Climatic Change, in press.
4. US EIA (2017). State Energy Data System. United States Energy Information Administration, Washington, D.C. https://www.eia.gov/state/seds/
5. Rystad Energy (2017). Cube Browser, Version 1.19. Oslo, Norway https://www.rystadenergy.com/Products/EnP-Solutions/UCube/Default
6. Gordon, D. and Wojcicki, S. (2017). Drilling Down on Oil: The Case of California’s Complex Midway Sunset Field. Carnegie Endowment for International Peace http://carnegieendowment.org/2017/03/15/drilling-down-on-oil-case-of-california-s-complex-midway-sunset-field-pub-68210
7. CARB (2017). California Greenhouse Gas Emission Inventory. California Air Resources Board, Sacramento, CA https://www.arb.ca.gov/cc/inventory/data/data.htm
8. CARB (2017). California’s 2017 Climate Change Scoping Plan. California Air Resources Board, Sacramento, CA https://www.arb.ca.gov/cc/scopingplan/scopingplan.htm
9. Aniss Bahreinian, Eva Borges, Jesse Gage, Bob McBride, Gordon Schremp, Ysbrand van der Werf and Gary Yowell (2015). Staff Draft Report, Transportation Energy Demand Forecast, 2016-2026. Publication Number: CEC-200-2015-008-SD. California Energy Commission, Sacramento, CA
10. U.S. EIA (2018). Annual Energy Outlook 2018. U.S. Energy Information Administration, Washington, DC http://www.eia.gov/forecasts/aeo/
11. US EIA (2017). Crude Oil Production. 31 July. https://www.eia.gov/dnav/pet/pet_crd_crpdn_adc_mbbl_a.htm
12. Brandt, A. R. (2011). Oil Depletion and the Energy Efficiency of Oil Production: The Case of California. Sustainability, 3(12). 1833–54. DOI:10.3390/su3101833
13. Long, J. C. S., Feinstein, L. C., Birkholzer, J., Jordan, P., Houseworth, J., Dobson, P. F., Heberger, M. and Gautier, D. L. (2016). An Independent Scientific Assessment of Well Stimulation in California: Volume I: Well Stimulation Technologies and Their Past, Present, and Potential Future Use in California. California Council on Science and Technology, Sacramento, CA http://ccst.us/projects/hydraulic_fracturing_public/BLM.php
14. U.S. EIA (2018). Annual Energy Outlook 2018. U.S. Energy Information Administration, Washington, DC http://www.eia.gov/forecasts/aeo/
15. DOGGR (2017). 2016 Report of California Oil and Gas Production Statistics. California Department of Conservation, Division of Oil, Gas, and Geothermal Resources
16. U.S. EPA (2017). Inventory of U.S. Greenhouse Gas Emissions and Sinks: 1990-2015. U.S. Environmental Protection Agency, Washington, DC https://www.epa.gov/ghgemissions/draft-inventory-us-greenhouse-gas-emissions-and-sinks-1990-2015
17. IPCC (2006). 2006 IPCC Guidelines for National Greenhouse Gas Inventories. H. Eggleston, L. Buendia, K. Miwa, T. Ngara, and K. Tanabe (eds.). Institute for Global Environmental Strategies (IGES) on behalf of the Intergovernmental Panel on Climate Change, Hayama, Japan http://www.ipcc-nggip.iges.or.jp/public/2006gl/index.html
18. Perloff, J. M. (2007). Microeconomics. 4th ed. Pearson, London, UK
19. Erickson, P. and Lazarus, M. (2014). Impact of the Keystone XL pipeline on global oil markets and greenhouse gas emissions. Nature Climate Change, 4(9). 778–81. DOI:10.1038/nclimate2335
20. Roberts, D. (2015). Is there any point in trying to restrict fossil fuel supplies? A new paper says yes. Vox, 29 October. http://www.vox.com/2015/10/29/9638744/fossil-fuel-supply-side-policy
21. Lazarus, M., Erickson, P. and Tempest, K. (2015). Supply-Side Climate Policy: The Road Less Taken. 2015–13. Stockholm Environment Institute http://www.sei-international.org/publications?pid=2835 SEI Working Paper
22. Erickson, P. (2017). Rebuttal: Oil Subsidies – More Material for Climate Change Than You Might Think. Council on Foreign Relations, 2 November. https://www.cfr.org/blog/rebuttal-oil-subsidies-more-material-climate-change-you-might-think
23. Collier, P. and Venables, A. J. (2014). Closing coal: Economic and moral incentives. Oxford Review of Economic Policy, 30(3). 492–512. DOI:10.1093/oxrep/gru024
24. Bordoff, J. and Houser, T. (2015). Navigating the U.S. Oil Export Debate. Columbia University, Center on Global Energy Policy and Rhodium Group, New York http://rhg.com/reports/navigating-the-us-oil-export-debate

11
25. Hamilton, J. D. (2008). Understanding Crude Oil Prices. 14492. National Bureau of Economic Research http://www.nber.org/papers/w14492 Working Paper
26. Brook, A.-M., Price, R., Sutherland, D., Westerlund, N. and André, C. (2004). Oil price developments: drivers, economic consequences and policy responses. http://papers.ssrn.com/Sol3/papers.cfm?abstract_id=651323
27. Rajagopal, D. and Plevin, R. J. (2013). Implications of market-mediated emissions and uncertainty for biofuel policies. Energy Policy, 56. 75–82. DOI:10.1016/j.enpol.2012.09.076
28. Baffes, J., Kose, M., Ohnsorge, F. and Stocker, M. (2015). The Great Plunge in Oil Prices: Causes, Consequences, and Policy Responses. ID 2624398. Social Science Research Network, Rochester, NY https://papers.ssrn.com/abstract=2624398 SSRN Scholarly Paper
29. Wingfield, B., Dodge, S. and Warren, H. (2017). This is How Oil Nations Are Doing at Cutting Production. Bloomberg.com, 19 May. https://www.bloomberg.com/graphics/2017-opec-production-targets/
30. Wolvovsky, E. and Anderson, W. (2016). OCS Oil and Natural Gas: Potential Lifecycle Greenhouse Gas Emissions and Social Cost of Carbon. BOEM OCS Report 2016-065. U.S. Department of Interior, Bureau of Ocean Energy Management, Sterling, VA https://www.boem.gov/OCS-Report-BOEM-2016-065/
31. Metcalf, G. (2016). The Impact of Removing Tax Preferences for U.S. Oil and Gas Production. Council on Foreign Relations http://www.cfr.org/energy-policy/impact-removing-tax-preferences-us-oil-gas-production/p38150
32. ICF and Ensys (2014). The Impacts of U.S. Crude Oil Exports on Domestic Crude Production, GDP, Employment, Trade, and Consumer Costs. ICF International for the American Petroleum Institute
33. Gordon, D., Brandt, A., Bergerson, J. and Koomey, J. (2015). Know Your Oil: Creating A Global Oil - Climate Index. Carnegie Endowment for International Peace http://carnegieendowment.org/files/know_your_oil.pdf
34. Oil Climate Index (2016). Oil Climate Index Webtool - Phase II. Carnegie Endowment for International Peace http://oci.carnegieendowment.org/#total-emissions
35. Fæhn, T., Hagem, C., Lindholt, L., Mæland, S. and Rosendahl, K. E. (2017). Climate policies in a fossil fuel producing country: Demand versus supply side policies. The Energy Journal, 38(1). 77–102. DOI:10.5547/01956574.38.1.tfae
36. Erickson, P., Down, A., Lazarus, M. and Koplow, D. (2017). Effect of subsidies to fossil fuel companies on United States crude oil production. Nature Energy, 2(11). 891–98. DOI:10.1038/s41560-017-0009-8
37. Fleurbaey, M., Kartha, S., Bolwig, S., Chee, Y., Corbera, E., et al. (2014). Sustainable development and equity. In Climate Change 2014: Mitigation of Climate Change. Contribution of Working Group III to the Fifth Assessment Report of the Intergovernmental Panel on Climate Change. O. Edenhofer, R. Pichs-Madruga, Y. Sokona, E. Farahani, E., S. Kadner, et al. (eds.). Cambridge University Press, Cambridge, UK and New York https://www.ipcc.ch/report/ar5/wg3/
38. OEHHA (2017). CalEnviroScreen 3.0. Office of Environmental Health Hazard Assessment (OEHHA), on behalf of the
An oil platform in state waters off Huntington Beach, California
© S
elbe
Lyn
n /
Flic
kr

49. DOGGR (2017). All Wells Database. California Department of Conservation, Division of Oil, Gas, and Geothermal Resources
50. Rajagopal, D. (2017). A synthesis of unilateral approaches to mitigating emissions leakage under incomplete policies. Climate Policy, 17(5). 573–90. DOI:10.1080/14693062.2016.1150249
51. Gordon, D. and Wojcicki, S. (2017). Need to Know: The Case for Oil Transparency in California. Carnegie Endowment for International Peace http://carnegieendowment.org/2017/03/15/need-to-know-case-for-oil-transparency-in-california-pub-68166
52. Edmund G. Brown (2017). Remarks of Governor Jerry Brown at America’s Pledge at COP23. Bonn, Germany https://youtu.be/gXyFW9_EJ_U
53. Piggot, G. (2018). The influence of social movements on policies that constrain fossil fuel supply. Climate Policy, Advanced online. DOI:10.1080/14693062.2017.1394255
54. Kartha, S., Lazarus, M. and Tempest, K. (2016). Fossil Fuel Production in a 2°C World: The Equity Implications of a Diminishing Carbon Budget. Stockholm Environment Institute, Somerville, MA https://www.sei-international.org/publications?pid=3020 SEI Discussion Brief
55. Caney, S. (2016). Climate Change, Equity, and Stranded Assets. Oxfam America http://www.oxfamamerica.org/explore/research-publications/climate-change-equity-and-stranded-assets/
56. Lenferna, G. A. (2018). Can we equitably manage the end of the fossil fuel era? Energy Research & Social Science, 35. 217–23. DOI:10.1016/j.erss.2017.11.007
57. The White House (2015). Statement by the President on the Keystone XL Pipeline. 6 November. https://obamawhitehouse.archives.gov/the-press-office/2015/11/06/statement-president-keystone-xl-pipeline
This discussion brief was written by Peter Erickson and Michael Lazarus. The authors thank Derik Broekhoff, Dan Lashof, Deepak Rajagopal, Christine Shearer, and Seth Shonkoff for helpful comments on this draft, and Frank Ackerman, Mason Inman, Greg Karras, Mohammad Masnadi, Greg Muttitt, and Kelly Trout for helpful conversations about data and methodology. Support for this research was provided by the 11th Hour Project of the Schmidt Family Foundation.
This brief is an output of the SEI Initiative on Fossil Fuels and Climate Change. To learn more, visit https://www.sei-international.org/fossil-fuels-and-climate-change
California Environmental Protection Agency (CalEPA), Sacramento, CA
39. Long, J. C. S., Feinstein, L. C., Birkholzer, J., Foxall, W., Houseworth, J., Jordan, P. and et al. (2016). An Independent Scientific Assessment of Well Stimulation in California: Volume III: Case Studies of Hydraulic Fracturing and Acid Stimulations in Select Regions: Offshore, Monterey Formation, Los Angeles Basin and San Joaquin Basin. California Council on Science and Technology, Sacramento, CA http://ccst.us/projects/hydraulic_fracturing_public/SB4.php
40. Srebotnjak, T. and Rotkin-Ellman, M. (2014). Drilling in California: Who’s at Risk? Natural Resources Defense Council, San Francisco, CA https://www.nrdc.org/sites/default/files/california-fracking-risks-report.pdf
41. Green, F. and Denniss, R. (2018). Cutting with both arms of the scissors: The economic and political case for restrictive supply-side climate policies. Climatic Change, forthcoming.
42. Piggot, G., Erickson, P., Lazarus, M. and van Asselt, H. (2017). Addressing Fossil Fuel Production under the UNFCCC: Paris and Beyond. Stockholm Environment Institute, Seattle, WA https://www.sei-international.org/publications?pid=3220 Working Paper
43. McAdam, D. (2017). Social movement theory and the prospects for climate change activism in the United States. Annual Review of Political Science, 20(1). 189–208. DOI:10.1146/annurev-polisci-052615-025801
44. Harstad, B. (2012). Buy Coal! A Case for Supply-Side Environmental Policy. Journal of Political Economy, 120(1). 77–115. DOI:10.1086/665405
45. McGlade, C. and Ekins, P. (2015). The geographical distribution of fossil fuels unused when limiting global warming to 2°C. Nature, 517(7533). 187–90. DOI:10.1038/nature14016
46. CEA (2016). The Economics of Coal Leasing on Federal Lands: Ensuring a Fair Return to Taxpayers. White House Council of Economic Advisers, Washington, D.C. https://www.whitehouse.gov/sites/default/files/page/files/20160622_cea_coal_leasing.pdf
47. Long, J. C. S., Feinstein, L. C., Bachmann, C. E., Birkholzer, J., Camarillo, M. K., Domen, J. K. and et al. (2016). An Independent Scientific Assessment of Well Stimulation in California: Volume II: Potential Environmental Impacts of Hydraulic Fracturing and Acid Stimulations. California Council on Science and Technology, Sacramento, CA http://ccst.us/projects/hydraulic_fracturing_public/SB4.php
48. Gerarden, T., Reeder, W. S. and Stock, J. H. (2016). Federal Coal Program Reform, the Clean Power Plan, and the Interaction of Upstream and Downstream Climate Policies. 22214. National Bureau of Economic Research http://www.nber.org/papers/w22214 Working Paper Author contacts:
Peter Erickson [email protected] Lazarus [email protected]
Media contact: Emily [email protected]
sei-international.org2018
Twitter: @SEIresearch, @SEIclimate
Published by:Stockholm Environment Institute1402 Third Avenue, Suite 900Seattle, WA 98101USATel: +1 206 547 4000