Embed Size (px)
Citation preview

&
ppic statewide survey
Californians Mark Baldassare
Dean Bonner
Sonja Petek
Jui Shrestha
CONTENTS
About the Survey 2
Press Release 3
Fiscal Attitudes and Policy Preferences 6
General Perceptions 16
Regional Map 22
Methodology 23
Questionnaire and Results 25
education
A P R I L 2 0 1 2
in collaboration with
The Dirk and Charlene Kabcenell Foundationand the Stuart Foundation

April 2012 Californians and Education 2
ABOUT THE SURVEY
The PPIC Statewide Survey provides policymakers, the media, and the public with objective, advocacy-free information on the perceptions, opinions, and public policy preferences of California residents. Inaugurated in April 1998, this is the 125th PPIC Statewide Survey in a series that has generated a database of responses from more than 264,000 Californians. This survey is conducted with funding from The Dirk and Charlene Kabcenell Foundation, the Stuart Foundation, and The Silver Giving Foundation. Its goal is to inform state policymakers, encourage discussion, and raise public awareness about K–12 public education issues. This is the eighth annual PPIC Statewide Survey since 2005 to focus on this topic.
California has the largest K–12 public education system in the nation. According to the California Department of Education and the Education Data Partnership (Ed-Data), the state served more than six million students in 1,050 school districts and about 9,900 public schools during the 2010–11 school year. California also has a highly diverse student population: More than half are economically disadvantaged (57%), a quarter are English learners (23%), and 10 percent have developmental, physical, emotional, or learning disabilities. Latinos (51%) make up the largest racial/ethnic group of students, followed by whites (27%), Asians (12%), and blacks (7%).
Governor Brown has placed K–12 public education at the center of his 2012–13 budget proposal. After several years of cutbacks, the governor would like to provide additional funding to the state’s school districts by temporarily increasing the personal income tax on upper-income earners and by temporarily raising the state sales tax. He is seeking voter approval through a citizen’s initiative on the November ballot. Should the initiative fail, the governor’s budget proposal calls for automatic multibillion dollar cuts to K–12 education. Meanwhile, the governor has called for two key education reforms: increased flexibility at the local level on spending state funds and the targeting of resources to schools with the neediest students.
In this context, this survey report presents the responses of 2,005 California adult residents on:
Fiscal attitudes and policy preferences, including priorities for state spending; preferences for the governor’s tax initiative and automatic K–12 spending cuts, and for raising specific taxes to provide additional funding for schools; whether the state budget situation is a problem for schools; concerns about teacher layoffs and shortening the school year; preferences for raising revenues for local schools; and attitudes toward reforms—increasing local flexibility and targeting resources to schools with more low-income students and English learners.
General perceptions, including approval ratings of the governor and legislature overall and of their handling of K–12 education; perceptions of California’s ranking in per pupil spending and student test scores compared to other states; concerns about the teacher shortage in lower-income areas and about English learners’ test scores; perceptions of their local public schools; and opinions of public school parents about their children’s schools.
Time trends, national comparisons, and the extent to which Californians may differ in their perceptions, attitudes, and preferences based on their political party affiliation, likelihood of voting, region of residence, race/ethnicity, whether they have children attending a California public school, and other demographics.
This report may be downloaded free of charge from our website (www.ppic.org). For more information about the survey, please contact [email protected]. Try our PPIC Statewide Survey interactive tools online at http://www.ppic.org/main/survAdvancedSearch.asp.

April 2012 Californians and Education 3
PPIC
Statewide
Survey
CONTACT
Linda Strean 415-291-4412
Andrew Hattori 415-291-4417
NEWS RELEASE
EMBARGOED: Do not publish or broadcast until 9:00 p.m. PDT on Wednesday, April 25, 2012.
Para ver este comunicado de prensa en español, por favor visite nuestra página de internet: http://www.ppic.org/main/pressreleaseindex.asp
PPIC STATEWIDE SURVEY: CALIFORNIANS AND EDUCATION
Worried About School Funding, Most Favor Tax Increase—For the Rich LIKELY VOTERS RELUCTANT TO RAISE OWN TAXES, BUT 54 PERCENT SUPPORT BROWN INITIATIVE
SAN FRANCISCO, April 25, 2012—California’s likely voters favor raising the state income taxes of the wealthiest state residents to provide more money for public schools, but most oppose increasing the state sales tax for this purpose. These are among the key findings of a statewide survey on K–12 education released today by the Public Policy Institute of California (PPIC).
The survey finds that 65 percent of likely voters favor raising the top rate of state income tax paid by the wealthiest Californians (34% oppose). By contrast, 46 percent support raising the state sales tax (52% oppose). Temporary increases in both of these taxes are components of Governor Jerry Brown’s proposed November ballot initiative to deal with the state’s multibillion-dollar budget gap.
Asked specifically about Brown’s initiative, 54 percent of likely voters say they would vote for it (39% would vote no) when they are read the ballot title and a brief summary. Direct comparisons with earlier PPIC surveys on this question are not possible because the initiative has changed. However, likely voters’ support was about the same in March when they were read the identical ballot title and a similar summary (52% yes, 40% no). Today, Democrats and Republicans are sharply divided on the measure (75% Democrats yes, 65% Republicans no), with independents more likely to say they would vote yes (53%) than no (43%). Public school parents support the measure by a wide margin (60% yes, 36% no).
If voters reject his initiative, Brown says there will be automatic cuts to public schools. A strong majority of likely voters (78%) oppose these cuts—a view held across parties.
The survey also asked about another idea being proposed to provide more money for education: an overall increase in state personal income taxes. The majority of likely voters (57%) oppose this tax increase (40% favor).
“Most likely voters favor the governor’s tax initiative, although they express much stronger support for raising taxes on the wealthy than increasing their own taxes for public schools,” says Mark Baldassare, PPIC president and CEO.
There is a strong partisan split among likely voters on the specific tax increases to provide more money for public schools. Most Democrats favor increasing the state income tax on high earners (89%), the state sales tax (64%), and personal income taxes overall (56%). Most independents favor raising income taxes on the wealthy (63%), but not the state sales tax (43% favor) or personal income tax (42% favor). Support is low among Republicans for raising any of these taxes to fund schools (36% support higher taxes on the wealthy, 25% support state sales tax increase, 21% support personal income tax increase).

PPIC Statewide Survey
April 2012 Californians and Education 4
DESPITE CONCERNS ABOUT FUNDING, MOST BALK AT RAISING LOCAL TAXES
An overwhelming majority of likely voters (72%) say the state budget situation is a big problem for public schools, and 67 percent say the quality of education is a big problem. When they are asked to choose among the four main areas of state spending, most (58%) say that K–12 education is the area they most want to protect from spending cuts (17% higher education, 15% health and human services, 7% prisons and corrections). And most (59%) say the current level of state funding for their local public schools is not adequate.
Likely voters are worried about steps that schools have taken to deal with decreased funding: 67 percent say they are very concerned about schools laying off teachers and 62 percent are very concerned about having fewer days of school instruction.
When public school parents are asked about the impact of budget cuts, a large majority (81%) report that their child’s public school has been affected a lot (36%) or somewhat (45%) by recent state budget cuts. Most (58%) say they are very concerned about teacher layoffs at their child’s school, with Latino parents (65%) much more likely than white parents (47%) to feel this way.
But just as most likely voters balk at raising their own state taxes to aid public schools, they are reluctant to increase their local taxes. Asked whether they would vote yes on a bond measure to pay for construction projects for their local school district, 53 percent say they would vote yes—but this is less than the 55 percent threshold needed to pass such a measure. If there were a local ballot measure that increased local parcel taxes to benefit schools, 51 percent would vote yes; this falls short of the two-thirds’ approval required for passage of a parcel tax.
FEW SAY THAT MONEY ALONE WILL SOLVE PROBLEMS
How can school quality be improved? Just 6 percent of likely voters say increased funding alone will lead to significant improvement. Forty-eight percent say that using funds more wisely will significantly improve schools, and a similar share (46%) say both are needed.
“While many Californians believe that the state’s budget situation is a big problem for public schools, few think that money alone is the answer,” Baldassare says. “Most continue to say that significant improvements in the quality of education will take place when we spend money more wisely.”
MOST PREFER LOCAL CONTROL OVER STATE FUNDS FOR SCHOOLS
The governor is proposing two other K–12 education reforms: giving school districts more flexibility in deciding how to spend state funds and giving districts with more low-income students or English learners more money than other schools.
Likely voters favor the idea of spending decisions made closer to home. Asked who should have the most control over spending decisions—local schools, local school districts, or state government—an overwhelming majority prefer local control (53% districts, 36% schools, 6% state). This majority holds across parties, regions, and demographic groups. But there are some differences: Los Angeles residents are less likely than others to choose local school districts (40% vs. about half in other regions) and more likely to choose state government (21% vs. about 10% in other regions). Among ethnic groups, Latinos (24%) are more likely than Asians (17%) or whites (7%) to favor state government control.
After being informed that some state funding provided to K–12 schools is earmarked for specific programs or goals, the vast majority of likely voters (81%) say they would favor giving local districts more flexibility over how that money is spent. How confident are they that school districts would spend the money wisely? Most (75%) are at least somewhat confident (18% very confident).

PPIC Statewide Survey
April 2012 Californians and Education 5
SUPPORT FOR DIRECTING MONEY TO NEEDIEST STUDENTS
Brown’s proposal to target resources to low-income students and English learners has drawn support from many experts and school leaders, and generated controversy over its impact on districts with fewer of these students.
As they have in past PPIC surveys, most likely voters (79%) say that school districts in lower-income areas of the state have fewer resources—including good teachers and classroom materials—than those in wealthier areas. Fifty-four percent of likely voters say that if new funding were to become available, more of it should go to the districts with more low-income students. They are much less likely (40%) to support the idea of giving more funding to districts with more English learners.
Responses are the same when likely voters are asked to consider the possibility that giving more money to schools with more needy students means that other districts would get less: 53 percent would give more money to districts with more low-income students and 40 percent would give more money to districts with more English learners.
BROWN’S JOB APPROVAL RATING HOLDS STEADY
As the governor tries to build support for his tax initiative, 47 percent of likely voters approve of his job performance (40% disapprove, 12% don’t know). This is similar to March (46% approve, 38% disapprove, 16% don’t know) and April 2011 (46% approve, 32% disapprove, 21% don’t know). Brown gets much lower marks for his handling of K–12 education: 23 percent approve, 54 percent disapprove, 23 percent don’t know. The state legislature fares poorly on both measures: Just 15 percent of likely voters approve of the way the legislature is doing its job, and just 10 percent approve of its handling of K–12 education.
MORE KEY FINDINGS
One in four know how California ranks on spending, test scores—page 18
Twenty-seven percent of likely voters correctly state that California is below average in its spending per pupil and in student test scores compared to other states.
Concerns about teacher shortage, English learners—page 19
Most likely voters are very concerned that schools in lower-income areas have a shortage of good teachers compared to schools in wealthier areas (62%) and that English learners score lower on standardized tests than other students (53%).
Local public schools get good grades—page 20
Half of Californians (52%) give a grade of A (17%) or B (35%) to their local public schools, similar to adults nationwide in a 2011 Phi Delta Kappa/Gallup poll. Public school parents are slightly more positive, with 24 percent giving A’s and 36 percent giving B’s to their schools.
This PPIC survey is conducted with funding from The Dirk and Charlene Kabcenell Foundation, the Stuart Foundation, and The Silver Giving Foundation.

April 2012 Californians and Education 6
FISCAL ATTITUDES AND POLICY PREFERENCES
KEY FINDINGS
Of California’s largest areas of spending, K–12 education is the one that likely voters most want to protect from cuts. (page 7)
Fifty-four percent of likely voters favor Governor Brown’s proposed tax initiative that would provide additional funding for K–12 public schools. Strong majorities oppose the automatic cuts to education that could result from the measure’s defeat. (page 8)
The governor’s initiative would temporarily raise income taxes on top earners—65 percent of likely voters favor this idea in general to provide additional K–12 funding. The initiative would also temporarily increase the sales tax, but 52 percent of likely voters oppose this idea in general. Forty percent favor raising state personal income taxes for K–12 education. (page 9)
Two thirds of likely voters believe the state budget situation is a big problem for K–12 schools, but many believe that money also needs to be spent more wisely. (page 10)
State residents are seriously concerned about schools laying off teachers or shortening the school year to deal with lower funding levels. (page 11)
Six in 10 adults—but only about half of likely voters—would support bond measures or parcel taxes to raise revenues for their local public schools. (page 12)
When asked about proposed school reforms, likely voters strongly support giving local school districts more flexibility over spending decisions, and just over half favor targeting funds to districts with more low-income students. Four in 10 support the idea of targeting funds to districts with more English learners. (pages 13–15)
65
4640
34
5257
0
20
40
60
80
Income Taxon Wealthy
StateSales Tax
PersonalIncome Tax
Per
cent
like
ly v
oter
s
Favor Oppose
Raising Taxes to Provide Fundingfor K–12 Public Education
5439
6
Yes
No
Don't know
Vote on Governor Brown's Proposed Tax Initiative, with Ballot Title and a Summary
54
40
53
40
0
20
40
60
80
...Low-incomestudents
...English languagelearners
Per
cent
like
ly v
oter
s
If new funding available
If less funding for other districts
Support for Targeting Money to School Districts That Have More...
Likely voters

PPIC Statewide Survey
April 2012 Californians and Education 7
STATE BUDGET
As local public schools face funding uncertainties again this year, nearly all likely voters (96%) and all public school parents likely to vote (100%) believe the state budget is at least somewhat of a problem. Eighty percent of likely voters consider the budget situation a big problem, similar to our survey findings in March (78%), January (78%), and last December (83%). Sixty-four percent of likely voters and 70 percent of public school parents likely to vote say that local government services, such as those provided by city and county government and public schools, have been affected a lot by recent state budget cuts. At least six in 10 likely voters in March (66%), January (60%), and last December (65%) said their local services had been affected a lot by recent state budget cuts. Today, majorities of likely voters across political party groups, demographic groups, and state regions share the view that local governments have been affected a lot by recent state budget cuts.
“Would you say that your local government services—such as those provided by city and county governments and public schools—have or have not been affected by recent
state budget cuts? (if they have: Have they been affected a lot or somewhat?)”
Likely voters only All Likely Voters
Party Public School Parents Dem Rep Ind
Affected a lot 64% 67% 61% 64% 70%
Affected somewhat 26 24 26 28 23
Not affected 6 5 8 6 6
Don’t know 5 5 5 3 1
When read the four major areas of state spending—K–12 public education, health and human services, higher education, and prisons and corrections—58 percent of likely voters and 64 percent of public school parents say K–12 public education is the area they would most like to protect from spending cuts. Since this question was first asked in June 2003, a majority of likely voters have always said K–12 education is the area they would most like to protect. Most likely voters across regions and party, age, education, and income groups say K–12 education is the area they would most like to protect from cuts.
“Some of the largest areas for state spending are K–12 public education, higher education, health and human services, and prisons and corrections. Thinking about these four areas of state spending, I’d like
you to name the one you most want to protect from spending cuts.”
Likely voters only All Likely Voters
Party Public School Parents Dem Rep Ind
K–12 public education 58% 66% 51% 48% 64%
Higher education 17 13 18 26 15
Health and human services 15 16 13 15 11
Prisons and corrections 7 3 13 7 10
Don’t know 4 2 5 4 –
How would Californians prefer to deal with the state’s multibillion dollar gap between spending and revenues? Majorities of likely voters (58%) and public school parents (57%) would include taxes in the solution, with most preferring a mix of spending cuts and tax increases. Fewer than four in 10 likely voters (36%) and public school parents (39%) prefer to deal with the state’s budget gap mostly through spending cuts. Most Democrats prefer a solution that includes tax increases (58% mix of cuts and taxes, 22% mostly tax increases), while most Republicans prefer mostly spending cuts (62%).

PPIC Statewide Survey
April 2012 Californians and Education 8
GOVERNOR’S PROPOSED TAX INITIATIVE
Governor Brown and others have proposed a tax initiative to deal with the state’s multibillion dollar budget gap. The initiative calls for a temporary increase in both the state sales tax and the state personal income tax on wealthy Californians. When read the ballot title and a brief summary, 54 percent of likely voters say they would vote yes on the initiative, 39 percent say no, and 6 percent say they are undecided. While direct comparisons are not possible, likely voters’ support for an earlier version of the governor’s proposed tax initiative was about the same when read the identical ballot title and a similar ballot summary in March (52% yes, 40% no). Likely voter support was higher in questions that predated the ballot title in our December 2011 survey (60% in favor) and January 2012 survey (68% in favor). Today, while 75 percent of Democrats would vote yes, 65 percent of Republicans would vote no. Independents are more likely to say they would vote yes (53%) than no (43%). At least half of men (51%) and women (57%) support the proposed tax initiative. Support is similar across income groups but far higher among Latinos (70%) than whites (49%). Public school parents support the tax initiative by a wide margin (60% yes, 36% no).
“Governor Brown and others have proposed a tax initiative for the November ballot titled the ‘Temporary Taxes to Fund Education. Guaranteed Local Public Safety Funding. Initiative Constitutional Amendment.’
…If the election were held today, would you vote yes or no on the proposed tax initiative?” *
Likely voters only Yes No Don’t know
All Likely Voters 54% 39% 6%
Public School Parents 60 36 4
Party
Democrats 75 16 9
Republicans 31 65 4
Independents 53 43 4
Gender Men 51 44 5
Women 57 36 7
Race/Ethnicity Latinos** 70 25 5
Whites 49 43 8
Household Income
Under $40,000 57 36 7
$40,000 to under $80,000 56 38 6
$80,000 or more 54 41 5
*For complete text of question, see page 26. **Small sample size for Latino likely voters.
Governor Brown’s budget proposes automatic spending cuts to K–12 public schools if the tax initiative is rejected. Seventy-eight percent of likely voters, 77 percent of public school parents, and strong majorities across parties are opposed to the automatic spending cuts. Among those who would vote yes on the proposed tax initiative, 84 percent oppose the automatic spending cuts.
“If voters reject the proposed tax initiative on the November ballot, Governor Brown’s budget proposes that automatic spending cuts be made to K–12 public schools. Do you favor or oppose these automatic spending cuts to K–12 public schools?”
Likely voters only All Likely Voters
Party Vote on Governor’s Proposed Tax Initiative
Dem Rep Ind Yes No
Favor 19% 12% 23% 29% 14% 28%
Oppose 78 85 75 69 84 70
Don’t know 3 3 2 3 2 2

PPIC Statewide Survey
April 2012 Californians and Education 9
RAISING STATE TAXES TO SUPPORT K–12 EDUCATION
Support varies among California’s likely voters when it comes to the specific tax increases that some are proposing to provide additional funding for K–12 education: raising the top rate of the state income tax paid by the wealthiest Californians (65% favor, 34% oppose), raising the state sales tax (46% favor, 52% oppose), and raising personal income taxes (40% favor, 57% oppose).
Majorities of Democrats are in favor of raising the state income tax on the wealthiest Californians (89%), increasing the state sales tax (64%), and raising state personal income taxes (56%) to provide additional funding for K–12 education. A majority of independent likely voters favor raising the state income tax on the wealthiest Californians (63%), but only about four in 10 are in favor of increasing the state sales tax (43%) or the state personal income tax (42%). In contrast, Republican likely voters express little support for raising income tax rates among the wealthy (36%), raising the state sales tax (25%), or raising state personal income taxes (21%).
Majorities of men and women, Latinos and whites, and likely voters in all income groups favor—although to varying degrees—raising taxes on the wealthiest Californians to provide funding for K–12 education. Responses are more variable when it comes to the other two tax proposals. Latinos are much more likely than whites to favor raising the state sales tax (59% to 42%) and state personal income taxes (51% to 34%). Across income groups, both proposals (sales tax, personal income tax) lack majority support—with one exception: 52 percent of middle-income families (between $40,000 and $80,000) support raising the state sales tax.
Strong majorities of likely voters who say they would vote yes on the governor’s tax initiative say they are in favor of raising taxes on the wealthiest Californians (88%), raising the state sales tax (69%), and raising state personal income taxes (65%) to provide additional funding for K–12 education. There is little support for any of these proposals among those who would vote no on the governor’s tax initiative.
Likely voters only: Percent saying “favor”
Raising the top rate of the state income tax paid by
the wealthiest Californians
Raising the state sales tax
Raising state personal
income taxes
All Likely Voters 65% 46% 40%
Public School Parents 64 53 37
Party
Democrats 89 64 56
Republicans 36 25 21
Independents 63 43 42
Gender Men 56 43 41
Women 72 48 39
Race/Ethnicity Latinos 81 59 51
Whites 59 42 34
Household Income
Under $40,000 74 44 45
$40,000 to under $80,000 64 52 40
$80,000 or more 61 43 39
Vote on Governor’s Proposed Tax Initiative
Yes 88 69 65
No 32 13 9

PPIC Statewide Survey
April 2012 Californians and Education 10
STATE FUNDING AND EDUCATIONAL QUALITY
Consistent with their concern about the state budget, 90 percent of Californians say that the state’s fiscal situation is at least somewhat of a problem for California’s K–12 public schools; and 65 percent of all adults and 72 percent of likely voters consider it a big problem. Strong majorities across political groups; majorities across age, education, income, and regional groups; and 62 percent of public school parents say that the budget situation is a big problem for California’s K–12 public schools.
“How much of a problem is the overall state budget situation for California’s K–12 public schools today? Is it a big problem, somewhat of a problem, or not much of a problem?”
All Adults
Party Likely Voters
Dem Rep Ind
Big problem 65% 70% 65% 70% 72%
Somewhat of a problem 25 24 23 21 20
Not a problem 6 3 5 6 5
Don’t know 4 3 7 2 4
Most Californians (87%) believe that the quality of education in California’s K–12 public schools is at least somewhat of a problem, and over half (58%) consider it a big problem. Nor is this something new: For the last seven years (since April 2005), at least half of Californians have said the quality of K–12 education is a big problem. Likely voters (67%) are more likely than residents in general (58%) and public school parents (53%) to say that quality is a big problem. More than six in 10 across parties say that the quality of education is a big problem in California’s K–12 public schools.
So how do Californians think funding should be altered to significantly improve the quality of education in public schools? About four in 10 adults (44%) say that existing funds need to be used more wisely, while the same percentage (44%) support a dual approach: using funds more wisely and increasing the funding for K–12 public schools. Only 9 percent believe that simply increasing state funding would significantly improve educational quality. Findings have been similar since April 2008. (For example, last April, 43 percent said use funds more wisely, 41 percent favored the dual approach, and 13 percent believed that simply increasing the funding would be sufficient.) The preferences of likely voters are similar to those of all adults: 48 percent say funds should be used more efficiently, 46 percent say increase the funding and use it more wisely, and 6 percent say that simply increasing the funding would be sufficient. A majority of Democrats (56%) believe a dual approach is needed, while a majority of Republicans (59%) think that using existing funds more wisely is sufficient. Independents are divided (49% do both, 46% use funds more wisely). As for public school parents, 45 percent say use funding more wisely, 11 percent say increase funding, and 39 percent say do both to improve quality.
“To significantly improve the quality of California’s K–12 public schools, which of the following statements do you agree with the most? We need to use existing state funds more wisely,
we need to increase the amount of state funding, or we need to use existing state funds more wisely and increase the amount of state funding.”
All Adults
Party Likely Voters
Dem Rep Ind
Use funding more wisely 44% 34% 59% 46% 48%
Increase funding 9 8 5 4 6
Do both 44 56 35 49 46
Don’t know 3 2 1 1 1

PPIC Statewide Survey
April 2012 Californians and Education 11
SPECIFIC SPENDING CUTS IN SCHOOLS
California’s public schools have taken numerous steps in recent years to cope with their declining funding, including laying off teachers and providing fewer school days. A majority of adults are very concerned about public schools laying off teachers and offering fewer days of classroom instruction (66% and 54%, respectively). Concern was similar last year—laying off teachers (68%), fewer days of instruction (56%). Concern about laying off teachers was somewhat higher in 2010 (73%).
“There are a number of ways for the state’s K–12 public schools to cut spending to deal with decreased state and local funding. For each of the following, please tell me if you are very concerned, somewhat
concerned, not too concerned, or not at all concerned. How about …?”
Laying off teachers Having fewer days of school instruction
Very concerned 66% 54%
Somewhat concerned 25 31
Not too concerned 5 9
Not at all concerned 3 5
Don’t know 1 1
Across parties, demographic groups, and regions and among public school parents, there is more concern about teacher layoffs than fewer days of classroom instruction. Concern about laying off teachers is higher among Democrats (75%) than independents (66%) or Republicans (58%), and concern about fewer days of instruction is also higher among Democrats (63%) than independents (54%) or Republicans (53%). Women are more likely than men to be very concerned about both teacher layoffs (72% to 60%) and a shorter school year (59% to 50%). Whites (67%), Latinos (64%), and Asians (59%) are all very concerned about teacher layoffs; fewer are very concerned about shortening the school year—whites and Latinos (55% each), Asians (47%). At least half of residents across the state’s major regions say they are very concerned about schools laying off teachers and having fewer days of classroom instruction.
Percent saying “very concerned” Laying off teachers Having fewer days of school instruction
All Adults 66% 54%
Likely Voters 67 62
Public School Parents 69 57
Party
Democrats 75 63
Republicans 58 53
Independents 66 54
Gender Men 60 50
Women 72 59
Race/Ethnicity
Asians 59 47
Latinos 64 55
Whites 67 55
Region
Central Valley 67 50
San Francisco Bay Area 67 61
Los Angeles 68 55
Other Southern California 62 55
PPIC Statewide Survey
April 2012 Californians and Education 12
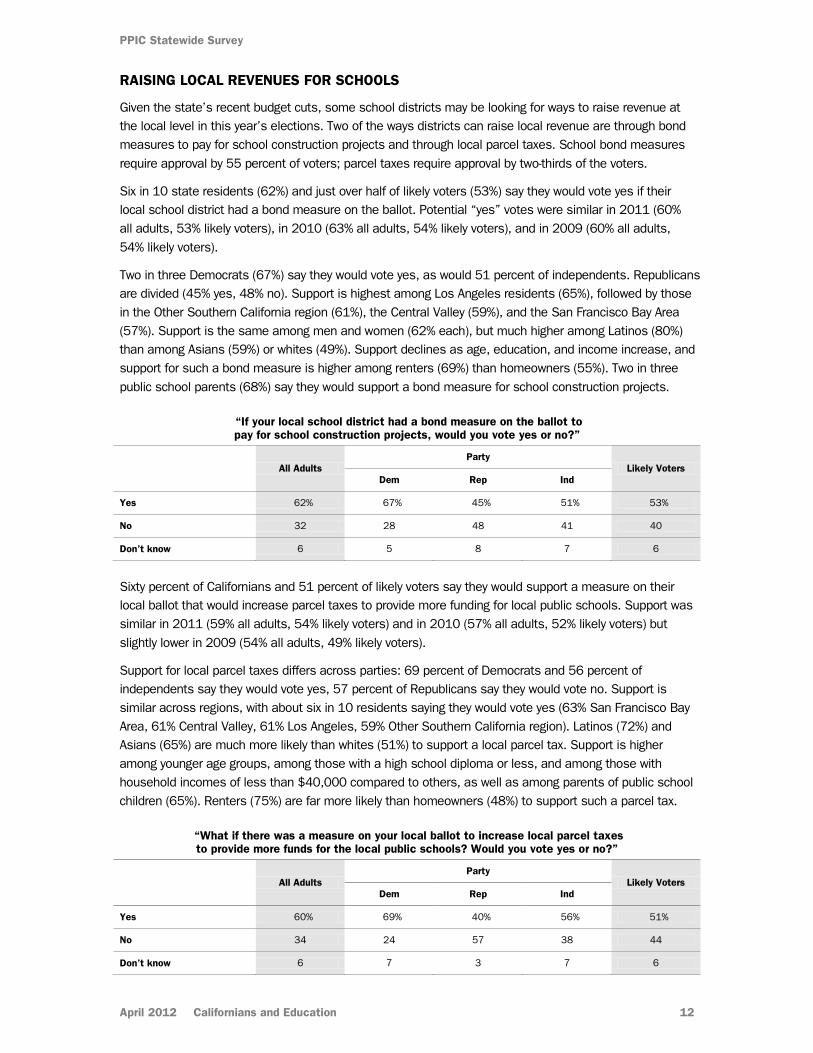
RAISING LOCAL REVENUES FOR SCHOOLS
Given the state’s recent budget cuts, some school districts may be looking for ways to raise revenue at the local level in this year’s elections. Two of the ways districts can raise local revenue are through bond measures to pay for school construction projects and through local parcel taxes. School bond measures require approval by 55 percent of voters; parcel taxes require approval by two-thirds of the voters.
Six in 10 state residents (62%) and just over half of likely voters (53%) say they would vote yes if their local school district had a bond measure on the ballot. Potential “yes” votes were similar in 2011 (60% all adults, 53% likely voters), in 2010 (63% all adults, 54% likely voters), and in 2009 (60% all adults, 54% likely voters).
Two in three Democrats (67%) say they would vote yes, as would 51 percent of independents. Republicans are divided (45% yes, 48% no). Support is highest among Los Angeles residents (65%), followed by those in the Other Southern California region (61%), the Central Valley (59%), and the San Francisco Bay Area (57%). Support is the same among men and women (62% each), but much higher among Latinos (80%) than among Asians (59%) or whites (49%). Support declines as age, education, and income increase, and support for such a bond measure is higher among renters (69%) than homeowners (55%). Two in three public school parents (68%) say they would support a bond measure for school construction projects.
“If your local school district had a bond measure on the ballot to pay for school construction projects, would you vote yes or no?”
All Adults
Party Likely Voters
Dem Rep Ind
Yes 62% 67% 45% 51% 53%
No 32 28 48 41 40
Don’t know 6 5 8 7 6
Sixty percent of Californians and 51 percent of likely voters say they would support a measure on their local ballot that would increase parcel taxes to provide more funding for local public schools. Support was similar in 2011 (59% all adults, 54% likely voters) and in 2010 (57% all adults, 52% likely voters) but slightly lower in 2009 (54% all adults, 49% likely voters).
Support for local parcel taxes differs across parties: 69 percent of Democrats and 56 percent of independents say they would vote yes, 57 percent of Republicans say they would vote no. Support is similar across regions, with about six in 10 residents saying they would vote yes (63% San Francisco Bay Area, 61% Central Valley, 61% Los Angeles, 59% Other Southern California region). Latinos (72%) and Asians (65%) are much more likely than whites (51%) to support a local parcel tax. Support is higher among younger age groups, among those with a high school diploma or less, and among those with household incomes of less than $40,000 compared to others, as well as among parents of public school children (65%). Renters (75%) are far more likely than homeowners (48%) to support such a parcel tax.
“What if there was a measure on your local ballot to increase local parcel taxes to provide more funds for the local public schools? Would you vote yes or no?”
All Adults
Party Likely Voters
Dem Rep Ind
Yes 60% 69% 40% 56% 51%
No 34 24 57 38 44
Don’t know 6 7 3 7 6

PPIC Statewide Survey
April 2012 Californians and Education 13
LOCAL FLEXIBILITY
In accord with the goal of realigning certain responsibilities from the state to the local level, the governor has proposed eliminating most categorical funding programs, thus increasing the flexibility of local school districts in deciding how to use state funds.
Most Californians (82%) want control over school spending decisions to reside at the local level, either within school districts (48%) or within the schools themselves (34%). Since we first began asking this question in 2008, very few residents have said they believe that the state government should control school spending decisions (15% or less since 2008, 14% today). Among likely voters, preference for local control is even higher (53% districts, 36% schools, 6% state government). Three in four public school parents prefer local control (47% districts, 29% schools, 18% state government).
Overwhelming majorities across parties, regions, and demographic groups prefer that school districts or local schools have the most control in deciding how state funding is spent in local public schools. Still, there are some differences between groups. For example, although more than seven in 10 residents across regions want some form of local control, Los Angeles residents are less likely than others to prefer local school districts (40% vs. about 50% in other regions) and more likely to select state government (21% vs. about 10% in other regions). Similarly, despite a strong preference among racial/ethnic groups for local control, Latinos (24%) are more likely than Asians (17%) or whites (7%) to choose state government.
“Who do you think should have the most control in deciding how the money from state government is spent in local public schools—
the local schools, the local school districts, or the state government?”
All Adults
Region Public School Parents Central Valley San Francisco
Bay Area Los Angeles Other Southern
California
Local schools 34% 33% 33% 33% 37% 29%
Local school districts 48 53 52 40 49 47
State government 14 12 12 21 10 18
Other/Don’t know 4 3 3 5 5 6
After being informed that some of the funding the state provides to K–12 public school districts is earmarked for specific programs and goals, the vast majority of Californians (79%), likely voters (81%), and public school parents (83%) say that they would favor giving local school districts more flexibility in deciding how this funding is spent. Support for such flexibility is widespread across parties (80% Republicans, 77% both Democrats and independents) and widespread across regions and demographic groups as well, especially among white residents (83% whites, 74% Latinos, 72% Asians).
“As you may know, some of the funding the state provides to K–12 public school districts is earmarked for specific programs and goals. Would you favor or oppose
giving local school districts more flexibility over how state funding is spent?”
All Adults
Region Public School Parents Central Valley San Francisco
Bay Area Los Angeles Other Southern
California
Favor 79% 80% 79% 79% 76% 83%
Oppose 15 16 14 17 16 13
Don’t know 6 4 7 5 8 4

PPIC Statewide Survey
April 2012 Californians and Education 14
LOCAL FLEXIBILITY (CONTINUED)
If the state were to give local school districts more flexibility over how state monies are spent, a majority of Californians (68%) are at least somewhat confident that the districts would spend this money wisely. However, about one-third of those polled are less confident (22% not too confident, 9% not at all confident). Solid majorities of likely voters, public school parents, and Californians across parties, regions, and demographic groups are at least somewhat confident that school districts would use the money wisely, although fewer than one in five in any group are very confident. Confidence is higher among residents in the Central Valley (75%) and the Other Southern California region (73%) than in the San Francisco Bay Area (66%) and Los Angeles (61%). Whites (72%) and Asians (78%) are more likely than Latinos (60%) to express at least some confidence. Confidence is higher among college graduates (78%) than among residents with less education (67% some college, 63% high school or less), and higher among upper-income residents (80%) than among those in the middle- (68%) and lower- (62%) income brackets. Among those who prefer that school districts have the most control over how state funding is spent in local schools, 73 percent are confident (13% very confident, 60% somewhat confident) that districts would spend the state money wisely.
“If the state were to give local school districts more flexibility over how state funding is spent, how confident are you that local school districts would use this money wisely? Are you very
confident, somewhat confident, not too confident, or not at all confident?”
All Adults
Region Public School Parents Central Valley San Francisco
Bay Area Los Angeles Other Southern
California
Very confident 14% 17% 11% 10% 18% 14%
Somewhat confident 54 58 55 51 55 54
Not too confident 22 20 21 26 19 25
Not at all confident 9 4 11 11 7 7
Don’t know 1 1 2 1 1 1
RESOURCE EQUITY
The governor is also proposing that school districts with more low-income students or English language learners receive more funding than other schools. Although many researchers and school leaders support this idea, there is some controversy over the baseline amount of funding per student and how this reallocation of funding would affect districts with fewer low-income students or English learners.
Most Californians (82%) believe that school districts in lower-income areas of the state have fewer resources than school districts in wealthier areas. At least 75 percent of Californians have held this view since this question was first asked in April 2005. Eight in 10 likely voters (79%) and public school parents (80%) believe resource differences between districts exist. More than two in three Californians across parties, regions, and demographic groups express this view.
“Do you think that school districts in lower-income areas of the state have the same amount of resources, including good teachers and classroom
materials, as school districts in wealthier areas, or not?”
All Adults
Race/Ethnicity Public School Parents Asians Latinos Whites
Yes 13% 11% 11% 15% 14%
No 82 76 85 79 80
Don’t know 6 13 4 5 6

PPIC Statewide Survey
April 2012 Californians and Education 15
RESOURCE EQUITY (CONTINUED)
Democrats and independents (87% each) are more likely than Republicans (68%)—and Latinos (85%) are slightly more likely than whites (79%) or Asians (76%)—to say that resources are not equal across districts. At least eight in 10 residents across all income and education groups say that resources are not equal between districts in lower-income areas and those in wealthier areas.
If the state were to have new money available for school districts, a strong majority of Californians (68%) say that districts with more low-income students should get more of the new funding. Fewer (52%) say that more funding should be given to districts with more English learners. Among likely voters, support is much lower for giving more money to districts with either type of student (low-income 54%, English learners 40%). More Democrats (72%) and independents (65%) than Republicans (42%) say that the additional funds should go to schools with more low-income students. Similarly, more Democrats (50%) and independents (49%) than Republicans (38%) say that the additional funding should go to schools with more English learners. Solid majorities of Latinos and Asians support targeting funds to both low-income students and English learners; among whites, a slim majority support the idea for low-income students, and a slim majority oppose it for English learners.
“If new state funding becomes available, do you think school districts that have more … should or should not get more of this new funding than other school districts?”
All Adults Race/Ethnicity Public School
Parents Asians Latinos Whites
Low-income students
Should 68% 75% 85% 53% 73%
Should not 27 18 12 41 24
Don't know 5 6 3 6 3
English language learners
Should 52 62 73 35 59
Should not 41 35 24 54 36
Don't know 7 3 4 11 5
Even if the redistribution of funding meant less funding for other school districts, support for needier districts is nearly identical to the support expressed if only new state funds were available, both among Californians (67% for low-income, 51% for English learners) and among likely voters (53% for low-income, 40% for English learners). Across parties and racial/ethnic groups, support for targeting funds, even in the case of less funding for other districts, is similar to support in the case of new funding, except that there is lower support among Asians for targeting funds to English learners.
“If it means less funding for other school districts, do you think school districts that have more … should or should not get more funding from the state?”
All Adults Race/Ethnicity Public School
Parents Asians Latinos Whites
Low-income students
Should 67% 74% 82% 53% 66%
Should not 28 24 14 40 29
Don't know 5 2 4 7 4
English language learners
Should 51 52 74 35 57
Should not 42 40 22 56 36
Don't know 7 8 4 9 7

April 2012 Californians and Education 16
GENERAL PERCEPTIONS
KEY FINDINGS
Just over four in 10 Californians continue to express approval of Governor Brown’s overall job performance; positive ratings drop considerably for his handling of the K–12 public education system. Majorities disapprove of the legislature overall and on education. (page 17)
Many Californians are unaware that California is below average in per pupil spending compared to other states. Half say that California’s student test scores are lower than those in other states, and indeed California ranks near the bottom. (page 18)
Majorities of Californians across regions and demographic groups are very concerned about the shortage of good teachers in lower-income areas. To a lesser degree, Californians are also very concerned about the state’s English learners scoring lower than others on standardized tests. (page 19)
Similar to past years, half of Californians give positive grades of “A” or “B” to the quality of their local public schools. Still, only 17 percent say “A” and 63 percent say state funding for their local public schools is not enough. (page 20)
Eight in 10 public school parents say their child’s public school has been affected by state budget cuts (36% a lot, 45% somewhat). But levels of concern about teacher layoffs at their child’s school vary considerably across income levels and between Latino and white parents. (page 21)
43
2732
43
0
20
40
60
80
Job overall K–12 public education
Per
cent
all
adul
ts
Approve
Disapprove
Approval Ratings of Governor Brown
4946
49 51 49 49 49 49
44
31 3236 35 37 36 36
0
20
40
60
80
Apr05
Apr06
Apr07
Apr08
Apr09
Apr10
Apr11
Apr12
Per
cent
all
adul
ts
Student test scores
Per pupil spending
Percentages Saying California Ranks Below Average Compared to Other States
73
54
43
0
20
40
60
80
100
Under$40,000
$40,000to $80,000
$80,000or more
Per
cent
pub
lic s
choo
l par
ents
Percent Very Concerned about Teacher Layoffs at Child's Public School, by Income Level

PPIC Statewide Survey
April 2012 Californians and Education 17
APPROVAL RATINGS OF STATE ELECTED OFFICIALS
As Governor Brown attempts to collect signatures and build support for a tax initiative on the November ballot, 43 percent of adults and 47 percent of likely voters approve of his overall job performance. Approval among both groups is similar to last month (40% adults, 46% likely voters) and to last April (40% adults, 46% likely voters). Two in three Democrats (65%) approve, while nearly six in 10 Republicans (58%) disapprove. Independents are more likely to approve (45%) than disapprove (32%). Approval is highest in the San Francisco Bay Area (55%) and lowest in the Other Southern California region (33%).
When it comes to Governor Brown’s handling of K–12 education, 27 percent of adults and 23 percent of likely voters approve of his job performance. His approval on this issue was similar last year (24% adults, 25% likely voters). Approval is low across parties (36% Democrats, 10% Republicans, and 21% independents). Fewer than one in three across regions and across age, education, and income groups approve of his handling of K–12 education. Latinos (36%) are more approving than Asians (27%) or whites (21%), and three in 10 public school parents (31%) approve of the governor’s handling of K–12 education.
“Overall, do you approve or disapprove of the way that Jerry Brown is handling…?”
All Adults Party Likely
Voters Dem Rep Ind
His job as governor of California
Approve 43% 65% 24% 45% 47%
Disapprove 32 20 58 32 40
Don't know 25 15 18 23 12
The state's kindergarten through 12th grade public education system
Approve 27 36 10 21 23
Disapprove 43 38 61 47 54
Don't know 30 26 29 32 23
Twenty-five percent of adults and 15 percent of likely voters approve of the way that the California Legislature is handling its job. Approval among adults is similar to March (25%) and to last April (21%).
On the issue of the state’s K–12 education system, 22 percent of adults and 10 percent of likely voters approve of the California Legislature. Approval of the legislature’s handling of K–12 education was similar last April (18% adults, 9% likely voters). At most, one in four across parties and regions approve. Latinos (43%) are far more likely than Asians (16%) or whites (9%) to approve of the legislature on K–12 education.
“Overall, do you approve or disapprove of the way that the California Legislature is handling…?”
All Adults Party Likely
Voters Dem Rep Ind
Its job
Approve 25% 26% 11% 21% 15%
Disapprove 58 56 80 66 73
Don't know 16 18 10 12 12
The state's kindergarten through 12th grade public education system
Approve 22 17 8 14 10
Disapprove 56 59 69 64 69
Don't know 22 24 23 21 21

PPIC Statewide Survey
April 2012 Californians and Education 18
PERCEPTIONS OF CALIFORNIA’S RELATIVE EDUCATION RANKINGS
Thirty-six percent of Californians think that the state’s per pupil spending for K–12 public education is below average compared to other states, while one in four say the state’s spending is average and 27 percent say it is near the top or above average. According to the National Education Association’s Rankings and Estimates report (December 2011), California ranked below average—37th among the 50 states and the District of Columbia—in per pupil spending in the 2010–11 school year. Californians’ views on per pupil spending have been similar since 2008; more Californians said it was below average in April 1998 (47%) and February 2000 (51%). Democrats (42%) are more likely than independents (35%) and Republicans (31%) to say spending is below average. Across racial/ethnic groups, the belief that per pupil spending is below average is most widely held among whites (38%), followed by Latinos (33%) and Asians (27%). Fewer than four in 10 adults across regions think per pupil spending is below average (38% Los Angeles, 38% San Francisco Bay Area, 36% Central Valley, and 31% Other Southern California region). Among public school parents, 43 percent say state spending is below average, as do 41 percent of those who consider the state budget situation to be a big problem for K–12 education.
“Where do you think California currently ranks in per pupil spending for K–12 public schools? Compared to other states, is California's spending near the top, above average, average,
below average, or near the bottom?”
All Adults
Race/Ethnicity Public School Parents Asians Latinos Whites
Near the top/Above average 27% 26% 23% 29% 20%
Average 25 31 32 20 27
Below average/Near the bottom 36 27 33 38 43
Don’t know 12 17 12 12 10
More Californians know how the state actually ranks in student test scores. Half of Californians (49%) say scores are below average compared to other states, while 31 percent say they are average and 12 percent say they are near the top or above average. According to 2011 test scores compiled by the U.S. Department of Education’s National Center for Education Statistics, California ranked near the bottom in both math and reading scores for fourth- and eighth-graders. Californians’ perceptions of student test scores have been fairly similar since we first asked this question in 1998. Across parties, at least half of voters think test scores are below average (51% Democrats, 55% independents, 59% Republicans). Across regions, about half of residents think test scores are below average. Whites (59%) are much more likely than Latinos (40%) and Asians (35%) to say scores are below average.
One in four Californians (24%), likely voters (27%), and public school parents (24%) correctly state that both per pupil spending and test scores in California are below average compared to other states.
“Where do you think California currently ranks in student test scores for K–12 public schools? Compared to other states, are California's student test scores near the top, above average, average, below average,
or near the bottom?”
All Adults
Race/Ethnicity Public School Parents Asians Latinos Whites
Near the top/Above average 12% 17% 13% 10% 10%
Average 31 39 41 24 39
Below average/Near the bottom 49 35 40 59 42
Don’t know 8 8 6 8 8

PPIC Statewide Survey
April 2012 Californians and Education 19
TEACHER SHORTAGE AND ENGLISH LANGUAGE LEARNERS
Most Californians (87%) are concerned (64% very, 23% somewhat) that schools in lower-income areas have a shortage of good teachers compared to schools in wealthier areas. Only 12 percent say they are not concerned (8% not too, 4% not at all). Six in 10 public school parents (60%) and likely voters (62%) say they are very concerned. The percentage saying very concerned was similar in April 2011 (65%) and April 2010 (60%), and lower in earlier years (54% in 2008 and 2007, 57% in 2006).
About seven in 10 Democrats (71%) and independents (67%) say they are very concerned about this issue, while less than half of Republicans (48%) say so. Majorities across income groups are very concerned; those earning under $40,000 (67%) and $40,000 to under $80,000 (68%) are more likely to be very concerned than those with incomes of $80,000 or more (58%). Among racial/ethnic groups, Latinos (73%) are most likely to say they are very concerned, compared to 61 percent of Asians and 56 percent of whites. Renters (71%) are more likely than homeowners (59%) to express concern. At least six in 10 across regions, age groups, and education levels say they are very concerned that schools in lower-income areas have a shortage of good teachers compared to schools in wealthier areas.
“How concerned are you that schools in lower-income areas have a shortage of good teachers compared to schools in wealthier areas?”
All Adults
Household Income Public School Parents Under $40,000 $40,000 to
under $80,000 $80,000 or more
Very concerned 64% 67% 68% 58% 60%
Somewhat concerned 23 22 20 28 28
Not too concerned 8 7 8 8 7
Not at all concerned 4 3 4 5 3
Don’t know 1 1 1 1 1
When asked about English language learners scoring lower on standardized tests compared to other students, 56 percent of Californians say they are very concerned and 27 percent say they are somewhat concerned. Only 16 percent are not concerned about this issue. Concern among public school parents (56% very, 27% somewhat) and likely voters (53% very, 25% somewhat) is similar to that among all adults. Latinos (64%) are more likely than Asians (55%) and whites (50%) to be very concerned. About six in 10 of those earning less than $80,000 say they are very concerned, compared to 48 percent of those earning $80,000 or more. The percentage saying they are very concerned is similar across parties. But 25 percent of Republicans say they are not too or not at all concerned, compared to 19 percent of independents and 12 percent of Democrats. The share saying they are very concerned today was the same last year (56%) but much lower in earlier years (42% in 2008, 44% in 2007, 43% in 2006).
“How concerned are you that English language learners in California’s schools today score lower on standardized tests than other students?”
All Adults
Race/Ethnicity Public School Parents Asians Latinos Whites
Very concerned 56% 55% 64% 50% 56%
Somewhat concerned 27 34 28 26 27
Not too concerned 9 4 4 13 6
Not at all concerned 7 5 3 9 8
Don’t know 2 2 1 2 2

PPIC Statewide Survey
April 2012 Californians and Education 20
RATING LOCAL PUBLIC SCHOOLS
Most Californians continue to give positive ratings to their local public schools. Half of Californians (52%) give their local public schools a grade of A (17%) or B (35%). Twenty-seven percent give a grade of C, 12 percent a D, and 4 percent an F. Similar shares of adults nationwide gave A’s (14%) or B’s (37%) to their local public schools in a June 2011 Phi Delta Kappa/Gallup poll. At least half of Californians have given an A or B grade for the quality of their local public schools each year since April 2005.
Public school parents are slightly more positive, with 24 percent giving a grade of A compared to 17 percent of all adults. Across regions, at least 49 percent give high grades to local public schools, with residents in the Other Southern California region (59%) giving more positive ratings than others. Among racial/ethnic groups, Asians (63%) are more likely than Latinos (53%) and whites (51%) to give a grade of A or B to their local public schools. Among those saying the quality of K–12 education in California’s public schools is a big problem, 42 percent give their local public schools a grade of A or B.
“Overall, how would you rate the quality of public schools in your neighborhood today? If you had to give your local public schools a grade, would it be A, B, C, D, or F?”
All Adults
Region Public School Parents Central Valley San Francisco
Bay Area Los Angeles Other Southern
California
A 17% 15% 21% 16% 17% 24%
B 35 35 29 33 42 36
C 27 31 29 28 23 23
D 12 9 11 15 10 10
F 4 5 4 3 2 4
Don’t know 5 3 6 4 6 3
Solid majorities of Californians (63%) and California’s public school parents (66%) think that the current level of state funding for their local public schools is not enough. One in four adults say state funding is just enough (26%) and only 7 percent say it is more than enough. Fifty-nine percent of likely voters say that state funding is not enough. The share of adults saying state funding is inadequate is slightly higher today than it was last April (56%), and similar to April 2010 (62%). About half of Californians held this view from 2005 to 2009. Across regions, San Francisco Bay Area residents (67%) are the most likely, and those in the Other Southern California region (59%) the least likely, to say state funding for their local public schools is inadequate. At least six in 10 across racial/ethnic groups say funding is inadequate, with Latinos (67%) most likely to express this view. Across parties, seven in 10 Democrats (71%) say funding is not enough, compared to fewer independents (55%) and Republicans (48%). Renters (69%) are more likely than homeowners (59%) to say state funding is inadequate. Among those giving grades of A or B to their local public schools, 56 percent say funding is not enough.
“Do you think the current level of state funding for your local public schools is more than enough, just enough, or not enough?”
All Adults
Region Public School Parents Central Valley San Francisco
Bay Area Los Angeles Other Southern
California
More than enough 7% 6% 7% 6% 9% 5%
Just enough 26 24 22 30 29 26
Not enough 63 64 67 62 59 66
Don’t know 4 5 4 2 4 4

PPIC Statewide Survey
April 2012 Californians and Education 21
PARENTS’ PERSPECTIVES
The vast majority of parents of public school students report that their child’s public school has been affected a lot (36%) or somewhat (45%) by recent state budget cuts. Just 16 percent say their child’s school has not been affected and 3 percent are unsure if there has been an effect. Public school parents likely to vote express similar views (39% a lot, 47% somewhat). The share saying their child’s school has been affected a lot was similar last year (35%), slightly higher in 2010 (43%), and lowest in 2009 (28%).
Similar shares of Latino (37% a lot, 46% somewhat) and white public school parents (35% a lot, 47% somewhat) say their child’s school has been affected by recent state budget cuts. (The sample size for Asian public school parents is not large enough for separate analysis.) More than one in three parents across income groups say their child’s public school has been affected a lot by state budget cuts. Parents with a college degree (35%) and those without one (37%) are similarly likely to say their child’s school has been affected a lot. Women (42%) are more likely than men (30%) to express this view.
“Would you say your child’s public school has or has not been affected by recent state budget cuts? (if it has: Has it been affected a lot or somewhat?)”
Public school parents only
All Public School Parents
Household Income Race/Ethnicity
Under $40,000
$40,000 to under $80,000
$80,000 or more
Latinos Whites
A lot 36% 37% 42% 34% 37% 35%
Somewhat 45 49 44 43 46 47
Not affected 16 10 13 20 14 16
Don’t know 3 3 – 3 3 3
Teacher layoffs have been discussed as an effect of further cuts to state funding for K–12 education. When asked about concern over teacher layoffs in their child’s public school, nearly all public school parents (87%) express concern. Fifty-eight percent say they are very concerned and 29 percent are somewhat concerned; only 13 percent say they are not too or not at all concerned.
Differences emerge between parents in various demographic groups. Sixty-two percent of public school parents who did not complete college say they are very concerned about teacher layoffs, compared to 44 percent of parents with a college degree. Among racial/ethnic groups, Latino public school parents (65%) are much more likely than white parents (47%) to say they are very concerned. Public school parents earning less than $40,000 (73%) are much more likely than middle-income parents (54%)—and far more likely than upper-income parents (43%)—to say they are very concerned. Public school parents who are under 45 years old (62%) are more likely than older parents (50%) to say they are very concerned about teacher layoffs at their child’s public school.
“How concerned are you about teacher layoffs at your child’s public school— very concerned, somewhat concerned, not too concerned, or not at all concerned?”
Public school parents only
All Public School Parents
Education Race/Ethnicity
Not a College Graduate
College Graduate Latinos Whites
Very concerned 58% 62% 44% 65% 47%
Somewhat concerned 29 26 36 29 31
Not too concerned 8 8 10 4 13
Not at all concerned 5 4 10 2 9

April 2012 Californians and Education 22
REGIONAL MAP

April 2012 Californians and Education 23
METHODOLOGY
The PPIC Statewide Survey is directed by Mark Baldassare, president and CEO and survey director at the Public Policy Institute of California, with assistance from Sonja Petek, project manager for this survey, and survey research associates Dean Bonner and Jui Shrestha. This survey on Californians and Education is supported with funding from The Dirk and Charlene Kabcenell Foundation, the Stuart Foundation, and The Silver Giving Foundation. We benefit from discussions with PPIC staff, foundation staff, and other policy experts, but the methods, questions, and content of this report were determined solely by Mark Baldassare and the survey staff.
Findings in this report are based on a survey of 2,005 California adult residents, including 1,603 interviewed on landline telephones and 402 interviewed on cell phones. Interviews took an average of 18 minutes to complete. Interviewing took place on weekday nights and weekend days from April 3 to 10, 2012.
Landline interviews were conducted using a computer-generated random sample of telephone numbers that ensured that both listed and unlisted numbers were called. All landline telephone exchanges in California were eligible for selection, and the sample telephone numbers were called as many as six times to increase the likelihood of reaching eligible households. Once a household was reached, an adult respondent (age 18 or older) was randomly chosen for interviewing using the “last birthday method” to avoid biases in age and gender.
Cell phones were included in this survey to account for the growing number of Californians who use them. These interviews were conducted using a computer-generated random sample of cell phone numbers. All cell phone numbers with California area codes were eligible for selection, and the sample telephone numbers were called as many as eight times to increase the likelihood of reaching an eligible respondent. Once a cell phone user was reached, it was verified that this person was age 18 or older, a resident of California, and in a safe place to continue the survey (e.g., not driving).
Cell phone respondents were offered a small reimbursement to help defray the cost of the call. Cell phone interviews were conducted with adults who have cell phone service only and with those who have both cell phone and landline service in the household.
Live landline and cell phone interviews were conducted by Abt SRBI, Inc. in English and Spanish according to respondents’ preferences. Accent on Languages, Inc. translated the survey into Spanish, with assistance from Renatta DeFever.
With assistance from Abt SRBI, we used recent data from the U.S. Census Bureau’s 2007–2009 American Community Survey (ACS) through the University of Minnesota’s Integrated Public Use Microdata Series for California to compare certain demographic characteristics of the survey sample—region, age, gender, race/ethnicity, and education—with the characteristics of California’s adult population. The survey sample was closely comparable to the ACS figures. Abt SRBI used data from the 2008 National Health Interview Survey and data from the 2007–2009 ACS for California both to estimate landline and cell phone service in California and to compare the data against landline and cell phone service reported in this survey. We also used voter registration data from the California Secretary of State to compare the party registration of registered voters in our sample to party registration statewide. The landline and cell phone samples were then integrated using a frame integration weight, while sample balancing adjusted for any differences across regional, age, gender, race/ethnicity, education, telephone service, and party registration groups.
PPIC Statewide Survey
April 2012 Californians and Education 24
The sampling error, taking design effects from weighting into consideration, is ±3.4 percent at the 95 percent confidence level for the total sample of 2,005 adults. This means that 95 times out of 100, the results will be within 3.4 percentage points of what they would be if all adults in California were interviewed. The sampling error for subgroups is larger: For the 1,310 registered voters, it is ±3.7 percent; for the 823 likely voters, it is ±4.3 percent; for the 620 public school parents, it is ±6.2 percent. Sampling error is only one type of error to which surveys are subject. Results may also be affected by factors such as question wording, question order, and survey timing.
We present results for four geographic regions, accounting for approximately 90 percent of the state population. “Central Valley” includes Butte, Colusa, El Dorado, Fresno, Glenn, Kern, Kings, Madera, Merced, Placer, Sacramento, San Joaquin, Shasta, Stanislaus, Sutter, Tehama, Tulare, Yolo, and Yuba Counties. “San Francisco Bay Area” includes Alameda, Contra Costa, Marin, Napa, San Francisco, San Mateo, Santa Clara, Solano, and Sonoma Counties. “Los Angeles” refers to Los Angeles County, and “Other Southern California” includes Orange, Riverside, San Bernardino, and San Diego Counties. Residents from other geographic areas are included in the results reported for all adults, registered voters, and likely voters; but sample sizes for these less populated areas are not large enough to report separately.
We present specific results for non-Hispanic whites and for Latinos, who account for about a third of the state’s adult population, constitute one of the fastest-growing voter groups, and whose children comprise about half of California’s public school students. We also present results for non-Hispanic Asians, who make up about 14 percent of the state’s adult population. Results for other racial/ethnic groups—such as non-Hispanic blacks and Native Americans—are included in the results reported for all adults, registered voters, and likely voters; but sample sizes are not large enough for separate analysis. We compare the opinions of those who report they are registered Democrats, registered Republicans, and decline-to-state or independent voters; the results for those who say they are registered to vote in another party are not large enough for separate analysis. We also analyze the responses of likely voters—so designated by their responses to voter registration survey questions, previous election participation, intentions to vote in the June primary, and current interest in politics.
The percentages presented in the report tables and in the questionnaire may not add to 100 due to rounding.
We compare current PPIC Statewide Survey results to those in our earlier surveys and to those in a national survey by Phi Delta Kappa/Gallup. Additional details about our methodology can be found at http://www.ppic.org/content/other/SurveyMethodology.pdf and are available upon request through [email protected].

April 2012 Californians and Education 25
QUESTIONNAIRE AND RESULTS
CALIFORNIANS AND EDUCATION
April 3–10, 2012 2,005 California Adult Residents: English, Spanish
MARGIN OF ERROR ±3.4% AT 95% CONFIDENCE LEVEL FOR TOTAL SAMPLE PERCENTAGES MAY NOT ADD TO 100 DUE TO ROUNDING
1. First, overall, do you approve or disapprove of the way that Jerry Brown is handling his job as governor of California?
43% approve 32 disapprove 25 don’t know
2. Do you approve or disapprove of the way that Governor Brown is handling the state's kindergarten through 12th grade public education system?
27% approve 43 disapprove 30 don’t know
3. Overall, do you approve or disapprove of the way that the California Legislature is handling its job?
25% approve 58 disapprove 16 don’t know
4. Do you approve or disapprove of the way that the California Legislature is handling the state's kindergarten through 12th grade public education system?
22% approve 56 disapprove 22 don’t know
[questions 5–10 reported for likely voters only]
5. [likely voters only] Next, some of the largest areas for state spending are: [rotate] (1) K–12 public education, (2) higher education, (3) health and human services, [and] (4) prisons and corrections. Thinking about these four areas of state spending, I’d like you to name the one you most want to protect from spending cuts.
58% K–12 public education 17 higher education 15 health and human services 7 prisons and corrections 4 don’t know
6. [likely voters only] Do you think the state budget situation in California—that is, the balance between government spending and revenues—is a big problem, somewhat of a problem, or not a problem for the people of California today?
80% big problem 16 somewhat of a problem 2 not a problem 1 don’t know
7. [likely voters only] Would you say that your local government services—such as those provided by city and county governments and public schools—have or have not been affected by recent state budget cuts? (if they
have: Have they been affected a lot or somewhat?)
64% affected a lot 26 affected somewhat 6 not affected 5 don’t know

PPIC Statewide Survey
April 2012 Californians and Education 26
8. [likely voters only] As you may know, the state government currently has an annual general fund budget of around $85 billion and faces a multibillion dollar gap between spending and revenues. How would you prefer to deal with the state's budget gap—mostly through spending cuts, mostly through tax increases, through a mix of spending cuts and tax increases, or do you think that it is okay for the state to borrow money and run a budget deficit?
36% mostly through spending cuts 12 mostly through tax increases 46 through a mix of spending cuts
and tax increases 2 okay to borrow money and run
a budget deficit 2 other (specify)
2 don’t know
9. [likely voters only] Governor Brown and others have proposed a tax initiative for the November ballot titled the “Temporary Taxes to Fund Education. Guaranteed Local Public Safety Funding. Initiative Constitutional Amendment.” It increases the personal income tax on annual earnings over $250,000 for seven years and increases the sales and use tax by a quarter cent for four years. It allocates temporary tax revenues, 89 percent to K–12 schools, and 11 percent to community colleges. It guarantees funding for public safety services realigned from state to local governments. Increased state revenues of about $5.4 to $9 billion annually would be available to pay for the state’s school and community college funding requirements, as increased by this measure, and to address the state’s budgetary problem by paying for other spending commitments. If the election were held today, would you vote yes or no on the proposed tax initiative?
54% yes 39 no 6 don’t know
10. [likely voters only] If voters reject the proposed tax initiative on the November ballot, Governor Brown’s budget proposes that automatic spending cuts be made to K–12 public schools. Do you favor or oppose these automatic spending cuts to K–12 public schools?
19% favor 78 oppose 3 don’t know
Next,
[rotate questions 11 and 12]
11. How much of a problem is the quality of education in California’s K–12 public schools today? Is it a big problem, somewhat of a problem, or not much of a problem?
58% big problem 29 somewhat of a problem 9 not much of a problem 4 don’t know
12. How much of a problem is the overall state budget situation for California’s K–12 public schools today? Is it a big problem, somewhat of a problem, or not much of a problem?
65% big problem 25 somewhat of a problem 6 not much of a problem 4 don’t know
13. To significantly improve the quality of California’s K–12 public schools, which of the following statements do you agree with the most? [rotate responses 1 and 2] (1) We need to use existing state funds more wisely, [or] (2) We need to increase the amount of state funding, [or] (3) We need to use existing state funds more wisely and increase the amount of state funding.
44% use funds more wisely 9 increase state funding 44 use funds more wisely and increase
funding 3 don’t know

PPIC Statewide Survey
April 2012 Californians and Education 27
There are a number of ways for the state’s K–12 public schools to cut spending to deal with decreased state and local funding. For each of the following, please tell me if you are very concerned, somewhat concerned, not too concerned, or not at all concerned.
[rotate questions 14 and 15]
14. How about laying off teachers as a way to deal with decreased funding?
66% very concerned 25 somewhat concerned 5 not too concerned 3 not at all concerned 1 don’t know
15. How about having fewer days of school instruction as a way to deal with decreased funding?
54% very concerned 31 somewhat concerned 9 not too concerned 5 not at all concerned 1 don’t know
Changing topics,
[rotate questions 16 and 17]
16. How concerned are you that schools in lower-income areas have a shortage of good teachers compared to schools in wealthier areas? Are you very concerned, somewhat concerned, not too concerned, or not at all concerned about this issue?
64% very concerned 23 somewhat concerned 8 not too concerned 4 not at all concerned 1 don’t know
17. How concerned are you that English language learners in California’s schools today score lower on standardized tests than other students? Are you very concerned, somewhat concerned, not too concerned, or not at all concerned about this issue?
56% very concerned 27 somewhat concerned 9 not too concerned 7 not at all concerned 2 don’t know
On another topic,
[rotate questions 18 and 19]
18. Where do you think California currently ranks in per pupil spending for K–12 public schools? Compared to other states, is California's spending near the top, above average, average, below average, or near the bottom?
13% near the top 14 above average 25 average 20 below average 16 near the bottom 12 don’t know
19. Where do you think California currently ranks in student test scores for K–12 public schools? Compared to other states, are California's student test scores near the top, above average, average, below average, or near the bottom?
2% near the top 10 above average 31 average 30 below average 19 near the bottom 8 don’t know

PPIC Statewide Survey
April 2012 Californians and Education 28
20. Next, overall, how would you rate the quality of public schools in your neighborhood today? If you had to give your local public schools a grade, would it be A, B, C, D, or F?
17% A 35 B 27 C 12 D 4 F 5 don’t know
21. Do you think the current level of state funding for your local public schools is more than enough, just enough, or not enough?
7% more than enough 26 just enough 63 not enough 4 don’t know
[rotate questions 22 and 23]
22. If your local school district had a bond measure on the ballot to pay for school construction projects, would you vote yes or no?
62% yes 32 no 6 don’t know
23. What if there was a measure on your local ballot to increase local parcel taxes to provide more funds for the local public schools? Would you vote yes or no?
60% yes 34 no 6 don’t know
24. Who do you think should have the most control in deciding how the money from state government is spent in local public schools—[rotate order] (1) the local schools, (2) the local school districts, [or] (3) the state government?
34% the local schools 48 the local school districts 14 the state government 2 other (specify) 2 don’t know
25. As you may know, some of the funding the state provides to K–12 public school districts is earmarked for specific programs and goals. Would you favor or oppose giving local school districts more flexibility over how state funding is spent?
79% favor 15 oppose 6 don’t know
26. If the state were to give local school districts more flexibility over how state funding is spent, how confident are you that local school districts would use this money wisely? Are you very confident, somewhat confident, not too confident, or not at all confident?
14% very confident 54 somewhat confident 22 not too confident 9 not at all confident 1 don’t know
27. Changing topics, do you think that school districts in lower-income areas of the state have the same amount of resources—including good teachers and classroom materials—as school districts in wealthier areas, or not?
13% yes, same amount of resources 82 no, not same amount of resources 6 don’t know
[rotate blocks: questions 28, 29 and
questions 30, 31]
[rotate questions 28 and 29]
28. If new state funding becomes available, do you think school districts that have more low-income students should or should not get more of this new funding than other school districts?
68% should 27 should not 5 don’t know

PPIC Statewide Survey
April 2012 Californians and Education 29
29. If new state funding becomes available, do you think school districts that have more English language learners should or should not get more of this new funding than other school districts?
52% should 41 should not 7 don’t know
[rotate questions 30 and 31]
30. If it means less funding for other school districts, do you think school districts that have more low-income students should or should not get more funding from the state?
67% should 28 should not 5 don’t know
31. If it means less funding for other school districts, do you think school districts that have more English language learners should or should not get more funding from the state?
51% should 42 should not 7 don’t know
[questions 32–34 reported for likely voters only]
Next, here are some ideas that have been suggested to raise state revenues to provide additional funding for K–12 public education. For each of the following, please say if you favor or oppose the proposal.
[rotate questions 32 to 34]
32. How about raising state personal income taxes to provide additional funding for K–12 public education?
40% favor 57 oppose 3 don’t know
33. How about raising the state sales tax to provide additional funding for K–12 public education?
46% favor 52 oppose 2 don’t know
34. How about raising the top rate of the state income tax paid by the wealthiest Californians to provide additional funding for K–12 public education?
65% favor 34 oppose 1 don’t know
35. Next, some people are registered to vote and others are not. Are you absolutely certain that you are registered to vote in California?
67% yes [ask q35a] 33 no [skip to q36b]
35a.Are you registered as a Democrat, a Republican, another party, or are you registered as a decline-to-state or independent voter?
45% Democrat [ask q36] 31 Republican [skip to q36a] 3 another party (specify) [skip to q37]
21 independent [skip to q36b]
36. Would you call yourself a strong Democrat or not a very strong Democrat?
54% strong 43 not very strong 3 don’t know
[skip to question 37]
36a.Would you call yourself a strong Republican or not a very strong Republican?
51% strong 45 not very strong 3 don’t know
[skip to question 37]
36b.Do you think of yourself as closer to the Republican Party or Democratic Party?
22% Republican Party 50 Democratic Party 20 neither (volunteered)
8 don’t know

PPIC Statewide Survey
April 2012 Californians and Education 30
37. How closely are you following news about candidates for the 2012 presidential election—very closely, fairly closely, not too closely, or not at all closely?
26% very closely 37 fairly closely 24 not too closely 13 not at all closely – don’t know
38. Would you consider yourself to be politically:
[read list, rotate order top to bottom]
10% very liberal 20 somewhat liberal 32 middle-of-the-road 21 somewhat conservative 13 very conservative 3 don’t know
39. Generally speaking, how much interest would you say you have in politics—a great deal, a fair amount, only a little, or none?
22% great deal 38 fair amount 31 only a little 8 none 1 don’t know
[D1–D4a: demographic questions]
D4b. [public school parents only] Would you say your child’s public school has or has not been affected by recent state budget cuts? (if it has: Has it been affected a lot or somewhat?)
36% affected a lot 45 affected somewhat 16 not affected 3 don’t know
D4c. [public school parents only] How concerned are you about teacher layoffs at your child’s public school—very concerned, somewhat concerned, not too concerned, or not at all concerned?
58% very concerned 29 somewhat concerned 8 not too concerned 5 not at all concerned – don’t know
[D5–D17: demographic questions]

PPIC STATEWIDE SURVEY ADVISORY COMMITTEE
Ruben Barrales President and CEO San Diego Regional Chamber of Commerce
Angela Blackwell Founder and CEO PolicyLink
Paul Brest President The William and Flora Hewlett Foundation
Mollyann Brodie Senior Vice President Kaiser Family Foundation
Bruce E. Cain Executive Director University of California Washington Center
James E. Canales President The James Irvine Foundation
Jon Cohen Director of Polling The Washington Post
Russell Hancock President and CEO Joint Venture Silicon Valley Network
Sherry Bebitch Jeffe Senior Scholar School of Policy, Planning, and Development University of Southern California
Robert Lapsley President California Business Roundtable
Carol S. Larson President and CEO The David and Lucile Packard Foundation
Monica Lozano Publisher and CEO La Opinión
Donna Lucas Chief Executive Officer Lucas Public Affairs
Lisa Pitney Vice President, Government Relations The Walt Disney Company
Dan Rosenheim News Director KPIX-TV
Robert K. Ross, M.D. President and CEO The California Endowment
Most Reverend Jaime Soto Bishop of Sacramento Roman Catholic Diocese of Sacramento
Cathy Taylor Vice President and Editorial Commentary Director Orange County Register
Raymond L. Watson Vice Chairman of the Board Emeritus The Irvine Company
Carol Whiteside President Emeritus Great Valley Center
The PPIC Statewide Survey Advisory Committee is a diverse group of experts who provide advice on survey issues.
However, survey methods, questions, content, and timing are determined solely by PPIC.

PPIC BOARD OF DIRECTORS
Gary K. Hart, Chair Former State Senator and Secretary of Education State of California
Mark Baldassare President and CEO Public Policy Institute of California
Ruben Barrales President and CEO San Diego Regional Chamber of Commerce
María Blanco Vice President, Civic Engagement California Community Foundation
Brigitte Bren Chief Executive Officer International Strategic Planning, Inc.
Robert M. Hertzberg Partner Mayer Brown, LLP
Walter B. Hewlett Chair, Board of Directors William and Flora Hewlett Foundation
Donna Lucas Chief Executive Officer Lucas Public Affairs
David Mas Masumoto Author and Farmer
Steven A. Merksamer Senior Partner Nielsen, Merksamer, Parrinello, Gross & Leoni, LLP
Kim Polese Chairman ClearStreet, Inc.
Thomas C. Sutton Retired Chairman and CEO Pacific Life Insurance Company

The Public Policy Institute of California is dedicated to informing and improving public policy in California through independent, objective, nonpartisan research on major economic, social, and political issues. The institute’s goal is to raise public awareness and to give elected representatives and other decisionmakers a more informed basis for developing policies and programs.
The institute’s research focuses on the underlying forces shaping California’s future, cutting across a wide range of public policy concerns, including economic development, education, environment and resources, governance, population, public finance, and social and health policy.
PPIC is a private operating foundation. It does not take or support positions on any ballot measures or on any local, state, or federal legislation, nor does it endorse, support, or oppose any political parties or candidates for public office. PPIC was established in 1994 with an endowment from William R. Hewlett.
Mark Baldassare is President and CEO of PPIC. Gary K. Hart is Chair of the Board of Directors.
Short sections of text, not to exceed three paragraphs, may be quoted without written permission provided that full attribution is given to the source and the copyright notice below is included. Copyright © 2012 Public Policy Institute of California All rights reserved. San Francisco, CA PUBLIC POLICY INSTITUTE OF CALIFORNIA 500 Washington Street, Suite 600 San Francisco, California 94111 phone: 415.291.4400 fax: 415.291.4401
PPIC SACRAMENTO CENTER Senator Office Building 1121 L Street, Suite 801 Sacramento, California 95814 phone: 916.440.1120 fax: 916.440.1121
www.ppic.org [email protected]