Embed Size (px)
Citation preview
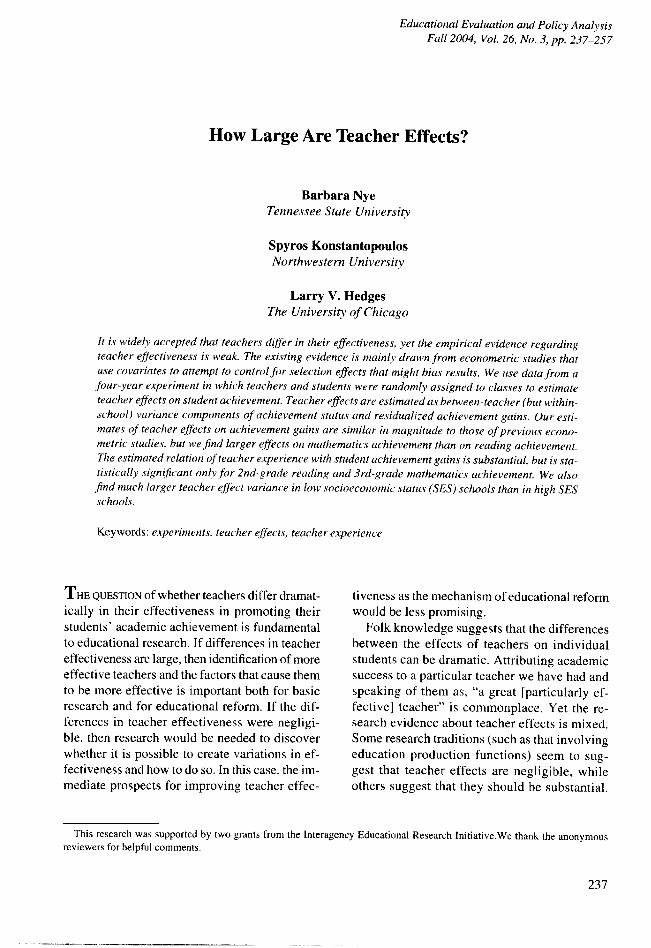
Educational Evaluation and Policy AnalysisFall 2004, Vol. 26, No. 3, pp. 237-257
How Large Are Teacher Effects?
Barbara NyeTennessee State University
Spyros KonstantopoulosNorthwestern University
Larry V. HedgesThe University of Chicago
It is widelv accepted that teachers differ in their effectiveness, yet the empirical evidence regardingteacher effectiveness is weak. The existing evidence is mainly drawn from econometric studies thatuse covariates to attempt to controlfbr selec tion effects that might bias results. We use data from afour-year experiment in which teachers and students were randomly assigned to classes to estimateteacher effects on student achievement. Teacher effects are estimated as between-teacher (but within-school) variance components of achievement status and residualized achievement gains. Our esti-mates of teacher effects on achievement gains are similar in magnitude to those of'previous econo-metric studies, but we find larger effects on mathematics achievement than on reading achievement.The estimated relation of teacher experience with student achievement gains is substantial, but is sta-tistically significant only,for 2nd-grade reading and 3rd-grade mathematics achievement. We also,find much larger teacher effect variance in low socioeconomic status (SES) schools than in high SESschools.
Keywords: experiments, teacher effects, teacher experience
THE QUESTION of whether teachers differ dramat-ically in their effectiveness in promoting theirstudents' academic achievement is fundamentalto educational research. If differences in teachereffectiveness are large, then identification of moreeffective teachers and the factors that cause themto be more effective is important both for basicresearch and for educational reform. If the dif-ferences in teacher effectiveness were negligi-ble, then research would be needed to discoverwhether it is possible to create variations in ef-fectiveness and how to do so. In this case, the im-mediate prospects for improving teacher effec-
tiveness as the mechanism of educational reformwould be less promising.
Folk knowledge suggests that the differencesbetween the effects of teachers on individualstudents can be dramatic. Attributing academicsuccess to a particular teacher we have had andspeaking of them as, "a great [particularly ef-fective] teacher" is commonplace. Yet the re-search evidence about teacher effects is mixed.Somne research traditions (such as that involvingeducation production functions) seem to sug-gest that teacher effects are negligible, whileothers suggest that they should be substantial.
This research was supported by two grants from the Interagency Educational Research Initiative.We thank the anonymousreviewers for helpful comments.
237
Nve, Konstantopoulos, and Hedges
However these traditions of research have seri-ous limitations.
In this article we briefly summarize some keyresults from two major traditions of research onteacher effects and indicate some of their limita-tions. We then report some new experimentalevidence, which is not subject to the same short-comings as previous research.
Education Production Function Studies
Education production function studies attemptto determine the relation of specific measuredteacher or school characteristics (such as teacherexperience, teacher education, class size, per pupilexpenditures, etc.) with student achievement.However, because parents choose neighborhoodsin which to live (and their associated schools) ac-cording to tastes and resources (Tiebout, 1956),student and family backgrounds are confoundedwith naturally occurring school resource charac-teristics. Education production function studies(e.g., Coleman, et al., 1966), attempt to statisti-cally control for this confounding by using studentand family background characteristics as covari-ates. A particularly important covariate is priorachievement, because it can be seen as summariz-ing the effects of individual background (includ-ing prior educational experiences) and familybackground up to that time. However, even thiscovariate may leave important characteristics ofthe student unmeasured.
Students within schools are often placed intoclasses or assigned to teachers based on studentcharacteristics (such as achievement), and teach-ers are not randomly assigned to classes either.While this may not create an analytic problemfor estimating relations at the level of the schoolas a unit of analysis, it creates problems when in-ferring the relation between characteristics ofteachers and student achievement. For examplesuppose that more experienced teachers are as-signed to classes composed of higher achievingstudents (e.g., as a privilege of seniority) or lowerachieving students (e.g., as compensatory strat-egy of assigning human capital). In either case,the causal direction in the relation between teacherexperience and student achievement is not thatteacher experience causes achievement but thereverse. This ambiguity of causal direction is amajor problem for production function studiesof the effects of teacher characteristics on studentachievement.
238
In part because of these problems, there is somecontroversy about the interpretation of the find-ings of research on education production func-tions. For example, the Coleman report (Coleman,et al., 1966) demonstrated that a large propor-tion of the variance in student achievement wasexplained by student background factors andthat relatively little additional variance was ex-plained by school characteristics. This findingwas widely, and incorrectly, interpreted as indi-cating that schools and teachers made little dif-ference in student achievement.
One influential reviewer of the production func-tion literature finds little reason to believe thatmeasured teacher characteristics such as educa-tional preparation, experience, or salary are relatedto student achievement (Hanushek, 1986). Othersargue that the studies that have been conductedsuggest positive effects of some of the resourcecharacteristics such as teacher experience andteacher education (Greenwald, Hedges, & Laine,1996). But most reviewers of this literature agreethat it is difficult to interpret the relation school orteacher characteristics and achievement, even aftercontrolling for student background, because theymay be confounded with the influences of unob-served individual, family, school, and neighbor-hood factors.
It is important to recognize that failure to findthat some set of measured teacher characteristicsare related to student achievement does not meanthat all teachers have the same effectiveness inpromoting achievement. It is possible that thewrong characteristics were measured (character-istics that were convenient, but unrelated toachievement) but other (as yet unmeasured) char-acteristics would be related to achievement. Evenif researchers attempted to measure the rightteacher characteristics, it is possible that the mea-surement is so poor that the relation was attenu-ated to the point of being negligible.
Studies of the Variation in Teacher Effects
Another analytic strategy that leads to evidenceabout teacher effects does not attempt to estimatethe relation between specific measured character-istics of teachers, but examines the variation be-tween classrooms in achievement controlling forstudent background. Such analyses usually useprior achievement as a covariate so they can beinterpreted as measuring the variance in (residu-alized) student achievement gain across class-
rooms. The interpretation of these variances isthat they represent the variation in achievementgain due to differences in teacher effectiveness.Such analyses assume that between-classroomvariation is caused by teacher variation in effec-tiveness. Consistent with the studies in this tradi-tion we operationalize teacher effects as between-classroom variance in achievement. Typicallythese studies calculate two regression analyses.One is a regression of student achievement onstudent background characteristics (includingprior achievement), yielding a multiple correla-tion R,. The second regression is of studentachievement on the same background variablesbut also includes a set of teacher-specific dummyvariables as predictors, yielding a multiple corre-lation R2. The regression coefficients for theteacher-specific dummy variables indicate the
How Large Are Teacher Effects?
"effects" of teachers and the difference betweenthe two regressions in variance accounted for (thechange in R2 value or AR2 = R2
2- R,2) represents
the proportion of variance in (residualized) stu-dent achievement gain accounted for by teachereffects. The advantage of this design is that it doesnot require the researcher to identify in advance,and measure adequately, the aspects of teacherbehavior or other teacher characteristics that arerelated to achievement. Of course this design can-not identify the specific characteristics that are re-sponsible for teacher effectiveness.
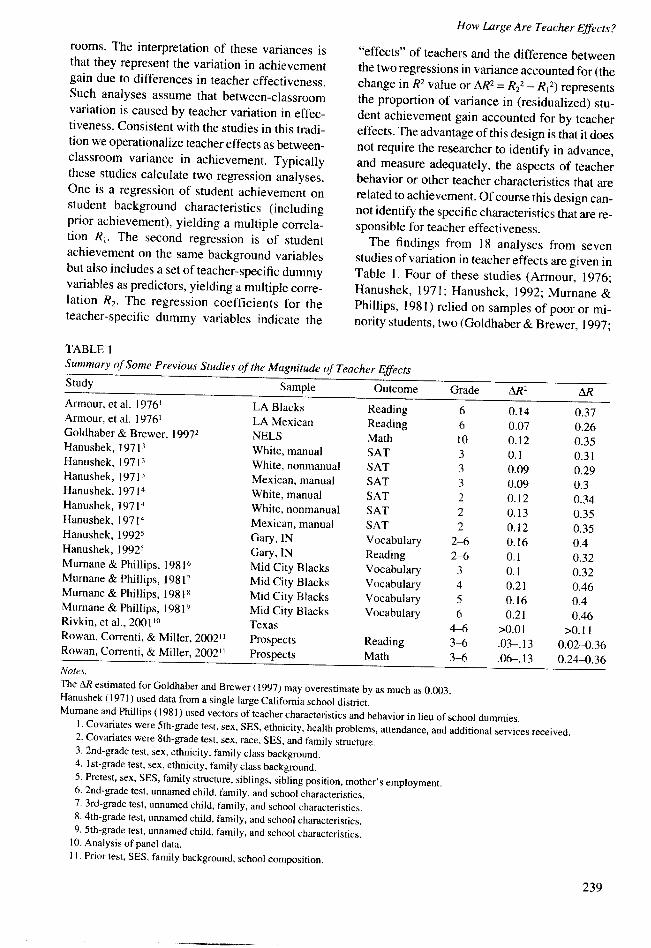
The findings from 18 analyses from sevenstudies of variation in teacher effects are given inTable 1. Four of these studies (Armour, 1976;Hanushek, 1971; Hanushek, 1992; Murnane &Phillips, 1981) relied on samples of poor or mi-nority students, two (Goldhaber & Brewer, 1997;
TABLE ISummary of Some Previous Studies of the Magnitude of Teacher EffectsStudy Sample Outcome Grade AR2 ARArmour, et al. 1976' LA Blacks Reading 6 0.14 0.37Armour, et al. 19761 LA Mexican Reading 6 0.07 0.26Goldhaber & Brewer, 19972 NELS Math 10 0.12 0.35Hanushek, 19713 White, manual SAT 3 0.1 0.31Hanushek, 19713 White, nonmanual SAT 3 0.09 0.29Hanushek, 19713 Mexican, manual SAT 3 0.09 0.3Hanushek, 19714 White, manual SAT 2 0.12 0.34Hanushek, 19714 White, nonmanual SAT 2 0.13 0.35Hanushek, 19714 Mexican, manual SAT 2 0.12 0.35Hanushek, 19925 Gary. IN Vocabulary 2-6 0.16 0.4Hanushek, 19925 Gary, IN Reading 2-6 0.1 0.32Murnane & Phillips, 19816 Mid City Blacks Vocabulary 3 0.1 0.32Murnane & Phillips, 19817 Mid City Blacks Vocabulary 4 0.21 0.46Murnane & Phillips, 198 1' Mid City Blacks Vocabulary 5 0.16 0.4Murnane & Phillips, 19819 Mid City Blacks Vocabulary 6 0.21 0.46Rivkin,etal., 2001'° Texas 4-6 >0.01 >0.11Rowan, Correnti, & Miller, 2002" Prospects Reading 3-6 .03-.13 0.02-0.36Rowan, Correnti, & Miller, 20021" Prospects Math 3-6 .06-.13 0.24-0.36
Notes.
The AR estimated for Goldhaber and Brewer ( 997) may overestimate bv as much as 0.003.Hanushek (1971) used data from a single large Califomia school district.Mumane and Phillips (1981) used vectors of teacher characteristics and behavior in lieu of school dummies.
I. Covariates were 5th-grade test, sex, SES, ethnicity, health problems, attendance, and additional services received.2. Covariates were 8th-grade test, sex, race, SES, and family structure.3. 2nd-grade test, sex, ethnicity, family class background.4. 1 st-grade test, sex, ethnicity, family class background.5. Pretest, sex, SES, family structure, siblings, sibling position, mother's employment.6. 2nd-grade test, unnamed child, family, and school characteristics.7. 3rd-grade test, unnamed child, family, and school characteristics.8. 4th-grade test, unnamed child, family. and school characteristics.9. 5th-grade test, unnamed child, family, and school characteristics.
10. Analysis of panel data.I . Prior test, SES, family background, school composition.
239
Nye, Konstantopoulos, and Hedges
Rowan, Correnti, & Miller, 2002) used nation-
ally representative samples of students, and one
(Rivkin, Hanushek, & Kaine, 2001) used a large
sample of public school students in Texas.
Some characteristics of the studies and the AR2
values for 17 of the analyses range from 0.07 to
0.21, suggesting that from 7% to 21% of the
variance in achievement gains is associated with
variation in teacher effectiveness. The 18th analy-
sis (Rivkin, et al., 2001) generated a somewhat
smaller estimate, but used a slightly different
technique than the other studies and the figure
given was designed to yield a lower bound on
the magnitude of teacher effects. Although the
study by Rowan, Correnti, and Miller is included
here, they estimated the variance accounted for
by teachers directly using a hierarchical linear
model analysis.If we regard the AR2 as the variance accounted
for by a perfectly measured index of teacher ef-
fectiveness, then the square root of AR2, namely
AR, can be loosely interpreted as a standardized
regression coefficient of student achievementon teacher effectiveness. The AR values for each
analysis are given in the last column. By most
standards, these effects are not negligible. Typi-
cal values, such as AR2= 0.10 correspond to
AR = 0.32, which says that a one standard devia-
tion increase in teacher effectiveness should in-
crease student achievement gains by about a one
third of a standard deviation. By way of compar-
ison, the effect of one year in small classes on
residualized gains estimated from the Ten-
nessee class size experiment is about 0.1 (Nye,
Hedges, & Konstantopoulos, 2001).Unfortunately, this design is also subject to
some of the same limitations as other production
function studies. First, valid interpretation of its
results requires that the covariates adequately
control for preexisting differences (including un-
observable differences that are related to achieve-
ment growth) among students assigned to differ-
ent classrooms. Second, valid interpretation also
requires that teachers are not assigned to class-
rooms on the basis of student characteristics(which may be known to the school but unavail-
able for use as covariates in the statistical analy-
sis) to exaggerate or attenuate differences be-
tween classrooms in achievement gains. For
example, schools might assign a particularly ef-
fective teacher to students believed to be entering
a difficult period as a compensatory resource allo-
240
cation strategy. Alternatively schools might assign
a particularly effective teacher to students believed
to have promise for unusually large achievementgains as a reward for accomplishment or a merito-cratic resource allocation strategy.
Schools may have many sources of informa-
tion suitable for identifying students poised for
unusually large gains or losses. They include es-
sentially everything known about the child be-
yond test scores and easily recorded factors suchas socioeconomic status (SES), gender, and fam-
ily structure. For example, an impeding divorce,
change of residence, delinquency problems, prob-
lems with siblings, unemployment of parents, or
adjustment problems in school may all signal po-
tential difficulties in the next school year. Alter-
natively, improvements in student motivation,
compliance, adjustment, or parental involvementmay all signal unusually good prospects for the
next school year.
Evidence from a Randomized Experiment
The problems in interpretation of both de-
signs discussed above would be eliminated if a
study were available that randomly assigned both
students and teachers to classes. Random as-
signment of students would assure that all ob-
servable and unobservable differences between
students in different classes would be no larger
than would be expected by chance. Random as-
signment of teachers to classes would assure
that any differences in teacher skill are uncorre-
lated with classroom achievement (although this
potential problem would also be substantiallymitigated by the fact that randomization of stu-
dents assured that there would be no large dif-
ferences of student achievement across class-
rooms.) Fortunately such a study exists: The
Tennessee Class Size Experiment.
The Tennessee Class Size Experiment
The Tennessee Class Size Experiment or Proj-
ect STAR (Student-Teacher Achievement Ratio)
is discussed in detail elsewhere (see, e.g., Nye,
Hedges, & Konstantopoulos, 2000). The experi-
ment involved students in 79 elementary schools
in 42 school districts in Tennessee. Within each
school, Kindergarten students were randomly as-
signed to classrooms in one of three treatment
conditions: small classes (with 13 to 17 students),larger classes (with 22 to 26 students) or larger
classes with a full-time classroom aide. Teachers
were also randomly assigned to classes of differ-ent types. These assignments of students to classtype were maintained through the third grade.Some students entered the study in the first gradeand subsequent grades, but were randomly as-signed to classes at that time. Teachers at each sub-sequent grade level were randomly assigned toclasses as the experimental cohort passed throughtheir grade. Districts had to agree to participatefor four years, allow site visitations for verifica-tion of class sizes, interviewing, and data collec-tion, including extra student testing. They alsohad to allow the research staff to randomly assignpupils and teachers to class types and to maintainthe assignment of students to class types fromKindergarten through grade 3.
Since the classes within each school are ini-tially equivalent (due to random assignment),any systematic differences in achievement amongclasses must be due to one of two sources: thetreatment or differences in teacher effectiveness.Thus within a school, any systematic variance inachievement between classrooms that had thesame treatment must be due to variations in teachereffectiveness. Because there are only a few class-rooms in each school, it is necessary pool evi-dence of between-classroom within-school dif-ferences across schools to obtain reasonablemeasurement precision.
Validity of the Experiment
In the STAR experiment, as in all longitudinallarge field studies, the fidelity of implementationwas somewhat compromised by three factors.First, there was some overlap between the actualsizes of the classes assigned to be large and theactual class sizes of those assigned to be small.Second, there was a small amount of switchingof students among class types in Kindergartenand later grades. Third, there was student attritionbetween Kindergarten and grade 3. Researchersinvestigated these threats to the validity of theexperiment and concluded that they did not af-fect the outcome of the experiment (see Krueger,1999; Nye, Hedges, & Konstantopoulos, 2000).
To assure the validity of the experiment, it isalso crucial that random assignment effectivelyeliminated preexisting differences between stu-dents and teachers assigned to different class-rooms. We argue that the fact that the random-ization of students and teachers to classes wascarried out by the consortium of researchers who
How Large Are Teacher Effects?
carried out the experiment, and not by schoolpersonnel, enhances its credibility. However itwould be desirable to check whether there wereany differences on pre-existing characteristics ofteachers or students among the assigned groups.Such analyses cannot of course prove that thegroups did not differ on variables that were notmeasured, they can only make such differencesless plausible by confirming that differences werenot observed on the variables that were mea-sured. We report on some analyses carried out tocheck the effectiveness of randomization in thenext section.
Was the randomization effective?To check the randomization of students to
class assignment, it would be desirable to com-pare pretest score on student achievement acrossclasses (but within-schools). Unfortunately, nopretest scores were collected. There are however,three student variables that should not havechanged as a consequence of assignment: SES(measured as eligibility for free or reduced pricelunch), ethnicity (measured as Black, Hispanic,or Asian versus White), and age. Because we arechecking an assignment process that occurredwithin-schools, it is important to carry out thesecomparisons controlling for school.
Krueger (1999) examined the effectiveness ofthe randomization into treatment groups (smallsized classes, regular sized classes, and regularsized classes with a full time aide). He found thatacross three variables (SES, minority group sta-tus, and age), there were no significant differencesbetween treatment types. Krueger also found thatthere were no significant differences across treat-ment types on the teacher characteristics of race,experience, and education (and we replicated hisresults). However, it is still possible that eventhough there are no differences between class-rooms across treatment types, there might be dif-ferences between classrooms that were assignedto the same treatment types within schools. Be-cause teacher effects in our analyses are esti-mated using differences between classroom themean achievement of classes receiving the sametreatment type, it is desirable to check for equalityacross classrooms within treatment types withinschools.
To test the hypothesis that the mean age wasthe same for every classroom within each treat-ment group within every school, we regressed
241
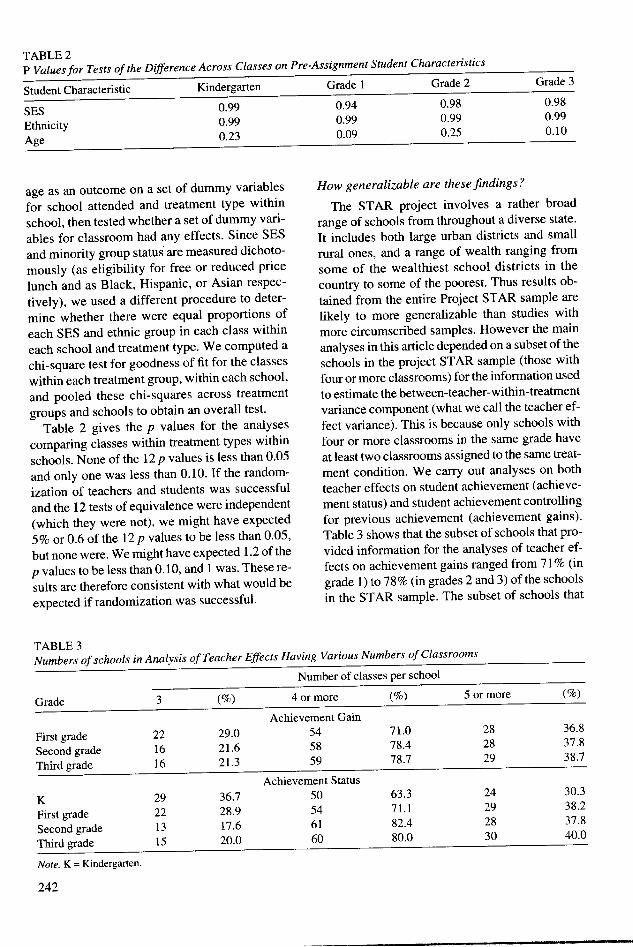
TABLE 2P Values for Tests of the Difference Across Classes on Pre-Assignment Student Characteristics
Student Characteristic Kindergarten Grade I Grade 2 Grade 3
SES 0.99 0.94 0.98 0.98
Ethnicity 0.99 0.99 0.99 0.99
Age 0.23 0.09 0.25 0.10
age as an outcome on a set of dummy variables
for school attended and treatment type within
school, then tested whether a set of dummy vari-
ables for classroom had any effects. Since SES
and minority group status are measured dichoto-
mously (as eligibility for free or reduced price
lunch and as Black, Hispanic, or Asian respec-
tively), we used a different procedure to deter-
mine whether there were equal proportions of
each SES and ethnic group in each class within
each school and treatment type. We computed a
chi-square test for goodness of fit for the classes
within each treatment group, within each school,
and pooled these chi-squares across treatment
groups and schools to obtain an overall test.
Table 2 gives the p values for the analyses
comparing classes within treatment types within
schools. None of the 12 p values is less than 0.05
and only one was less than 0.10. If the random-
ization of teachers and students was successful
and the 12 tests of equivalence were independent(which they were not), we might have expected
5% or 0.6 of the 12 p values to be less than 0.05,
but none were. We might have expected 1.2 of the
p values to be less than 0.10, and 1 was. These re-
sults are therefore consistent with what would be
expected if randomization was successful.
How generalizable are thesefindings?
The STAR project involves a rather broad
range of schools from throughout a diverse state.
It includes both large urban districts and small
rural ones, and a range of wealth ranging from
some of the wealthiest school districts in the
country to some of the poorest. Thus results ob-
tained from the entire Project STAR sample are
likely to more generalizable than studies with
more circumscribed samples. However the main
analyses in this article depended on a subset of the
schools in the project STAR sample (those with
four or more classrooms) for the information used
to estimate the between-teacher-within-treatmentvariance component (what we call the teacher ef-
fect variance). This is because only schools with
four or more classrooms in the same grade have
at least two classrooms assigned to the same treat-
ment condition. We carry out analyses on both
teacher effects on student achievement (achieve-
ment status) and student achievement controlling
for previous achievement (achievement gains).
Table 3 shows that the subset of schools that pro-
vided information for the analyses of teacher ef-
fects on achievement gains ranged from 71% (in
grade 1) to 78% (in grades 2 and 3) of the schools
in the STAR sample. The subset of schools that
TABLE 3Numbers of schools in Analysis of Teacher Effects Having Various Numbers of Classrooms
Number of classes per school
Grade 3 (%) 4 or more (%) 5 or more (%)
Achievement Gain
First grade 22 29.0 54 71.0 28 36.8
Second grade 16 21.6 58 78.4 28 37.8
Third grade 16 21.3 59 78.7 29 38.7
Achievement Status
K 29 36.7 50 63.3 24 30.3
First grade 22 28.9 54 71.1 29 38.2
Second grade 13 17.6 61 82.4 28 37.8
Third grade 15 20.0 60 80.0 30 40.0
Note. K = Kindergarten.
242
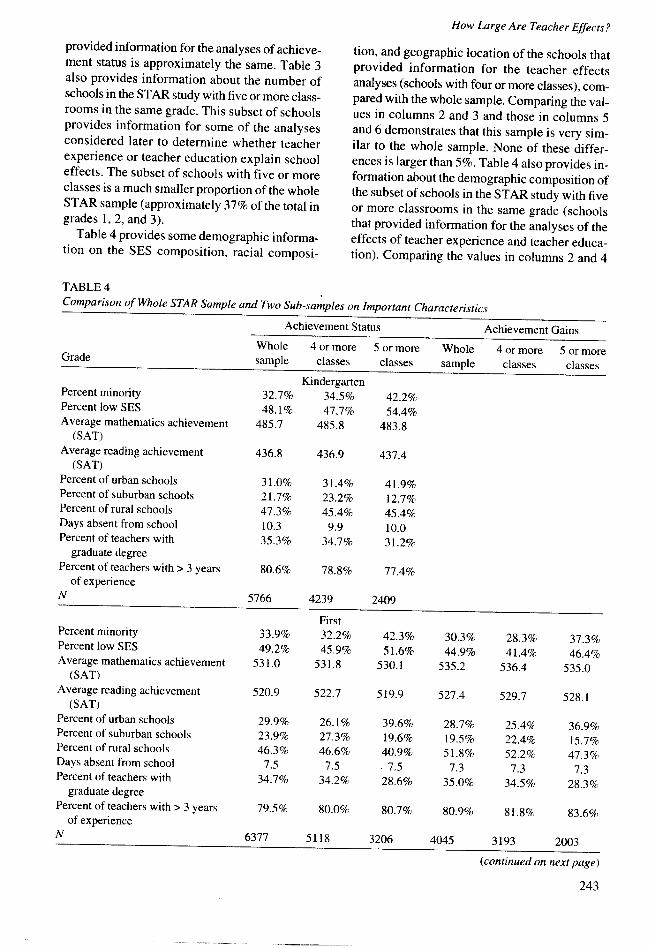
provided information for the analyses of achieve-ment status is approximately the same. Table 3also provides information about the number ofschools in the STAR study with five or more class-rooms in the same grade. This subset of schoolsprovides information for some of the analysesconsidered later to determine whether teacherexperience or teacher education explain schooleffects. The subset of schools with five or moreclasses is a much smaller proportion of the wholeSTAR sample (approximately 37% of the total ingrades 1, 2, and 3).
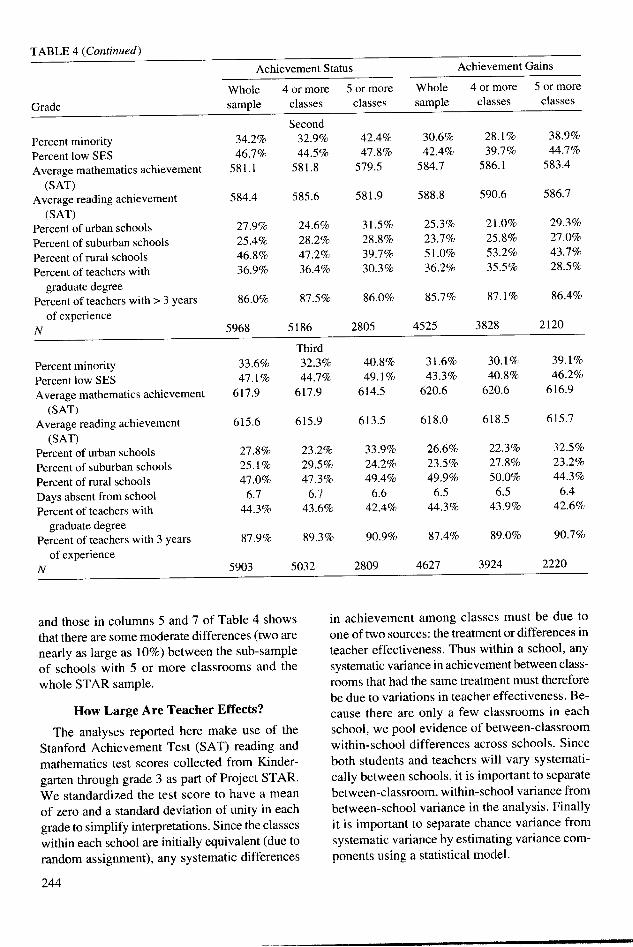
Table 4 provides some demographic informa-tion on the SES composition, racial composi-
How Large Are Teacher Effects?
tion, and geographic location of the schools thatprovided information for the teacher effectsanalyses (schools with four or more classes), com-pared with the whole sample. Comparing the val-ues in columns 2 and 3 and those in columns 5and 6 demonstrates that this sample is very sim-ilar to the whole sample. None of these differ-ences is larger than 5%. Table 4 also provides in-formation about the demographic composition ofthe subset of schools in the STAR study with fiveor more classrooms in the same grade (schoolsthat provided information for the analyses of theeffects of teacher experience and teacher educa-tion). Comparing the values in columns 2 and 4
TABLE 4Comparison of Whole STAR Sample and Two Sub-samples on Important Characteristics
Achievement Status Achievement GainsWhole 4 or more 5 or more Whole 4 or more 5 or moreGrade sample classes classes sample classes classes
KindergartenPercent minority 32.7'Percent low SES 48.1'Average mathematics achievement 485.7
(SAT)Average reading achievement 436.8
(SAT)Percent of urban schools 3 1.0XPercent of suburban schools 21.7'Percent of rural schools 47.3YDays absent from school 10.3Percent of teachers with 35.3c
graduate degreePercent of teachers with > 3 years 80.6f
of experience
ye 34.5% 42.2%%c 47.7% 54.4%
485.8 483.8
436.9 437.4
1% 31.4% 41.9%'% 23.2% 12.7%%o 45.4% 45.4%
9.9 10.0ro 34.7% 31.2%
% 78.8% 77.4%
N 5766 4239 2409
FirstPercent minorityPercent low SESAverage mathematics achievement
(SAT)Average reading achievement
(SAT)Percent of urban schoolsPercent of suburban schoolsPercent of rural schoolsDays absent from schoolPercent of teachers with
graduate degreePercent of teachers with > 3 years
of experience
33.9'49.2C
531.0
Yi 32.2% 42.3% 30.3% 28.3%% 45.9% 51.6% 44.9% 41.4%
531.8 530.1 535.2 536.4
37.3%46.4%
535.0
520.9 522.7 519.9 527.4 529.7 528.1
29.9% 26.1% 39.6% 28.7% 25.4% 36.9%23.9% 27.3% 19.6% 19.5% 22.4% 15.7%46.3% 46.6% 40.9% 51.8% 52.2% 47.3%
7.5 7.5 . 7.5 7.3 7.3 7.334.7% 34.2% 28.6% 35.0% 34.5% 28.3%
79.5% 80.0% 80.7% 80.9% 81.8% 83.6%
N 6377 5118 3206 4045 3193 2003
(continued on next page)
243
Achievement Status Achievement Gains
Whole 4 or more 5 or more Whole 4 or more 5 or more
Grade sample classes classes sample classes classes
Second
Percent minority 34.2% 32.9% 42.4% 30.6% 28.1% 38.9%
Percent low SES 46.7% 44.5% 47.8% 42.4% 39.7% 44.7%
&--- -thpmfticr ahievement 581.1 581.8 579.5 584.7 586.1 583.4
(SAT)Average reading achievement
(SAT)Percent of urban schoolsPercent of suburban schoolsPercent of rural schoolsPercent of teachers with
graduate degreePercent of teachers with > 3 years
of experienceN
584.4
27.9%25.4%46.8%36.9%
585.6 581.9 588.8 590.6 586.7
24.6%28.2%47.2%36.4%
31.5%28.8%39.7%30.3%
25.3%23.7%51.0%36.2%
21.0%25.8%53.2%35.5%
29.3%27.0%43.7%28.5%
86.0% 87.5% 86.0% 85.7% 87.1% 86.4%
5968 5186 2805 4525 3828 2120
Percent minorityPercent low SESAverage mathematics achievement
(SAT)Average reading achievement
(SAT)Percent of urban schoolsPercent of suburban schoolsPercent of rural schoolsDays absent from schoolPercent of teachers with
graduate degreePercent of teachers with 3 years
of experienceN
33.6%47.1%
617.9
615.6
27.8%25.1%47.0%
6.744.3%
Third32.3%44.7%
617.9
40.8%49.1%
614.5
31.6%43.3%
620.6
30.1%40.8%
620.6
39.1%46.2%
616.9
615.9 613.5 618.0 618.5 615.7
23.2%29.5%47.3%
6.743.6%
33.9%24.2%49.4%
6.642.4%
26.6%23.5%49.9%
6.544.3%
22.3%27.8%50.0%
6.543.9%
32.5%23.2%44.3%
6.442.6%
87.9% 89.3% 90.9% 87.4% 89.0% 90.7%
5903 5032 2809 4627 3924 2220
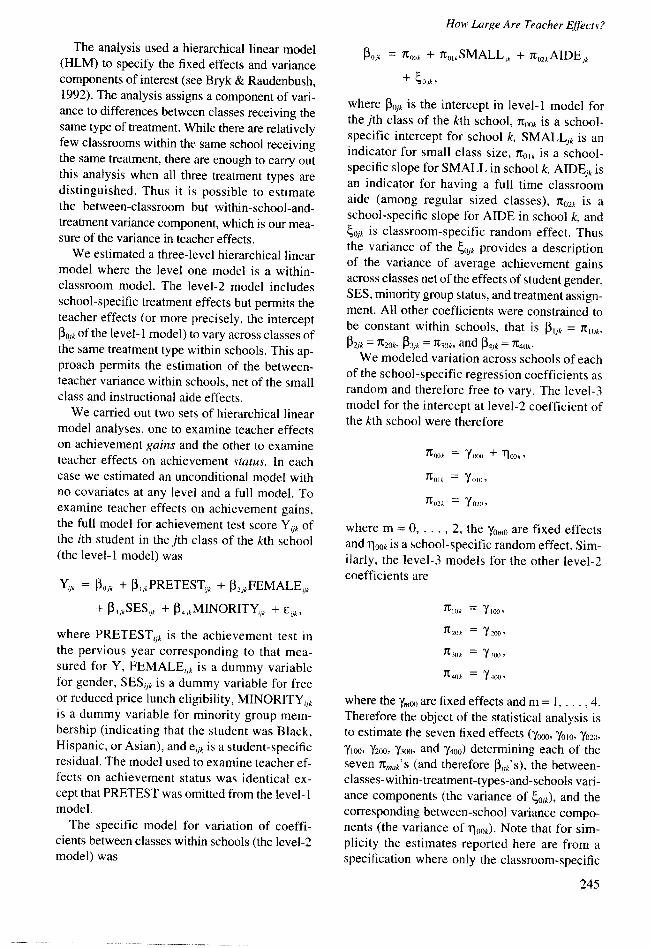
and those in columns 5 and 7 of Table 4 shows
that there are some moderate differences (two are
nearly as large as 10%) between the sub-sample
of schools with 5 or more classrooms and the
whole STAR sample.
How Large Are Teacher Effects?
The analyses reported here make use of the
Stanford Achievement Test (SAT) reading and
mathematics test scores collected from Kinder-
garten through grade 3 as part of Project STAR.
We standardized the test score to have a mean
of zero and a standard deviation of unity in each
grade to simplify interpretations. Since the classes
within each school are initially equivalent (due to
random assignment), any systematic differences
244
in achievement among classes must be due to
one of two sources: the treatment or differences in
teacher effectiveness. Thus within a school, any
systematic variance in achievement between class-
rooms that had the same treatment must therefore
be due to variations in teacher effectiveness. Be-
cause there are only a few classrooms in each
school, we pool evidence of between-classroom
within-school differences across schools. Since
both students and teachers will vary systemati-
cally between schools, it is important to separate
between-classroom, within-school variance from
between-school variance in the analysis. Finally
it is important to separate chance variance from
systematic variance by estimating variance com-
ponents using a statistical model.
TABLE 4 (Continued)
How Large Are Teacher Effects?
The analysis used a hierarchical linear model(HLM) to specify the fixed effects and variancecomponents of interest (see Bryk & Raudenbush,1992). The analysis assigns a component of vari-ance to differences between classes receiving thesame type of treatment. While there are relativelyfew classrooms within the same school receivingthe same treatment, there are enough to carry outthis analysis when all three treatment types aredistinguished. Thus it is possible to estimatethe between-classroom but within-school-and-treatment variance component, which is our mea-sure of the variance in teacher effects.
We estimated a three-level hierarchical linearmodel where the level one model is a within-classroom model. The level-2 model includesschool-specific treatment effects but permits theteacher effects (or more precisely, the interceptfo,k of the level- I model) to vary across classes ofthe same treatment type within schools. This ap-proach permits the estimation of the between-teacher variance within schools, net of the smallclass and instructional aide effects.
We carried out two sets of hierarchical linearmodel analyses, one to examine teacher effectson achievement gains and the other to examineteacher effects on achievement status. In eachcase we estimated an unconditional model withno covariates at any level and a full model. Toexamine teacher effects on achievement gains,the full model for achievement test score Yq4. ofthe ith student in the jth class of the kth school(the level- I model) was
Yiik = 1h + 3IIPRETEST,,/ + 32j,FEMALE,j,
+ P3,SES,]k + P4 jkMINORITYj, + Fjj,,
where PRETEST,Jk is the achievement test inthe pervious year corresponding to that mea-sured for Y, FEMALEi/k is a dummy variablefor gender, SES/k is a dummy variable for freeor reduced price lunch eligibility, MINORITYiJkis a dummy variable for minority group mem-bership (indicating that the student was Black,Hispanic, or Asian), and e,jk is a student-specificresidual. The model used to examine teacher ef-fects on achievement status was identical ex-cept that PRETEST was omitted from the level- Imodel.
The specific model for variation of coeffi-cients between classes within schools (the level-2model) was
Njk = 7OOk + lt(okSMALLik + 7tO2kAIDE,k
+ 4O, '
where Iojk is the intercept in level-I model forthe jth class of the kth school, tOOk is a school-specific intercept for school k, SMALLJk is anindicator for small class size, 1Olk is a school-specific slope for SMALL in school k, AIDEAk isan indicator for having a full time classroomaide (among regular sized classes), lt02k is aschool-specific slope for AIDE in school k, and4ojk is classroom-specific random effect. Thusthe variance of the 40jk provides a descriptionof the variance of average achievement gainsacross classes net of the effects of student gender,SES, minority group status, and treatment assign-ment. All other coefficients were constrained tobe constant within schools, that is 1 Ijk = ltIOk,
j2jk = 20k, 3Ijk = It///k, and P4jk - C40k-
We modeled variation across schools of eachof the school-specific regression coefficients asrandom and therefore free to vary. The level-3model for the intercept at level-2 coefficient ofthe kth school were therefore
7kOOk Yt7k, + Tlko,
-1k = 7oko,
CO'2k L Y020/,
where m = 0, . . ., 2, the yo,,o are fixed effectsand 1OOk is a school-specific random effect. Sim-ilarly, the level-3 models for the other level-2coefficients are
nIlk = YkOO,
ITU/Ok - 300'
7T40/k =Y40X)'
where the y,,( are fixed effects and m = 1, . 4.Therefore the object of the statistical analysis isto estimate the seven fixed effects (yooo, yOlo Y020,yloo, y2oo, yyx, and y4oo) determining each of theseven iT,Ak'S (and therefore P3yk's), the between-classes-within-treatment-types-and-schools vari-ance components (the variance of iOjk), and thecorresponding between-school variance compo-nents (the variance of TOOk). Note that for sim-plicity the estimates reported here are from aspecification where only the classroom-specific
245
Nye, Konstantopoulos, and Hedges
and school-specific intercepts were treated as ran-
dom at the second and third level respectively, butother analyses using additional random effectsled to quite similar results.
We conducted separate analyses for each of thetwo dependent variables, the SAT mathematics
and reading test scores, for each of the three (in
the case of teacher effects on achievement gains)or four (in the case of teacher effects on achieve-ment status) grade levels. Note that although wehad data on achievement status in Kindergarten,
there was no pretest available at that grade levelso no analysis of gains in Kindergarten was pos-sible. Therefore the analysis described here for
achievement gains was repeated six times and that
for achievement status was repeated eight times.
Results
The results of our variance component esti-mates from the hierarchical linear model analy-
ses are given in Table 5. Results for mathematicsachievement are given on the left and those for
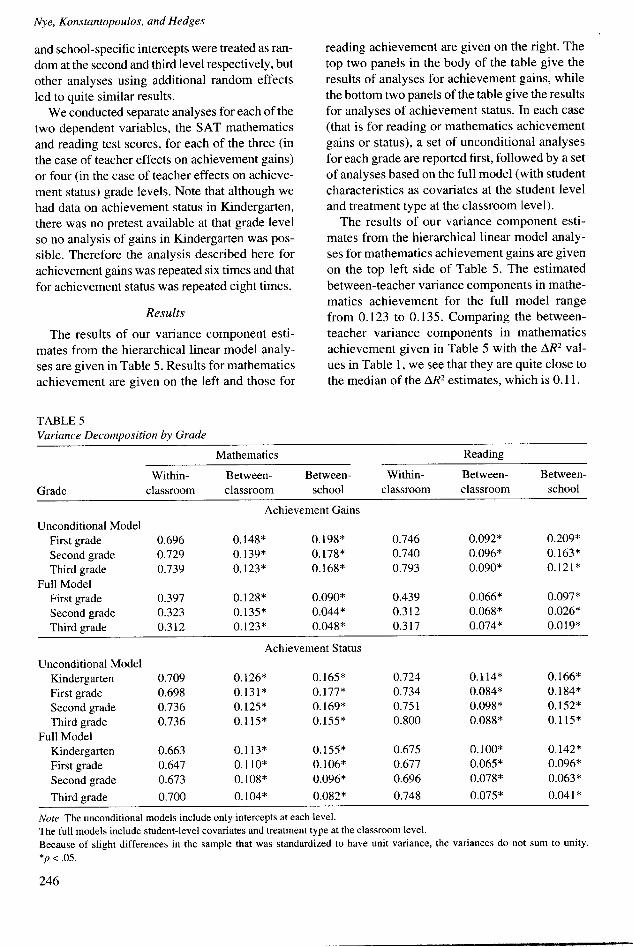
reading achievement are given on the right. Thetop two panels in the body of the table give theresults of analyses for achievement gains, whilethe bottom two panels of the table give the resultsfor analyses of achievement status. In each case(that is for reading or mathematics achievementgains or status), a set of unconditional analysesfor each grade are reported first, followed by a setof analyses based on the full model (with studentcharacteristics as covariates at the student leveland treatment type at the classroom level).
The results of our variance component esti-mates from the hierarchical linear model analy-ses for mathematics achievement gains are given
on the top left side of Table 5. The estimatedbetween-teacher variance components in mathe-matics achievement for the full model range
from 0.123 to 0.135. Comparing the between-teacher variance components in mathematicsachievement given in Table 5 with the AR2 val-ues in Table 1, we see that they are quite close tothe median of the AR2 estimates, which is 0.11.
TABLE 5Variance Decomposition by Grade
Mathematics Reading
Within- Between- Between- Within- Between- Between-
Grade classroom classroom school classroom classroom school
Achievement GainsUnconditional Model
First grade 0.696 0.148* 0.198* 0.746 0.092* 0.209*
Second grade 0.729 0.139* 0.178* 0.740 0.096* 0.163*Thirdgrade 0.739 0.123* 0.168* 0.793 0.090* 0.121*
Full ModelFirst grade 0.397 0.128* 0.090* 0.439 0.066* 0.097*
Second grade 0.323 0.135* 0.044* 0.312 0.068* 0.026*Third grade 0.312 0.123* 0.048* 0.317 0.074* 0.019*
Achievement StatusUnconditional Model
Kindergarten 0.709 0.126* 0.165* 0.724 0.114* 0.166*First grade 0.698 0.131* 0.177* 0.734 0.084* 0.184*Second grade 0.736 0.125* 0.169* 0.751 0.098* 0.152*Third grade 0.736 0.115* 0.155* 0.800 0.088* 0.115*
Full ModelKindergarten 0.663 0.113* 0.155* 0.675 0.100* 0.142*First grade 0.647 0.110* 0.106* 0.677 0.065* 0.096*Second grade 0.673 0.108* 0.096* 0.696 0.078* 0.063*
Third grade 0.700 0.104* 0.082* 0.748 0.075* 0.041*
Note. The unconditional models include only intercepts at each level.The full models include student-level covariates and treatment type at the classroom level.Because of slight differences in the sample that was standardized to have unit variance, the variances do not sum to unity.
*p< .05.
246
How Large Are Teacher Effects?
The results of our variance component esti-mates from the hierarchical linear model analy-ses for reading achievement gains are given onthe top right side of Table 5. The estimated be-tween-teacher variance components for the fullmodel in reading range from 0.066 to 0.074.Comparing the between-teacher variance com-ponents in reading given in Table 4 with the AR2
values in Table l, we see that they are within therange of previous estimates, but somewhatsmaller than the median. Thus the results of thisexperiment are consistent with previous non-experimental estimates of the magnitude of teachereffects on student achievement.
It is also worth noting that the variance due todifferences among teachers is substantial in com-parison to the variance between schools. In read-ing, the between teacher variance component isover twice as large as between-school variancecomponent at grade 2 and over three times aslarge at grade 3. In mathematics, the pattern issimilar. This suggests that naturally occurringteacher effects are typically larger than naturallyoccurring school effects. Thus (at least in thesedata), which teacher a student happens to getwithin a school matters more than which schoolthe student happens to attend. This finding isprovocative because it suggests that policies thatemphasize school choice fail to attend to teachereffects that may have a larger impact on studentachievement gains.
It is also interesting that across all grades, thevariance of the teacher effects in mathematics ismuch larger than that in reading. In fact, in gradesI to 3 the variance in mathematics is nearly twiceas large. This may be because mathematics ismostly learned in school and thus may be moredirectly influenced by teachers, or that there ismore variation in how (or how well or how much)teachers teach mathematics. Reading, on the otherhand, is more likely to be learned (in part) outsideof school and thus the influence of school andteacher on reading is smaller, or there is less vari-ation in how (or how well or how much) readingis taught in school.
We have also estimated the between-teacher-with-treatment-type variance components with-out controlling for pretest scores. This analysisestimates the variance of teacher effects onachievement status (not gains). The analysis ofteacher effects on achievement status is not di-rectly comparable to those on achievement gains.
However these analyses, reported in the bottomtwo panels of Table 5, show that teacher effectson achievement status are similar in magnitudeto teacher effects on achievement gains. How-ever, the between-school variance componentsfor achievement status are larger than between-school variance components for achievementgains. Thus when looking at achievement status,teacher effects are closer in magnitude to schooleffects than when looking at achievement gains.This indicates that for students with equal previ-ous achievement scores teacher effects are muchlarger than school effects.
Can Teacher Effects be Explainedby Variation in Actual Class Size?
Although the experiment had target class sizesof 13 to 17 for small classes and 22 to 26 forlarger classes, there was some variation in the ac-tual class sizes of the treatment groups and evena modest amount of overlap between the actualclass sizes of the treatment groups (see Nye,Hedges, & Konstantopoulos, 2000). Given thatthe experiment found effects of class size, it istherefore possible that some of the teacher effectsmight be due to variation in the actual class sizeswithin treatment groups.
One way to test this hypothesis is to controlfor actual class size in the level-2 model used indata analysis. This approach however has thedisadvantage that while target class is randomlyassigned, actual class size is not and may be a re-sult of non-random factors that may also be re-lated to outcome. That is, any relation betweenactual class size and achievement may not be acausal effect.
One way to overcome this problem is to use thetreatment assignment as an instrumental variablefor actual class size (see, e.g., Angrist, Imbens,& Rubin, 1996). Such an analysis yields esti-mates of the causal effects of actual class size,and therefore estimates of teacher effects aftercontrolling for actual class size. We carried outthis analysis by using treatment assignment topredict actual class sizes and then used that pre-dicted class size in the HLM analysis.
The teacher effect (between-teacher-within-school-and-treatment type) variance componentsfrom the instrumental variables analysis were es-sentially identical those obtained from the analy-ses reported in Table 5. None of the correspond-ing variance components differed by more than
247
Nye, Konstantopoulos, and Hedges
2%. Therefore it appears that variation in actual
class sizes cannot explain variance across teach-
ers in student achievement or achievement gains.In other words, variation in actual class sizeswithin treatment groups cannot explain teacher
effects in this experiment.
Can Teacher Effectsbe Explained by Variations
in Teacher Experience or Education?
We have established that teachers do differ in
effectiveness, but it would be useful to determinethe characteristics of teachers that are more or less
effective. Two of the characteristics that havebeen investigated in production function models
are teacher experience and teacher education.One way to test the hypothesis that teacher expe-
rience or teacher education is related to student
achievement is to control for teacher experienceor education, estimate the effect of teacher expe-rience, and determine whether the variance of
teacher effects decreases. Although it would have
been desirable to examine the joint effects of
these two variables, the sample of schools withsufficient numbers of teachers was insufficient to
do so. We did, however, examine each of these
two variables separately in a subsequent analysis.Teacher experience is often measured by the
number of years of service. We hypothesizedhowever that there would be a nonlinear effectof teacher experience, with teachers becomingmore skilled after the first few years of their ca-reer, which is consistent with empirical findings
of Murnane and Phillips (1981). Thus we codedteacher experience dichotomously. To deter-
mine whether variations in teacher experience
accounted for teacher effects, we introducedteacher experience in the level-2 model by re-
placing the level-2 model for the intercept by
POjk = ntOk + 7cO,kSMALLjk + ITo2 kAIDEjk
+ T.O3 kEXPERIENCE,k + 43jk'
where EXPERIENCE1k is a dummy variable tak-ing the value 0 for teachers with three years ofexperience or less and the value I for teacherswith more than three years of experience. Theexperience effect was constrained to be constantacross schools at level 3, so that lt03k = Y030, other-wise the level-3 model was the same as in the
previous analyses.We also hypothesized that teacher education
would also have nonlinear effects. Greenwald,Hedges, and Laine's (1996) review of productionfunction studies found stronger relations betweenteacher education and student achievement instudies that coded teacher education dichoto-mously as Master's degree or higher (or not). Todetermine whether variations in teacher educa-tion explained teacher effects, we introducedthe dummy variable TEACHER EDUCATION,(taking the value of I for teachers with graduate oradvanced degrees and 0 otherwise) into the level-2model exactly as we did for EXPERIENCE, andcarried out the same analysis.
Results
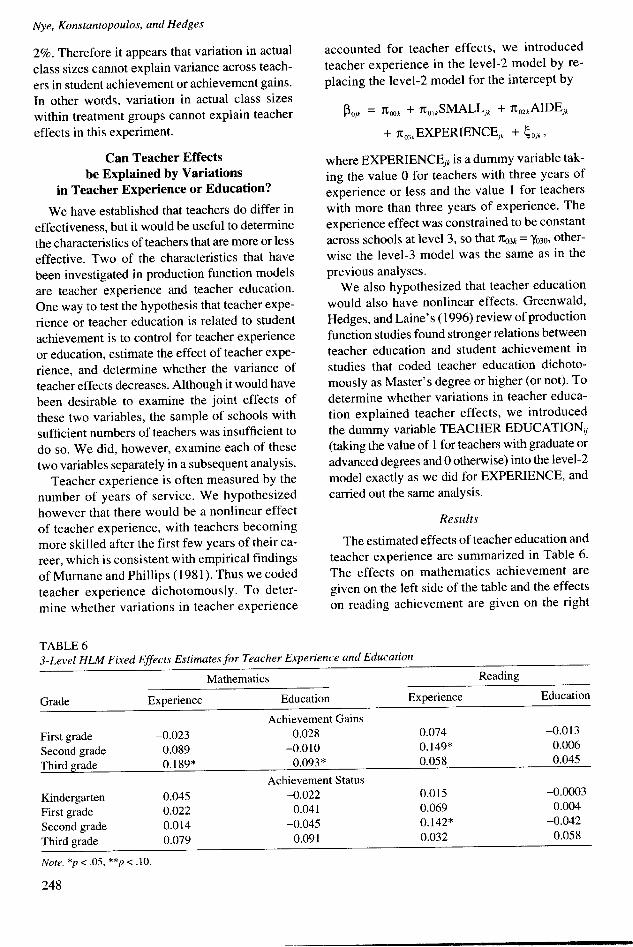
The estimated effects of teacher education andteacher experience are summarized in Table 6.The effects on mathematics achievement are
given on the left side of the table and the effectson reading achievement are given on the right
TABLE 63-Level HLM Fixed Effects Estimates for Teacher Experience and Education
Mathematics Reading
Grade Experience Education Experience Education
Achievement GainsFirst grade -0.023 0.028 0.074 -0.013
Second grade 0.089 -0.010 0. 149* 0.006
Third grade 0.189* 0.093* 0.058 0.045
Achievement StatusKindergarten 0.045 -0.022 0.015 -0.0003
First grade 0.022 0.041 0.069 0.004
Second grade 0.014 -0.045 0.142* -0.042
Third grade 0.079 0.091 0.032 0.058
Note. *p < .05, **p < .10.
248

How Large Are Teacher Effects?
side of the table, while effects on achievementgains are given in the top panel of the table andthe effects on achievement status are given in thebottom panel of the table. Neither teacher expe-rience, nor teacher education explained muchvariance in teacher effects (never more than 5%).The estimated effect of teacher experience onachievement gains was positive in every case ex-cept grade I mathematics achievement, where itwas negative, but near zero. The magnitudes ofthe estimated positive effects were not negligi-ble, ranging from 0.06 to 0.19 standard devia-tions or from about one-half to slightly less thantwo-times the small class effect on achievementgains found in previous analyses of these data(see Nye, Hedges, & Konstantopoulos, 2001).However, the effects of teacher experience onachievement gains were statistically significantonly for grade-2 reading and grade-3 mathemat-ics achievement.
The estimated effects of teacher education onachievement gains were generally smaller thanthose of teacher experience, and were negligi-ble in grades I and 2. The estimated effects ofteacher education at grade 3 were somewhatlarger (0.06 and 0.09 standard deviations in read-ing and mathematics, respectively), but were sta-tistically significant only for grade-3 mathemat-ics achievement gains.
The effects of teacher experience on achieve-ment status were generally smaller than the cor-responding effects on achievement gains, andwere statistically significant only for grade-2reading achievement and close to being statisti-cally significant for grade-3 mathematics. Noneof the effects of teacher education on achieve-ment status was statistically significant.
Do Teacher Effects Vary by School SES?
It is clear that teachers are not randomly allo-cated to schools. Research on teacher allocationto schools has documented that schools with highproportions of low income or minority studentsoften have difficulty recruiting and retaininghigh-quality teachers (Darling-Hammond, 1995).Two recent studies provide evidence that low-income students are more likely to be exposed toless effective teachers. Krei (1998) argued thatlow-income urban students are more likely to beexposed to less effective teachers than other stu-dents. Langford, Loeb, and Wyckoff (2002) alsoconcluded that low-achieving, minority, and low-
income students in urban settings attend schoolswith less competent teachers.
The origins and exact nature of the differencesin teacher quality between lower and higher in-come schools are unclear. However one plausi-ble mechanism that might result in lower incomeschools having teachers of lower average qualityis a "creaming" process. Suppose teacher qual-ity is imperfectly correlated with pre-servicecharacteristics, but is revealed (or developed)after individuals begin to work as teachers. Onceteacher quality becomes observable, higher in-come schools lure high quality teachers awayfrom lower income schools using incentives ofbetter pay or working conditions. If this weretrue, one would expect more consistent teachereffects (lower between-teacher variance) in higherincome schools. Teacher effects would be moreinconsistent (there would be larger between-teacher variance) in lower income schools sincelower income schools would experience influxand then loss of high quality teachers, while main-taining a cadre of low quality teachers. We ex-amine within school between classroom variancein achievement in low-and high-SES schools sep-arately to determine the variance of teacher ef-fectiveness in the upper and lower tails of theschool SES distribution.
To investigate whether teacher effects differedin higher and lower SES schools we carried out thefirst analysis described but restricted the sample tothe schools in the upper and lower quartiles of theschool SES distribution, respectively. Here schoolSES was defined as the proportion of the samplein the school that was eligible for free or reducedprice lunch. The schools in the lower quartile hadan average of 64% to 72% of students eligible forfree or reduced price lunch, while the schools inthe higher quartile had an average of 28% to 34%of students eligible for free or reduced price lunch.We compared the variance components from high-and low-SES schools using a normal score statis-tic (the difference between the estimates dividedby the standard error of the difference).
Results
The variance decomposition results of ourseparate hierarchical linear model analyses ofachievement gains for the schools in the top andbottom SES quartiles are given in Table 7. Resultsfor low-SES schools are given on the left side ofthe table and results for high-SES schools are
249
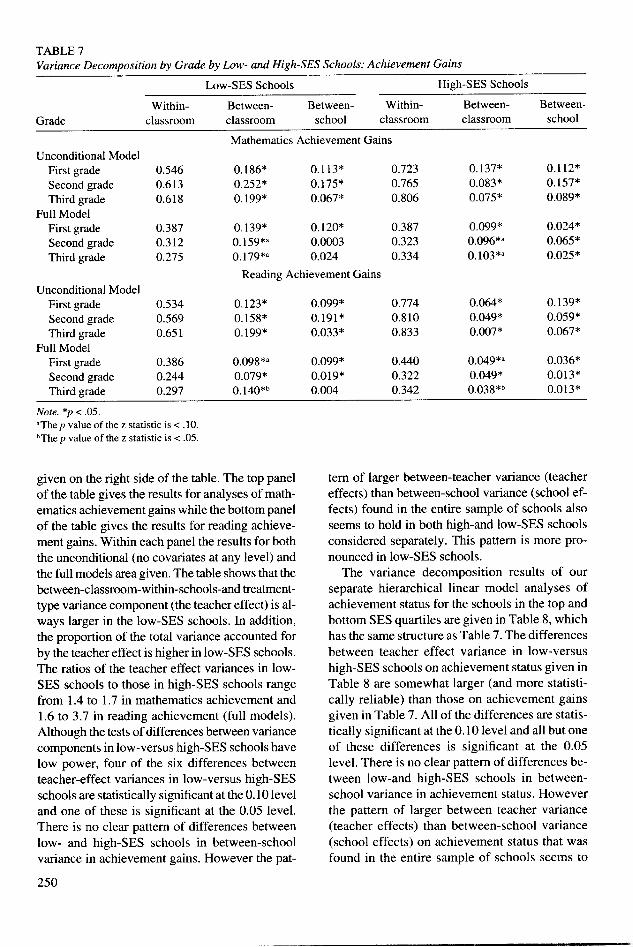
TABLE 7Variance Decomposition by Grade by Low- and High-SES Schools: Achievement Gains
Low-SES Schools High-SES Schools
Within- Between- Between- Within- Between- Between-Grade classroom classroom school classroom classroom school
Mathematics Achievement GainsUnconditional Model
First grade 0.546 0.186* 0.113* 0.723 0.137* 0.112*Second grade 0.613 0.252* 0.175* 0.765 0.083* 0.157*Thirdgrade 0.618 0.199* 0.067* 0.806 0.075* 0.089*
Full ModelFirst grade 0.387 0.139* 0.120* 0.387 0.099* 0.024*Second grade 0.312 0.159*a 0.0003 0.323 0.096*a 0.065*Third grade 0.275 0.179*a 0.024 0.334 0.103*a 0.025*
Reading Achievement GainsUnconditional Model
First grade 0.534 0.123* 0.099* 0.774 0.064* 0.139*Second grade 0.569 0.158* 0.191* 0.810 0.049* 0.059*Third grade 0.651 0.199* 0.033* 0.833 0.007* 0.067*
Full ModelFirst grade 0.386 0.098*a 0.099* 0.440 0.049*, 0.036*Second grade 0.244 0.079* 0.019* 0.322 0.049* 0.013*Third grade 0.297 0.140 *b 0.004 0.342 0.038*b 0.013*
Note. *p < .05.'The p value of the z statistic is < .0.IThe p value of the z statistic is < .05.
given on the right side of the table. The top panelof the table gives the results for analyses of math-ematics achievement gains while the bottom panelof the table gives the results for reading achieve-ment gains. Within each panel the results for boththe unconditional (no covariates at any level) andthe full models area given. The table shows that thebetween-classroom-within-schools-and treatment-type variance component (the teacher effect) is al-ways larger in the low-SES schools. In addition,the proportion of the total variance accounted forby the teacher effect is higher in low-SES schools.The ratios of the teacher effect variances in low-SES schools to those in high-SES schools rangefrom 1.4 to 1.7 in mathematics achievement and1.6 to 3.7 in reading achievement (full models).Although the tests of differences between variancecomponents in low-versus high-SES schools havelow power, four of the six differences betweenteacher-effect variances in low-versus high-SESschools are statistically significant at the 0.10 leveland one of these is significant at the 0.05 level.There is no clear pattern of differences betweenlow- and high-SES schools in between-schoolvariance in achievement gains. However the pat-
250
tern of larger between-teacher variance (teachereffects) than between-school variance (school ef-fects) found in the entire sample of schools alsoseems to hold in both high-and low-SES schoolsconsidered separately. This pattern is more pro-nounced in low-SES schools.
The variance decomposition results of ourseparate hierarchical linear model analyses ofachievement status for the schools in the top andbottom SES quartiles are given in Table 8, whichhas the same structure as Table 7. The differencesbetween teacher effect variance in low-versushigh-SES schools on achievement status given inTable 8 are somewhat larger (and more statisti-cally reliable) than those on achievement gainsgiven in Table 7. All of the differences are statis-tically significant at the 0.10 Ilevel and all but oneof these differences is significant at the 0.05level. There is no clear pattern of differences be-tween low-and high-SES schools in between-school variance in achievement status. Howeverthe pattern of larger between teacher variance(teacher effects) than between-school variance(school effects) on achievement status that wasfound in the entire sample of schools seems to
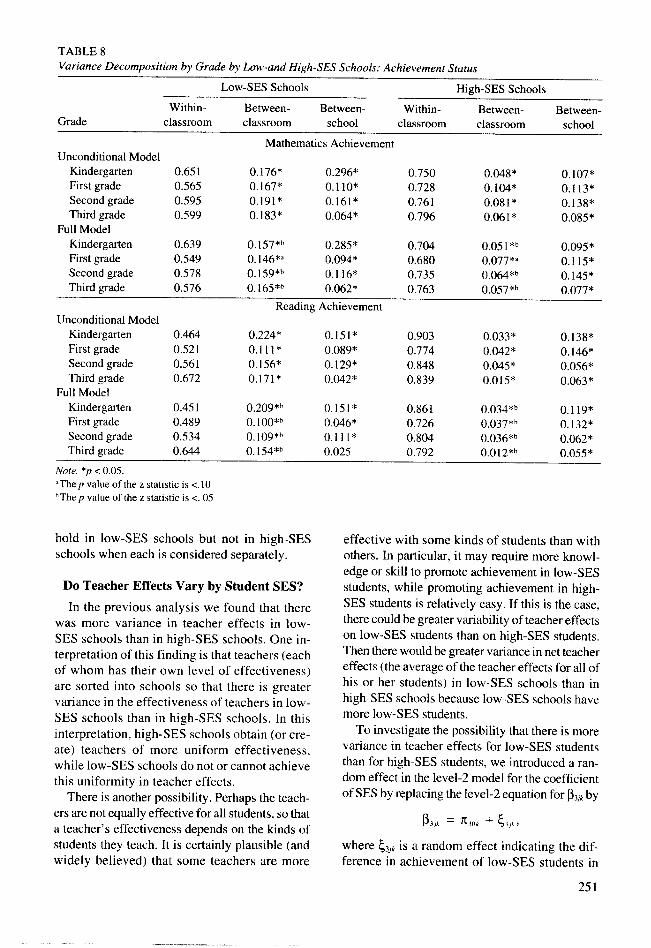
TABLE 8Variance Decomposition by Grade by Low-and High-SES Schools: Achievement Status
Low-SES Schools High-SES Schools
Within- Between- Between- Within- Between- Between-Grade classroom classroom school classroom classroom school
Mathematics AchievementUnconditional Model
Kindergarten 0.651 0.176* 0.296* 0.750 0.048* 0.107*Firstgrade 0.565 0.167* 0.110* 0.728 0.104* 0.113*Second grade 0.595 0.191* 0.161* 0.761 0.081* 0.138*Third grade 0.599 0.183* 0.064* 0.796 0.061* 0.085*
Full ModelKindergarten 0.639 0. 157*b 0.285* 0.704 0.051* 0.095*First grade 0.549 0.146*, 0.094* 0.680 0.077*, 0.115*Second grade 0.578 0. 159*b 0.116* 0.735 0.064*b 0.145*Third grade 0.576 0.165*b 0.062* 0.763 0.057*5 0.077*
Reading AchievementUnconditional Model
Kindergarten 0.464 0.224* 0.151* 0.903 0.033* 0.138*First grade 0.521 0.111* 0.089* 0.774 0.042* 0.146*Second grade 0.561 0.156* 0.129* 0.848 0.045* 0.056*Thirdgrade 0.672 0.171* 0.042* 0.839 0.015* 0.063*
Full ModelKindergarten 0.451 0.209*b 0.151* 0.861 0.034*b 0.119*Firstgrade 0.489 0.1 00*5 0.046* 0.726 0.037*b 0.132*Second grade 0.534 0.109*b 0.111 * 0.804 0.036*b 0.062*Third grade 0.644 0.154*h 0.025 0.792 0.012*5 0.055*
Note. *p < 0.05.'The p value of the z statistic is <.10'The p value of the z statistic is <.05
hold in low-SES schools but not in high-SESschools when each is considered separately.
Do Teacher Effects Vary by Student SES?
In the previous analysis we found that therewas more variance in teacher effects in low-SES schools than in high-SES schools. One in-terpretation of this finding is that teachers (eachof whom has their own level of effectiveness)are sorted into schools so that there is greatervariance in the effectiveness of teachers in low-SES schools than in high-SES schools. In thisinterpretation, high-SES schools obtain (or cre-ate) teachers of more uniform effectiveness,while low-SES schools do not or cannot achievethis uniformity in teacher effects.
There is another possibility. Perhaps the teach-ers are not equally effective for all students, so thata teacher's effectiveness depends on the kinds ofstudents they teach. It is certainly plausible (andwidely believed) that some teachers are more
effective with some kinds of students than withothers. In particular, it may require more knowl-edge or skill to promote achievement in low-SESstudents, while promoting achievement in high-SES students is relatively easy. If this is the case,there could be greater variability of teacher effectson low-SES students than on high-SES students.Then there would be greater variance in net teachereffects (the average of the teacher effects for all ofhis or her students) in low-SES schools than inhigh-SES schools because low-SES schools havemore low-SES students.
To investigate the possibility that there is morevariance in teacher effects for low-SES studentsthan for high-SES students, we introduced a ran-dom effect in the level-2 model for the coefficientof SES by replacing the level-2 equation for 3ji. by
13j- 730 + 43ji-,
where 43jk is a random effect indicating the dif-ference in achievement of low-SES students in
251
Nye, Konstantopoulos, and Hedges
the jth class of the kth school (controlling for the
teacher effect for high-SES children and all of
the other student-level covariates). Thus 43jk iS
the degree to which the teacher effect in the jth
class of the kth school differs for low-SES stu-
dents and high-SES students. The SES effect was
also allowed to vary randomly across schools at
level 3, so that n3Ok = '3YfJ + T30)k.
Results
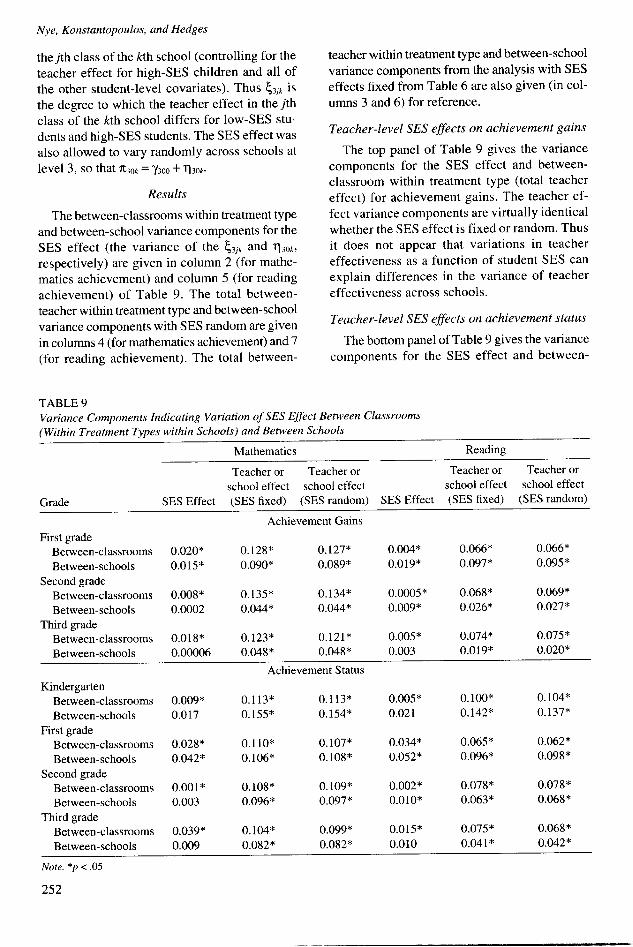
The between-classrooms within treatment type
and between-school variance components for the
SES effect (the variance of the 43jk and T30k,
respectively) are given in column 2 (for mathe-
matics achievement) and column 5 (for reading
achievement) of Table 9. The total between-teacher within treatment type and between-school
variance components with SES random are given
in columns 4 (for mathematics achievement) and 7
(for reading achievement). The total between-
TABLE 9
teacher within treatment type and between-school
variance components from the analysis with SES
effects fixed from Table 6 are also given (in col-
umns 3 and 6) for reference.
Teacher-level SES effects on achievement gains
The top panel of Table 9 gives the variance
components for the SES effect and between-
classroom within treatment type (total teacher
effect) for achievement gains. The teacher ef-
fect variance components are virtually identical
whether the SES effect is fixed or random. Thus
it does not appear that variations in teacher
effectiveness as a function of student SES can
explain differences in the variance of teacher
effectiveness across schools.
Teacher-level SES effects on achievement status
The bottom panel of Table 9 gives the variance
components for the SES effect and between-
Variance Components Indicating Variation of SES Effect Between Classrooms
(Within Treatment Types within Schools) and Between Schools
Mathematics Reading
Teacher or Teacher or Teacher or Teacher or
school effect school effect school effect school effect
Grade SES Effect (SES fixed) (SES random) SES Effect (SES fixed) (SES random)
Achievement GainsFirst grade
Between-classrooms 0.020* 0.128* 0.127* 0.004* 0.066* 0.066*
Between-schools 0.015* 0.090* 0.089* 0.019* 0.097* 0.095*
Second gradeBetween-classrooms 0.008* 0.135* 0.134* 0.0005* 0.068* 0.069*
Between-schools 0.0002 0.044* 0.044* 0.009* 0.026* 0.027*
Third gradeBetween-classrooms 0.018* 0.123* 0.121* 0.005* 0.074* 0.075*
Between-schools 0.00006 0.048* 0.048* 0.003 0.019* 0.020*
Achievement StatusKindergarten
Between-classrooms 0.009* 0.113* 0.113* 0.005* 0.100* 0.104*
Between-schools 0.017 0.155* 0.154* 0.021 0.142* 0.137*
First gradeBetween-classrooms 0.028* 0.110* 0.107* 0.034* 0.065* 0.062*
Between-schools 0.042* 0.106* 0.108* 0.052* 0.096* 0.098*
Second gradeBetween-classrooms 0.001* 0. 108* 0. 109* 0.002* 0.078* 0.078*
Between-schools 0.003 0.096* 0.097* 0.010* 0.063* 0.068*
Third gradeBetween-classrooms 0.039* 0.104* 0.099* 0.015* 0.075* 0.068*
Between-schools 0.009 0.082* 0.082* 0.010 0.041* 0.042*
Note. *p < .05
252
How Large Are Teacher Effects?
classroom within treatment type (total teachereffect) for achievement status. As in the case ofachievement gains, the teacher effect variancecomponents are virtually identical whether theSES effect is fixed or random. This suggests that,while teacher effects vary by SES, this variationcannot explain apparent variation in mean class-room achievement.
School-level SES effects
For both achievement gains and achievementstatus, school effects are virtually identicalwhether the school-level SES effect is fixed orrandom. Thus it appears that school-level vari-ation in SES effects has little impact on betweenschool variation in either achievement gains orachievement status.
Discussion
These results suggest that teacher effects arereal and are of a magnitude that is consistent withthat estimated by previous studies. However wewould argue that, because of random assignmentof teachers and students to classrooms in this ex-periment, our results provide stronger evidenceabout teacher effects. The results of this studysupport the idea that there are substantial differ-ences among teachers in the ability to produceachievement gains in their students.
If teacher effects are normally distributed,these findings would suggest that the differencein achievement gains between having a 25th per-centile teacher (a not so effective teacher) and a75th percentile teacher (an effective teacher) isover one third of a standard deviation (0.35) inreading and almost half a standard deviation(0.48) in mathematics.' Similarly, the differencein achievement gains between having a 50th per-centile teacher (an average teacher) and a 90thpercentile teacher (a very effective teacher) isabout one third of a standard deviation (0.33) inreading and somewhat smaller than half a stan-dard deviation (0.46) in mathematics. In Kinder-garten the effects are comparable, but somewhatlarger for reading. For example, the difference inachievement status in kindergarten between hav-ing a 50th percentile teacher and a 90th per-centile teacher is about 0.40 standard deviationsin reading and 0.43 standard deviations in math-ematics. These effects are certainly large enougheffects to have policy significance.
Sizeable as these effects may be, we argue thatthe effects reported here do not necessarily con-stitute an upper bound on teacher effects for atleast two reasons. First, our design only permitsthe measurement of within-school variance ofteacher effects. Presumably there is also a non-zero between-school component of variance ofteacher effects, and because the total variance ofteacher effects is the sum of within-school andbetween-school components, the total must belarger than either of the parts. Second, our analy-ses may underestimate teacher effects because itis not clear that the outcome measures in ProjectSTAR were strongly aligned with the intentionof instruction. The effects of school inputs suchas teacher effectiveness are expected to be largestwhen the content covered during instruction isclosely aligned with school outcomes such asstudent achievement measures (see, e.g., Walker& Schaffarzick, 1974; or Brimer et al., 1978).
This suggests that interventions to improvethe effectiveness of teachers or identify effectiveteachers might be promising strategies for im-proving student achievement. However it is im-portant to recognize that while our estimates maynot be an upper bound on teacher effects them-selves, one must be cautious in estimating the ef-fect that an intervention, which is based on ma-nipulating teacher effects might have. Considerthe intervention of replacing a teacher estimatedto be at the 25th percentile with a teacher esti-mated to be at the 75th percentile. Our calcula-tions probably overstate the effect of such anintervention because it estimates the potentialeffects of interventions if a perject predictor ofteacher effectiveness was available. No such per-fect predictors are available. Even direct empiri-cal estimates of teacher effects, for example fromvalue added models, would have substantial sta-tistical estimation error, and would therefore beimperfectly correlated with true teacher effec-tiveness. An intervention using an imperfect cor-relate of teacher effectiveness as a proxy for trueteacher effectiveness would have a proportion-ately smaller effect. For example, the differencein achievement gains between having a teacherat the 25th percentile versus the 75th percentileon a measure correlated p = 0.5 with teacher ef-fectiveness would be only half as large as the fig-ures cited.
The finding that teacher effects are largerthan school effects has interesting implications
253
Nye, Konstantopoulos, and Hedges
for improving student achievement. Many poli-cies attempt to improve achievement by substi-tuting one school for another (e.g., schoolchoice) or changing the schools themselves(e.g., whole school reform). The rationale forthese policies is based on the fact that there isvariation in school effects. If teacher effects arelarger than school effects, then policies focus-ing teacher effects as a larger source of varia-tion in achievement may be more promisingthan policies focusing on school effects. Byanalogy, policies derived from a teacher effectsrationale might include substituting one teacherfor another (e.g., teacher choice, or teacher ac-countability) or changing teachers (e.g., teacherdevelopment).
The finding that teacher effects are much largerin low-SES schools suggests that the distributionof teacher effectiveness is much more uneven inlow-SES schools than in high-SES schools. Toput it another way, in low-SES schools, it mat-ters more which teacher a child receives than itdoes in high-SES schools. The larger variance inteacher effectiveness in low-SES schools sug-gests, however, that interventions to replace lesseffective teachers with more effective teachers(or turning one into the other) may be morepromising in low-SES schools than in high-SESschools.
The fact that teacher effects were smaller inthe higher SES schools than the low-SES schoolsis interesting for another reason. It might be ar-gued that the higher SES schools would have af-forded greater resources to teachers and greaterautonomy in deploying those resources, a situationthat could accentuate the differences in teacherskill. This hypothesis seems not to be confirmed.Similarly, it might be imagined that teacher ef-fects would be larger in the small classes than inregular sized classes, because teachers in thesmall classes have greater opportunity to interactwith individual children. Other analyses not re-ported in detail here show that this is not the case.Specifically, we conducted sensitivity analysisemploying the same specifications, but restrict-ing our sample to the control group (regular sizeclasses) to eliminate possible influence of treat-ment effects. The results were comparable tothose reported here using all students in all typesof classes.
The interpretation of these effects, and thoseof the other studies discussed in this article,
254
could be compromised if teacher effects werecumulative and some of those effects were un-observed at the end of the year. For example,first-grade students experience both the effectsof their Kindergarten teacher and their first-grade teacher. In the present study students areequated (on both observable and unobservablefactors) at the time of assignment by random-ization. However, teacher effects occur afterrandomization and therefore teacher effects ontest scores accumulate over time. If the effectsof teachers are entirely captured by end-of-yeartest scores, then our analysis, which is based onresidualized gains should yield pure estimatesof teacher effects on achievement gains. On theother hand if effects of previous teachers areonly observed later, then our analyses may over-estimate the variance of teacher effects (seeAppendix). However if there were substantialteacher effects that were not immediately ob-servable, we might expect teacher effect vari-ances to grow from year to year. The fact thatthe estimated teacher effect variances in Table 5do not appear to increase systematically withgrade level, suggests that this may not be a sub-stantial concern.
One could argue that the best evidence forteacher effects is given by the variance com-ponents in Kindergarten, since only in that gradewere all students randomly assigned to classeswith no other possible lagged teacher effects fromprevious years. It is unfortunate that previousachievement was not available in Kindergarten,and hence was not included in our specifications.However, in principle randomization of studentswithin schools should make adjustment for pre-vious achievement unnecessary.
It is tempting to compare the potential ofinterventions based on teacher effectivenesswith other potential strategies for educationalimprovement such as class-size reduction. Theeffect of a one standard deviation change inteacher effectiveness is larger than, for example,that of reducing class size from 25 to 15 (Nye,Hedges, & Konstantopoulos, 2001). Moreoverthe costs of such class size reduction are veryhigh. Recently, Krueger (2003) conducted a costbenefit analysis of Project STAR and concludedthat the minimum cost effective gain from class-size reduction of the magnitude undertaken inProject STAR would be one tenth of a standarddeviation. It is unclear what the costs of improv-
How Large Are Teacher Effects?
ing teacher effectiveness by one standard devia-tion might be. However, if the cost of such an in-tervention is comparable to that of reducing classsize, our findings suggest that the positive effectis at least as large and therefore such an inter-vention to improve teacher quality would be costeffective.
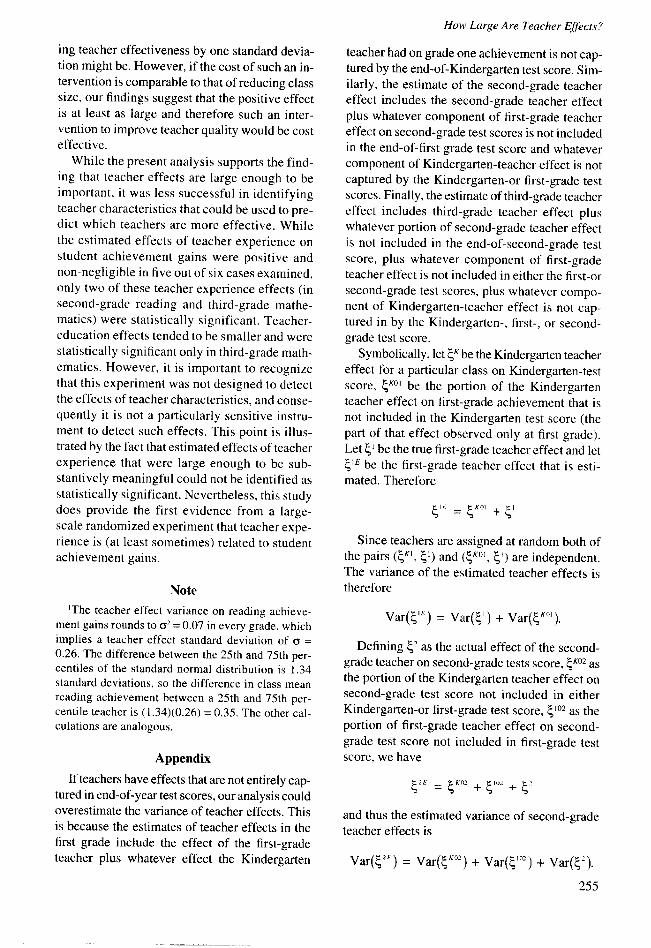
While the present analysis supports the find-ing that teacher effects are large enough to beimportant, it was less successful in identifyingteacher characteristics that could be used to pre-dict which teachers are more effective. Whilethe estimated effects of teacher experience onstudent achievement gains were positive andnon-negligible in five out of six cases examined,only two of these teacher experience effects (insecond-grade reading and third-grade mathe-matics) were statistically significant. Teacher-education effects tended to be smaller and werestatistically significant only in third-grade math-ematics. However, it is important to recognizethat this experiment was not designed to detectthe effects of teacher characteristics, and conse-quently it is not a particularly sensitive instru-ment to detect such effects. This point is illus-trated by the fact that estimated effects of teacherexperience that were large enough to be sub-stantively meaningful could not be identified asstatistically significant. Nevertheless, this studydoes provide the first evidence from a large-scale randomized experiment that teacher expe-rience is (at least sometimes) related to studentachievement gains.
Note
'The teacher effect variance on reading achieve-ment gains rounds to ( = 0.07 in every grade, whichimplies a teacher effect standard deviation of ca =0.26. The difference between the 25th and 75th per-centiles of the standard normal distribution is 1.34standard deviations, so the difference in class meanreading achievement between a 25th and 75th per-centile teacher is (1.34)(0.26) = 0.35. The other cal-culations are analogous.
Appendix
If teachers have effects that are not entirely cap-tured in end-of-year test scores, our analysis couldoverestimate the variance of teacher effects. Thisis because the estimates of teacher effects in thefirst grade include the effect of the first-gradeteacher plus whatever effect the Kindergarten
teacher had on grade one achievement is not cap-tured by the end-of-Kindergarten test score. Sim-ilarly, the estimate of the second-grade teachereffect includes the second-grade teacher effectplus whatever component of first-grade teachereffect on second-grade test scores is not includedin the end-of-first grade test score and whatevercomponent of Kindergarten-teacher effect is notcaptured by the Kindergarten-or first-grade testscores. Finally, the estimate of third-grade teachereffect includes third-grade teacher effect pluswhatever portion of second-grade teacher effectis not included in the end-of-second-grade testscore, plus whatever component of first-gradeteacher effect is not included in either the first-orsecond-grade test scores, plus whatever compo-nent of Kindergarten-teacher effect is not cap-tured in by the Kindergarten-, first-, or second-grade test score.
Symbolically, let RK be the Kindergarten teachereffect for a particular class on Kindergarten-testscore, 4KOI be the portion of the Kindergartenteacher effect on first-grade achievement that isnot included in the Kindergarten test score (thepart of that effect observed only at first grade).Let 1, I be the true first-grade teacher effect and let4IE be the first-grade teacher effect that is esti-mated. Therefore
41 = 4KOI +
Since teachers are assigned at random both ofthe pairs (4KI, 41) and (4Ko1, 4') are independent.The variance of the estimated teacher effects istherefore
Var("E) = Var(4') + Var(&,°).
Defining 42 as the actual effect of the second-grade teacher on second-grade tests score, K02 asthe portion of the Kindergarten teacher effect onsecond-grade test score not included in eitherKindergarten-or first-grade test score, 102 as theportion of first-grade teacher effect on second-grade test score not included in first-grade testscore, we have
42F = 4KO2 + I102 + 2
and thus the estimated variance of second-gradeteacher effects is
Var(42E) = Var(4Ko2) + Var(4' 2 ) + Var(4 2 ).
255
Nye, Konstantopoulos, and Hedges
In a similar way and using analogous notation,the estimated variance of third grade teachereffects is
Var(43_) = Var(,Ko3) + Var(4103 )
+ Var(42 03) + Var(4).
Whether this problem is serious or not de-pends on how large the lagged effects of teachers(4KOI 102 4203, -KO2, etc.) are in comparison to
the effect of the current teacher (41, 42, or 43).
Logic suggests that these effects should be con-siderably smaller than the effects of the currentteacher and may be negligible. Some researchers
using the Tennessee Value Added AssessmentSystem contend that effects of previous teacherson achievement status (not gains) can be ob-served for up to five years (see Sanders, 1998;Topping & Sanders, 2000). However their analy-ses suggest that these effects are independent ofgains in student achievement.
References
Angrist, J., Imbens, G. W., & Rubin, D. B. (1996).Identification of causal effects using instrumentalvariables. Journal of the American StatisticalAssociation, 91, 444-472.
Armour, D. T. (1976). Analysis of the schoolpreferredreading program in selected Los Angeles minorityschools. R-2007-LAUSD. Santa Monica, CA: RandCorporation.
Brimer, A., Madaus, F. G., Chapman, B., Kallaghan, T.,& Wood, R. (1978). Sources of difference in schoolachievement. Windsor, Berks. SLA I DF: NFER Pub-lishing Company.
Bryk, A. S., & Raudenbush, S. W. (1992). Hierar-chical linear models. Thousand Oaks, CA: SagePublications.
Coleman, J. S., Campbell, E. Q., Hobson, C. J.,McPartland, J., Mood, A. M., Weinfeld, F. D., &York, R. L. (1966). Equality of educational oppor-tunit. Washington, DC: US Government PrintingOffice.
Darling-Hammond, L. (1995). Inequality and accessto knowledge. In J. A. Banks (Ed.), The handbookof research on multicultural education. New York:Macmillan.
Goldhaber, D. D., & Brewer, D. J. (1997). Why don'tschools and teachers seem to matter? Assessing theimpact of unobservables on educational productiv-ity. The Journal of Human Resources, 32, 505-523.
Greenwald, R., Hedges, L. V., & Laine, R. D. (1996).The effect of school resources on student achieve-ment. Review of Educational Research, 66, 361-396.
Hanushek, E. A. (1971). Teacher characteristics andgains in student achievement; estimation using microdata. American Economic Review, 61, 280-288.
Hanushek, E. A. (1986). The economics of schooling:Production and efficiency in public schools. Jour-nal of Economic Literature, 24, 1141-1177.
Hanushek, E. A. (1971). Teacher characteristics andgains in student achievement: estimation using microdata. American Economic Review, 61, 280-288.
Hanushek, E. A. (1992). The tradeoff between childquantity and quality: Some empirical evidence.Journal of Political Economy, 100, 84-117.
Krei, M. S. (1998). Intensifying the barriers: The prob-lem of inequitable teacher allocation in low-incomeurban schools. Urban Education, 33, 71-94.
Krueger, A. B. (1999). Experimental estimates ofeducation production functions. Quarterly Journalof Economics, 114, 497-532.
Krueger, A. B. (2003). Economic considerations andclass size. Economic Journal, 113, 34-63.
Langford, H., Loeb, S., & Wyckoff, J. (2002).Teacher sorting and the plight of urban schools:A descriptive analysis. Educational Evaluation
and Policy Analysis, 24, 37-62.Mumane, R. J., & Phillips, B. R. (1981). What do
effective teachers of inner-city children have incommon'? Social Science Research, 10, 83-100.
Nye, B., Hedges, L. V., & Konstantopoulos, S.(2000). The effects of small classes on achieve-ment: The results of the Tennessee class size ex-periment. American Educational Research Jour-
nal, 37, 123-151.Nye, B., Hedges, L. V., and Konstantopoulos, S.
(2001). Are the effects of small classes cumulative?Evidence from a Tennessee experiment. The Jour-nal of Educational Research, 94, 336-345.
Rivkin, S. G., Hanushek, E. A., & Kain, J. F. (2001).Teachers, schools, and academic achievement.
NBER Report.Rowan, B., Correnti, R., & Miller, R. J. (2002). What
large scale, survey research tells us about teachereffects on student achievement: Insights from theProspects study of elementary schools. TeachersCollege Record, 104, 1525-1567.
Sanders, W. L. (1998). Value added assessment. TheSchool Administrator, 55(11), 24-32.
Tiebout, C. M. (1956). A pure theory of local expen-ditures. Journal of Political Economy, 64, 416-424.
Topping, K. J., & Sanders, W. L. (2000). Teachereffectiveness and computer assessment of read-ing: Relating value added and learning informa-tion system data. School Effectiveness and School
Improvement, 11, 305-337.Walker, D. F., & Schaffarzick, J. (1974). Comparing
Curricula. Review of Educational Research, 44,
83-111.
256
Authors
BARBARA NYE is Director, Center of Excellence forResearch and Policy on Basic Skills, Tennessee StateUniversity, 3301 10th Ave., Box 141. Nashville, TN37203; [email protected]. Her areas of specializa-tion are research on class size, teacher education, sci-ence education and policy issues.
SPYROS KONSTANTOPOULOS is an AssistantProfessor of Human Development and Social Policy,and Learning Sciences at the School of Education andSocial Policy at Northwestern University. 2120 CampusDrive, Evanston. IL 60208; [email protected] specializes in the application of statistical methodsin social science research, particularly research onthe effects of class size, and school and teacher effectresearch.
LARRY V. HEDGES is Stella M. Rowley Profes-sor of Education Psychology, Sociology, The Univ-ersity of Chicago, 5835 Kimbark Ave., Chicago, IL60637; [email protected]. His areas of special-ization are the application of statistical methods ineducation research and educational policy analysis,particularly research on the effects of class size and ed-ucational technology, school effects research, and re-search on motivation.
Manuscript received April 14, 2003Revision received March 15, 2004
Accepted July 19, 2004
257
COPYRIGHT INFORMATION
TITLE: How Large Are Teacher Effects?SOURCE: Educ Eval Policy Anal 26 no3 Fall 2004
WN: 0429703465003
The magazine publisher is the copyright holder of this article and itis reproduced with permission. Further reproduction of this article inviolation of the copyright is prohibited. To contact the publisher:http://www.aera.net/
Copyright 1982-2004 The H.W. Wilson Company. All rights reserved.