Embed Size (px)
Citation preview
THE EFFECTS OF A TEACHER PRESCRIBED PROBLEM-SOLVING PATHWAY
ON NOVICE PROBLEM-SOLVERS IN A CHEMISTRY CLASSROOM
by
Randal C. Houseman
A thesis submitted in partial fulfillment of the requirements for the degree
of
Master of Science
in
Science Education
MONTANA STATE UNIVERSITY Bozeman, Montana
July 2020

©COPYRIGHT
by
Randal C. Houseman
2020
All Rights Reserved

ii
ACKNOWLEDGEMENTS
I would like to thank Eijk and Rose-Marie Van Otterloo for their generosity and
support of the Chair Program at Holderness School. The Chair Program is a gift that
strengthens the community of teachers and learners at Holderness School. The Chair
Program has allowed me to:
• Reflect on the teaching and learning that happens in my classes and act on these
reflections.
• Share ideas and information with talented science teachers from all across the
globe.
• Study subject matter that interests me and is relevant to my students.
• Learn from and with some outstanding educators at Montana State University.
• Learn many formative assessment techniques that I can and will implement in my
classroom.
• Remember what it feels like to be on the other side of the teacher / student
relationship.
I would also like to thank my wife, Meredith for all that she has done to support me
through this journey. This included uprooting her life for a year and travelling across the
country with me, having empathy and understanding when my face was buried in a
computer screen for hours on end, and sharing my excitement and frustrations of being a
student again.
iii
TABLE OF CONTENTS
1. INTRODUCTION AND BACKGROUND ....................................................................1 Focus Question.................................................................................................................2
2. CONCEPTUAL FRAMEWORK ....................................................................................4
Problem Versus Exercise .................................................................................................4 Difficulty of A Problem ...................................................................................................6 Behaviors of Successful Problem Solvers ......................................................................7
3. METHODOLOGY ........................................................................................................10
Treatment .......................................................................................................................10 Data Collection and Analysis Strategies ........................................................................12 4. Data Analysis .................................................................................................................16
Results ............................................................................................................................16 5. CLAIM, EVIDENCE, AND REASONING ..................................................................27
Claims from the Study ...................................................................................................27 Value of the Study and Consideration of Future Research ............................................31
Value ......................................................................................................................31 Future Research .....................................................................................................33
Impact of Action Research on the Author .....................................................................34 REFERENCES CITED ................................................................................................................................35................................................................................................................................................ APPENDICES ...................................................................................................................38
APPENDIX A: Institutional Review Board Exemption ........................................39 APPENDIX B: Blank Student Work Checklist .....................................................41 APPENDIX C: Confidence Survey ......................................................................43 APPENDIX D: “I Do Not Understand” Survey ....................................................47 APPENDIX E: Post-treatment Student Reflection Questions ...............................51

iv
LIST OF TABLES
Table Page
1. Data Triangulation Matrix .................................................................................15
v
LIST OF FIGURES
Figure Page
1. An Overview of Teacher Prescribed Pathway ..................................................11
2. Student Work on First Post-Treatment Assessment .........................................17
3. A Bar graph Showing Steps Included on Post-treatment Assessment ..............18
4. A Boxplot Showing Steps Included in Documented Problem Solutions ..........19
5. A Stacked Bar Graph of Responses to the First Three Questions on the I Don’t
Understand Survey ................................................................................................20
6. A Stacked Bar Graph of Responses to Last two Questions on the I Don’t
Understand Survey .................................................................................................21
7.A Pie Graph of Students’ Reported Strengths in Problem Solving ...................22
8. A Pie Graph of Student’s Reported Weaknesses in Problem Solving ..............23
9. A Pie Graph of Stategies Students Use When Solving Problems ......................25
10. A Pie graph of Students’ Feelings When Solving Novel Problems................ 26
vi
ABSTRACT
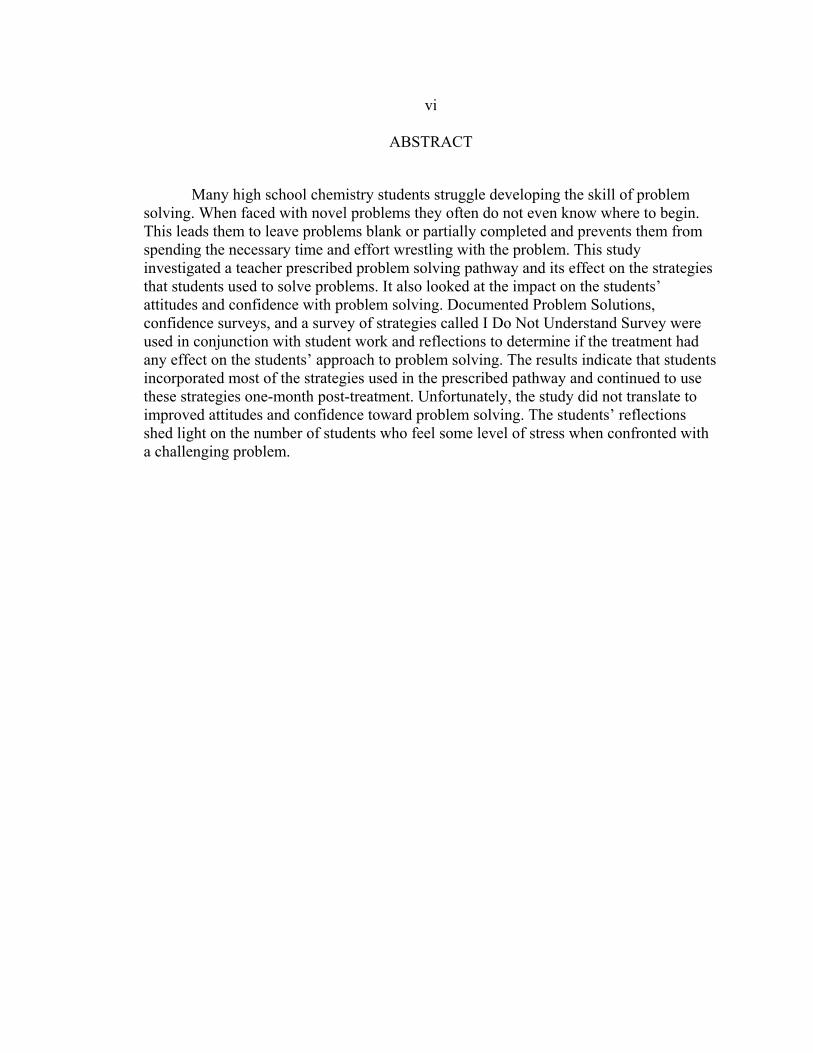
Many high school chemistry students struggle developing the skill of problem solving. When faced with novel problems they often do not even know where to begin. This leads them to leave problems blank or partially completed and prevents them from spending the necessary time and effort wrestling with the problem. This study investigated a teacher prescribed problem solving pathway and its effect on the strategies that students used to solve problems. It also looked at the impact on the students’ attitudes and confidence with problem solving. Documented Problem Solutions, confidence surveys, and a survey of strategies called I Do Not Understand Survey were used in conjunction with student work and reflections to determine if the treatment had any effect on the students’ approach to problem solving. The results indicate that students incorporated most of the strategies used in the prescribed pathway and continued to use these strategies one-month post-treatment. Unfortunately, the study did not translate to improved attitudes and confidence toward problem solving. The students’ reflections shed light on the number of students who feel some level of stress when confronted with a challenging problem.
1
CHAPTER ONE
INTRODUCTION AND BACKGROUND
Context of the Study
Holderness School is an independent boarding school in central New Hampshire.
The school was founded in 1879 as an Episcopal high school for boys. Holderness went
co-educational in the 1970’s but still maintains a connection to its Episcopal roots. The
school educates students in grades nine through twelve and also has three to five post
graduate students each year. The overall student population is 280, 85% of which are
boarding students and 15 % are day students. Forty five percent of the student body is
female and 15 % are international students from eleven different countries. The average
class size is 12 with a maximum class size of 16. The student to faculty ratio is six to one.
The tuition for boarding students is $64,800. Financial Aid is available and
approximately one-third of the students receive aid, totaling more than $3.5 million
annually (Holderness.org). All of the students matriculate to a four-year college or
university. Holderness school places a priority on the school community. This includes
family style dinners where each faculty shares a meal with six or seven students. Family
style dinners occur at least two times a week. Each student and faculty are also expected
to know the name of each member of the community and as part of the Jobs Program
each student on campus has a job ranging from cleaning a classroom to raking leaves.
In the MSSE 504, Formative Assessment in Science Education I conducted a
Documented Problem Solutions assessment with an honors physics class. This classroom
2 assessment technique had the students document all the steps that they use to solve a
given problem. Many of the students in this class were former students of my chemistry
class. This group of students had strong problem-solving skills and were able to produce
the correct response on most of the problems that were presented with the assessment.
Given their success on solving the problems I thought that they would have little
difficulty describing the important steps that they took to reach their solution. This was
not the case. The majority of the students failed to mention a step that was common to all
of the problems on the assignment. This apparent struggle with metacognition lead me to
consider Documented Problems Solutions with my younger less experienced chemistry
students. Even when offered partial credit on all problems many of my chemistry students
will leave difficult problems blank or show little to no work. I spoke with a colleague
who had her AP statistics students document the steps to their solutions on each problem
they were assigned. This was met with great resistance from her students. They argued
that it more than doubled the time it took to complete each assignment and it often
overwhelmed those students who were struggling in the class. Again, these students were,
as a group, more advanced students with better problem-solving skills than my chemistry
students. I was looking for a way to help my novice problem solvers and to get all of my
students to begin to reflect on their thinking.
Focus Question
My focus question was, Will a clear and manageable problem-solving pathway
provided to the students with the appropriate scaffolding help more students implement
problem-solving strategies in high school chemistry?

3
My sub-question was as follows:
1. What impact will this process have on student attitudes and confidence with
problem-solving?
4
CHAPTER 2
CONCEPTUAL FRAMEWORK
Problem Versus Exercise
Researchers studying problem solving must first start with a working definition of
the word problem. One definition of a problem is a gap or divide between where a learner
is and where they want to be and not knowing how to build a bridge to cross the gap
(Hayes, 1980). Another way to view a problem is characterized by a learner who is faced
with a question and does not have an immediate solution or pathway to reach a solution
(Bloom & Niss, 1991). A problem has also been defined as a difficulty that a learner
needs to clear away but lacks any groundwork to do so (Ince, 2018).
To aid their students, educators have set out to establish a defined set of steps or a
pathway that a learner must undergo in order to solve a problem. One early and often
referenced pathway contains four steps to solve all mathematical problems. The first step
is to understand the problem. In this step the known(s) and unknown(s) are identified.
The second step is to devise a plan by first asking if the problem is similar to other
problems that have already been solved. The third step is to carry out a plan. Included in
this step is checking all work performed. In the final step, the question “does the solution
make sense” needs to be answered (Polya, 1957).
Many science educators have developed their own process to help students solve
problems. Goldilocks Help was established to assist novice chemistry students by
providing them with a five-step problem-solving guide. In the first step, titled

5 Understand, the problem is defined and or deconstructed. The second step, Analyze, the
known(s) and the unknown(s) are extracted from the problem. The third step, Plan,
involves establishing a relationship between the known(s) and the unknown(s). The
fourth step, Implement, includes all the calculations. The final step, Evaluate, is
determining the sensibility of the solution (Yuriev, Naidu, Schembri & Short, 2017).
Research suggests that it is important to distinguish the difference between
problems and exercises. The steps taken to solve a problem are significantly different
from a path used to find a solution to an exercise. Algorithms are often used in science
and math education and can be described as a defined set of rules that can be followed to
obtain a solution. Therefore, algorithms are important in solving exercises (Bodner,
1987). Bodner (1987) used the factor label method as an example of an algorithm being
used to solve an exercise. The factor label method is used to convert one unit into
another. He believes that algorithms alone, however, cannot be used to solve a problem.
Certain parts of a problem might be solved using an algorithm but by definition the
problem as a whole cannot be solved with a series of known steps. However, if a student
has not built appropriate algorithms to solve specific parts of a problem then it is unlikely
that they will be able produce a solution to the overall problem (Bodner, 1987).
Research concludes that problems are solved in a cyclical and seemingly
irrational manner. Steps may include try something, try something else, read the problem
again, and start over if you have to. A method like this is clearly not linear and again
points to the difference between problems and exercises. This cyclical approach
emphasizes that no single problem-solving method can incorporate all of the nuances of
6 problem solving because of the complexity of the process and the variability of the
learner (Bodner & Herron, 2003).
The complexity of the problem-solving process has led many educators in other
directions. Instead of trying to provide a problem-solving guide or pathway for students
some educators want students to focus on the reasoning they have used to arrive at a
solution. Show-That is a method that provides students with the final answer to problems
in the form of an equation. The students are then required to document how that final
answer was derived. This shifts the focus of the student from trying to find a numerical
answer to showing their reasoning behind the answer provided. This method may also
help the students’ understanding of the underlying concepts (Hewitt, 2008). Another
approach is the cross-proportion method that was developed as a concept-based process.
This differs from the algorithm approach commonly used to solve problems in chemistry
and starts with students pointing out the underlying principles that they have learned and
that are needed in the solution (Cook & Cook, 2005).
Difficulty of A Problem
Research has focused on factors leading to varying problem difficulty.
One study determined that as the amount of information that has to be processed
increases so does the difficulty. Based on this idea, researchers believe that at some point
the volume of information will exceed the working memory and overwhelm the learner.
Therefore, they determined that the number of steps required to solve a problem
determines its difficulty (Johnstone & El-Bana, 1989). Another study pointed out some
of the limitations of using volume as the sole indicator of difficulty. In the study it was
7 noted that each step to a problem cannot be assumed to be of equal difficulty, some steps
are more difficult than others (Tsaparlis, 1998). A more recent study did not limit the
focus of the research to the final answer that the students obtained. Instead, this study
looked at the process of problem-solving. This study reported that a problem with only a
few steps can be difficult if the process is branched as opposed to linear. One example is
when students start with a single number in a problem and need to use it in two separate
calculations before they can obtain a final answer. This is a different path than a series of
conversions from one unit to the next which many students are familiar with. It also noted
that students often have algorithms that are context bound. Consequently, if the context
changes, they are no longer able to appropriately apply the algorithm. Similarly, other
problems are difficult because a student’s knowledge is often tied to the context in which
it was learned. In this case students may not have the ability to transfer their knowledge
of the subject to an unfamiliar problem. Lastly, some problems are difficult simply
because students have failed to memorize important information needed to succeed in the
subject. This could be due in part to the focus in education on higher order thinking skills
leading to the neglect of simple but important content (Gulacar & Fynewever, 2010).
Behaviors of Successful Problem Solvers
The difficulty of any single problem is dependent on the problem solver.
Novice and expert are terms sometimes used to categorized problem solvers. It is,
however, better to look at problem solving performance on a continuum. As someone
gains more knowledge in a field they are less dependent on general strategies to solve a
problem. In this way a problem can become an exercise due to an increase in field
8 specific knowledge. The behaviors of successful problem solvers can be compared to the
behaviors of unsuccessful problem solvers. Successful problem solvers read and reread a
question throughout the process of solving a problem (Bodner & Herron 2002).
The idea that there are certain behaviors that promote successful problem-solving
has led to the study of these behaviors. One study compiled a list of the behaviors of
successful physics problem solvers that are found in the reviewed research. It was found
that successful problem solvers first try to comprehend the underlying physics concepts
and then work on a solution to the problem. It was also noted that they tend to follow a
series of steps to get to the final answer, including making a plan and evaluating the
outcome. On the other hand, unsuccessful problem solvers started by trying to plug
numbers into mathematical equations. The successful problem solvers’ up-front
preparation time to understand the concepts and deconstruct the problem was longer than
the unsuccessful problem solver. This time was spent making appropriate connections
between all of the data provided in the problem. The unsuccessful problem solver was
unable to make these connections (Ince, 2018). Eliminating numbers from questions and
forcing students to let the symbols of the equations guide them may force unsuccessful
problem solvers to focus on making these important connections (Hewitt, 2006).
Another study was conducted to determine if student use of a teacher supplied
problem solving method increased after a period of behavioral modification. The research
was a response, in part, to the frequent refrain from students that they understood it in
class but can’t do it on their own. Many students reported not knowing how to get started.
The research provided the test group with a fairly regimented method to solve physics
9 problems. Rewards were given to the students who followed the pathway provided. At
the end of the research period more students were using the pathway or parts of the
pathway. While the students’ behaviors were successfully changed, the students’ attitude
remained unchanged. Most of the students reported that the formulaic method provided
by the instructors was too time consuming and cumbersome. It was also noted that the
increase in use of the pathway did not seem to have a measurable impact on student
performance (DiLisi, Eulberg, Lanese & Padovan, 2005).

10
CHAPTER 3
METHODOLOGY
Treatment
The purpose of this study was to determine the impact of a teacher prescribed
problem-solving method on the strategies students use to work though challenging
problems and their confidence when facing a novel problem in chemistry. The treatment
period for the research was during the third and fourth quarters. Most of the work done
during this time was quantitative with students solving multi-step problems including but
not limited to stoichiometry, solution stoichiometry, gas laws, and colligative properties.
A total of 31 students in two classes of Honors Chemistry, an introductory chemistry
class, participated in this study. Seven of the students were international students. The
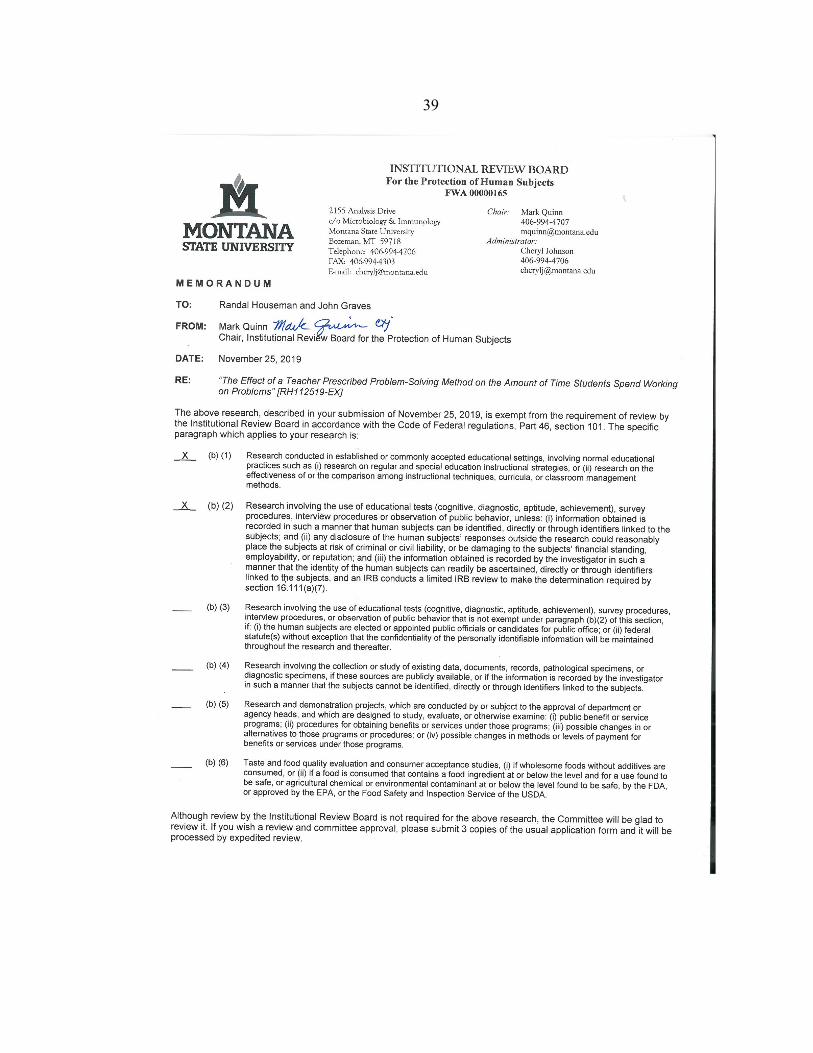
research methodology for this project received an exemption by Montana State
University’s Institutional Review Board, and compliance for working with human
subjects was maintained (Appendix A).
Prior to any treatment, Student Work Checklists were used to determine what
students were including in their solutions to problems (Appendix B). These checklists
included the following categories: left blank, answer only, work included, formula
included, correct response, time spent and name of the student. Student Work Checklists
were used on homework, classwork, and assessment problems. Just prior to treatment the
Documented Problem Solutions Trial formative assessment was conducted. This first
Documented Problem Solution was used to familiarize the students with the expectations
11 of this classroom assessment technique and to get them to think about the steps they use
to solve problems. The Documented Problem Solution Pretreatment was conducted on a
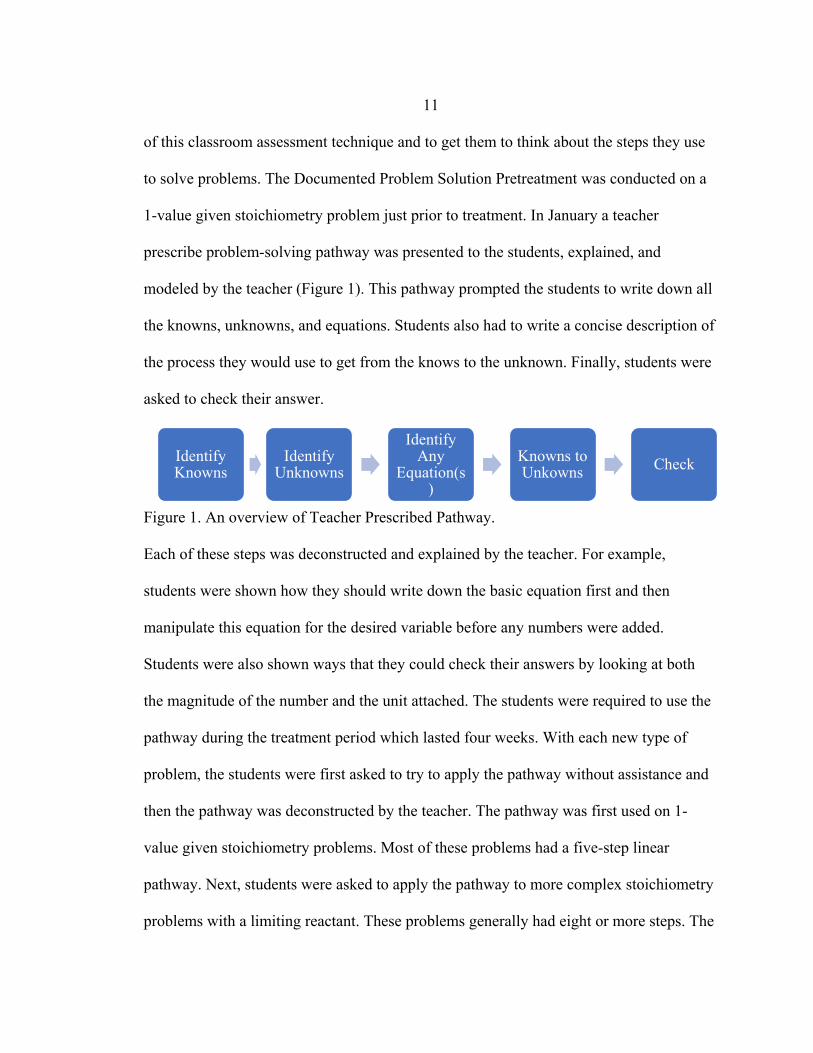
1-value given stoichiometry problem just prior to treatment. In January a teacher
prescribe problem-solving pathway was presented to the students, explained, and
modeled by the teacher (Figure 1). This pathway prompted the students to write down all
the knowns, unknowns, and equations. Students also had to write a concise description of
the process they would use to get from the knows to the unknown. Finally, students were
asked to check their answer.
Figure 1. An overview of Teacher Prescribed Pathway.
Each of these steps was deconstructed and explained by the teacher. For example,
students were shown how they should write down the basic equation first and then
manipulate this equation for the desired variable before any numbers were added.
Students were also shown ways that they could check their answers by looking at both
the magnitude of the number and the unit attached. The students were required to use the
pathway during the treatment period which lasted four weeks. With each new type of
problem, the students were first asked to try to apply the pathway without assistance and
then the pathway was deconstructed by the teacher. The pathway was first used on 1-
value given stoichiometry problems. Most of these problems had a five-step linear
pathway. Next, students were asked to apply the pathway to more complex stoichiometry
problems with a limiting reactant. These problems generally had eight or more steps. The
Identify Knowns
Identify Unknowns
Identify Any
Equation(s)
Knowns to Unkowns Check
12 increased volume of steps had the potential to increase the difficulty (Johnstone & El-
Bana, 1989). Eventually the students were asked to apply the pathway to colligative
property problems. These problems combined many of the steps of the stoichiometry
problems with multiple new equations. Some of these problems could also be described
as having a branched solving process as opposed to the linear process used in most of the
previous stoichiometry problems. This had the potential to make the colligative property
problems even more complex (Gulacar & Fynewever, 2010). Students were reminded
daily to include their pathway with all problems. After the treatment period students were
free to use the pathway or not use the pathway. The post-treatment student work was
examined to see what parts of the pathway, if any, the students were still using.
Assessments one week and one month post treatment were used to observe any
behavioral changes in the students.
Data Collection and Analysis Strategies
Two pre-treatment assignments were analyzed using data compiled on the Student
Work Checklist. The first pre-treatment assignment was an introductory homework
problem that students were asked to complete without an in-class explanation. This
problem required a simple two step solution. The question, What is the mass in grams of
a billion billion (1018) atoms of 24Mg?, was analyzed to determine if there was a
relationship between a student showing work and answering the problem correctly.
The second pretreatment assignment dealt with wavelength, frequency and energy
problems and was the first assignment that required the students to use multiple formulas
(c= 𝜆𝜆 𝜈𝜈 and E = h 𝜈𝜈) and, on some problems, combine the formulas. Again, using the
13 Student Work Checklist, the data was analyzed to see if there was a relationship between
the gender of the student and whether or not a formula was included in their solution. The
analysis of these two assignments was performed before any treatment began and helped
guide the rest of the study.
The Pre and Post-Treatment Documented Problem Solutions were used to
determine the steps students used to solve problems (Appendix D). Documented Problem
Solutions were used to develop problem solving skills and to develop the ability to apply
previously learned principles to new problems (Angelo & Cross, 1993). The teacher
determined the fundamental steps needed to correctly solve the problem. The number of
each of these steps that a student correctly identified was recorded. A boxplot was used to
represent the average scores. The median difference between the pre and post-treatment
numbers was compared for each student using the Wilcoxon Signed Rank Test.
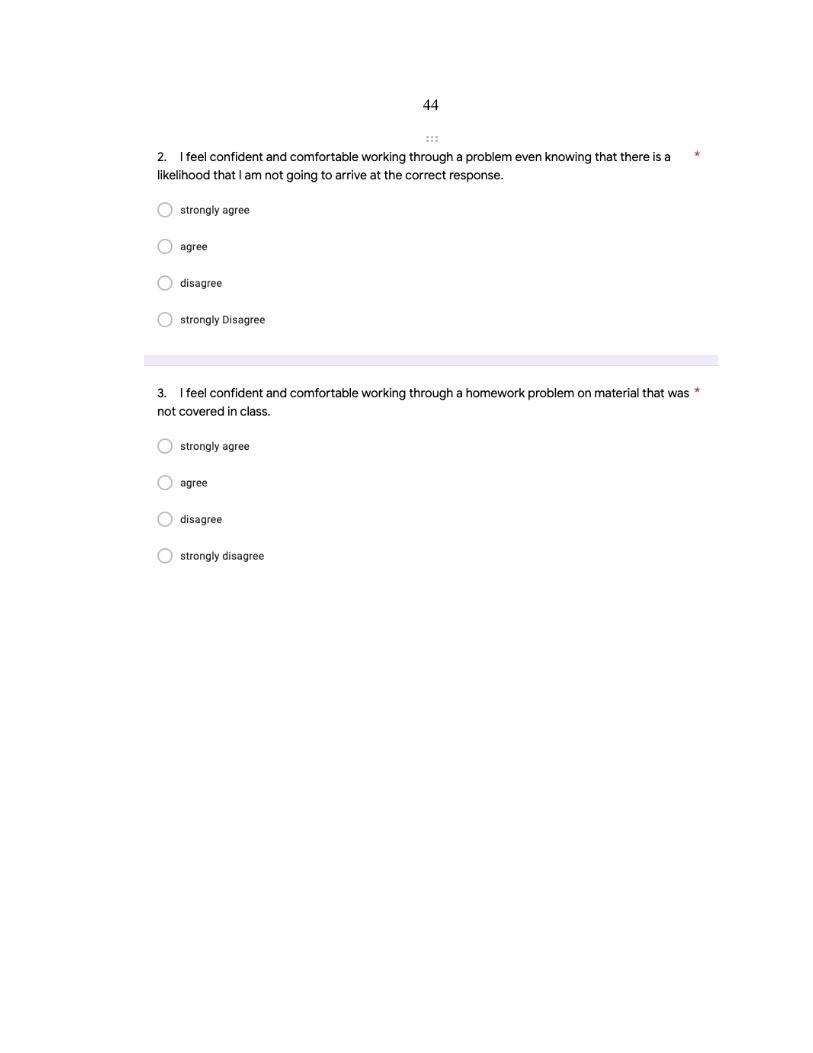
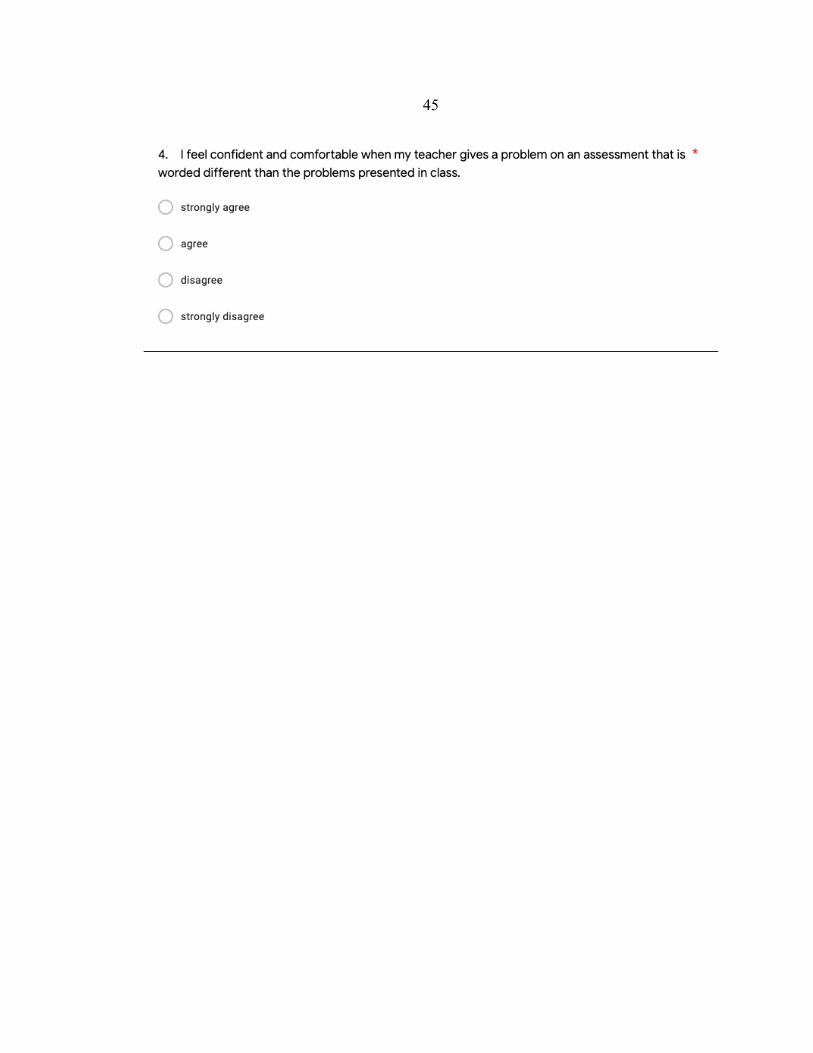
The Pre- and Post-Treatment Confidence Survey was used to determine students’
confidence and comfort solving new and different problems (Appendix G). The questions
ask students to strongly disagree, disagree, agree or strongly agree to questions about
their confidence working through problems that they had not seen before or were unlikely
to arrive at a correct response. The percent of positive responses on the pretreatment
survey were compared to the positive responses post treatment. Bar graphs were used to
represent this data.
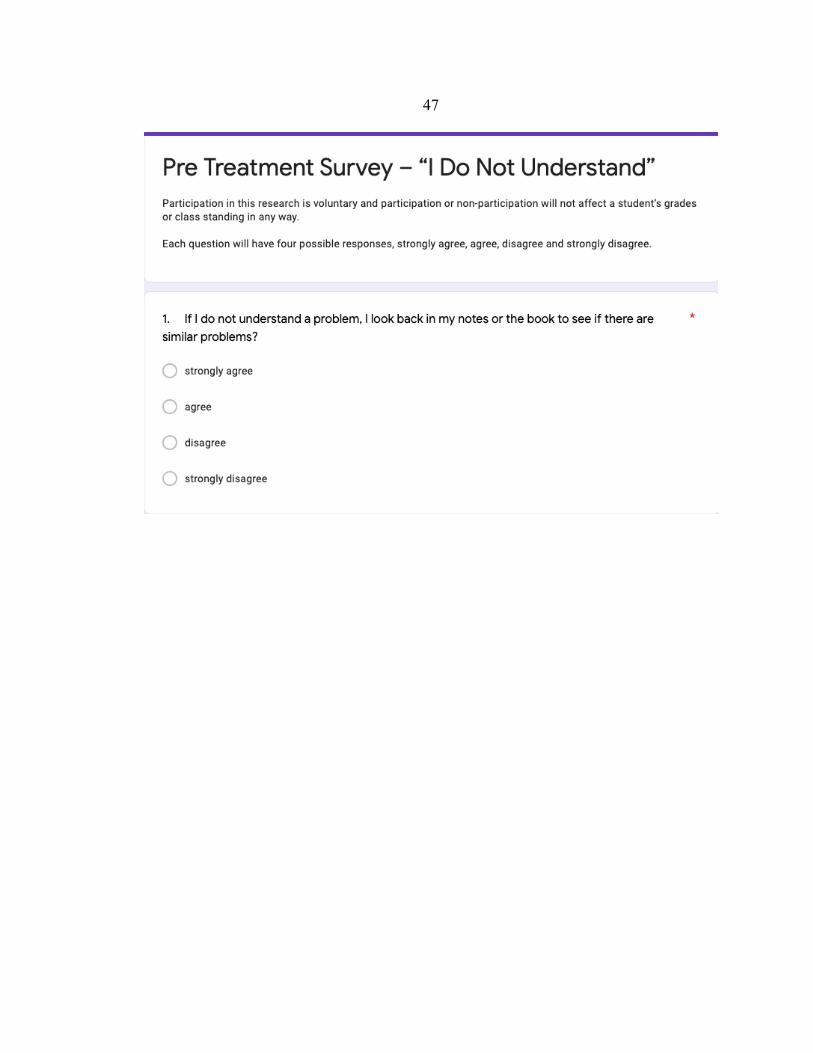
The Pre and Post-Treatment I Do Not Understand Likert Survey was used to
determine what strategies students use when faced with a problem they do not understand
and therefore can not solve. The students were asked to respond strongly agree, agree,
14 disagree, strongly disagree to the five questions. The percent of positive responses on the
pretreatment survey were compared to the positive responses post treatment. Bar graphs
were used to represent this data.
A post-treatment reflection was conducted. The students were asked to respond to
five questions. The questions, What are your strengths as a problem solver? What are
your weaknesses as a problem solver? How will you improve on these weaknesses? How
do you feel about working on a type of problem that you have never seen before? What
are some strategies you could use to work on a type of problem that you have never seen
before? The qualitative data was grouped according to like responses and plotted using
pie charts.
The data collection instruments used to answer the primary and secondary
questions are outlined in the triangulation matrix below (Table 1).
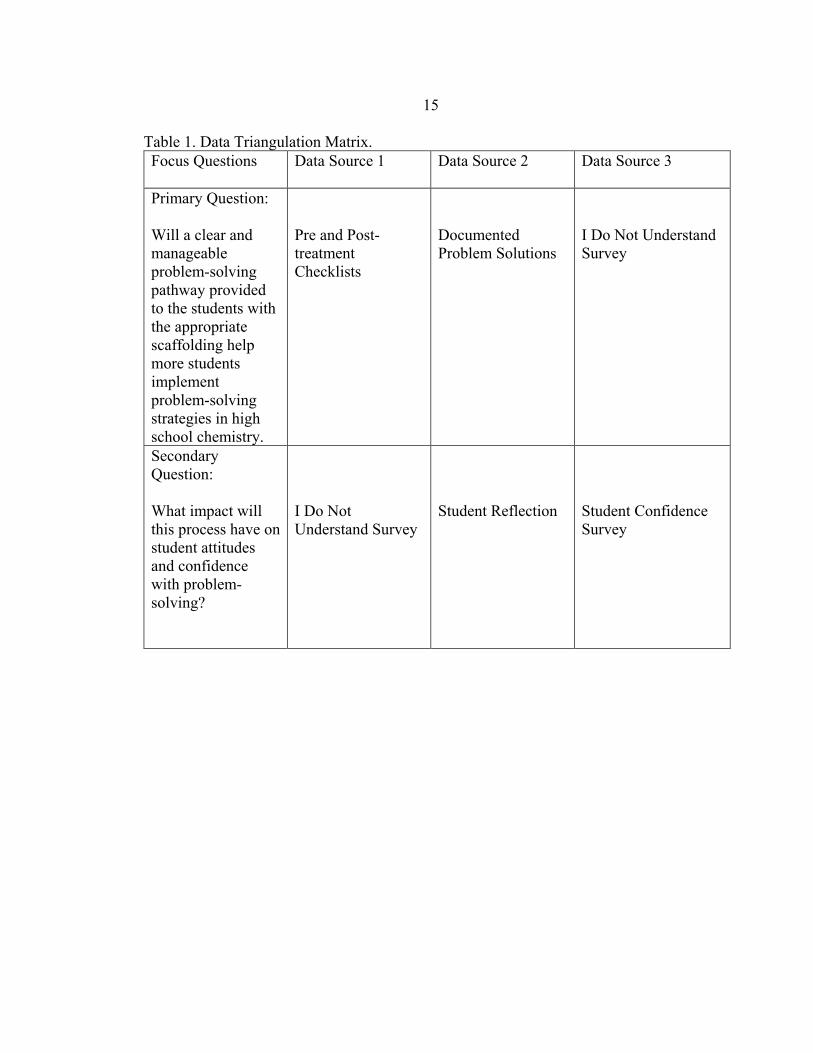
15 Table 1. Data Triangulation Matrix. Focus Questions Data Source 1 Data Source 2 Data Source 3
Primary Question:
Will a clear and manageable problem-solving pathway provided to the students with the appropriate scaffolding help more students implement problem-solving strategies in high school chemistry.
Pre and Post-treatment Checklists
Documented Problem Solutions
I Do Not Understand Survey
Secondary Question: What impact will this process have on student attitudes and confidence with problem-solving?
I Do Not Understand Survey
Student Reflection
Student Confidence Survey

16
CHAPTER 4
DATA AND ANALYSIS
Results
The data obtained from the first Student Work Checklist indicated that 58 percent
of the students did not include any work in their solution (N=31). One student included
work but did not have a final calculation. Forty two percent of the students successfully
answered the question correctly. The data was analyzed using a Pearson’s Chi-Squared
Test. The null hypothesis was showing work is independent of answering the question
correctly. The p-value for the test was 2.473 x10⁻⁵ with a Pearson’s correlation coefficient
of 0.823. This extremely small p-value demonstrates that the null hypothesis should be
rejected. The evidence indicated that showing work on this problem was not independent
of obtaining the correct answer. The Pearson’s correlation coefficient of 0.823 show a
strong relationship between showing work and answering the problem correctly.
The data from the second Pretreatment Student Checklist indicated that 42 % of
the male students and 68% of the female students included formulas in their work
(N=31). A Chi-Squared Test for Independence was used to analyze the data. Including
formulas with their work was independent of the student’s gender was the null
hypothesis. The p-value of the test was 0.2727 suggesting that the null hypothesis should
not be rejected. Gender and showing work were independent on this assignment. Neither
females or males were more likely to include work.
17
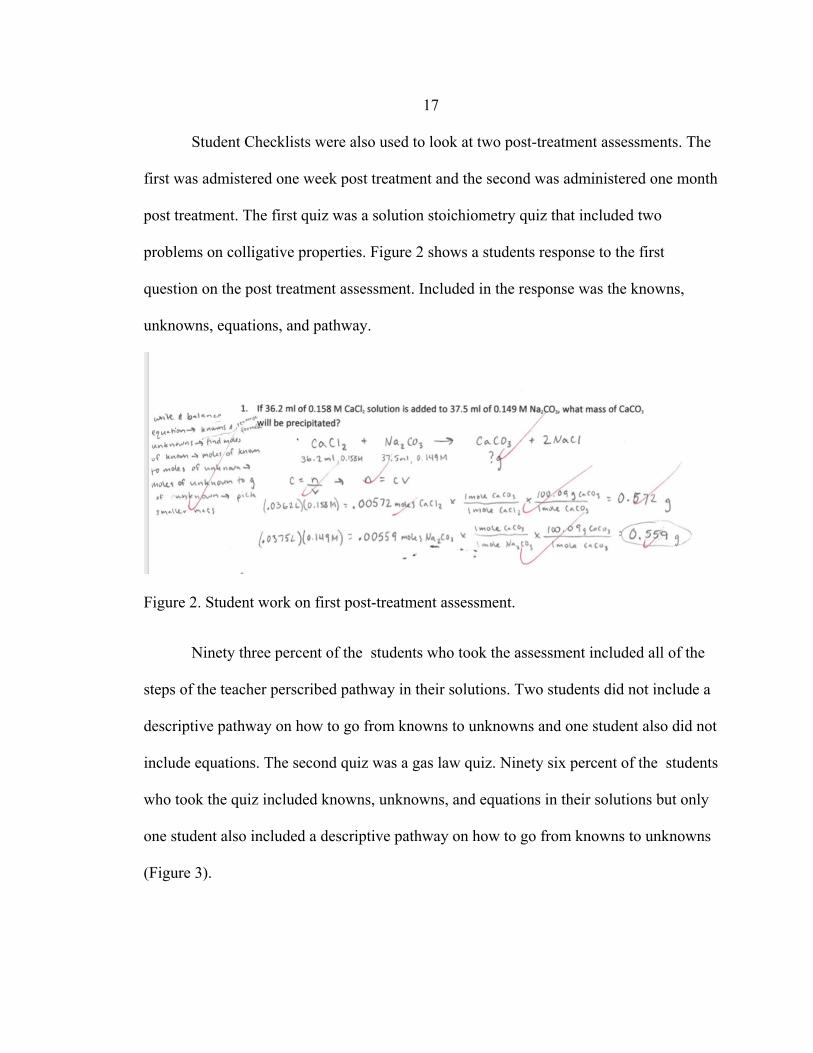
Student Checklists were also used to look at two post-treatment assessments. The
first was admistered one week post treatment and the second was administered one month
post treatment. The first quiz was a solution stoichiometry quiz that included two
problems on colligative properties. Figure 2 shows a students response to the first
question on the post treatment assessment. Included in the response was the knowns,
unknowns, equations, and pathway.
Figure 2. Student work on first post-treatment assessment.
Ninety three percent of the students who took the assessment included all of the
steps of the teacher perscribed pathway in their solutions. Two students did not include a
descriptive pathway on how to go from knowns to unknowns and one student also did not
include equations. The second quiz was a gas law quiz. Ninety six percent of the students
who took the quiz included knowns, unknowns, and equations in their solutions but only
one student also included a descriptive pathway on how to go from knowns to unknowns
(Figure 3).
18
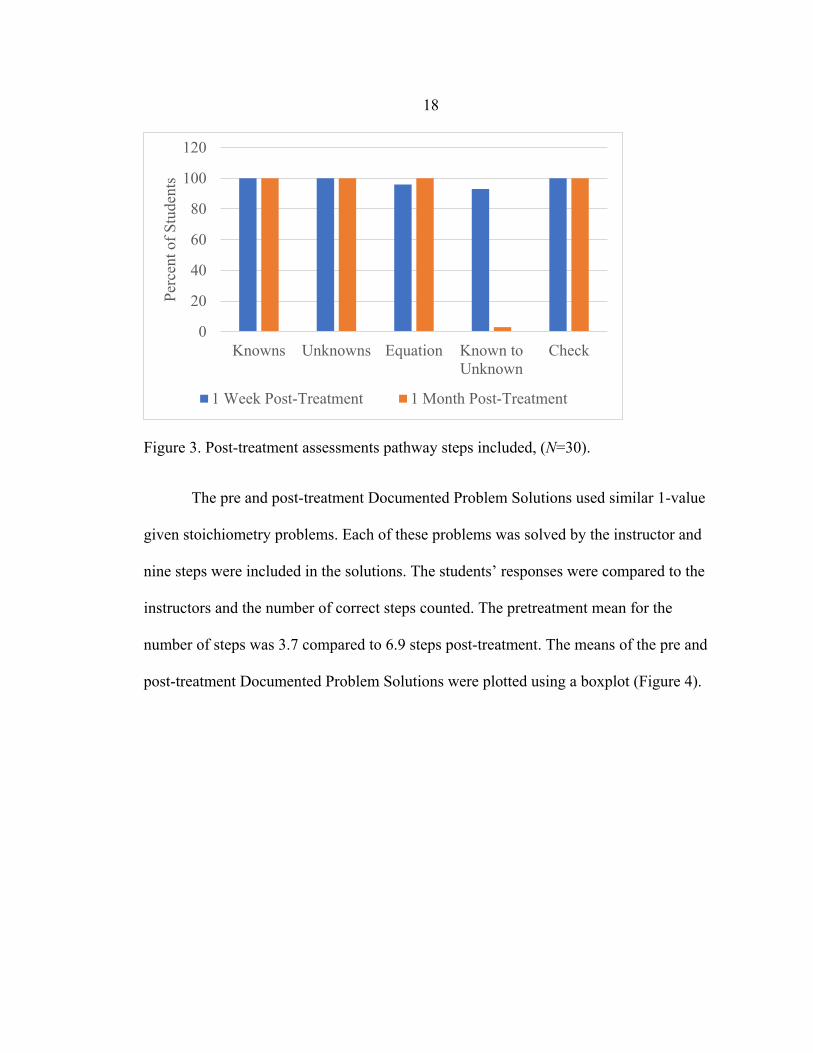
Figure 3. Post-treatment assessments pathway steps included, (N=30).
The pre and post-treatment Documented Problem Solutions used similar 1-value
given stoichiometry problems. Each of these problems was solved by the instructor and
nine steps were included in the solutions. The students’ responses were compared to the
instructors and the number of correct steps counted. The pretreatment mean for the
number of steps was 3.7 compared to 6.9 steps post-treatment. The means of the pre and
post-treatment Documented Problem Solutions were plotted using a boxplot (Figure 4).
0
20
40
60
80
100
120
Knowns Unknowns Equation Known toUnknown
Check
Perc
ent o
f Stu
dent
s
1 Week Post-Treatment 1 Month Post-Treatment
19
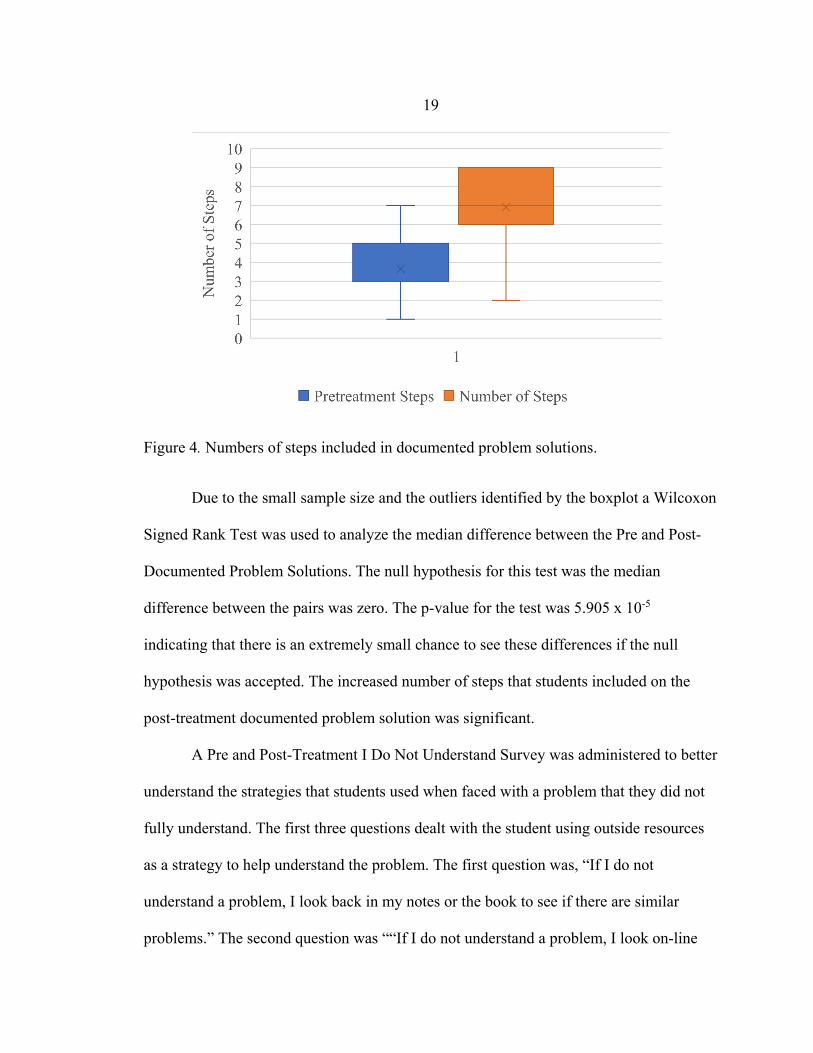
Figure 4. Numbers of steps included in documented problem solutions.
Due to the small sample size and the outliers identified by the boxplot a Wilcoxon
Signed Rank Test was used to analyze the median difference between the Pre and Post-
Documented Problem Solutions. The null hypothesis for this test was the median
difference between the pairs was zero. The p-value for the test was 5.905 x 10⁻⁵
indicating that there is an extremely small chance to see these differences if the null
hypothesis was accepted. The increased number of steps that students included on the
post-treatment documented problem solution was significant.
A Pre and Post-Treatment I Do Not Understand Survey was administered to better
understand the strategies that students used when faced with a problem that they did not
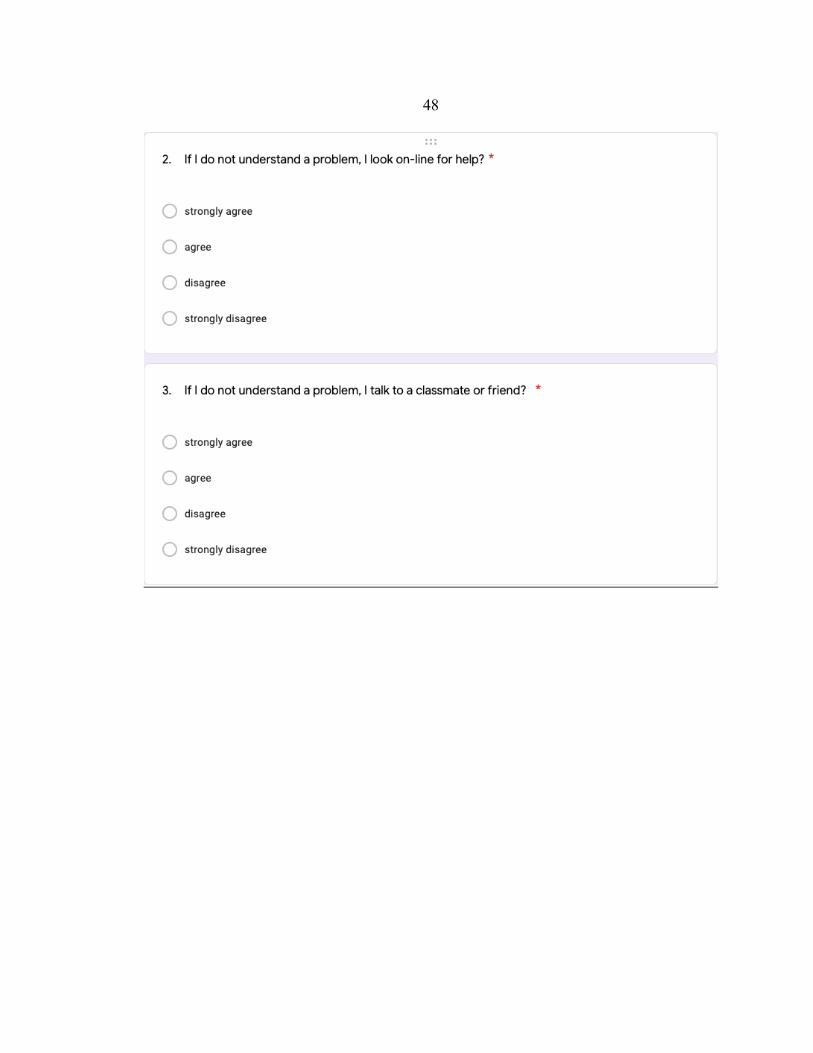
fully understand. The first three questions dealt with the student using outside resources
as a strategy to help understand the problem. The first question was, “If I do not
understand a problem, I look back in my notes or the book to see if there are similar
problems.” The second question was ““If I do not understand a problem, I look on-line

20 for help” and the third question was “If I do not understand a problem, I talk to a
classmate or friend.” On the pretreatment survey ninety three percent of the students
responded with strongly agree or agree to the first three questions combined (Figure 5).
On the post-treatment survey this percentage changed to ninety percent.
Figure 5. Responses to first three questions on I Don’t Understand Survey, (N=27).
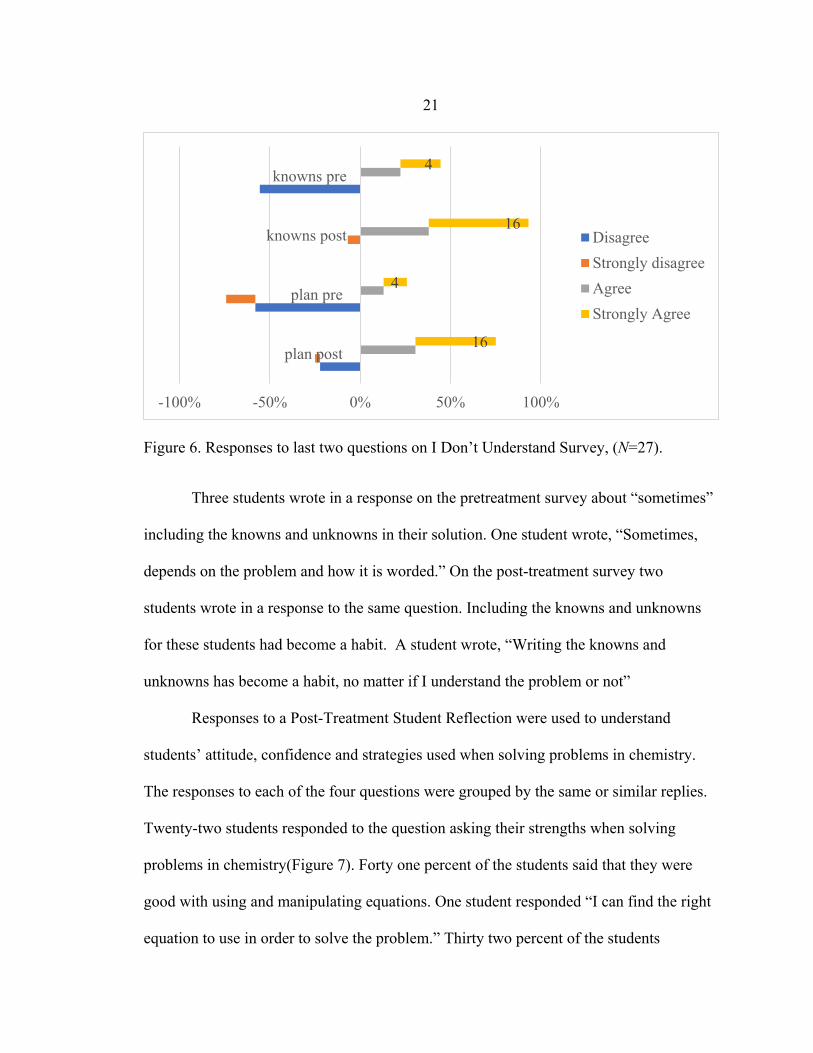
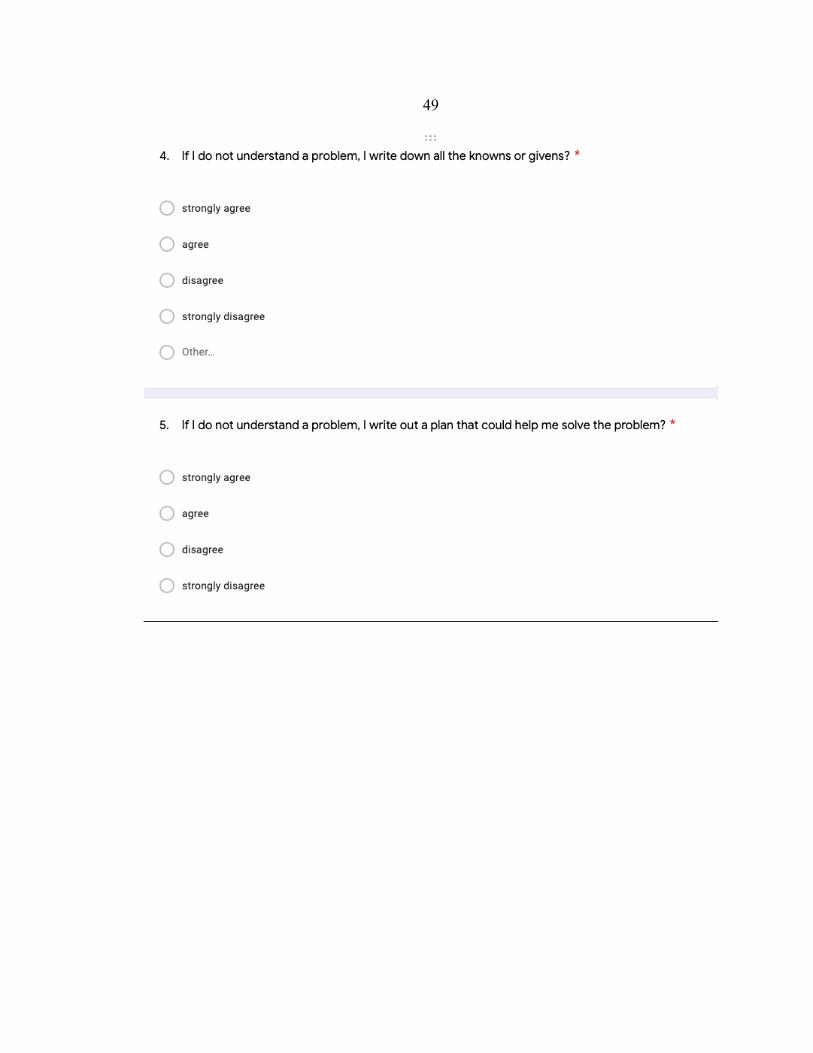
The last two question of the survey dealt with strategies that were part of the
teacher prescribed problem solving pathway. These questions were “If I do not
understand a problem, I write down all the knowns or givens” and “If I do not understand
a problem, I write out a plan that could help me solve the problem.” On the pretreatment
survey thirty three percent of the students responded with strongly agree or agree to these
questions. On the post treatment survey this percentage increased to eighty three percent
(Figures 6).
11
14
7
11
20
17
-20% 0% 20% 40% 60% 80% 100%
classmates post
classmates pre
on-line post
on-line pre
notes post
notes pre
DisagreeStrongly disagreeAgreeStrongly Agree
21
Figure 6. Responses to last two questions on I Don’t Understand Survey, (N=27).
Three students wrote in a response on the pretreatment survey about “sometimes”
including the knowns and unknowns in their solution. One student wrote, “Sometimes,
depends on the problem and how it is worded.” On the post-treatment survey two
students wrote in a response to the same question. Including the knowns and unknowns
for these students had become a habit. A student wrote, “Writing the knowns and
unknowns has become a habit, no matter if I understand the problem or not”
Responses to a Post-Treatment Student Reflection were used to understand
students’ attitude, confidence and strategies used when solving problems in chemistry.
The responses to each of the four questions were grouped by the same or similar replies.
Twenty-two students responded to the question asking their strengths when solving
problems in chemistry(Figure 7). Forty one percent of the students said that they were
good with using and manipulating equations. One student responded “I can find the right
equation to use in order to solve the problem.” Thirty two percent of the students
16
4
16
4
-100% -50% 0% 50% 100%
plan post
plan pre
knowns post
knowns pre
DisagreeStrongly disagreeAgreeStrongly Agree
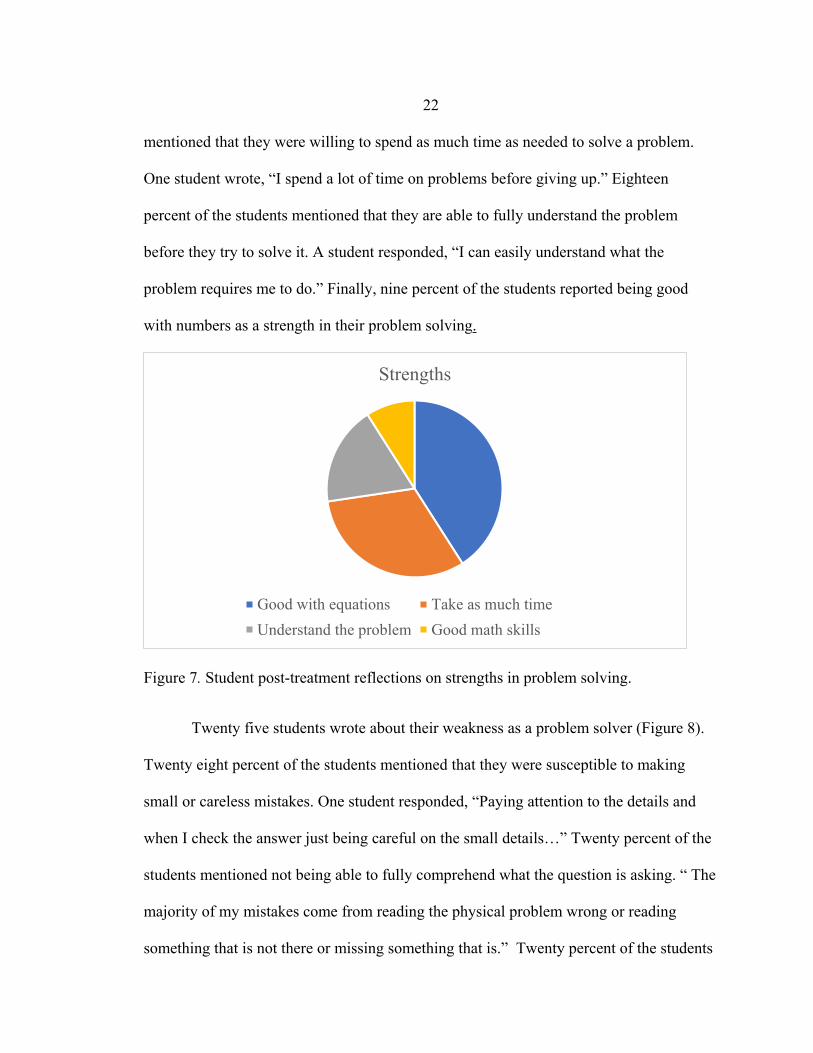
22 mentioned that they were willing to spend as much time as needed to solve a problem.
One student wrote, “I spend a lot of time on problems before giving up.” Eighteen
percent of the students mentioned that they are able to fully understand the problem
before they try to solve it. A student responded, “I can easily understand what the
problem requires me to do.” Finally, nine percent of the students reported being good
with numbers as a strength in their problem solving.
Figure 7. Student post-treatment reflections on strengths in problem solving.
Twenty five students wrote about their weakness as a problem solver (Figure 8).
Twenty eight percent of the students mentioned that they were susceptible to making
small or careless mistakes. One student responded, “Paying attention to the details and
when I check the answer just being careful on the small details…” Twenty percent of the
students mentioned not being able to fully comprehend what the question is asking. “ The
majority of my mistakes come from reading the physical problem wrong or reading
something that is not there or missing something that is.” Twenty percent of the students
Strengths
Good with equations Take as much timeUnderstand the problem Good math skills
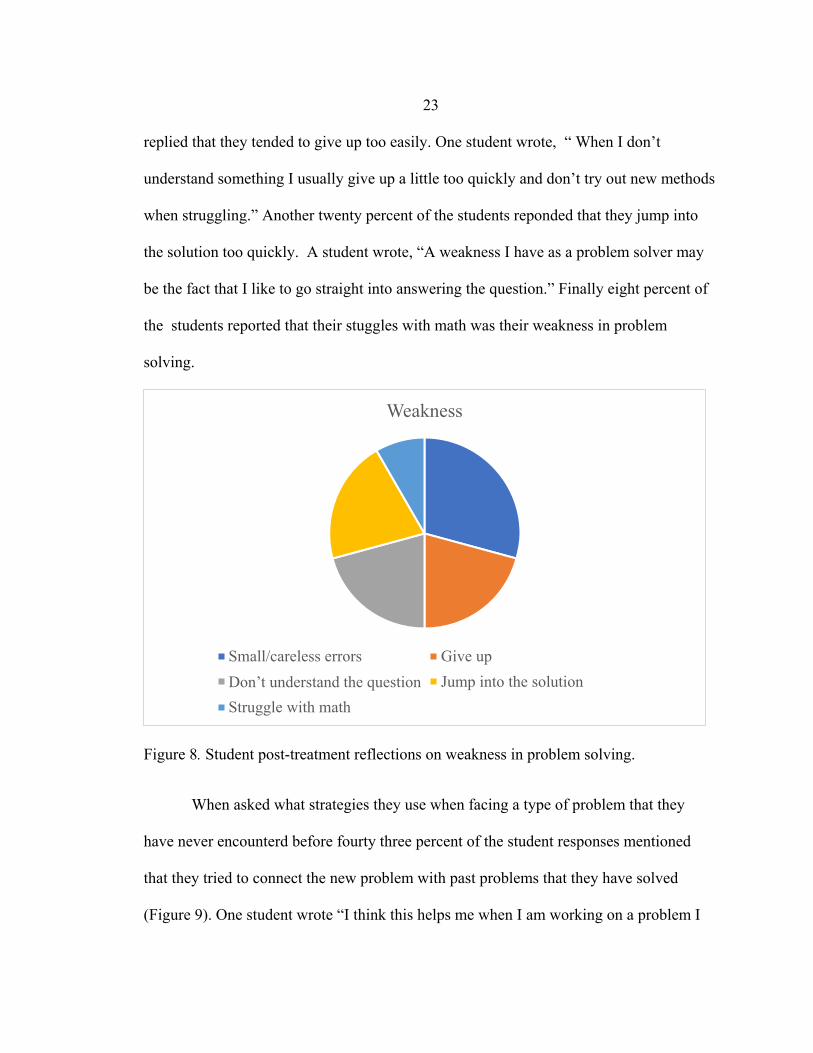
23 replied that they tended to give up too easily. One student wrote, “ When I don’t
understand something I usually give up a little too quickly and don’t try out new methods
when struggling.” Another twenty percent of the students reponded that they jump into
the solution too quickly. A student wrote, “A weakness I have as a problem solver may
be the fact that I like to go straight into answering the question.” Finally eight percent of
the students reported that their stuggles with math was their weakness in problem
solving.
Figure 8. Student post-treatment reflections on weakness in problem solving.
When asked what strategies they use when facing a type of problem that they
have never encounterd before fourty three percent of the student responses mentioned
that they tried to connect the new problem with past problems that they have solved
(Figure 9). One student wrote “I think this helps me when I am working on a problem I
Weakness
Small/careless errors Give upDon’t understand the question Jump into the solutionStruggle with math
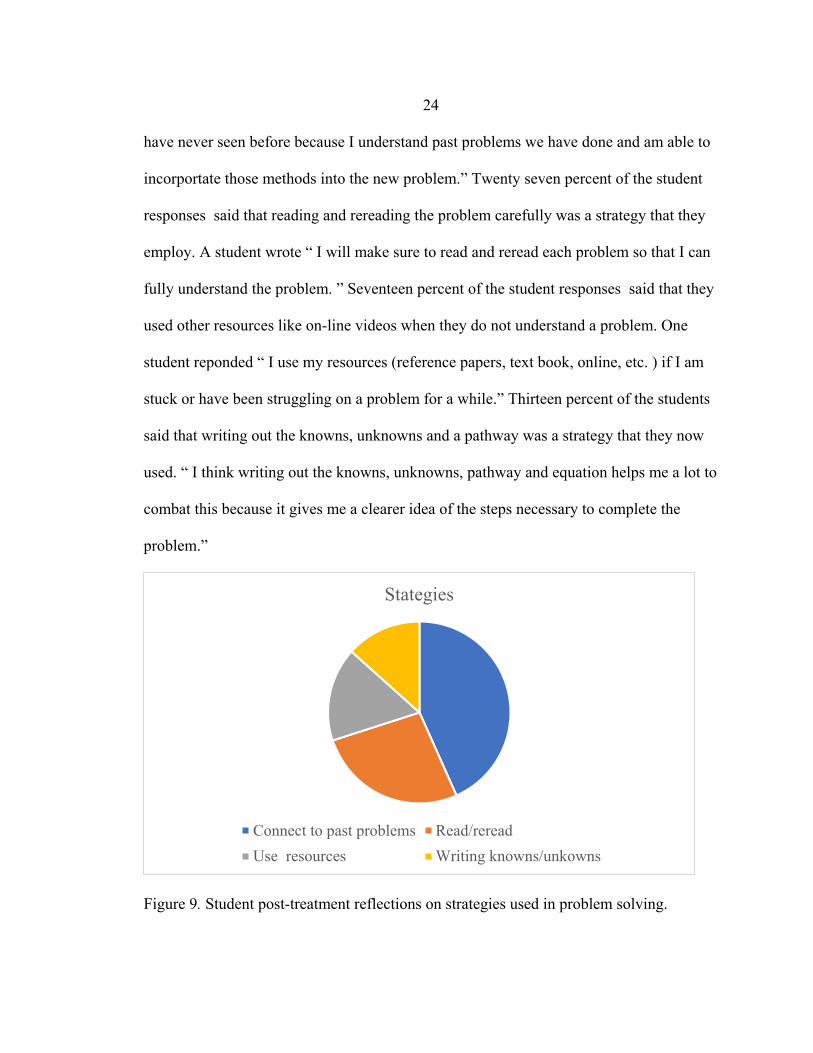
24 have never seen before because I understand past problems we have done and am able to
incorportate those methods into the new problem.” Twenty seven percent of the student
responses said that reading and rereading the problem carefully was a strategy that they
employ. A student wrote “ I will make sure to read and reread each problem so that I can
fully understand the problem. ” Seventeen percent of the student responses said that they
used other resources like on-line videos when they do not understand a problem. One
student reponded “ I use my resources (reference papers, text book, online, etc. ) if I am
stuck or have been struggling on a problem for a while.” Thirteen percent of the students
said that writing out the knowns, unknowns and a pathway was a strategy that they now
used. “ I think writing out the knowns, unknowns, pathway and equation helps me a lot to
combat this because it gives me a clearer idea of the steps necessary to complete the
problem.”
Figure 9. Student post-treatment reflections on strategies used in problem solving.
Stategies
Connect to past problems Read/rereadUse resources Writing knowns/unkowns
25
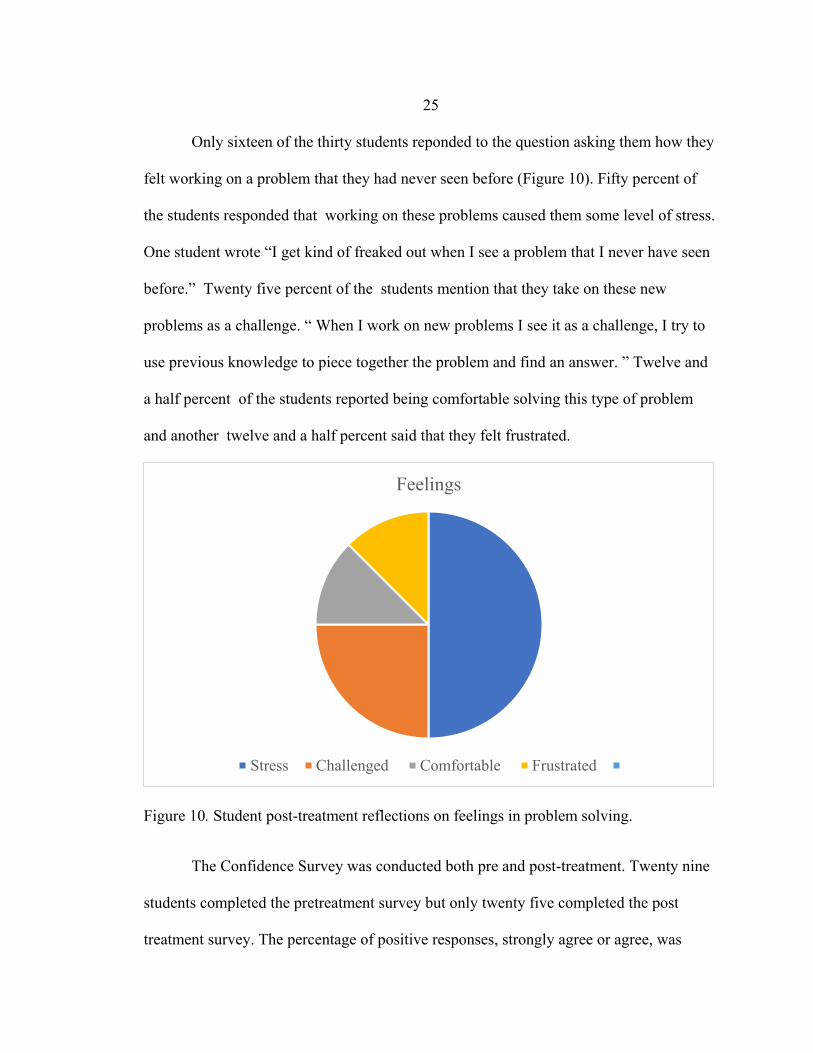
Only sixteen of the thirty students reponded to the question asking them how they
felt working on a problem that they had never seen before (Figure 10). Fifty percent of
the students responded that working on these problems caused them some level of stress.
One student wrote “I get kind of freaked out when I see a problem that I never have seen
before.” Twenty five percent of the students mention that they take on these new
problems as a challenge. “ When I work on new problems I see it as a challenge, I try to
use previous knowledge to piece together the problem and find an answer. ” Twelve and
a half percent of the students reported being comfortable solving this type of problem
and another twelve and a half percent said that they felt frustrated.
Figure 10. Student post-treatment reflections on feelings in problem solving.
The Confidence Survey was conducted both pre and post-treatment. Twenty nine
students completed the pretreatment survey but only twenty five completed the post
treatment survey. The percentage of positive responses, strongly agree or agree, was
Feelings
Stress Challenged Comfortable Frustrated
26 compared. On the first question “I feel confident and comfortable working through
problems I am unfamiliar with,” sixty two percent of the students responded positively
pretreatment and sixty percent responded positively post-treatment. This same
comparison was sixty eight percent pretreament to eighty four percent post-treatment for
the second question, “I feel confident and comfortable working through a problem even
knowing that there is a likelihood that I am not going to arrive at the correct response.”
The third question “I feel confident and comfortable working through a homework
problem on material that was not covered in class,” had a fourty five percent positive
response pretreatment and fifty two positive reponses post-treatment. Finally, sixty two
percent of the responses were positive to the fourth question “I feel confident and
comfortable when my teacher gives a problem on an assessment that is worded different
than the problems presented in class” on the pretreatment survey. On the post treatment
survey 60 percent of the responses were postive for this question.
27
CHAPTER 5
CLAIM, EVIDENCE, REASONING
Claims from the Study
The two pretreatment assignments were analyzed as baseline data before
implementation of the intervention and helped direct the focus of the study. The first
assignment helped assess the importance of continuing with the study. If there was not a
clear connection between the amount of work a student showed and their ability to
answer a question correctly the value of the study would have been in question. The
analysis of the first pretreatment assignment showed a clear connection between the
amount of work shown by the students and whether or not they arrived at the correct
answer. Students who did not show work were less likely to arrive at the correct answer.
This data gave me confidence that the study was in fact worth pursuing. The second
pretreatment assignment was used to address a common refrain heard in teachers’
meetings about students and in particular male students. The typical teenage male student
has been described in teachers’ meetings as not being as attentive to details as their
female classmates. This could account for the lack of work shown by male students. The
analysis of the second pretreatment assignment showed that neither male or female
student in my classes were less likely to show work. This indicated that the same
intervention for both male and female students could be effective.
The use of the teacher prescribed problem solving pathway did provide useful
strategies to help students solve challenging problems. This was shown by an increase in
28 the number of steps that students identified as important when solving stoichiometry
problems. Pre and Post-treatment Documented Problem Solutions were used to get
students to think about their thinking and document each step of solving a problem. Both
the mean and median steps, pre and post -treatment, that students documented were used
to show this increase. The results indicated that students were thinking about the
problem-solving process more in-depth after the treatment. Question four and five on the
Pre and Post- Treatment I Don’t Understand survey show that students were using two of
the strategies outlined in the teacher prescribed problem solving pathway much more
frequently post-treatment. Students responding with a strongly agree or agree to question
eight, identifying and writing down all the knowns and unknowns, increased by 49
percent from pre-treatment to post-treatment. Question nine, about writing a pathway or
plan to show how to get from the knowns to unknowns, also showed a large increase.
Only 15 percent of the students identified this as a strategy that they used pre-treatment
whereas sixty seven percent of the students responded strongly agree or agree post-
treatment (n=27). Finally, the two post-treatment assessments also show that students
continued to use the strategies outlined in the teacher prescribed pathway even after the
treatment period had ended. Ninety seven percent of the students continued to write down
the knowns, unknowns and any formulas on a gas law assessment one month post-
treatment.
As for the students’ confidence and attitudes regarding problem solving there was
no indication that this intervention had any impact. The percent of positive results on the
Confidence Survey for the pre-treatment questions was fifty nine and only increased to
29 sixty four post-treatment. The post-treatment reflection told a similar story. Sixty three
percent of students that wrote about their feelings when facing a problem that they had
never seen before responded in a negative way. These students reported feeling stressed
and frustrated.
Reflection on Methodology
It needs to be noted that the impact of Covid-19, the resulting long break (March
7th – April 13th) and the move to on-line learning had an impact on this capstone project.
This included a need to adjust the focus question and sub-questions. Initially I had
planned on determining if the teacher prescribed problem solving pathway would
improve student results. This was to be determined using the same pre and post-treatment
assessment. The plan was to administer a stoichiometry test pre-treatment and then again
one month post-treatment. The time gap had a twofold purpose. First, the post-treatment
assessment was going to be presented to the students as a review for their final exam.
Second, the time between assessments was hopefully going to give a more accurate
measure of the impact of the treatment. Unfortunately, once we went to on-line learning
all our assessments became open note/ open book assessments. Comparing a post-
treatment open note assessment to a pre-treatment assessment had little value. One of my
sub-questions originally was about the use of the teacher prescribed problem solving
pathway increasing the time students worked on problems. On the pre-treatment
assessment, students recorded the time that it took them to solve each problem.
Unfortunately, the time it took for students on pre-treatment questions could not be

30 compared to the post-treatment time because students had the opportunity to look through
their resources before solving each question.
Another factor that I did not account for was the constantly changing size of my
class. One of my students left after the first semester on a medical leave. More
importantly, I taught seven high level skiers who were gone on and off throughout the
winter, some of these students were not in class for weeks at a time. This made it difficult
to collect and compare data and often put in question the statistical test that I had hoped
to use to analyze the data.
Finally, I tried to collect too much data initially. I was collecting many pre-
treatment assignments and filling out Student Work Checklist. This became tedious work
and most of this data was not used in the study. This data overload could have negatively
impacted important data that I needed to collect later in the study.
Value of the Study and Consideration for Future Research
In the MSSE 504 course, Formative Assessment in Science Education the
importance of closing the loop with students was emphasized. After each classroom
assessment technique was administered teachers were encouraged to share their findings
with their students. The greatest value of conducting this study was the sharing of
information with my students. Early in the school year I explained the basic ideas behind
my study. This led to many conversations about the research that I had found on problem
solving. As a class we talked about how a successful problem solver spends more up-
front time understanding the problem than a novice problem solver. We also talked about
how the typical pathway to a solution is not always linear. A conversation about cyclical
31 pathways encouraged the students to try an approach to a problem and when it did not
work to return to the foundational concepts and try another approach. Before the first
Documented Problem Solutions was administered, we talked about metacognition. Most
of the students had never heard the word or understood the concept. Students began to
better understand what I was asking when I would say “what were you thinking here.”
Their responses became more thoughtful. When the teacher prescribed pathway was
finally introduced each part was broken down and scaffolded. For example, one step,
writing the formula, the importance of manipulating the formula without numbers was
emphasized. The power of graphing calculators allows students to skip this step but then
they often miss out on a better understanding of the relationships between the variables
and therefore some of the underlying concepts. On an assignment post treatment, I had
the students manipulate the ideal gas law to solve for density. I do not think they would
have been able to do this without the many discussions about manipulating formulas.
Finally, the students were interested to hear the results of the surveys and the themes that
developed in their reflections. All of this sharing of information took time but this time
was time well spent.
Another important value of this study was that it revealed the stress that many of
my students feel on a daily basis. In the post-treatment reflection, many students
expressed some level of stress when presented with a problem that they had never seen
before or they felt unprepared to answer. A few of the students openly wear that stress in
class but for many others it came as a complete surprise to me. Certainly, this has
reminded me to be empathetic to all learners. I am aware that until this stress is managed
32 it will be difficult to make the improvements in problem solving that I am aiming for. In
the future an increase in formative assessments may help ease some of the stress by
taking away some of the pressure to perform.
Future Research
Next year I would like to continue with this study and collect some of the data I
was unable to this year. Ultimately, I would like this process to help students become
better problems solvers. To analyze this would require pre and post-treatment assessment
data. The only information that I have on post-treatment performance was on the
assessment one-week post-treatment. The students were presented with four questions,
three of the four were similar to questions that we went over in class but the other
question was slightly different. Sixteen of the thirty students made the same mistake on
this problem. They tried to make the information in the problem fit into a type of problem
that they were familiar with leading them to use an incorrect formula. From my research
this is a common mistake made by novice problem solvers. The information from this
one question, even though it is a small data point, indicates that many of my students still
need work improving their problem-solving skills. I do think that measures of
improvement will need to be more long term. I, therefore, would like to check in with
these students next year when most of them are taking some level of physics and see how
many of them are still using all or part of the problem-solving pathway. I would also
encourage their physics teachers to use a Documented Problem Solutions assessment and
with the students’ permission I would like to analyze the data from these formative
assessments. This information would help determine a longer-term impact of the study.
33
Impact of Action Research on Author
As a teacher at a small boarding school I pride myself in knowing my students
Iwell. Unfortunately, this can cause me to make assumptions about my students. This
study, for me, showed the importance of making decisions on information not
assumptions. I had no idea how many of my students felt some level of stress when faced
with a question they did not immediatley know how to solve. As honors chemistry
students these students were some of the best in the 10th grade. I assumed that more of
these students would see novel problems as a challenge worth tackling not as a source of
stress. When students left a homework problem blank I assumed that it was because they
were being lackadaisical and saying that they didn’t understand was an easy excuse. The
data from the post treament reflection and follow up conversations gave me this
important information. Now I am tasked with how to best make changes based on this
information.

34
REFERENCES CITED
35 Angelo, T. & Cross, K. (1993). Classroom Assessment Techniques: A Handbook for College Teachers. San Francisco, CA: Jossey-Bass. Blum, W. & Niss, M. (1991). Applied mathematical problem solving, modeling, applications, and links to subjects-state, trends and issues in mathematics instruction. Educational Studies in Mathematics, 22(1), 37-68.
Bodner, G.M. (1987). The role of algorithms in teaching problem-solving. Journal of Chemical Education, 64, 513-514.
Bodner G. M. & Herron J. D. (2002). Problem-solving in chemistry, In Gilbert J. K., De Jong O., Justi R., Treagust D. F. and Van Driel J. H. (Ed.), Chemical education: towards research- based practice, 235-266, Dordecht: Kluwer.
Cook, E. & Cook, R. Cross-proportions: A conceptual method for developing quantitative problem-solving skills. Journal of Chemical Education, 82(8), 1187- 1189.
DiLisi, G, A., Eulberg, J, E., Lanese, J, F., & Padovan, P. (2006). Establishing problem- solving habits in introductory science courses. Journal of College Science Teaching. 35(5), 42-47.
Gulacar, O. & Fynewever, H. (2010). A research methodology for studying what makes some problems hard to solve. International Journal of Science Education, 32(16), 2167-2184.
Hayes, J. (1980). The Complete Problem Solver. Philadelphia: The Franklin Institute.
Hewitt, P. (2008) Show that: A better framework for problem solving. The Science Teacher, 75(2), 58-61.
Hewitt, P. (2006). Problems without numbers-at first. The Science Teacher. 73(5), 40-42.
Ince, E. (2018). An overview of problem solving studies in physics education. Journal of Education and Learning, 7(4), 191-200.
Johnstone, A. H., & El-Bana, H. (1989). Understanding learning difficulties: A predictive research model. Studies in Higher Education, 14(2), 159–168.
Polya, G. (1957). How To Solve It: A New Aspect of Mathematical Method. Princeton, NJ: Princeton University Press.
36 Tsaparlis, G. (1998). Dimensional analysis and predictive models in problem solving. International Journal of Science Education, 20(3), 335–350.
Yuriev, E., Naidu S., Schembri L.S., & Shor, J.L. (2017). Scaffolding the development of problem- solving skills in chemistry: Guiding novice students out of dead ends and false starts. Chemistry Education and Research, 18, 486-504.

37
APPENDICES
38
APPENDIX A
INSTITUTIONAL REVIEW BOARD EXEMPTION
39

40
APPENDIX B
BLANK STUDENT WORK CHECKLIST
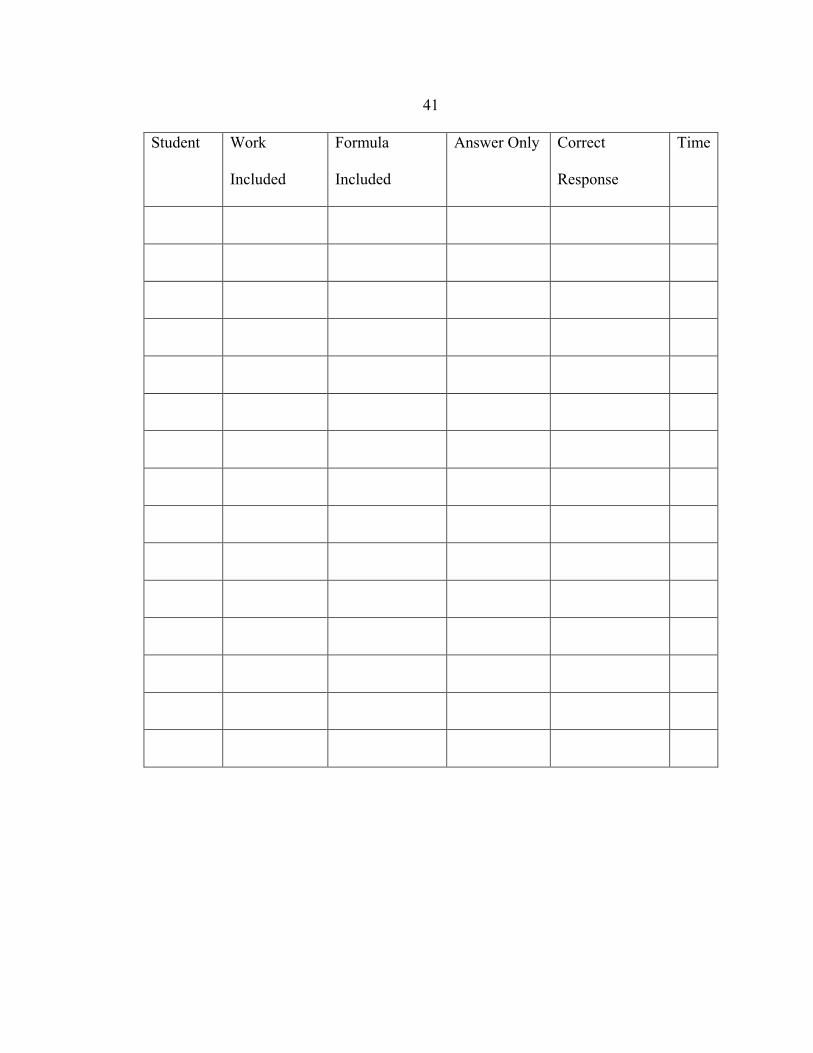
41 Student Work
Included
Formula
Included
Answer Only Correct
Response
Time
42
APPENDIX C
CONFIDENCE SURVEY

43
44
45
46
APPENDIX D
I DO NOT UNDERSTAND SURVEY
47
48
49
50
APPENDIX E
POST-TREATMENT STUDENT REFLECTION QUESTIONS
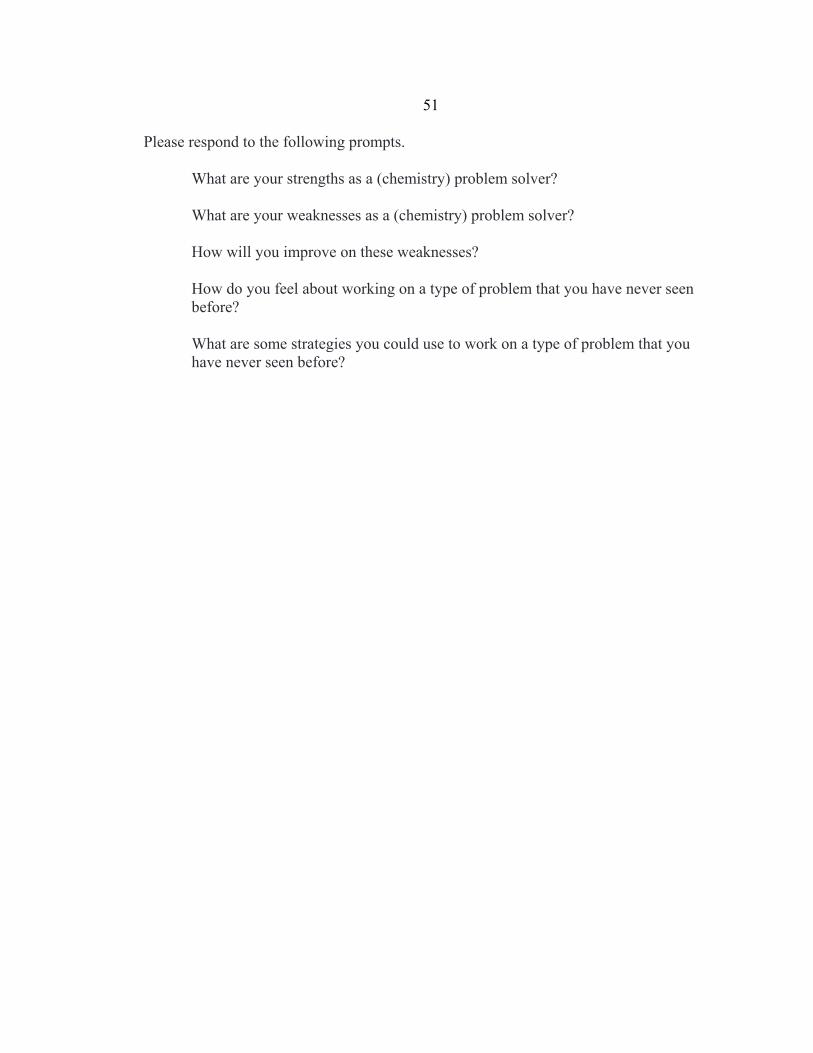
51 Please respond to the following prompts.
What are your strengths as a (chemistry) problem solver?
What are your weaknesses as a (chemistry) problem solver?
How will you improve on these weaknesses?
How do you feel about working on a type of problem that you have never seen before?
What are some strategies you could use to work on a type of problem that you have never seen before?