Embed Size (px)
Citation preview

How important are mobile broadband networks for global economic
development?
Harald Edquist, Peter Goodridge, Jonathan Haskel, Xuan Li and Edward Lindquist
Discussion Paper 2017/05 June 2017

How Important Are Mobile Broadband Networks for the
Global Economic Development?
By
Harald Edquist*, Peter Goodridge**, Jonathan Haskel***, Xuan Li**** and Edward
Lindquist*****
May 24, 2017
Abstract
Since the beginning of the 21st century mobile broadband has diffused very
rapidly in many countries around the world. This paper investigates to what
extent the diffusion of mobile broadband has impacted economic
development in terms of GDP. The results show that there is a significant
effect from mobile broadband on GDP both when mobile broadband is first
introduced and gradually as mobile broadband diffuses throughout different
economies. Based on a two stage model we are able to conclude that on
average a 10 percent increase of mobile broadband adoption causes a 0.6–2.8
percent increase in economic growth depending on the model specifications.
JEL Codes: F62; O11; O33; O47
Keywords: ICT, Mobile broadband, Economic growth, Instrumental variables
* Corresponding author: Harald Edquist, Ericsson Research, Färögatan 6, SE-164 80, Stockholm, Sweden.
Email: [email protected]. **
Peter Goodridge, Imperial College Business School, Imperial College, London SW7 2AZ, United Kingdom.
Email: [email protected] ***
Jonathan Haskel, Imperial College Business School, Imperial College, London SW7 2AZ, United Kingdom.
Email: [email protected] ****
Xuan Li, ISS Ethix AB, Stureplan 4C, SE-114 35, Stockholm, Sweden. E-mail: [email protected] *****
Edward Lindquist, Business Sweden, Klarabergsviadukten 70, SE-111 64, Stockholm, Sweden.
Email: [email protected]
1
1. Introduction
We are currently experiencing a technological revolution based on ICT. One of the major
innovations within ICT, during the last decade, is the use of mobile broadband. According to
GSMA (2017) mobile broadband connections have increased from approximately 27 000 in
2001 to 4 138 464 810 in 2016 i.e. an average growth of 122 percent per year.1 Moreover, the
use of data being sent via mobile networks has been increasing exponentially at
approximately 65 percent on a year-on-year basis during the period, 2010–2015 (Ericsson
mobility report 2016; Coyle and Williams 2011).
Previous research has shown that ICT has had a large economic impact in many countries
(Brynjolfsson and Hitt 2003; Oliner and Sichel 2000; Röller and Waverman 2001). However,
most of these studies have focused on established technologies such as fixed telephone lines
and computers. Only a handful of studies have focused on mobile technologies (see for
example Gruber and Koutroumpis 2011). As more data becomes available it has become
increasingly easy to also study the impact of newer technologies. This paper investigates the
macroeconomic impacts of mobile broadband based on econometric methods applied to a
cross-country panel data set. The primary questions that will be investigated are:
To what extent has mobile broadband affected macroeconomic development in terms
of GDP globally?
If there is an impact from mobile broadband, is it a one-time effect of mobile
broadband introduction and/or a gradual process along mobile broadband penetration?
The paper shows that mobile broadband is associated with GDP. Introducing a dummy
variable for mobile broadband introduction in a difference-in-difference specification, there is
evidence of an introductory effect from mobile broadband. Moreover, there is also a
contemporaneous effect from mobile broadband penetration, though it is initially not
significant once we control for capital and labor. Furthermore, based on moving averages, we
find stronger and larger effects from five-year differences compared to first differences. This
is an indication that a lagged effect from mobile broadband penetration on GDP also exists.
1 GSMA (2017) defines mobile broadband connections as SIM cards registered on a mobile network in a device
capable of download speeds of 256 kb/s or greater, including 3G (e.g. WCDMA, HSPA) and 4G (e.g. LTE,
WiMAX) network technologies.

2
Based on a two stage model controlling for simultaneity and reverse causality, we find strong
evidence that mobile broadband introduction and penetration causes GDP growth rather than
vice versa. The results suggest that a 10 percent increase in mobile broadband penetration
causes a 0.6–2.8 percent increase in GDP, depending on the specification of the model. .
Moreover, there is a significant effect from lagged mobile broadband penetration, indicating
that the full effect from mobile broadband infrastructure may take time before being properly
realized.
The paper is organized as follows. In section 2 we summarize findings from earlier research
and position our study in the current literature. In section 3 we present the methodological
framework, in section 4 we describe the data, in section 5 and 6 we present our results based
on both a fixed effect and an instrumental variable approach. Section 7 provides robustness
checks and section 8 concluding remarks.
2. Related Literature Throughout, the 1980s it was unclear to many economists to what extent information and
communication technology (ICT) impacted economic growth at the macro level (Solow
1987). However, ever since economic and productivity growth took off in the US economy in
the mid-1990s, there have been a plethora of studies showing links between ICT and
economic development (see for example Oliner and Sichel 2000; Jorgenson et al. 2008;
O’Mahony and Vecchi 2005; van Ark et al. 2008). Most of these studies focused on ICT
generally, while the impact of different ICT-technologies was less emphasized.
In the 1980s, fixed telephones were already found to have strong contribution to economic
development (Hardy 1980). Moreover, Röller and Waverman (2001) found evidence of a
significant positive causal link from telecommunication infrastructure on aggregate output,
based on data in 21 OECD-countries spanning from 1970–1990. Similar results were found
by Datta and Agarwal (2004).
Based on the growth accounting framework, Corrado (2011) found that communication
equipment capital deepening accounted for 7 percent of labor productivity growth in the US
non-farm business sector in 1995–2007. Moreover, Goodridge et al. (2014) estimated that the

3
contribution from communication equipment to value added growth in the UK was 5 percent
(i.e. 0.11 percentage points per annum) from 2005–2008.
A few studies have taken a more focused approach looking at mobile communication.
Waverman et al. (2005) found that mobile telephony had a positive and significant impact on
growth in developing countries. Moreover, Gruber and Koutroumpis (2011) investigated the
contribution from mobile telecommunication infrastructure to economic growth from 1990–
2007. Their findings showed that investment in mobile telecommunication infrastructure had
a considerable contribution to economic and productivity growth.
Since the mid-2000s the speed of uploading and downloading data from mobile devices has
increased tremendously. The increase in data traffic was 65 percent per year from 2010–2015
(Ericsson mobility report 2016). The basis for this development has been the introduction and
expansion of 3G and 4G mobile network systems and the development of smartphone
devices.
Thus far little is known about the economic impact of mobile broadband however several
papers have investigated the relationship between fixed broadband and economic growth.
Czernich et al. (2011) found that after a country has introduced fixed broadband, GDP per
capita was between 2.7 and 3.9 percent higher on average than before introduction. Moreover,
a 10 percentage point increase in broadband penetration was associated with increased annual
per capita growth of 0.9 to 1.5 percentage points.
Qiang and Rossotto (2009) found that fixed broadband penetration was associated with an
increase in GDP per capita of 1.2 and 1.4 percent in developed and developing countries,
respectively. Based on different specifications Koutroumpis (2009) found broadband
penetration to have a significant impact on GDP growth ranging from 0.3 to 0.9 percent in 15
EU-countries. Rohman and Bohlin (2012) also found that a doubling of broadband speed
contributed 0.3 percentage points to growth compared with growth in the base year.
Williams et al. (2012) is one of the few studies thus far that has investigated the impact of 3G
penetration on economic growth. Their findings showed that for a given level of total mobile
penetration, a 10 percent substitution from 2G to 3G increases GDP per capita growth by 0.15

4
percentage points. Williams et al. (2012) also showed that a doubling of mobile data use,
results in a 0.5 percentage points increase in GDP per capita.
3. Methodology
3.1 Production function framework
The model applied in this paper is based on the framework of the neoclassical production
function. The production function framework relates output to labor, capital, intermediate
inputs and TFP. In this paper we measure output as GDP (value added). Assuming an
augmented Cobb-Douglas production function, we have the following equation:
𝑌𝑖,𝑡 = 𝑇𝐹𝑃𝑖,𝑡𝐾𝑖,𝑡𝛽𝐾𝐿𝑖,𝑡
𝛽𝐿 (1)
where Yi,t is real value added, Ki,t is capital services, Li,t is labor input and TFP is Hicks-
neutral total factor productivity, all for country i at time t.
By taking natural logarithms of equation (1) we have:
ln 𝑌𝑖,𝑡 = 𝛽𝐾 ln 𝐾 𝑖,𝑡 + 𝛽𝐿 ln 𝐿𝑖,𝑡 + ln 𝑇𝐹𝑃𝑖,𝑡 (2)
where β represents the output elasticity of each input.
3.2 Econometric specification
The specification is based on the production function framework presented in section 3.1. In
addition, we have also added a measure of human capital as a control variable. Thus, in order
to test whether there is a direct impact when mobile broadband is introduced we use the
following econometric specification:
ln 𝑌𝑖,𝑡 = 𝛽0+𝛽𝐼𝐷𝑖,𝑡 + 𝛽𝐾 ln 𝐾 𝑖,𝑡 + 𝛽𝐿 ln 𝐿𝑖,𝑡 + 𝛽𝐻𝐾 ln 𝐻𝐾𝑖,𝑡 + 𝜕𝑡𝑇𝑡 + (𝑎𝑖 + εi.t) (3)
where Yi,t is real value added in chained PPPs (in million 2011 US$), Di,t is a dummy variable
denoting the introduction of mobile broadband. Ki,t is capital input measured as an index of
capital services (in million 2011 US$), Li,t is labor input measured as persons engaged (in
millions) and HKi,t is a measure of human capital based on years of schooling and returns to
education.

5
Tt is a set of year dummy variables included in order to control for economic shocks. These
time dummies take out the average variation over time and allow identification of the the
production function parameters through the cross-sectional variation. Finally, ai is a set of
unobserved country specific effects and εi,t is the error term.
In order to include a dummy variable when mobile broadband is introduced in a country we
follow rules used by Czernich et al. (2011). Thus, the introduction year is set as the year when
the penetration rate reaches one percent. More specifically, a dummy variable equals one if
the penetration rate is greater than or equal to 1 percent. Japan and South Korea were the first
countries to reach reach a penetration rate of more than one percent in 2003. However, using
the one percent penetration rate as a threshold for introduction might seem arbitrary;
therefore, we also introduced a five percent penetration level as an additional threshold.
The idea behind the preceding specification is that there is a permanent shift in GDP once
mobile broadband has been introduced. This could be explained by the effect from early
adopters, but also from the increase of large initial investments due to mobile broadband roll-
out. However, mobile broadband may also positively affect economic growth by continuously
spurring innovation processes (Czernich et al. 2011). In order to estimate the continuous
effect of mobile broadband penetration, we replace the dummy variable of mobile broadband
introduction with a continuous variable of mobile broadband penetration rate:
ln 𝑌𝑖,𝑡 = 𝛽𝑀𝐵 ln 𝑀𝐵𝑖,𝑡 + 𝛽𝑌𝐼𝑌𝐼𝑖,𝑡 + 𝛽𝐾 ln 𝐾 𝑖,𝑡 + 𝛽𝐿 ln 𝐿𝑖,𝑡 + 𝛽𝐻𝐾 ln 𝐻𝐾𝑖,𝑡 + 𝜕𝑡𝑇𝑡 + (𝑎𝑖 + εi.t)
(4)
where MBi,t is mobile broadband connections expressed as a percentage of total connections.
Moreover, we also include an additional control variable YIi,t showing the number of years
since mobile broadband was introduced. This variable then accounts for faster diffusion in
countries that introduce broadband later. According to Gerschenkron (1952) “relative
backwardness” may facilitate economic growth, since it is easier to imitate the technologically
leading countries.
4. Data The data used in this paper has been collected from a number of different sources. Data on
GDP, employment and human capital were retrieved from the Penn World Tables (Feenstra et

6
al. 2015). The Penn World Table publishes different GDP series (see Feenstra et al. 2015).
This paper uses a measure where the level of GDP have been constructed based on multiple
PPP benchmark years and therefore correct for changing prices between these benchmarks.
Feenstra et al. (2015) argue that this measure offers the best cross-country and time-series
comparisons of real GDP.2
Employment is measured in terms of persons engaged and therefore includes both employees
and self-employed. Human capital is an index based on the average years of schooling and an
assumed rate of return to education around the world.
An index of capital services was constructed based on the Penn World Tables and the Total
Economy Database (Conference Board 2015).3 The capital services index was constructed
using a capital stock benchmark for the base year 2011 and then multiplying with the yearly
growth rates of total capital services.
Data on mobile broadband penetration was retrieved from the GSMA Wireless Intelligence
Database (GSMA 2017) and is available for the years 2002–2014. The data consists of the
mobile broadband connections expressed as a percentage of total connections. Mobile
broadband connections represent SIM cards registered on the mobile network in a device
capable of download speeds of 256 kb/s or greater, including 3G (eg WCDMA and HSPA)
and 4G (eg LTE, WiMAX) network technologies. The difference between connections and
subscribers is that one subscriber can have multiple connections. Moreover, the penetration
rate in each country before the introduction of mobile broadband is denoted as missing values
in the GSMA database, but the real meaning of these missing values is that they are too small
to be recorded. Thus, we replace the initial missing value with number zero.
In order to deal with simultaneity issues, we use data on fixed internet users per 100
inhabitants and mobile cellular telephone subscriptions per 100 inhabitants in the year 2002
2 An alternative method to estimate GDP across countries and time is to use one PPP benchmark year and then
project backward and forward in time by using national accounts data. This method has been criticized by
Johnson et al. (2013), showing that estimates vary substantially across different versions of the Penn World
Tables with greater variability the farther the estimate is from the benchmark year. In section 7, we test the
robustness of our results based on the alternative method of measuring GDP across countries and time. 3 The Total Economy Database (Conference Board 2015) presents data for capital services for ICT and non-ICT
capital. This data has been aggregated. However, for a number of countries data was missing for ICT-capital
services. It was then assumed that the share of ICT capital for these countries was 0, implying that the total
capital services variable equals the non-ICT capital services variable.

7
(see section 6). Data for these indicators in 2002 are based on the World
Telecommunication/ICT Indicators database (International Telecommunication Union 2015).
Moreover, we also use data on fixed broadband subscriptions per 100 inhabitants to test the
robustness of our results.
Table 1 shows descriptive statistics of the variables used throughout the analysis. It shows that
both GDP and capital services vary considerably between countries. Already in 2002, mobile
phone subscriptions per 100 inhabitants had reached 110 (in Taiwan). Moreover, the
maximum value of mobile broadband penetration (as a percent of total connections) is 99 (for
South Korea).
5. Results and discussion A fixed effects (FE) model controls for or partials out the effects of the country specific
components. An alternative to the fixed effects model is the random effects (RE) model which
is used when variation across countries is assumed to be random and not correlated with the
dependent and independent variables in the model. Based on a Hausman test we reject the
hypothesis that the random effects model is most appropriate and instead conclude that the
fixed effects model is most appropriate.4
Fixed effects estimation can be based on different statistical techniques. We will use two
methods. The first method is within-groups regression, where the mean values of the
variables in the observations of a given country are calculated and subtracted from the
data of that country. This removes the unobserved effect. The model explains the variation
around the mean of the dependent variable in terms of the variations around the means of
the explanatory variables for the group of observations for a given country. The second
method takes the first difference of equation (4), which also removes the unobserved
industry-specific effects.5
4 The Hausman test for the fixed and random effects model including time specific effect gives a statistic of
97.92 with a Prob>chi2 = 0.0000. Thus, we reject the hypothesis that the random effects model is most
appropriate and instead conclude that the fixed effects model is most appropriate. 5 Based on data over two years the within group estimation and first differences are identical. When more than
two years are analyzed the two methods do not yield the same results but they are both unbiased estimators under the underlying coefficient vector. However, when there is no serial correlation of the idiosyncratic errors, within group estimation is most efficient. If the error terms follow a random walk process, then first differencing is more efficient (Wooldridge 2009).

8
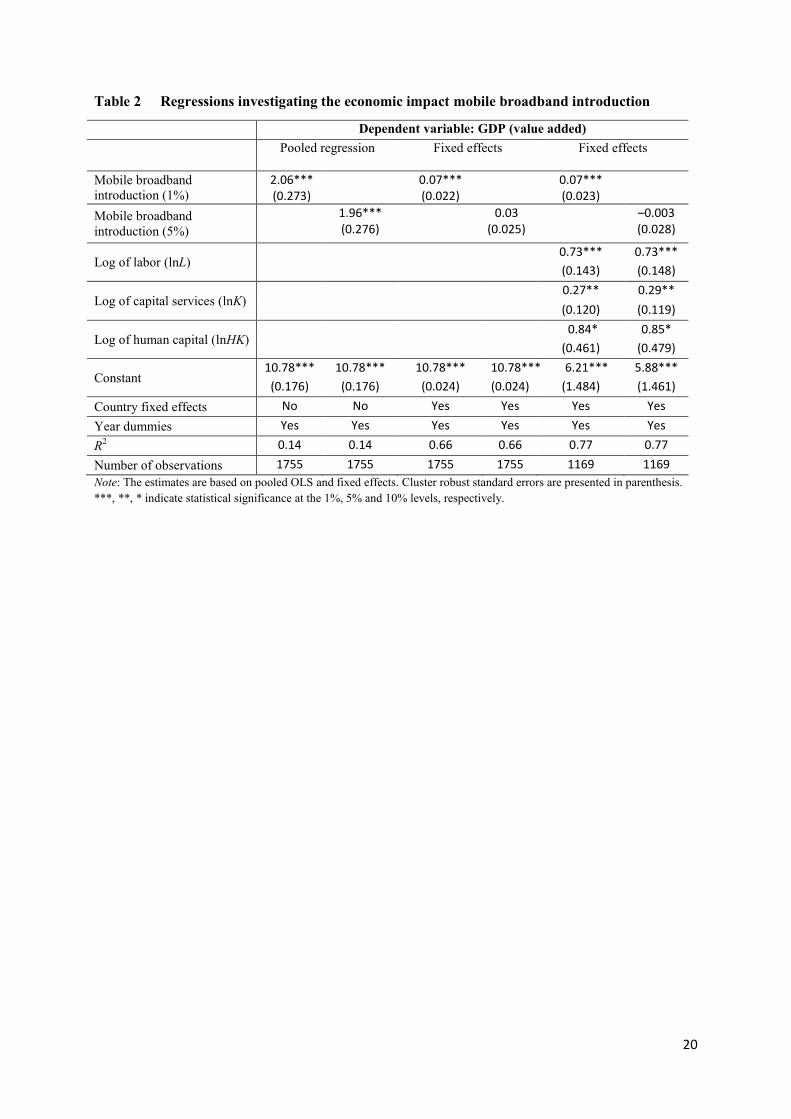
Table 2 shows the results for the introduction of mobile broadband for countries with no
missing values for either mobile broadband or GDP. The results show that there is a positive
and significant association between the introduction of mobile broadband at a 1 percent level
based on both OLS and fixed effects regressions. The coefficients decrease in magnitude, but
are still highly significant once we control for labor, capital services and human capital. Thus,
an introduction of mobile broadband in a country is associated with an increased GDP growth
of approximately 0.1 percent. At the threshold of 5 percent the coefficients are insignificant
once controlling for country fixed effects and additional inputs of capital and labor. Thus,
there is evidence of an introduction effect from mobile broadband. One possible explanation
could be that this effect is driven by large initial investments when mobile broadband is first
rolled out, which in turn affects GDP.
Table 3 shows the association between the continuous mobile broadband variable and GDP.
The coefficient is quite large based on pooled OLS estimation, but becomes considerably
smaller once country fixed effects are introduced into the model. Moreover, the coefficient
remains highly significant when we include labor, human capital and capital services in the
regression and control for the number of years since mobile broadband was introduced at the
threshold of one percent. However, the coefficient becomes insignificant once we use the
threshold of 5 percent.
An additional method that can be used to estimate the impact of mobile broadband is to use
first differences. This method also removes the unobserved country specific effects. The new
equation can be written:
∆ln 𝑌𝑖,𝑡 = 𝛽𝑀𝐵 ∆ln 𝑀𝐵𝑖,𝑡 + 𝛽𝐾∆ ln 𝐾 𝑖,𝑡 + 𝛽𝐿∆ ln 𝐿𝑖,𝑡 + 𝛽𝐻𝐾 ∆ln 𝐻𝐾𝑖,𝑡 + 𝛿𝑡 + 𝑣i.t (5)
where δt are year dummies, which capture common economic shocks, and vi,t is the
differenced residual.
Table 4 shows the estimated regression based on first differences. Mobile broadband
penetration is positive and significant at the 10 percent level. The results imply that on
average a 10 percent increase in mobile penetration is associated with a 0.1 percent increase
in GDP growth. Labor and capital services are still positive and highly significant.

9
Once we introduce longer differences based on 3-years and 5-years moving averages of the
growth rates, we find that the change in mobile broadband penetration is associated with GDP
at the 1 percent level. Brynjolfsson and Hitt (2003) found that the returns of computers
increased when long term differences were introduced. These findings were based on firm
level data and the suggested interpretation was that the observed contribution of
computerization would be accompanied by relatively large and time consuming investments
in complementary inputs, notably organizational capital. Since similar results are found for
mobile penetration, it seems likely that the effects from mobile broadband are also tied to
investments in other intangibles such as training and organizational capital.
6. Instrumental variable approach
6.1 Simultaneity One of the main critiques of estimating the impact from ICT based on fixed effects models is
that ICT can be considered both a driver and a result of GDP growth. The methods used thus
far have determined a correlation rather than a causal effect of mobile broadband introduction
and penetration on GDP growth. If one or more of the explanatory variables are determined
jointly with the dependent variable it is known as simultaneity bias. This implies that the
explanatory variable that is determined simultaneously with the dependent variable will be
correlated with the error terms, which means that the fixed effects model will not provide an
appropriate estimator.
One way of addressing simultaneity is by using instruments that are correlated with the
explanatory variable but not with the error term. Some of the instruments proposed from
earlier studies are tax credit for ICT investment and specific types of housing (Abramovsky
and Griffith 2006; Dettling 2013). However, none of these instruments are available across
countries.
In this article, identification of instruments relies on the nature of mobile broadband. Mobile
broadband networks are designed for accessing the Internet on mobile phones or computers
anywhere and at anytime. Thus, the number of mobile broadband connections is closely
related to the number of mobile phone subscribers and computer users. Prior to the

10
introduction of mobile broadband in many countries, the penetration of computers had already
reached a saturation point and construction of mobile phone infrastructure had been
completed in many countries. However, customers were still buying mobile phones and
computers to replace traditional cellphones with smartphones and old computers with new
fancier laptops and tablets.
Mobile broadband networks (primarily 3G and 4G) were constructed along the existing base
stations for mobile telephony by upgrading or modifying the pre-existing cellular
infrastructure. This implies that a country with better 2G cellular network is likely to have a
higher adoption rate of mobile broadband. Thus, the pre-determined adoption rate of
computers and mobile phones can effectively predict the diffusion trajectory of mobile
broadband. Therefore, it is possible to model the maximum penetration of mobile broadband
as a linear function of the diffusion of mobile phone infrastructure and personal computers
before the diffusion of mobile broadband:
𝛾𝑖 = 𝜃0 + 𝜃1𝑀𝑜𝑏𝑖𝑙𝑒𝑃ℎ𝑜𝑛𝑒𝑖0 + 𝜃2𝐼𝑛𝑡𝑒𝑟𝑛𝑒𝑡𝑖0 (6)
where i is the maximum penetration level in country i. MobilePhonei,0 is mobile phone
penetration, measured as mobile-cellular telephone subscriptions per 100 inhabitants in 2002
and Interneti,0 is the diffusion of computers proxied by fixed Internet users per 100 inhabitants
in 2002. Both indicators are gathered from the International Telecommunication Union
(2015).
The model used is based on a logistic form of S-shaped diffusion curve that was first
introduced in economic analysis by Griliches (1957) and is also applied by Czernich et al.
(2011) to analyze the economic impact of fixed broadband. It suggests that the diffusion of
new technology follow an S-shaped curve and approaches its maximum penetration level
eventually, which is best described through a logistic curve of the following form:
𝑀𝑜𝑏𝑖𝑙𝑒𝐵𝑟𝑜𝑎𝑑𝑏𝑎𝑛𝑑𝑖𝑡 =𝛾𝑖
1+𝑒𝑥𝑝[−𝛽(𝑡−𝜏)]+ 휀𝑡 (7)
where MobileBroadbandit is mobile broadband penetration rated in country i at year t. i is the
same as in equation (6) i.e. a country-specific and time-invariant parameter that determines

11
the maximum penetration of mobile broadband when t approximates infinity. Both and are
invariable across countries and determine the diffusion speed and the inflection point of the
diffusion process, respectively. At the inflection point , the diffusion curve has its maximum
growth rate /2. t is the error term. By substituting i in equation (7) with equation (6), we
obtain a non-linear first stage model.
6.2 First stage results
The first stage least squares model is estimated based on non-linear least squares. Table 5
shows the results of the full sample. The coefficients for cell phone and fixed Internet
penetration in 2002 remain significant at the 1 percent level for all models. Thus, pre-
determined cell phone penetration and fixed Internet usage have positive effects on the
saturation level i in the mobile diffusion curve. The inflection point is determined to be
around 2010 which seems probable. In total, the estimated model provides a very good fit of
the broadband diffusion process across countries.
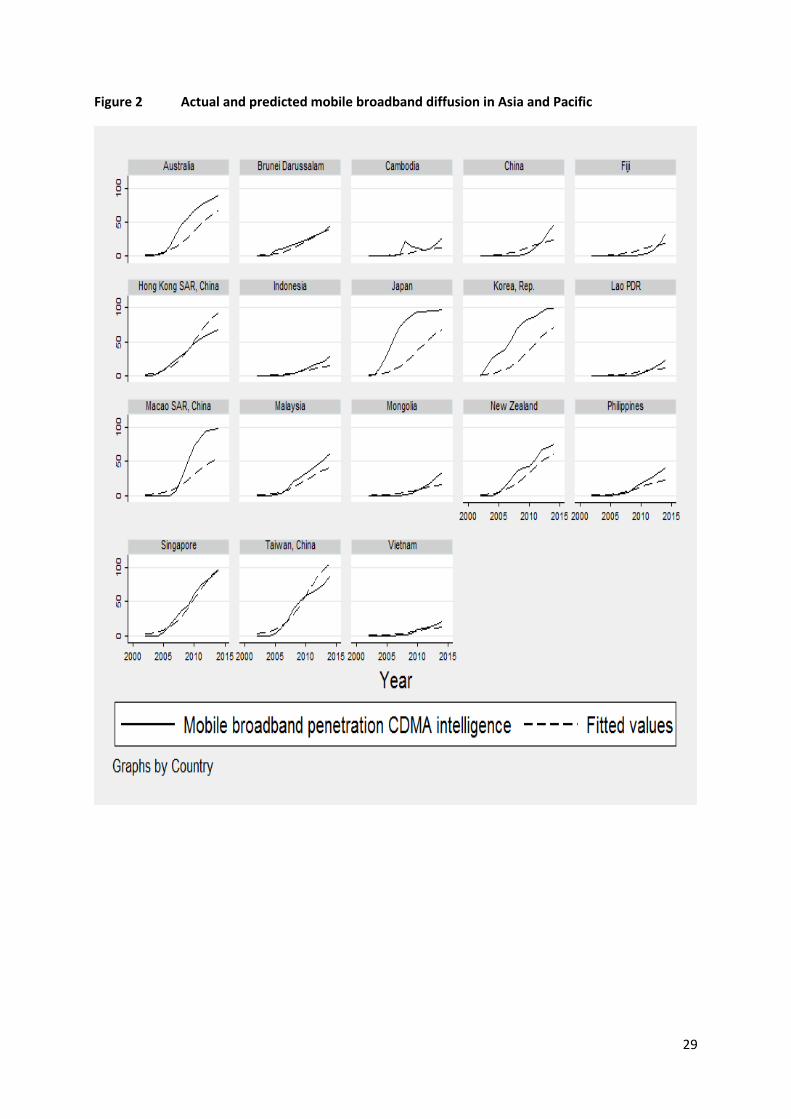
Figures 1–6 plot the actual and fitted values of broadband penetration rate over time for the
135 different countries categorized by region. Almost all countries exhibit a logistic curve of
mobile broadband diffusion. For most countries the fitted line for mobile broadband diffusion
tracks the actual line closely. In a few countries such as Japan, Macao and South Korea, there
is a clear divergence of the predicted values from the actual trajectory. In general, there is no
shared pattern of the occurrence of deviation, which implies that the first-stage model is not
biased towards any specific direction. Hence, it is likely to be a reflection of heterogeneity
across countries. Moreover, it is also evident that many European countries are at a later state
of mobile broadband adoption compared to most countries in Africa and Asia.
6.3 Second stage results The first stage estimation predicted the diffusion process of mobile broadband based on cell
phone and fixed Internet penetration levels in 2002. The second stage uses the fitted values of
mobile broadband penetration rate and the predicted years of introduction based on the first
stage regression in order to estimate the causal effect of mobile broadband on GDP. Standard
12
errors in the second stage are bootstrapped (500 repetitions) since the independent variable
was predicted by the first-stage estimation.6
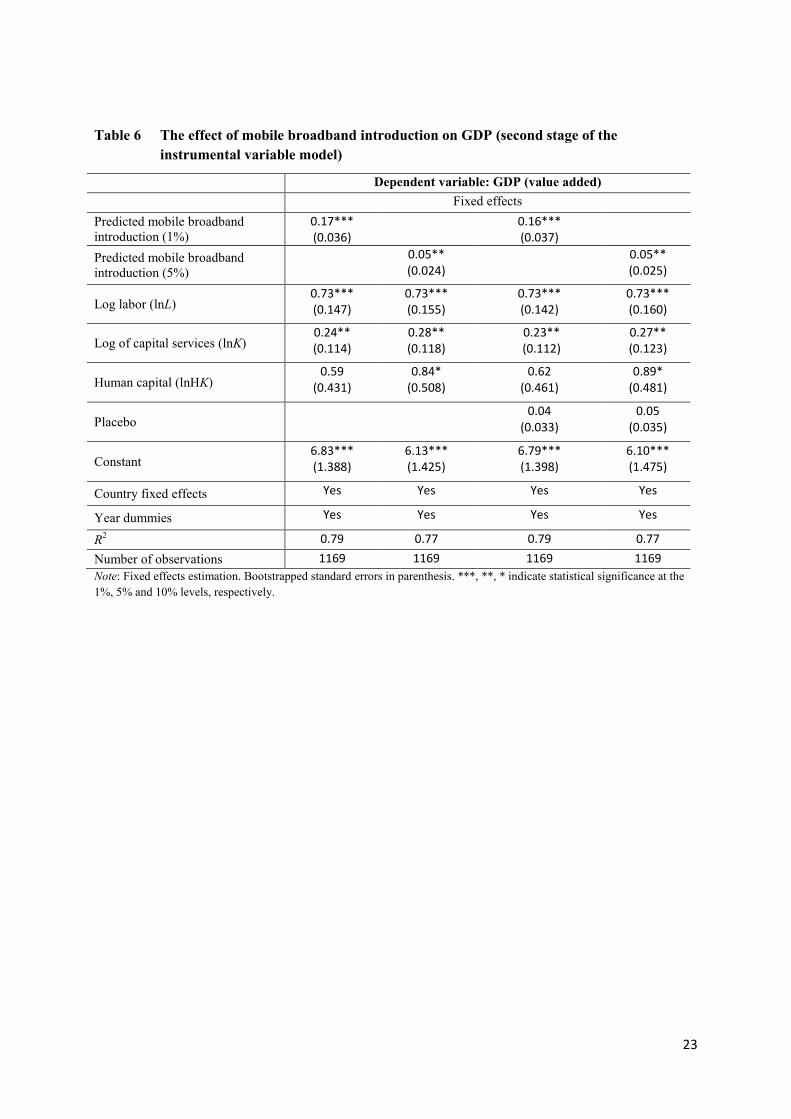
Table 6 shows the effect of mobile broadband introduction at both the one and five percent
threshold. The results show that there is a strong significant effect from mobile broadband
introduction at the 1 percent threshold. Thus, after reaching a mobile broadband penetration
rate of 1 percent, a country would experience an increase in GDP of 0.17 percent. Table 6 also
includes a placebo dummy, which equals one, three years before predicted mobile broadband
introduction reaches the 1 percent penetration threshold. The placebo dummy is insignificant,
implying that there is no effect three years before mobile broadband was introduced.7
Table 7 presents results based on the predicted mobile broadband penetration rate. The results
imply that mobile broadband penetration has a statistically significant positive effect on GDP.
Thus, a 10 percent increase in the mobile penetration rate causes GDP to increase by 0.6–2.8
percent depending on whether we control for the number of years since introduction of mobile
broadband. Moreover, the one and two year lagged coefficients remain highly significant.
This is an indication that the effect from mobile broadband is not only contemporaneous, but
also has a long term effect on economic development.
7. Robustness
As discussed in section 4, the Penn World Table publishes different GDP series. The
regressions in this paper is based on GDP with multiple PPP benchmark years. Feenstra et al.
(2015) argue that this measure offers the best cross-country and time-series comparisons of
real GDP. Nevertheless, the Penn World Table also publishes an alternative measure of GDP
based on PPP benchmark only for the year 2011 and then projected backward and forward in
time by using national accounts data.
6 Bootstrapping provides a way of estimating standard errors when no formula is otherwise available or when
available formulas make inappropriate assumptions. It implies drawing N observations with replacement from
the original sample data. Using the resampled dataset, it is possible to apply the estimator and collect the
statistics. This process is repeated many times. 7 The placebo dummy is significant if it is introduced 1–2 years before mobile broadband penetration reaches the
1 percent threshold. This could be an indication that mobile broadband introduction has an effect in GDP already
before it reaches the one percent threshold.

13
We test the robustness of our results by conducting similar regressions based on the GDP
series with only one benchmark year. In general, the results are robust. Table 8 shows the
second stage results based on the predicted mobile broadband penetration rate and the
alternative GDP series. The coefficients are generally smaller but still significant. Thus, a 10
percent increase in the mobile penetration rate causes GDP to increase by 0.3–1.7 percent. 8
The mobile broadband introduction dummy and penetration rate predicted by the first stage
estimation are both theoretical approximations to the true diffusion process. The first stage
estimation confirms that the cell phone and fixed Internet coverage in 2002 places a limit on
the maximum reach of mobile broadband. But the predicted mobile broadband penetration
may also be correlated with the diffusion of fixed broadband. In order to control for this effect
we also introduce a variable of fixed broadband, measured as subscribers per 100 inhabitants,
into the regressions.9
Table 9 shows estimations of the impact from predicted mobile broadband penetration once
we also control for actual fixed broadband penetration. Without controlling for the year since
mobile broadband introduction, the coefficient of predicted mobile broadband penetration
becomes insignificant. However, it becomes significant at the 1 percent level once we control
for the number of years since mobile broadband introduction. Moreover, the lagged
coefficients are also highly significant, indicating that part of the effect on GDP from mobile
broadband penetration comes with a lag.
Finally, mobile broadband penetration is measured as the share of mobile connections in total
connections. An alternative measure would be to relate mobile broadband to the population in
each country. We find that our results are robust, once we measure mobile broadband
penetration as mobile broadband connections per 100 inhabitants. Table 10 shows the second
stage results based on mobile connections per 100 inhabitants. The results show that a 10
percent increase in mobile connections per 100 inhabitants causes GDP to increase by 0.5–2.1
percent.
8 One result that differs based on the GDP series with only one benchmark year is that the estimated
coefficients based on moving averages over three and five years become insignificant. 9 Data on fixed broadband subscribers per 100 inhabitants is based on the International Telecommunication
Union (2015).

14
8. Conclusions A number of different studies have shown that ICT is closely connected to macroeconomic
development in terms of GDP. Most of these studies have focused on ICT as a whole or
established technologies such as fixed telephone lines and computers. This paper investigates
the effect of a much more novel technology, namely that of mobile broadband, on GDP.
Mobile broadband is measured as a percentage of total connections. Mobile broadband
connections are defined as SIM cards registered on mobile network in a device capable of
download speeds of 256 kb/s or greater, including 3G (e.g. WCDMA, HSPA) and 4G (e.g.
LTE, WiMAX) networks technologies.
The paper first uses pooled and fixed effects estimation techniques to measure the impact of
mobile broadband. The results show that the introduction of mobile broadband is associated
with increases in GDP. Possible explanations are the effect from early adopters, as well as
large increased initial investments due to mobile broadband roll-out. Moreover, there is also a
contemporaneous effect from mobile broadband. However, estimations based on moving
averages find a larger effect based on a five-year differences compared to first differences.
This is an indication that a lagged effect from mobile broadband penetration exists. One
possible explanation is that complementary investments in intangibles are necessary before
the full effect of mobile broadband networks can be realized.
A major concern when interpreting the results based on pooled and fixed effect models is that
of simultaneity bias i.e. mobile broadband can be considered both a driver and a result of
GDP growth. We address this potential bias with an instrumental variable (IV) approach.
Mobile broadband networks were constructed along the existing base stations for mobile
telephony by upgrading the pre-existing cellular infrastructure. Thus, it is possible to model
the maximum penetration of mobile broadband as a linear function of the diffusion of mobile
phone infrastructure and personal computers before the diffusion of mobile broadband. By
introducing a two stage model we are able to model mobile broadband penetration as a
logistic form of S-shaped diffusion curve.10
10
The logistic form of S-shaped diffusion curve was first introduced in economic analysis by Griliches (1957)
and is also applied by Czernich et al. (2011) to analyze the economic impact of fixed broadband.

15
Based on this two stage model, we find strong evidence that it is actually mobile broadband
introduction and penetration that is driving GDP development. The results suggest that a 10
percent increase in mobile broadband penetration causes a 0.6–2.8 percent increase in GDP
depending on how the model is specified. Moreover, there is a highly significant effect from
lagged mobile broadband penetration.
Since 2001, global broadband connections have increased from approximately 27 000 to
4 138 464 810 in 2016. Moreover, the use of data being sent via mobile networks has
increased exponentially with approximately 65 percent on a year-on-year basis 2010–2015.
Our results show that this extremely rapid diffusion of mobile broadband is driving positive
macroeconomic development in terms of GDP.

16
9. References Abramovsky, Laura and Griffith, Rachel (2006), “Outsourcing and Offshoring of Business
Services: How Important is ICT?”, Journal of the European Economic Association, vol. 4, pp.
594–601.
Brynjolfsson, Erik, and Hitt, Lorin M. (2003), “Computing Productivity: Firm level
Evidence”, Review of Economics and Statistics, vol. 85, pp. 793–808.
Conference Board (2015), Total Economy Database, September, www.conference-
board.org/data/economydatabase
Corrado, Carol (2011), “Communication Capital, Metcalfe’s law, and U.S. Productivity
Growth”, Economics Working Paper Series EPWP#11–01, Conference Board, New York.
Coyle, Diane and Williams, Howard (2011), “Overview”, The Vodaphone Policy Paper
Series, no. 12, pp. 3–11.
Czernich, Nina, Falck, Oliver, Kretschmer, Tobias and Woessman, Ludger (2011),
“Broadband infrastructure and economic growth”, Economic Journal, vol. 121, pp. 505–532.
Datta, Anusua and Agarwal, Submit (2004), “Telecommunications and economic growth: a
panel data approach”, Applied Economics, vol. 36, pp. 1649–1654.
Dettling, Lisa J. (2013), Broadband in the Labor Market: The Impact of Residential High-
Speed Internet on Married Women’s Labor Force Participation, Finance and Economics
Discussion Series 2013–065. Federal Reserve Board, Washington D.C.
Ericsson Mobility Report (2016), “Ericsson Mobility Report – On the Pulse of the Network
Society”, Mobile World Congress, Ericsson, Stockholm.
Feenstra, Robert C., Inklaar, Robert and Timmer, Marcel P. (2015), “The Next Generation of
the Penn World Table”, American Economic Review, vol. 105, pp. 3150 – 3182, Available
online: www.ggdc.net/pwt
Gerschenkron, Alexander (1952), “Economic Backwardness in Historical Perspective”, in:
Hoselitz, Bert,F. (Ed.), The progress of underdeveloped areas, Chicago University Press,
Chicago, pp. 3–29.
Goodridge, Peter, Haskel, Jonathan and Wallis, Gavin (2014), “The “C” in ICT:
Communications Capital, Spillovers and UK Growth”, Discussion Paper 2014/10, Imperial
College, London.
Griliches, Zvi (1957), “Hybrid Corn: An Exploration in the Economics of Technological
Change”, Econometrica, vol. 25, pp. 501–522.

17
Gruber, Harald and Koutroumpis, Pantelis (2011), “Mobile telecommunications and the
impact on economic development”, Economic Policy, vol. 26, pp. 387–426.
GSMA (2017), GSMA Wireless Intelligence Database, Available online:
www.gsmaintelligence.com
Hardy, Andrew P. (1980), “The role of the telephone in economic development”,
Telecommunications Policy, vol. 4, pp. 278–286.
International Telecommunication Union (2015), World Telecommunication/ICT Indicators
2015 Database, Geneva.
Johnson, Simon, Larson, William, Papageoriou, Chris and Subramanian, Arvind (2013), “Is
Newer Better? Penn World Table Revisions and Their Impact on Growth Estimates”, Journal
of Monetary Economics, vol. 60, pp. 255–74.
Jorgenson, Dale, W., Mun S. Ho and Stiroh, Kevin J. (2008), “A Retrospective Look at the
U.S. Productivity Resurgence”, Journal of Economic Perspectives, vol. 22, pp. 3–24.
Koutroumpis, Pantelis (2009), “The economic impact of broadband on growth: A
simultaneous approach”, Telecommunications Policy, vol. 33, pp. 471–485
Oliner, Stephen D. and Sichel, Daniel (2000), “The Resurgence of Growth in the Late 1990s:
Is Information Technology the Story?”, Journal of Economic Perspectives, vol. 14, pp. 3–22.
O’Mahony, Mary and Vecchi, Michela (2005), “Quantifying the Impact of ICT Capital on
Output Growth: A Heterogeneous Dynamic Panel Approach”, Economica, vol. 72, pp. 615–
633.
Qiang, Christine Zhen-Wei and Rossotto, Carlo M. (2009), “Economic Impacts of
Broadband”, in: Communications for Development 2009: Extending Reach and Increasing
Impact, pp. 35–50, World Bank, Washington D.C.
Rohman, Ibrahim and Bohlin, Erik (2012), “Does broadband speed really matter for driving
economic growth? Investigating OECD countries”, International Journal of Management and
Network Economics, vol. 2, pp. 336–356.
Röller, Lars-Hendrik, and Waverman, Leonard (2001), “Telecommunications Infrastructure
and Economic Development: A Simultaneous Approach”, American Economic Review, vol.
91, pp. 909–923.
Solow, Robert M. (1987), “We’d Better Watch Out”, New York Review of Books, July 12, p.
36.

18
van Ark, Bart, O’Mahony, Mary and Timmer, Marcel (2008), “The Productivity Gap between
Europe and the United States: Trends and Causes”, Journal of Economic Perspectives, vol 22,
pp. 25–44.
Waverman, Leonard, Meschi, Meloria and Fuss, Melvyn (2005), “The Impact of Telecoms on
Economic Growth in Developing Countries”, The Vodaphone Policy Paper Series, no. 2, pp.
10–24.
Williams, Chris, Solomon, Gabriel and Pepper, Robert (2012), “What is the impact of mobile
telephony on economic growth – A report for the GSM Association”, Deloitte LLD, London.
Wooldridge, Jeffrey M. (2009), Introductory Economics: A Modern Approach, South
Western, Mason, OH.

19
10. Tables and figures
10.1 Tables
Table 1 Descriptive statistics
Variable Mean St. Dev. Min Max No. obs
GDP based on multiple benchmark
years (in PPP adjusted 2011 US$,
millions)
434687 1228532 309 17100000 1755
GDP based on one benchmark years
and national accounts growth rates (in
PPP adjusted 2011 US$, millions)
456777 1254163 336 17200000 1755
Capital Services (in 2011 US$,
millions) 2227649 5164891 17407 67400000 1247
Number of persons engaged (in
millions) 18 79 0.04 798 1716
Human capital index 2.54 0.67 1.09 3.73 1495
Mobile broadband connections (as a
percent of total connections) 12 20 0 99 2054
Mobile broadband connections (as per
100 inhabitants) 14 27 0 294 2054
Mobile phone subscriptions in 2002 (as
per 100 inhabitants) 28 30 0.1 110 2054
Fixed Internet users in 2002 (as per 100
inhabitants) 6 10 0.004 49 2054
Fixed broadband subscriptions (as per
100 inhabitants) 9 11 0 47 1810
Note: The descriptive statistics include the full sample.
20
Table 2 Regressions investigating the economic impact mobile broadband introduction
Dependent variable: GDP (value added)
Pooled regression
Fixed effects Fixed effects
Mobile broadband
introduction (1%)
2.06*** (0.273)
0.07*** (0.022)
0.07*** (0.023)
Mobile broadband
introduction (5%)
1.96*** (0.276)
0.03 (0.025)
–0.003 (0.028)
Log of labor (lnL) 0.73*** 0.73***
(0.143) (0.148)
Log of capital services (lnK) 0.27** 0.29**
(0.120) (0.119)
Log of human capital (lnHK) 0.84* 0.85*
(0.461) (0.479)
Constant 10.78*** 10.78*** 10.78*** 10.78*** 6.21*** 5.88***
(0.176) (0.176) (0.024) (0.024) (1.484) (1.461)
Country fixed effects No No Yes Yes Yes Yes
Year dummies Yes Yes Yes Yes Yes Yes
R2 0.14 0.14 0.66 0.66 0.77 0.77
Number of observations 1755 1755 1755 1755 1169 1169
Note: The estimates are based on pooled OLS and fixed effects. Cluster robust standard errors are presented in parenthesis.
***, **, * indicate statistical significance at the 1%, 5% and 10% levels, respectively.

21
Table 3 Regressions investigating the economic impact mobile broadband penetration
Dependent variable: GDP (value added)
Pooled regression
Fixed effects Fixed effects
Log of mobile broadband
penetration (lnMB)
0.11* (0.064)
0.20*** (0.059)
0.03*** (0.009)
0.03** (0.011)
0.02*** (0.008)
0.01 (0.011)
Years since mobile
broadband introduction (1%)
0.36*** (0.051)
–0.03* (0.014)
–0.01 (0.012)
Years since mobile
broadband introduction (5%)
0.30*** (0.050)
–0.03** (0.012)
–0.02 (0.014)
Log of labor (lnL) 0.58*** 0.57***
(0.114) (0.106)
Log of capital services (lnK) 0.30*** 0.26***
(0.077) (0.090)
Log of human capital (lnHK) –0.17 –0.13
(0.337) (0.345)
Constant 14.73*** 14.83*** 11.59*** 11.54*** 7.40*** 7.77***
(0.515) (0.550) (0.124) (0.129) (0.931) (1.045)
Country fixed effects No No Yes Yes Yes Yes
Year dummies Yes Yes Yes Yes Yes Yes
R2 0.26 0.24 0.64 0.65 0.76 0.77
Number of observations 1060 1060 1060 1060 800 800
Note: The estimates are based on pooled OLS and fixed effects. Cluster robust standard errors are presented in parenthesis.
***, **, * indicate statistical significance at the 1%, 5% and 10% levels, respectively.

22
Table 4 Regressions investigating the economic impact mobile broadband penetration
Note: The estimates are based on fixed effects. Cluster robust standard errors are presented in parenthesis. Long differences
include n-period moving average of the growth rates of each variable. ***, **, * indicate statistical significance at the 1%,
5% and 10% levels, respectively.
Table 5 Technology diffusion curve (first stage of the instrumental variable model)
Note: Non-linear least squares estimation. Robust standard errors are presented in parenthesis. ***, **, * indicate statistical
significance at the 1%, 5% and 10% levels, respectively.
Dependent variable: GDP (value added)
Fixed effects
First differences Three years differences Five years differences
Mobile broadband
penetration (lnMB)
0.01** (0.005)
0.02*** (0.007)
0.03*** (0.008)
Labor (lnL) 0.61*** (0.096)
0.64*** (0.128)
0.60*** (0.141)
Capital services (lnK) 0.28*** (0.075)
0.270*** (0.081)
0.30*** (0.080)
Human capital (lnHK) –0.16
(0.365) –0.39
(0.393) 0.04
(0.393)
Constant –0.01
(0.015) –0.007 (0.015)
–0.01 (0.012)
Year dummies Yes Yes Yes
R2 0.32 0.38 0.50
Number of observations 710 531 360
Dependent variable: Mobile broadband penetration rate
Non-linear least squares
Model 1 Model 2 Model 3
Cell phone penetration rate in
2002
0.93*** (0.060)
0.67*** (0.050)
Fixed Internet penetration rate in
2002
2.63*** (0.253)
0.93*** (0.130)
Diffusion speed () 0.49*** (0.036)
0.49*** (0.043)
0.49*** (0.035)
Inflection point () 2010.2***
(0.347) 2010.3***
(0.456) 2010.2***
(0.325)
Constant () 11.07*** (1.098)
22.32*** (1.971)
12.38*** (1.128)
R2 0.83 0.78 0.84
Number of observations 1755 1755 1755
23
Table 6 The effect of mobile broadband introduction on GDP (second stage of the
instrumental variable model)
Note: Fixed effects estimation. Bootstrapped standard errors in parenthesis. ***, **, * indicate statistical significance at the
1%, 5% and 10% levels, respectively.
Dependent variable: GDP (value added)
Fixed effects
Predicted mobile broadband
introduction (1%)
0.17*** (0.036)
0.16*** (0.037)
Predicted mobile broadband
introduction (5%)
0.05** (0.024)
0.05** (0.025)
Log labor (lnL) 0.73*** (0.147)
0.73*** (0.155)
0.73*** (0.142)
0.73*** (0.160)
Log of capital services (lnK) 0.24** (0.114)
0.28** (0.118)
0.23** (0.112)
0.27** (0.123)
Human capital (lnHK) 0.59
(0.431) 0.84*
(0.508) 0.62
(0.461) 0.89*
(0.481)
Placebo 0.04
(0.033) 0.05
(0.035)
Constant 6.83*** (1.388)
6.13*** (1.425)
6.79*** (1.398)
6.10*** (1.475)
Country fixed effects Yes Yes Yes Yes
Year dummies Yes Yes Yes Yes
R2 0.79 0.77 0.79 0.77
Number of observations 1169 1169 1169 1169

24
Table 7 The effect of mobile broadband penetration on GDP (second stage of the instrumental
variable model)
Note: Fixed effects estimation. Bootstrapped standard errors in parenthesis. ***, **, * indicate statistical significance at the
1%, 5% and 10% levels, respectively.
Dependent variable: GDP (value added)
Fixed effects
Log of predicted mobile broadband
penetration (lnMB)
0.06*** (0.019)
0.28*** (0.065)
0.21*** (0.037)
Lag of predicted mobile broadband
penetration (lnMB) (t-1)
0.06*** (0.017)
Lag of predicted mobile broadband
penetration (lnMB) (t-2)
0.06*** (0.015)
Years since mobile broadband
introduction (1%)
–0.08*** (0.022)
Years since mobile broadband
introduction (5%)
–0.06*** (0.013)
Log of labor (lnL) 0.73*** (0.170)
0.72*** (0.148)
0.72*** (0.145)
0.70*** (0.154)
0.66*** (0.156)
Log of capital services (lnK) 0.29** (0.122)
0.24** (0.107)
0.14 (0.108)
0.29** (0.121)
0.30** (0.116)
Log of human capital (lnHK) 0.86*
(0.485) 0.56
(0.455) 0.34
(0.422) 0.71
(0.456) 0.46
(0.437)
Constant 5.92*** (1.535)
6.96*** (1.327)
8.48*** (1.405)
6.14*** (1.452)
6.39*** (1.397)
Country fixed effects Yes Yes Yes Yes Yes
Year dummies Yes Yes Yes Yes Yes
R2 0.77 0.79 0.81 0.76 0.75
Number of observations 1169 1169 1169 1080 990

25
Table 8 The effect of mobile broadband penetration on GDP based on one benchmark year
and national accounts growth rates (second stage of the instrumental variable model)
Note: Fixed effects estimation. Bootstrapped standard errors in parenthesis. ***, **, * indicate statistical significance at the
1%, 5% and 10% levels, respectively. GDP measurement is based on one benchmark year and national accounts growth rates
instead of multiple benchmark years.
Dependent variable: GDP (value added)
Fixed effects
Log of predicted mobile broadband
penetration (lnMB)
0.03** (0.013)
0.17*** (0.033)
0.13*** (0.024)
Lag of predicted mobile broadband
penetration (lnMB) (t-1)
0.03** (0.013)
Lag of predicted mobile broadband
penetration (lnMB) (t-2)
0.02* (0.012)
Years since mobile broadband
introduction (1%)
–0.05*** (0.010)
Years since mobile broadband
introduction (5%)
–0.04*** (0.008)
Log of labor (lnL) 0.46*** (0.117)
0.45*** (0.109)
0.45*** (0.101)
0.48*** (0.119)
0.49*** (0.122)
Log of capital services (lnK) 0.28*** (0.077)
0.25*** (0.070)
0.18** (0.071)
0.27*** (0.084)
0.27*** (0.082)
Log of human capital (lnHK) 0.61
(0.394) 0.42
(0.339) 0.26
(0.337) 0.60
(0.382) 0.53
(0.393)
Constant 6.93*** (0.913)
7.59*** (0.851)
8.62*** (0.864)
7.05*** (0.985)
7.10*** (0.943)
Country fixed effects Yes Yes Yes Yes Yes
Year dummies Yes Yes Yes Yes Yes
R2 0.81 0.83 0.85 0.79 0.76
Number of observations 1169 1169 1169 1080 990

26
Table 9 The effect of mobile broadband penetration on GDP (second stage of the instrumental
variable model)
Note: Fixed effects estimation. Bootstrapped standard errors in parenthesis. ***, **, * indicate statistical significance at the
1%, 5% and 10% levels, respectively.
Dependent variable: GDP (value added)
Fixed effects
Log of predicted mobile broadband
penetration (lnMB)
0.02 (0.014)
0.16*** (0.062)
0.16*** (0.038)
Lag of predicted mobile broadband
penetration (lnMB) (t-1)
0.03** (0.013)
Lag of predicted mobile broadband
penetration (lnMB) (t-2)
0.03*** (0.011)
Years since mobile broadband
introduction (1%)
–0.04** (0.020)
Years since mobile broadband
introduction (5%)
–0.05*** (0.013)
Log of labor (lnL) 0.72*** (0.146)
0.72*** (0.151)
0.72*** (0.138)
0.69*** (0.141)
0.64*** (0.140)
Log of capital services (lnK) 0.27*** (0.083)
0.26*** (0.082)
0.19** (0.078)
0.27*** (0.081)
0.27*** (0.082)
Log of human capital (lnHK) 0.09
(0.455) 0.02
(0.438) –0.09
(0.439) 0.10
(0.459) 0.01
(0.460)
Log of fixed broadband penetration
(lnFB)
0.05*** (0.010)
0.04*** (0.012)
0.02* (0.012)
0.05*** (0.010)
0.05*** (0.011)
Constant 7.12*** (1.094)
7.30*** (1.069)
8.30*** (1.076)
7.13*** (1.076)
7.29*** (1.032)
Country fixed effects Yes Yes Yes Yes Yes
Year dummies Yes Yes Yes Yes Yes
R2 0.82 0.82 0.83 0.81 0.79
Number of observations 1102 1102 1102 1033 957

27
Table 10 The effect of alternative mobile broadband penetration on GDP (second stage of the
instrumental variable model)
Note: Fixed effects estimation. Bootstrapped standard errors in parenthesis. ***, **, * indicate statistical significance at the
1%, 5% and 10% levels, respectively. Mobile broadband penetration is measured as mobile broadband connections per 100
inhabitants instead of mobile broadband connections as a percentage share of total connections.
Dependent variable: GDP (value added)
Fixed effects
Log of predicted mobile broadband
penetration (lnMB)
0.05*** (0.018)
0.21*** (0.055)
0.17*** (0.033)
Lag of predicted mobile broadband
penetration (lnMB) (t-1)
0.06*** (0.015)
Lag of predicted mobile broadband
penetration (lnMB) (t-2)
0.06*** (0.014)
Years since mobile broadband
introduction (1%)
–0.06*** (0.019)
Years since mobile broadband
introduction (5%)
–0.05*** (0.012)
Log of labor (lnL) 0.73*** (0.163)
0.72*** (0.145)
0.72*** (0.146)
0.70*** (0.168)
0.66*** (0.169)
Log of capital services (lnK) 0.29** (0.123)
0.25** (0.106)
0.16 (0.109)
0.29** (0.124)
0.30*** (0.115)
Log of human capital (lnHK) 0.86*
(0.492) 0.56
(0.460) 0.37
(0.458) 0.71
(0.443) 0.46
(0.428)
Constant 5.92*** (1.493)
6.88*** (1.327)
8.20*** (1.457)
6.15*** (1.450)
6.40*** (1.396)
Country fixed effects Yes Yes Yes Yes Yes
Year dummies Yes Yes Yes Yes Yes
R2 0.77 0.79 0.80 0.76 0.75
Number of observations 1169 1169 1169 1080 990

28
10.2 Figures
Figure 1 Actual and predicted mobile broadband diffusion in Europe and Central Asia
29
Figure 2 Actual and predicted mobile broadband diffusion in Asia and Pacific

30
Figure 3 Actual and predicted mobile broadband diffusion in Sub-Saharan Africa

31
Figure 4 Actual and predicted mobile broadband diffusion in Middle East and North Africa

32
Figure 5 Actual and predicted mobile broadband diffusion in North America and South Asia

33
Figure 6 Actual and predicted mobile broadband diffusion in Latin America and Caribean

This paper has been produced by the Department of Management at Imperial College Business School
Copyright © the authors 2014 All rights reserved
ISSN: 1744-6783
Imperial College Business School Tanaka Building South Kensington Campus London SW7 2AZ United Kingdom
T: +44 (0)20 7589 5111 F: +44 (0)20 7594 9184
www.imperial.ac.uk/business-school