Embed Size (px)
Citation preview

How Effective are Capital Controls in Asia?: Thailand Case Studies
The presentation is based on the paper entitled“How Effective are Capital Controls in Asia?
Maria Socorro Gochoco-Bautista (ADB)Juthathip Jongwanich (SOM, AIT)Jong-Wha Lee (Korea University)
Available at ERD Working Paper Series No. 224
Juthathip JongwanichSchool of Management (SOM)
Asian Institute of Technology (AIT)
Introduction• The global financial crisis of 2008 leads to the revival of the
debate on the role capital control in ensuring macroeconomic and financial stability.
• In particular, the strong and quick recovery of emerging Asian countries results in noticeable capital inflows into the region.
• There are fear that capital inflows will inundate Asia and threaten currency, and macroeconomic and financial stability.
• Particularly, currency appreciation leads to a debate between exporters and policymakers
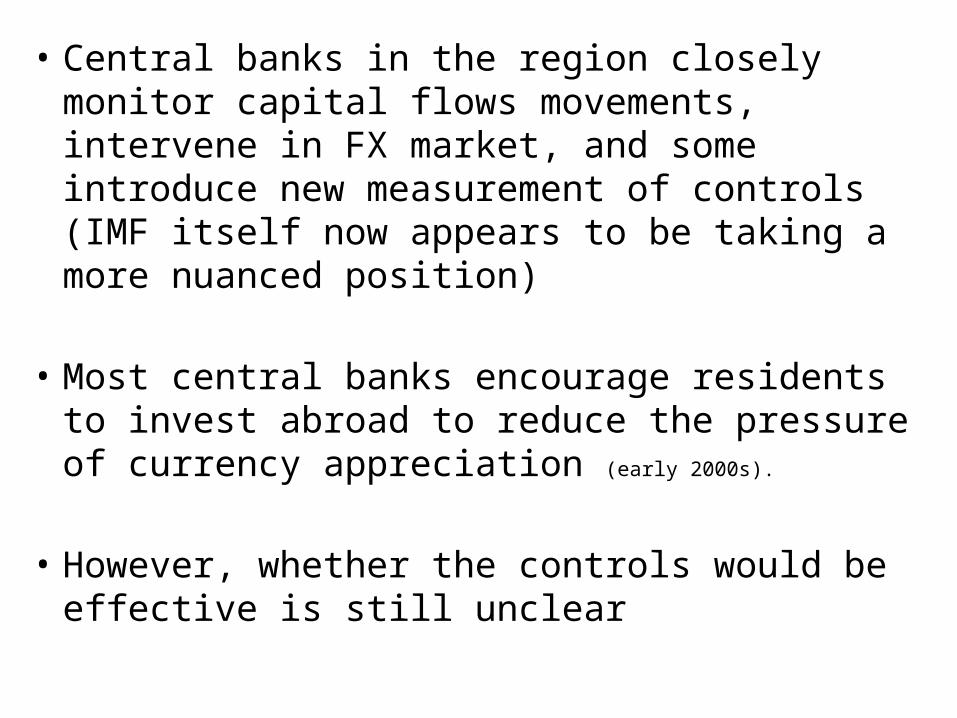
• Central banks in the region closely monitor capital flows movements, intervene in FX market, and some introduce new measurement of controls (IMF itself now appears to be taking a more nuanced position)
• Most central banks encourage residents to invest
abroad to reduce the pressure of currency appreciation (early 2000s).
• However, whether the controls would be effective is still unclear
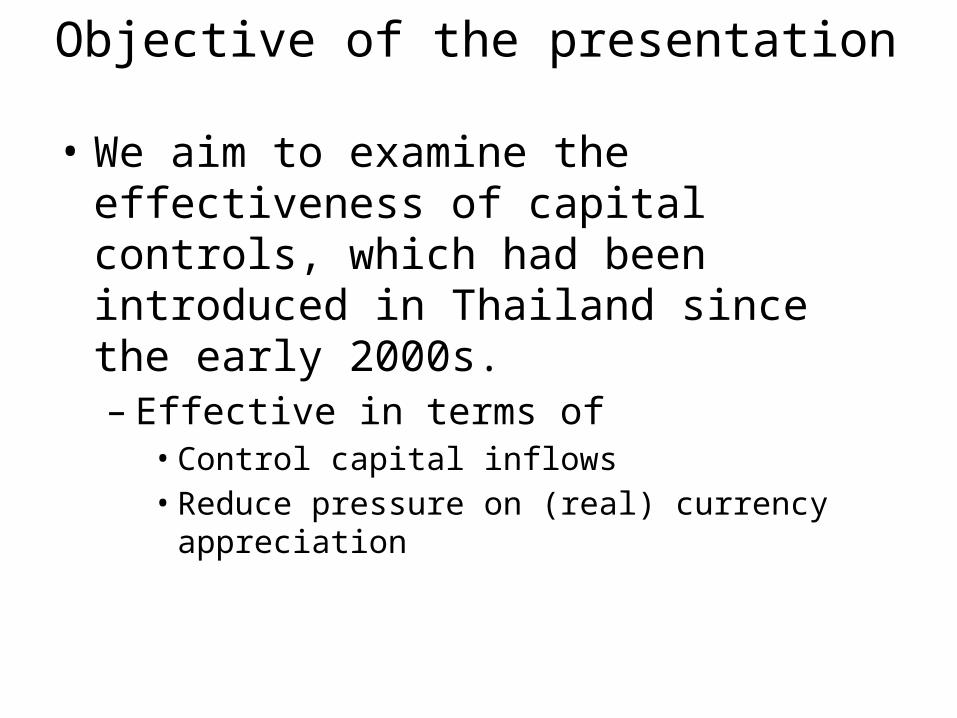
Objective of the presentation
• We aim to examine the effectiveness of capital controls, which had been introduced in Thailand since the early 2000s.– Effective in terms of
• Control capital inflows• Reduce pressure on (real) currency appreciation
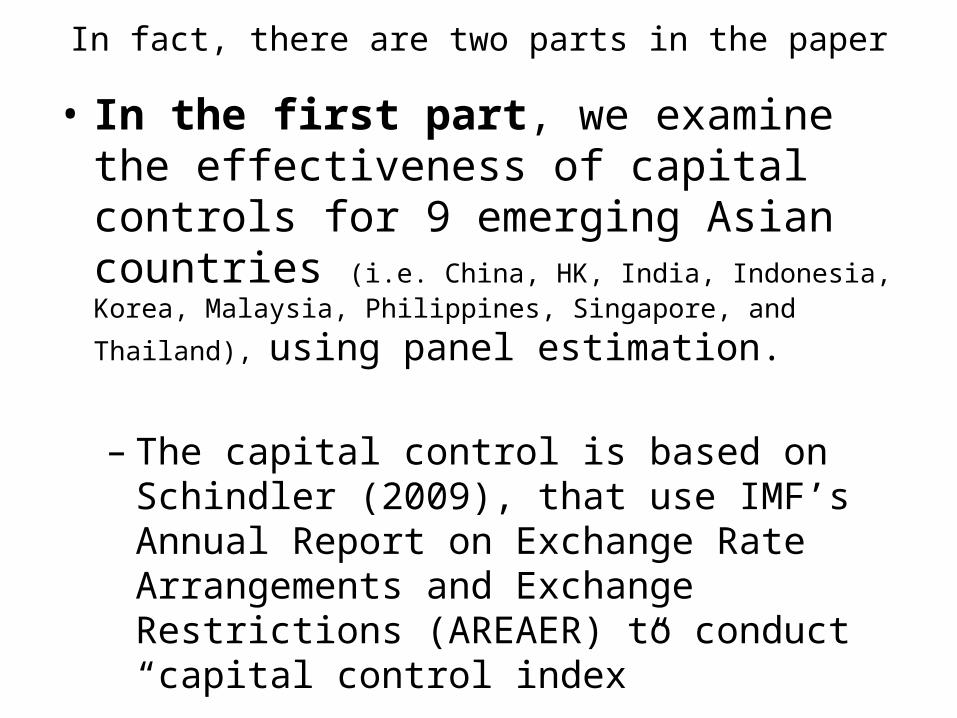
In fact, there are two parts in the paper• In the first part, we examine the effectiveness
of capital controls for 9 emerging Asian countries (i.e. China, HK, India, Indonesia, Korea, Malaysia,
Philippines, Singapore, and Thailand), using panel estimation.
– The capital control is based on Schindler (2009), that use IMF’s Annual Report on Exchange Rate Arrangements and Exchange Restrictions (AREAER) to conduct “capital control index”
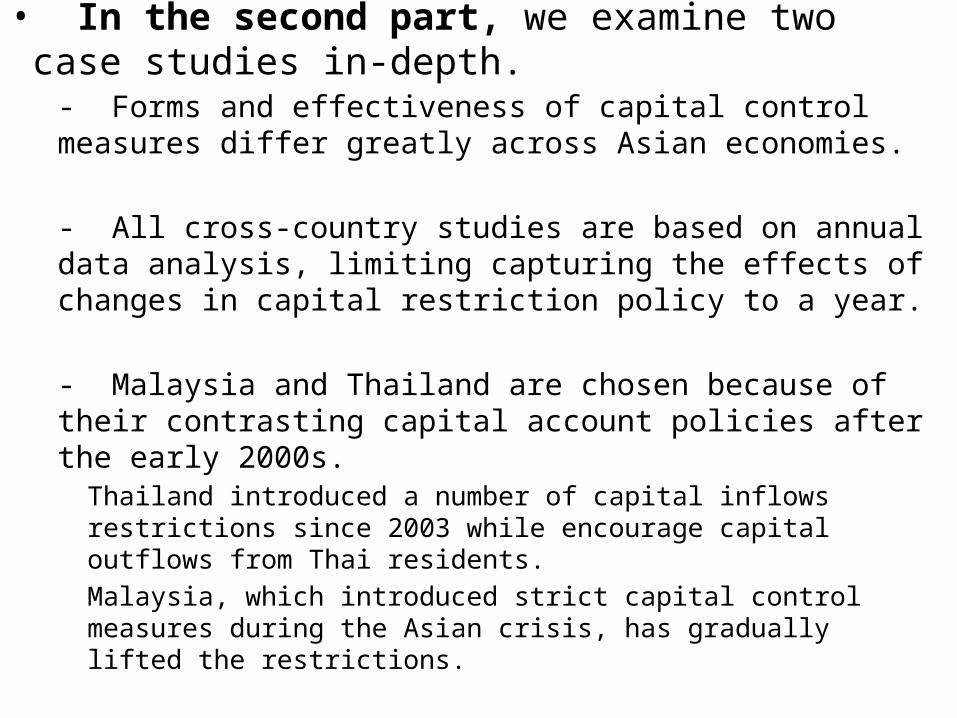
• In the second part, we examine two case studies in-depth.
- Forms and effectiveness of capital control measures differ greatly across Asian economies.
- All cross-country studies are based on annual data analysis, limiting capturing the effects of changes in capital restriction policy to a year.
- Malaysia and Thailand are chosen because of their contrasting capital account policies after the early 2000s.
Thailand introduced a number of capital inflows restrictions since 2003 while encourage capital outflows from Thai residents.Malaysia, which introduced strict capital control measures during the Asian crisis, has gradually lifted the restrictions.
Outline of the Presentation• Movements of Capital Flows
• Brief literature survey
• Capital control indexes
• Empirical model
• Results
• Conclusions and policy inferences
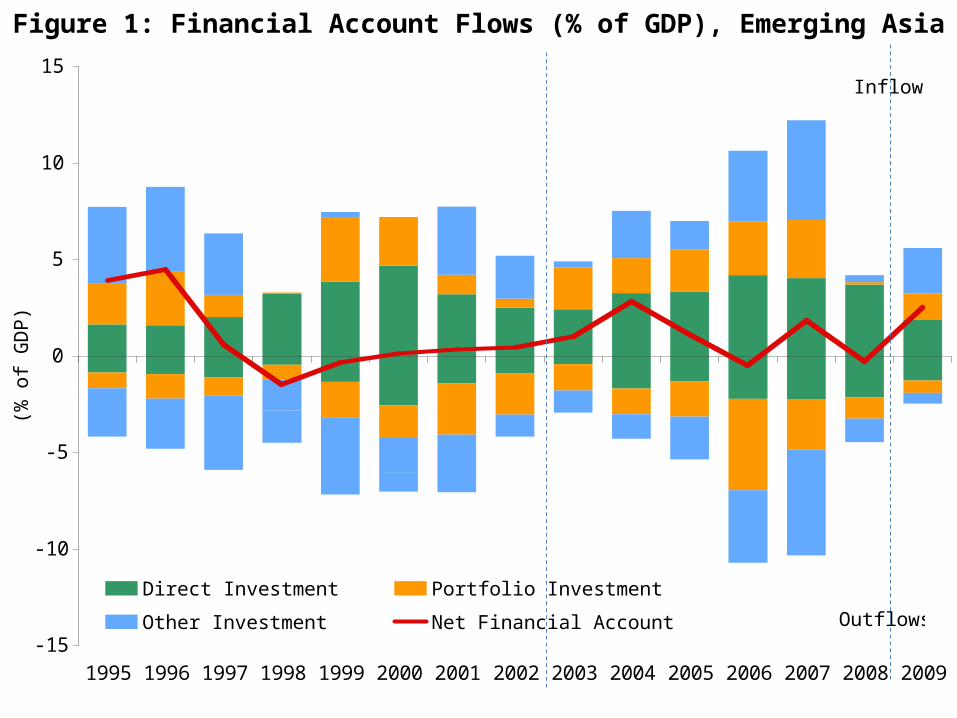
Figure 1: Financial Account Flows (% of GDP), Emerging Asia
-15
-10
-5
0
5
10
15
1995 1996 1997 1998 1999 2000 2001 2002 2003 2004 2005 2006 2007 2008 2009
(% o
f GD
P)
Direct Investment Portfolio Investment
Other Investment Net Financial Account Flow
Inflows
Outflows
1993 1994 1995 1996 1997 1998 1999 2000 2001 2002 2003 2004 2005 2006 2007 2008 p 2009 p 2009H12009H22010H1
-20,000.0
-15,000.0
-10,000.0
-5,000.0
0.0
5,000.0
10,000.0
15,000.0
20,000.0
25,000.0
30,000.0
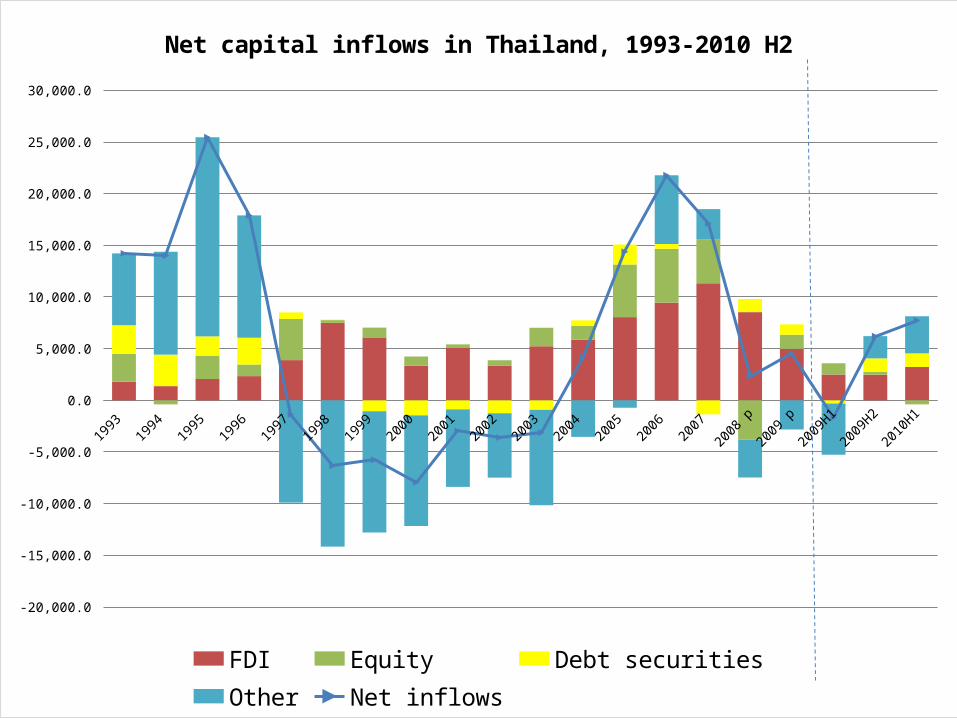
Net capital inflows in Thailand, 1993-2010 H2
FDI Equity Debt securitiesOther Net inflows
1993
1994
1995
1996
1997
1998
1999
2000
2001
2002
2003
2004
2005
2006
2007
2008
p
2009
p
2009
H1
2009
H2
2010
H1
-20,000
-15,000
-10,000
-5,000
0
5,000
10,000
15,000
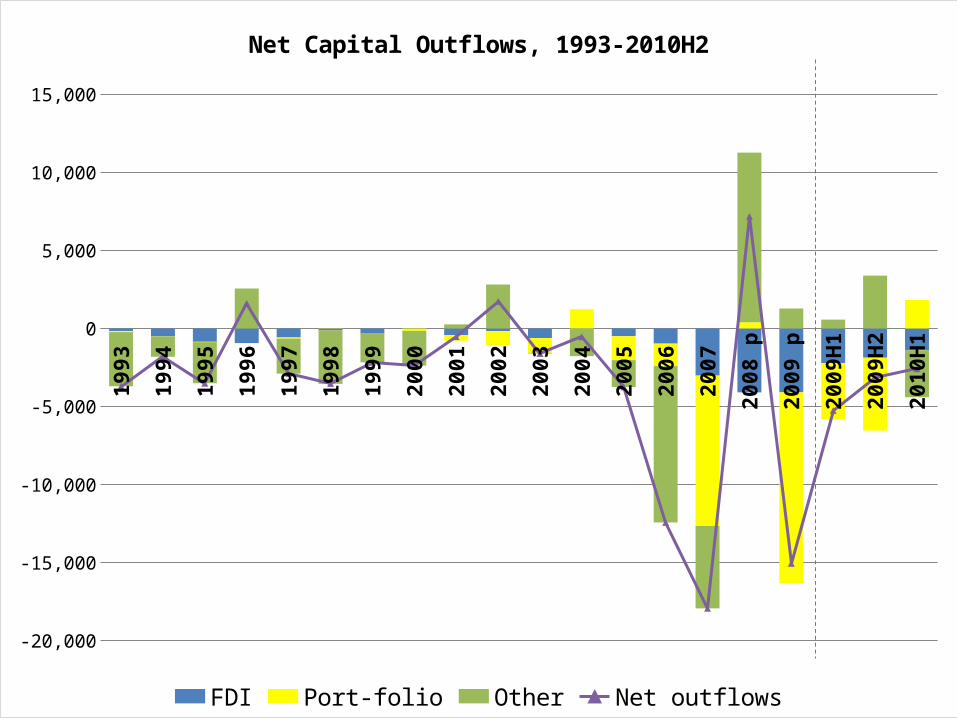
Net Capital Outflows, 1993-2010H2
FDI Port-folio Other Net outflows
Q1/2000
Q2/2000
Q3/2000
Q4/2000
Q1/2001
Q2/2001
Q3/2001
Q4/2001
Q1/2002
Q2/2002
Q3/2002
Q4/2002
Q1/2003
Q2/2003
Q3/2003
Q4/2003
Q1/2004
Q2/2004
Q3/2004
Q4/2004
Q1/2005
Q2/2005
Q3/2005
Q4/2005
Q1/2006
Q2/2006
Q3/2006
Q4/2006
Q1/2007
Q2/2007
Q3/2007
Q4/2007
Q1/2008
Q2/2008
Q3/2008
Q4/2008
Q1/2009 p
Q2/2009 p
Q3/2009 p
Q4/2009 p
Q1/2010 p
Q2/2010 p
-10,000
-5,000
0
5,000
10,000
15,000
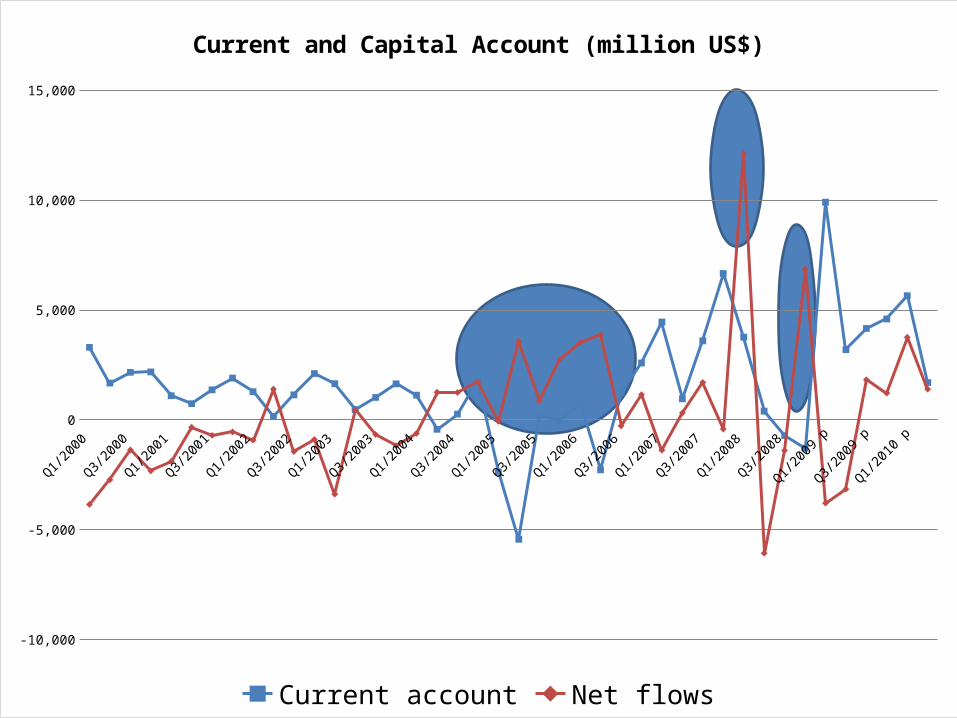
Current and Capital Account (million US$)
Current account Net flows
JAN 2002 DEC 2002 NOV 2003 OCT 2004 SEP 2005 AUG 2006 JUL 2007 JUN 2008 MAY 2009 APR 201028
30
32
34
36
38
40
42
44
46
80
85
90
95
100
105
110
115
120
125
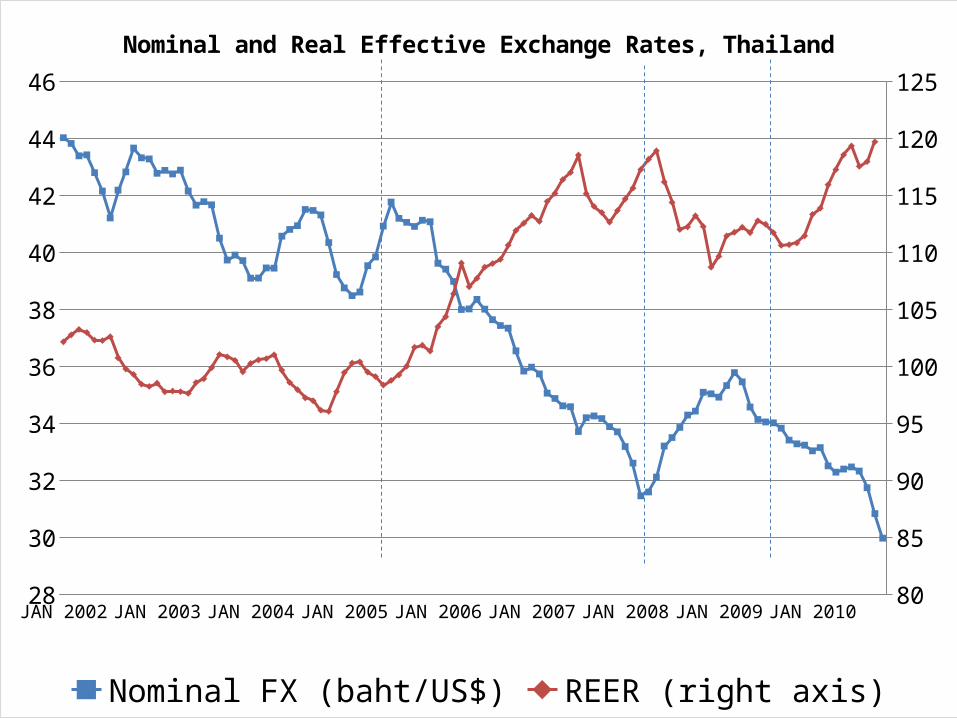
Nominal and Real Effective Exchange Rates, Thailand
Nominal FX (baht/US$) REER (right axis)
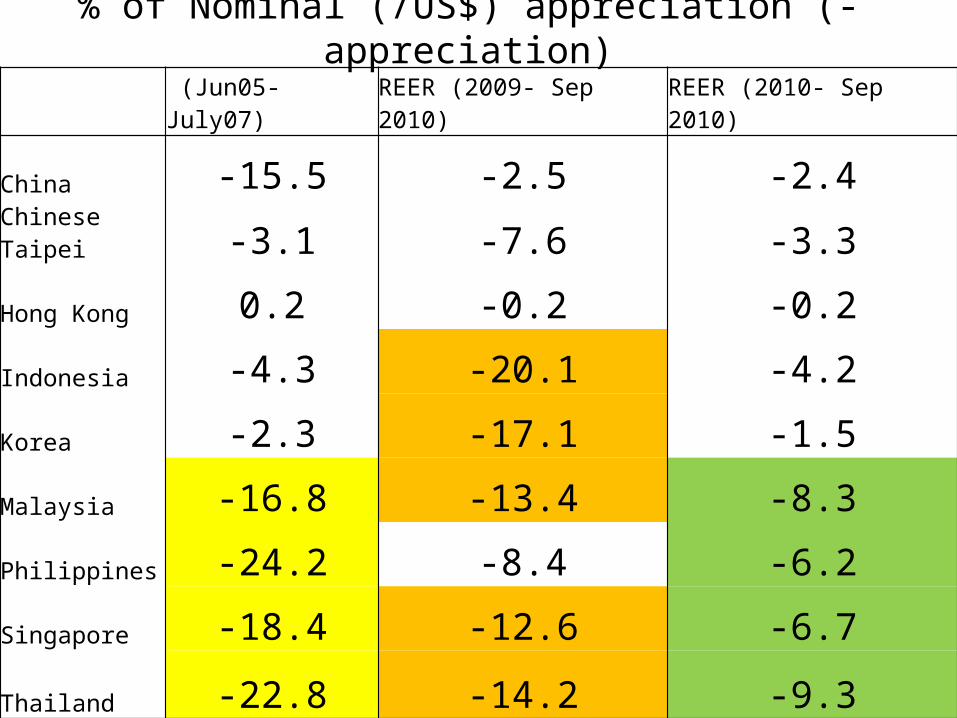
% of Nominal (/US$) appreciation (- appreciation)
(Jun05-July07) REER (2009- Sep 2010) REER (2010- Sep 2010)
China -15.5 -2.5 -2.4
Chinese Taipei -3.1 -7.6 -3.3
Hong Kong 0.2 -0.2 -0.2
Indonesia -4.3 -20.1 -4.2
Korea -2.3 -17.1 -1.5
Malaysia -16.8 -13.4 -8.3
Philippines -24.2 -8.4 -6.2
Singapore -18.4 -12.6 -6.7
Thailand -22.8 -14.2 -9.3
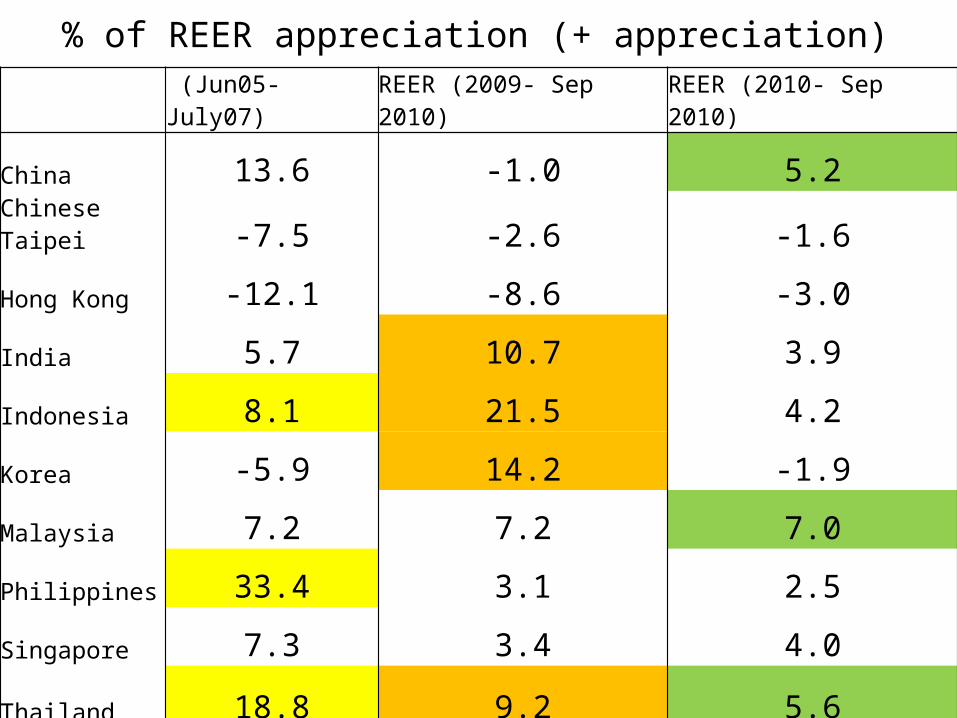
% of REER appreciation (+ appreciation)
(Jun05-July07) REER (2009- Sep 2010) REER (2010- Sep 2010)
China 13.6 -1.0 5.2
Chinese Taipei -7.5 -2.6 -1.6
Hong Kong -12.1 -8.6 -3.0
India 5.7 10.7 3.9
Indonesia 8.1 21.5 4.2
Korea -5.9 14.2 -1.9
Malaysia 7.2 7.2 7.0
Philippines 33.4 3.1 2.5
Singapore 7.3 3.4 4.0
Thailand 18.8 9.2 5.6
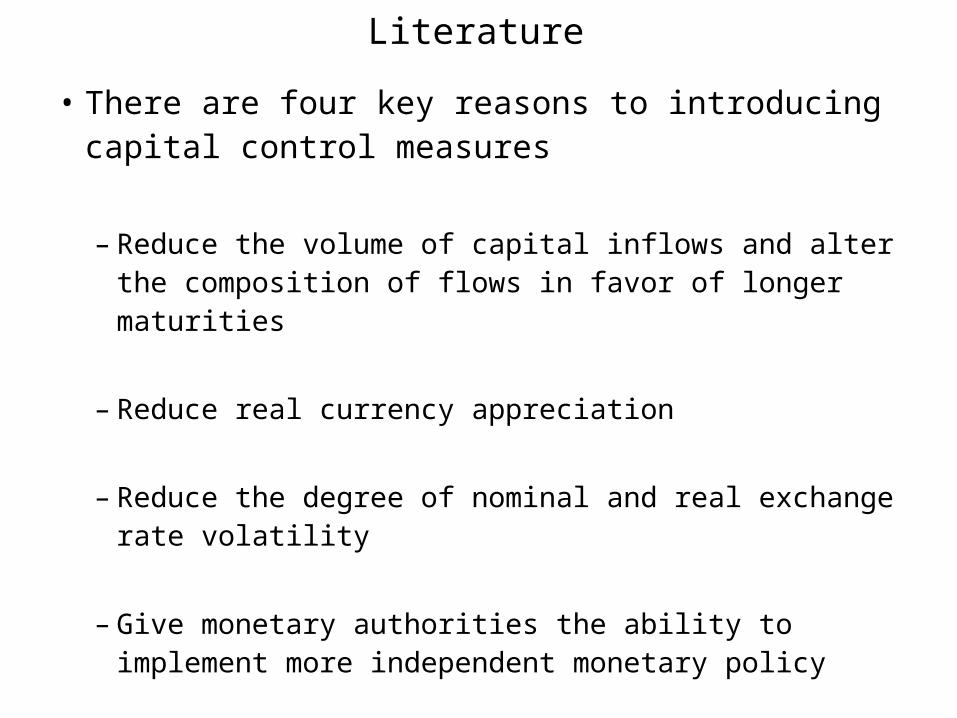
Literature
• There are four key reasons to introducing capital control measures
– Reduce the volume of capital inflows and alter the composition of flows in favor of longer maturities
– Reduce real currency appreciation
– Reduce the degree of nominal and real exchange rate volatility
– Give monetary authorities the ability to implement more independent monetary policy
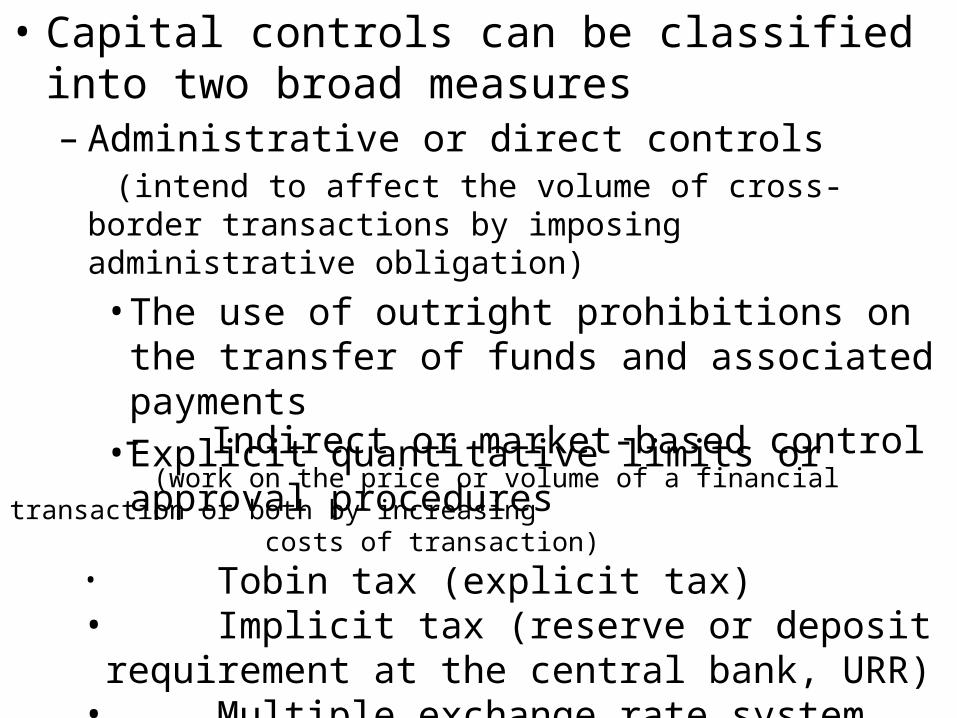
• Capital controls can be classified into two broad measures– Administrative or direct controls (intend to affect the volume of cross-border transactions by
imposing administrative obligation)
• The use of outright prohibitions on the transfer of funds and associated payments
• Explicit quantitative limits or approval procedures
- Indirect or market-based control (work on the price or volume of a financial transaction or both by increasing costs of transaction)
• Tobin tax (explicit tax)• Implicit tax (reserve or deposit requirement at the
central bank, URR)• Multiple exchange rate system
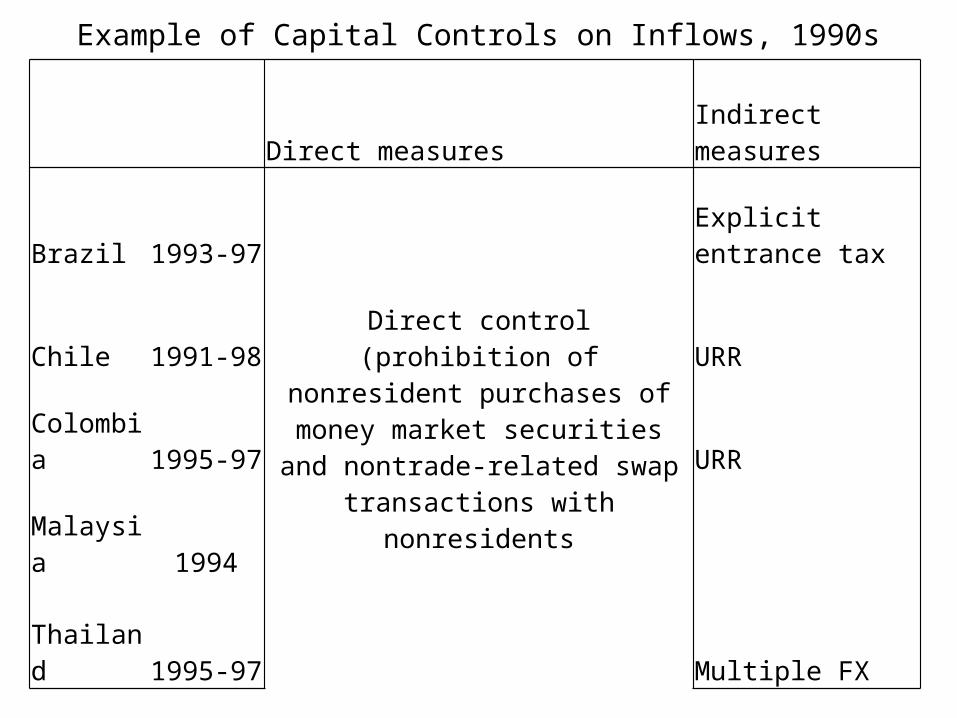
Example of Capital Controls on Inflows, 1990s
Direct measures Indirect measures
Brazil 1993-97
Direct control (prohibition of nonresident purchases of money market securities and nontrade-related swap transactions with
nonresidents
Explicit entrance tax
Chile 1991-98 URR
Colombia 1995-97 URR
Malaysia 1994
Thailand 1995-97 Multiple FX
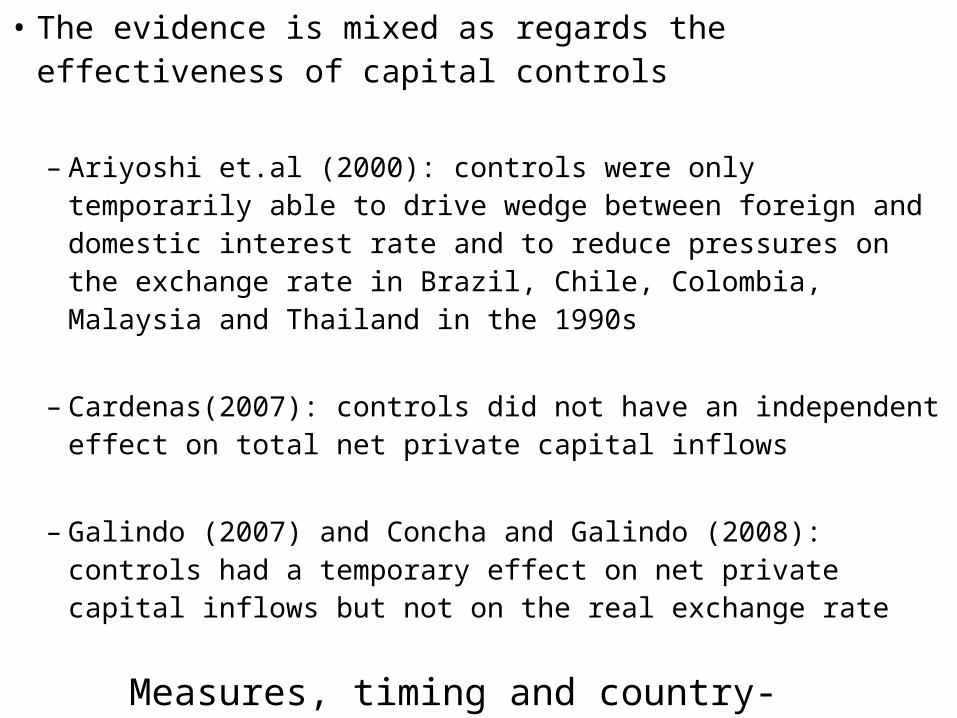
• The evidence is mixed as regards the effectiveness of capital controls
– Ariyoshi et.al (2000): controls were only temporarily able to drive wedge between foreign and domestic interest rate and to reduce pressures on the exchange rate in Brazil, Chile, Colombia, Malaysia and Thailand in the 1990s
– Cardenas(2007): controls did not have an independent effect on total net private capital inflows
– Galindo (2007) and Concha and Galindo (2008): controls had a temporary effect on net private capital inflows but not on the real exchange rate
Measures, timing and country-specific matters
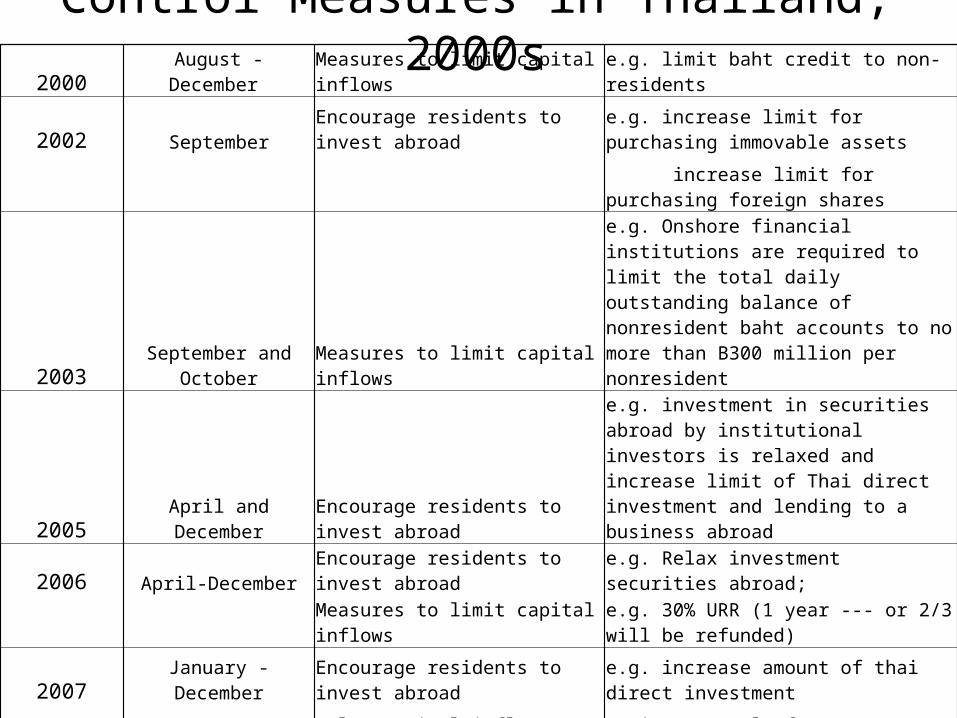
Control Measures in Thailand, 2000s2000 August - December Measures to limit capital inflows e.g. limit baht credit to non-residents
2002 SeptemberEncourage residents to invest abroad
e.g. increase limit for purchasing immovable assets
increase limit for purchasing foreign shares
2003September and
October Measures to limit capital inflows
e.g. Onshore financial institutions are required to limit the total daily outstanding balance of nonresident baht accounts to no more than B300 million per nonresident
2005 April and DecemberEncourage residents to invest abroad
e.g. investment in securities abroad by institutional investors is relaxed and increase limit of Thai direct investment and lending to a business abroad
2006 April-DecemberEncourage residents to invest abroad e.g. Relax investment securities abroad;
Measures to limit capital inflowse.g. 30% URR (1 year --- or 2/3 will be refunded)
2007 January - DecemberEncourage residents to invest abroad
e.g. increase amount of thai direct investment
Relax capital inflows restrictionsOption to apply for URR or hedge against FX risks
2008-Feb 2010
Encourage residents to invest abroad
e.g. increase amount of FDI and lending abroad
Relax capital inflows restrictions e.g. lift URR (Feb 2008)
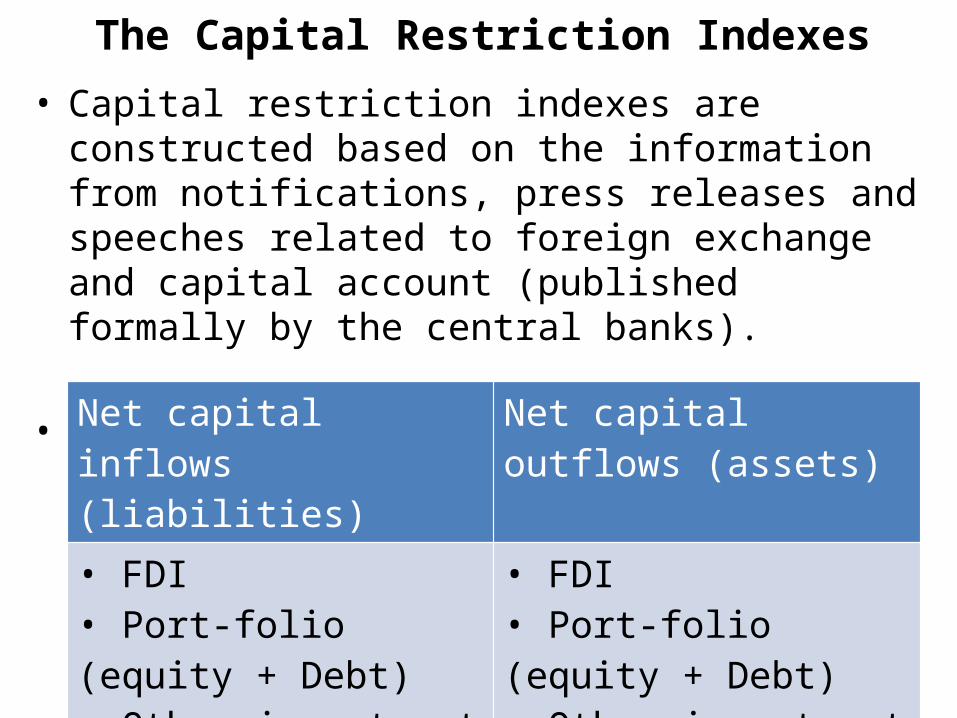
The Capital Restriction Indexes• Capital restriction indexes are constructed based on the
information from notifications, press releases and speeches related to foreign exchange and capital account (published formally by the central banks).
• Measures are conducted by different asset types
Net capital inflows (liabilities)
Net capital outflows (assets)
• FDI• Port-folio (equity + Debt)• Other investment (bank loans)
• FDI• Port-folio (equity + Debt)• Other investment (bank loans)
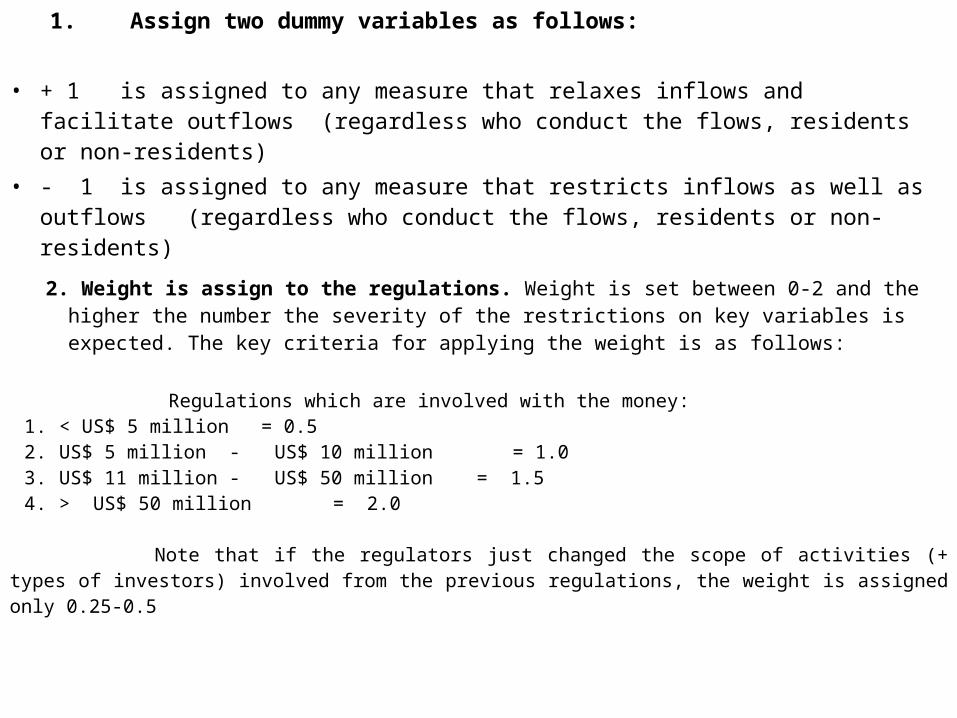
1. Assign two dummy variables as follows: • + 1 is assigned to any measure that relaxes inflows and facilitate outflows
(regardless who conduct the flows, residents or non-residents) • - 1 is assigned to any measure that restricts inflows as well as outflows
(regardless who conduct the flows, residents or non-residents)
2. Weight is assign to the regulations. Weight is set between 0-2 and the higher the number the severity of the restrictions on key variables is expected. The key criteria for applying the weight is as follows:
Regulations which are involved with the money: 1. < US$ 5 million = 0.52. US$ 5 million - US$ 10 million = 1.03. US$ 11 million - US$ 50 million = 1.54. > US$ 50 million = 2.0
Note that if the regulators just changed the scope of activities (+ types of investors) involved from the previous regulations, the weight is assigned only 0.25-0.5
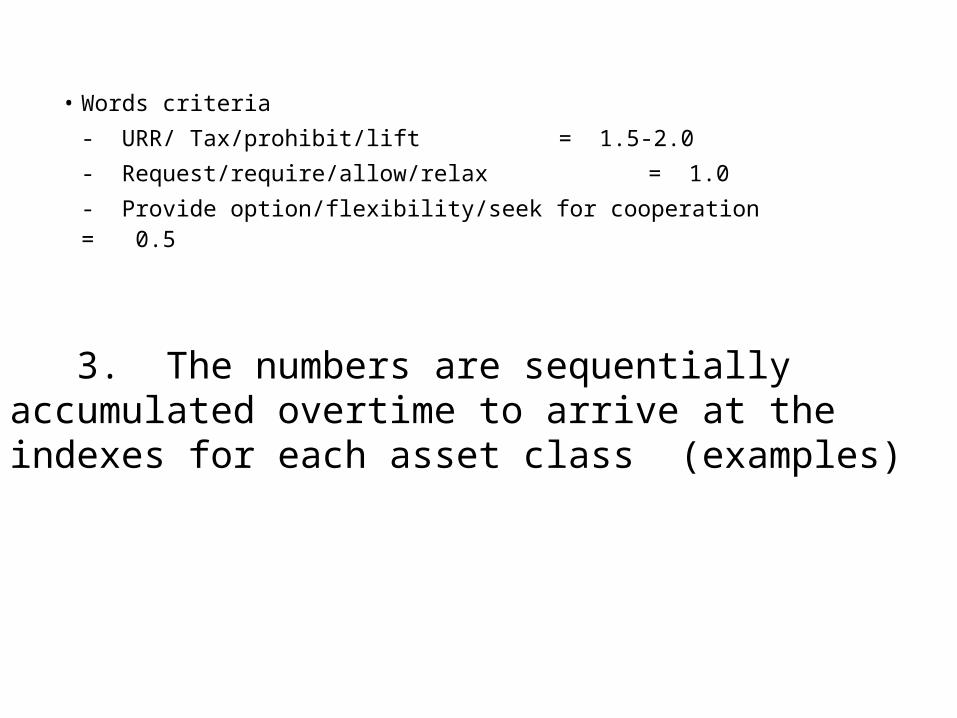
• Words criteria- URR/ Tax/prohibit/lift = 1.5-2.0- Request/require/allow/relax = 1.0- Provide option/flexibility/seek for cooperation = 0.5
3. The numbers are sequentially accumulated overtime to arrive at the indexes for each asset class (examples)
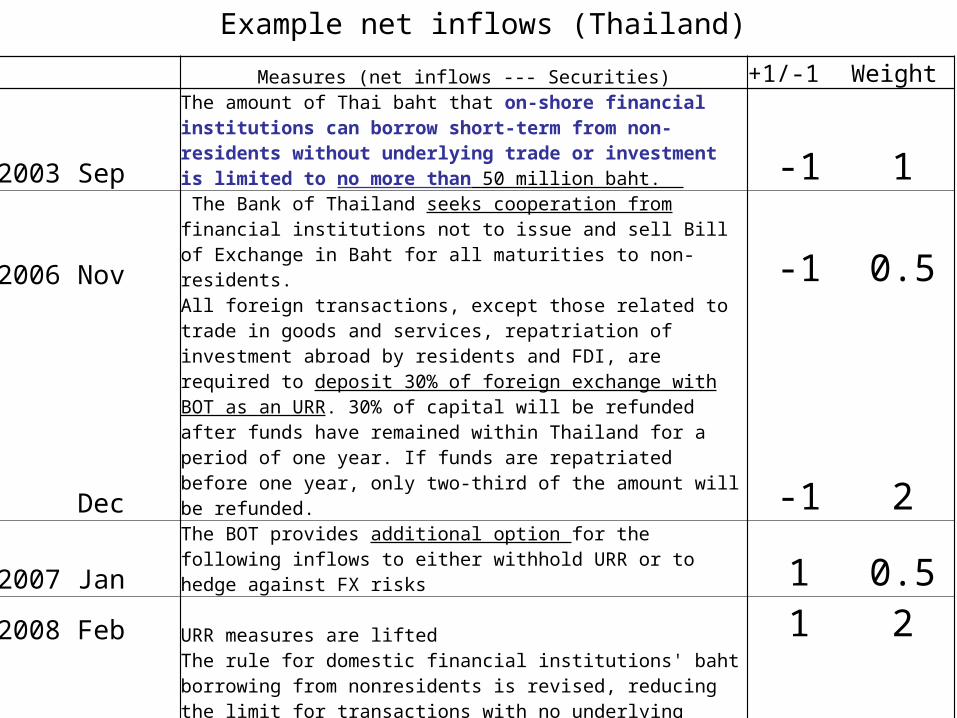
Example net inflows (Thailand)
Measures (net inflows --- Securities) +1/-1 Weight
2003 Sep
The amount of Thai baht that on-shore financial institutions can borrow short-term from non-residents without underlying trade or investment is limited to no more than 50 million baht. -1 1
2006 Nov
The Bank of Thailand seeks cooperation from financial institutions not to issue and sell Bill of Exchange in Baht for all maturities to non-residents. -1 0.5
Dec
All foreign transactions, except those related to trade in goods and services, repatriation of investment abroad by residents and FDI, are required to deposit 30% of foreign exchange with BOT as an URR. 30% of capital will be refunded after funds have remained within Thailand for a period of one year. If funds are repatriated before one year, only two-third of the amount will be refunded. -1 2
2007 JanThe BOT provides additional option for the following inflows to either withhold URR or to hedge against FX risks 1 0.5
2008 Feb URR measures are lifted 1 2
The rule for domestic financial institutions' baht borrowing from nonresidents is revised, reducing the limit for transactions with no underlying trade for all maturities to no more than B10 million outstanding balance per group of nonresidents.
Thai baht liquidity by domestic financial institutions to nonresidents is limited to no more than B300 million
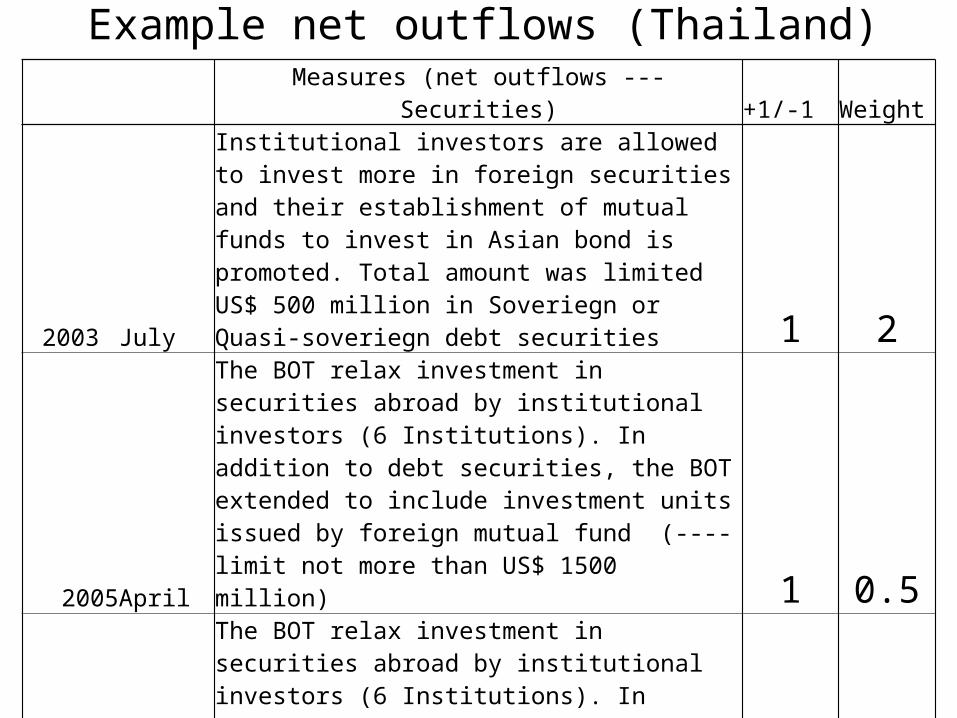
Measures (net outflows --- Securities) +1/-1 Weight
2003 July
Institutional investors are allowed to invest more in foreign securities and their establishment of mutual funds to invest in Asian bond is promoted. Total amount was limited US$ 500 million in Soveriegn or Quasi-soveriegn debt securities 1 2
2005April
The BOT relax investment in securities abroad by institutional investors (6 Institutions). In addition to debt securities, the BOT extended to include investment units issued by foreign mutual fund (---- limit not more than US$ 1500 million) 1 0.5
2006April
The BOT relax investment in securities abroad by institutional investors (6 Institutions). In addition to debt securities, the BOT extended to include investment units issued by foreign mutual fund (---- limit not more than US$ 2,000 million) 1 0.5
2009August
Increase types of institution investors by allowing juristic persons that are registered under Thai law with assets of at least Baht 5,000 million to invest in securities abroad 1 0.5
Example net outflows (Thailand)
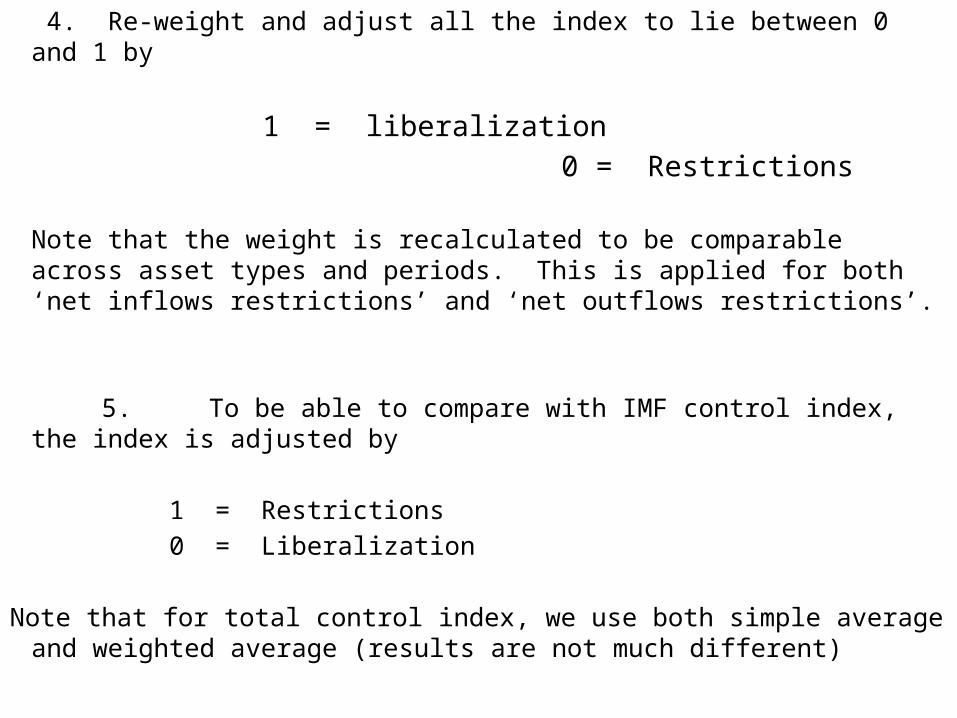
4. Re-weight and adjust all the index to lie between 0 and 1 by
1 = liberalization 0 = Restrictions
Note that the weight is recalculated to be comparable across asset types and periods. This is applied for both ‘net inflows restrictions’ and ‘net outflows restrictions’.
5. To be able to compare with IMF control index, the index is adjusted by
1 = Restrictions 0 = Liberalization
Note that for total control index, we use both simple average and weighted average (results are not much different)
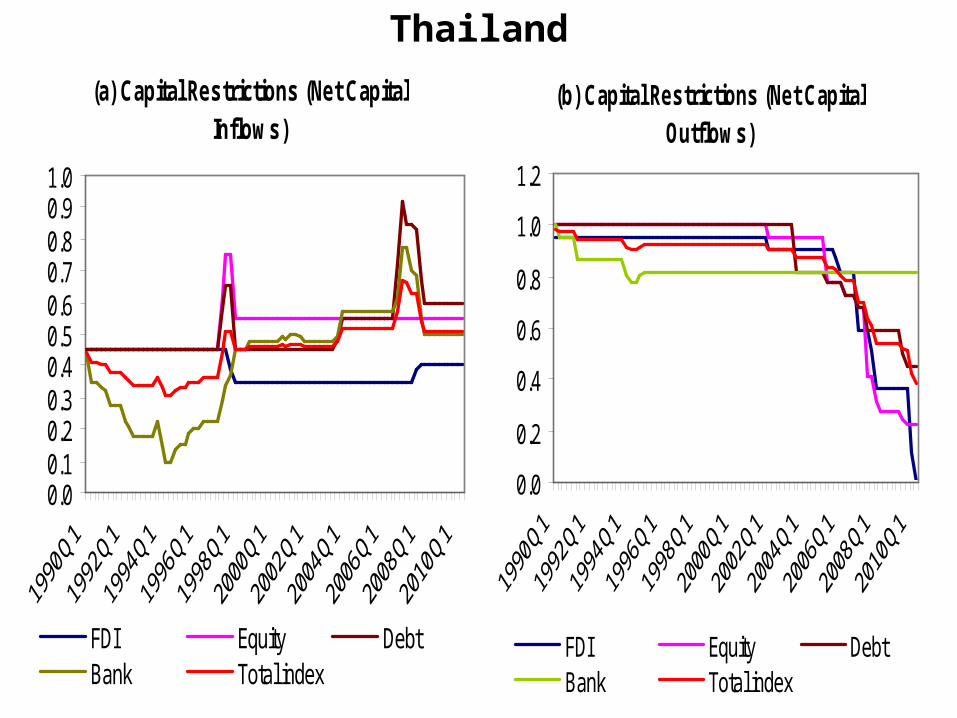
(a) Capital Restrictions (Net Capital Inflows)
0.00.10.20.30.40.50.60.70.80.91.0
FDI Equity DebtBank Total index
Thailand
(b) Capital Restrictions (Net Capital Outflows)
0.0
0.2
0.4
0.6
0.8
1.0
1.2
FDI Equity DebtBank Total index
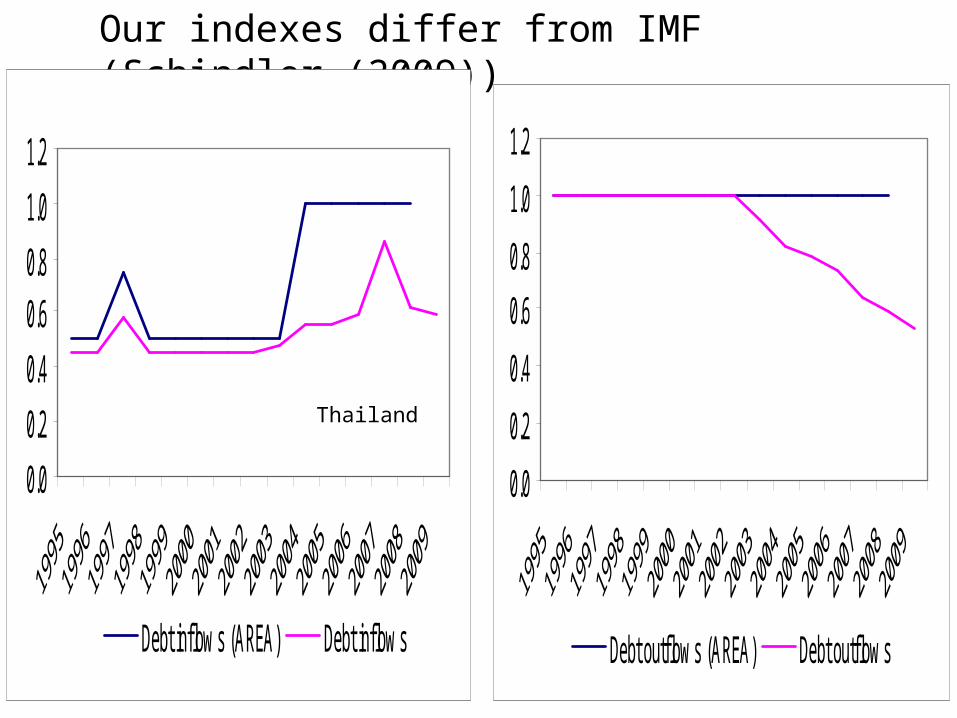
Our indexes differ from IMF (Schindler (2009))
0.0
0.2
0.4
0.60.8
1.0
1.2
Debt inf low s (AREA) Debt inf low s
0.0
0.2
0.4
0.6
0.8
1.0
1.2
Debt outf low s (AREA) Debt outf low s
Thailand
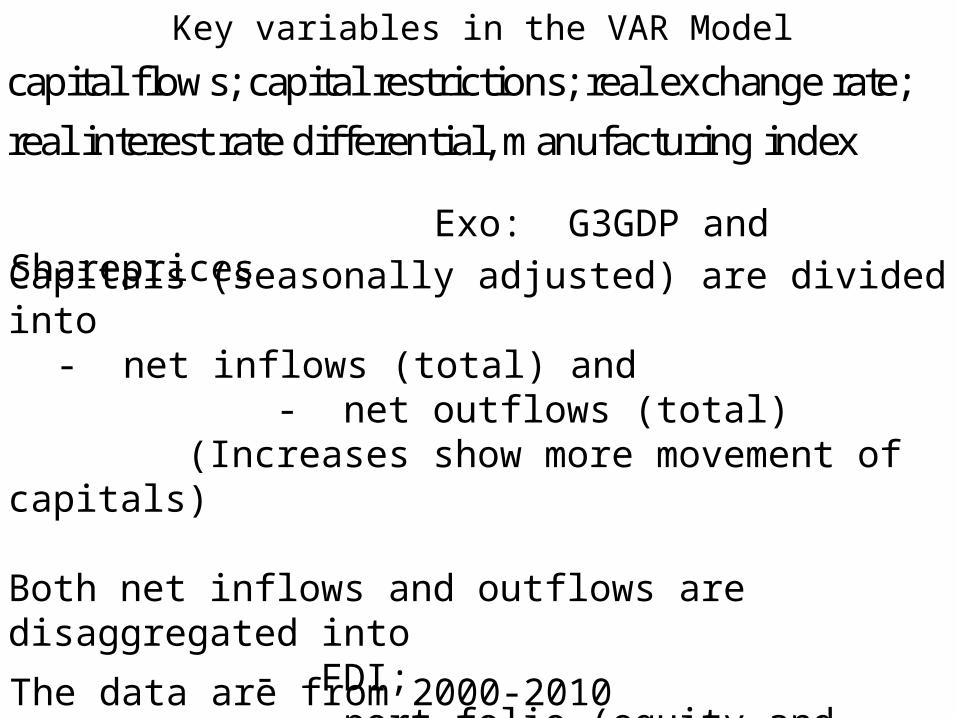
Key variables in the VAR Modelcapital flows; capital restrictions; real exchange rate;
real interest rate differential, manufacturing index
Capitals (seasonally adjusted) are divided into - net inflows (total) and
- net outflows (total) (Increases show more movement of capitals)
Both net inflows and outflows are disaggregated into - FDI; - port-folio (equity and debts) and - other investment (bank)
The data are from 2000-2010
Exo: G3GDP and Shareprices
• Capital restriction indexes (our indexes lie between 0 and 1)– The higher the value, the increase the restrictions
• Real Effective Exchange Rate (both BOT and BIS)- Increase reflects appreciation
• Real interest rate differentials- The difference between the Thai policy rate and the US
3-month Treasury bill rate, each adjusted by CPI inflation (sensitivity for choices of interest rates)
• Manufacturing production index (BOT, 2000=100) (sensitivity for realGDP)
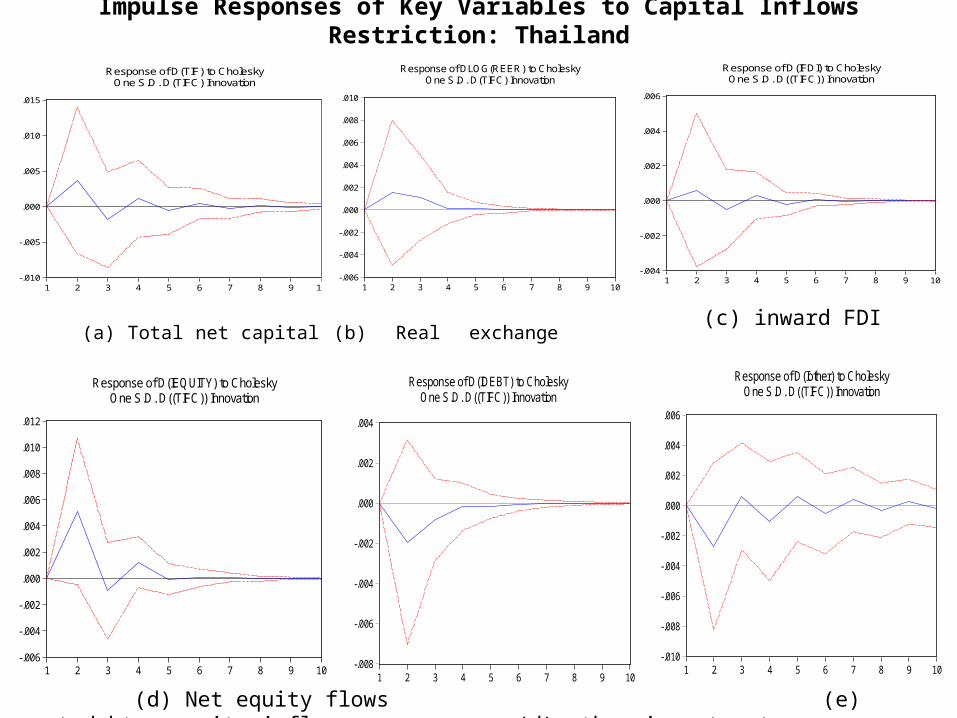
(a) Total net capital inflows (b) Real exchange rate
-.010
-.005
.000
.005
.010
.015
1 2 3 4 5 6 7 8 9 10
Response of D(TIF) to CholeskyOne S.D. D(TIFC) Innovation
-.006
-.004
-.002
.000
.002
.004
.006
.008
.010
1 2 3 4 5 6 7 8 9 10
Response of DLOG(REER) to CholeskyOne S.D. D(TIFC) Innovation
-.004
-.002
.000
.002
.004
.006
1 2 3 4 5 6 7 8 9 10
Response of D(IFDI) to CholeskyOne S.D. D((TIFC)) Innovation
-.006
-.004
-.002
.000
.002
.004
.006
.008
.010
.012
1 2 3 4 5 6 7 8 9 10
Response of D(IEQUITY) to CholeskyOne S.D. D((TIFC)) Innovation
-.008
-.006
-.004
-.002
.000
.002
.004
1 2 3 4 5 6 7 8 9 10
Response of D(IDEBT) to CholeskyOne S.D. D((TIFC)) Innovation
-.010
-.008
-.006
-.004
-.002
.000
.002
.004
.006
1 2 3 4 5 6 7 8 9 10
Response of D(Iother) to CholeskyOne S.D. D((TIFC)) Innovation
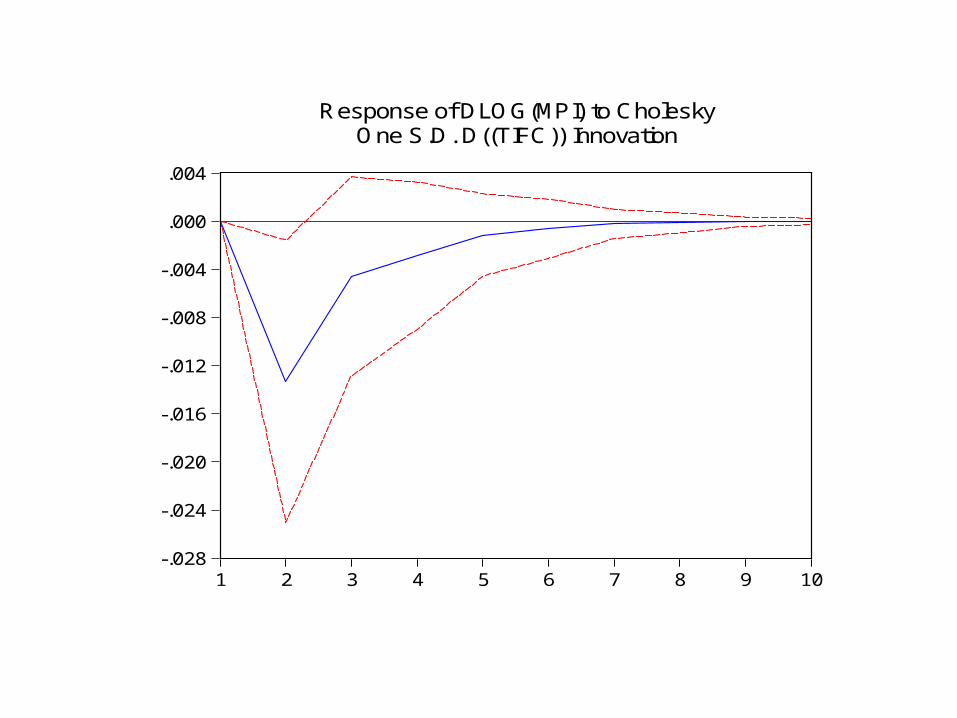
Impulse Responses of Key Variables to Capital Inflows Restriction: Thailand
(c) inward FDI
(d) Net equity flows (e) net debt security inflows (d) other investment
-.028
-.024
-.020
-.016
-.012
-.008
-.004
.000
.004
1 2 3 4 5 6 7 8 9 10
Response of DLOG(MPI) to CholeskyOne S.D. D((TIFC)) Innovation
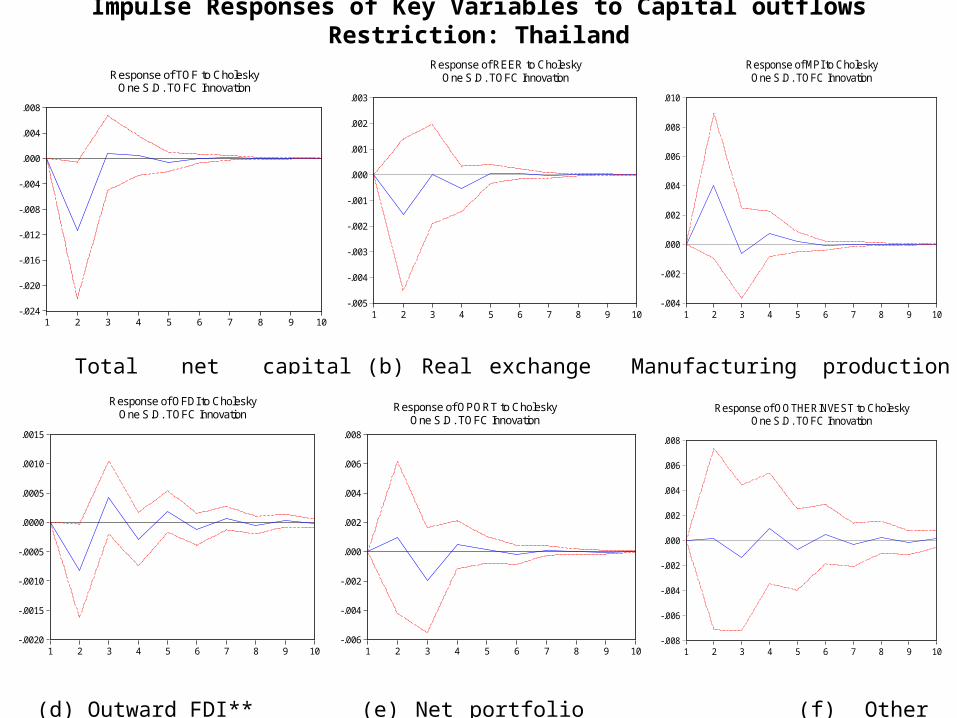
Total net capital outflows** (b) Real exchange rate Manufacturing production index**
(d) Outward FDI** (e) Net portfolio outflows (f) Other investment outflows
-.024
-.020
-.016
-.012
-.008
-.004
.000
.004
.008
1 2 3 4 5 6 7 8 9 10
Response of TOF to CholeskyOne S.D. TOFC Innovation
-.005
-.004
-.003
-.002
-.001
.000
.001
.002
.003
1 2 3 4 5 6 7 8 9 10
Response of REER to CholeskyOne S.D. TOFC Innovation
-.004
-.002
.000
.002
.004
.006
.008
.010
1 2 3 4 5 6 7 8 9 10
Response of MPI to CholeskyOne S.D. TOFC Innovation
-.0020
-.0015
-.0010
-.0005
.0000
.0005
.0010
.0015
1 2 3 4 5 6 7 8 9 10
Response of OFDI to CholeskyOne S.D. TOFC Innovation
-.006
-.004
-.002
.000
.002
.004
.006
.008
1 2 3 4 5 6 7 8 9 10
Response of OPORT to CholeskyOne S.D. TOFC Innovation
-.008
-.006
-.004
-.002
.000
.002
.004
.006
.008
1 2 3 4 5 6 7 8 9 10
Response of OOTHERINVEST to CholeskyOne S.D. TOFC Innovation
Impulse Responses of Key Variables to Capital outflows Restriction: Thailand
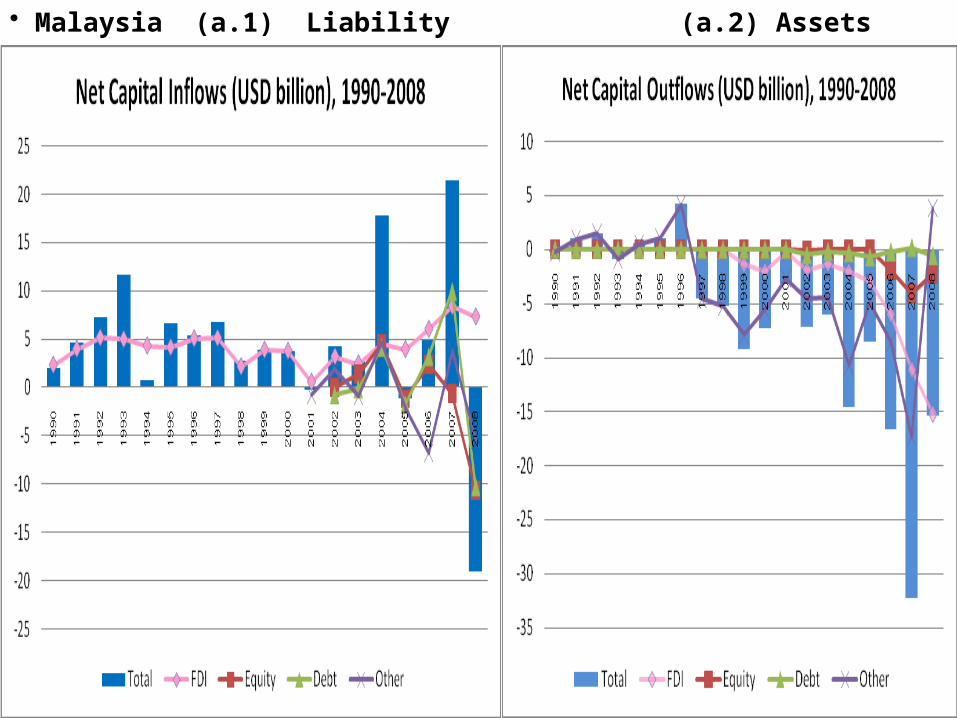
• Malaysia (a.1) Liability (a.2) Assets
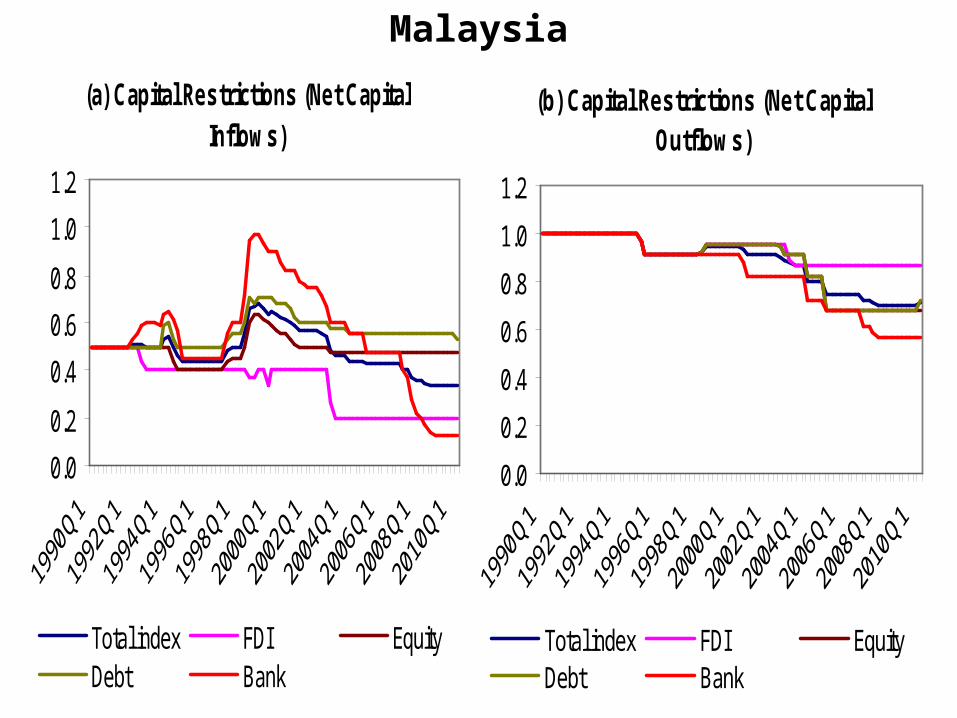
(a) Capital Restrictions (Net Capital Inflows)
0.0
0.2
0.4
0.6
0.8
1.0
1.2
Total index FDI EquityDebt Bank
Malaysia
(b) Capital Restrictions (Net Capital Outflows)
0.0
0.2
0.4
0.6
0.8
1.0
1.2
Total index FDI EquityDebt Bank
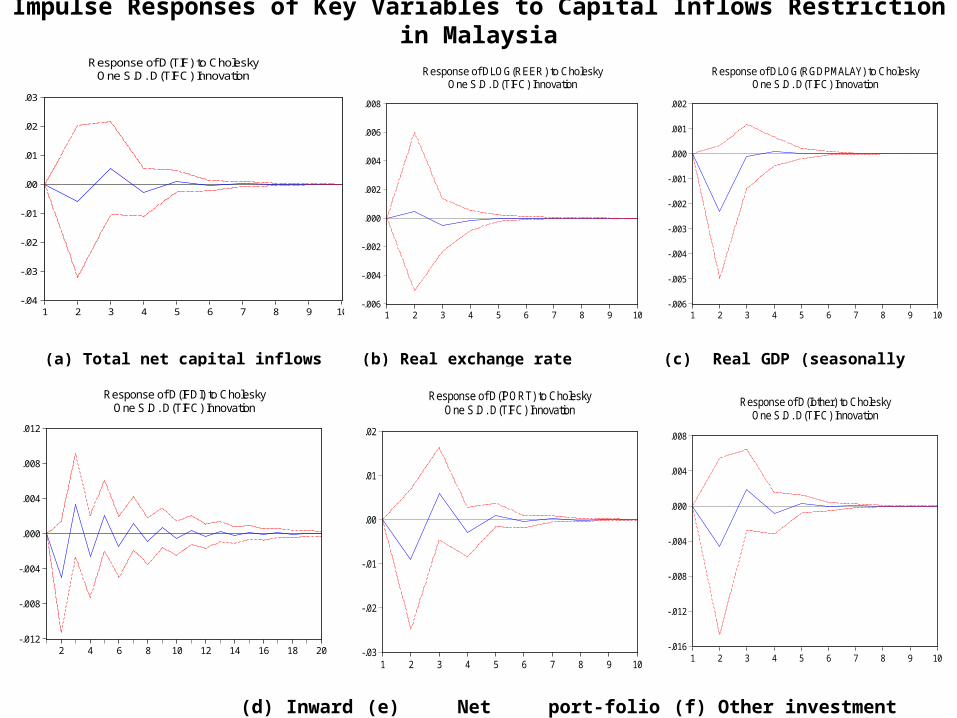
(a) Total net capital inflows (b) Real exchange rate (c) Real GDP (seasonally
adjusted)
(d) Inward FDI** (e) Net port-folio inflows** (f) Other investment
-.04
-.03
-.02
-.01
.00
.01
.02
.03
1 2 3 4 5 6 7 8 9 10
Response of D(TIF) to CholeskyOne S.D. D(TIFC) Innovation
-.006
-.004
-.002
.000
.002
.004
.006
.008
1 2 3 4 5 6 7 8 9 10
Response of DLOG(REER) to CholeskyOne S.D. D(TIFC) Innovation
-.006
-.005
-.004
-.003
-.002
-.001
.000
.001
.002
1 2 3 4 5 6 7 8 9 10
Response of DLOG(RGDPMALAY) to CholeskyOne S.D. D(TIFC) Innovation
-.012
-.008
-.004
.000
.004
.008
.012
2 4 6 8 10 12 14 16 18 20
Response of D(IFDI) to CholeskyOne S.D. D(TIFC) Innovation
-.03
-.02
-.01
.00
.01
.02
1 2 3 4 5 6 7 8 9 10
Response of D(IPORT) to CholeskyOne S.D. D(TIFC) Innovation
-.016
-.012
-.008
-.004
.000
.004
.008
1 2 3 4 5 6 7 8 9 10
Response of D(Iother) to CholeskyOne S.D. D(TIFC) Innovation
Impulse Responses of Key Variables to Capital Inflows Restriction in Malaysia
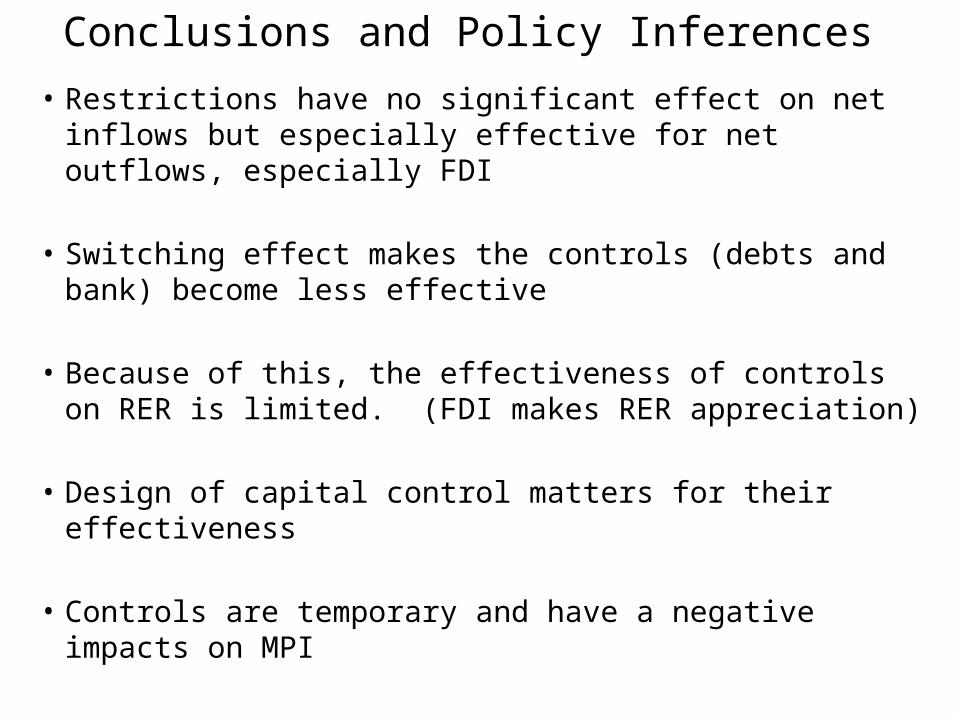
Conclusions and Policy Inferences
• Restrictions have no significant effect on net inflows but especially effective for net outflows, especially FDI
• Switching effect makes the controls (debts and bank) become less effective
• Because of this, the effectiveness of controls on RER is limited. (FDI makes RER appreciation)
• Design of capital control matters for their effectiveness
• Controls are temporary and have a negative impacts on MPI
• Encouraging outflows are more effective, especially FDI.
• Insignificance for other flows could be because of home bias
• Under current situation, capital flows have begun to show its effect >= current account since 2010Q2.
• Baht appreciation: reduce volatility + find the reasons why most of exporters do not hedge
• Closely monitor capital inflows --- concerns on stability of financial market (well design controls matter)
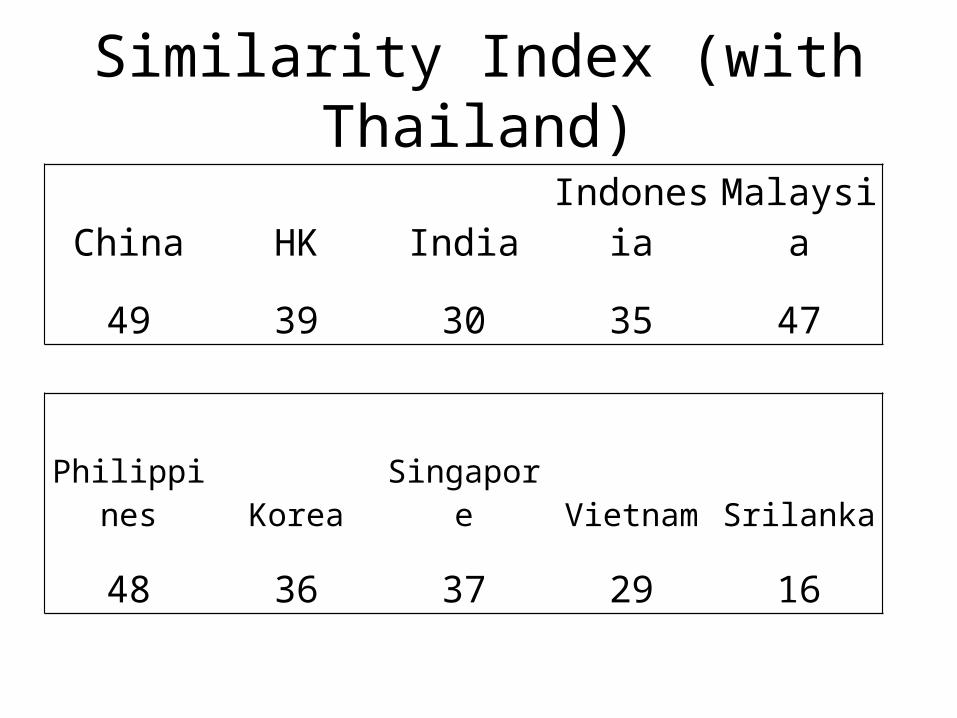
Similarity Index (with Thailand)
China HK India Indonesia Malaysia
49 39 30 35 47
Philippines Korea Singapore Vietnam Srilanka
48 36 37 29 16