Embed Size (px)
Citation preview
SYMPOSIUM SERIES No. 149 © 2003 IChemE
699
“HOW DOES SAFETY PERFORMANCE AFFECT CORPORATE VALUE”
M. Hobbs and G.C. Stevens Arthur D Little, Science Park Cambridge CB4 4DW
It is conventional to measure corporate safety performance using measures of accident frequency such as lost time injury rate. However, it has long been recognised that safety losses include many ef fects in addition to injury to staff such as Property Loss, Third Party Liability, Business Interruption, Environmental remediation and Loss of Corporate Reputation. This paper discusses the use of loss profiles to evaluate property loss and provides a practical illustration of the extension of the approach to third party liability. The probabilistic treatment of business interruption and environmental remediation costs is also discussed. Finally the effect of major accidents on corporate value is reviewed. Two different patterns of response are outlined, one in which effective management response to an emergency leads to recovery of initial share value declines and the other in which market recovery does not occur and may in some cases lead to the f inancial failure of the f irm. The relationship between corporate reputation and loss of corporate value following a major accident is examined and illustrated with case histories.
Corporate Reputation; Risk Management; Loss Prof iles
INTRODUCTION Major accidents often lead to initiatives to improve safety performance through improved regulation. These initiatives may be internal to the company, for example Union Carbide’s development of its Episodic Risk Management program following the Bhopal accident, or they may be the spur to national or international regulation, for example the European Union directives adopted in the aftermath of the Seveso catastrophe. Even where there is a comprehensive safety management framework developed in response to historical disasters, for example in the UK rail industry, a succession of accidents may still occur which in the case of Railtrack contributed to a weakening of the company position.
This paper examines the methods used to assess potential losses resulting from major accidents and extends the thinking to include corporate reputation. Case histories are used to indicate two paths following such an event, one leading to recovery and continued operation and the other to erosion of the company’s position, and eventually to its bankruptcy.
ASSESSMENT OF SAFETY PERFORMANCE Quantified risk analysis (QRA) has become conventional in the assessment of safety performance over the past 20 years. When applied to a selection of petrochemical facilities in the Rijnmond area it was a cutting edge technique1 but has now become a routine part of facility assessment. This does not mean that the methods are applied consistently. Recent reviews of QRA work carried out in fulfillment of the Seveso II directive2 shows just how much disparity can be found in results from different practitioners.
SYMPOSIUM SERIES No. 149 © 2003 IChemE
700
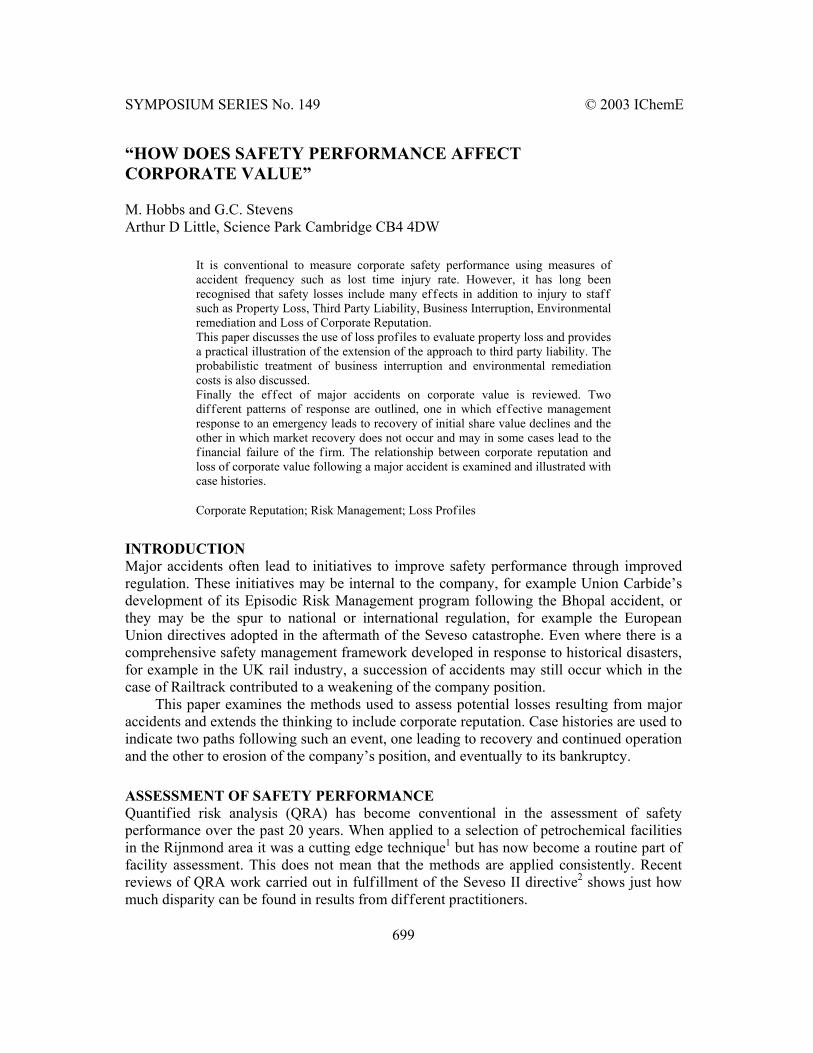
Typical output from QRA studies is provided as individual risk of fatality contours showing the risk exposure from the facility to a ‘theoretical’ individual with full time exposure.
Figure 1. Individual risk of fatality Contours superimposed on a facility
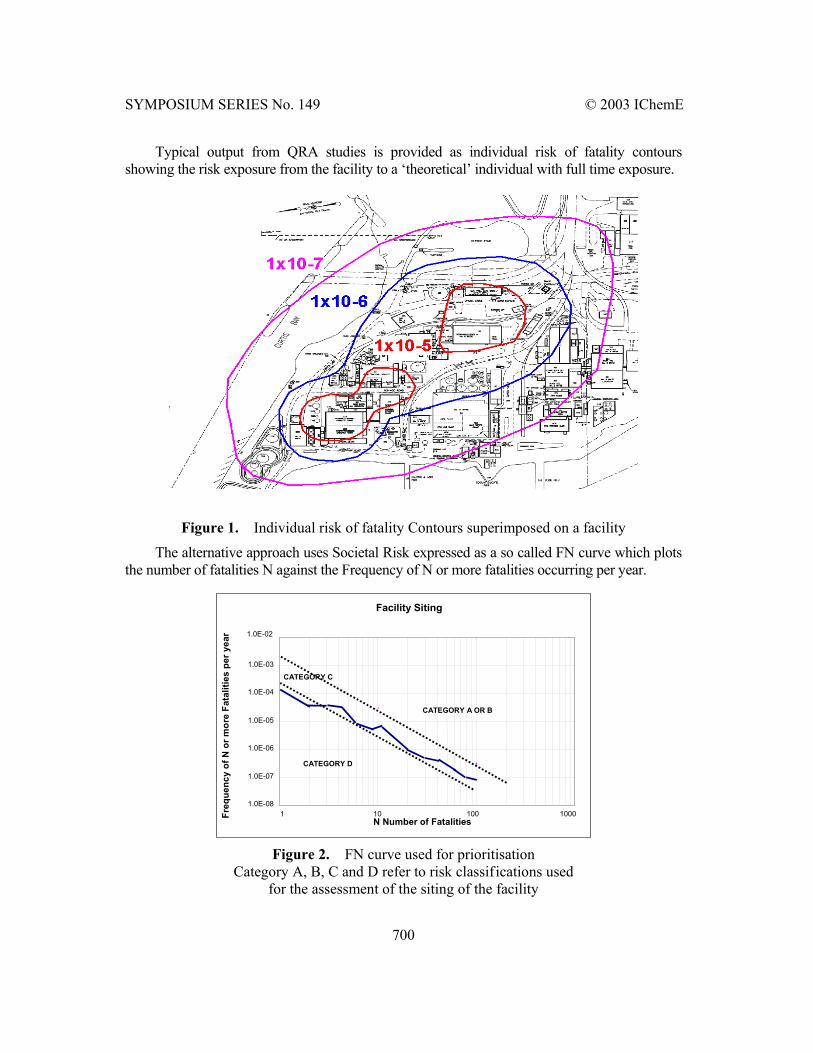
The alternative approach uses Societal Risk expressed as a so called FN curve which plots the number of fatalities N against the Frequency of N or more fatalities occurring per year.
Facility Siting
1.0E-08
1.0E-07
1.0E-06
1.0E-05
1.0E-04
1.0E-03
1.0E-02
1 10 100 1000N Number of FatalitiesFr
eque
ncy
of N
or m
ore
Fata
litie
s pe
r yea
r
CATEGORY A OR B
CATEGORY D
CATEGORY C
Figure 2. FN curve used for prioritisation
Category A, B, C and D refer to risk classifications used for the assessment of the siting of the facility
SYMPOSIUM SERIES No. 149 © 2003 IChemE
701
The Individual Risk of fatality contours can be applied to those working on the site as well as to neighbours who are potentially third parties affected by any major accident. Risk acceptability criteria have been promulgated by regulatory authorities using both individual risk of fatality criteria3 and societal risk criteria4 for guidance on risk acceptability.
These well established techniques provide a numerical basis for the assessment of safety performance.
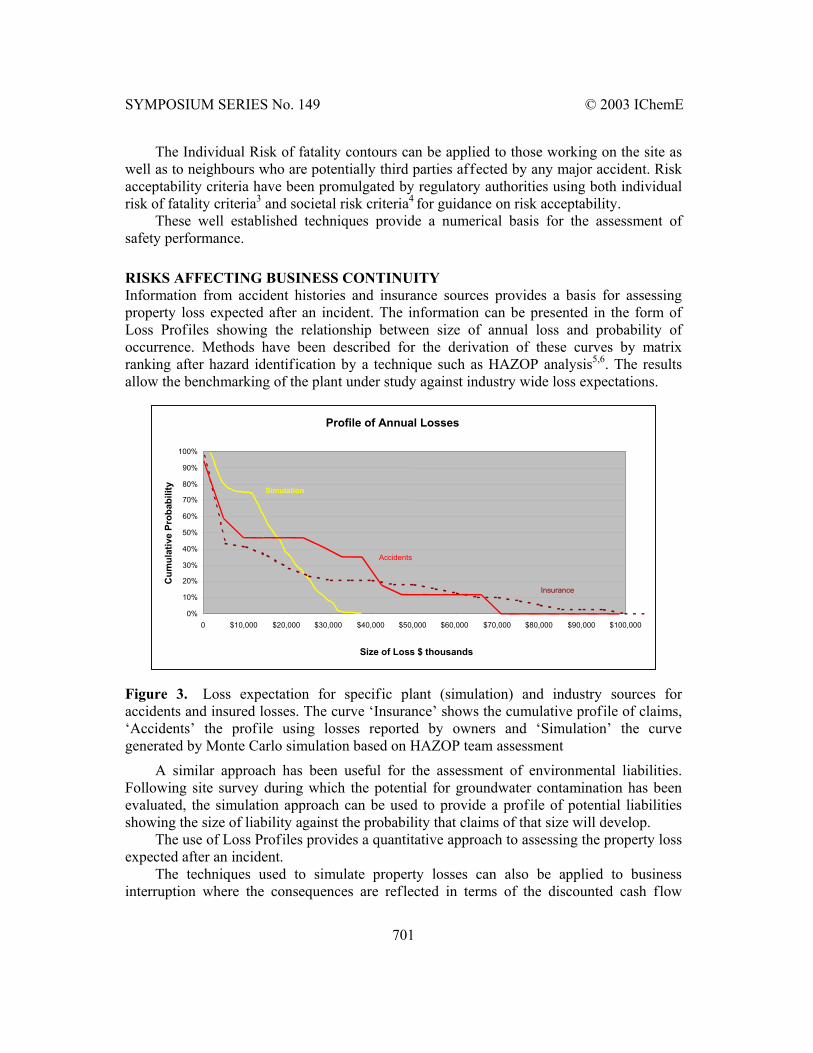
RISKS AFFECTING BUSINESS CONTINUITY Information from accident histories and insurance sources provides a basis for assessing property loss expected after an incident. The information can be presented in the form of Loss Profiles showing the relationship between size of annual loss and probability of occurrence. Methods have been described for the derivation of these curves by matrix ranking after hazard identification by a technique such as HAZOP analysis5,6. The results allow the benchmarking of the plant under study against industry wide loss expectations.
Profile of Annual Losses
0%
10%
20%
30%
40%
50%
60%
70%
80%
90%
100%
0 $10,000 $20,000 $30,000 $40,000 $50,000 $60,000 $70,000 $80,000 $90,000 $100,000
Size of Loss $ thousands
Cum
ulat
ive
Prob
abili
ty
Accidents
Insurance
Simulation
Figure 3. Loss expectation for specific plant (simulation) and industry sources for accidents and insured losses. The curve ‘Insurance’ shows the cumulative profile of claims, ‘Accidents’ the profile using losses reported by owners and ‘Simulation’ the curve generated by Monte Carlo simulation based on HAZOP team assessment
A similar approach has been useful for the assessment of environmental liabilities. Following site survey during which the potential for groundwater contamination has been evaluated, the simulation approach can be used to provide a profile of potential liabilities showing the size of liability against the probability that claims of that size will develop.
The use of Loss Profiles provides a quantitative approach to assessing the property loss expected after an incident.
The techniques used to simulate property losses can also be applied to business interruption where the consequences are reflected in terms of the discounted cash flow
SYMPOSIUM SERIES No. 149 © 2003 IChemE
702
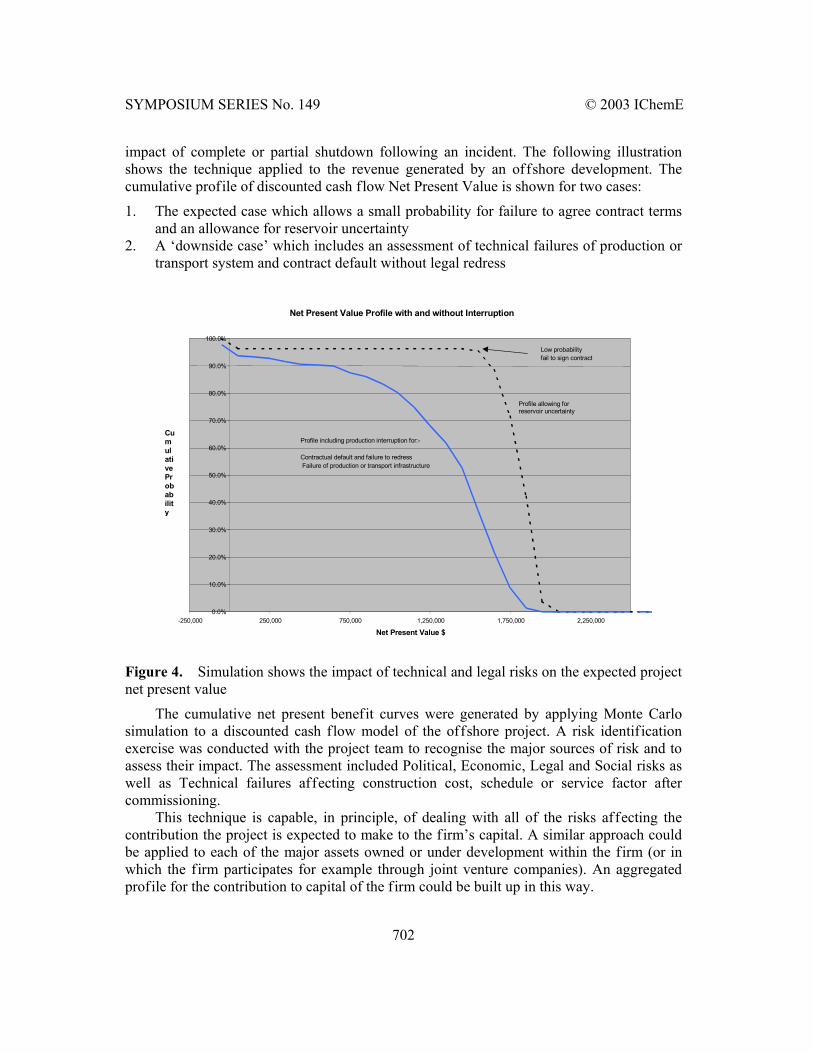
impact of complete or partial shutdown following an incident. The following illustration shows the technique applied to the revenue generated by an offshore development. The cumulative profile of discounted cash flow Net Present Value is shown for two cases:
1. The expected case which allows a small probability for failure to agree contract terms and an allowance for reservoir uncertainty
2. A ‘downside case’ which includes an assessment of technical failures of production or transport system and contract default without legal redress
Figure 4. Simulation shows the impact of technical and legal risks on the expected project net present value
The cumulative net present benefit curves were generated by applying Monte Carlo simulation to a discounted cash flow model of the offshore project. A risk identif ication exercise was conducted with the project team to recognise the major sources of risk and to assess their impact. The assessment included Political, Economic, Legal and Social risks as well as Technical failures affecting construction cost, schedule or service factor after commissioning.
This technique is capable, in principle, of dealing with all of the risks affecting the contribution the project is expected to make to the firm’s capital. A similar approach could be applied to each of the major assets owned or under development within the firm (or in which the firm participates for example through joint venture companies). An aggregated profile for the contribution to capital of the firm could be built up in this way.
Net Present Value Profile with and without Interruption
0.0%
10.0%
20.0%
30.0%
40.0%
50.0%
60.0%
70.0%
80.0%
90.0%
100.0%
-250,000 250,000 750,000 1,250,000 1,750,000 2,250,000 Net Present Value $
Cumulative Probability
Profile allowing for reservoir uncertainty
Low probability fail to sign contract
Profile including production interruption for:- Contractual default and failure to redress Failure of production or transport infrastructure
SYMPOSIUM SERIES No. 149 © 2003 IChemE
703
The approach outlined above provides a method to numerically assess most of the loss expected after an incident except impact on corporate reputation. As case studies show, companies may suffer considerable erosion in value, in extreme cases leading to bankruptcy, not simply through failure of their tangible assets but also as a result of loss of Corporate Reputation. The loss of reputation may arise for a number of reasons, for example financial or professional impropriety. However, for a number of businesses where safety is of paramount importance, major accidents can threaten Corporate Reputation. Where the firm is relatively large and the losses comparatively small, such an accident may not cripple the entire company but can have severe local consequences for the facility involved. In other cases a succession of major losses or even one major accident can initiate a process leading to collapse of the company value.
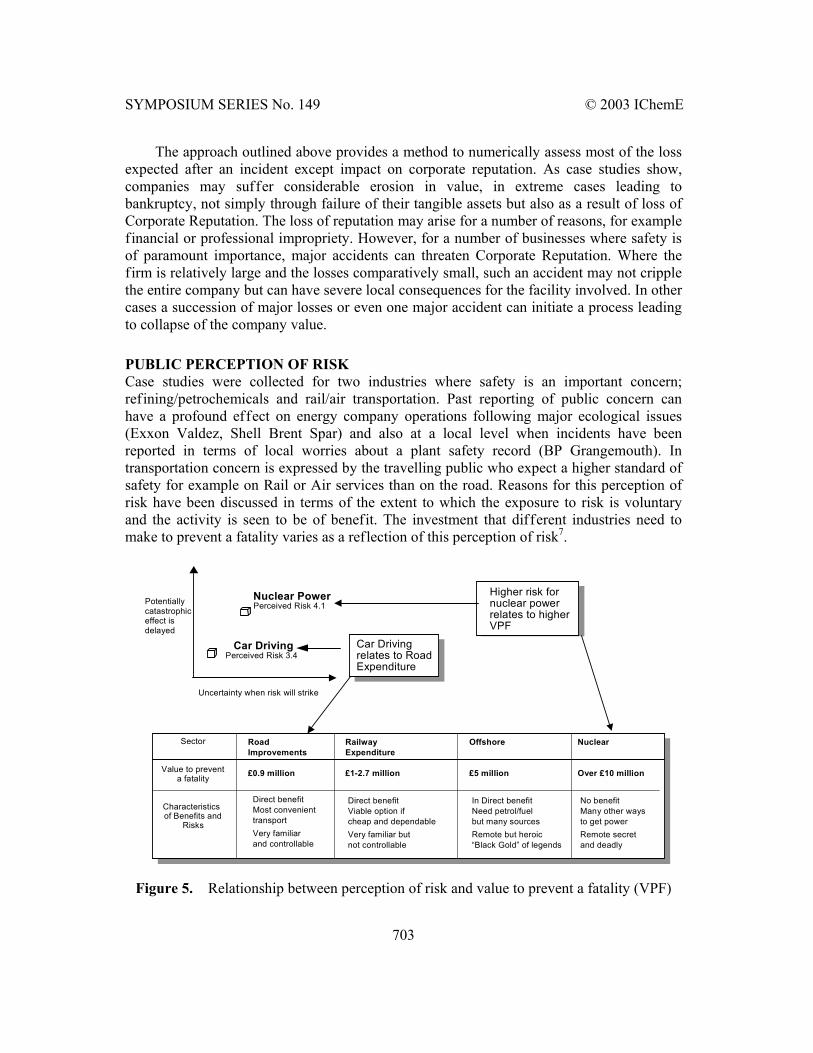
PUBLIC PERCEPTION OF RISK Case studies were collected for two industries where safety is an important concern; refining/petrochemicals and rail/air transportation. Past reporting of public concern can have a profound effect on energy company operations following major ecological issues (Exxon Valdez, Shell Brent Spar) and also at a local level when incidents have been reported in terms of local worries about a plant safety record (BP Grangemouth). In transportation concern is expressed by the travelling public who expect a higher standard of safety for example on Rail or Air services than on the road. Reasons for this perception of risk have been discussed in terms of the extent to which the exposure to risk is voluntary and the activity is seen to be of benefit. The investment that different industries need to make to prevent a fatality varies as a reflection of this perception of risk7.
Figure 5. Relationship between perception of risk and value to prevent a fatality (VPF)
RoadImprovements
£0.9 million
RailwayExpenditure
£1-2.7 million
Offshore
£5 million
Nuclear
Over £10 million
Direct benefitMost convenienttransport
Direct benefitViable option ifcheap and dependable
In Direct benefitNeed petrol/fuelbut many sources
No benefitMany other waysto get power
Very familiarand controllable
Very familiar butnot controllable
Remote but heroic“Black Gold” of legends
Remote secretand deadly
Sector
Value to preventa fatality
Characteristicsof Benefits and
Risks
Uncertainty when risk will strike
Nuclear PowerPerceived Risk 4.1
Car DrivingPerceived Risk 3.4
Car Drivingrelates to RoadExpenditure
Higher risk fornuclear powerrelates to higherVPF
Potentiallycatastrophiceffect isdelayed
SYMPOSIUM SERIES No. 149 © 2003 IChemE
704
CASE STUDIES OF LOSS FOLLOWING ACCIDENTS
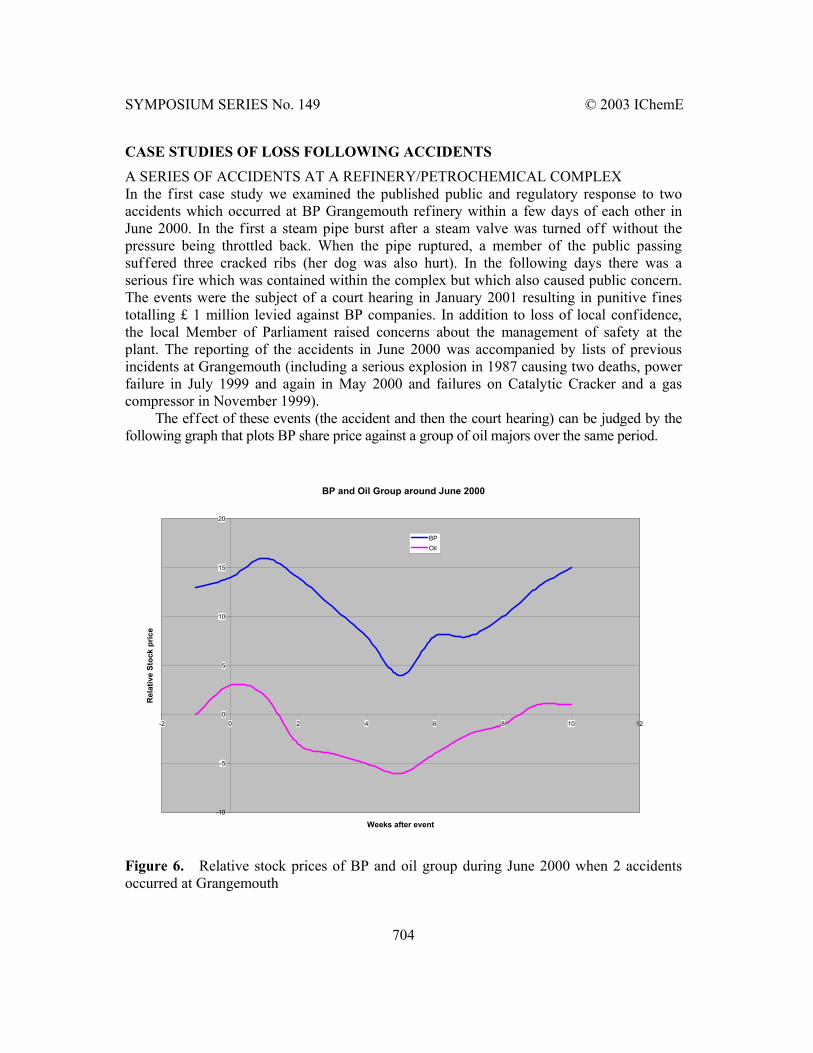
A SERIES OF ACCIDENTS AT A REFINERY/PETROCHEMICAL COMPLEX In the first case study we examined the published public and regulatory response to two accidents which occurred at BP Grangemouth refinery within a few days of each other in June 2000. In the first a steam pipe burst after a steam valve was turned off without the pressure being throttled back. When the pipe ruptured, a member of the public passing suffered three cracked ribs (her dog was also hurt). In the following days there was a serious fire which was contained within the complex but which also caused public concern. The events were the subject of a court hearing in January 2001 resulting in punitive fines totalling £ 1 million levied against BP companies. In addition to loss of local confidence, the local Member of Parliament raised concerns about the management of safety at the plant. The reporting of the accidents in June 2000 was accompanied by lists of previous incidents at Grangemouth (including a serious explosion in 1987 causing two deaths, power failure in July 1999 and again in May 2000 and failures on Catalytic Cracker and a gas compressor in November 1999).
The effect of these events (the accident and then the court hearing) can be judged by the following graph that plots BP share price against a group of oil majors over the same period.
Figure 6. Relative stock prices of BP and oil group during June 2000 when 2 accidents occurred at Grangemouth
BP and Oil Group around June 2000
-10
-5
0
5
10
15
20
-2 0 2 4 6 8 10 12
Weeks after event
Rel
ativ
e St
ock
pric
e
BPOil
SYMPOSIUM SERIES No. 149 © 2003 IChemE
705
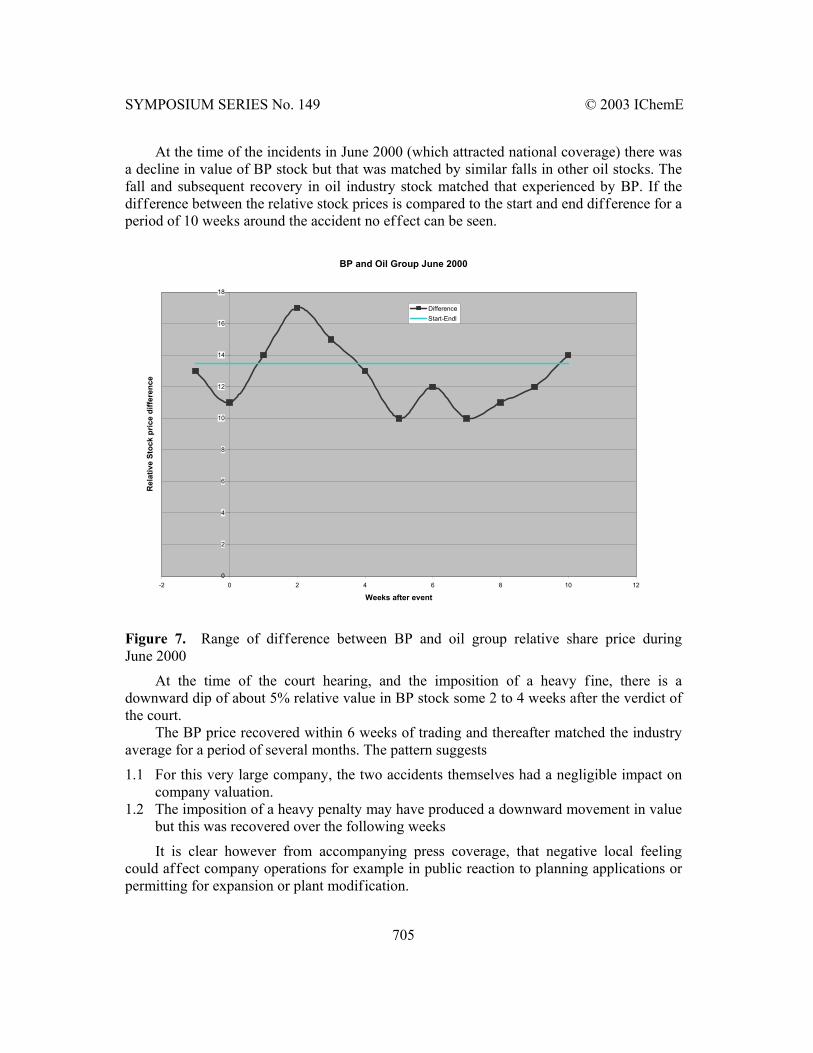
At the time of the incidents in June 2000 (which attracted national coverage) there was a decline in value of BP stock but that was matched by similar falls in other oil stocks. The fall and subsequent recovery in oil industry stock matched that experienced by BP. If the difference between the relative stock prices is compared to the start and end difference for a period of 10 weeks around the accident no effect can be seen.
Figure 7. Range of difference between BP and oil group relative share price during June 2000
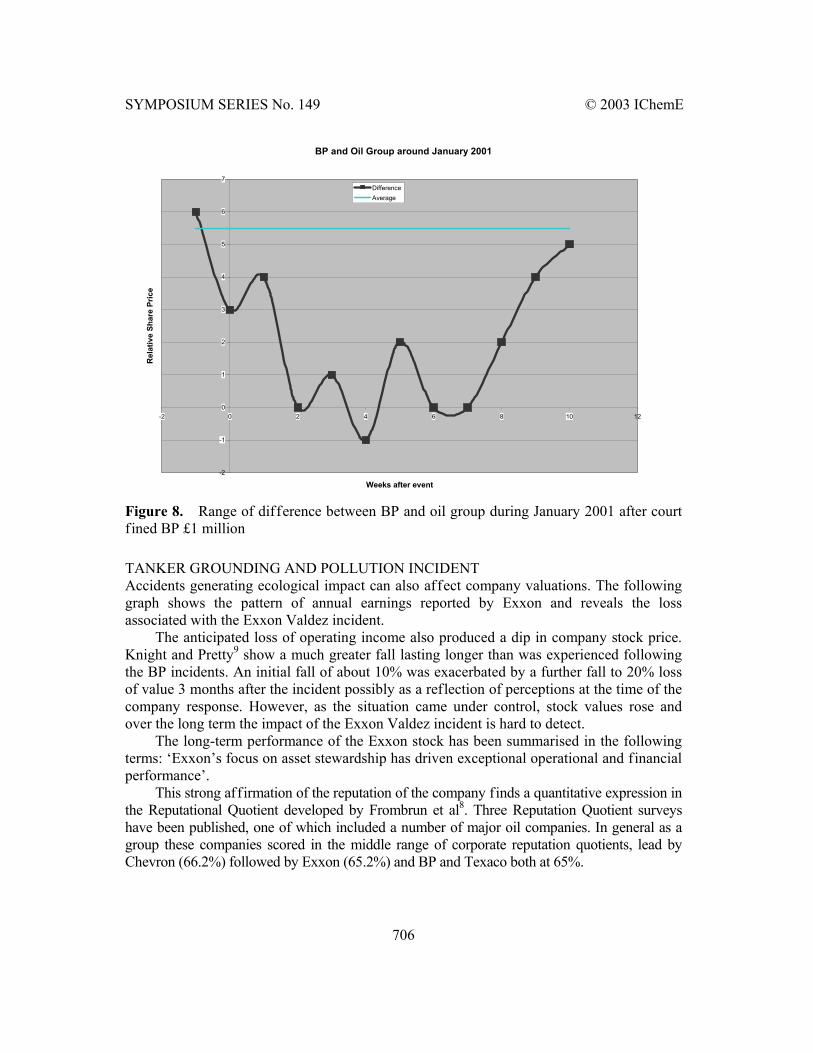
At the time of the court hearing, and the imposition of a heavy fine, there is a downward dip of about 5% relative value in BP stock some 2 to 4 weeks after the verdict of the court.
The BP price recovered within 6 weeks of trading and thereafter matched the industry average for a period of several months. The pattern suggests
1.1 For this very large company, the two accidents themselves had a negligible impact on company valuation.
1.2 The imposition of a heavy penalty may have produced a downward movement in value but this was recovered over the following weeks
It is clear however from accompanying press coverage, that negative local feeling could affect company operations for example in public reaction to planning applications or permitting for expansion or plant modification.
BP and Oil Group June 2000
0
2
4
6
8
10
12
14
16
18
-2 0 2 4 6 8 10 12
Weeks after event
Rel
ativ
e St
ock
pric
e di
ffere
nce
DifferenceStart-Endl
SYMPOSIUM SERIES No. 149 © 2003 IChemE
706
Figure 8. Range of difference between BP and oil group during January 2001 after court fined BP £1 million
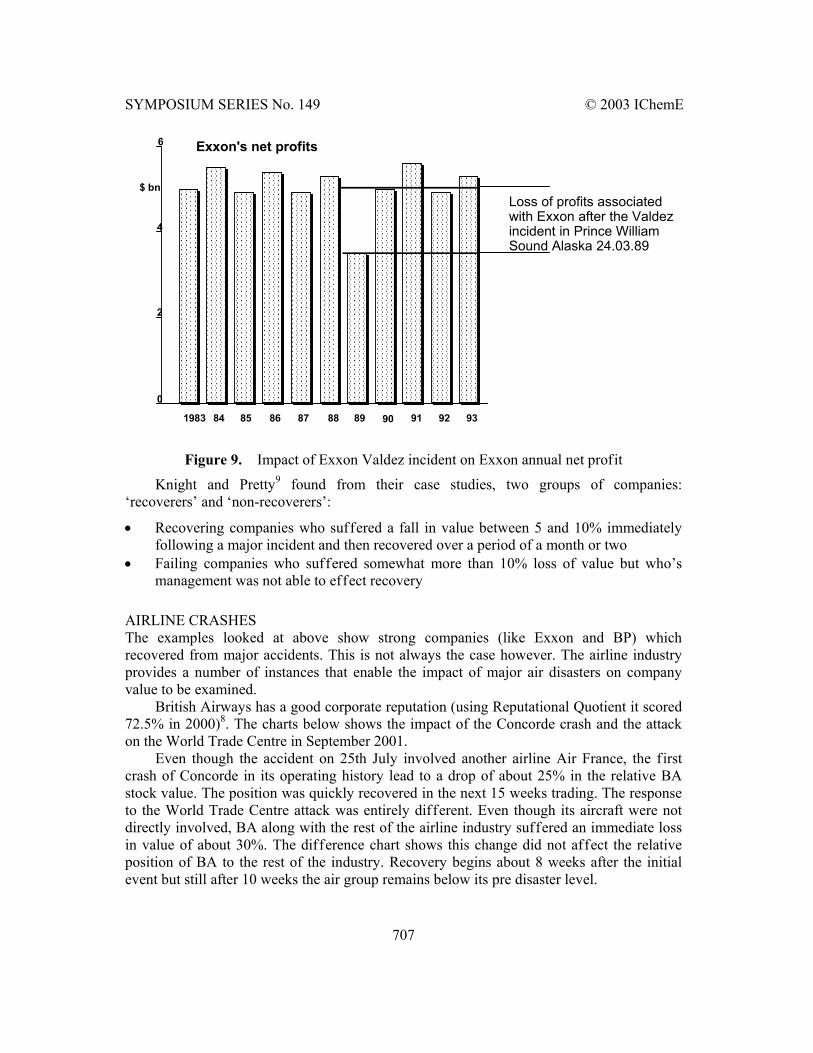
TANKER GROUNDING AND POLLUTION INCIDENT Accidents generating ecological impact can also affect company valuations. The following graph shows the pattern of annual earnings reported by Exxon and reveals the loss associated with the Exxon Valdez incident.
The anticipated loss of operating income also produced a dip in company stock price. Knight and Pretty9 show a much greater fall lasting longer than was experienced following the BP incidents. An initial fall of about 10% was exacerbated by a further fall to 20% loss of value 3 months after the incident possibly as a reflection of perceptions at the time of the company response. However, as the situation came under control, stock values rose and over the long term the impact of the Exxon Valdez incident is hard to detect.
The long-term performance of the Exxon stock has been summarised in the following terms: ‘Exxon’s focus on asset stewardship has driven exceptional operational and financial performance’.
This strong affirmation of the reputation of the company finds a quantitative expression in the Reputational Quotient developed by Frombrun et al8. Three Reputation Quotient surveys have been published, one of which included a number of major oil companies. In general as a group these companies scored in the middle range of corporate reputation quotients, lead by Chevron (66.2%) followed by Exxon (65.2%) and BP and Texaco both at 65%.
BP and Oil Group around January 2001
-2
-1
0
1
2
3
4
5
6
7
-2 0 2 4 6 8 10 12
Weeks after event
Rel
ativ
e Sh
are
Pric
e
DifferenceAverage
SYMPOSIUM SERIES No. 149 © 2003 IChemE
707
Figure 9. Impact of Exxon Valdez incident on Exxon annual net profit
Knight and Pretty9 found from their case studies, two groups of companies: ‘recoverers’ and ‘non-recoverers’:
• Recovering companies who suffered a fall in value between 5 and 10% immediately following a major incident and then recovered over a period of a month or two
• Failing companies who suffered somewhat more than 10% loss of value but who’s management was not able to effect recovery
AIRLINE CRASHES The examples looked at above show strong companies (like Exxon and BP) which recovered from major accidents. This is not always the case however. The airline industry provides a number of instances that enable the impact of major air disasters on company value to be examined.
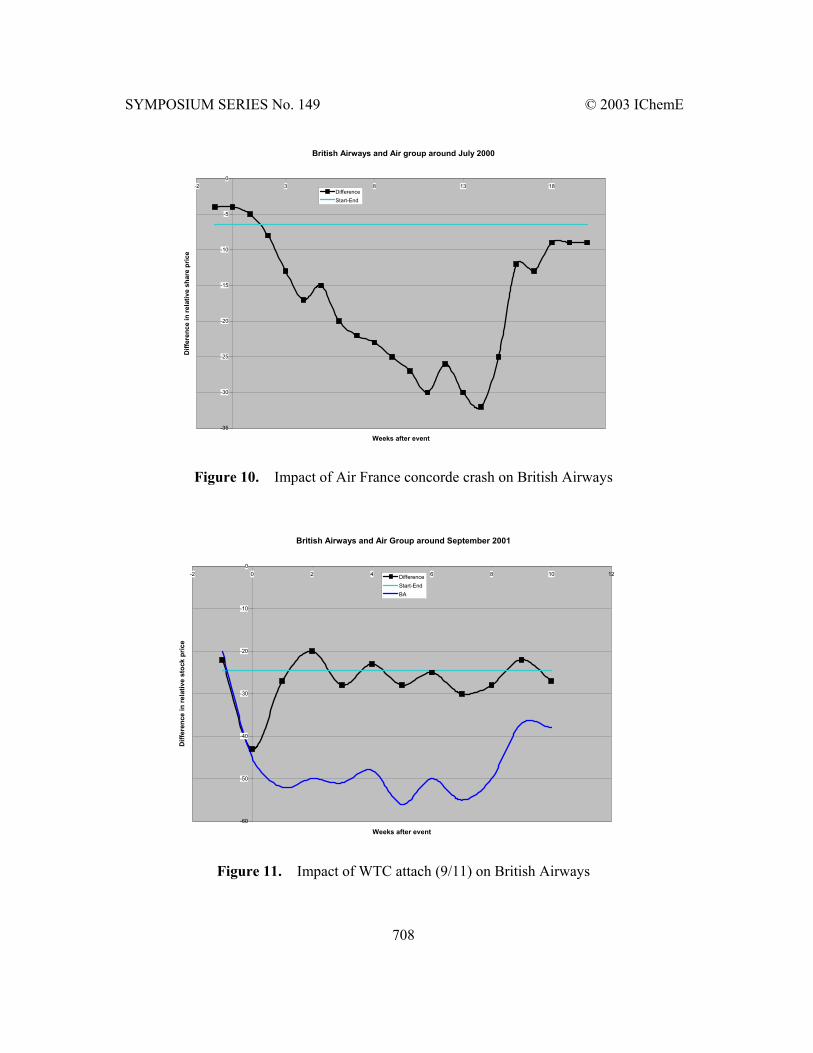
British Airways has a good corporate reputation (using Reputational Quotient it scored 72.5% in 2000)8. The charts below shows the impact of the Concorde crash and the attack on the World Trade Centre in September 2001.
Even though the accident on 25th July involved another airline Air France, the first crash of Concorde in its operating history lead to a drop of about 25% in the relative BA stock value. The position was quickly recovered in the next 15 weeks trading. The response to the World Trade Centre attack was entirely different. Even though its aircraft were not directly involved, BA along with the rest of the airline industry suffered an immediate loss in value of about 30%. The difference chart shows this change did not affect the relative position of BA to the rest of the industry. Recovery begins about 8 weeks after the initial event but still after 10 weeks the air group remains below its pre disaster level.
Loss of profits associatedwith Exxon after the Valdezincident in Prince WilliamSound Alaska 24.03.89
6
4
2
0
������������������������������������������������������������������������������������������������������������������������������������������������
������������������������������������������������������������������������������������������������������������������������������������������������
������������������������������������������������������������������������������������������������������������������������
���������������������������������������������������������������������������������������������������������������������������������������
������������������������������������������������������������������������������������������������������������������������
��������������������������������������������������������������������������������������������������������������������������������
���������������������������������������������������������������������������������������������������
������������������������������������������������������������������������������������������������������������������������
���������������������������������������������������������������������������������������������������������������������������������������������������������
���������������������������������������������������������������������������������������������������������������������������������������
������������������������������������������������������������������������������������������������������������������������������������������������
$ bn
1983 84 85 86 87 88 89 90 91 92 93
Exxon's net profits
SYMPOSIUM SERIES No. 149 © 2003 IChemE
708
Figure 10. Impact of Air France concorde crash on British Airways
Figure 11. Impact of WTC attach (9/11) on British Airways
British Airways and Air group around July 2000
-35
-30
-25
-20
-15
-10
-5
0-2 3 8 13 18
Weeks after event
Diff
eren
ce in
rela
tive
shar
e pr
ice
DifferenceStart-End
British Airways and Air Group around September 2001
-60
-50
-40
-30
-20
-10
0-2 0 2 4 6 8 10 12
Weeks after event
Diff
eren
ce in
rela
tive
stoc
k pr
ice
DifferenceStart-EndBA
SYMPOSIUM SERIES No. 149 © 2003 IChemE
709
The pattern of events suggests some additional criteria to those proposed by Knight and Pretty namely
3.1 Company value can be affected by a major accident suffered by a company carrying out similar operations. The immediate market assumption appears to be ‘if it can happen to one company why not to another’. When stable and reliable operations are demonstrated to continue, confidence returns and value is quickly recovered
3.2 A few very rare disasters have the ability to affect valuation of the entire market sector. The depth of the fall and the duration of recovery can be protracted.
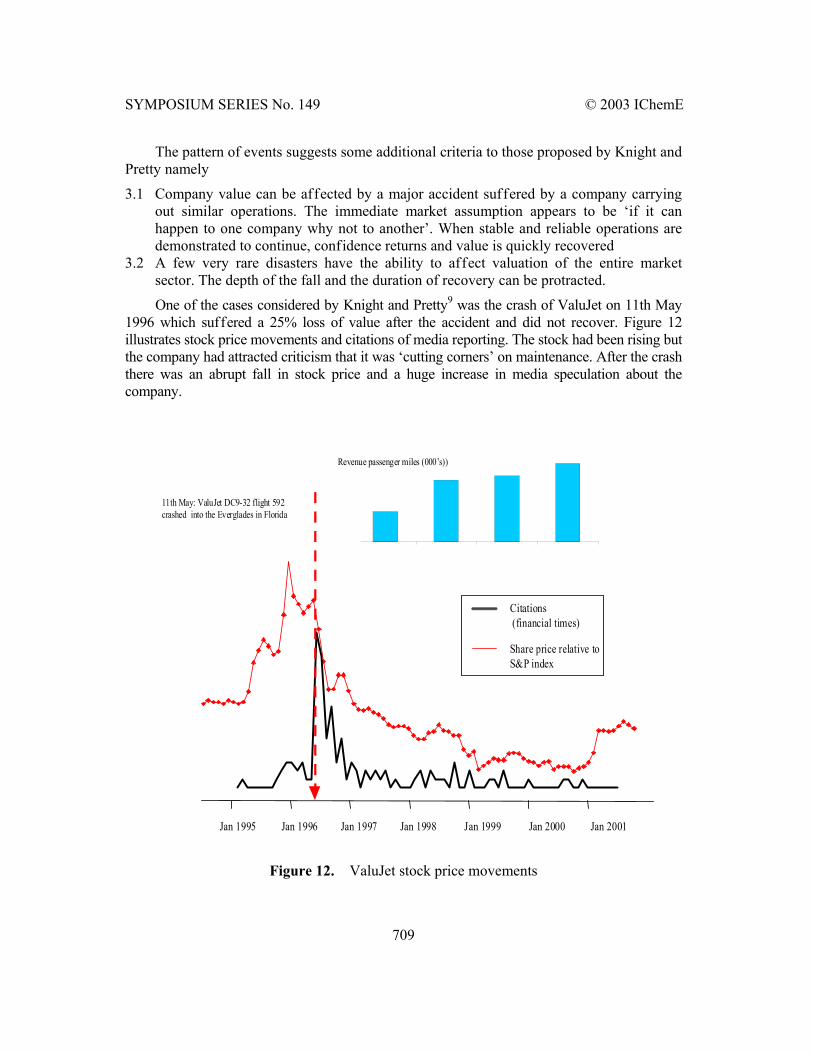
One of the cases considered by Knight and Pretty9 was the crash of ValuJet on 11th May 1996 which suffered a 25% loss of value after the accident and did not recover. Figure 12 illustrates stock price movements and citations of media reporting. The stock had been rising but the company had attracted criticism that it was ‘cutting corners’ on maintenance. After the crash there was an abrupt fall in stock price and a huge increase in media speculation about the company.
Figure 12. ValuJet stock price movements
Jan 1995 Jan 1996 Jan 1997 Jan 1998 Jan 1999 Jan 2000 Jan 2001
Citations (financial times)
Share price relative toS&P index
11th May: ValuJet DC9-32 flight 592crashed into the Everglades in Florida
0500000
10000001500000200000025000003000000350000040000004500000
Revenue passenger miles (000’s))
SYMPOSIUM SERIES No. 149 © 2003 IChemE
710
There was no recovery in company value and the concern went into bankruptcy proceedings, from which it emerged under a new name. Despite a steady growth in revenue passenger miles the downward trend in company value was not reversed until 5 years after the initiating accident.
It remains with the market to decide if ‘Cut Price’ airlines remain vulnerable to this pattern of events in the future. At the time of writing, media continue to pay attention to the safety standards in such operations.
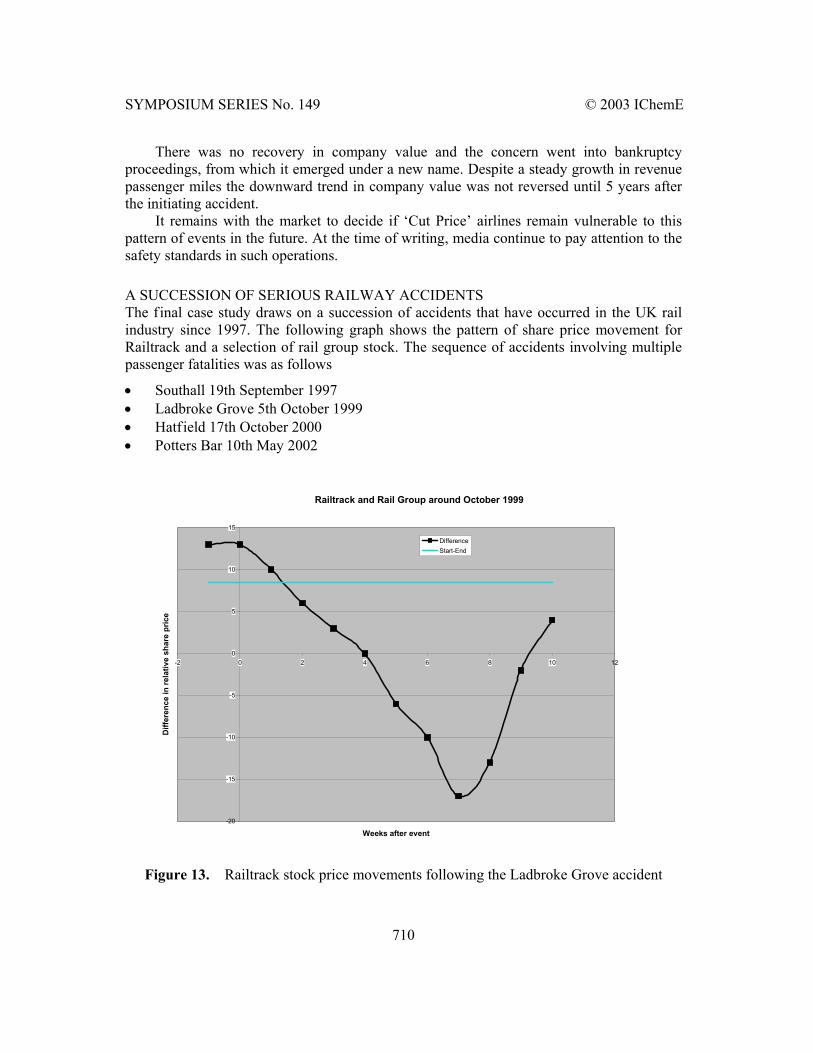
A SUCCESSION OF SERIOUS RAILWAY ACCIDENTS The final case study draws on a succession of accidents that have occurred in the UK rail industry since 1997. The following graph shows the pattern of share price movement for Railtrack and a selection of rail group stock. The sequence of accidents involving multiple passenger fatalities was as follows
• Southall 19th September 1997 • Ladbroke Grove 5th October 1999 • Hatfield 17th October 2000 • Potters Bar 10th May 2002
Figure 13. Railtrack stock price movements following the Ladbroke Grove accident
Railtrack and Rail Group around October 1999
-20
-15
-10
-5
0
5
10
15
-2 0 2 4 6 8 10 12
Weeks after event
Diff
eren
ce in
rela
tive
shar
e pr
ice
DifferenceStart-End
SYMPOSIUM SERIES No. 149 © 2003 IChemE
711
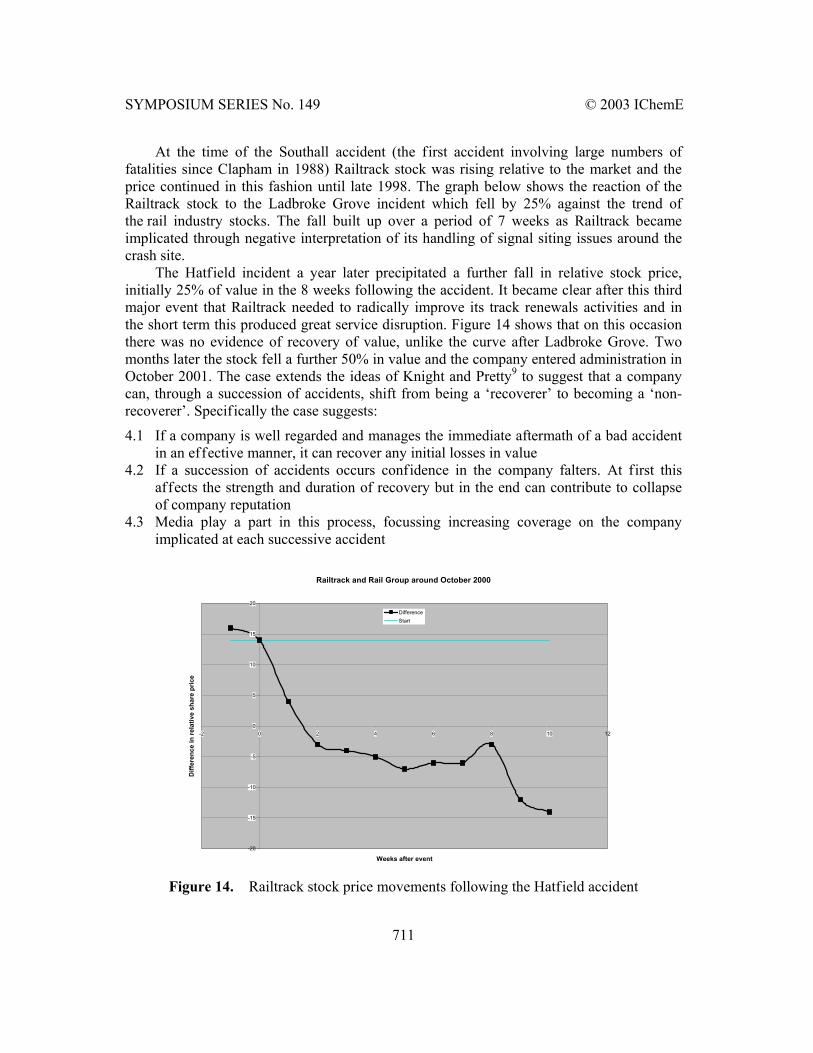
At the time of the Southall accident (the first accident involving large numbers of fatalities since Clapham in 1988) Railtrack stock was rising relative to the market and the price continued in this fashion until late 1998. The graph below shows the reaction of the Railtrack stock to the Ladbroke Grove incident which fell by 25% against the trend of the rail industry stocks. The fall built up over a period of 7 weeks as Railtrack became implicated through negative interpretation of its handling of signal siting issues around the crash site.
The Hatfield incident a year later precipitated a further fall in relative stock price, initially 25% of value in the 8 weeks following the accident. It became clear after this third major event that Railtrack needed to radically improve its track renewals activities and in the short term this produced great service disruption. Figure 14 shows that on this occasion there was no evidence of recovery of value, unlike the curve after Ladbroke Grove. Two months later the stock fell a further 50% in value and the company entered administration in October 2001. The case extends the ideas of Knight and Pretty9 to suggest that a company can, through a succession of accidents, shift from being a ‘recoverer’ to becoming a ‘non-recoverer’. Specifically the case suggests:
4.1 If a company is well regarded and manages the immediate aftermath of a bad accident in an effective manner, it can recover any initial losses in value
4.2 If a succession of accidents occurs confidence in the company falters. At first this affects the strength and duration of recovery but in the end can contribute to collapse of company reputation
4.3 Media play a part in this process, focussing increasing coverage on the company implicated at each successive accident
Figure 14. Railtrack stock price movements following the Hatfield accident
Railtrack and Rail Group around October 2000
-20
-15
-10
-5
0
5
10
15
20
-2 0 2 4 6 8 10 12
Weeks after event
Diff
eren
ce in
rela
tive
shar
e pr
ice
DifferenceStart
SYMPOSIUM SERIES No. 149 © 2003 IChemE
712
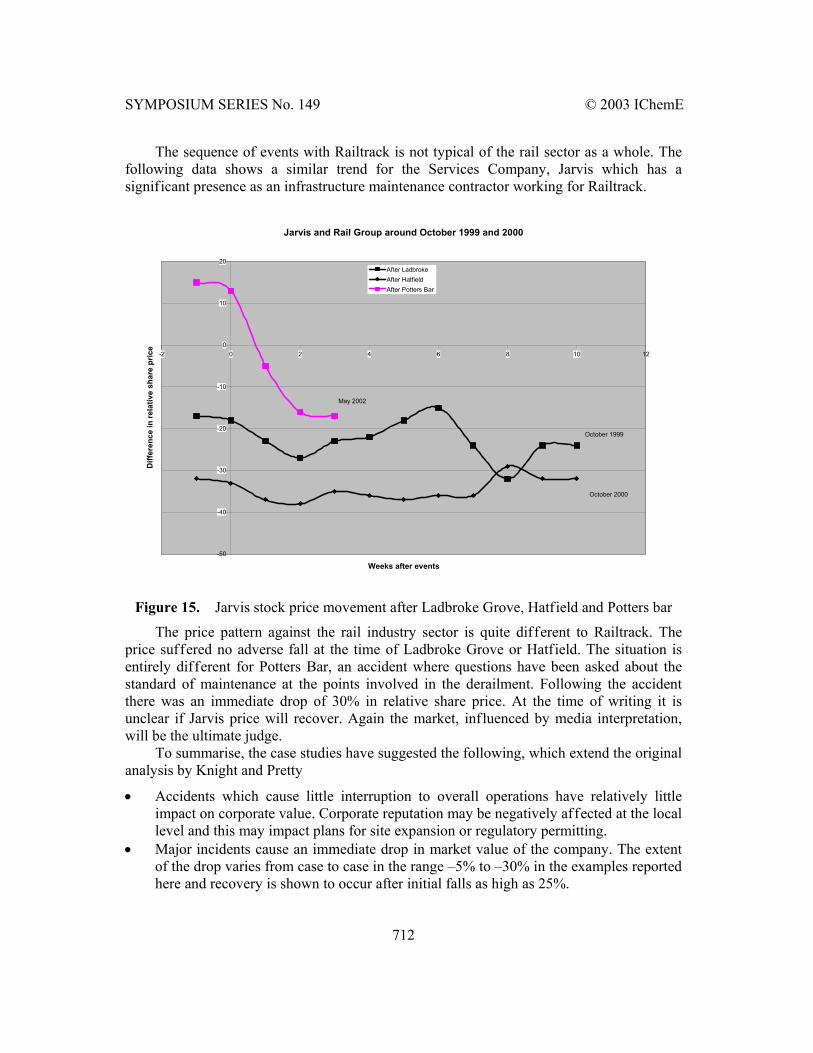
The sequence of events with Railtrack is not typical of the rail sector as a whole. The following data shows a similar trend for the Services Company, Jarvis which has a significant presence as an infrastructure maintenance contractor working for Railtrack.
Figure 15. Jarvis stock price movement after Ladbroke Grove, Hatfield and Potters bar
The price pattern against the rail industry sector is quite different to Railtrack. The price suffered no adverse fall at the time of Ladbroke Grove or Hatfield. The situation is entirely different for Potters Bar, an accident where questions have been asked about the standard of maintenance at the points involved in the derailment. Following the accident there was an immediate drop of 30% in relative share price. At the time of writing it is unclear if Jarvis price will recover. Again the market, influenced by media interpretation, will be the ultimate judge.
To summarise, the case studies have suggested the following, which extend the original analysis by Knight and Pretty
• Accidents which cause little interruption to overall operations have relatively little impact on corporate value. Corporate reputation may be negatively affected at the local level and this may impact plans for site expansion or regulatory permitting.
• Major incidents cause an immediate drop in market value of the company. The extent of the drop varies from case to case in the range –5% to –30% in the examples reported here and recovery is shown to occur after initial falls as high as 25%.
Jarvis and Rail Group around October 1999 and 2000
-50
-40
-30
-20
-10
0
10
20
-2 0 2 4 6 8 10 12
Weeks after events
Diff
eren
ce in
rela
tive
shar
e pr
ice
After LadbrokeAfter HatfieldAfter Potters Bar
October 1999
October 2000
May 2002
SYMPOSIUM SERIES No. 149 © 2003 IChemE
713
• Loss of company value can occur even if the accident occurs to another company with similar operations.
• Critical to success is achieving recovery following the initial loss. Some companies, typically those with strong corporate reputation based on sound management recover their value within a few weeks of trading.
• A succession of incidents, particularly associated with negative media reporting, weakens corporate reputation. Recovery of value following an accident and an initial loss becomes progressively harder. In extreme cases company value may not recover and this can be a factor contributing to bankruptcy.
A hypothesis is presented to account for these observations in the following section.
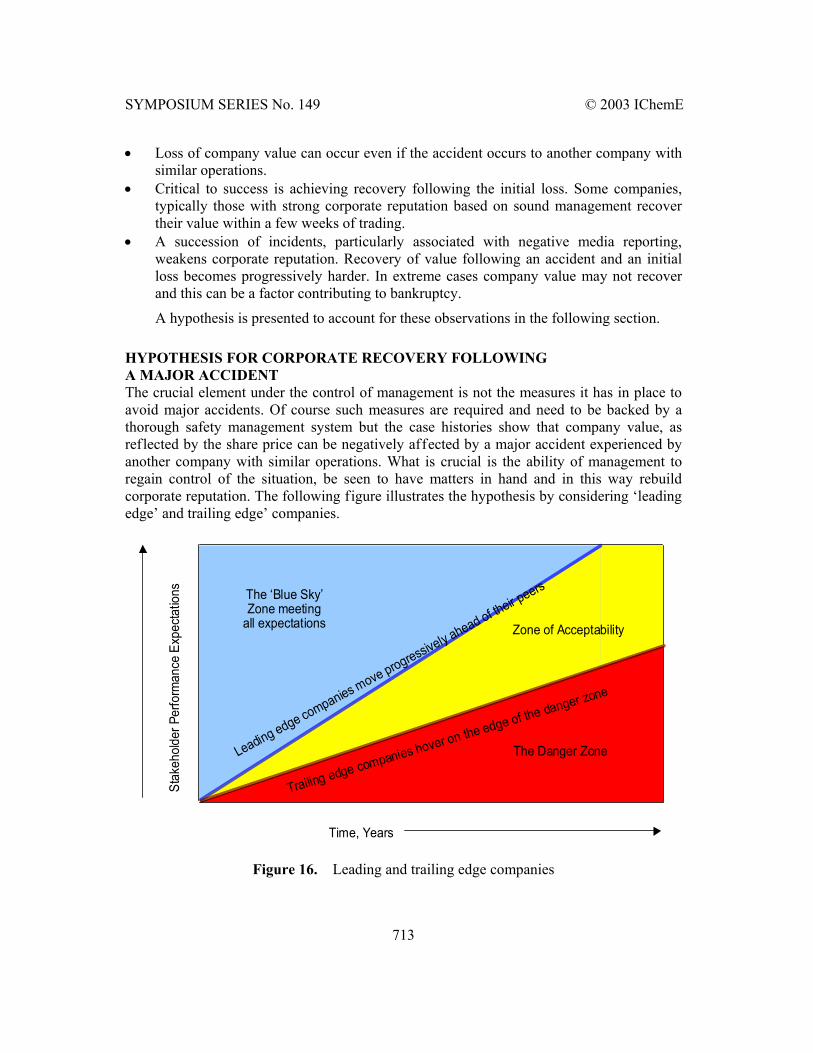
HYPOTHESIS FOR CORPORATE RECOVERY FOLLOWING A MAJOR ACCIDENT The crucial element under the control of management is not the measures it has in place to avoid major accidents. Of course such measures are required and need to be backed by a thorough safety management system but the case histories show that company value, as reflected by the share price can be negatively affected by a major accident experienced by another company with similar operations. What is crucial is the ability of management to regain control of the situation, be seen to have matters in hand and in this way rebuild corporate reputation. The following figure illustrates the hypothesis by considering ‘leading edge’ and trailing edge’ companies.
Figure 16. Leading and trailing edge companies
Time, Years
The ‘Blue Sky’Zone meeting
all expectations Zone of Acceptability
The Danger ZoneLeading edge companies move progressively ahead of their peers
Trailing edge companies hover on the edge of the danger zone
Stak
ehold
er P
erfo
rman
ce E
xpec
tatio
ns
SYMPOSIUM SERIES No. 149 © 2003 IChemE
714
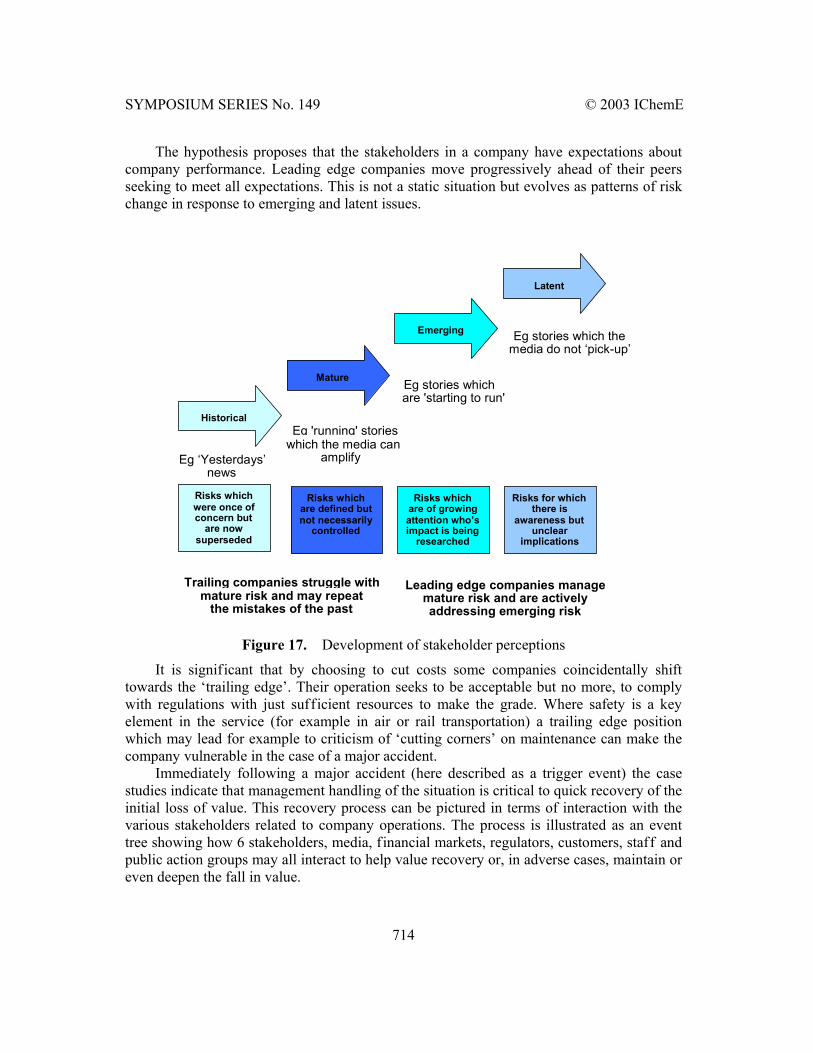
The hypothesis proposes that the stakeholders in a company have expectations about company performance. Leading edge companies move progressively ahead of their peers seeking to meet all expectations. This is not a static situation but evolves as patterns of risk change in response to emerging and latent issues.
Figure 17. Development of stakeholder perceptions
It is significant that by choosing to cut costs some companies coincidentally shift towards the ‘trailing edge’. Their operation seeks to be acceptable but no more, to comply with regulations with just sufficient resources to make the grade. Where safety is a key element in the service (for example in air or rail transportation) a trailing edge position which may lead for example to criticism of ‘cutting corners’ on maintenance can make the company vulnerable in the case of a major accident.
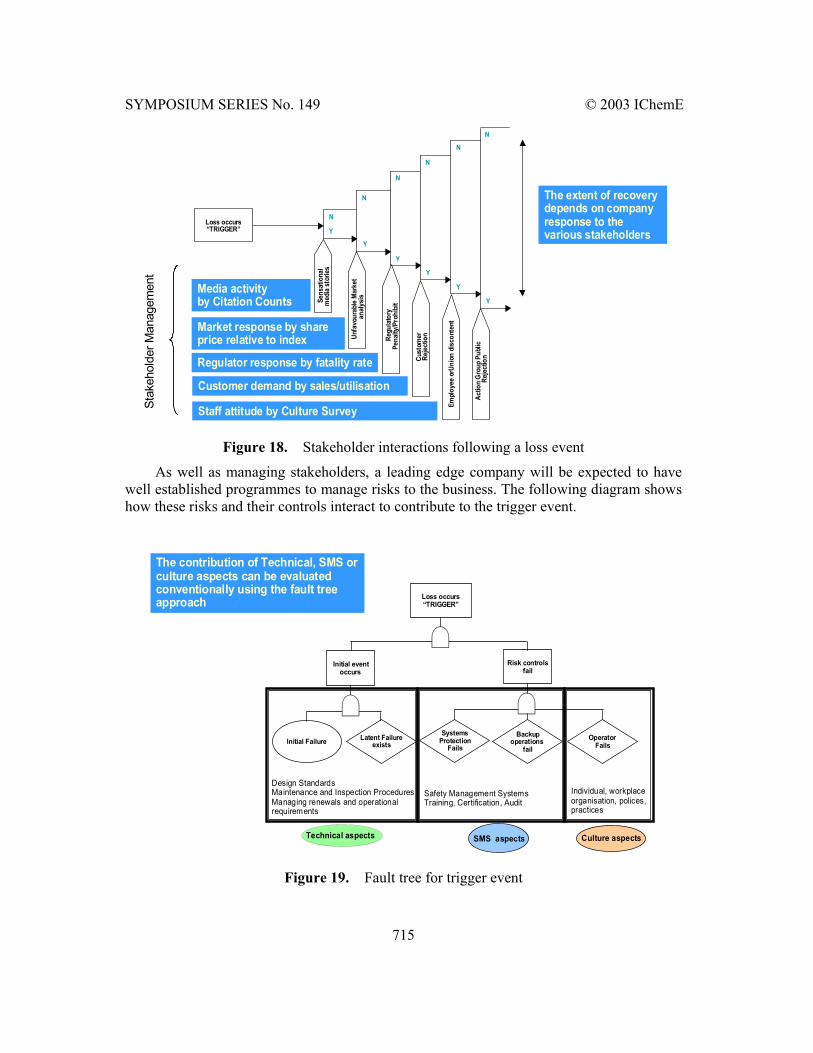
Immediately following a major accident (here described as a trigger event) the case studies indicate that management handling of the situation is critical to quick recovery of the initial loss of value. This recovery process can be pictured in terms of interaction with the various stakeholders related to company operations. The process is illustrated as an event tree showing how 6 stakeholders, media, financial markets, regulators, customers, staff and public action groups may all interact to help value recovery or, in adverse cases, maintain or even deepen the fall in value.
Historical
Risks which were once of concern but
are now superseded
Mature
Emerging
Latent
Risks which are defined but not necessarily
controlled
Risks which are of growing attention who’s impact is being
researched
Risks for which there is
awareness but unclear
implications
Leading edge companies manage mature risk and are actively addressing emerging risk
Trailing companies struggle with mature risk and may repeat
the mistakes of the past
Eg stories which the media do not ‘pick-up’
Eg stories which are 'starting to run'
Eg 'running' stories which the media can
amplify Eg ‘Yesterdays’ news
SYMPOSIUM SERIES No. 149 © 2003 IChemE
715
Figure 18. Stakeholder interactions following a loss event
As well as managing stakeholders, a leading edge company will be expected to have well established programmes to manage risks to the business. The following diagram shows how these risks and their controls interact to contribute to the trigger event.
Figure 19. Fault tree for trigger event
Stak
ehol
der M
anag
emen
t
Loss occurs“TRIGGER”
Media activityby Citation Counts
Y
N
Unfa
vour
able
Mar
ket
anal
ysis
Y
N
N
Regu
lato
ryPe
nalty
/Pro
hibi
t
N
Cust
omer
Reje
ctio
n
Y
N
Actio
n G
roup
Pub
licRe
ject
ion
Y
N
Sens
atio
nal
med
ia s
torie
s
Y
Y
Market response by shareprice relative to index
Regulator response by fatality rate
Empl
oyee
orU
nion
dis
cont
ent
Customer demand by sales/utilisation
Staff attitude by Culture Survey
The extent of recoverydepends on companyresponse to thevarious stakeholders
Loss occurs“TRIGGER”
SystemsProtection
FailsOperator
FailsBackup
operations fail
Initial eventoccurs
Risk controlsfail
Latent FailureexistsInitial Failure
The contribution of Technical, SMS orculture aspects can be evaluatedconventionally using the fault treeapproach
Design Standards Maintenance and Inspection ProceduresManaging renewals and operationalrequirements
Technical aspects Culture aspects SMS aspects
Safety Management SystemsTraining, Certification, Audit
Individual, workplaceorganisation, polices, practices
SYMPOSIUM SERIES No. 149 © 2003 IChemE
716
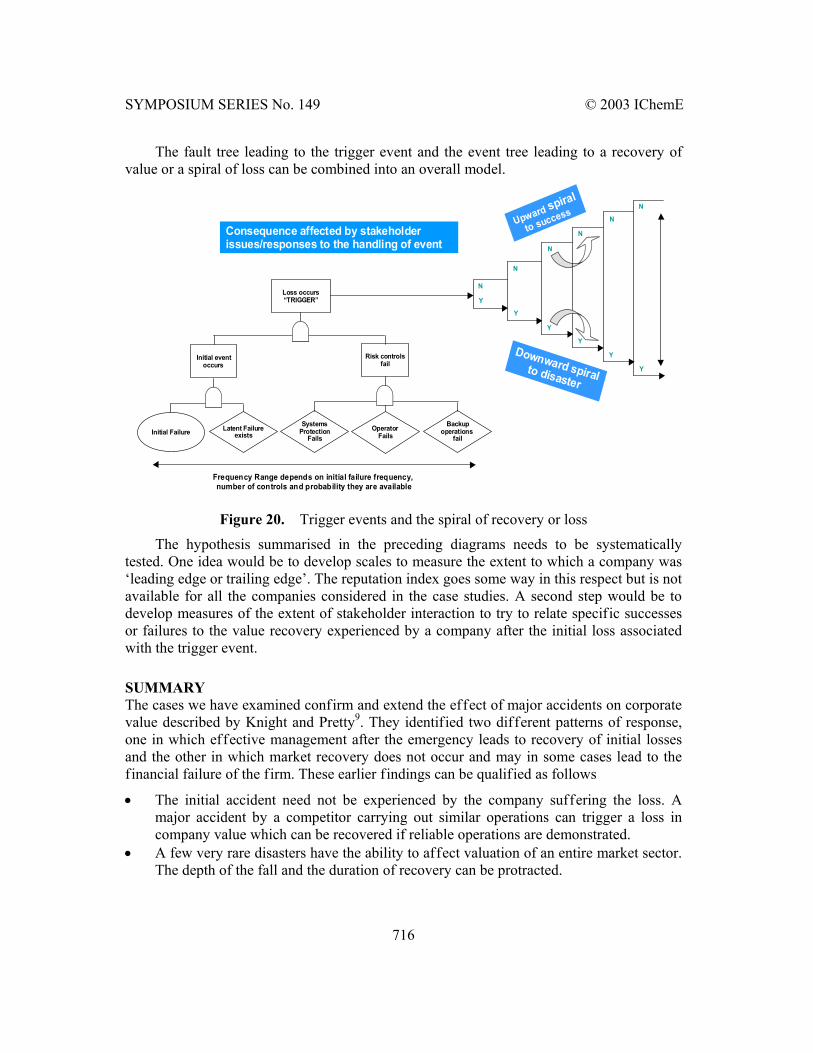
The fault tree leading to the trigger event and the event tree leading to a recovery of value or a spiral of loss can be combined into an overall model.
Figure 20. Trigger events and the spiral of recovery or loss
The hypothesis summarised in the preceding diagrams needs to be systematically tested. One idea would be to develop scales to measure the extent to which a company was ‘leading edge or trailing edge’. The reputation index goes some way in this respect but is not available for all the companies considered in the case studies. A second step would be to develop measures of the extent of stakeholder interaction to try to relate specific successes or failures to the value recovery experienced by a company after the initial loss associated with the trigger event.
SUMMARY The cases we have examined confirm and extend the effect of major accidents on corporate value described by Knight and Pretty9. They identified two different patterns of response, one in which effective management after the emergency leads to recovery of initial losses and the other in which market recovery does not occur and may in some cases lead to the financial failure of the firm. These earlier findings can be qualified as follows
• The initial accident need not be experienced by the company suffering the loss. A major accident by a competitor carrying out similar operations can trigger a loss in company value which can be recovered if reliable operations are demonstrated.
• A few very rare disasters have the ability to affect valuation of an entire market sector. The depth of the fall and the duration of recovery can be protracted.
Loss occurs“TRIGGER”
SystemsProtection
FailsOperator
FailsBackup
operations fail
Initial eventoccurs
Risk controlsfail
Latent FailureexistsInitial Failure
Consequence affected by stakeholderissues/responses to the handling of event
Frequency Range depends on initial failure frequency, number of controls and probability they are available
Y
N
Y
N
N
N
Y
N
Y
N
Y
Y
Upward spiral
to success
Downward spiralto disaster
SYMPOSIUM SERIES No. 149 © 2003 IChemE
717
• Accidents causing little interruption to overall operations have relatively little impact on corporate value. Corporate reputation may however, be negatively affected at the local level and this may impact plans for site expansion or regulatory permitting.
• Major incidents cause an immediate drop in market value of the company. The extent of the drop varies from case to case in the range –5% to –30% in the examples reported here and recovery is shown to occur after initial falls as high as 25%.
• Critical to success is achieving recovery following the initial loss. Some companies, typically those with strong corporate reputation based on sound management recover their value within a few weeks of trading.
• A succession of incidents, particularly where the media focuses increasing coverage on the company implicated at each successive accident can weaken corporate reputation. Recovery of value following an accident and an initial loss becomes progressively harder. In extreme cases company value may not recover and this can be a factor contributing to bankruptcy.
A hypothesis is presented which explains these findings in terms of ‘leading edge’ and ‘trailing’ companies.
REFERENCES 1. Risk Analysis Report to the Rijnmond Public Authority, D.Reidel Publishing Co., 1981
ISBN 90-277-1393-6 2. F. Markert et al. Sources and Magnitudes of Uncertainties in Risk Analysis of Chemical
Establishments. First insights from an European Benchmark Study 10th International Symposium on Loss Prevention and Safety Promotion in the Process Industries (June 2001).
3. HSE: Risk Criteria for Land Use Planning in the Vicinity of Major Industrial Hazards, HMSO, 1989
4. Dutch National Environmental Policy Plan: Premises for Risk Management, Second Chamber of States General, 1988-89 session, 21137, nos.1-2)
5. G.C Stevens: Prioritisation of Safety related Plant Modifications 7th International Symposium on Loss Prevention (May 1992)
6. G.C. Stevens and M Marchi: A Benefit/Cost approach for prioritising expenditure during plant turnaround 10th International Symposium on Loss Prevention and Safety Promotion in the Process Industries (June 2001).
7. New Scientist 28 Sept 1996 p37 8. C J Frombrun and Naomi Gardberg Who’s tops in corporate reputation? Corporate
Reputation Review March 2000 9. R F Knight and D J Pretty The impact of catastrophes on Shareholder Value Oxford
Executives Research Briefings 1997