Embed Size (px)
Citation preview
How Does Size Affect Mutual Fund Performance? Evidence from Mutual
Fund Trades*
Jeffrey A. Busse† Tarun Chordia
‡ Lei Jiang
§ Yuehua Tang
**
June 2014
Preliminary
ABSTRACT
Larger mutual funds underperform their smaller counterparts due to their holdings and not due to
higher transaction costs. Using a sample of actual fund trades combined with fund portfolio
holdings we find that larger funds experience lower percentage transaction costs than smaller
funds. Further, smaller funds hold smaller market capitalization stocks and, to a lesser extent,
stocks with greater book-to-market ratios and higher momentum. It is these characteristics,
especially the market capitalization of stock holdings that account for diseconomies of scale in
the mutual fund industry.
Keywords: Mutual funds, transaction costs, fund size, stock size, fund performance
* We would like to thank Baozhong Yang for the link between the Abel Noser and Thomson Reuters Mutual Fund
Holdings databases. † Jeffrey A. Busse, Goizueta Business School, Emory University, 1300 Clifton Road NE, Atlanta, GA 30322, USA;
Tel: +1 404-727-0160; Email: [email protected]. ‡ Tarun Chordia, Goizueta Business School, Emory University, 1300 Clifton Road NE, Atlanta, GA 30322, USA;
Tel: +1 404-727-1620; Email: [email protected]. § Lei Jiang, School of Economics and Management, Tsinghua University, Beijing, 100084, China; Tel: +86 10-
62797084; Email: [email protected]. ** Yuehua Tang, Lee Kong Chian School of Business, Singapore Management University, 50 Stamford Road #04-01,
Singapore 178899; Tel. +65 6808-5475; Email [email protected].
1
How Does Size Affect Mutual Fund Performance? Evidence from Mutual
Fund Trades
Over the last decade, several studies have examined the relation between a fund’s total
net assets (TNA) and its performance. Examples include Chen et al. (2004), Christoffersen,
Keim, and Musto (2008), Yan (2008), and Edelen, Evans, and Kadlec (2013). The general
consensus from these studies is that individual funds are subject to diseconomies of scale, since
larger funds underperform smaller funds, on average. The one notable exception to that
consensus finding is Elton, Gruber, and Blake (2012), who find no diseconomies of scale in
subsets of funds grouped by investment objective.
Diseconomies of scale explanations follow two lines of reasoning. First, for a given set of
stock holdings, a fund faces increasingly large percentage transaction costs as its TNA increases,
because altering a particular fraction of the portfolio requires transactions of larger dollar
amounts, and larger dollar transactions would be expected to increase costs attributable to price
impact. Alternatively, a fund could increase the number of its holdings as its size increases.
Presumably, stocks added to the portfolio to invest new inflows would not reflect the fund
manager’s favorite stock picks, thereby reducing subsequent performance. However, since Pollet
and Wilson (2008) find that funds do not increase the number of their holdings in proportion to
increases in assets under management, transaction cost effects are the lone remaining explanation
for diseconomies of scale.
Yan (2008) and Edelen, Evans, and Kadlec (2013) find evidence consistent with the view
that increases in fund TNA adversely affect transaction costs. Yan (2008) finds that
diseconomies of scale are particularly evident among groups of funds that hold less liquid stocks.
For funds that invest in relatively liquid stocks, Yan (2008) finds no evidence of diseconomies of
scale. Edelen, Evans, and Kadlec (2013) infer individual fund trades from quarterly portfolio
holdings, and they find that the larger trades associated with larger funds increase percentage
transaction costs.
In our paper, we use a unique sample of actual fund trades combined with fund portfolio
holdings to precisely pin down why larger funds underperform smaller-size funds. We construct
our sample by matching individual trades from the Abel Noser database of institutional trades to
2
changes in portfolio holdings in the Thomson Reuters database of mutual fund quarterly
portfolio holdings. By analyzing the Abel Noser database, we estimate, trade by trade, mutual
fund transaction costs, including the price impact pointed to by others as the likely explanation
for diseconomies of scale. Specifically, we construct two transaction cost measures for the funds
in our Abel Noser sample: hidden cost (e.g., Keim and Madhavan (1997) and Hu (2009)) and
execution shortfall (e.g., Anand et al. (2012)). The former uses the previous trading day’s closing
stock price as a benchmark, and the latter uses the price at the time of order placement as a
benchmark. Both measures capture implicit trading costs, including price impact and costs
related to the bid-ask spread as a percentage of the dollar value of a fund’s trades.
Contrary to the notion that larger funds experience greater transaction costs than smaller
funds, we find precisely the opposite result: larger funds experience lower percentage transaction
costs than smaller funds. For example, when sorted according to TNA, top quintile funds (i.e.,
the largest funds) experience an annual performance drag of 0.19 percent because of transaction
costs as measured by the hidden cost measure, whereas bottom quintile funds experience an
annual performance drag of 0.30 percent. We find that transaction costs generally decrease with
fund TNA. Diseconomies of scale arguments that center around transaction costs implicitly
assume that mutual funds absorb liquidity. For example, for stock purchases, funds are assumed
to pay the spread and potentially pay increasingly higher prices stemming from price impact over
the duration of their trade. Our results suggest that larger funds either are more patient than
smaller funds when they trade (i.e., they more often provide liquidity) or they trade more liquid
stocks. Our evidence suggests that both effects play a role in the transaction cost advantage
realized by larger funds.
Given our transaction cost results, how can we rationalize the overall finding of
diseconomies of scale, which we confirm in our sample, especially given that Pollet and Wilson
(2008) find that larger funds do not load up on less-favored stocks? To answer this question, we
examine the characteristics of stocks held by mutual funds, finding important differences related
to fund size. As expected, larger funds tend to hold more liquid stocks than smaller funds, since
larger funds deliberately avoid stocks with insufficient liquidity. More importantly, controlling
for stock liquidity, we find that smaller funds hold smaller market capitalization stocks and, to a
lesser extent, stocks with greater book-to-market ratios and higher momentum. That is, although
we are unable to explain performance differences across funds of differing TNA by controlling
3
for the liquidity of their holdings or transaction costs, after we control for stock holding
characteristics such as market capitalization, book-to-market, and momentum, we find no
difference in performance across funds of differing TNA. Portfolio holding characteristics, rather
than transaction costs, account for diseconomies of scale in the mutual fund industry.
Small funds outperform large funds by earning extra return premia from their holdings,
characterized by lower market cap, greater book-to-market, and higher price momentum, on
average. These premia are more than enough to offset the greater percentage transaction costs
that smaller funds incur. Larger funds earn lower average returns by holding stocks of greater
market capitalization, lower book-to-market, and lower past returns. Presumably, the transaction
costs incurred by larger funds if they were to emphasize in their portfolios the types of stocks
held by their smaller counterparts would subsume their higher average returns. Larger funds do,
however, charge their shareholders lower expenses, but the expense ratio advantage offered by
larger funds together with their smaller transaction costs are insufficient to offset the lower
average returns associated with their portfolio stock holdings.
Overall, our results point to a different mechanism behind mutual fund diseconomies of
scale compared to previous studies. Whereas the results of Yan (2008) and others suggest that
higher transaction costs for a given level of holding liquidity lead to underperformance in
relatively large funds, our results indicate that it is the avoidance of those transaction costs that
lead larger funds to hold stocks characterized by lower average returns. That is, managers of
large funds willingly accept lower returns to keep transaction costs in check.
The remainder of the paper proceeds as follows. Section I describes the data. Section II
provides an overview of the sample and some preliminary analysis. Section III presents our main
empirical analysis. Section IV concludes the paper.
I. Data and Variables
A. Data Description
We obtain data from several sources. We obtain fund names, returns, total net assets
(TNA), expense ratios, turnover ratios, investment objectives, and other fund characteristics from
the Center for Research in Security Prices (CRSP) Survivorship Bias Free Mutual Fund
Database. The CRSP mutual fund database lists multiple share classes separately. We aggregate
4
share-class level data to fund-level data. Specifically, we calculate total TNA as the sum of TNA
across all share classes. Second, we obtain mutual fund portfolio holdings from Thomson
Reuters Mutual Fund Holdings (formerly CDA/Spectrum S12) database. The database contains
quarterly portfolio holdings for all U.S. equity mutual funds. We merge the CRSP Mutual Fund
database and the Thomson Mutual Fund Holdings database using the MFLINKS table available
on WRDS (see Wermers (2000)).
We focus on actively-managed U.S. equity mutual funds and exclude balanced,
international, bond, and index funds. To isolate equity funds, we require stock holdings to be
greater than 80% of all fund assets. We also exclude funds with fewer than 10 stocks to focus on
diversified funds. Following Elton et al. (2001), Chen et al. (2004), and Yan (2008), we exclude
funds with less than $15 million in TNA. Our final sample consists of 5,469 unique actively-
managed U.S. equity mutual funds over a sample period from January 1980 to September 2012,
corresponding to portfolio holdings availability on Thomson Reuters.
We obtain mutual fund transaction data from Abel Noser Solutions, a leading execution
quality measurement service provider for institutional investors.6 Since Abel Noser does not
identify the specific institution responsible for the trade, we match institutions in the Abel Noser
database with mutual funds reporting quarterly holdings to the Thomson Reuters S12 database as
follows. For each Abel Noser manager X, and for each reporting period between two adjacent
portfolio report dates of a Thomson S12 manager M, we compute the change of holdings (i.e.,
total trades with shares adjusted for splits and distributions) by X in each stock during the
reporting period. We also compute split-adjusted changes in holdings by M for that reporting
period. We then compare the change in holdings by X and M for each stock to determine
whether X and M match. See Agarwal, Tang, and Yang (2012) for more details on the matching
procedure.
Our initial matched sample covers 1,428 unique Thomson Reuters funds. We further
match the funds in the merged Abel Noser-Thomson Reuters sample to the CRSP mutual fund
database to obtain fund characteristics and retain actively-managed U.S. equity funds. Our final
sample consists of the trade-by-trade transaction history of 617 unique mutual funds from
January 1999 to September 2011, where the later January 1999 starting point for the trade data 6 Previous academic studies that use Abel Noser data include Goldstein et al. (2009), Chemmanur, He, and Hu
(2009), Puckett and Yan (2011), Anand et al. (2012), and Busse, Green, and Jegadeesh (2012), among others.
5
compared to the portfolio holdings data corresponds to the beginning of the Abel Noser
database.7
Lastly, for each stock in our merged transaction sample, we obtain or compute stock-
level characteristics from CRSP and COMPUSTAT, including market capitalization, turnover
ratio (i.e., share volume divided by shares outstanding), the Amihud measure of illiquidity, and
book-to-market ratio. We restrict our sample to stocks with CRSP share codes 10 or 11 (i.e.,
common stock) and NYSE, AMEX, or NASDAQ listings.
B. Variable Construction
B.1. Trading Cost Measures
Following prior studies, we use the Abel Noser data to construct two trading cost
measures for our mutual fund sample: hidden cost (e.g., Keim and Madhavan (1997) and Hu
(2009)) and execution shortfall (e.g., Anand et al. (2012)). The former uses the previous trading
day’s closing stock price as a benchmark, and the latter uses the price at the time of order
placement as a benchmark:
where is the execution price of a trade, and is trading direction, which takes a value
of 1 for a buy and –1 for a sell. After calculating these measures for each trade, we construct the
value-weighted measure for a given fund-month based on all of a fund’s trades in a given month.
Both measures capture implicit trading costs, including price impact and costs related to the bid-
ask spread (i.e., potentially buying at the ask) as a percentage of the dollar value of the trade,
rather than the explicit trading cost paid by the fund, such as brokerage commission or SEC
taxes. As an alternative set of transaction cost measures, we also scale dollar transaction costs by
fund TNA rather than the dollar trade value.
7 After September 2011, Abel Noser stopped providing the fund-level identifier in the institutional trading data.
Consequently, we cannot match Abel Noser data to Thomson S12 data at fund level after September 2011.
6
Lastly, we calculate two explicit trading cost measures using the Abel Noser data:
commissions and taxes. Specifically, we scale the fund’s total dollar value of commissions and
taxes in a given month by the dollar trade value.
B.2. Portfolio Holding Characteristics
For each sample fund, we use individual stock holdings to calculate fund-level market
capitalization, book-to-market (B/M) ratio, momentum, turnover ratio, and Amihud illiquidity
measure. To calculate the fund-level statistic, we weight each stock characteristic according to its
dollar weight in the most recent fund portfolio.
We calculate the book-to-market ratio as the book value of equity (assumed to be
available six months after the fiscal year end) divided by current market capitalization. We take
book value from COMPUSTAT supplemented by the hand-collected book values from Kenneth
French’s website.8 We truncate book values at the 0.5% and 99.5% levels to eliminate outliers,
although our results are not sensitive to this truncation. We calculate momentum as six-month
cumulative stock returns over the period from month t–7 to t–2. We compute stock turnover as
monthly trading volume over month-end shares outstanding.
For a given stock, we calculate the Amihud (2002) measure as the average ratio of the
absolute value of the change in price to its dollar trading volume for all the trading dates in a
given month. Following Acharya and Pedersen (2005), we normalize the Amihud ratio to adjust
for inflation and truncate it at 30 to eliminate the effect of outliers (i.e., removing stocks with
transaction cost larger than 30% of price) as follows:
| |
( )
where is the ratio of the capitalizations of the market portfolio at the end of month t–1 and
of the market portfolio at the end of July 1962.
B.3. Fund Characteristics
8 http://mba.tuck.dartmouth.edu/pages/faculty/ken.french/data_library.html.
7
To measure abnormal performance, we use alpha from three alternative risk-adjustment
models: the one-factor model, the Fama-French (1993) three-factor model, and the Carhart
(1997) four-factor model. The one-factor model uses the CRSP value-weighted market return as
the market proxy; the three-factor model adds size and book-to-market factors; and the four-
factor model includes a momentum factor.
In addition to these three alpha measures, we calculate holdings-based gross portfolio
returns each month assuming constant fund portfolio holdings from the end of the previous
quarter. We further compute the portfolio’s Daniel et al. (DGTW, 1997) stock characteristic
benchmark-adjusted return. We form 125 portfolios in June of each year based on a three-way
quintile sorting along the size (using the NYSE size quintile), book-market ratio, and momentum
dimensions. The abnormal performance of a stock is its return in excess of its DGTW benchmark
portfolio, and the DGTW-adjusted return for each portfolio aggregates over all the component
stocks using portfolio dollar value weighting.
Lastly, we calculate a return gap measure (Kacperczyk, Sialm, and Zheng (2008)) based
on the holdings-based returns and fund gross returns. We compute monthly gross fund returns by
adding one-twelfth of the year-end expense ratio to the monthly net fund returns during the year.
To measure fund size, we use Fund TNA, which we calculate as the sum of portfolio
assets across all share classes of a fund. The variable Fund Age is the age of the oldest share
class in the fund. Following Sirri and Tufano (1998), we define Fund Flow as the average
monthly net growth in fund assets beyond reinvested dividends. It reflects the percentage growth
of a fund in excess of the growth that would have occurred with no new inflow and had all
dividends been reinvested. We aggregate each fund family’s total assets under management to
get Family TNA. We calculate Expense Ratio, Management Fee, 12b1 Fee, and Fund Turnover
as the average expense ratios, management fees, 12b1 fees, and turnover ratios, respectively,
across all fund share classes. Cash % and Stock % are the percentages of a fund’s portfolio
invested in cash and common stocks, respectively.
II. Sample Overview and Preliminary Analyses
We use two sets of data to pin down the reasons funds with larger TNA underperform
smaller-size funds. We construct the first sample based on Thomson Reuters Mutual Fund
8
Holdings data over the period from January 1980 to September 2012 (which we refer to as the
“Thomson S12 Sample”). We base the second sample on institutional trading data from the Abel
Noser-Thomson Reuters S12 matched database (which we refer to as the “Abel Noser Sample”).
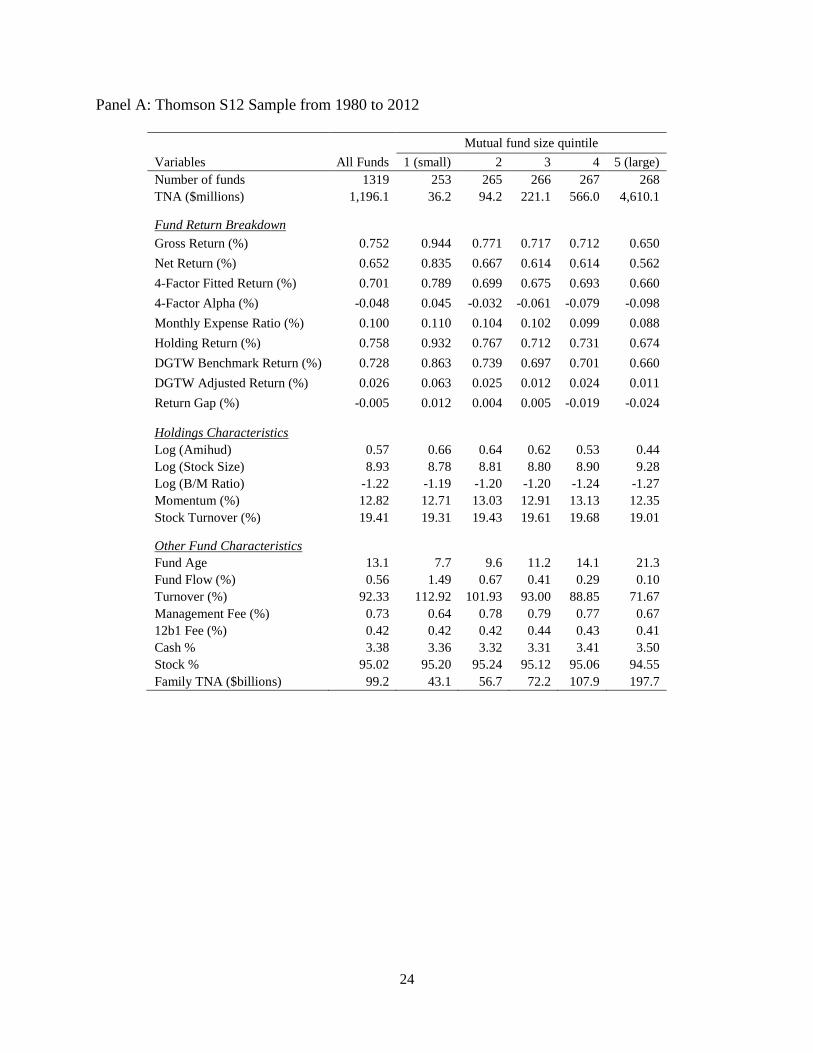
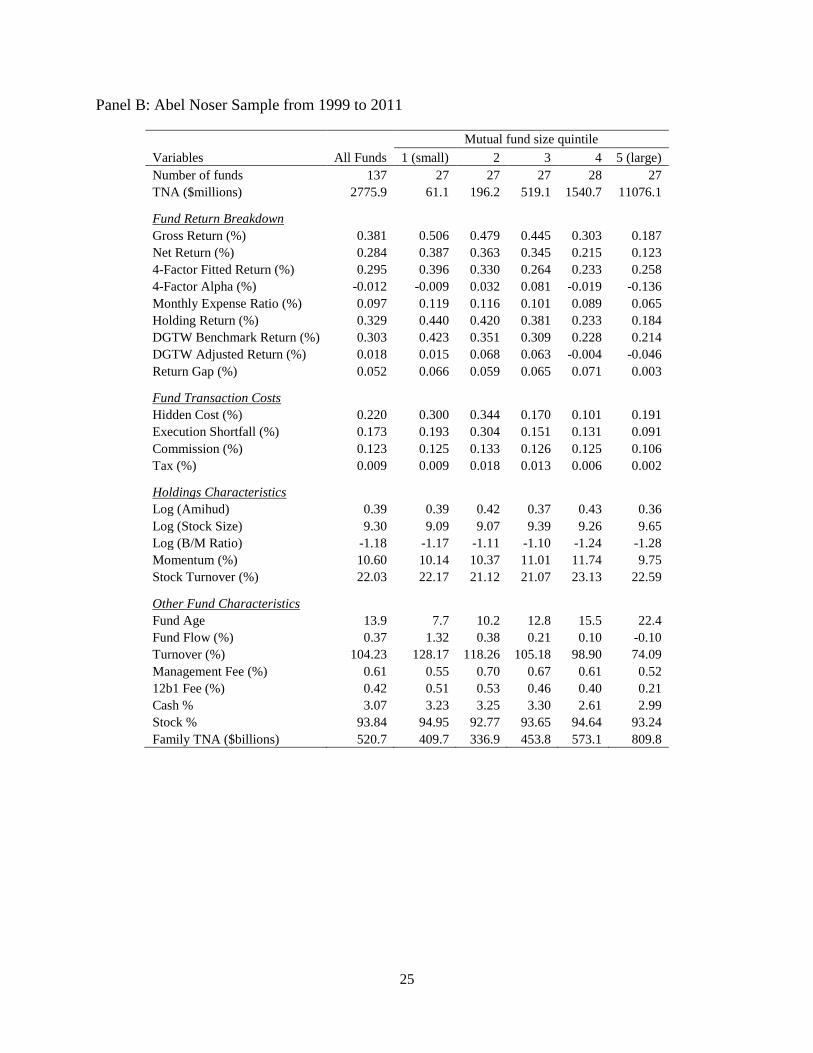
In Table I, we report summary statistics of fund characteristics, holdings characteristics,
and transaction cost measures for all sample funds. In addition, we divide sample funds into five
portfolios based on their TNA and report descriptive statistics for each fund size quintile. We
report the results for the Thomson S12 sample in Panel A and for the Abel Noser sample in Panel
B. For both panels, the number of funds is the average number of funds each month in each
portfolio. As a point of comparison, the average number of funds in our Thomson S12 sample as
reported in Panel A is slightly larger than the number of funds reported by Yan (2008). For all
other fund-level variables, we first compute the average across all of the funds in each group and
then take the time-series average of the cross-sectional average.
[Insert Table I here]
For our Thomson S12 sample, an average of 1,319 funds exist with an average of 253–
268 funds in each fund size quintile over the sample period from 1980 to 2012. As expected,
given that Abel Noser has a limited number of clients as well as the difficulty in linking the data
to Thomson and CRSP Mutual Fund data, the Abel Noser sample is smaller, with an average of
137 funds per sample period. The average TNA is $1,196 million in the Thomson S12 sample
and $2,776 for the Abel Noser sample. In both samples, large variations in fund TNA exist. The
average fund TNA is $36 million for quintile 1 and $4,610 million for quintile 5 in the Thomson
S12 sample. In the Abel Noser sample corresponding averages are $61 million and $11,076
million respectively.
Comparing fund statistics across the five fund size quintiles, we find that funds with large
TNA show both lower net returns and lower gross returns (computed by adding expense ratio to
fund net returns or based on fund portfolio holdings). Moreover, even after adjusting for risk
factors, the 4-factor alpha decreases monotonically across fund TNA quintiles. This pattern
confirms results in prior literature that show diseconomies of scale in the mutual fund industry
(e.g., Chen et al. (2004) and Yan (2008)). Lastly, we find that, on average, larger funds are older,
charge lower expenses, and generate lower turnover. The fact that larger funds show lower
expenses indicates that expenses run counter to the overall finding of diseconomies of scale, so
9
that the driving force behind diseconomies of scale is important enough to override cost
differences related to expenses.
When examining holdings characteristics, we find that larger funds hold larger market
capitalization stocks, as shown by the monotonic relation between fund TNA and stock market
capitalization. In addition, larger funds tend to hold stocks with lower book-to-market ratios (i.e.,
growth stocks) and, perhaps, stocks with lower momentum. Since it has been well documented
that stocks with larger market capitalization, lower book-to-market, and lower momentum are
characterized by lower average return cross-sectionally (e.g., Banz (1981), Basu (1983), Fama
and French (1992), Jegadeesh and Titman (1993), Daniel and Titman (1997), and Avramov and
Chordia (2006a, 2006b)), these patterns suggest that portfolio holdings characteristics may
account for the overall finding of diseconomies of scale in the mutual fund industry. Moreover,
as shown by the Amihud illiquidity ratio, larger funds tend to hold more liquid stocks, which are
also associated with lower average return (e.g., Amihud and Mendelson (1986), Pastor and
Stambaugh (2003), and Acharya and Pedersen (2005)).
If firm characteristics do explain diseconomies of scale in mutual funds, we might expect
that fund DGTW-adjusted returns are unrelated to, or weakly correlated with, fund size, since the
DGTW approach controls for three firm characteristics (size, book-to-market ratio, and
momentum). Indeed, as shown in the two panels of Table I, we find a weaker relation between
DGTW-adjusted return and fund size compared to the relation between 4-factor alpha and fund
size.
Lastly, we examine how fund trading cost measures vary with fund size. First, we find
that our two implicit trading cost measures, hidden cost and execution shortfall, decrease with
fund size. As shown in Panel B of Table I, funds in quintiles 1–5 (where quintile 1 has the
smallest TNA and quintile 5 has the largest TNA) experience transaction costs as measured by
hidden cost of 30 basis points, 34 basis points, 17 basis points, 10 basis points, and 9 basis
points, respectively, for every dollar they trade. When estimated via execution shortfall,
transaction costs for funds in quintiles 1–5 are 19 basis points, 30 basis points, 15 basis points,
13 basis points, and 9 basis points, respectively. Thus, contrary to the idea that larger funds
experience larger price impact in their trades, we find the opposite result: larger funds actually
experience lower percentage transaction costs. As larger funds have lower turnover than smaller
10
funds, our results are stronger if we scale the total dollar transaction costs by TNA rather than by
the fund’s total dollar traded (untabulated). Second, when examining our explicit trading cost
measures, we do not find that commissions and taxes (both scaled by dollar trade value) vary
across fund TNA quintiles. Therefore, our empirical evidence suggests that neither explicit nor
implicit trading costs can explain the diseconomies of scale in the mutual fund industry.
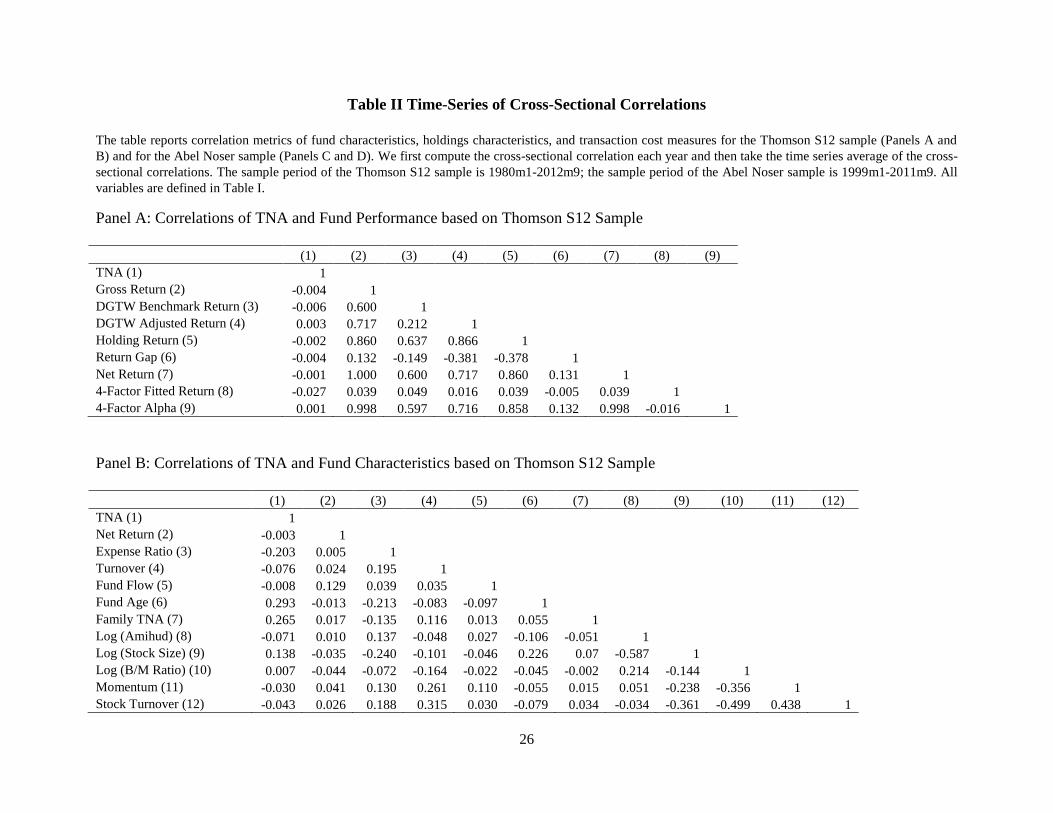
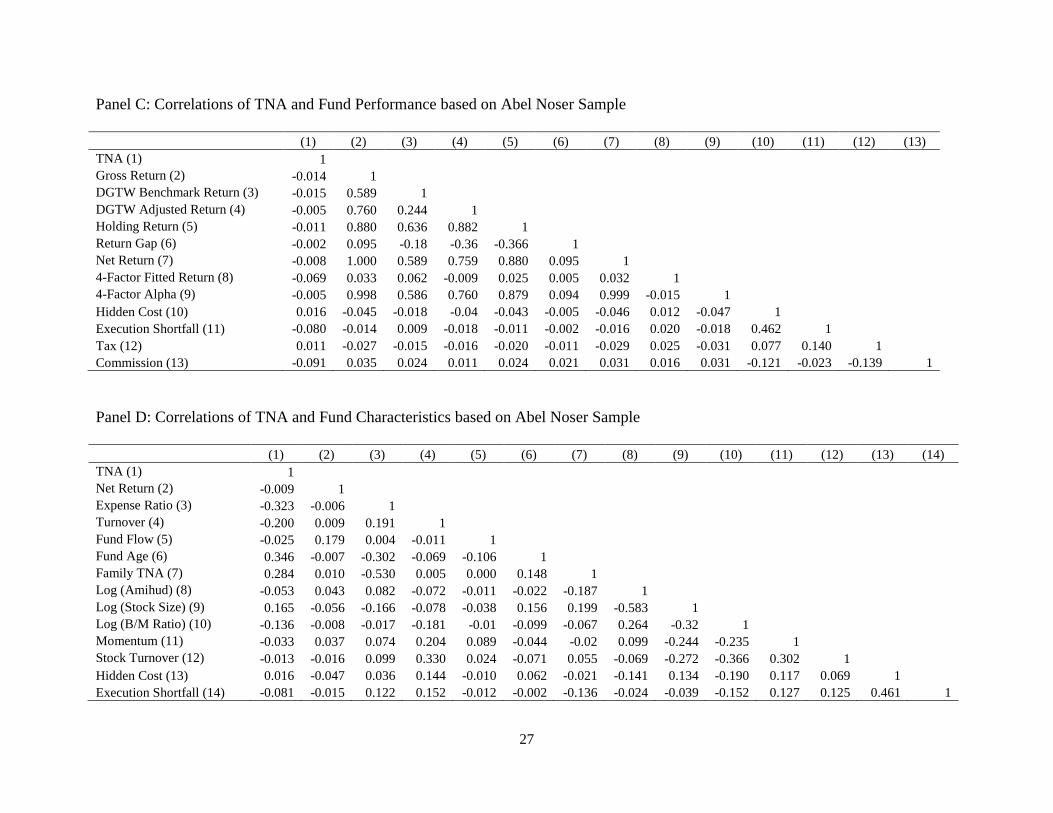
Table II presents correlation metrics among fund characteristics, holding characteristics,
and transaction cost measures for both the Thomson S12 sample (Panels A and B) and the Abel
Noser sample (Panels C and D). We first compute the cross-sectional correlation each year and
then take the time series average of the cross-sectional correlations. Consistent with the patterns
in Table I, fund TNA is negatively correlated to fund gross and net returns, fund holdings-based
returns, expense ratio, and turnover ratio. Moreover, fund size positively correlates with the
market capitalization and liquidity of stock held in the portfolio and negatively correlates with
the momentum of portfolio stocks. As for transaction cost measures, fund TNA negatively
correlates with fund execution shortfall and brokerage commission.
[Insert Table II here]
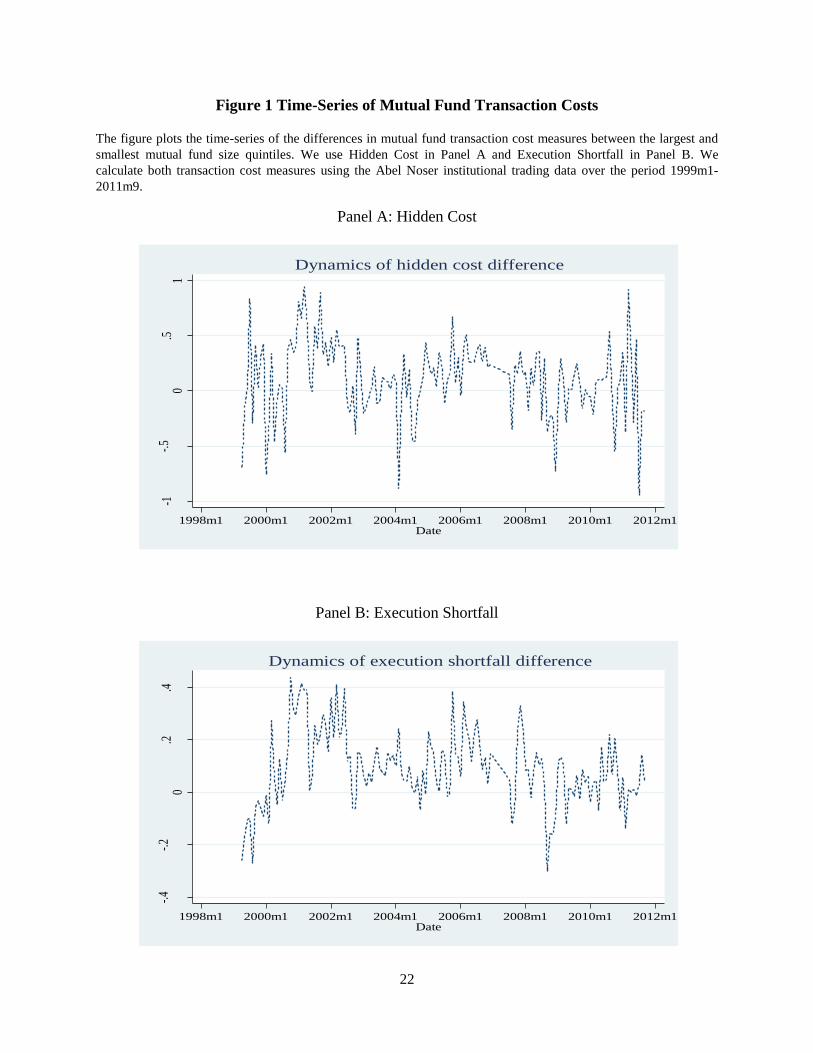
We further investigate and plot the time-series patterns of the differences in fund
transaction cost measures, hidden cost and execution shortfall, between the top and bottom fund
size quintiles in Figure 1. Consistent with the results in Table I, we find that larger funds have
lower transaction costs, on average, than small funds over time. In some periods, such as the
second half of 2010, hidden cost is negative, which implies that mutual funds provide liquidity to
the market. During the financial crisis (i.e., the second half of 2008), both measures of
transaction costs dramatically increase.
[Insert Figure 1 here]
III. How Does Size Affect Mutual Fund Performance?
In this section, we first confirm again in our sample diseconomies of scale in the mutual
fund industry. We use both time-series portfolio and cross-sectional regression approaches. To
precisely determine the underlying mechanism behind mutual fund diseconomies of scale, we
analyze the Abel Noser data to examine how implicit transaction costs, computed from actual
fund trades, affect fund performance. Our results show that transaction costs cannot explain
diminishing returns to scale in mutual funds. We lastly examine whether fund portfolio holding
11
characteristics, such as stock size, B/M ratio, and momentum, can account for fund diseconomies
of scale, and we find support for this hypothesis.
A. Relation between Fund Size and Fund Performance
Following prior studies (e.g., Chen et al. (2004) and Yan (2008)), we use a time-series
portfolio approach to analyze how fund size affects performance. Specifically, we sort all funds
into quintiles each month based on their previous-month TNA. We then compute equal-weighted
monthly returns for each quintile, which gives five time-series of portfolio returns. We evaluate
these five portfolio returns using the CAPM model, the Fama-French (1993) three-factor model,
and the Carhart (1997) four-factor model, respectively, as follows:
( )
( )
where is the net return of fund quintile i in month t minus the risk free rate;
is the excess return of the CRSP value-weighted market index over the risk free rate; SMB,
HML, and UMD are the returns of size, book-to-market, and momentum factors, respectively.
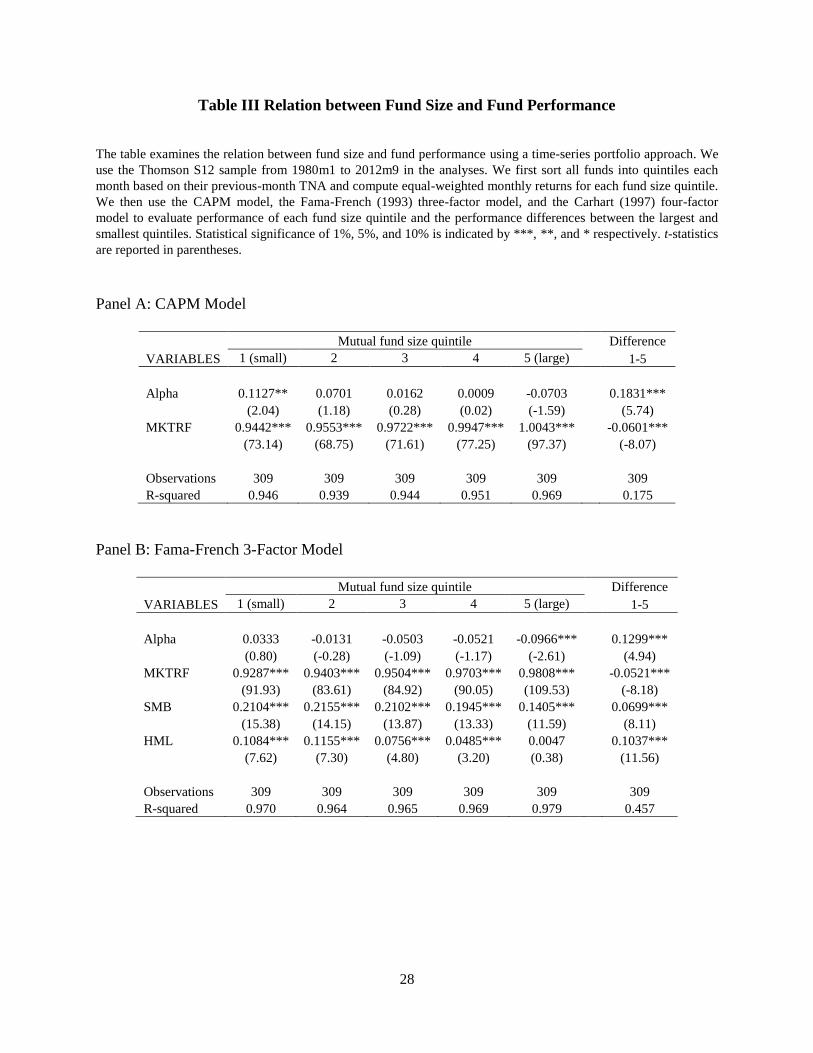
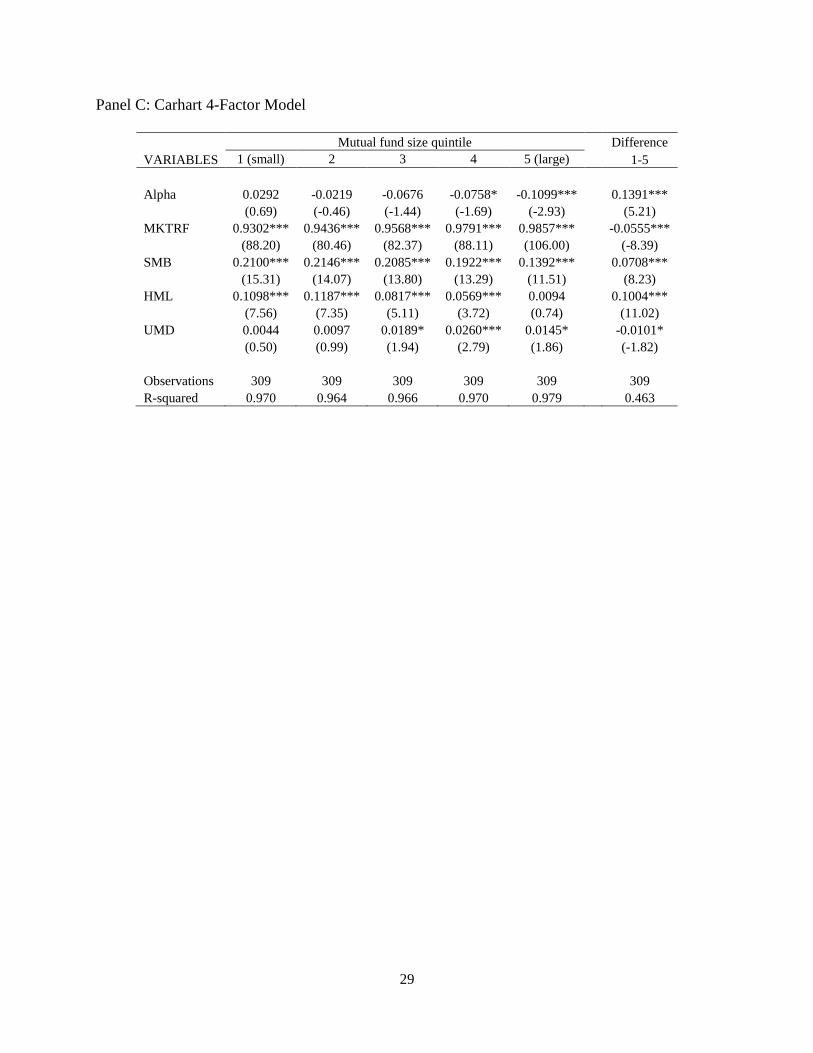
Table III presents the estimation results based on the Thomson S12 sample over the
period from 1980 to 2012. Regardless of the alpha measure, funds in the smallest quintile
perform significantly better than funds in the largest quintile on a risk-adjusted basis.
Specifically, funds in the smallest quintile outperform funds in the largest quintile by 18.3 basis
points per month based on the CAPM model, 13.0 basis points per month based on the three-
factor model, and 13.9 basis points per month based on the Carhart (1997) model, all significant
at the 1% level. The magnitude of these performance differences is similar to that reported by
Chen et al. (2004) and Yan (2008).
[Insert Table III here]
These performance results are robust to analyses based on fund gross returns, i.e.,
summing net returns and expense ratios (untabulated). As large funds have lower expense ratios
12
than small funds, the alpha difference of the smallest and largest quintiles is larger than the
difference based on net fund returns. Moreover, we find similar results when we analyze the
Abel Noser sample (untabulated). Overall, we confirm with our fund sample and over our sample
period that small funds significantly outperform large funds.
B. Can Transaction Costs Explain Diseconomies of Scale?
Prior studies suggest that larger funds underperform smaller funds because they incur
higher transaction costs, driven by price impact (e.g., Chen et al. (2004), Yan (2008), and
Edelen, Evans, and Kadlec (2013)). Without examining actual mutual fund trades, however, one
cannot precisely test this hypothesis. In this section, we use trade-by-trade data from Abel Noser
to formally test whether transaction costs can explain why large funds underperform small funds.
Following prior studies (e.g., Chen et al. (2004) and Yan (2008)), we employ a cross-sectional
regression Fama-MacBeth (1973) approach.
With a cross-sectional regression approach, we control for fund-level variables and
portfolio holding characteristics in order to isolate the transaction cost effect. The detailed
specification is:
where is the return of fund i in month t with or without adjusting for performance
benchmarks, is the logarithm of fund TNA for month t–1, is the
transaction cost measure from Abel Noser data, either hidden cost or execution shortfall, in
month t–1, and is a set of fund-level control variables from month t–1, including expense
ratio, turnover, net flow, fund age, and logged family size. We use the Fama-MacBeth (1973)
estimation method: we first estimate cross-sectional regression (8) each month and then report
the time-series average of the monthly coefficients. The existence of mutual fund diseconomies
of scale would predict that is negative and significant. If transaction costs or price impact can
fully explain the relation between fund size and performance, we expect to be negative and
significant while is insignificant.
13
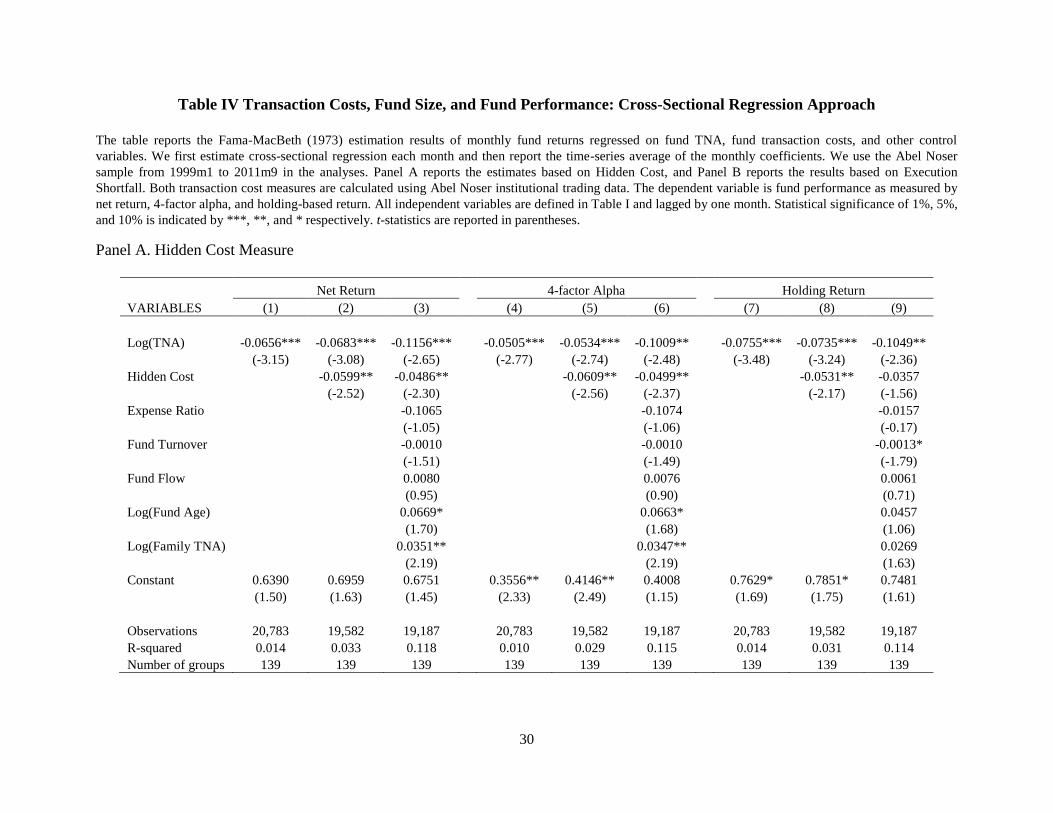
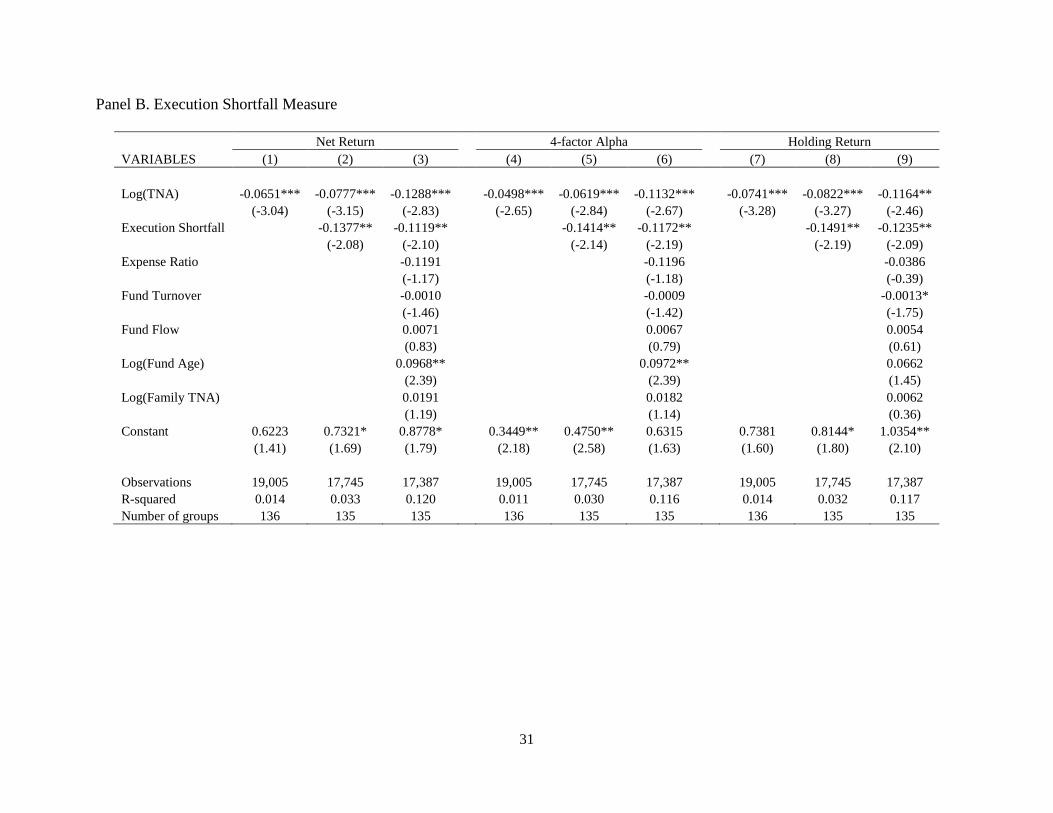
Table IV reports the estimation results. First, consistent with earlier results, we find
strong evidence that funds in the Abel Noser sample experience diminishing returns to scale. As
shown in all specifications in both panels, the coefficient on fund TNA is negative and
significant at the 5% level or better. Second, transaction costs erode fund returns, since the
coefficient on hidden cost or execution shortfall is always negative and significant at the 5%
level except in one specification. This evidence is consistent with Edelen, Evans, and Kadlec
(2013).
However, as shown in columns (2), (5), and (8) in both panels, even after controlling for
fund transaction costs from actual trades, the coefficients on fund TNA remain negative and
significant. This pattern is robust to additional controls for various fund characteristics in
columns (3), (6), and (9). This set of evidence suggests that, although transaction costs hurt fund
performance, they cannot explain diseconomies of scale. Our results are also robust to scaling the
dollar transaction cost by fund TNA rather than the dollar trade value (untabulated).
Consequently, our analysis of mutual fund trades does not support the idea that larger funds
experience greater transaction costs or that transaction costs drive the underperformance of large
funds.
[Insert Table IV here]
To better understand fund transaction costs, we further examine how transaction cost
measures vary with fund size and other fund characteristics. The univariate results in Table I
provide evidence that larger funds have lower transaction costs. We formally carry out
multivariate regression analyses to test this idea using the Fama-MacBeth (1973) method. The
specification is as follows:
where is the transaction cost measure estimated from Abel Noser data, either
hidden cost or execution shortfall, for month t, is the logarithm of fund TNA for
month t–1, and is a set of fund-level control variables for month t–1, including expense
ratio, turnover, net flow, fund age, logged family TNA, fund net return, and the average Amihud
(2002) illiquidity measure based on fund portfolio holdings.
14
Table V presents our estimation results. Consistent with the results in Table I, we find
that larger funds have smaller transaction costs than smaller funds, as measured by either hidden
cost or execution shortfall. In all four specifications in Table V, the coefficient on fund TNA is
negative and significant at the 1% level. This evidence runs counter to the hypothesis in prior
literature that suggests that larger funds experience greater transaction costs than smaller funds in
their trades. Moreover, fund transaction costs also relate to other fund characteristics, such as
fund turnover ratio, fund family size, and fund age. As one would expect, the greater is the
turnover ratio of a fund, the greater are its transaction costs, and the larger the fund’s family size,
the lower are its transaction costs. Interestingly, we also find that old funds tend to experience
larger transaction costs than young funds. Lastly, transaction cost measures of mutual funds tend
to persist over time.
[Insert Table V here]
C. Holding Characteristics and Mutual Fund Diseconomies of Scale
Given our evidence that mutual fund transaction costs are not the reason larger funds
underperform smaller funds, we investigate whether portfolio holdings characteristics can help
explain diseconomies of scale in the mutual fund industry. Specifically, we examine the relation
between holdings characteristics and fund size and see how this relation relates to the
underperformance of larger funds.
To begin, we construct a set of fund-level holdings characteristics based on fund portfolio
holdings and corresponding stock-level variables: market capitalization, B/M ratio, momentum,
turnover ratio, and Amihud measure. We regress these holdings characteristics on fund TNA via
the Fama-MacBeth (1973) method.
Table VI presents the estimation results for both the Thomson S12 and Abel Noser
samples. We find significant differences in portfolio holding characteristics related to fund size.
Specifically, compared to smaller funds, larger funds tend to hold stocks with larger market
capitalization, lower book-to-market ratios, lower momentum, and greater liquidity. This
evidence is consistent overall with the results in Table I. As stocks with larger market
capitalization, lower book-to-market, lower momentum, and greater liquidity have lower average
15
returns cross-sectionally (e.g., Banz (1981), Basu (1983), Amihud and Mendelson (1986), Fama
and French (1992), Jegadeesh and Titman (1993), Daniel and Titman (1997), Pastor and
Stambaugh (2003), Acharya and Pedersen (2005), and Avramov and Chordia (2006a, 2006b)),
the differences across groups of funds sorted according to TNA suggest that portfolio holdings
characteristics can potentially explain diseconomies of scale in the mutual fund industry.
[Insert Table VI here]
Next, we formally test whether portfolio holding characteristics account for the mutual
fund diseconomies of scale effect. We adopt the following specification estimated via Fama-
MacBeth (1973):
where is the return of fund i in month t with or without adjusting for performance
benchmarks, is the logarithm of fund TNA for month t–1, is a set
of stock holding characteristics as of month t–1, including market capitalization, B/M ratio,
momentum, turnover ratio, and Amihud measure, and is a set of fund-level control
variables at month t–1, including expense ratio, turnover, net flow, fund age, and logged family
TNA. If diminishing returns to scale in mutual funds are attributable to portfolio holding
characteristics, we expect to change from significantly negative to insignificant when we add
portfolio holding characteristics in the regressions.
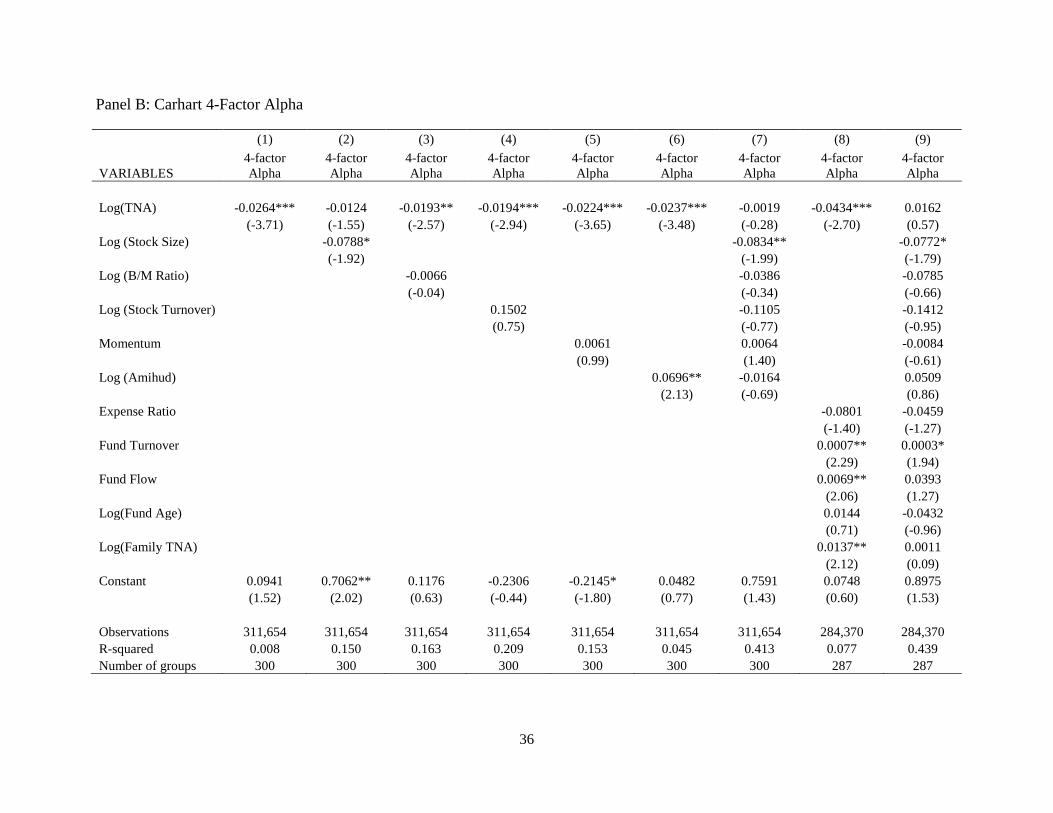
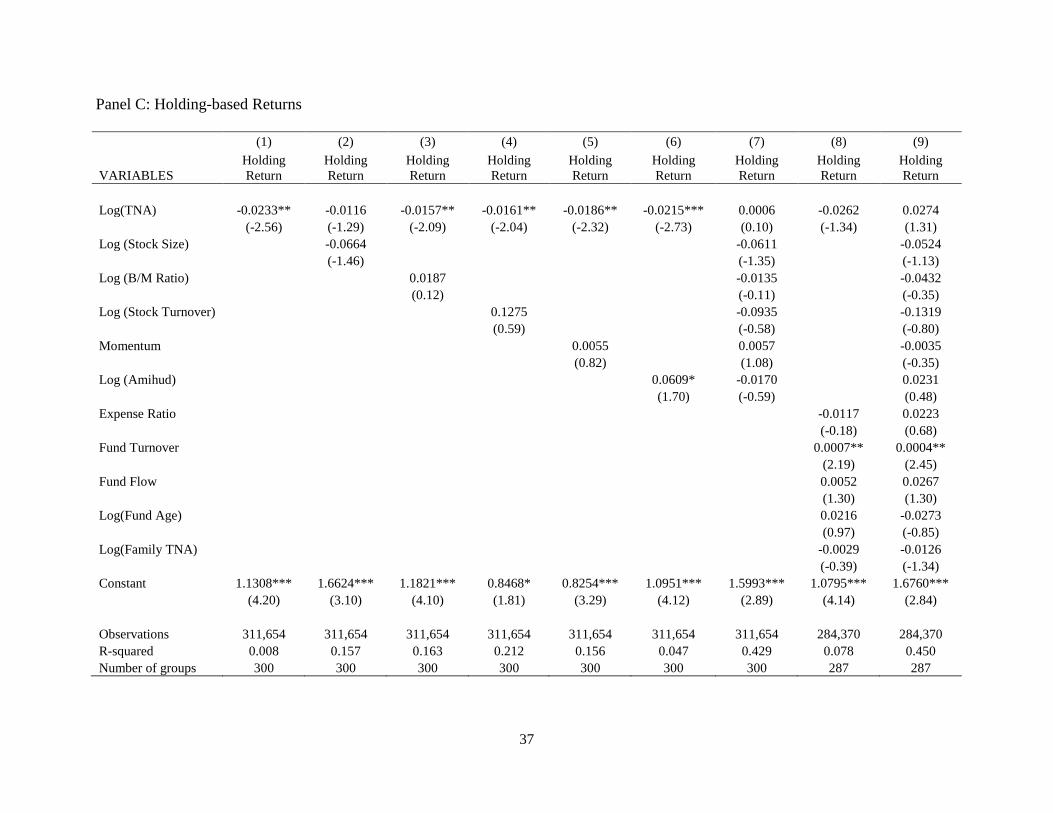
Table VII reports estimation results with fund excess return (Panel A), four-factor alpha
(Panel B), and holding return (Panel C) as the dependent variables based on the Thomson S12
sample. We highlight a number of findings. First, the results in column (1) of all three panels
confirm results from the cross-sectional regression approach that larger funds significantly
underperform smaller funds in the Thomson S12 sample. Second, we find that the market
capitalization of stocks held by mutual funds is negatively related to fund performance. More
importantly, once we control for the market capitalization of fund holdings, as in columns (2),
(7), and (9) of all three panels, the coefficients on fund size become insignificant. Thus, after
accounting for the difference in market capitalization of fund portfolio holdings, performance
across funds is unrelated to TNA. These results suggest that, to avoid price impact, larger funds
hold larger stocks, on average, and thus earn a lower return cross-sectionally.
16
[Insert Table VII here]
Third, when we control for other portfolio holding characteristics such as the B/M ratio,
momentum, stock turnover, and the Amihud ratio, the magnitude of the coefficients on fund
TNA decrease, but the coefficients remain significantly negative. Our results do not materially
change when we include fund-level controls such as the expense ratio, turnover, net flow, fund
age, and fund family size. Moreover, our results are qualitatively similar when we use fund gross
returns, the one-factor alpha, or the three-factor alpha as the dependent variable (untabulated).
We further examine the relation between the market capitalization of fund holdings and
fund TNA via an alternative approach. In particular, we double sort funds, first on average
market capitalization of fund holdings and then on fund TNA. We first form five quintiles of
funds based on the past average market capitalization of fund holdings. Within each quintile, we
further divide funds into five portfolios based on fund TNA. We rebalance the portfolios
quarterly. If the market capitalization of holdings explains diseconomies of scale in mutual
funds, we would expect that within each market capitalization portfolio, the performance
difference across different TNA portfolios should not significantly differ from zero.
Table VIII reports the results of the double sort analysis. Panel A presents the results with
fund excess returns (net returns minus one month T-bill rate), Panel B presents the results with
Carhart 4-factor alphas, and Panel C presents the results with holding-based returns. Consistent
with the cross-sectional estimation evidence in Table VII, for all three performance measures, we
find that differences in the performance of funds in the smallest and largest TNA quintiles do not
significantly differ from zero, except in the smallest market capitalization portfolio. This
evidence further supports our finding that after controlling for the market capitalization of fund
holdings, we find little evidence of diseconomies of scale in mutual fund performance.
[Insert Table VIII here]
Lastly, we analyze the Abel Noser sample and run a horse race between transaction costs
and portfolio holding characteristics to see whether one can drive away the negative relation
between fund size and fund performance. Again, we adopt a cross-sectional regression approach
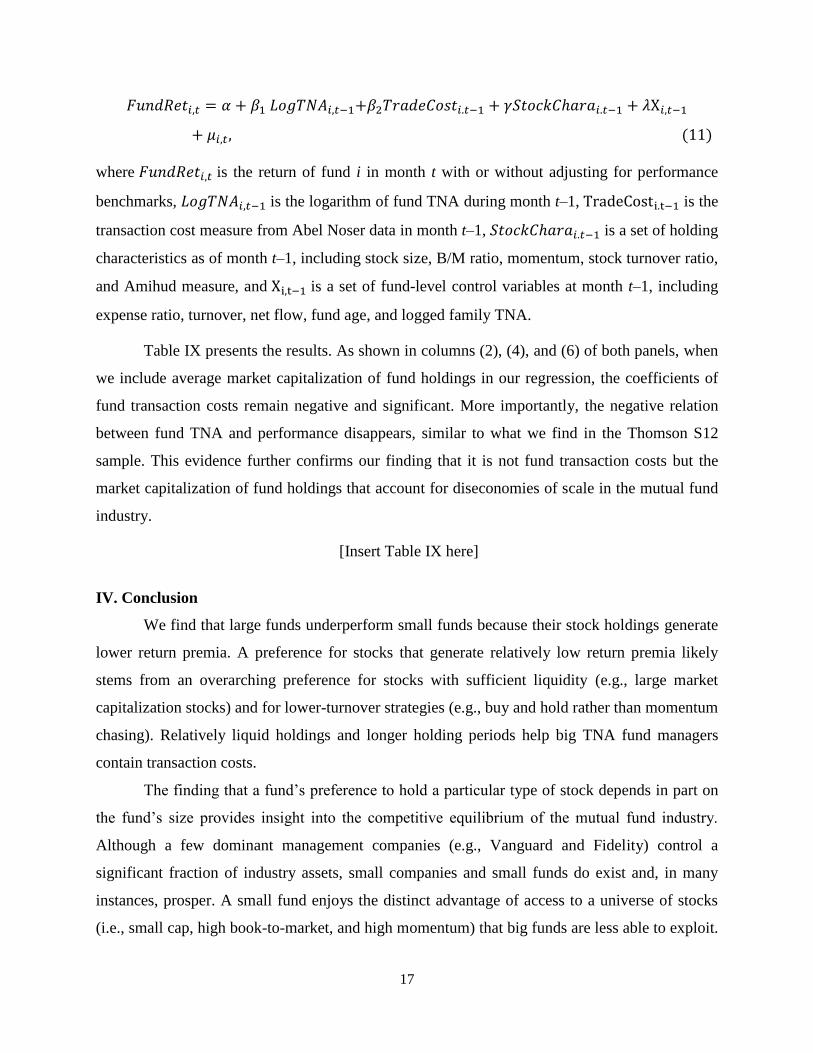
using the Fama-MacBeth (1973) estimation method. We use the following specification:
17
where is the return of fund i in month t with or without adjusting for performance
benchmarks, is the logarithm of fund TNA during month t–1, is the
transaction cost measure from Abel Noser data in month t–1, is a set of holding
characteristics as of month t–1, including stock size, B/M ratio, momentum, stock turnover ratio,
and Amihud measure, and is a set of fund-level control variables at month t–1, including
expense ratio, turnover, net flow, fund age, and logged family TNA.
Table IX presents the results. As shown in columns (2), (4), and (6) of both panels, when
we include average market capitalization of fund holdings in our regression, the coefficients of
fund transaction costs remain negative and significant. More importantly, the negative relation
between fund TNA and performance disappears, similar to what we find in the Thomson S12
sample. This evidence further confirms our finding that it is not fund transaction costs but the
market capitalization of fund holdings that account for diseconomies of scale in the mutual fund
industry.
[Insert Table IX here]
IV. Conclusion
We find that large funds underperform small funds because their stock holdings generate
lower return premia. A preference for stocks that generate relatively low return premia likely
stems from an overarching preference for stocks with sufficient liquidity (e.g., large market
capitalization stocks) and for lower-turnover strategies (e.g., buy and hold rather than momentum
chasing). Relatively liquid holdings and longer holding periods help big TNA fund managers
contain transaction costs.
The finding that a fund’s preference to hold a particular type of stock depends in part on
the fund’s size provides insight into the competitive equilibrium of the mutual fund industry.
Although a few dominant management companies (e.g., Vanguard and Fidelity) control a
significant fraction of industry assets, small companies and small funds do exist and, in many
instances, prosper. A small fund enjoys the distinct advantage of access to a universe of stocks
(i.e., small cap, high book-to-market, and high momentum) that big funds are less able to exploit.
18
Whereas new, small funds are unable to compete with big funds on expenses, they more than
make up for this disadvantage with an investment pool that offers higher average returns. By
contrast, small companies in many other industries face built-in disadvantages. In the retail
industry, for example, a firm’s negotiating power with suppliers is often directly related to the
size of its contract. Few retail firms can compete with Walmart or Amazon on price, as their
sales volume allows them to negotiate rock-bottom costs. In the mutual fund industry, no similar
volume-discount exists. In fact, it works in the opposite direction, as transaction costs correlate
positively with trade size. Ignoring skill, then, it is not surprising that big funds compete by
charging low expenses whereas small funds have the opportunity to earn higher investment
returns, the very dynamics that manifest themselves in the diseconomies of scale that we see
across the industry.
19
References
Acharya, Viral and Lasse Pedersen, 2005, Asset Pricing with Liquidity Risk, Journal of Financial
Economics 77, 375–410.
Agarwal, Vikas, Yuehua Tang, and Baozhong Yang, 2012, Do Mutual Funds Have Market
Timing Ability? Evidence from Mutual Fund Trades, Working Paper, Georgia State University
and Singapore Management University
Amihud, Yakov, 2002, Illiquidity and Stock Returns: Cross Section and Time Series Effects,
Journal of Financial Markets 5, 31–56
Amihud, Yakov and Haim Mendelson, 1986, Asset Pricing and the Bid-Ask Spread, Journal of
Financial Economics 17, 223-49.
Anand, Amber, Paul Irvine, Andy Puckett, and Kumar Venkataraman, 2012, Performance of
Institutional Trading Desks: An Analysis of Persistence in Trading Costs, Review of Financial
Studies 25, 557–598
Avramov, Doron and Tarun Chordia, 2006a, Asset Pricing Models and Financial Market
Anomalies, Review of Financial Studies 19, 1001–1040.
Avramov, Doron and Tarun Chordia, 2006b, Predicting stock returns, Journal of Financial
Economics 82, 387–415.
Banz, Rolf W., 1981, The relative efficiency of various portfolios: some further evidence:
discussion, Journal of Finance 32, 663–682.
Basu, S., 1977, Investment performance of common stocks in relation to their price-earnings
ratios: a test of the efficient market hypothesis, Journal of Finance 32, 663–682.
Berk, Jonathan B., and Richard C. Green, 2004, Mutual Fund Flows and Performance in Rational
Markets. Journal of Political Economy 112, 1269–1295.
Busse, Jeffrey A., T. Clifton Green, and Narasimhan Jegadeesh, 2012, Buy-Side Trades and Sell-
Side Recommendations: Interactions and Information Content, Journal of Financial Markets 15,
207–232.
Carhart, Mark M., 1997, On Persistence in Mutual Fund Performance, Journal of Finance 52,
57–82.
Chemmanur, T., S. He, and G. Hu. 2009. The Role of Institutional Investors in Seasoned Equity
Offerings. Journal of Financial Economics 94:384–411.
Chen, Joseph, Harrison Hong, Ming Huang, and Jeffrey Kubik, 2004, Does fund size erode
mutual fund performance? The role of liquidity and organization, American Economic Review
94, 1276–1302.
20
Christoffersen, Keim, and Musto, 2008, Valuable Information and Costly Liquidity: Evidence
from Individual Mutual Fund Trades, Working Paper, University of Pennsylvania
Daniel, Kent, Mark Grinblatt, Sheridan Titman, and Russ Wermers, 1997, Measuring Mutual
Fund Performance with Characteristic-Based Benchmarks, Journal of Finance 52, 1035–1058.
Daniel, Kent and Sheridan Titman, 1997, Evidence on the Characteristics of Cross Sectional
Variation in Stock Returns, Journal of Finance 52, 1–33.
Edelen, Evans, and Kadlec, 2013, Shedding Light on “Invisible” Costs: Trading Costs and
Mutual Fund Performance, Financial Analysts Journal 69, 33–44.
Elton, Edwin J., Martin J. Gruber, and Christopher R. Blake, 2001, A First Look at the Accuracy
of the CRSP Mutual Database and a Comparison of the CRSP and Morningstar Mutual Fund
Databases, Journal of Finance 56, 2415–2430.
Elton, Edwin J., Martin J. Gruber, and Christopher R. Blake, 2012, Does Mutual Fund Size
Matter? The Relationship Between Size and Performance, Review of Asset Pricing Studies 2,
31–55.
Fama, Eugene F. and Kenneth R. French, 1992, The cross-section of expected stock returns,
Journal of Finance 47, 427–465.
Fama, Eugene F. and Kenneth R. French, 1993, Common Risk Factors in the Returns on Stocks
and Bonds, Journal of Financial Economics 33, 3–56.
Fama, Eugene F. and James D. MacBeth, 1973, Risk, Return, and Equilibrium: Empirical Tests,
Journal of Political Economy 81, 607–636.
Goldstein, M., P. Irvine, E. Kandel, and Z. Weiner, 2009, Brokerage Commissions and
Institutional Trading Patterns, Review of Financial Studies 22, 5175–5212.
Hu, Gang, 2009, Measures of Implicit Trading Costs and Buy–Sell Asymmetry, Journal of
Financial Markets 12, 418–37.
Jegadeesh, Narasimhan and Sheridan Titman, 1993, Returns to Buying Winners and Selling
Losers: Implications for Stock Market Efficiency, Journal of Finance 48, 65–91.
Kacperczyk, Marcin, Clemens Sialm, and Lu Zheng, 2008, Unobserved Actions of Mutual
Funds, Review of Financial Studies 21, 2379-2416.
Keim, Donald B. and Ananth Madhavan, 1997, Transaction costs and investment style: an inter-
exchange analysis of institutional equity trades. Journal of Financial Economics 46, 265–292.
21
Pastor, Lubos and Robert Stambaugh, 2003, Liquidity Risk and Expected Stock Returns, Journal
of Political Economy 111, 642-85.
Pollet, Joshua M., and Mungo Wilson, 2008, How Does Size Affect Mutual Fund Behavior?
Journal of Finance 63, 2941–69.
Puckett, Andy, and Xuemin Yan, 2011, The Interim Trading Skills of Institutional Investors.
Journal of Finance 66, 601–33.
Sirri, Erik R. and Peter Tufano, 1998, Costly Search and Mutual Fund Flows, Journal of Finance
53, 1589–1622.
Wermers, Russ, 2000, Mutual Fund Performance: An Empirical Decomposition into Stock-
Picking Talent, Style, Transactions Costs, and Expenses, Journal of Finance 55, 1655–1695.
Yan, Xuemin, 2008, Liquidity, investment style, and the relation between fund size and fund
performance, Journal of Financial and Quantitative Analysis 43, 741–767.
22
Figure 1 Time-Series of Mutual Fund Transaction Costs
The figure plots the time-series of the differences in mutual fund transaction cost measures between the largest and
smallest mutual fund size quintiles. We use Hidden Cost in Panel A and Execution Shortfall in Panel B. We
calculate both transaction cost measures using the Abel Noser institutional trading data over the period 1999m1-
2011m9.
Panel A: Hidden Cost
Panel B: Execution Shortfall
-1-.
50
.51
hidd
en c
ost d
iffe
renc
e
1998m1 2000m1 2002m1 2004m1 2006m1 2008m1 2010m1 2012m1Date
Dynamics of hidden cost difference
-.4
-.2
0.2
.4
exec
utio
n sh
ortf
all d
iffe
renc
e
1998m1 2000m1 2002m1 2004m1 2006m1 2008m1 2010m1 2012m1Date
Dynamics of execution shortfall difference
23
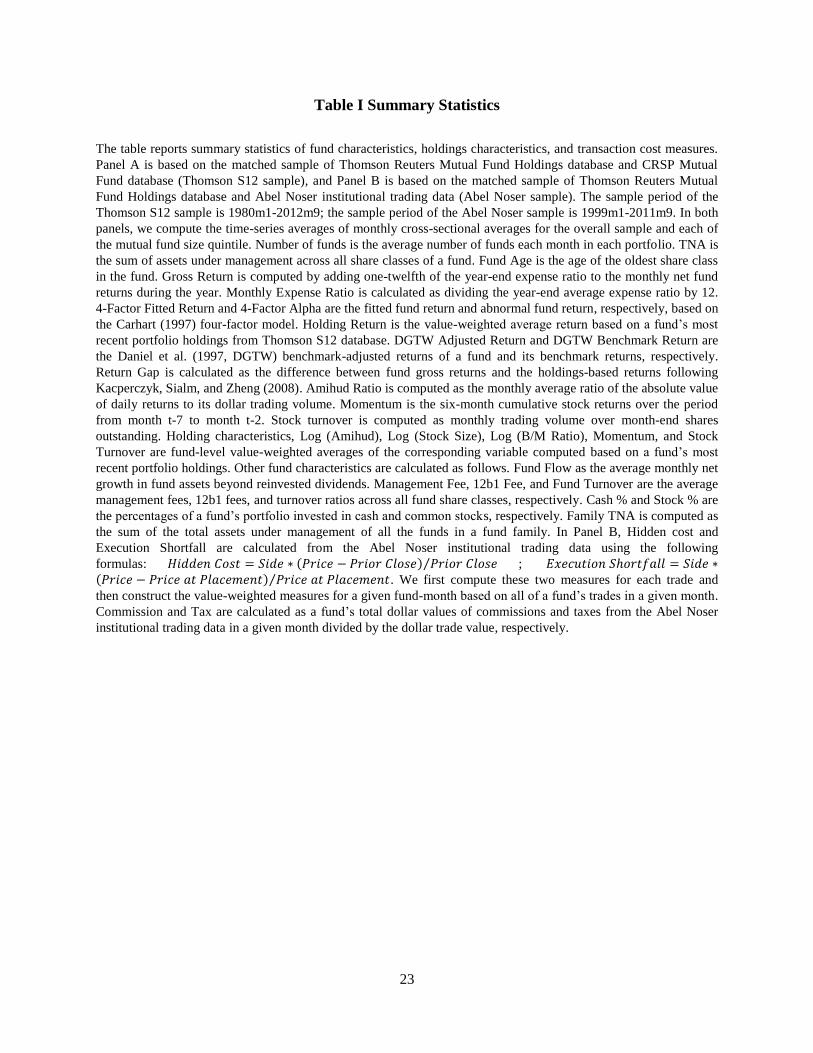
Table I Summary Statistics
The table reports summary statistics of fund characteristics, holdings characteristics, and transaction cost measures.
Panel A is based on the matched sample of Thomson Reuters Mutual Fund Holdings database and CRSP Mutual
Fund database (Thomson S12 sample), and Panel B is based on the matched sample of Thomson Reuters Mutual
Fund Holdings database and Abel Noser institutional trading data (Abel Noser sample). The sample period of the
Thomson S12 sample is 1980m1-2012m9; the sample period of the Abel Noser sample is 1999m1-2011m9. In both
panels, we compute the time-series averages of monthly cross-sectional averages for the overall sample and each of
the mutual fund size quintile. Number of funds is the average number of funds each month in each portfolio. TNA is
the sum of assets under management across all share classes of a fund. Fund Age is the age of the oldest share class
in the fund. Gross Return is computed by adding one-twelfth of the year-end expense ratio to the monthly net fund
returns during the year. Monthly Expense Ratio is calculated as dividing the year-end average expense ratio by 12.
4-Factor Fitted Return and 4-Factor Alpha are the fitted fund return and abnormal fund return, respectively, based on
the Carhart (1997) four-factor model. Holding Return is the value-weighted average return based on a fund’s most
recent portfolio holdings from Thomson S12 database. DGTW Adjusted Return and DGTW Benchmark Return are
the Daniel et al. (1997, DGTW) benchmark-adjusted returns of a fund and its benchmark returns, respectively.
Return Gap is calculated as the difference between fund gross returns and the holdings-based returns following
Kacperczyk, Sialm, and Zheng (2008). Amihud Ratio is computed as the monthly average ratio of the absolute value
of daily returns to its dollar trading volume. Momentum is the six-month cumulative stock returns over the period
from month t-7 to month t-2. Stock turnover is computed as monthly trading volume over month-end shares
outstanding. Holding characteristics, Log (Amihud), Log (Stock Size), Log (B/M Ratio), Momentum, and Stock
Turnover are fund-level value-weighted averages of the corresponding variable computed based on a fund’s most
recent portfolio holdings. Other fund characteristics are calculated as follows. Fund Flow as the average monthly net
growth in fund assets beyond reinvested dividends. Management Fee, 12b1 Fee, and Fund Turnover are the average
management fees, 12b1 fees, and turnover ratios across all fund share classes, respectively. Cash % and Stock % are
the percentages of a fund’s portfolio invested in cash and common stocks, respectively. Family TNA is computed as
the sum of the total assets under management of all the funds in a fund family. In Panel B, Hidden cost and
Execution Shortfall are calculated from the Abel Noser institutional trading data using the following
formulas: ⁄ ; ⁄ . We first compute these two measures for each trade and
then construct the value-weighted measures for a given fund-month based on all of a fund’s trades in a given month.
Commission and Tax are calculated as a fund’s total dollar values of commissions and taxes from the Abel Noser
institutional trading data in a given month divided by the dollar trade value, respectively.
24
Panel A: Thomson S12 Sample from 1980 to 2012
Mutual fund size quintile
Variables All Funds 1 (small) 2 3 4 5 (large)
Number of funds 1319 253 265 266 267 268
TNA ($millions) 1,196.1 36.2 94.2 221.1 566.0 4,610.1
Fund Return Breakdown
Gross Return (%) 0.752 0.944 0.771 0.717 0.712 0.650
Net Return (%) 0.652 0.835 0.667 0.614 0.614 0.562
4-Factor Fitted Return (%) 0.701 0.789 0.699 0.675 0.693 0.660
4-Factor Alpha (%) -0.048 0.045 -0.032 -0.061 -0.079 -0.098
Monthly Expense Ratio (%) 0.100 0.110 0.104 0.102 0.099 0.088
Holding Return (%) 0.758 0.932 0.767 0.712 0.731 0.674
DGTW Benchmark Return (%) 0.728 0.863 0.739 0.697 0.701 0.660
DGTW Adjusted Return (%) 0.026 0.063 0.025 0.012 0.024 0.011
Return Gap (%) -0.005 0.012 0.004 0.005 -0.019 -0.024
Holdings Characteristics
Log (Amihud) 0.57 0.66 0.64 0.62 0.53 0.44
Log (Stock Size) 8.93 8.78 8.81 8.80 8.90 9.28
Log (B/M Ratio) -1.22 -1.19 -1.20 -1.20 -1.24 -1.27
Momentum (%) 12.82 12.71 13.03 12.91 13.13 12.35
Stock Turnover (%) 19.41 19.31 19.43 19.61 19.68 19.01
Other Fund Characteristics
Fund Age 13.1 7.7 9.6 11.2 14.1 21.3
Fund Flow (%) 0.56 1.49 0.67 0.41 0.29 0.10
Turnover (%) 92.33 112.92 101.93 93.00 88.85 71.67
Management Fee (%) 0.73 0.64 0.78 0.79 0.77 0.67
12b1 Fee (%) 0.42 0.42 0.42 0.44 0.43 0.41
Cash % 3.38 3.36 3.32 3.31 3.41 3.50
Stock % 95.02 95.20 95.24 95.12 95.06 94.55
Family TNA ($billions) 99.2 43.1 56.7 72.2 107.9 197.7
25
Panel B: Abel Noser Sample from 1999 to 2011
Mutual fund size quintile
Variables All Funds 1 (small) 2 3 4 5 (large)
Number of funds 137 27 27 27 28 27
TNA ($millions) 2775.9 61.1 196.2 519.1 1540.7 11076.1
Fund Return Breakdown
Gross Return (%) 0.381 0.506 0.479 0.445 0.303 0.187
Net Return (%) 0.284 0.387 0.363 0.345 0.215 0.123
4-Factor Fitted Return (%) 0.295 0.396 0.330 0.264 0.233 0.258
4-Factor Alpha (%) -0.012 -0.009 0.032 0.081 -0.019 -0.136
Monthly Expense Ratio (%) 0.097 0.119 0.116 0.101 0.089 0.065
Holding Return (%) 0.329 0.440 0.420 0.381 0.233 0.184
DGTW Benchmark Return (%) 0.303 0.423 0.351 0.309 0.228 0.214
DGTW Adjusted Return (%) 0.018 0.015 0.068 0.063 -0.004 -0.046
Return Gap (%) 0.052 0.066 0.059 0.065 0.071 0.003
Fund Transaction Costs
Hidden Cost (%) 0.220 0.300 0.344 0.170 0.101 0.191
Execution Shortfall (%) 0.173 0.193 0.304 0.151 0.131 0.091
Commission (%) 0.123 0.125 0.133 0.126 0.125 0.106
Tax (%) 0.009 0.009 0.018 0.013 0.006 0.002
Holdings Characteristics
Log (Amihud) 0.39 0.39 0.42 0.37 0.43 0.36
Log (Stock Size) 9.30 9.09 9.07 9.39 9.26 9.65
Log (B/M Ratio) -1.18 -1.17 -1.11 -1.10 -1.24 -1.28
Momentum (%) 10.60 10.14 10.37 11.01 11.74 9.75
Stock Turnover (%) 22.03 22.17 21.12 21.07 23.13 22.59
Other Fund Characteristics
Fund Age 13.9 7.7 10.2 12.8 15.5 22.4
Fund Flow (%) 0.37 1.32 0.38 0.21 0.10 -0.10
Turnover (%) 104.23 128.17 118.26 105.18 98.90 74.09
Management Fee (%) 0.61 0.55 0.70 0.67 0.61 0.52
12b1 Fee (%) 0.42 0.51 0.53 0.46 0.40 0.21
Cash % 3.07 3.23 3.25 3.30 2.61 2.99
Stock % 93.84 94.95 92.77 93.65 94.64 93.24
Family TNA ($billions) 520.7 409.7 336.9 453.8 573.1 809.8
26
Table II Time-Series of Cross-Sectional Correlations
The table reports correlation metrics of fund characteristics, holdings characteristics, and transaction cost measures for the Thomson S12 sample (Panels A and
B) and for the Abel Noser sample (Panels C and D). We first compute the cross-sectional correlation each year and then take the time series average of the cross-
sectional correlations. The sample period of the Thomson S12 sample is 1980m1-2012m9; the sample period of the Abel Noser sample is 1999m1-2011m9. All
variables are defined in Table I.
Panel A: Correlations of TNA and Fund Performance based on Thomson S12 Sample
(1) (2) (3) (4) (5) (6) (7) (8) (9)
TNA (1) 1
Gross Return (2) -0.004 1
DGTW Benchmark Return (3) -0.006 0.600 1
DGTW Adjusted Return (4) 0.003 0.717 0.212 1
Holding Return (5) -0.002 0.860 0.637 0.866 1
Return Gap (6) -0.004 0.132 -0.149 -0.381 -0.378 1
Net Return (7) -0.001 1.000 0.600 0.717 0.860 0.131 1
4-Factor Fitted Return (8) -0.027 0.039 0.049 0.016 0.039 -0.005 0.039 1
4-Factor Alpha (9) 0.001 0.998 0.597 0.716 0.858 0.132 0.998 -0.016 1
Panel B: Correlations of TNA and Fund Characteristics based on Thomson S12 Sample
(1) (2) (3) (4) (5) (6) (7) (8) (9) (10) (11) (12)
TNA (1) 1
Net Return (2) -0.003 1
Expense Ratio (3) -0.203 0.005 1
Turnover (4) -0.076 0.024 0.195 1
Fund Flow (5) -0.008 0.129 0.039 0.035 1
Fund Age (6) 0.293 -0.013 -0.213 -0.083 -0.097 1
Family TNA (7) 0.265 0.017 -0.135 0.116 0.013 0.055 1
Log (Amihud) (8) -0.071 0.010 0.137 -0.048 0.027 -0.106 -0.051 1
Log (Stock Size) (9) 0.138 -0.035 -0.240 -0.101 -0.046 0.226 0.07 -0.587 1
Log (B/M Ratio) (10) 0.007 -0.044 -0.072 -0.164 -0.022 -0.045 -0.002 0.214 -0.144 1
Momentum (11) -0.030 0.041 0.130 0.261 0.110 -0.055 0.015 0.051 -0.238 -0.356 1
Stock Turnover (12) -0.043 0.026 0.188 0.315 0.030 -0.079 0.034 -0.034 -0.361 -0.499 0.438 1
27
Panel C: Correlations of TNA and Fund Performance based on Abel Noser Sample
(1) (2) (3) (4) (5) (6) (7) (8) (9) (10) (11) (12) (13)
TNA (1) 1
Gross Return (2) -0.014 1
DGTW Benchmark Return (3) -0.015 0.589 1
DGTW Adjusted Return (4) -0.005 0.760 0.244 1
Holding Return (5) -0.011 0.880 0.636 0.882 1
Return Gap (6) -0.002 0.095 -0.18 -0.36 -0.366 1
Net Return (7) -0.008 1.000 0.589 0.759 0.880 0.095 1
4-Factor Fitted Return (8) -0.069 0.033 0.062 -0.009 0.025 0.005 0.032 1
4-Factor Alpha (9) -0.005 0.998 0.586 0.760 0.879 0.094 0.999 -0.015 1
Hidden Cost (10) 0.016 -0.045 -0.018 -0.04 -0.043 -0.005 -0.046 0.012 -0.047 1
Execution Shortfall (11) -0.080 -0.014 0.009 -0.018 -0.011 -0.002 -0.016 0.020 -0.018 0.462 1
Tax (12) 0.011 -0.027 -0.015 -0.016 -0.020 -0.011 -0.029 0.025 -0.031 0.077 0.140 1
Commission (13) -0.091 0.035 0.024 0.011 0.024 0.021 0.031 0.016 0.031 -0.121 -0.023 -0.139 1
Panel D: Correlations of TNA and Fund Characteristics based on Abel Noser Sample
(1) (2) (3) (4) (5) (6) (7) (8) (9) (10) (11) (12) (13) (14)
TNA (1) 1
Net Return (2) -0.009 1
Expense Ratio (3) -0.323 -0.006 1
Turnover (4) -0.200 0.009 0.191 1
Fund Flow (5) -0.025 0.179 0.004 -0.011 1
Fund Age (6) 0.346 -0.007 -0.302 -0.069 -0.106 1
Family TNA (7) 0.284 0.010 -0.530 0.005 0.000 0.148 1
Log (Amihud) (8) -0.053 0.043 0.082 -0.072 -0.011 -0.022 -0.187 1
Log (Stock Size) (9) 0.165 -0.056 -0.166 -0.078 -0.038 0.156 0.199 -0.583 1
Log (B/M Ratio) (10) -0.136 -0.008 -0.017 -0.181 -0.01 -0.099 -0.067 0.264 -0.32 1
Momentum (11) -0.033 0.037 0.074 0.204 0.089 -0.044 -0.02 0.099 -0.244 -0.235 1
Stock Turnover (12) -0.013 -0.016 0.099 0.330 0.024 -0.071 0.055 -0.069 -0.272 -0.366 0.302 1
Hidden Cost (13) 0.016 -0.047 0.036 0.144 -0.010 0.062 -0.021 -0.141 0.134 -0.190 0.117 0.069 1
Execution Shortfall (14) -0.081 -0.015 0.122 0.152 -0.012 -0.002 -0.136 -0.024 -0.039 -0.152 0.127 0.125 0.461 1
28
Table III Relation between Fund Size and Fund Performance
The table examines the relation between fund size and fund performance using a time-series portfolio approach. We
use the Thomson S12 sample from 1980m1 to 2012m9 in the analyses. We first sort all funds into quintiles each
month based on their previous-month TNA and compute equal-weighted monthly returns for each fund size quintile.
We then use the CAPM model, the Fama-French (1993) three-factor model, and the Carhart (1997) four-factor
model to evaluate performance of each fund size quintile and the performance differences between the largest and
smallest quintiles. Statistical significance of 1%, 5%, and 10% is indicated by ***, **, and * respectively. t-statistics
are reported in parentheses.
Panel A: CAPM Model
Mutual fund size quintile Difference
VARIABLES 1 (small) 2 3 4 5 (large)
1-5
Alpha 0.1127** 0.0701 0.0162 0.0009 -0.0703
0.1831***
(2.04) (1.18) (0.28) (0.02) (-1.59)
(5.74)
MKTRF 0.9442*** 0.9553*** 0.9722*** 0.9947*** 1.0043***
-0.0601***
(73.14) (68.75) (71.61) (77.25) (97.37)
(-8.07)
Observations 309 309 309 309 309
309
R-squared 0.946 0.939 0.944 0.951 0.969 0.175
Panel B: Fama-French 3-Factor Model
Mutual fund size quintile Difference
VARIABLES 1 (small) 2 3 4 5 (large)
1-5
Alpha 0.0333 -0.0131 -0.0503 -0.0521 -0.0966***
0.1299***
(0.80) (-0.28) (-1.09) (-1.17) (-2.61)
(4.94)
MKTRF 0.9287*** 0.9403*** 0.9504*** 0.9703*** 0.9808***
-0.0521***
(91.93) (83.61) (84.92) (90.05) (109.53)
(-8.18)
SMB 0.2104*** 0.2155*** 0.2102*** 0.1945*** 0.1405***
0.0699***
(15.38) (14.15) (13.87) (13.33) (11.59)
(8.11)
HML 0.1084*** 0.1155*** 0.0756*** 0.0485*** 0.0047
0.1037***
(7.62) (7.30) (4.80) (3.20) (0.38)
(11.56)
Observations 309 309 309 309 309
309
R-squared 0.970 0.964 0.965 0.969 0.979 0.457
29
Panel C: Carhart 4-Factor Model
Mutual fund size quintile Difference
VARIABLES 1 (small) 2 3 4 5 (large)
1-5
Alpha 0.0292 -0.0219 -0.0676 -0.0758* -0.1099***
0.1391***
(0.69) (-0.46) (-1.44) (-1.69) (-2.93)
(5.21)
MKTRF 0.9302*** 0.9436*** 0.9568*** 0.9791*** 0.9857***
-0.0555***
(88.20) (80.46) (82.37) (88.11) (106.00)
(-8.39)
SMB 0.2100*** 0.2146*** 0.2085*** 0.1922*** 0.1392***
0.0708***
(15.31) (14.07) (13.80) (13.29) (11.51)
(8.23)
HML 0.1098*** 0.1187*** 0.0817*** 0.0569*** 0.0094
0.1004***
(7.56) (7.35) (5.11) (3.72) (0.74)
(11.02)
UMD 0.0044 0.0097 0.0189* 0.0260*** 0.0145*
-0.0101*
(0.50) (0.99) (1.94) (2.79) (1.86)
(-1.82)
Observations 309 309 309 309 309
309
R-squared 0.970 0.964 0.966 0.970 0.979 0.463
30
Table IV Transaction Costs, Fund Size, and Fund Performance: Cross-Sectional Regression Approach
The table reports the Fama-MacBeth (1973) estimation results of monthly fund returns regressed on fund TNA, fund transaction costs, and other control
variables. We first estimate cross-sectional regression each month and then report the time-series average of the monthly coefficients. We use the Abel Noser
sample from 1999m1 to 2011m9 in the analyses. Panel A reports the estimates based on Hidden Cost, and Panel B reports the results based on Execution
Shortfall. Both transaction cost measures are calculated using Abel Noser institutional trading data. The dependent variable is fund performance as measured by
net return, 4-factor alpha, and holding-based return. All independent variables are defined in Table I and lagged by one month. Statistical significance of 1%, 5%,
and 10% is indicated by ***, **, and * respectively. t-statistics are reported in parentheses.
Panel A. Hidden Cost Measure
Net Return 4-factor Alpha Holding Return
VARIABLES (1) (2) (3) (4) (5) (6) (7) (8) (9)
Log(TNA) -0.0656*** -0.0683*** -0.1156***
-0.0505*** -0.0534*** -0.1009**
-0.0755*** -0.0735*** -0.1049**
(-3.15) (-3.08) (-2.65)
(-2.77) (-2.74) (-2.48)
(-3.48) (-3.24) (-2.36)
Hidden Cost
-0.0599** -0.0486**
-0.0609** -0.0499**
-0.0531** -0.0357
(-2.52) (-2.30)
(-2.56) (-2.37)
(-2.17) (-1.56)
Expense Ratio
-0.1065
-0.1074
-0.0157
(-1.05)
(-1.06)
(-0.17)
Fund Turnover
-0.0010
-0.0010
-0.0013*
(-1.51)
(-1.49)
(-1.79)
Fund Flow
0.0080
0.0076
0.0061
(0.95)
(0.90)
(0.71)
Log(Fund Age)
0.0669*
0.0663*
0.0457
(1.70)
(1.68)
(1.06)
Log(Family TNA)
0.0351**
0.0347**
0.0269
(2.19)
(2.19)
(1.63)
Constant 0.6390 0.6959 0.6751
0.3556** 0.4146** 0.4008
0.7629* 0.7851* 0.7481
(1.50) (1.63) (1.45)
(2.33) (2.49) (1.15)
(1.69) (1.75) (1.61)
Observations 20,783 19,582 19,187
20,783 19,582 19,187
20,783 19,582 19,187
R-squared 0.014 0.033 0.118
0.010 0.029 0.115
0.014 0.031 0.114
Number of groups 139 139 139 139 139 139 139 139 139
31
Panel B. Execution Shortfall Measure
Net Return 4-factor Alpha Holding Return
VARIABLES (1) (2) (3) (4) (5) (6) (7) (8) (9)
Log(TNA) -0.0651*** -0.0777*** -0.1288***
-0.0498*** -0.0619*** -0.1132***
-0.0741*** -0.0822*** -0.1164**
(-3.04) (-3.15) (-2.83)
(-2.65) (-2.84) (-2.67)
(-3.28) (-3.27) (-2.46)
Execution Shortfall
-0.1377** -0.1119**
-0.1414** -0.1172**
-0.1491** -0.1235**
(-2.08) (-2.10)
(-2.14) (-2.19)
(-2.19) (-2.09)
Expense Ratio
-0.1191
-0.1196
-0.0386
(-1.17)
(-1.18)
(-0.39)
Fund Turnover
-0.0010
-0.0009
-0.0013*
(-1.46)
(-1.42)
(-1.75)
Fund Flow
0.0071
0.0067
0.0054
(0.83)
(0.79)
(0.61)
Log(Fund Age)
0.0968**
0.0972**
0.0662
(2.39)
(2.39)
(1.45)
Log(Family TNA)
0.0191
0.0182
0.0062
(1.19)
(1.14)
(0.36)
Constant 0.6223 0.7321* 0.8778*
0.3449** 0.4750** 0.6315
0.7381 0.8144* 1.0354**
(1.41) (1.69) (1.79)
(2.18) (2.58) (1.63)
(1.60) (1.80) (2.10)
Observations 19,005 17,745 17,387
19,005 17,745 17,387
19,005 17,745 17,387
R-squared 0.014 0.033 0.120
0.011 0.030 0.116
0.014 0.032 0.117
Number of groups 136 135 135 136 135 135 136 135 135
32
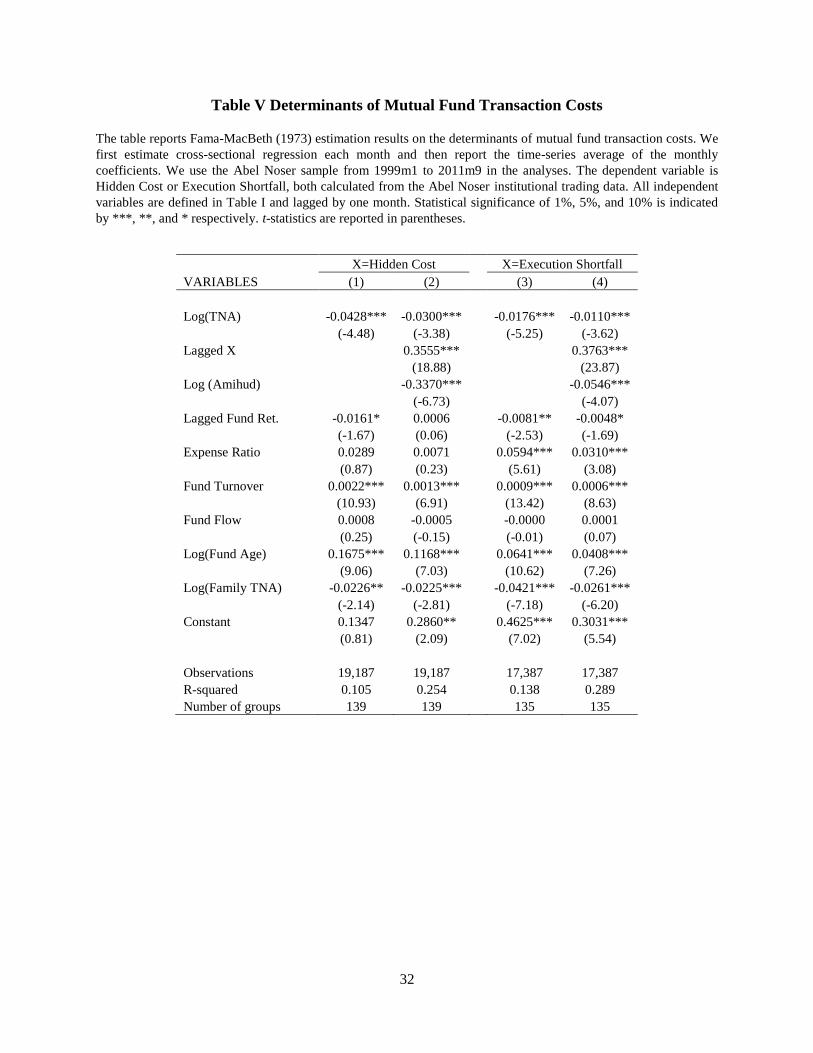
Table V Determinants of Mutual Fund Transaction Costs
The table reports Fama-MacBeth (1973) estimation results on the determinants of mutual fund transaction costs. We
first estimate cross-sectional regression each month and then report the time-series average of the monthly
coefficients. We use the Abel Noser sample from 1999m1 to 2011m9 in the analyses. The dependent variable is
Hidden Cost or Execution Shortfall, both calculated from the Abel Noser institutional trading data. All independent
variables are defined in Table I and lagged by one month. Statistical significance of 1%, 5%, and 10% is indicated
by ***, **, and * respectively. t-statistics are reported in parentheses.
X=Hidden Cost X=Execution Shortfall
VARIABLES (1) (2) (3) (4)
Log(TNA) -0.0428*** -0.0300***
-0.0176*** -0.0110***
(-4.48) (-3.38)
(-5.25) (-3.62)
Lagged X
0.3555***
0.3763***
(18.88)
(23.87)
Log (Amihud)
-0.3370***
-0.0546***
(-6.73)
(-4.07)
Lagged Fund Ret. -0.0161* 0.0006
-0.0081** -0.0048*
(-1.67) (0.06)
(-2.53) (-1.69)
Expense Ratio 0.0289 0.0071
0.0594*** 0.0310***
(0.87) (0.23)
(5.61) (3.08)
Fund Turnover 0.0022*** 0.0013***
0.0009*** 0.0006***
(10.93) (6.91)
(13.42) (8.63)
Fund Flow 0.0008 -0.0005
-0.0000 0.0001
(0.25) (-0.15)
(-0.01) (0.07)
Log(Fund Age) 0.1675*** 0.1168***
0.0641*** 0.0408***
(9.06) (7.03)
(10.62) (7.26)
Log(Family TNA) -0.0226** -0.0225***
-0.0421*** -0.0261***
(-2.14) (-2.81)
(-7.18) (-6.20)
Constant 0.1347 0.2860**
0.4625*** 0.3031***
(0.81) (2.09)
(7.02) (5.54)
Observations 19,187 19,187
17,387 17,387
R-squared 0.105 0.254
0.138 0.289
Number of groups 139 139 135 135
33
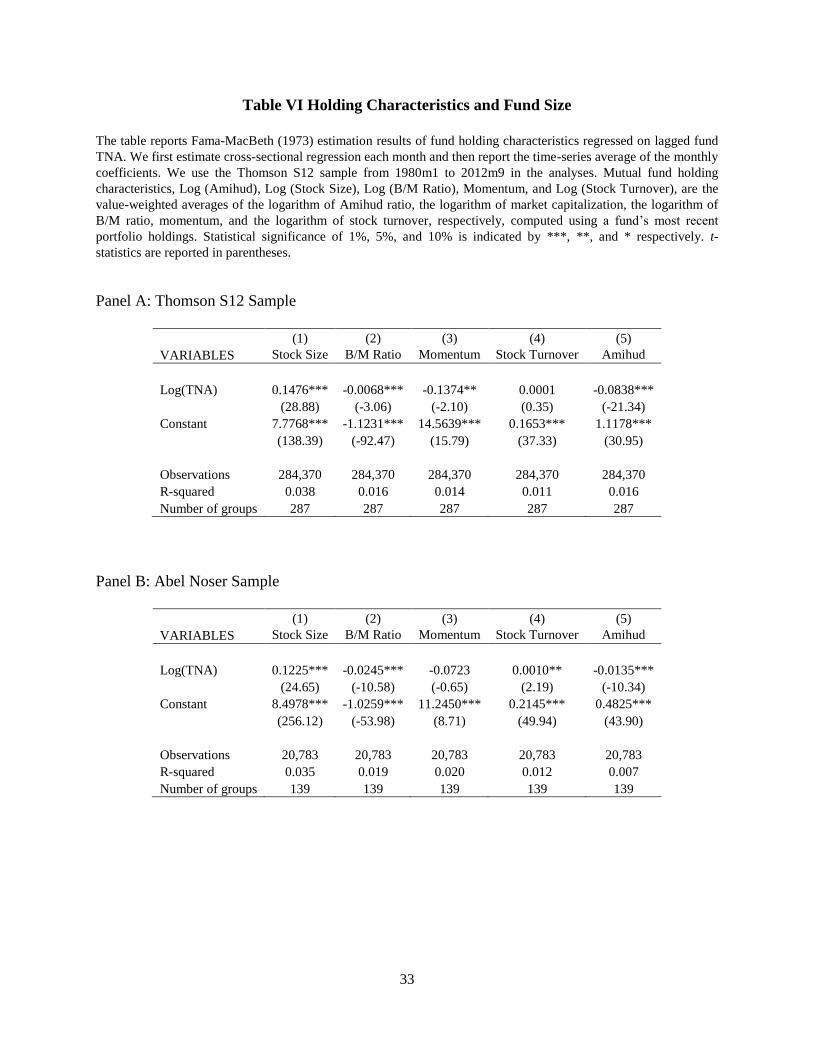
Table VI Holding Characteristics and Fund Size
The table reports Fama-MacBeth (1973) estimation results of fund holding characteristics regressed on lagged fund
TNA. We first estimate cross-sectional regression each month and then report the time-series average of the monthly
coefficients. We use the Thomson S12 sample from 1980m1 to 2012m9 in the analyses. Mutual fund holding
characteristics, Log (Amihud), Log (Stock Size), Log (B/M Ratio), Momentum, and Log (Stock Turnover), are the
value-weighted averages of the logarithm of Amihud ratio, the logarithm of market capitalization, the logarithm of
B/M ratio, momentum, and the logarithm of stock turnover, respectively, computed using a fund’s most recent
portfolio holdings. Statistical significance of 1%, 5%, and 10% is indicated by ***, **, and * respectively. t-
statistics are reported in parentheses.
Panel A: Thomson S12 Sample
(1) (2) (3) (4) (5)
VARIABLES Stock Size B/M Ratio Momentum Stock Turnover Amihud
Log(TNA) 0.1476*** -0.0068*** -0.1374** 0.0001 -0.0838***
(28.88) (-3.06) (-2.10) (0.35) (-21.34)
Constant 7.7768*** -1.1231*** 14.5639*** 0.1653*** 1.1178***
(138.39) (-92.47) (15.79) (37.33) (30.95)
Observations 284,370 284,370 284,370 284,370 284,370
R-squared 0.038 0.016 0.014 0.011 0.016
Number of groups 287 287 287 287 287
Panel B: Abel Noser Sample
(1) (2) (3) (4) (5)
VARIABLES Stock Size B/M Ratio Momentum Stock Turnover Amihud
Log(TNA) 0.1225*** -0.0245*** -0.0723 0.0010** -0.0135***
(24.65) (-10.58) (-0.65) (2.19) (-10.34)
Constant 8.4978*** -1.0259*** 11.2450*** 0.2145*** 0.4825***
(256.12) (-53.98) (8.71) (49.94) (43.90)
Observations 20,783 20,783 20,783 20,783 20,783
R-squared 0.035 0.019 0.020 0.012 0.007
Number of groups 139 139 139 139 139
34
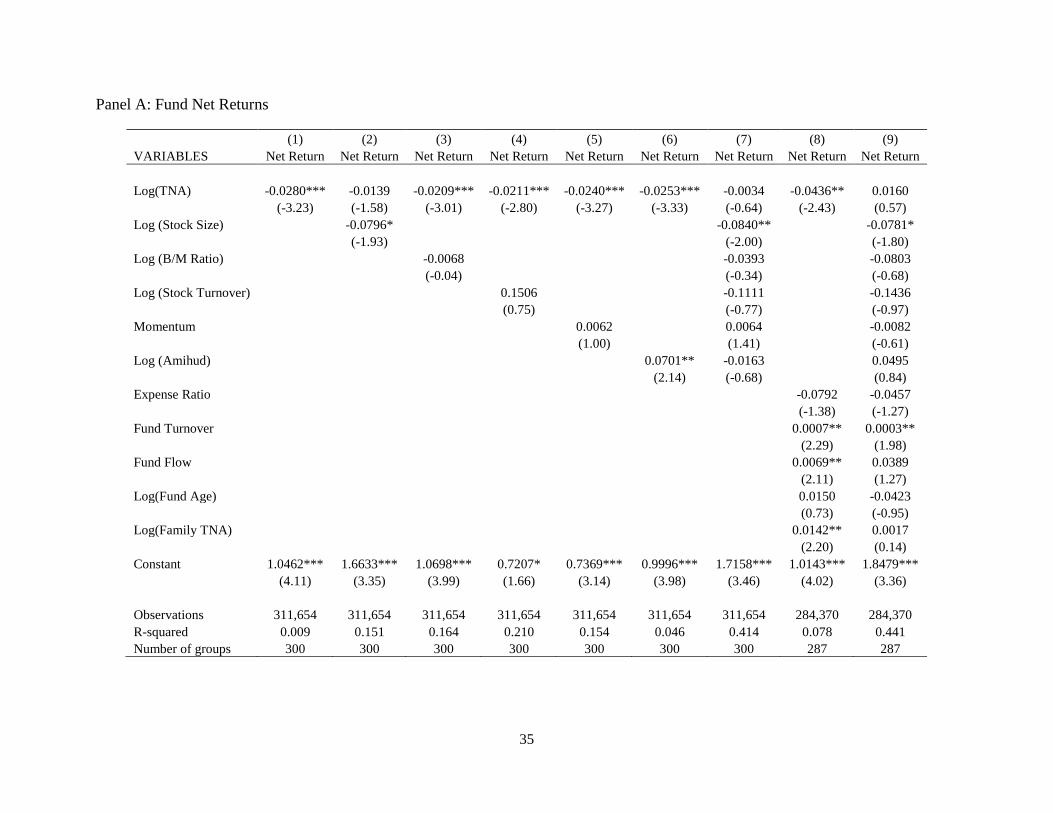
Table VII Holding Characteristics, Fund Size, and Fund Performance: Cross-Sectional Regression Approach
The table reports Fama-MacBeth (1973) estimation results of monthly fund returns regressed on fund TNA, holding characteristics, and other control variables.
We first estimate cross-sectional regression each month and then report the time-series average of the monthly coefficients. We use the Thomson S12 sample
from 1980m1 to 2012m9 in the analyses. The dependent variable is fund performance as measured by fund net return (Panel A), 4-factor alpha (Panel B), and
holding-based return (Panel C). Mutual fund holding characteristics, Log (Amihud), Log (Stock Size), Log (B/M Ratio), Momentum, and Log (Stock Turnover),
are the value-weighted averages of the logarithm of Amihud ratio, the logarithm of market capitalization, the logarithm of B/M ratio, momentum, and the
logarithm of stock turnover, respectively, computed using a fund’s most recent portfolio holdings. All independent variables are lagged by one month. Other
variables are defined in Table I. Statistical significance of 1%, 5%, and 10% is indicated by ***, **, and * respectively. t-statistics are reported in parentheses.
35
Panel A: Fund Net Returns
(1) (2) (3) (4) (5) (6) (7) (8) (9)
VARIABLES Net Return Net Return Net Return Net Return Net Return Net Return Net Return Net Return Net Return
Log(TNA) -0.0280*** -0.0139 -0.0209*** -0.0211*** -0.0240*** -0.0253*** -0.0034 -0.0436** 0.0160
(-3.23) (-1.58) (-3.01) (-2.80) (-3.27) (-3.33) (-0.64) (-2.43) (0.57)
Log (Stock Size)
-0.0796*
-0.0840**
-0.0781*
(-1.93)
(-2.00)
(-1.80)
Log (B/M Ratio)
-0.0068
-0.0393
-0.0803
(-0.04)
(-0.34)
(-0.68)
Log (Stock Turnover)
0.1506
-0.1111
-0.1436
(0.75)
(-0.77)
(-0.97)
Momentum
0.0062
0.0064
-0.0082
(1.00)
(1.41)
(-0.61)
Log (Amihud)
0.0701** -0.0163
0.0495
(2.14) (-0.68)
(0.84)
Expense Ratio
-0.0792 -0.0457
(-1.38) (-1.27)
Fund Turnover
0.0007** 0.0003**
(2.29) (1.98)
Fund Flow
0.0069** 0.0389
(2.11) (1.27)
Log(Fund Age)
0.0150 -0.0423
(0.73) (-0.95)
Log(Family TNA)
0.0142** 0.0017
(2.20) (0.14)
Constant 1.0462*** 1.6633*** 1.0698*** 0.7207* 0.7369*** 0.9996*** 1.7158*** 1.0143*** 1.8479***
(4.11) (3.35) (3.99) (1.66) (3.14) (3.98) (3.46) (4.02) (3.36)
Observations 311,654 311,654 311,654 311,654 311,654 311,654 311,654 284,370 284,370
R-squared 0.009 0.151 0.164 0.210 0.154 0.046 0.414 0.078 0.441
Number of groups 300 300 300 300 300 300 300 287 287
36
Panel B: Carhart 4-Factor Alpha
(1) (2) (3) (4) (5) (6) (7) (8) (9)
VARIABLES
4-factor
Alpha
4-factor
Alpha
4-factor
Alpha
4-factor
Alpha
4-factor
Alpha
4-factor
Alpha
4-factor
Alpha
4-factor
Alpha
4-factor
Alpha
Log(TNA) -0.0264*** -0.0124 -0.0193** -0.0194*** -0.0224*** -0.0237*** -0.0019 -0.0434*** 0.0162
(-3.71) (-1.55) (-2.57) (-2.94) (-3.65) (-3.48) (-0.28) (-2.70) (0.57)
Log (Stock Size)
-0.0788*
-0.0834**
-0.0772*
(-1.92)
(-1.99)
(-1.79)
Log (B/M Ratio)
-0.0066
-0.0386
-0.0785
(-0.04)
(-0.34)
(-0.66)
Log (Stock Turnover)
0.1502
-0.1105
-0.1412
(0.75)
(-0.77)
(-0.95)
Momentum
0.0061
0.0064
-0.0084
(0.99)
(1.40)
(-0.61)
Log (Amihud)
0.0696** -0.0164
0.0509
(2.13) (-0.69)
(0.86)
Expense Ratio
-0.0801 -0.0459
(-1.40) (-1.27)
Fund Turnover
0.0007** 0.0003*
(2.29) (1.94)
Fund Flow
0.0069** 0.0393
(2.06) (1.27)
Log(Fund Age)
0.0144 -0.0432
(0.71) (-0.96)
Log(Family TNA)
0.0137** 0.0011
(2.12) (0.09)
Constant 0.0941 0.7062** 0.1176 -0.2306 -0.2145* 0.0482 0.7591 0.0748 0.8975
(1.52) (2.02) (0.63) (-0.44) (-1.80) (0.77) (1.43) (0.60) (1.53)
Observations 311,654 311,654 311,654 311,654 311,654 311,654 311,654 284,370 284,370
R-squared 0.008 0.150 0.163 0.209 0.153 0.045 0.413 0.077 0.439
Number of groups 300 300 300 300 300 300 300 287 287
37
Panel C: Holding-based Returns
(1) (2) (3) (4) (5) (6) (7) (8) (9)
VARIABLES
Holding
Return
Holding
Return
Holding
Return
Holding
Return
Holding
Return
Holding
Return
Holding
Return
Holding
Return
Holding
Return
Log(TNA) -0.0233** -0.0116 -0.0157** -0.0161** -0.0186** -0.0215*** 0.0006 -0.0262 0.0274
(-2.56) (-1.29) (-2.09) (-2.04) (-2.32) (-2.73) (0.10) (-1.34) (1.31)
Log (Stock Size)
-0.0664
-0.0611
-0.0524
(-1.46)
(-1.35)
(-1.13)
Log (B/M Ratio)
0.0187
-0.0135
-0.0432
(0.12)
(-0.11)
(-0.35)
Log (Stock Turnover)
0.1275
-0.0935
-0.1319
(0.59)
(-0.58)
(-0.80)
Momentum
0.0055
0.0057
-0.0035
(0.82)
(1.08)
(-0.35)
Log (Amihud)
0.0609* -0.0170
0.0231
(1.70) (-0.59)
(0.48)
Expense Ratio
-0.0117 0.0223
(-0.18) (0.68)
Fund Turnover
0.0007** 0.0004**
(2.19) (2.45)
Fund Flow
0.0052 0.0267
(1.30) (1.30)
Log(Fund Age)
0.0216 -0.0273
(0.97) (-0.85)
Log(Family TNA)
-0.0029 -0.0126
(-0.39) (-1.34)
Constant 1.1308*** 1.6624*** 1.1821*** 0.8468* 0.8254*** 1.0951*** 1.5993*** 1.0795*** 1.6760***
(4.20) (3.10) (4.10) (1.81) (3.29) (4.12) (2.89) (4.14) (2.84)
Observations 311,654 311,654 311,654 311,654 311,654 311,654 311,654 284,370 284,370
R-squared 0.008 0.157 0.163 0.212 0.156 0.047 0.429 0.078 0.450
Number of groups 300 300 300 300 300 300 300 287 287
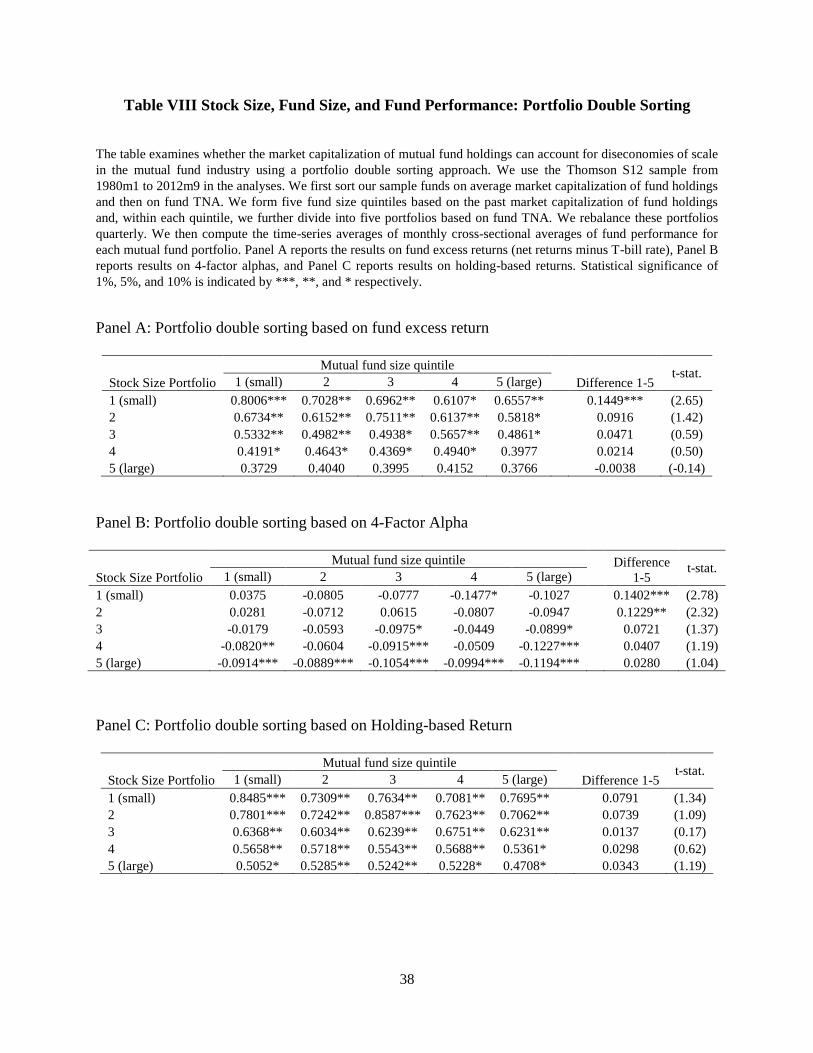
38
Table VIII Stock Size, Fund Size, and Fund Performance: Portfolio Double Sorting
The table examines whether the market capitalization of mutual fund holdings can account for diseconomies of scale
in the mutual fund industry using a portfolio double sorting approach. We use the Thomson S12 sample from
1980m1 to 2012m9 in the analyses. We first sort our sample funds on average market capitalization of fund holdings
and then on fund TNA. We form five fund size quintiles based on the past market capitalization of fund holdings
and, within each quintile, we further divide into five portfolios based on fund TNA. We rebalance these portfolios
quarterly. We then compute the time-series averages of monthly cross-sectional averages of fund performance for
each mutual fund portfolio. Panel A reports the results on fund excess returns (net returns minus T-bill rate), Panel B
reports results on 4-factor alphas, and Panel C reports results on holding-based returns. Statistical significance of
1%, 5%, and 10% is indicated by ***, **, and * respectively.
Panel A: Portfolio double sorting based on fund excess return
Mutual fund size quintile
Difference 1-5 t-stat.
Stock Size Portfolio 1 (small) 2 3 4 5 (large)
1 (small) 0.8006*** 0.7028** 0.6962** 0.6107* 0.6557**
0.1449*** (2.65)
2 0.6734** 0.6152** 0.7511** 0.6137** 0.5818*
0.0916 (1.42)
3 0.5332** 0.4982** 0.4938* 0.5657** 0.4861*
0.0471 (0.59)
4 0.4191* 0.4643* 0.4369* 0.4940* 0.3977
0.0214 (0.50)
5 (large) 0.3729 0.4040 0.3995 0.4152 0.3766 -0.0038 (-0.14)
Panel B: Portfolio double sorting based on 4-Factor Alpha
Mutual fund size quintile Difference
1-5 t-stat.
Stock Size Portfolio 1 (small) 2 3 4 5 (large)
1 (small) 0.0375 -0.0805 -0.0777 -0.1477* -0.1027
0.1402*** (2.78)
2 0.0281 -0.0712 0.0615 -0.0807 -0.0947
0.1229** (2.32)
3 -0.0179 -0.0593 -0.0975* -0.0449 -0.0899*
0.0721 (1.37)
4 -0.0820** -0.0604 -0.0915*** -0.0509 -0.1227***
0.0407 (1.19)
5 (large) -0.0914*** -0.0889*** -0.1054*** -0.0994*** -0.1194*** 0.0280 (1.04)
Panel C: Portfolio double sorting based on Holding-based Return
Mutual fund size quintile
Difference 1-5 t-stat.
Stock Size Portfolio 1 (small) 2 3 4 5 (large)
1 (small) 0.8485*** 0.7309** 0.7634** 0.7081** 0.7695**
0.0791 (1.34)
2 0.7801*** 0.7242** 0.8587*** 0.7623** 0.7062**
0.0739 (1.09)
3 0.6368** 0.6034** 0.6239** 0.6751** 0.6231**
0.0137 (0.17)
4 0.5658** 0.5718** 0.5543** 0.5688** 0.5361*
0.0298 (0.62)
5 (large) 0.5052* 0.5285** 0.5242** 0.5228* 0.4708* 0.0343 (1.19)
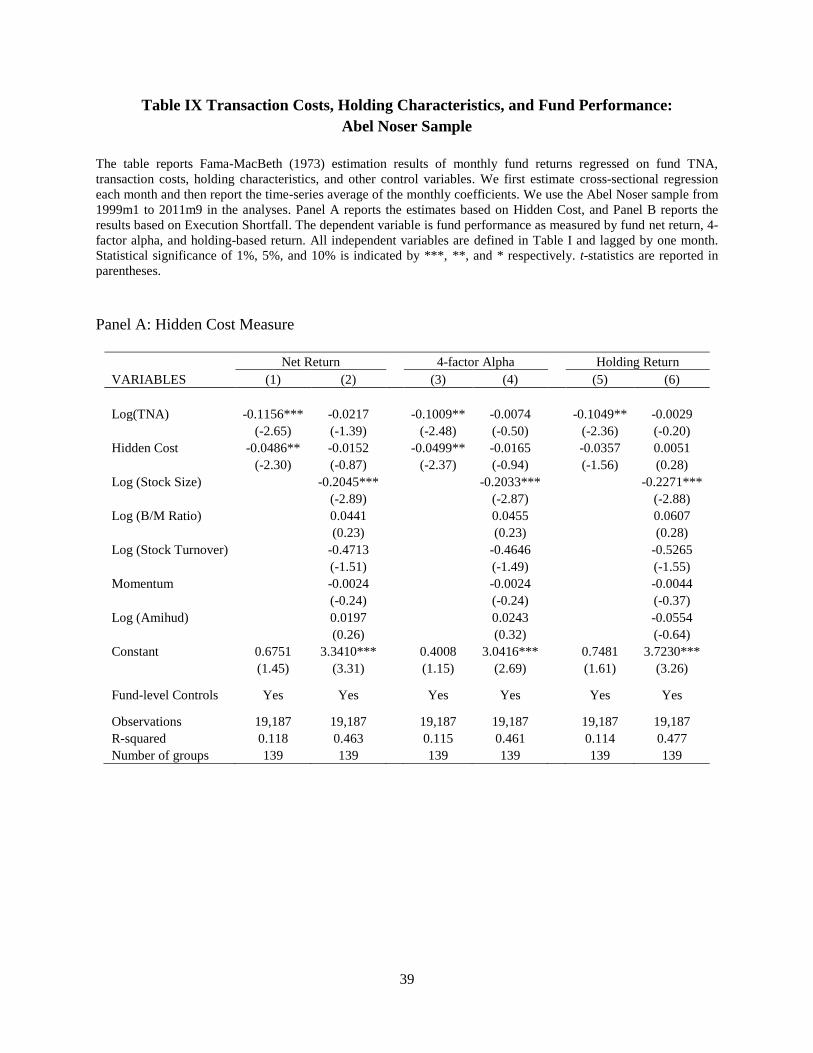
39
Table IX Transaction Costs, Holding Characteristics, and Fund Performance:
Abel Noser Sample
The table reports Fama-MacBeth (1973) estimation results of monthly fund returns regressed on fund TNA,
transaction costs, holding characteristics, and other control variables. We first estimate cross-sectional regression
each month and then report the time-series average of the monthly coefficients. We use the Abel Noser sample from
1999m1 to 2011m9 in the analyses. Panel A reports the estimates based on Hidden Cost, and Panel B reports the
results based on Execution Shortfall. The dependent variable is fund performance as measured by fund net return, 4-
factor alpha, and holding-based return. All independent variables are defined in Table I and lagged by one month.
Statistical significance of 1%, 5%, and 10% is indicated by ***, **, and * respectively. t-statistics are reported in
parentheses.
Panel A: Hidden Cost Measure
Net Return 4-factor Alpha Holding Return
VARIABLES (1) (2) (3) (4) (5) (6)
Log(TNA) -0.1156*** -0.0217
-0.1009** -0.0074
-0.1049** -0.0029
(-2.65) (-1.39)
(-2.48) (-0.50)
(-2.36) (-0.20)
Hidden Cost -0.0486** -0.0152
-0.0499** -0.0165
-0.0357 0.0051
(-2.30) (-0.87)
(-2.37) (-0.94)
(-1.56) (0.28)
Log (Stock Size)
-0.2045***
-0.2033***
-0.2271***
(-2.89)
(-2.87)
(-2.88)
Log (B/M Ratio)
0.0441
0.0455
0.0607
(0.23)
(0.23)
(0.28)
Log (Stock Turnover)
-0.4713
-0.4646
-0.5265
(-1.51)
(-1.49)
(-1.55)
Momentum
-0.0024
-0.0024
-0.0044
(-0.24)
(-0.24)
(-0.37)
Log (Amihud)
0.0197
0.0243
-0.0554
(0.26)
(0.32)
(-0.64)
Constant 0.6751 3.3410***
0.4008 3.0416***
0.7481 3.7230***
(1.45) (3.31)
(1.15) (2.69)
(1.61) (3.26)
Fund-level Controls Yes Yes
Yes Yes
Yes Yes
Observations 19,187 19,187
19,187 19,187
19,187 19,187
R-squared 0.118 0.463
0.115 0.461
0.114 0.477
Number of groups 139 139 139 139 139 139
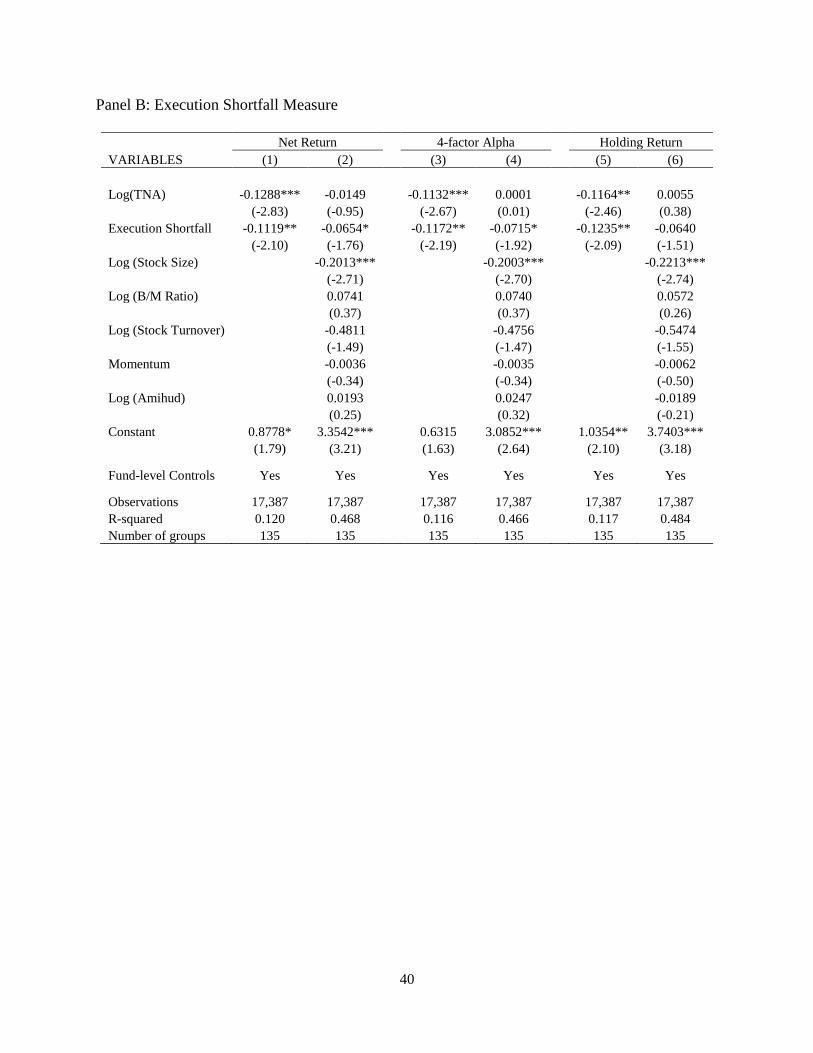
40
Panel B: Execution Shortfall Measure
Net Return 4-factor Alpha Holding Return
VARIABLES (1) (2) (3) (4) (5) (6)
Log(TNA) -0.1288*** -0.0149
-0.1132*** 0.0001
-0.1164** 0.0055
(-2.83) (-0.95)
(-2.67) (0.01)
(-2.46) (0.38)
Execution Shortfall -0.1119** -0.0654*
-0.1172** -0.0715*
-0.1235** -0.0640
(-2.10) (-1.76)
(-2.19) (-1.92)
(-2.09) (-1.51)
Log (Stock Size)
-0.2013***
-0.2003***
-0.2213***
(-2.71)
(-2.70)
(-2.74)
Log (B/M Ratio)
0.0741
0.0740
0.0572
(0.37)
(0.37)
(0.26)
Log (Stock Turnover)
-0.4811
-0.4756
-0.5474
(-1.49)
(-1.47)
(-1.55)
Momentum
-0.0036
-0.0035
-0.0062
(-0.34)
(-0.34)
(-0.50)
Log (Amihud)
0.0193
0.0247
-0.0189
(0.25)
(0.32)
(-0.21)
Constant 0.8778* 3.3542***
0.6315 3.0852***
1.0354** 3.7403***
(1.79) (3.21)
(1.63) (2.64)
(2.10) (3.18)
Fund-level Controls Yes Yes
Yes Yes
Yes Yes
Observations 17,387 17,387
17,387 17,387
17,387 17,387
R-squared 0.120 0.468
0.116 0.466
0.117 0.484
Number of groups 135 135 135 135 135 135