Embed Size (px)
Citation preview
Department of Computing Science and Mathematics
University of Stirling
How do People want to Control their Home?
Claire Maternaghan
Technical Report CSM-185
ISSN 1460-9673
April 2011

Department of Computing Science and MathematicsUniversity of Stirling
How do People want to Control their Home?
Claire Maternaghan
Department of Computing Science and Mathematics
University of Stirling
Stirling FK9 4LA, Scotland
Telephone +44 1786 467 421, Facsimile +44 1786 464 551
Email cma@cs..
Technical Report CSM-185
ISSN 1460-9673
April 2011
Abstract
There are a large number of home automation companies which o�er consumers tailored solutions tomeet their needs. At installation time users are asked how they would like their home to behave so asthe companies engineers can program the solution for their client. Once programmed, the users mustcontact the company and, in many cases, pay for these rules to be altered in any way. This is mostly dueto the rigid design of the software architecture used by these companies. In most cases the user is veryunlikely to know how they would like their home to behave until they have lived with the technology forsome time. Even then, their requirements may change on a daily basis.
The author proposes that consumers need home systems that they are able to program, and re-program, easily. In order to gain a deeper understanding of how people could see themselves usingsuch a control mechanism of their home an online survey was carried out. There were 150 participantsranging in age, gender, sex, technical ability and experience. This report describes the survey and usergroup, and then explores the data received from the survey: evaluating the author's eight hypothesesand describing any trends on the qualitative data gathered.
Acknowledgments
Claire Maternaghan is supported by the Scottish Informatics and Computer Science Alliance, the Uni-versity of Stirling, and the MATCH project (Scottish Funding Council, grant HR04016). The author isgrateful to her colleagues on the MATCH project and Kate Howie for their advice and support. Thanksalso goes to all those who participated in the survey.
1
1 Introduction
Home automation is a concept that has been dreamed about for decades. Walt Disney's original plansfor his Experimental Prototype Community of Tomorrow (EPCOT) outlined a utopian laboratory fordomestic technology, where families would live, work, and play in an integrated environment [10]. Disney,like many of his contemporaries, imagined homes that would attend to their inhabitants' every need.He regarded the home as a site of unending technological progress. The understanding of the Americanhome was altered thanks to the �xation on `space age' technology and its promise of domestic bliss. Asthe decades roll by, slowly but surely home automation is creeping into the developed world's homes.
The �rst home automation products appeared on the market in the late 1970s [8] yet home automationhas barely left the ground. Helen Heneveld, a leading home automation industry consultant [11], describestwo main markets for home automation solutions: the mass market and the �ultra-high-end� market.Many of today's products and solutions fall into the high-end category, giving the illusion that all homeautomation must be expensive and rare. Unfortunately, to a large extent, this is true. For the averagehome occupant to install a home system of any nature they either need to have a technical backgroundand understanding of the technology they are installing or have to rely on specialised companies to installthe system for them. For the most part the latter is the only option, keeping prices high and consumersreliant.
Ideally consumers should be able to go to their local hardware store, buy some home hardware (e.g.some X10 modules for controlling mains devices, a door lock for remotely locking the front door or aburglar alarm which supports SMS, email reporting and remote control) and install it into their currenthome system independently and with ease. From there, they should also be able to integrate this newhardware, and the services it o�ers, into the existing rule set for the home. For example, say the ownerwanted to turn o� the lights when they lock the front door. They later add a burglar alarm system totheir home (and to the home system) and would like to amend their original rule to now turn o� thelights and turn on the burglar alarm when they lock the front door. At the moment, this is not possiblewith existing home automation systems on the market.
As part of the author's research into developing a home system, further understanding was required ofhow users would imagine themselves interacting and controlling such a system. A survey was designed tohelp with this understanding. There have been a few surveys into how users (including families, couples,parents and the older generations) live within their home and how, or if, technology could be used toenhance it, including: [1, 2, 3, 4, 5, 6, 9, 15, 17, 20]. Also how these groups of people react to variousacademic projects, including: aCAPpella [7], Accord [16], CAMP [18, 19], Papier-Mâché [13] and others[12, 21]. However, to the author's best knowledge there has not yet been a survey carried out asking theuser for basic information about controlling their homes and the locations and technologies associatedwith that. Therefore not only is this survey necessary, it is also extremely valuable.
Section 2 describes the survey and the respondents who took part are described in section 3. Section4 reviews the results of the survey, looking at both the quantitative and qualitative data, and using thequantitative data to evaluate various hypotheses. Finally the report concludes with a summary of the�ndings in section 5.
2 The Survey
The Google Form service was used to create the online survey, which is shown in Appendix A andavailable to view at [14].
2.1 Format
The survey was designed to take between 5 and 10 minutes to �ll in. This had the advantage ofencouraging more people to take part due to the small time commitment required, but meant that thequestions had to be condensed and kept to a minimum without jeopardising the quality and range ofinformation which was required.
2
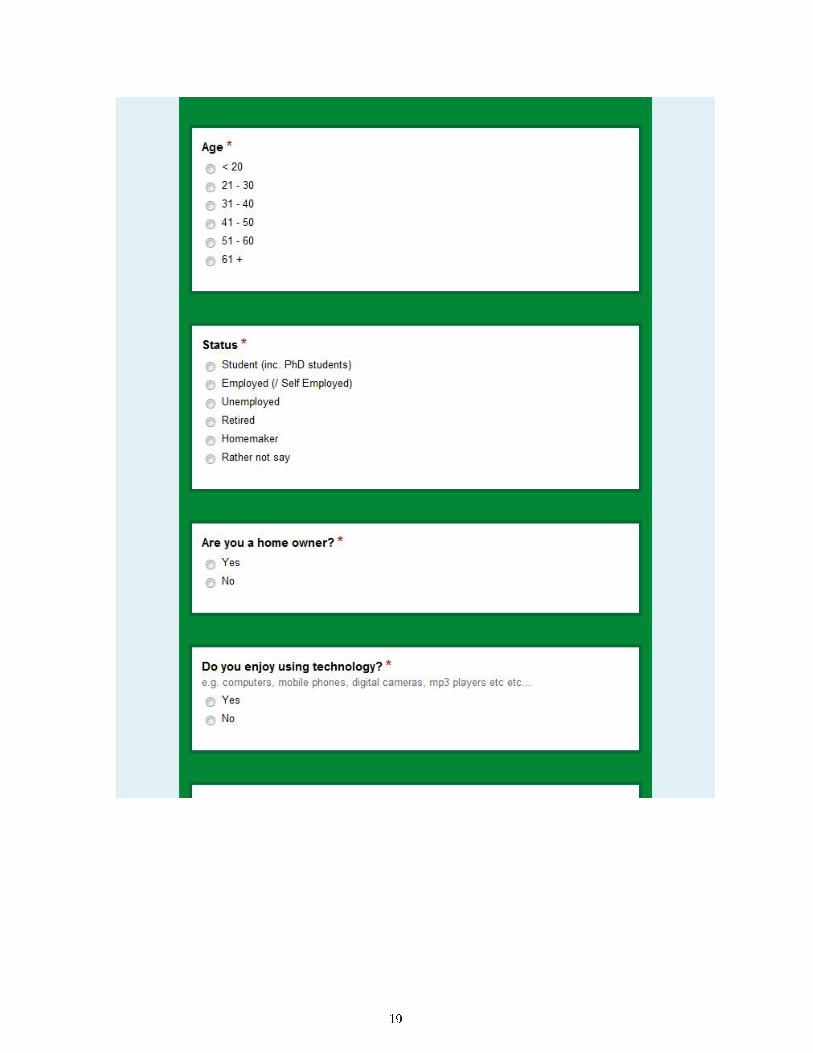
2.2 Demographic Questions
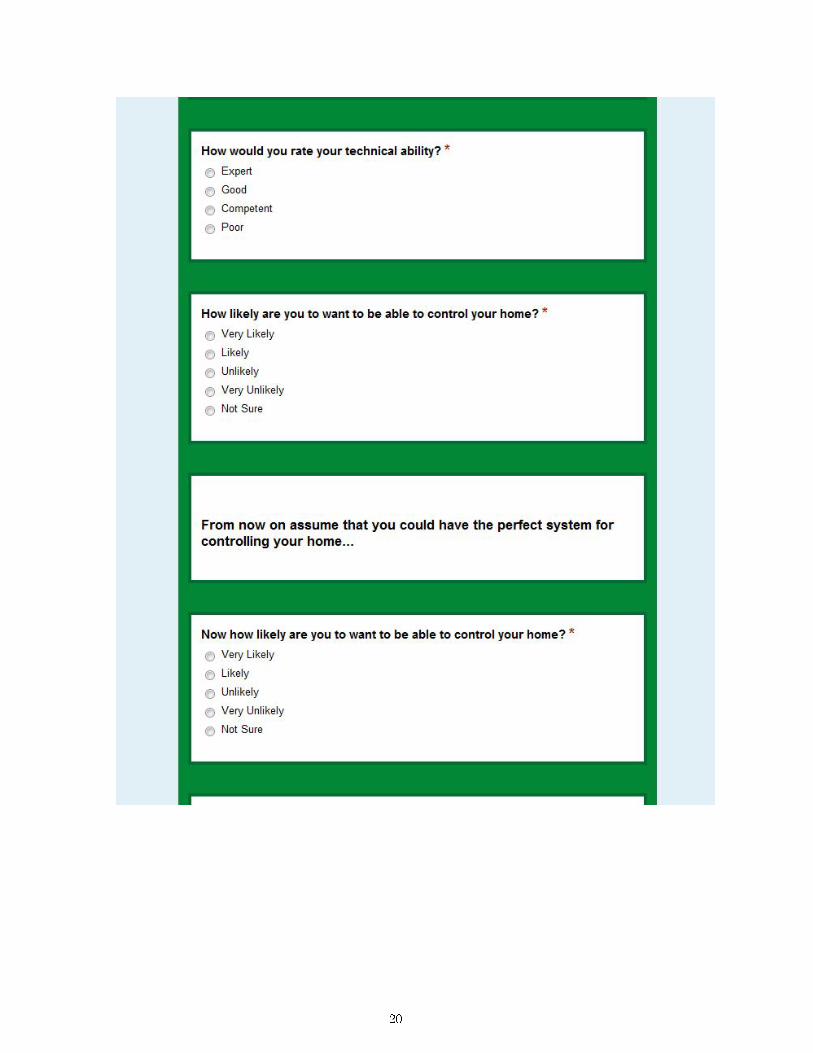
The �rst four questions were to obtain some basic demographic information about the respondent,including gender, age, status and home owner. This information both helped ensure that we wereobtaining data from a representative sample of the demographic and o�ered insight into trends based onthis information. Some additional information more speci�c to technology was also gathered to providethe author with a further understanding of the type of user. Due to the nature of the topic it wasimportant to ensure that results from a good mix of technical backgrounds were obtained.
2.3 Introductory Question
The introductory question asked �How likely are you to want to be able to control your home?�, withthe possible answers: `Very Likely', `Likely', `Unlikely', `Very Unlikely' and `Unsure' which are based onthe Likert scale.
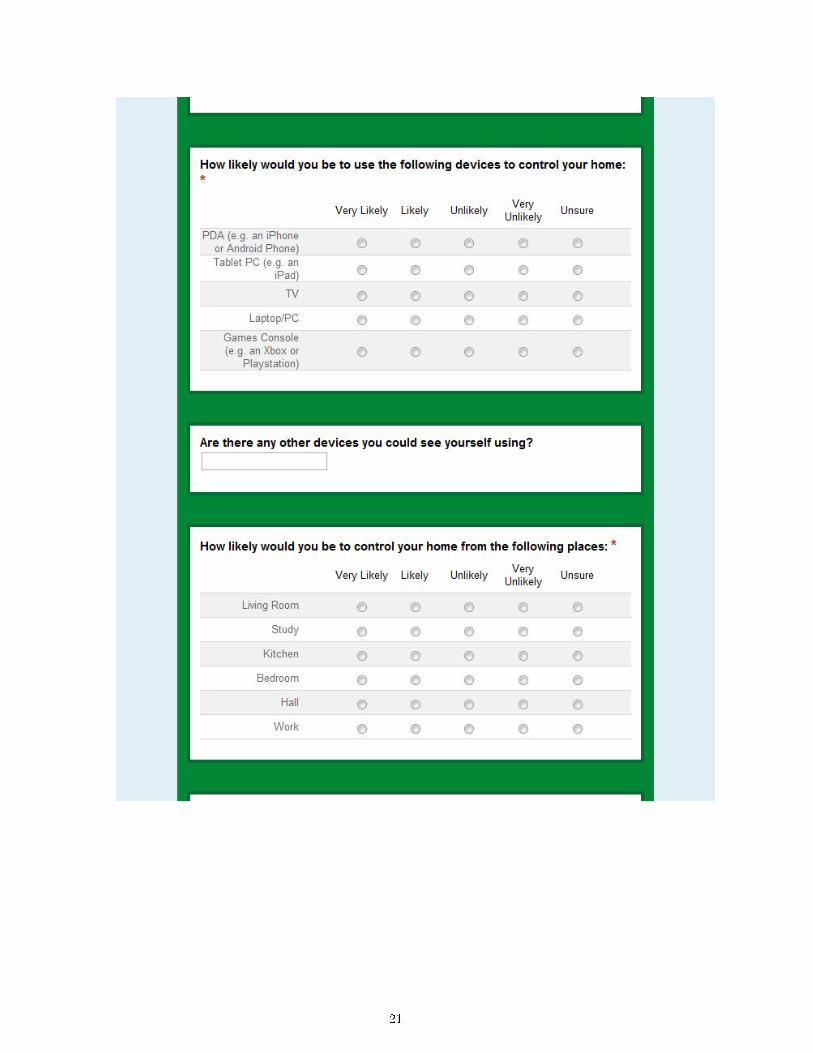
2.4 Core Questions
There were three main categories of core questions for the respondent:
• The preferred devices to control the home with.
• The preferred locations to control the home from.
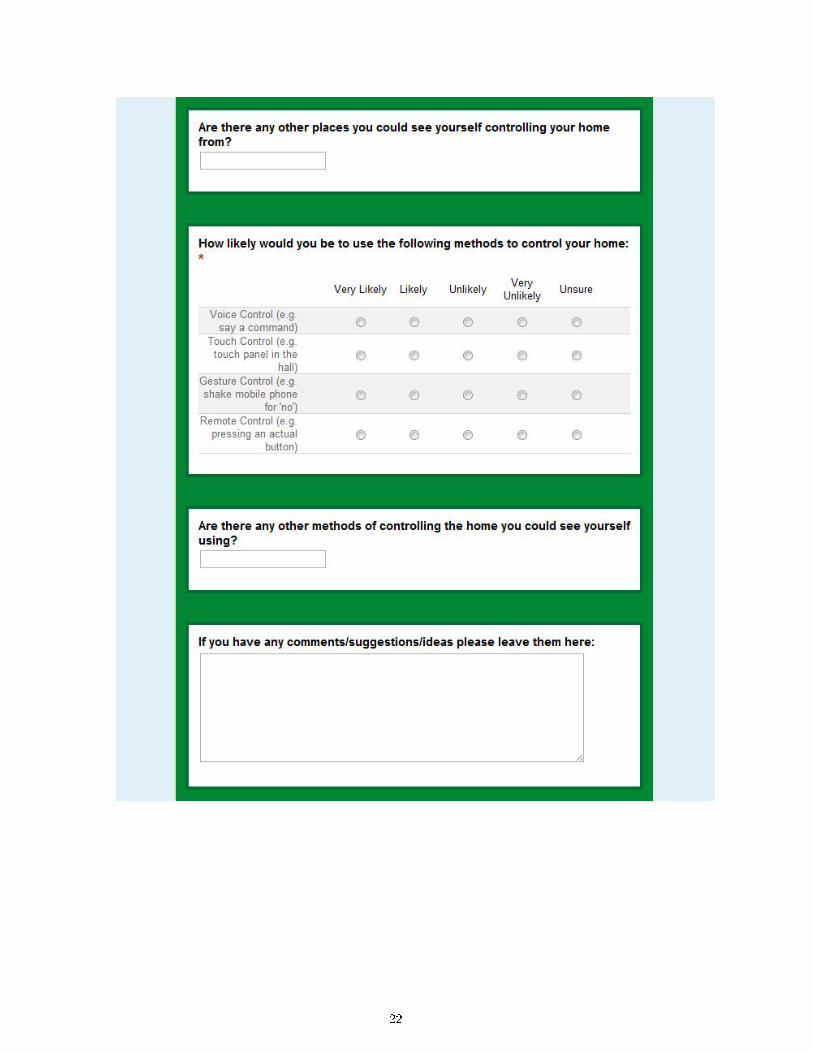
• The preferred methods to control the home with.
These questions all have the exact same format, where the question was asked then a few possibilitieswere o�ered. The user had to rate the likelihood of each possibility using the Likert scale. There wasalso a text box at the end of each question which allowed the user to list any other possibilities that werenot mentioned in the question.
Finally, to end the survey the user was given a large text box introduced with `If you have anycomments/suggestions/ideas please leave them here'.
2.5 Review
The survey was reviewed by experienced academics to ensure both the technical correctness of the surveyformat and style.
2.6 Pilot
A pilot was carried out with three respondents who varied in age, technical experience, and familiaritywith this �eld of research to con�rm that the survey was suitable for the wide range of respondents whichit was aimed at. The comments were all taken into account and some of the questions and technicalwords had to be reworded to remove any ambiguity in the questions.
When testing the survey out one of the respondents answered `Very Unlikely' when asked how likelythey would be to want to control their home, and justi�ed this by saying that they would not likethe hassle and stress of trying to choose, buy, install, manage and use such a system. They describedhow they fear that such a system would break or be unreliable and therefore not worth the hassle normoney involved in owning a home system. This was interesting as the user was applying their personalexperience and reservations about computers and technology to the notion of a potential home systemthat the survey is asking about. The author decided to add the following statement: �From now onassume that you could have the perfect system for controlling your home...� and then ask the questionagain: �Now how likely are you to want to be able to control your home?�, with the same �ve possibleanswers as before.
Before the survey was sent out the author wrote eight hypotheses which are described and proven(either true or false) in section 4.
3
3 The Respondents
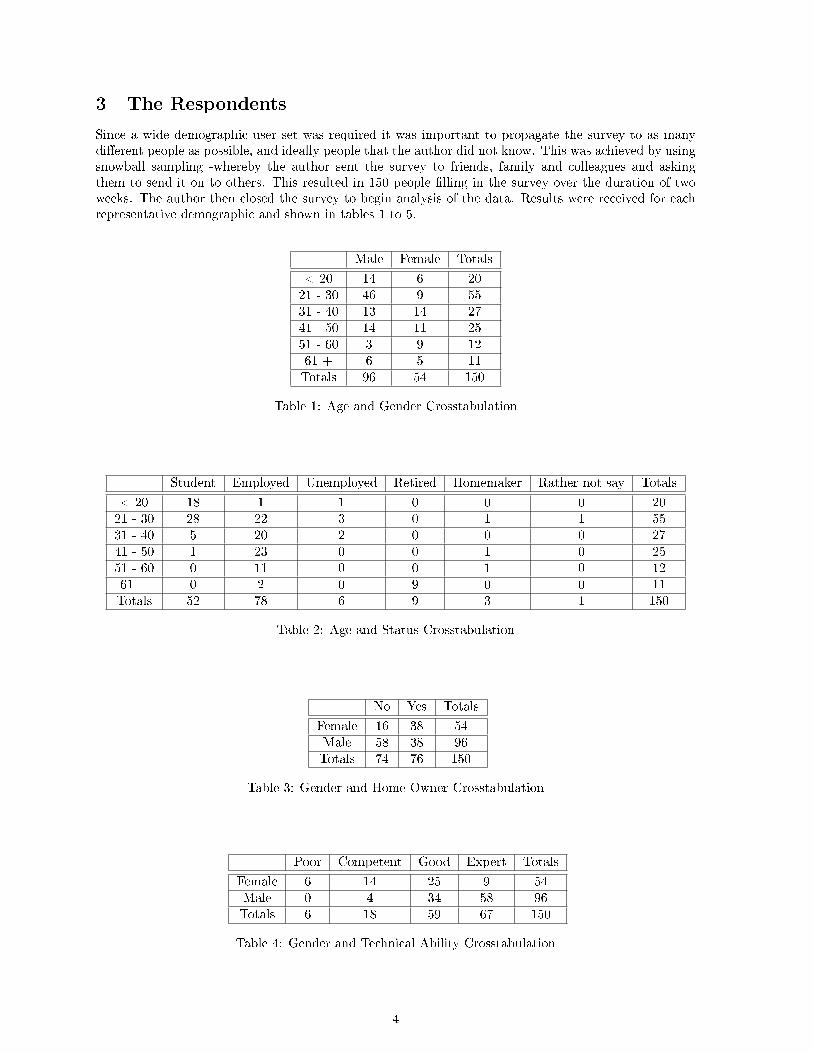
Since a wide demographic user set was required it was important to propagate the survey to as manydi�erent people as possible, and ideally people that the author did not know. This was achieved by usingsnowball sampling -whereby the author sent the survey to friends, family and colleagues and askingthem to send it on to others. This resulted in 150 people �lling in the survey over the duration of twoweeks. The author then closed the survey to begin analysis of the data. Results were received for eachrepresentative demographic and shown in tables 1 to 5.
Male Female Totals
< 20 14 6 2021 - 30 46 9 5531 - 40 13 14 2741 - 50 14 11 2551 - 60 3 9 1261 + 6 5 11Totals 96 54 150
Table 1: Age and Gender Crosstabulation
Student Employed Unemployed Retired Homemaker Rather not say Totals
< 20 18 1 1 0 0 0 2021 - 30 28 22 3 0 1 1 5531 - 40 5 20 2 0 0 0 2741 - 50 1 23 0 0 1 0 2551 - 60 0 11 0 0 1 0 1261 + 0 2 0 9 0 0 11Totals 52 78 6 9 3 1 150
Table 2: Age and Status Crosstabulation
No Yes Totals
Female 16 38 54Male 58 38 96Totals 74 76 150
Table 3: Gender and Home Owner Crosstabulation
Poor Competent Good Expert Totals
Female 6 14 25 9 54Male 0 4 34 58 96Totals 6 18 59 67 150
Table 4: Gender and Technical Ability Crosstabulation
4
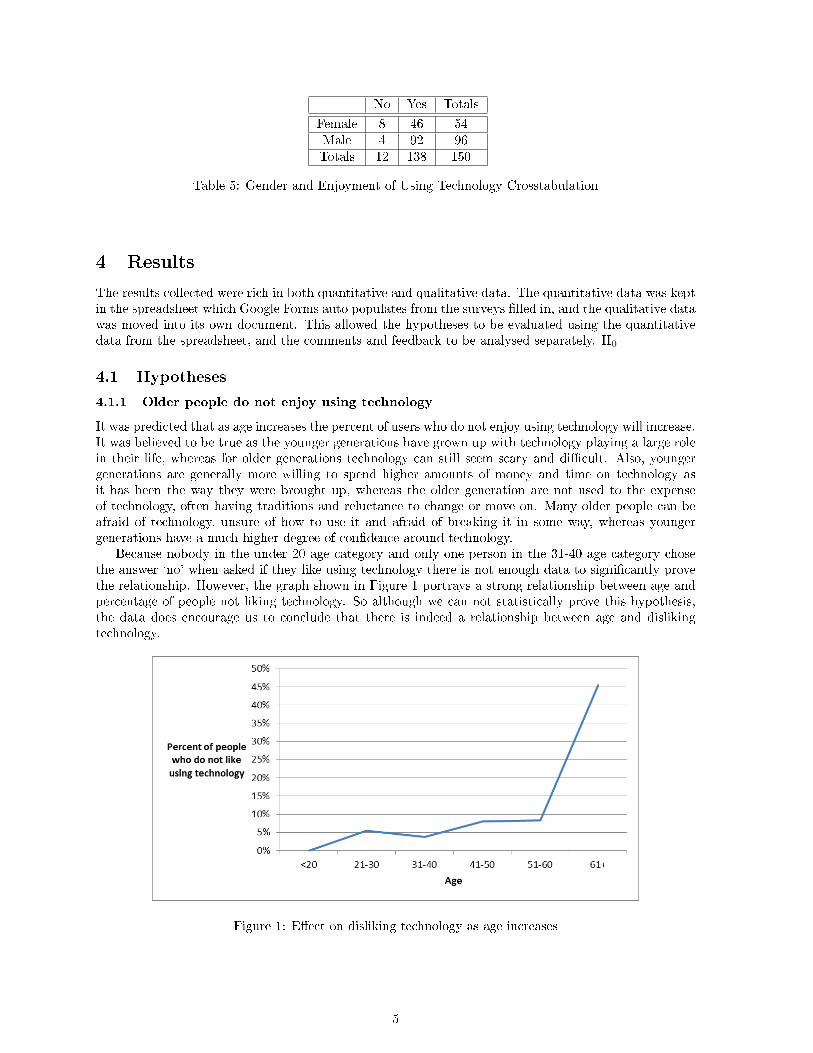
No Yes Totals
Female 8 46 54Male 4 92 96Totals 12 138 150
Table 5: Gender and Enjoyment of Using Technology Crosstabulation
4 Results
The results collected were rich in both quantitative and qualitative data. The quantitative data was keptin the spreadsheet which Google Forms auto populates from the surveys �lled in, and the qualitative datawas moved into its own document. This allowed the hypotheses to be evaluated using the quantitativedata from the spreadsheet, and the comments and feedback to be analysed separately. H0
4.1 Hypotheses
4.1.1 Older people do not enjoy using technology
It was predicted that as age increases the percent of users who do not enjoy using technology will increase.It was believed to be true as the younger generations have grown up with technology playing a large rolein their life, whereas for older generations technology can still seem scary and di�cult. Also, youngergenerations are generally more willing to spend higher amounts of money and time on technology asit has been the way they were brought up, whereas the older generation are not used to the expenseof technology, often having traditions and reluctance to change or move on. Many older people can beafraid of technology, unsure of how to use it and afraid of breaking it in some way, whereas youngergenerations have a much higher degree of con�dence around technology.
Because nobody in the under 20 age category and only one person in the 31-40 age category chosethe answer `no' when asked if they like using technology there is not enough data to signi�cantly provethe relationship. However, the graph shown in Figure 1 portrays a strong relationship between age andpercentage of people not liking technology. So although we can not statistically prove this hypothesis,the data does encourage us to conclude that there is indeed a relationship between age and dislikingtechnology.
Figure 1: E�ect on disliking technology as age increases
5
4.1.2 As age increases, technical ability decreases
Similar to hypothesis 4.1.1, and for similar reasons, the author believed that the average technical abilityof users will decrease as age increases.
H0: There is no relationship between age and technical ability.H1: There is a relationship between age and technical ability.A chi-squared test was used to calculate if there was signi�cant di�erence between under 40s and
over 40s when rating technical ability. P is less than 0.0005, therefore at a 1% level of signi�cance wecan reject H0 in favour of H1 to conclude that there is a relationship so that as age increases, technicalability decreases.
4.1.3 People would like to control their home if o�ered their `perfect' solution
The author believed that if users were o�ered �the perfect system for controlling their home� that thevast majority of them would be highly likely to want it.
80% of people answered `likely' or `very likely' when asked if they would like to control their home.This rose to 93.33% when they were o�ered the `perfect system' and asked the same question again.
H0: There is no relationship between the likelihood of wanting a home system before and after beingo�ered a `perfect system'.
H1: There is a relationship between the likelihood of wanting a home system before and after beingo�ered a `perfect system'.
A chi-squared test was carried out against the likelihood of wanting a home system before beingo�ered a `perfect system' and after. This resulted in a p value of 0.001, so at a 1% level of signi�cance wecan reject H0 in favour of H1, concluding that there is a relationship between the likelihood of wantinga home system and the likelihood of wanting a `perfect' home system. From the data we can see thatthis relationship is an increase in likelihood from a home system to a `perfect' home system.
4.1.4 People would prefer using their PDA, laptop/PC and tablet over their TV or gamesconsole
As a means of controlling their home the author believed that most people would much prefer to useeither a PDA, laptop, PC or tablet PC than their TV or games console.
H0: There is no relationship between the likelihood of wanting to control the home using either aPDA, laptop/PC or tablet more than through a TV or games console.
H1: There is a relationship between the likelihood of wanting to control the home using either a PDA,laptop/PC or tablet more than through a TV or games console.
Using a chi-square test, the p values between each relationship are:
TV Games Console
Laptop/PC < 0.001 < 0.001PDA < 0.001 < 0.001Tablet 0.362 < 0.001
Table 6: P-Values of likelihood between means of control
At a 1% signi�cance level we would not be able to reject H0in favour of H1, due to the large p-valuebetween TV and tablet. This would force the conclusion that there is no relationship between wantingto control the home using either a PDA, laptop/PC or tablet more than through a TV or games console.However, if we remove the tablet from the hypothesis to result in:
H0: There is no relationship between the likeliness of wanting to control the home using either a PDor laptop/PC more than through a TV or games console.
H1: There is a relationship between the likeliness of wanting to control the home using either a PDor laptop/PC more than through a TV or games console.
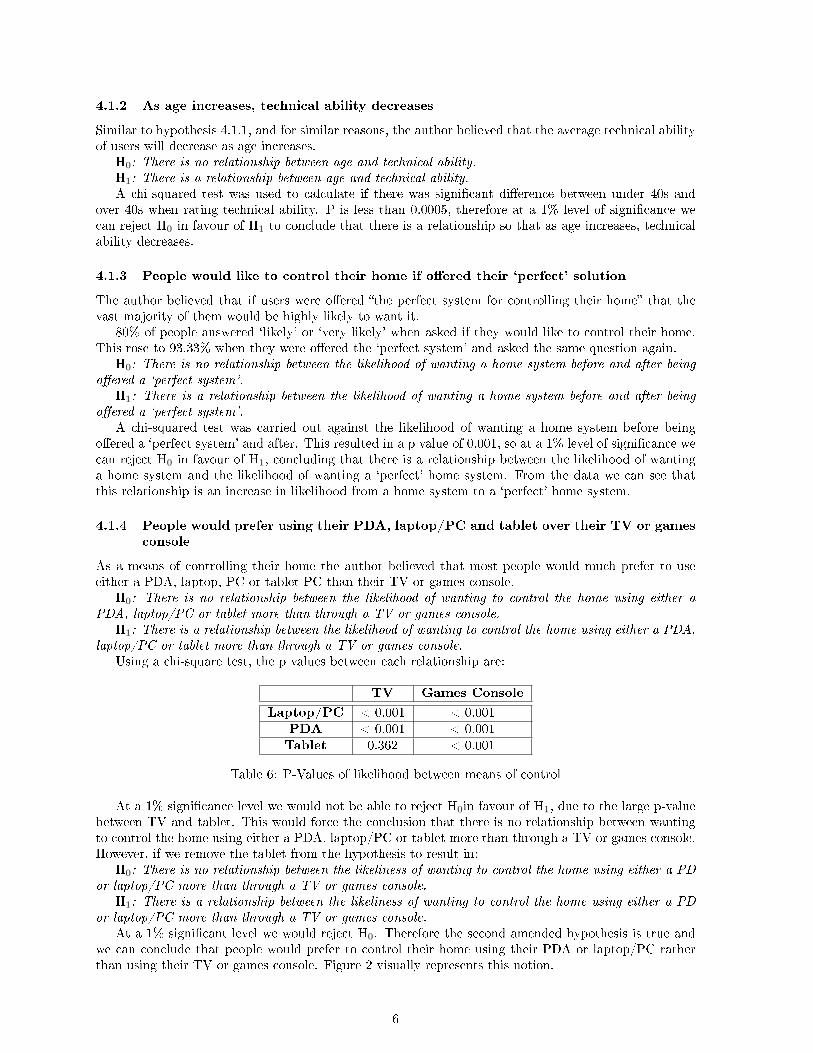
At a 1% signi�cant level we would reject H0. Therefore the second amended hypothesis is true andwe can conclude that people would prefer to control their home using their PDA or laptop/PC ratherthan using their TV or games console. Figure 2 visually represents this notion.
6
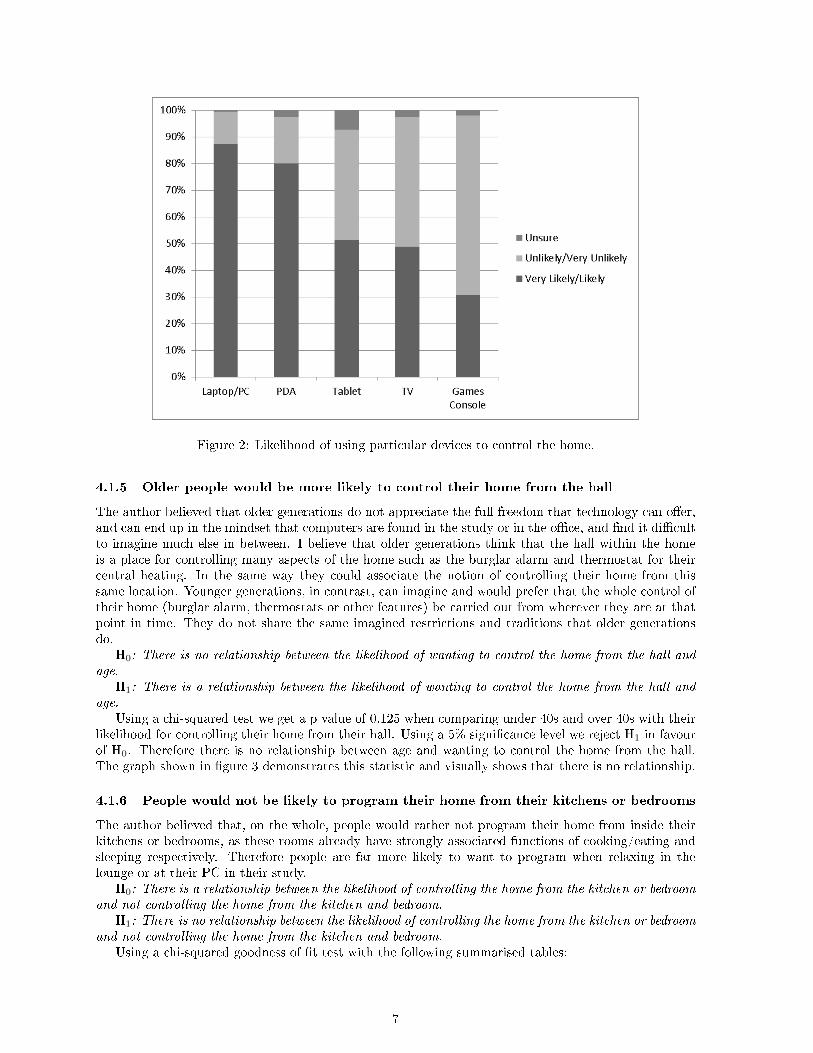
Figure 2: Likelihood of using particular devices to control the home.
4.1.5 Older people would be more likely to control their home from the hall
The author believed that older generations do not appreciate the full freedom that technology can o�er,and can end up in the mindset that computers are found in the study or in the o�ce, and �nd it di�cultto imagine much else in between. I believe that older generations think that the hall within the homeis a place for controlling many aspects of the home such as the burglar alarm and thermostat for theircentral heating. In the same way they could associate the notion of controlling their home from thissame location. Younger generations, in contrast, can imagine and would prefer that the whole control oftheir home (burglar alarm, thermostats or other features) be carried out from wherever they are at thatpoint in time. They do not share the same imagined restrictions and traditions that older generationsdo.
H0: There is no relationship between the likelihood of wanting to control the home from the hall andage.
H1: There is a relationship between the likelihood of wanting to control the home from the hall andage.
Using a chi-squared test we get a p value of 0.125 when comparing under 40s and over 40s with theirlikelihood for controlling their home from their hall. Using a 5% signi�cance level we reject H1 in favourof H0. Therefore there is no relationship between age and wanting to control the home from the hall.The graph shown in �gure 3 demonstrates this statistic and visually shows that there is no relationship.
4.1.6 People would not be likely to program their home from their kitchens or bedrooms
The author believed that, on the whole, people would rather not program their home from inside theirkitchens or bedrooms, as these rooms already have strongly associated functions of cooking/eating andsleeping respectively. Therefore people are far more likely to want to program when relaxing in thelounge or at their PC in their study.
H0: There is a relationship between the likelihood of controlling the home from the kitchen or bedroomand not controlling the home from the kitchen and bedroom.
H1: There is no relationship between the likelihood of controlling the home from the kitchen or bedroomand not controlling the home from the kitchen and bedroom.
Using a chi-squared goodness of �t test with the following summarised tables:
7
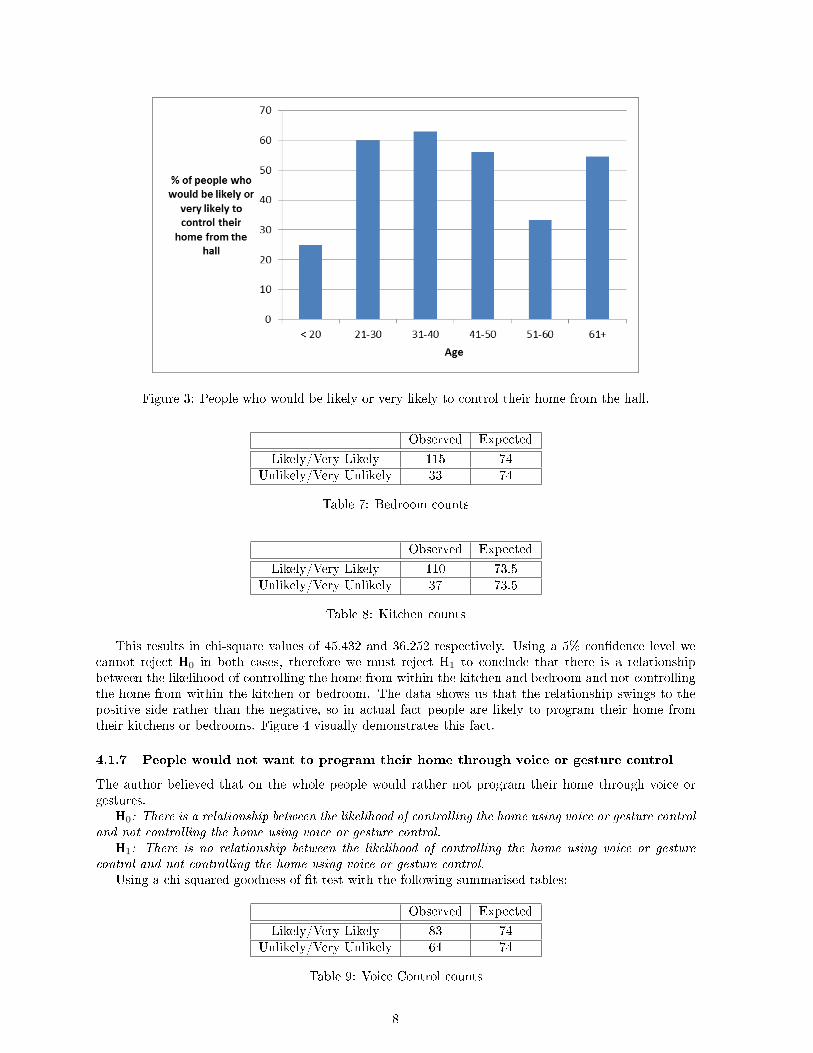
Figure 3: People who would be likely or very likely to control their home from the hall.
Observed Expected
Likely/Very Likely 115 74Unlikely/Very Unlikely 33 74
Table 7: Bedroom counts
Observed Expected
Likely/Very Likely 110 73.5Unlikely/Very Unlikely 37 73.5
Table 8: Kitchen counts
This results in chi-square values of 45.432 and 36.252 respectively. Using a 5% con�dence level wecannot reject H0 in both cases, therefore we must reject H1 to conclude that there is a relationshipbetween the likelihood of controlling the home from within the kitchen and bedroom and not controllingthe home from within the kitchen or bedroom. The data shows us that the relationship swings to thepositive side rather than the negative, so in actual fact people are likely to program their home fromtheir kitchens or bedrooms. Figure 4 visually demonstrates this fact.
4.1.7 People would not want to program their home through voice or gesture control
The author believed that on the whole people would rather not program their home through voice orgestures.
H0: There is a relationship between the likelihood of controlling the home using voice or gesture controland not controlling the home using voice or gesture control.
H1: There is no relationship between the likelihood of controlling the home using voice or gesturecontrol and not controlling the home using voice or gesture control.
Using a chi-squared goodness of �t test with the following summarised tables:
Observed Expected
Likely/Very Likely 83 74Unlikely/Very Unlikely 64 74
Table 9: Voice Control counts
8
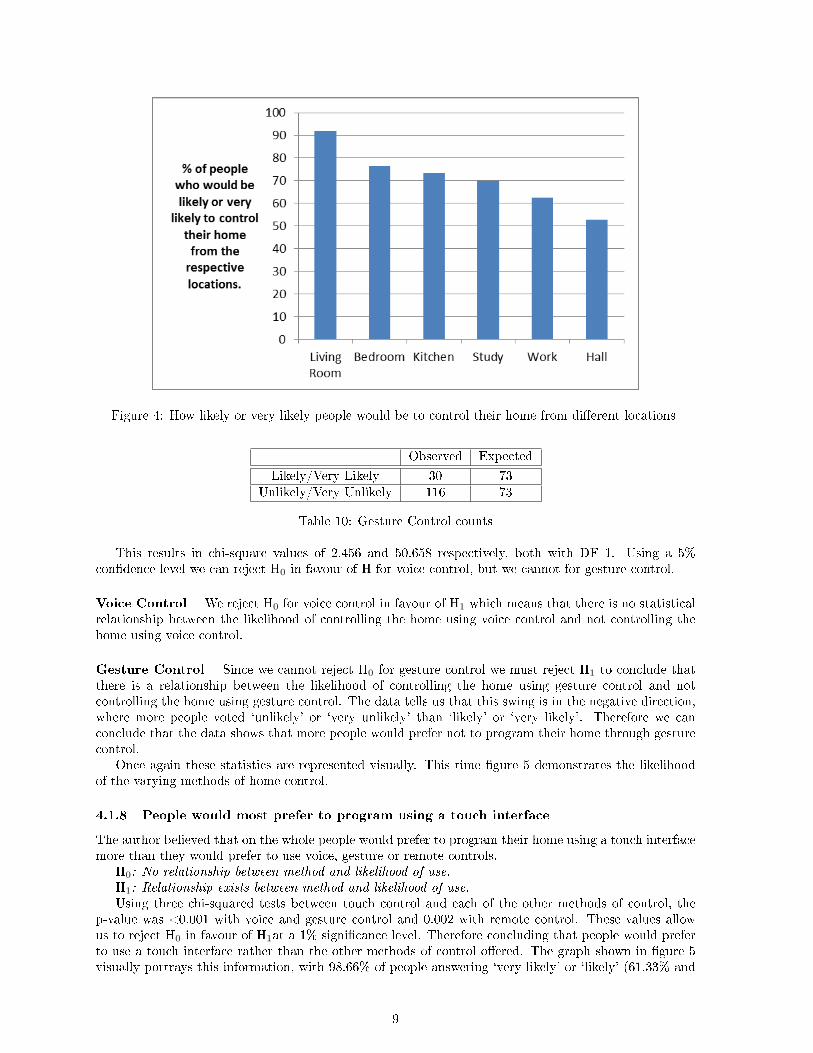
Figure 4: How likely or very likely people would be to control their home from di�erent locations
Observed Expected
Likely/Very Likely 30 73Unlikely/Very Unlikely 116 73
Table 10: Gesture Control counts
This results in chi-square values of 2.456 and 50.658 respectively, both with DF 1. Using a 5%con�dence level we can reject H0 in favour of H for voice control, but we cannot for gesture control.
Voice Control We reject H0 for voice control in favour of H1 which means that there is no statisticalrelationship between the likelihood of controlling the home using voice control and not controlling thehome using voice control.
Gesture Control Since we cannot reject H0 for gesture control we must reject H1 to conclude thatthere is a relationship between the likelihood of controlling the home using gesture control and notcontrolling the home using gesture control. The data tells us that this swing is in the negative direction,where more people voted `unlikely' or `very unlikely' than `likely' or `very likely'. Therefore we canconclude that the data shows that more people would prefer not to program their home through gesturecontrol.
Once again these statistics are represented visually. This time �gure 5 demonstrates the likelihoodof the varying methods of home control.
4.1.8 People would most prefer to program using a touch interface
The author believed that on the whole people would prefer to program their home using a touch interfacemore than they would prefer to use voice, gesture or remote controls.
H0: No relationship between method and likelihood of use.H1: Relationship exists between method and likelihood of use.Using three chi-squared tests between touch control and each of the other methods of control, the
p-value was <0.001 with voice and gesture control and 0.002 with remote control. These values allowus to reject H0 in favour of H1at a 1% signi�cance level. Therefore concluding that people would preferto use a touch interface rather than the other methods of control o�ered. The graph shown in �gure 5visually portrays this information, with 98.66% of people answering `very likely' or `likely' (61.33% and
9
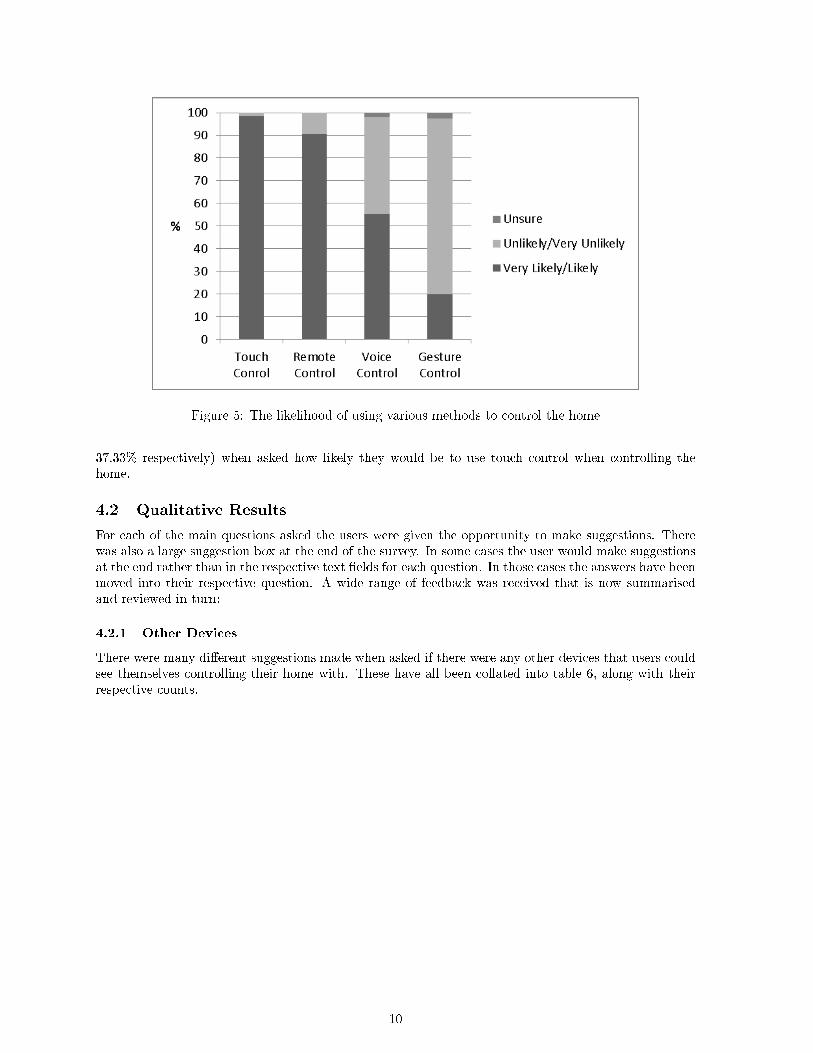
Figure 5: The likelihood of using various methods to control the home
37.33% respectively) when asked how likely they would be to use touch control when controlling thehome.
4.2 Qualitative Results
For each of the main questions asked the users were given the opportunity to make suggestions. Therewas also a large suggestion box at the end of the survey. In some cases the user would make suggestionsat the end rather than in the respective text �elds for each question. In those cases the answers have beenmoved into their respective question. A wide range of feedback was received that is now summarisedand reviewed in turn:
4.2.1 Other Devices
There were many di�erent suggestions made when asked if there were any other devices that users couldsee themselves controlling their home with. These have all been collated into table 6, along with theirrespective counts.
10
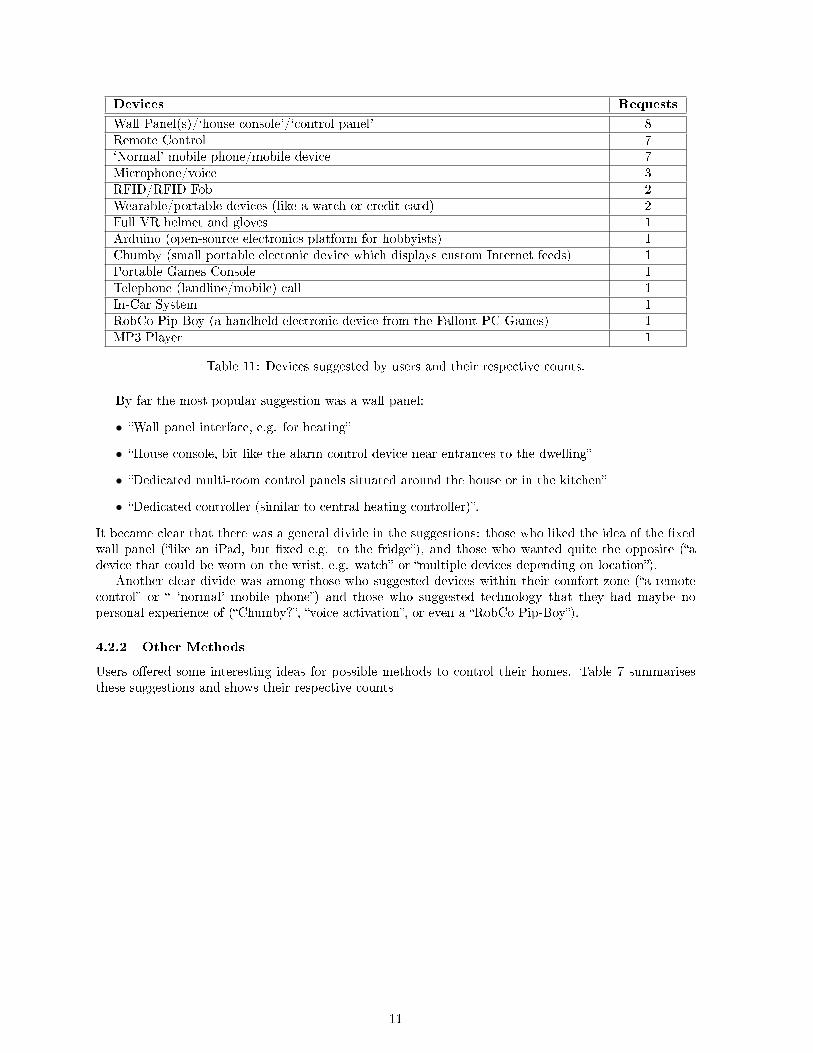
Devices Requests
Wall Panel(s)/`house console'/`control panel' 8Remote Control 7`Normal' mobile phone/mobile device 7Microphone/voice 3RFID/RFID Fob 2Wearable/portable devices (like a watch or credit card) 2Full VR helmet and gloves 1Arduino (open-source electronics platform for hobbyists) 1Chumby (small portable electonic device which displays custom Internet feeds) 1Portable Games Console 1Telephone (landline/mobile) call 1In-Car System 1RobCo Pip-Boy (a handheld electronic device from the Fallout PC Games) 1MP3 Player 1
Table 11: Devices suggested by users and their respective counts.
By far the most popular suggestion was a wall panel:
• �Wall panel interface, e.g. for heating�
• �House console, bit like the alarm control device near entrances to the dwelling�
• �Dedicated multi-room control panels situated around the house or in the kitchen�
• �Dedicated controller (similar to central heating controller)�.
It became clear that there was a general divide in the suggestions: those who liked the idea of the �xedwall panel (�like an iPad, but �xed e.g. to the fridge�), and those who wanted quite the opposite (�adevice that could be worn on the wrist, e.g. watch� or �multiple devices depending on location�).
Another clear divide was among those who suggested devices within their comfort zone (�a remotecontrol� or � `normal' mobile phone�) and those who suggested technology that they had maybe nopersonal experience of (�Chumby?�, �voice activation�, or even a �RobCo Pip-Boy�).
4.2.2 Other Methods
Users o�ered some interesting ideas for possible methods to control their homes. Table 7 summarisesthese suggestions and shows their respective counts
11
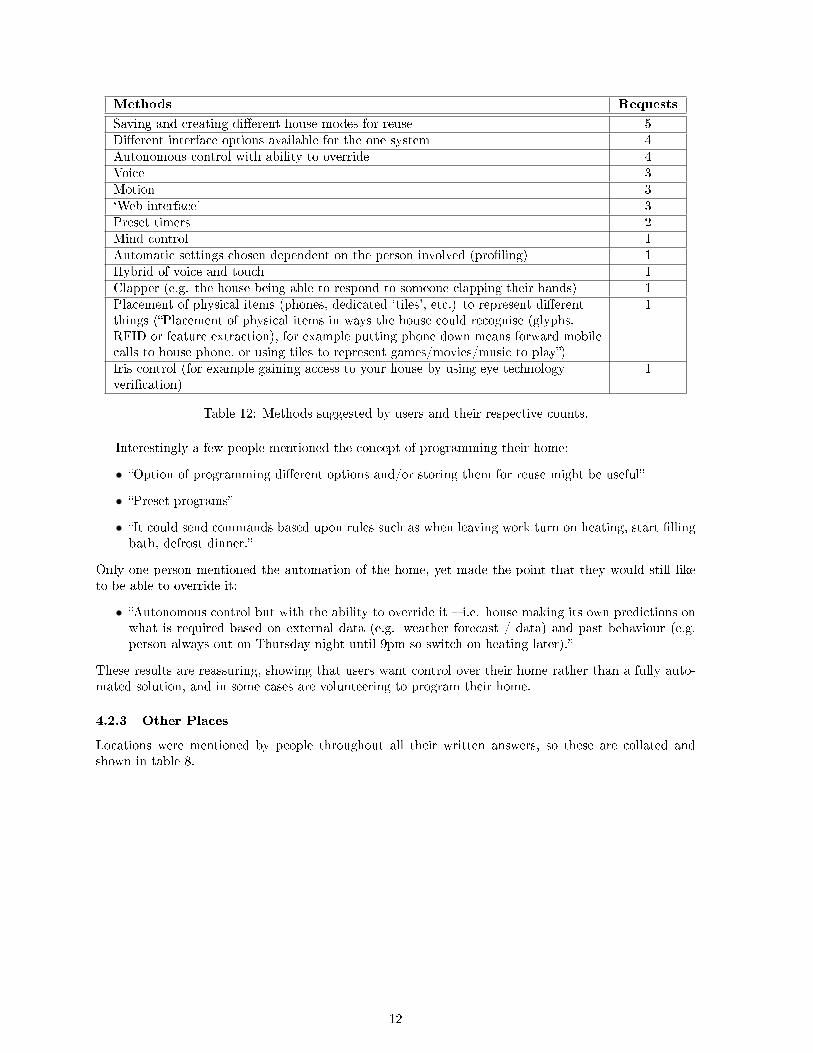
Methods Requests
Saving and creating di�erent house modes for reuse 5Di�erent interface options available for the one system 4Autonomous control with ability to override 4Voice 3Motion 3`Web interface' 3Preset timers 2Mind control 1Automatic settings chosen dependent on the person involved (pro�ling) 1Hybrid of voice and touch 1Clapper (e.g. the house being able to respond to someone clapping their hands) 1Placement of physical items (phones, dedicated `tiles', etc.) to represent di�erentthings (�Placement of physical items in ways the house could recognise (glyphs,RFID or feature extraction), for example putting phone down means forward mobilecalls to house phone, or using tiles to represent games/movies/music to play�)
1
Iris control (for example gaining access to your house by using eye technologyveri�cation)
1
Table 12: Methods suggested by users and their respective counts.
Interestingly a few people mentioned the concept of programming their home:
• �Option of programming di�erent options and/or storing them for reuse might be useful�
• �Preset programs�
• �It could send commands based upon rules such as when leaving work turn on heating, start �llingbath, defrost dinner.�
Only one person mentioned the automation of the home, yet made the point that they would still liketo be able to override it:
• �Autonomous control but with the ability to override it � i.e. house making its own predictions onwhat is required based on external data (e.g. weather forecast / data) and past behaviour (e.g.person always out on Thursday night until 9pm so switch on heating later).�
These results are reassuring, showing that users want control over their home rather than a fully auto-mated solution, and in some cases are volunteering to program their home.
4.2.3 Other Places
Locations were mentioned by people throughout all their written answers, so these are collated andshown in table 8.
12
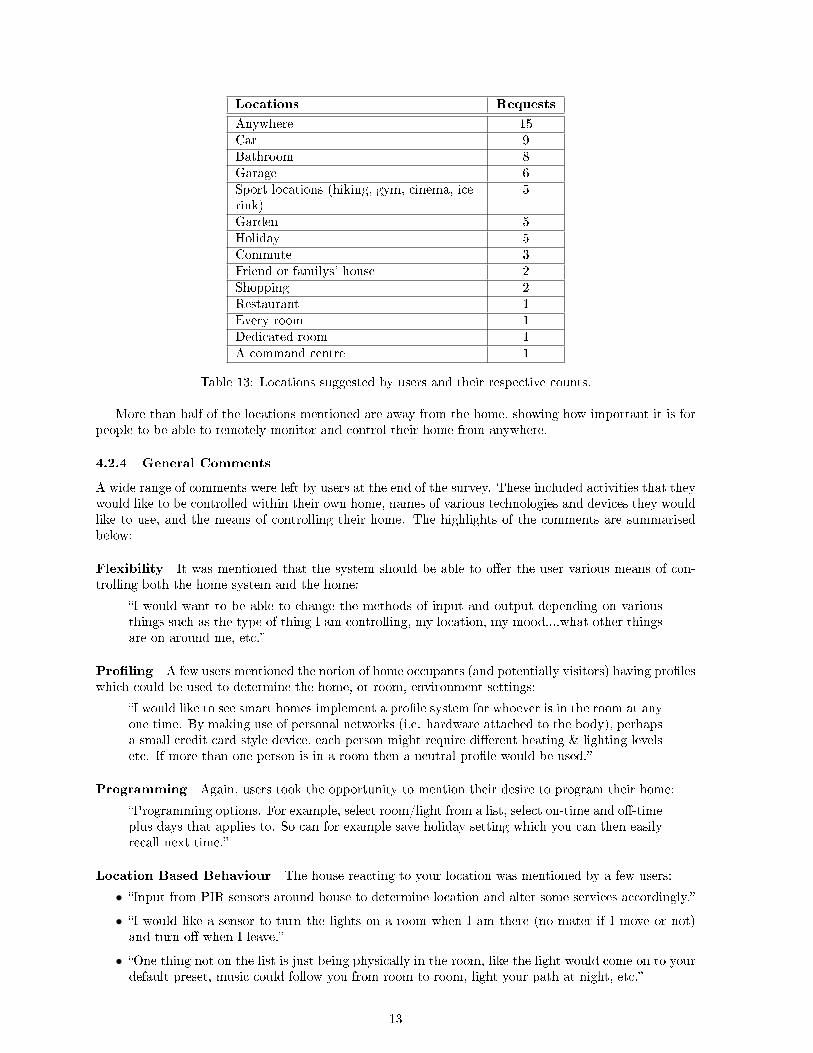
Locations Requests
Anywhere 15Car 9Bathroom 8Garage 6Sport locations (hiking, gym, cinema, icerink)
5
Garden 5Holiday 5Commute 3Friend or familys' house 2Shopping 2Restaurant 1Every room 1Dedicated room 1A command centre 1
Table 13: Locations suggested by users and their respective counts.
More than half of the locations mentioned are away from the home, showing how important it is forpeople to be able to remotely monitor and control their home from anywhere.
4.2.4 General Comments
A wide range of comments were left by users at the end of the survey. These included activities that theywould like to be controlled within their own home, names of various technologies and devices they wouldlike to use, and the means of controlling their home. The highlights of the comments are summarisedbelow:
Flexibility It was mentioned that the system should be able to o�er the user various means of con-trolling both the home system and the home:
�I would want to be able to change the methods of input and output depending on variousthings such as the type of thing I am controlling, my location, my mood....what other thingsare on around me, etc.�
Pro�ling A few users mentioned the notion of home occupants (and potentially visitors) having pro�leswhich could be used to determine the home, or room, environment settings:
�I would like to see smart homes implement a pro�le system for whoever is in the room at anyone time. By making use of personal networks (i.e. hardware attached to the body), perhapsa small credit card style device, each person might require di�erent heating & lighting levelsetc. If more than one person is in a room then a neutral pro�le would be used.�
Programming Again, users took the opportunity to mention their desire to program their home:
�Programming options. For example, select room/light from a list, select on-time and o�-timeplus days that applies to. So can for example save holiday setting which you can then easilyrecall next time.�
Location Based Behaviour The house reacting to your location was mentioned by a few users:
• �Input from PIR sensors around house to determine location and alter some services accordingly.�
• �I would like a sensor to turn the lights on a room when I am there (no mater if I move or not)and turn o� when I leave.�
• �One thing not on the list is just being physically in the room, like the light would come on to yourdefault preset, music could follow you from room to room, light your path at night, etc.�
13
Home Security As the author discovered in a previous user study, home security is an importantissue to people. This was con�rmed again in this study:
• �I'd love to have a home surveillance that I could view from work to check that the house is OK.Also, to be able to switch on lights for example if I am coming home later than expected.�
• �Safety features would be useful addition, e.g. � if hot water tank leaks switch o� water heatingand turn o� more water going in to tank. Could inform homeowner by SMS.�
System Security There was a surprising lack of comments made about the reliability and securityissues of a home system, however this could be due to the comment made in the survey which asked theuser to answer the questions as if a `perfect' home system was available.
• �Security � if you were able to make commands for changes in your house while you are outside ofit - can someone unwanted do it? It would be good to have things like baths run for coming homefrom cold football matches � get the heating turned on/o� if the weather changes quickly (as itdoes here) but I wouldn't like a stranger running a bath and �ooding the house or turning on theheating when you are away for a month in high summer.�
• �Street / Public places (e.g. Bar, Train etc.) � but only if trust was gained that system workedcorrectly!�
Accessibility Most likely due to the type of user �lling in the survey there was very little mentionedabout accessibility issues, nor telecare. One user did make the following point:
�I hope this could include some accessible solutions in one system, e.g. to allow disabledpeople to control all environmental aspects such as windows, curtains, door openers, TV,media systems, page turners, bed control, water and shower temperature, automated on/o�taps/showers/washing machines etc. etc. etc. And that the system could be adapted toallow varied accessible manner...for some this would be touch, others could be voice activated,others by additional larger switches with automated scanning through options, some otherscan use head pointers etc. etc.!�
Feedback Only one user mentioned system feedback for reassurance purposes:
�A remote control device with buttons speci�c to the task � perhaps with pictures would beeasy to use, followed by a message to say that the task had been completed so that you knewthe task you had just asked to be done had actually been completed.�
5 Conclusion
This survey has been incredibly valuable in learning how people want to control their homes. Thisinformation has allowed hypotheses about users and the home to be proven true, or in some cases false,and for trends to be observed in both the quantitative and qualitative data. The key information learntwas the types of devices, methods and locations in which people would use to control their home andOne user summarised the key aspects of home control: �Multiple points of access, ease of control andreliability are key issues.�
The quantitative data has allowed us to evaluate a number of hypothesis. The data con�rms that olderpeople do not enjoy using technology and are not as technically capable as younger generations. Usersdemonstrated a very strong desire to control their home, especially when o�ered `the perfect system'.On the whole PDAs, laptops, PCs and tablet PCs were preferred as means of controlling the home overgames consoles. Finally, touch and remote control were strongly preferred as means of controlling thehome than voice or gesture control. The author's two hypotheses about controlling the home from certainlocations were both proven false, showing that actually there is no trend between age and controllingthe home from the hall, and that actually people on the whole do not have much preference where theycontrol their home from.
14

The author can make use of the statistics and observations learnt from the survey to help ensurethat her work is both suitable and appropriate for potential end users. Having learnt that 98.7% of theusers from the survey said that they would be likely or very likely to control their home using a touchinterface, and the strong desire for people to want to control their home from `anywhere', an Apple iPadhas been chosen as the main means of controlling the author's existing home system work. An iPad isa slimline tablet PC which o�ers a very high standard of simplicity, form factor and enjoyment for anyuser and was considered the most suitable device available on the market. Care and attention over otherissues raised by users will be given, such as security and �exibility of both the home system and themeans of controlling the home system.
15
References
[1] Sarah Beech, Erik Geelhoed, Rachel Murphy, Julie Parker, Abigail Sellen, and Kate Shaw. TheLifestyles of Working Parents : Implications and Opportunities for New Technologies. HP Techreport, (HPL-2003-88), 2004.
[2] J Coughlin, L A D'Ambrosio, B Reimer, and M R Pratt. Older adult perceptions of smart hometechnologies: implications for research, policy and market innovations in healthcare. Conferenceproceedings : ... Annual International Conference of the IEEE Engineering in Medicine and BiologySociety. IEEE Engineering in Medicine and Biology Society. Conference, 2007:1810�5, January 2007.
[3] Andy Crabtree, Tom Rodden, Terry Hemmings, and Steve Benford. Finding a Place for UbiCompin the Home. UbiComp, 2864(LNCS):208�226, 2003.
[4] Charles N Darrah. Family Models , Model Families. In Revisiting the American Dream: How USFamilies Cope with Work and Family Life, American Anthropological Association Annual Confer-ence, Chicago, IL, 2003.
[5] CN Darrah, J. English-Lueck, and J. Freeman. Families at work: An ethnography of dual careerfamilies. Report for the Sloane Foundation, pages 98�-6, 2001.
[6] Scott Davido�, Min Kyung Lee, John Zimmerman, and Anind Dey. Socially-Aware Requirementsfor a Smart Home. International Symposium on Intelligent Environments, pages 41�44, 2006.
[7] A K Dey, R Hamid, C Beckmann, I Li, and D Hsu. a CAPpella: programming by demonstration ofcontext-aware applications. Proceedings of the SIGCHI conference on Human factors in computingsystems, page 40, 2004.
[8] Edward B. Driscoll. A Timeline for Home Automation. 2002.
[9] Rebecca E Grinter, W Keith Edwards, Mark W Newman, and Nicolas Ducheneaut. The Work toMake a Home Network Work. In ECSCW, number September, pages 469�488, Paris, France, 2005.
[10] Davin Heckman. A Small World: Smart Houses and the Dream of the Perfect Day. Duke UniversityPress, 2008.
[11] Helen Heneveld. Background of Helen Heneveld. www.hheneveld.com/about, 2009.
[12] Clare-Marie Karat, John Karat, Carolyn Brodie, and Jinjuan Feng. Evaluating interfaces for privacypolicy rule authoring. Proceedings of the SIGCHI conference on Human Factors in computingsystems - CHI '06, page 83, 2006.
[13] Scott R. Klemmer, Jack Li, James Lin, and James A. Landay. Papier-Mache. ACM Press, NewYork, New York, USA, 2004.
[14] Claire Maternaghan. Controlling the Home Survey, 2010.
[15] Jon O'Brien, Tom Rodden, Mark Rounce�eld, and John Hughes. At home with the technology:an ethnographic study of a set-top-box trial. ACM Transactions on Computer-Human Interaction,6(3):282�308, September 1999.
[16] T Rodden, A Crabtree, T Hemmings, B Koleva, J Humble, K P RA kesson, and P HANSSON. Con-�guring the Ubiquitous Home. Cooperative Systems Design: Scenario-Based Design of CollaborativeSystems, page 215, 2004.
[17] Jennifer A Rode, U C Irvine, Eleanor F Toye, and Alan F Blackwell. The Domestic Economy : aBroader Unit of Analysis for End User Programming. In CHI, pages 1757�1760, 2005.
[18] K. Truong, G. Abowd, and J. Brotherton. Who, what, when, where, how: Design issues of captureand access applications, pages 209 � 224. Springer, 2001.
16

[19] K. Truong, E.M. Huang, and G.D. Abowd. CAMP: A magnetic poetry interface for end-userprogramming of capture applications for the home. UbiComp 2004: Ubiquitous Computing, pages143�160, 2004.
[20] Alladi Venkatesh, Æ Erik Kruse, and ÆEric Chuan-fong Shih. The networked home : an analysisof current developments and future trends. October, pages 23�32, 2003.
[21] B Zhang, PLP Rau, and G Salvendy. Design and evaluation of smart home user interface: e�ectsof age, tasks and . . . . Behaviour and Information . . . , 2009.
17
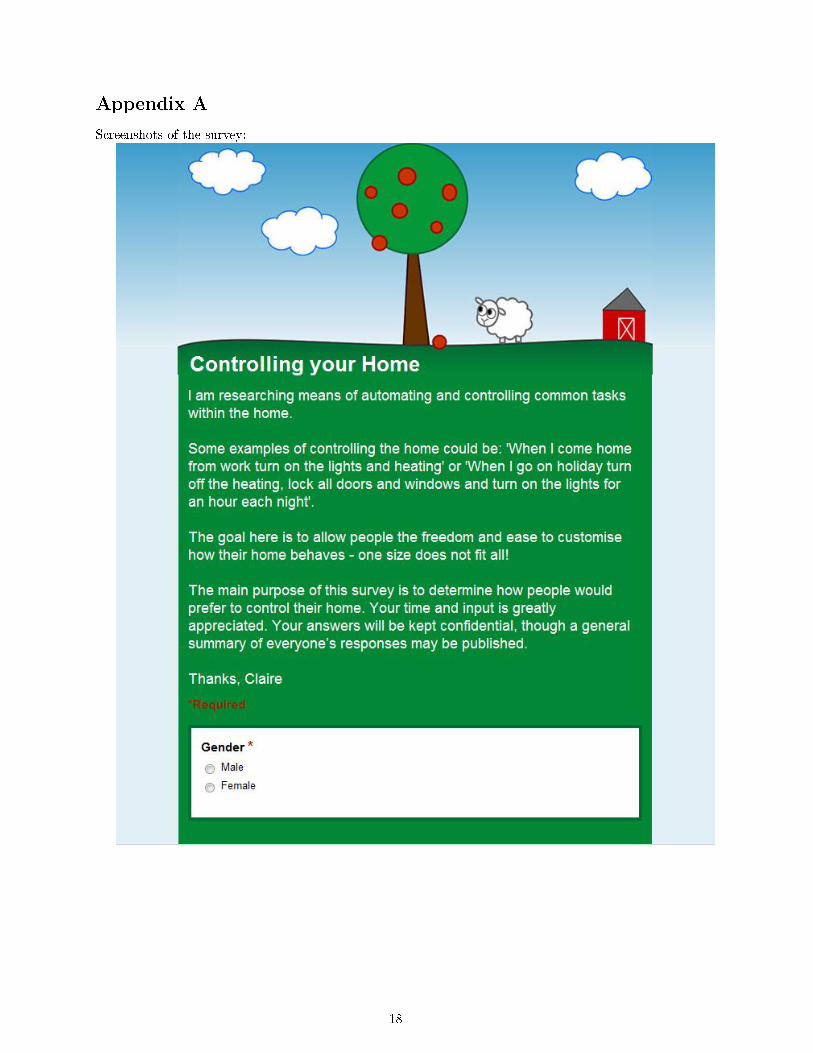
Appendix A
Screenshots of the survey:
18
19
20
21
22