Embed Size (px)
Citation preview

What People Want: Investigating Inclusive Insurance
Demand in Ethiopia
FINANCE, COMPETITIVENESS & INNOVATION INSIGHT | LONG-TERM FINANCE
Pub
lic D
iscl
osur
e A
utho
rized
Pub
lic D
iscl
osur
e A
utho
rized
Pub
lic D
iscl
osur
e A
utho
rized
Pub
lic D
iscl
osur
e A
utho
rized

© 2018 The World Bank Group
1818 H Street NW Washington, DC 20433 Telephone: 202-473-1000 Internet: www.worldbank.org All rights reserved.
This volume is a product of the staff and consultants of the World Bank Group. The World Bank Group refers to the member institutions of the World Bank Group: The World Bank (International Bank for Reconstruction and Development); International Finance Corporation (IFC); and Multilateral Investment Guarantee Agency (MIGA), which are separate and distinct legal entities each organized under its respective Articles of Agreement. We encourage use for educational and non-commercial purposes.
The findings, interpretations, and conclusions expressed in this volume do not necessarily reflect the views of the Directors or Executive Directors of the respective institutions of the World Bank Group or the governments they represent. The World Bank Group does not guarantee the accuracy of the data included in this work.
Rights and Permissions
The material in this publication is copyrighted. Copying and/or transmitting portions or all of this work without permission may be a violation of applicable law. The World Bank encourages dissemination of its work and will normally grant permission to reproduce portions of the work promptly.
All queries on rights and licenses, including subsidiary rights, should be addressed to the Office of the Publisher, The World Bank Group, 1818 H Street NW, Washington, DC 20433, USA; fax: 202-522-2422; e-mail: [email protected].

I
TABLE OF CONTENTS
ACRONYMS AND ABBREVIATIONS III
ACKNOWLEDGMENTS VII
EXECUTIVE SUMMARY IX
I. INTRODUCTION 1Understanding Low-Income Markets 1Objectives of Demand Research 1Methodology 3
II. SUMMARY CHARACTERISTICS OF HOUSEHOLDS SURVEYED 7Geographical Scope 7Respondent Profile 8Economic Level Segmentation 10
III. FINANCIAL BEHAVIOR 13Savings 13Borrowing 14Insurance 15Informal Insurance - Edirs 16
IV. RISKS AND RISK MANAGEMENT 19Risk Events Experienced by Survey Respondents 20Risk Ranking by Focus Groups 21
V. SPECIFIC RISK EVENTS, COSTS, AND COPING 25Agricultural Risk Events 25Health Risk Events 29Death Risk Events 36
VI. POTENTIAL CHANNELS FOR DISTRIBUTION OF INSURANCE 43
CONCLUSIONS AND RECOMMENDATIONS 47
REFERENCES 49
APPENDICES 51
WHAT PEOPLE WANT: INVESTIGATING INCLUSIVE INSURANCE DEMAND IN ETHIOPIA
I
FINANCE, COMPETITIVENESS & INNOVATION INSIGHT | LONG-TERM FINANCE

IITABLE OF CONTENTS
FIGURESFigure 1. Summary of Research Methodology 4Figure 2. Geographical Scope of the Study 7Figure 3. Cumulative Percentage of Sample Likely to Fall Below National Poverty Lines 10Figure 4. Likelihood of Sample Under National Poverty Lines, by Primary Economic Activity 11Figure 5. Proportion of Households Reporting Savings for Future Expenses 13Figure 6. Amount Saved (USD), Urban and Rural 14Figure 7. Percentage of Households Borrowing from Various Sources in the Last 5 Years 14Figure 8. Primary Reasons Households do not Borrow 14Figure 9. Reasons for not Having Insurance 15Figure 10. Primary Reason for Edir Membership 16Figure 11. Sufficiency of Edir Payment 16Figure 12. Monthly Contribution Amounts (USD) - Urban and Rural HH 17Figure 13. Expected Edir Payout in Event of Death of Close Family Member (USD) 17Figure 14. Experience of Shock Events as Reported by Survey Respondents 19Figure 15. Example Risk Ranking Cards – Focus Group Discussions 20Figure 16. Risk Ranking According to Three Factors (FGDs) 20Figure 17. Distribution of Households’ Crop Income in Normal Years and Shock Years (USD) 26Figure 18: Percentage of HHs Reporting Losses in the Given Ranges 27Figure 19. Proportion of Households Reporting Losses in the Given Ranges After a Crop Shock 27Figure 20. Coping Mechanism Used to Cope with Agricultural Losses 28Figure 21. Occurrence by Type of Health Shock 31Figure 22. Types and Amounts of Incurred Costs Reported After a Health Shock 31Figure 23. Health Shock Costs and Frequency by Urban and Rural 32Figure 24. Average Cost by Type of Health Shock 32Figure 25. Distribution of Costs Incurred by a Household During a Health Shock: Urban and Rural (USD) 32Figure 26. Coping Strategies Used After a Health Shock 34Figure 27. Frequency and Allocation of Costs Faced After a Death – Rural Participants 37Figure 28: Frequency and Allocation of Costs Faced After a Death – Urban Participants 38Figure 29. Distribution of Expenses After Death – Urban and Rural 38Figure 30. Coping Mechanisms Used After a Death 39Figure 31. Membership and Frequency of Access of Potential Channels – Survey Respondents 43Figure 32. Product Development Process 47Figure 33. Attitudes Towards Insurance 56

WHAT PEOPLE WANT: INVESTIGATING INCLUSIVE INSURANCE DEMAND IN ETHIOPIA
III
TABLESTable 1. Key Research Questions 2Table 2. Profile of Households in Survey 8Table 3. Overall Risk Ranking by Focus Groups 23Table 4. Household Agricultural Cash Management 26Table 5. Focus Group Feedback on Crop Insurance Product Prototype Features 29Table 6. WTP for Crop Insurance (ETB) 30Table 7. WTP for Crop Insurance (% of Coverage) 29Table 8. Focus Group Feedback on Hospital Cash Product Prototype Features 35Table 9. WTP for Hospital Cash Insurance (ETB) 36Table 10. WTP for Hospital Cash Insurance (% of Coverage) 36Table 11. Focus Group Feedback on Life Insurance Product Prototype Features 40Table 12. WTP for Life Insurance (% of Coverage) 41Table 13. WTP for Life Insurance (ETB) 42Table 14. Trust, Ease of Access, and Likelihood of Buying from Potential Distribution Channels (FGDs) 44Table 15. Sampled HHs Distributed to the Regions 52Table 16. Household Survey Sampling Framework 52
BOXESBox 1. Edirs as Informal Insurance 16Box 2. Crop Insurance Product Prototype 29Box 3. Health Facility Access 32Box 4. Hospital Cash Insurance Product Prototype 35Box 5. Life Insurance Product Prototype 40

III. MANDATORY REPORTING AND INFORMATION SHARING
IV

VWHAT PEOPLE WANT: INVESTIGATING INCLUSIVE INSURANCE DEMAND IN ETHIOPIA
V
ACRONYMS AND ABBREVIATIONS
ATP Ability to pay
ETB Ethiopian Birr
FGD Focus Group Discussion
HH Household
MFI Microfinance Institutions
MI Microinsurance
N Number
NBE National Bank of Ethiopia
PL Poverty Line
R4 R4 Rural Resilience Initiative
SACCO Savings and credit cooperative
SNNPR Southern Nations, Nationalities, and Peoples’ Region
SPS Simple Poverty Scorecard
USD United States Dollar
WFP World Food Programme
WTP Willingness to pay
FOREIGN TERMSEdir Traditional community groups that assist each other during emergencies, often for funeralsEqub Traditional informal financial cooperative, similar to a rotating savings and credit associationWoreda Districts, or third-level administrative divisions in Ethiopia
Kebele Smallest administrative unit of Ethiopia, similar to a ward
The exchange rate used throughout this study is USD 1 = ETB 22.1, the interbank exchange rate at the time of the data collection in March 2017
FINANCE, COMPETITIVENESS & INNOVATION INSIGHT | LONG-TERM FINANCE

VIVIACRONYMS AND ABBREVIATIONS

ACKNOWLEDGMENTS
The authors are Katie Biese (MicroInsurance Centre at Milliman), Michael J. McCord (MicroInsurance Centre at Milliman), Katherine Baez (EA Consultants), Eamon Kelly (Independent Consultant), and Craig Thorburn (World Bank Group [email protected]).
The authors express their great appreciation for the unwavering support of the National Bank of Ethiopia, particularly Ato Belay Tulu, whose assistance in obtaining necessary research permissions as well as dedication to making inclusive insurance a reality in Ethiopia were instrumental.
The team thanks the World Bank Group Ethiopia team, Francesco Strobbe (Senior Financial Economist) and Mengistu Bessir Achew (Operations Officer), for their support of this research.
The team would like to express its gratitude to JaRco Consulting’s core and field team, led by Tsegahun Tessema. We are grateful to Kibru Mamusha (Project coordinator at JaRco Consulting) as well as all supervisors, enumerators and researchers whose efforts and commitments made this project possible. Finally, the team owes particular appreciation to all Ethiopian women and men who participated in this study, either responding to lengthy household interviews or engaging in focus group discussions.
A special thanks goes to Aichin Lim Jones (Graphic Designer) for her work on the design, layout, and graphics of this publication.
This study and report were financed by the World Bank Promoting Inclusive Insurance in Ethiopia project funded by the FIRST Initiative (See footnote 2). It was implemented by the MicroInsurance Centre at Milliman in collaboration with EA Consultants and JaRco consulting.
VIIWHAT PEOPLE WANT: INVESTIGATING INCLUSIVE INSURANCE DEMAND IN ETHIOPIA
VII
FINANCE, COMPETITIVENESS & INNOVATION INSIGHT | LONG-TERM FINANCE

VIIIVIIIACRONYMS AND ABBREVIATIONS

EXECUTIVE SUMMARY
One important barrier to insurance markets that are more inclusive is the necessity to better understand the needs of low-income and other un- and underserved populations. These people are not currently clients of insurers and are difficult for insurers
to reach through normal operations. As a result, many well-motivated efforts to provide client solutions can fail because of a misunderstanding or lack of understanding of the client’s situation. Without a clear understanding of the target market’s real and perceived risk management needs and the strategies they use to manage those risks, it is very difficult to identify opportunities and design valuable insurance products.
IXWHAT PEOPLE WANT: INVESTIGATING INCLUSIVE INSURANCE DEMAND IN ETHIOPIA
IX
This demand research study aims to provide data and information regarding critical inputs to key microinsurance product development opportunities and requirements in Ethiopia. By examining the risks that low-income people face, how they manage them, and identifying gaps, the market can gain valuable inputs into product design, including benefits to offer, better distribution approaches, and marketing and communications strategies.
The research was conducted using a set of three tools: a quantitative household survey of more than 2900 Ethiopians and two sets of qualitative focus group discussions totaling 38 groups. Interviews and focus groups were conducted across Amhara, Oromia, Tigray, Southern Nations, Nationalities, and Peoples’ Region (SNNPR), and Addis Ababa by a local research team between February and May of 2017.
The results show a clear gap between the effects of various financial shocks and households’ ability to cope with them and a clear gap of unmet but insurable risks. In the event of illness, death, agriculture or other property loss, 53% to 96% of affected respondents experienced great to moderate financial hardship, depending on the type of shock. Up to a year after the event, as many as 1/4 to 2/3 (depending on the type of shock) of affected households had been unable to sufficiently recover using the coping mechanisms they had available to them.
Coping mechanisms invoked to respond to financial shocks can be painful and leave the household with significantly reduced resilience. Savings and cash on hand are the most common and primary strategy used to cope with financial adversity. However, only 7% of households report regular saving, and those that do manage to save have low balances. Loans or gifts from family and friends is a second choice strategy for many, but in cases where shocks affect entire communities, such as drought, this is often a severely limited if not prohibitive option. When cash, savings, and family / friends are not available, more burdensome strategies must be used. Among rural households in particular, selling assets such as livestock is common, used in 5% to 25% of cases depending on the type of shock. While this may cover immediate expenses, it reduces their future productivity and erodes resilience against poverty in the longer term for the immediate family and possibly for generations. Interest-bearing loans from formal institutions are reported to be expensive, difficult to obtain, and stressful.
The survey results show that experience with and knowledge of insurance is very low, but this can be leveraged as an opportunity. Though insurance knowledge is low and will require educational efforts, negative bias is also very low. This is positive for insurers, as they can start with a ‘blank slate’ rather than trying to overcome a bias against insurance, which is common in many other markets.
FINANCE, COMPETITIVENESS & INNOVATION INSIGHT | LONG-TERM FINANCE

XEXECUTIVE SUMMARY
Also, despite low knowledge of formal insurance, Ethiopians have a strong informal insurance culture through Edirs (community-based organisations largely focused on funeral benefits, also iddir, eddir, idir), which can be leveraged. When presented with prototype products, focus group participants were very interested in the idea of insurance as a solution to closing the gap between expected costs and available coping strategies.
People worry most about health-related risks, as well as risks that impact their assets. During focus group discussions in rural areas, crop loss was ranked as the most worrisome because crops are not only the primary source of income, but they also are fundamental to the overall health of the household, both people and livestock. Health risks were ranked highly in both urban and rural areas, as participants seem to consider the ‘worst case scenarios’ of potentially very expensive treatment, lengthy periods of inability to work or even death, and disease outbreaks. Transport accidents were also top of mind for urban dwellers, as these events are highly visible and can be very devastating when they occur. Both urban and rural respondents ranked death risks rather low in priority, as the financial impact is perceived as low due to the culture of community assistance for funerals1. However, concern remains in case of death of a breadwinner.
Findings regarding specific types of risks:
• Agriculture risks. Overall, 49% of households experienced some loss, either of crops or livestock, during the last year. For those who reported a crop loss to the survey, the average income from crops dropped from USD 323 (ETB 7,150) in a normal year to USD 123 (ETB 2,720) in a shock year, a loss of 62%. For almost 75% of households, these losses represented half or more of their income in a normal year. Less tangible losses include not having enough food, and loss of investment in agricultural inputs, often purchased on credit. Only 53% reported being
able to pull together enough money to completely cover their losses, the lowest ‘success’ rate of all shocks examined in this study. Most focus group participants (97%) indicated they would buy a proposed prototype crop insurance product if it were available to them, as it would allow them to replace lost income and buy inputs for the next crop cycle. However, despite the interest, some groups felt it was not affordable: on average, participants were willing to pay just 3%-4% of the sum insured per year.
• Health risks. 32% of households experienced at least one major health event in the last year, and FGD participants ranked it as the most likely risk to occur and potentially one of the most impactful if it were to happen, clearly indicating a demand for insurance protection. The perception of financial impact as expressed by FGD participants seems higher than the actual financial impact of health shocks as reported to the survey. The average total costs reported was USD 105, but the majority of households report less than this, with a median cost of USD 22. Many people fear a high-cost illness, but many basic events are manageable with existing resources, with 75% reporting that they were able to fully recover after the shock event, and just 51% report moderate or great finacial hardship. A well-designed insurance product could leverage existing strategies such as savings, and provide peace of mind. Interest in a hospital cash prototype was high, with close to half of participants willing to pay an actuarially sound premium.
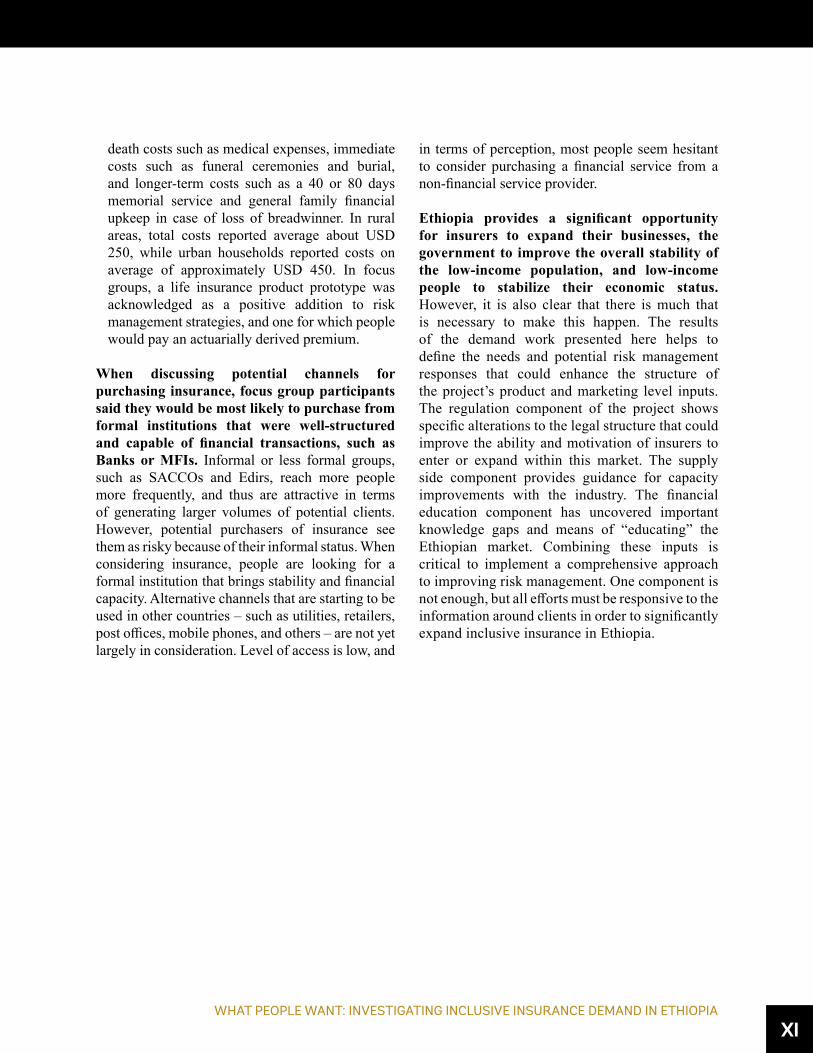
• Death risks. For focus group participants, the risk of death is seen as less pressing because people feel relatively well-prepared due to membership in an Edir. However, for most survey respondents, the primary reasons for being part of an Edir are social rather than financial. 83% estimated that the amounts provided in the event of death are minimal, covering only a token amount up to about 25% of costs. Reported costs in case of death fall into three general areas: pre-
1 Subsequent anecdotal suggestions also pointed to a system of relatively orderly transfer or property on death as another potential contributing factor.
WHAT PEOPLE WANT: INVESTIGATING INCLUSIVE INSURANCE DEMAND IN ETHIOPIA
XI
death costs such as medical expenses, immediate costs such as funeral ceremonies and burial, and longer-term costs such as a 40 or 80 days memorial service and general family financial upkeep in case of loss of breadwinner. In rural areas, total costs reported average about USD 250, while urban households reported costs on average of approximately USD 450. In focus groups, a life insurance product prototype was acknowledged as a positive addition to risk management strategies, and one for which people would pay an actuarially derived premium.
When discussing potential channels for purchasing insurance, focus group participants said they would be most likely to purchase from formal institutions that were well-structured and capable of financial transactions, such as Banks or MFIs. Informal or less formal groups, such as SACCOs and Edirs, reach more people more frequently, and thus are attractive in terms of generating larger volumes of potential clients. However, potential purchasers of insurance see them as risky because of their informal status. When considering insurance, people are looking for a formal institution that brings stability and financial capacity. Alternative channels that are starting to be used in other countries – such as utilities, retailers, post offices, mobile phones, and others – are not yet largely in consideration. Level of access is low, and
in terms of perception, most people seem hesitant to consider purchasing a financial service from a non-financial service provider.
Ethiopia provides a significant opportunity for insurers to expand their businesses, the government to improve the overall stability of the low-income population, and low-income people to stabilize their economic status. However, it is also clear that there is much that is necessary to make this happen. The results of the demand work presented here helps to define the needs and potential risk management responses that could enhance the structure of the project’s product and marketing level inputs. The regulation component of the project shows specific alterations to the legal structure that could improve the ability and motivation of insurers to enter or expand within this market. The supply side component provides guidance for capacity improvements with the industry. The financial education component has uncovered important knowledge gaps and means of “educating” the Ethiopian market. Combining these inputs is critical to implement a comprehensive approach to improving risk management. One component is not enough, but all efforts must be responsive to the information around clients in order to significantly expand inclusive insurance in Ethiopia.

XIIXIIACKNOWLEDGMENTS

1
I. INTRODUCTION
WHAT PEOPLE WANT: INVESTIGATING INCLUSIVE INSURANCE DEMAND IN ETHIOPIA
1
FINANCE, COMPETITIVENESS & INNOVATION INSIGHT | LONG-TERM FINANCE
Understanding Low-income Markets
Insurance markets can be less than fully inclusive for many reasons. Barriers that prevent clients and providers from finding and completing insurance transactions that they want and need are many and varied. One important barrier is not surprising – the needs of clients that are not
currently served by insurance are not well understood by insurers. These people are not currently clients of insurers and are difficult for insurers to reach through normal operations.
As a result, many well-motivated efforts to provide client solutions can fail because of a misunderstanding or lack of understanding of the client’s situation. The microinsurance landscape is littered with examples where failure can be attributed to products that do not work for clients due to such a misunderstanding. However, understanding client needs is a costly investment. To this end, this study is intended to get information to help overcome this barrier. Just as industry-wide mortality studies are commonplace in many markets, industry wide consumer research can be important in markets where the cost of each insurer doing it themselves would be a barrier to providing services.
This effort follows a project directed at reducing regulatory barriers. Now we seek to reduce barriers arising from misunderstanding of the market.
“Inclusive Insurance” and “Microinsurance”: Inclusive insurance focuses on making insurance markets more “inclusive” and reducing the extent that people are excluded from accessing and using the insurance services they want and need. Typically, this is focused on lower-income people who are usually underserved to a greater extent, if not totally, and may also include other un- and under-served groups such as women, or middle-income groups. In the Ethiopian context, whilst we are focusing on lower-income people,
we discuss a range of people that are not high income and yet are also underserved.
The term ‘microinsurance’ is used in this report, and is often used generally, to refer to insurance specifically designed to meet the needs of the poor. It is thus a more specific sub-set of inclusive insurance. ‘Microinsurance’ does not mean, and is often confused with, “little insurance policies” that are the same as more conventional insurance products, but with lower premium and benefit amounts. ‘Microinsurance’ also does not mean a particular type of insurance product, although some in Ethiopia tend to describe it as such, for example, insurance attached to microfinance lending activity or weather index based crop insurance.
Objectives of Demand ResearchThe demand research was conducted to provide key inputs for World Bank support to develop the insurance sector in Ethiopia, particularly to develop and launch microinsurance products. It serves as a critical input to one of the four pillars of the World Bank’s “Promoting Inclusive Insurance in Ethiopia” project2, which includes initiatives around products, regulation and supervision, consumer protection and financial literacy, and index-based insurance.
2 The project, running over three years, is funded by the FIRST Initiative; a multi donor trust fund providing support for initiatives to strengthen and develop the financial sector. Refer to www.firstinitiative.org for more information.
2I. INTRODUCTION
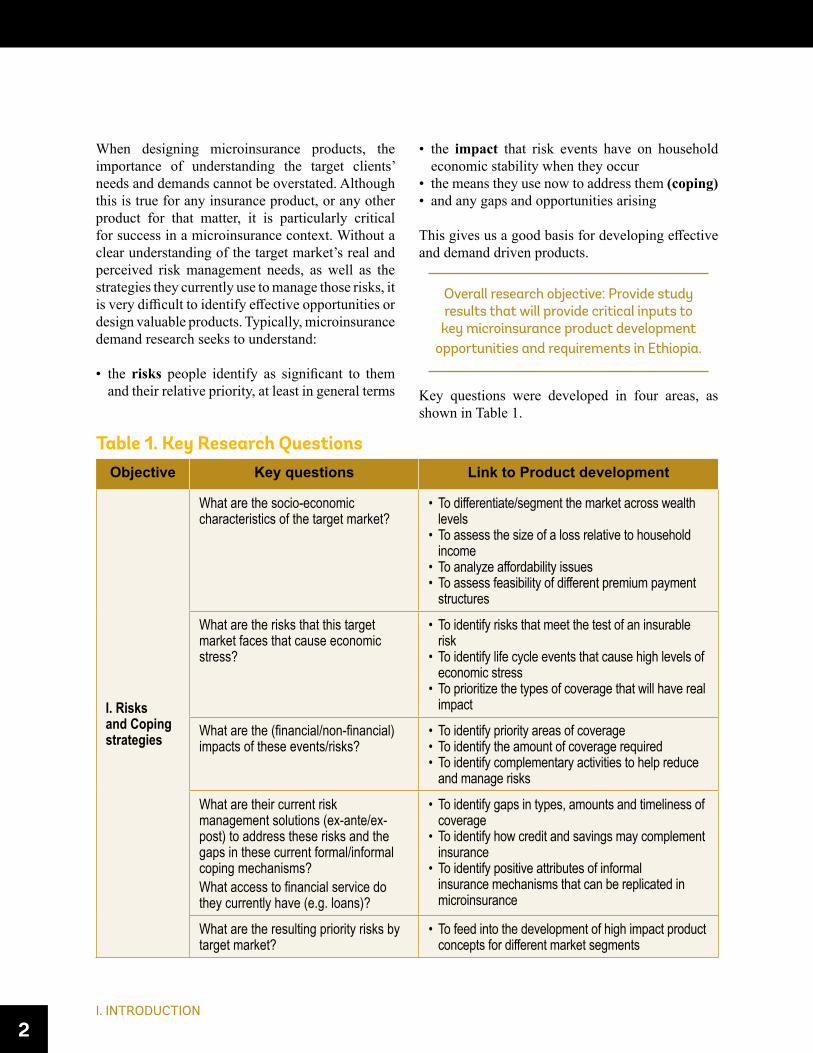
When designing microinsurance products, the importance of understanding the target clients’ needs and demands cannot be overstated. Although this is true for any insurance product, or any other product for that matter, it is particularly critical for success in a microinsurance context. Without a clear understanding of the target market’s real and perceived risk management needs, as well as the strategies they currently use to manage those risks, it is very difficult to identify effective opportunities or design valuable products. Typically, microinsurance demand research seeks to understand:
• the risks people identify as significant to them and their relative priority, at least in general terms
• the impact that risk events have on household economic stability when they occur
• the means they use now to address them (coping)• and any gaps and opportunities arising
This gives us a good basis for developing effective and demand driven products.
Overall research objective: Provide study results that will provide critical inputs to key microinsurance product development
opportunities and requirements in Ethiopia.
Key questions were developed in four areas, as shown in Table 1.
Table 1. Key Research QuestionsObjective Key questions Link to Product development
I. Risks and Coping strategies
What are the socio-economic characteristics of the target market?
• To differentiate/segment the market across wealth levels
• To assess the size of a loss relative to household income
• To analyze affordability issues • To assess feasibility of different premium payment
structures
What are the risks that this target market faces that cause economic stress?
• To identify risks that meet the test of an insurable risk
• To identify life cycle events that cause high levels of economic stress
• To prioritize the types of coverage that will have real impact
What are the (financial/non-financial) impacts of these events/risks?
• To identify priority areas of coverage• To identify the amount of coverage required• To identify complementary activities to help reduce
and manage risks
What are their current risk management solutions (ex-ante/ex-post) to address these risks and the gaps in these current formal/informal coping mechanisms?What access to financial service do they currently have (e.g. loans)?
• To identify gaps in types, amounts and timeliness of coverage
• To identify how credit and savings may complement insurance
• To identify positive attributes of informal insurance mechanisms that can be replicated in microinsurance
What are the resulting priority risks by target market?
• To feed into the development of high impact product concepts for different market segments

WHAT PEOPLE WANT: INVESTIGATING INCLUSIVE INSURANCE DEMAND IN ETHIOPIA
3
MethodologyThe study was carried out in four regions – Amhara, Oromia, SNNPR, and Tigray – and Addis Ababa. The regions selected provide a cross section of rural and urban markets. However, the overall results are not intended to be nationally representative. Instead, they are intended to be sufficient for the planned project research needs oriented toward product development. At the same time, they do cover a substantial and credible group to be relevant as input for decision-
making at the national level. The marginal value to the results from covering all regions and adding a “nationally representative” constraint on sampling was not required for this particular study. The regions that were not selected are less developed in terms of infrastructure and economy, and are less densely populated, making research more cost and time intensive. These characteristics also make it much less likely for insurers to be interested and able to reach to those markets. A purposive sampling approach
II. Financial Literacy and Consumer Awareness
What is the target market’s understanding and perception of insurance?What is their level of financial literacy?What is the level of trust expressed by clients regarding insurance?
• To help determine client education needs• To design field agent training programs (how to
explain insurance to clients)• To design marketing and communication strategies
III. Capacity to pay for insurance
What is their Ability to pay (“ATP”) and Willingness to pay (“WTP”) for microinsurance?
• To understand the level of premium that low-income households can afford and are willing to pay
• To design premium collection procedures and processes that are convenient and easily accessible for clients
IV. Distribution Mechanism for Insurance
What existing groups do they belong to? Are these groups involved in financial transactions? Who do they ‘trust’ the most to buy insurance from? What is their level of ownership and usage of mobile phones?
• To identify potential delivery systems that fit clients• To identify structures and positive features of
existing institutions that can be incorporated into insurance delivery systems

4I. INTRODUCTION
to the selection of communities according to the rural and urban populations of each area, as well as a deliberate sample according to gender of the respondent, were used in order to obtain credible comparisons within these demographics.
To accomplish the stated objectives, a local research firm implemented a set of three tools developed by the authors. The authors also trained the enumerators and focus group facilitators on each of the tools. The research tools were as follows:
• Short set of six pre-survey Focus Group Discussions (FGDs) gathered basic information about market experience with risks, their mitigation and management and provided inputs to help enhance the quantitative study.
• A quantitative household questionnaire gathered quantitative data on the four research
areas described above, and provides tangible sources of data on the knowledge, attitudes, and practices regarding insurance.
• A larger set of 32 post-survey Focus Group Discussions gathered qualitative information to help explain the results of the quantitative survey, and tested several product prototypes for interest and willingness to pay.
Figure 1 provides a summary of the full approach. It shows how the market research is intended to fit in an overall product development process and feed back into the design of prototypes. Focus groups used at the start and end are linked with the extensive household survey instrument. The following sections describe the household survey and FGD methodology in more detail.
Figure 1. Summary of Research Methodology
InstitutionalAssessment
ProductDesign
Roll Out PartnershipDevelopment
ContinuousReview
32Post-survey
FGDs
2,922HH
Surveys
6Pre-survey
FGDsMarket
Research
PilotTesting
PrototypeDesign & Testing
MicroinsuranceProduct
DevelopmentProcess
DemandReport +
Videos fromthe Field
Consists of
Results in
Informs
Inform
Follow Up By

WHAT PEOPLE WANT: INVESTIGATING INCLUSIVE INSURANCE DEMAND IN ETHIOPIA
5
Household Survey
The survey comprised respondents from 2922 households3 in the selected four regions and Addis Ababa. The survey was conducted by a local Ethiopian research firm using a three-stage cluster approach. At the first level, enumeration areas were selected by a simple random sampling approach of zones, weredas, kebeles (smallest administrative unit) and villages, based on a list used by the Ethiopian Statistical Agency. In each enumeration area, interviewers selected the households using a systematic random sampling method based on household lists provided by the local administrative units. Finally, within households, an equal number of adult male and female respondents were targeted, who may or may not be the head of household.
The survey was implemented using computer-assisted personal interview methods, in local languages, between April and May 2017. The Personal Digital Assistant technology offered several advantages, including instant data access and ‘live’ updates, efficiency by reducing data entry time, reducing human error, and time- and geo-stamps to ensure the “right” person is in the “right” place.
The full sampling framework for the survey can be found in Appendix 1, and the survey instrument is available by contacting the World Bank.
Focus Group Discussions
A total of 38 FGDs (six prior to and 32 following the household survey) composed of six to ten participants each were conducted by local researchers in local languages. All FGDs were sound-recorded to allow the researcher to focus on the discussion and allow for review afterwards to ensure no information was missed or misheard. The semi-structured discussions lasted between one and two hours depending on the composition of the group and the answers.
The groups consisted of economically engaged adults, with male and female groups conducted separately. Participants were identified in discussion with a relevant local authority and engaged voluntarily. Both urban and rural groups were conducted; in rural areas participants were almost entirely engaged in agriculture, while urban participants were a mix of self-employed, agriculture, or government employed persons. The full sampling framework is available Appendix 1.
The set of post-survey focus group discussions, in addition to discussing overall risks and coping mechanisms, also tested five different product prototypes. High level prototypes were developed based on the results of the household survey and included crop insurance in case of drought, livestock insurance in case of death of animal for any cause, a hospital cash product, a simple term life product, and a fire policy covering home or business property. To avoid confusion or bias, each FGD only tested one of the five products.
3 Details on the methodology for establishing sample size provided in Appendix 1.

66ACKNOWLEDGMENTS

7
II. SUMMARY CHARACTERISTICS OF HOUSEHOLDS SURVEYED
WHAT PEOPLE WANT: INVESTIGATING INCLUSIVE INSURANCE DEMAND IN ETHIOPIA
7
Geographical Scope4
The research was conducted in the regions of Amhara, Oromia, Tigray, and SNNPR, as well as in Addis Ababa; together these regions account for almost 90% of the population of Ethiopia.5 In each region, a 50% split between urban and rural households (HH) was
selected, such that together with 100% urban Addis Ababa, the overall sample was 37% rural and 63% urban. Figure 2 provides an overview of the geographic scope of the study.
4 Details of geographical scope in Appendix 1. 5 See Table 15 in Appendix 1 for population details by region.
Figure 2. Georgraphical Scope of the Study
FINANCE, COMPETITIVENESS & INNOVATION INSIGHT | LONG-TERM FINANCE
5 Regions
16 Zones
31 Woredas
59 Kebeles
2,922 Household Surveyed
50 Households Surveyed per Kebele on Average
13,088 Household Members
37% of Households Are Rural
8II. SUMMARY CHARACTERISTICS OF HOUSEHOLDS SURVEYED
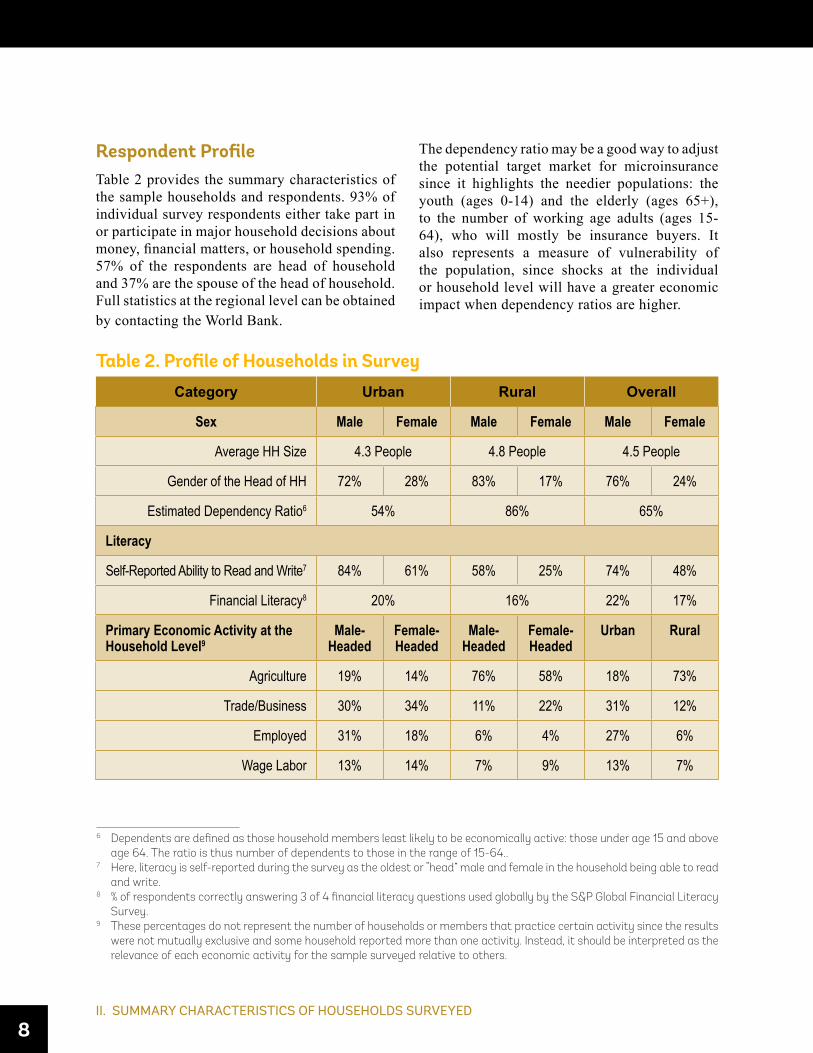
Respondent ProfileTable 2 provides the summary characteristics of the sample households and respondents. 93% of individual survey respondents either take part in or participate in major household decisions about money, financial matters, or household spending. 57% of the respondents are head of household and 37% are the spouse of the head of household. Full statistics at the regional level can be obtained by contacting the World Bank.
The dependency ratio may be a good way to adjust the potential target market for microinsurance since it highlights the needier populations: the youth (ages 0-14) and the elderly (ages 65+), to the number of working age adults (ages 15-64), who will mostly be insurance buyers. It also represents a measure of vulnerability of the population, since shocks at the individual or household level will have a greater economic impact when dependency ratios are higher.
Table 2. Profile of Households in SurveyCategory Urban Rural Overall
Sex Male Female Male Female Male Female
Average HH Size 4.3 People 4.8 People 4.5 People
Gender of the Head of HH 72% 28% 83% 17% 76% 24%
Estimated Dependency Ratio6 54% 86% 65%
Literacy
Self-Reported Ability to Read and Write7 84% 61% 58% 25% 74% 48%
Financial Literacy8 20% 16% 22% 17%
Primary Economic Activity at the Household Level9
Male-Headed
Female-Headed
Male-Headed
Female-Headed
Urban Rural
Agriculture 19% 14% 76% 58% 18% 73%
Trade/Business 30% 34% 11% 22% 31% 12%
Employed 31% 18% 6% 4% 27% 6%
Wage Labor 13% 14% 7% 9% 13% 7%
6 Dependents are defined as those household members least likely to be economically active: those under age 15 and above age 64. The ratio is thus number of dependents to those in the range of 15-64..
7 Here, literacy is self-reported during the survey as the oldest or “head” male and female in the household being able to read and write.
8 % of respondents correctly answering 3 of 4 financial literacy questions used globally by the S&P Global Financial Literacy Survey.
9 These percentages do not represent the number of households or members that practice certain activity since the results were not mutually exclusive and some household reported more than one activity. Instead, it should be interpreted as the relevance of each economic activity for the sample surveyed relative to others.

WHAT PEOPLE WANT: INVESTIGATING INCLUSIVE INSURANCE DEMAND IN ETHIOPIA
9
At around 20%, financial literacy of the survey sample—measured in terms of ability to correctly answer questions on 3 of 4 financial topics—is below that found by a more focused study conducted by Standard & Poor’s using the same questions, which found 32% of the Ethiopian population to be ‘financially literate’ in 2014.10 Ethiopia is comparable to other Sub-Saharan markets, such as Sudan (21%), Egypt (27%), and Uganda (34%), and not far behind Kenya (38%) and Tanzania (40%). As formal financial services are expanded to be more inclusive, providers must take care in designing informative and efficient marketing materials and procedures, as well as in the design of the product itself, building financial literacy as the market grows.
Mobile phone ownership is lower than in many other emerging markets, particularly in rural areas. Compared with some of its regional neighbors, Ethiopia has rather low mobile penetration: for example, GSMA reports that Kenya has a 78% sim penetration (number of connections compared to the total population), Sudan has 68%, Uganda 60%, and Tanzania 71%, compared to Ethiopia’s 42%.11 With 40% of rural households reporting no mobile phone, it is clear that mobile distribution will not be an immediate or complete solution for expanding inclusive insurance in contrast to the experience of a number of other African countries.
Unemployed 1% 7% 0% 0% 3% 0%
Other 6% 13% 0% 5% 8% 1%
Mobile Phone Ownership
Average # of Phones Per HH 2.1 .9 1.6
% of HHs with No Phone 9% 40% 20%
% of HHs with 1 Phone 25% 38% 30%
% of HHs with 2+ Phones 66% 22% 50%
Source of Income for Individuals
Wage Labor (Non-Agriculture, Temporary or Permanent)
56% 22% 43%
Self-Owned Business 37% 20% 24%
Agriculture 19% 92% 35%
Other (Remittance, Rent, etc.) 9% 6% 8%
10 Klapper, L., A. Lusardi, and P. van Oudheusden. Financial Literacy Around the World: Insights from the Standard and Poor’s Ratings Services Global Financial Literacy Survey. http://gflec.org/wp-content/uploads/2015/11/Finlit_paper_16_F2_sin-gles.pdf .
11 GSMA Intelligence, Country data dashboards. https://www.gsmaintelligence.com/ Data retrieved 17 October 2017.
10II. SUMMARY CHARACTERISTICS OF HOUSEHOLDS SURVEYED
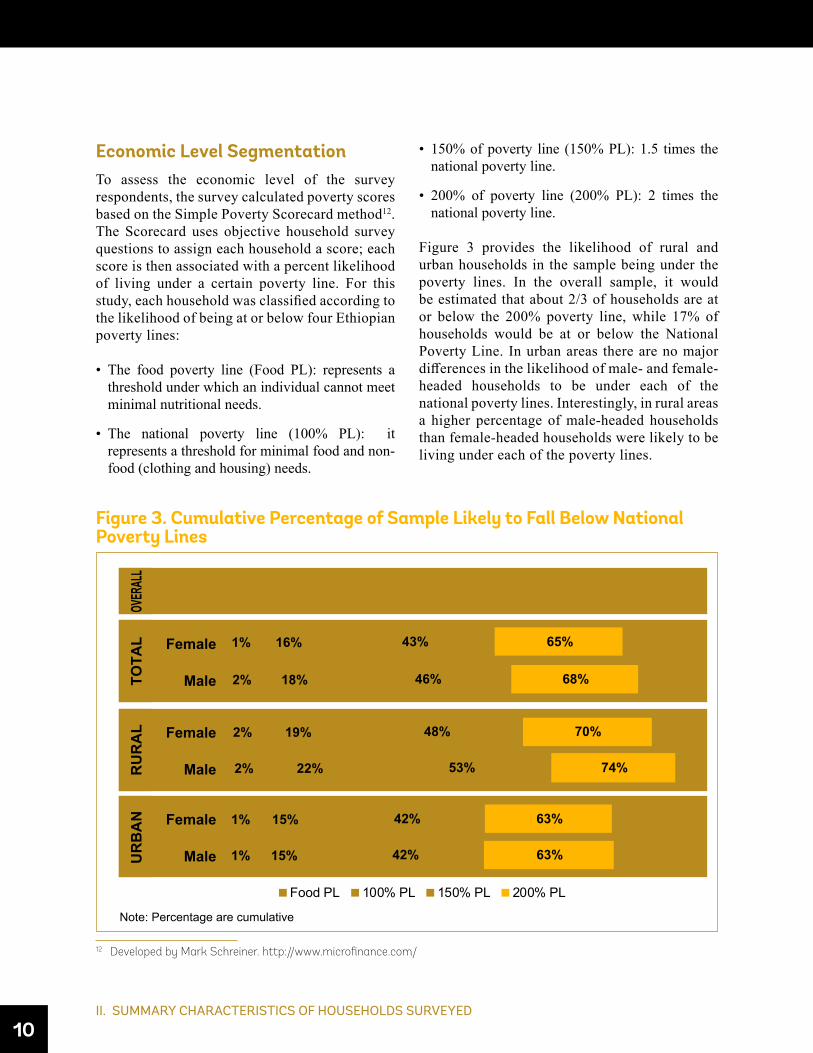
Economic Level SegmentationTo assess the economic level of the survey respondents, the survey calculated poverty scores based on the Simple Poverty Scorecard method12. The Scorecard uses objective household survey questions to assign each household a score; each score is then associated with a percent likelihood of living under a certain poverty line. For this study, each household was classified according to the likelihood of being at or below four Ethiopian poverty lines:
• The food poverty line (Food PL): represents a threshold under which an individual cannot meet minimal nutritional needs.
• The national poverty line (100% PL): it represents a threshold for minimal food and non-food (clothing and housing) needs.
• 150% of poverty line (150% PL): 1.5 times the national poverty line.
• 200% of poverty line (200% PL): 2 times the national poverty line.
Figure 3 provides the likelihood of rural and urban households in the sample being under the poverty lines. In the overall sample, it would be estimated that about 2/3 of households are at or below the 200% poverty line, while 17% of households would be at or below the National Poverty Line. In urban areas there are no major differences in the likelihood of male- and female-headed households to be under each of the national poverty lines. Interestingly, in rural areas a higher percentage of male-headed households than female-headed households were likely to be living under each of the poverty lines.
Figure 3. Cumulative Percentage of Sample Likely to Fall Below National Poverty Lines
12 Developed by Mark Schreiner. http://www.microfinance.com/
Female
RU
RA
L
Male
1%
1%
2%
2%
2%
1%
2%
15%
15%
22%
19%
18%
16%
17%
42%
42%
53%
48%
46%
43%
45%
63%
63%
74%
70%
68%
65%
67%
Food PL 100% PL 150% PL 200% PL
Female
UR
BA
N
Male
Female
TOTA
L
Male
OVER
ALL
Note: Percentage are cumulative

WHAT PEOPLE WANT: INVESTIGATING INCLUSIVE INSURANCE DEMAND IN ETHIOPIA
11
In terms of targeting a market segment for microinsurance, the low-income market could be considered as those who are just below the poverty line but not destitute (food poor), up through those who are still vulnerable to falling back below poverty (up to 200% of poverty line). For the Ethiopian market, one could loosely define this as those households above the food poverty line yet below 200% of poverty line. This represents up to 65% of households in the study.
The households’ poverty likelihood also differs depending on the primary economic activity. Households whose members work for wage labor live in households with the highest poverty levels, followed by agriculture workers (Figure 4). This situation may be influenced by the income volatility that characterizes wage labor and agriculture, compared to formal employment and trade.
Figure 4. Likelihood of Sample Under National Poverty Lines, by Primary Economic Activity
Food PL 100% PL 150% PL 200% PL
1%
1%
1%
2%
16%
15%
12%
20%
45%
43%
36%
49%
67%
64%
58%
70%
Agriculture
Trade/Business
Employed
Wage Labor
URBAN
2%
1%
1%
2%
23%
17%
10%
19%
54%
45%
32%
48%
75%
67%
53%
69%
Agriculture
Trade/Business
Employed
Wage Labor
RURAL
Food PL 100% PL 150% PL 200% PL

1212II. SUMMARY CHARACTERISTICS OF HOUSEHOLDS SURVEYED
Key Implications – Demographic Profile• The dependency ratio (population <15 and >64 divided by those from 15 to 64 years old) is particularly high in the
rural areas. This has an impact on the development of insurance products, as products in rural areas will require consideration of more children and the aged, while at the same time households in rural areas tend to have the least disposable income for insurance. This measure of vulnerability will be particularly important in designing life, health, and personal accident products.
• Given a target market of the population above the food poverty line yet below 200% of national poverty line, the results of the study indicate that up to 65% of Ethiopian households in the five regions would fall into this segment. This suggests a simple potential market of around 65 million people.
• In the sample, as in Ethiopia generally, men are considered the heads of households. However, it becomes clear throughout this study that women have a strong impact on HH decisions. Therefore, women should be considered in product development and marketing and promotion. Additionally, it would benefit insurers to have some products and services that are focused specifically on the women’s market.
• Throughout the emerging markets, mobile phones are seen as the answer to many distribution problems and to quickly reaching scale (whether this is correct or not is for another study). In urban areas in Ethiopia, HH ownership of at least one phone is about 90%, while in the rural areas, it is 60%. In developing products in Ethiopia, it is important to consider that products with processes or services tied to mobile phones automatically excludes about 20% of the total potential market. Given the low financial literacy, it is not considered that mobile platforms could have large scale but may be suitable for a certain sub-set of the population.

13
III. FINANCIAL BEHAVIOR
WHAT PEOPLE WANT: INVESTIGATING INCLUSIVE INSURANCE DEMAND IN ETHIOPIA
13
FINANCE, COMPETITIVENESS & INNOVATION INSIGHT | LONG-TERM FINANCE
Understanding households’ current use and perceptions of financial tools can be useful in determining how insurance can fill in a gap or complement households’ current portfolio of strategies, as well as provide insights for marketing and positioning insurance products.
Savings
13 The exchange rate used throughout this study is USD 1 = ETB 22.1, the interbank exchange rate at the time of the data collection in March 2017 (oanda.com).
Figure 5. Proportion of Households Reporting Saving for Future Expenses
The majority of households do not have adequate savings; they save infrequently, if at all, and often have low balances when they do save. 52% of the surveyed individuals live in a household with a formal savings account, with significantly more households in urban areas having an account (63%) than rural households (35%), and a higher percentage of male-headed households (54%) than female-headed households (46%) reporting account ownership. Only 7% of households reported regular saving, and having an account does not guarantee saving: more than half of households do not save at all, including 10% of those households that have a formal account. Figure 5 shows the proportion of rural and urban households saving at various frequencies.
For those that do manage to save, balances are low, with most households having a current balance of up to USD 300 (ETB 663013) (Figure 6). On average, households that do save had set aside USD 330 (ETB 7785) for future expenses, with urban households having saved more (USD 448 / ETB 9900) than rural households (USD 149 / ETB 3300) at the time of interviewing. Gender differences in savings balances were smaller than differences by urban / rural, with male-headed households reporting balances of about USD 363 (ETB 8,020) and female-headed households reporting almost USD 315 (ETB 6,935). It should also be noted that of the households who reported saving for future expenses, more than a third of respondents did not know how much savings they currently had accumulated.
9% 11%
31%47%
3% 7%22%
68%
Yes, Often NoYes, ButVery Rarely
Yes, But Infrequentlyor Sporadically
(All HH, Regardless of Whether They Have Formal Savings Accounts)
Urban Rural

14III. FINANCIAL BEHAVIOR
Savings are important because they are often the first layer of protection in the event of a financial shock. As we will see in Section 5 of this paper, using savings and cash-on-hand were the first and most common strategies used by households that faced a shock. Given the savings behavior and balances reported to the survey, it is not surprising that many repondents reported that their coping strategies were insufficient to recover from an adverse event.
BorrowingSources of credit are accessible to most households, and more than half have made use of one or more sources of credit in the last five years. Half of all surveyed households borrowed some money in the last five years, generally consistent
Figure 6. Amount Saved (USD), Urban and Rural
across gender, with a higher percentage of female-headed households (55%) than male-headed (49%) reporting taking a loan. Urban and rural borrowing was also generally similar (51% of urban households and 47% of rural households reported borrowing), though the sources of the financing between the two groups is quite different, with urban households being much more likely to borrow from a bank. Figure 7 shows the most common sources of credit for urban and rural households. Other sources such as cooperatives, moneylenders, and MFIs were each used by less than 3% of households. Constraints to credit seem to be limited, at least in perception: For those who did not borrow, just 31% reported a form of constraint as the reason: either prohibitive cost, inability to get a loan from a financial institution, or not wanting to bother family and friends (Figure 8).
Figure 7. Percentage of Households Borrowing from Various Sources in the Last 5 Years
Figure 8. Primary Reasons Households Do Not Borrow
0%
5%
10%
15%
20%
25%
Banks SACCOs Friendsand Family
Other
Urban Rural
% of HH’s Reporting Balances in the Given Ranges
40%
62%
14%
15%
15%
11%
3%
2%
9%
5%
19%
6%
Urban
Rural
USD 0-100 101-200 401-500 >500201-300 301-400
12%7%
4%
9%
16%
52%
FIs Will NotLend to Me
Cost Is TooHigh
No Need
Other/Don’t Know
Do Not Believein Loans
Do Not Want toBother Friends & Family

WHAT PEOPLE WANT: INVESTIGATING INCLUSIVE INSURANCE DEMAND IN ETHIOPIA
15
InsuranceInsurance experience and knowledge is very low; thus, rather than having negative preconceptions about insurance that are found in many markets, Ethiopians are open to learning more about insurance. Just 15% of urban households and 18% of rural households had some prior insurance experience. In urban households, the most common type of insurance was government-sponsored health insurance and motor third-party liability; in rural areas respondents were mainly familiar with the government health insurance and funeral insurance. Of those with insurance, 30% were unaware of the premium amount.
The primary reasons households have not had insurance are information-related (Figure 9). In rural areas, most households are unaware of insurance, with 62% of respondents reporting that they have never heard of insurance before (compared to 42% of urban respondents). Insurance-related
reasons were far less common, because so few had experienced insurance – for example less than 6% said that insurance is too complicated, and hardly anyone indicated a lack of need or a lack of trust. This is positive for insurers and other stakeholders, as a lack of knowledge is easier to address than negative attitudes and inaccurate pre-conceptions.
For those respondents who had heard of insurance prior to the survey, perceptions indicate a general openness and need for insurance. Responses to a series of agree / disagree statements indicate that up to 70% see a need for, or usefulness of, insurance. Interestingly, there was little difference in perception between male and female respondents. Women were slightly more likely to respond with ‘Don’t know’ but the overall distribution of opinion was generally the same.
Figure 33 in Appendix 2 provides the full set of questions and answers regarding perceptions of insurance.
Figure 9. Reasons for Not Having Insurance
0%
1%
6%
6%
14%
25%
41%
49%
0% 10% 20% 30% 40% 50%
Don't Trust Insurers
Don't Need Insurance
Too Expensive
It’s Complicated Or Inconvenient
Don't Know
Don't Know Where To Find It
Not Enough Info/ Not Sure How It Works
Never Heard of Insurance
InformationRelatedReasons
InsuranceRelatedReasons

16III. FINANCIAL BEHAVIOR
Informal insurance - EdirsThe Edir (see Box 1) is a common informal insurance mechanism that mainly provides support in the case of death of family members. Among the respondents, 79% of households belong to an Edir, with no significant difference by region, gender of household head, or between urban and rural areas. Survey responses indicate, however, that the primary value of membership may be social, and the financial value is perceived as insufficient to provide full protection in the event of the death of a family member, leaving room for insurance to play a complementary role.
For most respondents, the primary reasons for being part of an Edir are social rather than financial (Figure 10), and the amounts provided in the event of a death tend to be minimal (Figure 11). This corresponds with responses regarding the financial value that an Edir provides in the event of a death of a family member. Most participants agreed that in the case of death of an immediate family member, the amount of money provided by the Edir is very limited (Figure 11). In fact, 83% of respondents said the proceeds from their Edir would provide only up to about 25% of total costs.
Despite the low amounts, this regular setting aside of funds for a risk event is the precursor to an insurance culture, and indicates that households do have some cash available to pay for ex-ante risk management. The clear majority of households reported monthly contributions of up to USD 0.50 (ETB 11) as shown in Figure 12. Very few rural households contribute more than this, while more urban households contribute in the range of USD 0.50 to 1.00 (ETB 11 - 22) and USD 1.00 to 1.50 (ETB 22 - 33) per month.
Box 1. Edirs As Informal Insurance
EDIRS – Informal Insurance In Ethiopia
Edirs are traditional community groups whose members assist each other socially and financially when adverse events occur, primarily in case of a family member’s death. Participants typically make monthly contributions and receive a payout to cover a portion of funeral and other related expenses. This payout will vary based on how close the deceased was to the Edir members. Edirs may provide monetary or in-kind benefits.
Figure 10. Primary Reason for Edir Membership
Figure 11. Sufficiency of Edir Payouts
About 75%of Costs
More Than 75% of Costs
Provides AToken Amount
About 25%of Costs
About 50% of Costs
50%33%
13%
3% 1%
Contributeto My
Community
ReceiveAssistance
with FinancialBurden
SocialBenefits/
Expectations
ReceiveSupport forEmotional
Burden
Urban Rural
39%43% 43%
37%
13% 12%7%
4%

WHAT PEOPLE WANT: INVESTIGATING INCLUSIVE INSURANCE DEMAND IN ETHIOPIA
17
In exchange for these contributions, members receive relatively little in financial benefits in the event of death of a close family member. More than 70% of
Figure 12. Monthly Contribution Amounts (USD) - Urban and Rural HHs
rural respondents and 60% of urban respondents said they would expect to receive up to USD 50 (ETB 1105) (Figure 13).
Figure 13. Expected Edir Payout in Event of Death of Close Family Member (USD)
Key Implications - Financial Behaviors• Infrequent saving and low balances leave households vulnerable in case of a shock, leaving a need and opportunity
for insurance.
• Credit seems to be available from multiple sources and widely used; there may be additional opportunities for bundling insurance with credit
• Insurance knowledge is low and any insurance products will require an educational marketing effort. However, negative bias is very low, which is positive for insurers, as they can start with a blank slate rather than trying to overcome bias against insurance as is common in other countries.
• Despite low formal insurance knowledge, Ethiopians have a strong informal insurance culture through Edirs. While the financial coverage provided by Edirs is insufficient, the practice of risk-pooling can possibly be leveraged and the coverage complemented by formal insurance.
Urban Rural
0100200300400500600700
No.
of H
ouse
hold
s
Monthly Contribution Amount 0.00-0.50 0.51-1.00 1.01-1.51 1.51-2.00 2.01-2.50 >2.50
584 597
882
8652
959
16379
401
Urban
Rural
USD 0-25 26-50 101-125 >12551-75 76-100
% of HH’s Reporting Expected Payouts in the Given Ranges
27%
48%
32%
23%
11%
12%
9%
8%
2%
2%
20%
6%

1818ACKNOWLEDGMENTS

19
IV. RISKS AND RISK MANAGEMENT
WHAT PEOPLE WANT: INVESTIGATING INCLUSIVE INSURANCE DEMAND IN ETHIOPIA
19
Risk Events Experienced by Survey Respondents
Survey respondents reported experiencing several shock events in the year prior to the survey. Most common were health incidents, with 32% of households reporting at least one serious illness / health event. Of those households with agriculture as a primary source of
income, 56% reported significant loss of crop or livestock.14 Almost 7% of all households reported a death in the family. Significant property loss was reported by about 3% of households. For those who experienced these events, varying levels of financial hardship and the ability to recover were reported, as shown in Figure 14 based on rural and urban responses.
Figure 14. Experience of Shock Events as Reported by Survey Respondents
14 A severe drought and poor temporal distribution of rainfall in the Horn of Africa at the end of 2016 affected southern and eastern Ethiopia, including some of the survey areas. (Source: FEWSNET East Africa Special Report February 3, 2017)
% of Affected HHs Reporting Moderate to Great Hardship
% of All HHs ExperiencingShock in Prior Year
% of Affected HHs Reporting Inability to Recover from Shock
53%
96%
65%
88% 93%
29%
64%
44% 42% 47%28%
1%7%
17%
53%
Illness in theFamily
Damage/ Lossof Property
Death inthe Family
Illness/ Deathof Livestock
Crop Loss/Damage
0
10
20
30
40
50
60
0
20
40
60
80
100
120
Illness in theFamily
Damage/ Lossof Property
Death inthe Family
0
10
20
30
40
50
60
0
20
40
60
80
100
120
53%
86%
61%
24%37% 37%
34%
4% 7%
Urban
RuralPe
rcen
t of A
ll H
HS
Perc
ent o
f All
HH
S
Perc
ent o
f Affe
cted
HH
SPe
rcen
t of A
ffect
ed H
HS
FINANCE, COMPETITIVENESS & INNOVATION INSIGHT | LONG-TERM FINANCE

20IV. RISKS AND RISK MANAGEMENT
Risk Events Experienced by Survey RespondentsSurvey respondents reported experiencing several shock events in the year prior to the survey. Most common were health incidents, with 32% of households reporting at least one serious illness / health event. Of those households with
agriculture as a primary source of income, 56% reported significant loss of crop or livestock. Almost 7% of all households reported a death in the family. Significant property loss was reported by about 3% of households. For those who experienced these events, varying levels of financial hardship and the ability to recover were reported, as shown in Figure 14 based on rural and urban responses.
Figure 15. Example Risk Ranking Cards – Focus Group Discussions
Figure 16. Risk Ranking According to Three Factors (FGDs)
3
0
5
10
15
20
25
30
35
40
45
Illness in
the Fam
ily
Crop Los
s/Damage
Illness/D
eath of L
ivestock
Death in th
e Family
Damage/Los
s of Prope
rty
Transpo
rt Accident
Illness in
the Fam
ily
Crop Los
s/Damage
Illness/D
eath of L
ivestock
Death in th
e Family
Damage/Los
s of Prope
rty
Transpo
rt Accident
Fact
or S
core
- N
o. o
f Par
ticip
ants
Ran
king
Ris
k in
Top
3
42
32
1115
2226
30
20
12 1113
3336
22
14
5
1339
143
42
0
20
40
60
80
100
120
140
160
119
3931
3041
117134
88
5948
101100
44
61
90
144143
Likelihood WorryFinancial Impact
Urban Rural

WHAT PEOPLE WANT: INVESTIGATING INCLUSIVE INSURANCE DEMAND IN ETHIOPIA
21
Risk Ranking by Focus GroupsHealth risks, crop loss, and transport accidents were the most important risks according to focus group participants. While the survey data shows actual experience with shock events, the focus group discussions centered around people’s perceptions of risk in terms of severity, likelihood of happening in the next year, and the level of worry that they cause. Participants were asked to rank each risk based on these factors, and then collectively rank them according to overall importance. Figure 15 shows an example of the risk-ranking cards – individual dots represent participants’ selection of that risk being significant in terms of likelihood (green), impact (yellow), and level of worry (red), while Figure 16 provides the rankings for each risk for rural groups.
Health Risks
Health risks ranked highly for both men and women, in urban as well as rural areas. Participants ranked health risks highly on all three factors.
• Highly likely: households are likely to have some member of the family fall ill. Rural groups brought up climate and weather issues as top of mind for causing health shocks, while urban groups discussed poor sanitary conditions, particularly in squatter settlements, as the key risk. Both groups discussed the nature of shocks often having a cascading effect, with outbreaks affecting several family or community members at once. This high perceived likelihood matches well with actual experiences reported to the household survey, with almost a third of households reporting one or more health incidents in the last year.
• High financial impact, leading to potentially high costs: According to participants, health shocks can lead to the largest cumulative loss of money, primarily because it can prevent family members from working for long periods, resulting in lost income. Thus, even if they do not face treatment costs, they still have costs due to lost opportunities. Participants noted that health risks incur both direct and indirect costs, which may
need to be financed by selling productive assets. Several groups indicated that illness is a concern because they are often left untreated due to lack of affordability of medicine / treatment. The high ranking on the cost factor is slightly less aligned with the experiences reported to the survey: the clear majority of the respondents reported relatively low out-of-pocket costs (<USD 100 or ETB 2210), and it had the lowest response on financial hardship, with just over half reporting moderate or great financial hardship.
• Very worrisome: Illness is feared because if left untreated it exposes people to the risk of death. Several groups mentioned a fear of disease outbreaks, which could ultimately lead to the death of many people at one time.
The ‘worst case scenarios’ of potentially very expensive treatment, lengthy periods of inability to work, and outbreaks seem to be driving participants’ concern about this risk, and therefore many groups have ranked it as the top risk.
Crop Risks
Crop loss was by far the biggest concern in rural areas, because crops are not only the primary source of income, but they also are fundamental to the overall health of the household, both its people and livestock. More than 75% of the rural groups ranked the loss of crops as the most important risk, as its consequences if it happens are devastating.
• Likelihood of losing crops is high because there are numerous perils: Participants noted several perils that can affect their crop, primarily drought and disease, but also pests.
“Although the problem is high, there are also people who do not go to health centres due
to lack of money for the medication” (FGD participant)

22IV. RISKS AND RISK MANAGEMENT
• Very high financial impact. Participants noted that it is a double loss because of the sunk costs of seeds and fertilizer, as well as the loss of the expected output. For rural households, crops are often their primary source of livelihood; thus, losses have serious consequences. According to one participant, “if there is no crop, there is no existence for us.” Indeed, the survey data supports this: 75% of households experiencing a crop shock reported losses of at least 50% of their normal year income, and 93% reported moderate to great financial hardship.
• People worry about not having food. Losing their crops is the most worrisome event that could happen. Such a loss not only means lost income and investment, but also, for so many people, it is the primary source of food for the household. Many rural groups ranked crop loss ahead of illness, because they see crops as a primary contributor to good health. If there is crop loss, there is a shortage of food which also results in illness in a family and associated medical costs. And if there were no crops, there is no income, and thus no money to pay for medical treatment. Crops also serve as food for livestock, which are essential assets for the households.
Transport Accidents
Transport accidents are particularly worrisome for urban respondents.
• Transport accidents are perceived as highly likely, largely due to their visibility when they occur. Participants cited increased construction and truck traffic as causing accidents, as well as drivers not giving priority to pedestrians as primary reasons.
• The financial impact is potentially high, as accidents can affect income (not being able to work), lead to death (potentially of many people at once), and can cause property loss (of vehicle, inventory, etc.). However, one group did mention that third party motor insurance should cover the costs of an accident for most people.
• People worry because accidents happen randomly. Participants also mentioned that they often affect children and the elderly.
Death Risks
A death in the family was ranked lower by most groups, noting that people feel relatively well prepared to cope with the financial aspects.
• The likelihood of death was positioned relatively low compared to other risks, though of course accepted as an eventuality. Rather, some of the other risks – crop loss, accidents, and illness – are deemed by the participants as more likely to happen and were seen as potential causes of death, and therefore participants noted that they should be addressed first.
• Financial impact of death is perceived as relatively low due to the culture of community assistance for funerals. The financial impact of a death was not seen as important, because people prepare in advance through Edir and other community contribution schemes. Families still spend money but it is not as stressful as the other risks. The participants views on this are interesting in context of the survey results: in part 3 of this paper, it was shown that more than 80% of respondents who had deaths in their families over the years experienced that Edirs cover up to 25% of funeral expenses or
“If there is no crop, there is no existence for us.” (FGD participant)
“Hunger does not have medication, which makes crop loss the most worrisome.”
(FGD participant)
“Due to the high incidence of accidents in our area especially those of traffic accidents, we always fear for our families and ourselves.”
(FGD participant)

WHAT PEOPLE WANT: INVESTIGATING INCLUSIVE INSURANCE DEMAND IN ETHIOPIA
23
less. Also, for those that experienced a death in the last year, 2/3 reported moderate to great hardships, and just under half have not yet been able to sufficiently recover.
• The biggest worry for people in terms of death is losing a main breadwinner or head of household.
Livestock Risks
As with crop loss, losing livestock is a high-ranking risk in the rural areas due to their contribution to the households’ livelihoods. The likelihood of experiencing livestock loss is high because of the nature of communicable diseases that affect them, and they are also affected by some of the same weather risks as the crops. Livestock was seen as having a less severe financial impact because participants have some coping mechanisms / adaptations available for certain perils. For example, in case of drought, farmers can buy feed from other areas or move animals. Also, rather than being a primary source of income, participants mentioned that livestock raising was more of a secondary income, or rather used as an input to crop production (such as oxen ploughing fields).
Other Property Risks
Property loss (home or business) was less at the forefront of participants’ minds in terms of risks in rural areas, and ranked third in urban areas. Loss of property is considered less likely to occur, though transport accidents and floods were listed as a proximate cause. The financial impact was mentioned as potentially very high; the data from the survey show that those who experience a property loss had a difficult time recovering: just 58% managed to sufficiently cope, while 88% reported a moderate to great financial hardship. The biggest worry and amount of discussion from participants relating to property loss was around forced displacement.
Summary of Risk Ranking
Table 3 below provides the overall summary of risk ranking by gender and location of the FGDs. There is little difference by gender, but unsurprisingly there is a large difference by geography, with rural participants prioritizing crops and livestock related risks.
Table 3. Overall Risk Ranking by Focus GroupsUrban Rural
Rank Women Men Women Men
1 Transport Illness Crop Crop
2 Illness Transport Accident Illness Livestock
3 Property Property Livestock Illness
4 Death Death Property Death
5 Crop Displacement Death Property

2424IV. RISKS AND RISK MANAGEMENT
Key Implications – Risks and Risk Management• In the rural areas people worry the most about their crops and the health of their family members
• Perils and risks are viewed as intertwined (for example, loss of crops can lead to illness because nourishment is lacking, or accidents can lead to death, etc.). This has implications for positioning of insurance products: protect one asset (crops) and you protect against a chain of events.
• The financial implications of death in the household are perhaps underestimated by people because of the culture of community support surrounding deaths. Any life insurance products will have to be carefully positioned in the context of current informal coping mechanisms.
• Health is ranked either first or second and if a well-designed product is implemented, then there is likely to be a significant market potential for such cover.

25
V. SPECIFIC RISK EVENTS, COSTS, AND COPING
WHAT PEOPLE WANT: INVESTIGATING INCLUSIVE INSURANCE DEMAND IN ETHIOPIA
25
FINANCE, COMPETITIVENESS & INNOVATION INSIGHT | LONG-TERM FINANCE
Both the household survey and the focus group discussions asked respondents about experiences with several potentially insurable risks. Respondents provided detailed information regarding the events that occurred, the costs / losses that they experienced, and how they coped with
them. The specific risks include: health shocks, agriculture shocks (crop and livestock), death, and property shocks (loss of home or business). The focus group discussions also included a simple prototype test to gauge interest in a possible insurance product solution. Experiences with three of the risks – crop loss, death, and health shocks – are described in the following sections, concluding with product-specific design implications for insurance.
Agricultural Risk Events In rural areas, crop losses were the most frequently reported to the survey, and were by far the biggest concern of FGD participants, due to their significance to household livelihood and overall well-being. There is clearly a demand for agricultural risk management and risk coping products, and insurance, if well-designed, may play an important role. The agricultural risk analysis focuses on rural households in Amhara, Oromia, SNNPR and Tigray. Addis Ababa and urban areas of the regions have not been included.
Context – Agricultural Practices
Of the households surveyed that experience agricultural production risk, 85% use some type of agricultural inputs such as improved seeds, fertilizers, and pesticides as part of their regular farming practices. Across regions there are no significant differences in whether or not households use any type of acquired inputs. This high utilization rate suggests that input suppliers could act as a potential distribution channel for insurance. Focus group participants suggested that households may not be able to afford enough pesticides to control diseases and pests, which require constant treatment over long periods of time. This is an important consideration when designing an insurance product as it could lead to a moral hazard - farmers may elect to skip expensive pesticides because they are protected from the potential loss.
The difference in timing of cash inflows and outflows may affect timing of potential premium payments for insurance. The need for inputs may put farmers in a liquidity constrained position. Inputs are primarily bought at a time which does not align with when the household earns the most money from agricultural sales. This mismatch affects the possibility of premium collection at the store since in the periods where input purchases are necessary, the households’ available income to buy insurance would be more restricted than if it were during the periods when the farmers receive most money from sales.
More than half of households say they have sufficient income to cover the next production cycle, yet less than 10% indicate they fully save specifically for the next production cycle. 55% of households obtain all the money needed to produce for the next season from selling products, but only 9% save enough for the next production cycle, and 34% say they do not save at all. Female-headed households are less likely to save for future production than those headed by men: 52% of female-headed households do not save at all for the next production cycle, in contrast to 31% of male-headed households. This could be an important input for how to market and target agricultural insurance products.

26V. SPECIFIC RISK EVENTS, COSTS, AND COPING
Agriculture Risk ExperienceOverall, 56% of rural households experienced some loss, either of crops or livestock, during the last year. The most common causes of crop loss are climate related: drought, untimely rainfall or excess of rain. Other considerable threats are related to rodents, birds, pests and disease. Overall, focus group participants supported the survey, citing drought and flood as the most devastating events due to frequency, inability to prepare for the shock, and financial impact - a drought or flood could destroy 50%-100% of the harvest.
Even though households are more likely to lose crops than livestock, and that this may be more devastating, the focus group discussions implied that the health of animals is important to farmers because the loss of livestock will prevent them from undertaking farming activities (animals are key for the farming process, especially for plowing). In this sense, designing an agricultural product to cover for crop losses without covering one of the main agricultural inputs – livestock – may result in an important coverage gap. The most common reported causes of a livestock loss event were disease (68%) and weather-related events (27%).
Types and Amounts of Costs Experienced
Costs faced due to crop loss are tangible and intangible, as reported by the survey and by FGD participants. FGDs discussed the cost of not having enough food, thus either compromising health or requiring a cash outlay to purchase food that would have been grown. There is also a loss of the investment in agricultural inputs, which are often purchased on credit. And most tangibly, as measured by the survey, there is the loss in potential income from the sale of the crops.
Similarly, in case of loss of livestock, there is a multiplier effect: respondents report lost potential income from selling the livestock later on, lost potential income from the regular sale of livestock products such as eggs or milk, and the actual cost of replacing the animal (which is likely to be younger and possibly not producing the regular products, or not strong enough for the labor needs). There are also less tangible opportunity costs of losing an input to farm labor, such as oxen that would help with crops.
For those who reported a crop loss to the survey, the average income dropped from USD 323 (ETB 7,150) in a normal year to USD 123 (ETB 2,720) in a shock year, a loss of 62%. Figure 17 shows
Table 4. Household Agricultural Cash ManagementYes Some None
Sufficient Income for Next Production 55% 36% 9%
Saves for Next Production 9% 57% 34%
Figure 17. Distribution of Households’ Crop Income in Normal Years and Shock Years (USD)
NormalYear
ShockYear
USD 0-100 101-200 401-500 501-600201-300 301-400
12%
62%
23%
20%
24%
11%
14%
3%
11%
1%
4%
1%
11%
2%
501-600
% of HHs Reporting Income In The Given Ranges
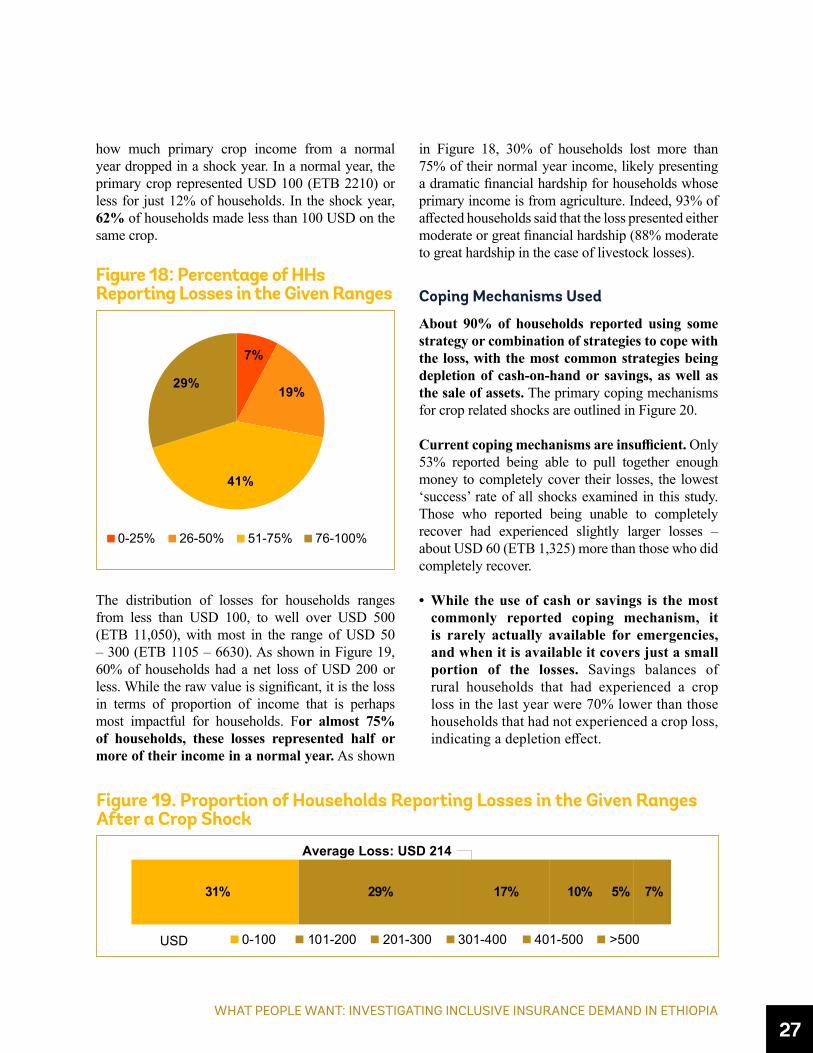
WHAT PEOPLE WANT: INVESTIGATING INCLUSIVE INSURANCE DEMAND IN ETHIOPIA
27
how much primary crop income from a normal year dropped in a shock year. In a normal year, the primary crop represented USD 100 (ETB 2210) or less for just 12% of households. In the shock year, 62% of households made less than 100 USD on the same crop.
Figure 18: Percentage of HHs Reporting Losses in the Given Ranges
Figure 19. Proportion of Households Reporting Losses in the Given Ranges After a Crop Shock
The distribution of losses for households ranges from less than USD 100, to well over USD 500 (ETB 11,050), with most in the range of USD 50 – 300 (ETB 1105 – 6630). As shown in Figure 19, 60% of households had a net loss of USD 200 or less. While the raw value is significant, it is the loss in terms of proportion of income that is perhaps most impactful for households. For almost 75% of households, these losses represented half or more of their income in a normal year. As shown
in Figure 18, 30% of households lost more than 75% of their normal year income, likely presenting a dramatic financial hardship for households whose primary income is from agriculture. Indeed, 93% of affected households said that the loss presented either moderate or great financial hardship (88% moderate to great hardship in the case of livestock losses).
Coping Mechanisms Used
About 90% of households reported using some strategy or combination of strategies to cope with the loss, with the most common strategies being depletion of cash-on-hand or savings, as well as the sale of assets. The primary coping mechanisms for crop related shocks are outlined in Figure 20.
Current coping mechanisms are insufficient. Only 53% reported being able to pull together enough money to completely cover their losses, the lowest ‘success’ rate of all shocks examined in this study. Those who reported being unable to completely recover had experienced slightly larger losses – about USD 60 (ETB 1,325) more than those who did completely recover.
• While the use of cash or savings is the most commonly reported coping mechanism, it is rarely actually available for emergencies, and when it is available it covers just a small portion of the losses. Savings balances of rural households that had experienced a crop loss in the last year were 70% lower than those households that had not experienced a crop loss, indicating a depletion effect.
0-25% 26-50% 76-100%51-75%
7%
19%
41%
29%
Average Loss: USD 214
USD 0-100 101-200 401-500 >500201-300 301-400
31% 29% 17% 10% 5% 7%

28V. SPECIFIC RISK EVENTS, COSTS, AND COPING
• Agricultural losses (crop or livestock) were the only risk for which government assistance was reported as a significant coping mechanism. It seems to be a more effective strategy for some people, as a higher percentage of the households that received assistance could recover – almost 75%, compared to 53% of crop shocks overall.
• Selling assets was also a main strategy listed by the participants who experienced crop losses. It is an accessible and preferred strategy for many people because they would rather use their own assets than ask someone for a loan or help. However, they recognize that selling productive assets such as oxen is difficult to do as it has an impact on future income as well, and indeed the use of asset sales as a coping mechanism was very low for those who had experienced a loss of livestock.
• Assistance from family and friends is typically limited in cases of crop shocks, as often the shock event has impacted other households in the area as well, such as in the case of weather-related shocks or disease outbreaks. Formal loans from banks are typically not available, while migration to find another job was indicated as a strategy of last resort.
Response to Product Prototypes
In order to gauge possible interest in an insurance solution to better manage crop losses, a simple crop insurance product prototype was presented during focus group discussions. The prototype is shown in Box 2; maize was the crop chosen by participants in most cases, to be protected against loss due to drought. Participants were asked for feedback on premiums that they would be willing to pay, product value, and other details like payment frequency and preferred channels to pay premiums and collect the payouts of the insurance.
Most focus group participants saw great value in a proposed crop insurance product, as it would allow them to replace lost income and buy inputs for the next crop cycle. Table 5 below provides key responses on various product features.
Most participants (97%) indicated they would buy the product if it were available to them, but some groups felt it was not affordable: on average, participants were willing to pay just 3%-4% of the sum insured per year. Participants were asked the premium amount that they would be willing to
Figure 20. Coping Mechanism Used to Cope with Agricultural Losses
42%
27%
20%
13%
8%
7%
7%
10%
5%
20%
3%
15%
6%
4%
16%
Cash / Savings
Selling Assets
Additional Job / Work More
Assistance from Goverment
Gifts from Family & Friends
Family and Friend Loan
Formal Loan
Reduce Consumption
Crop LossLivestock Loss
55%

WHAT PEOPLE WANT: INVESTIGATING INCLUSIVE INSURANCE DEMAND IN ETHIOPIA
29
Box 2. Crop Insurance Product PrototypesBenefits In case of Crop Failure due to DROUGHT: ETB _________
Farmer receives this fixed amount which they can request at the start, based on expected value of harvest.If there is no crop failure at the end of the season the farmer receives nothing.
What is the Cover? You have the option to insure part of the value of the crop or the full amount.
Term of Cover 1 season: 4-6 months (you can renew every season)
If I Need to Make a Claim? Option 1 (Indemnity): Farmer makes claims request, insurance company representative visits to confirm the loss and claim is paid within 1-2 months. Option 2 (Index): Insurance Company checks readings from Early Warning System or other weather station, and if it measures a Drought for your area, money is paid within 2 weeks
What If There Are Questions or Problems?
A call-in number for any questions, available any time to all who purchase
Table 5. Focus Group Feedback on Crop Insurance Product Prototype FeaturesProduct feature Responses
Benefit • Benefit amounts were chosen by participants, and ranged in value from USD 340 (ETB 7,500) to USD 680 (ETB 15,000)
• Proposed benefit amounts would be sufficient to recover from a major loss; allow replacement of income and purchase inputs for next crop cycle.
Premium Payment • Method: Banks or MFIs• Timing: Twice a year, during June-January (depending on the region)
Claim Payments • Banks and MFIs; paid within a month• Given a choice between and index-based payout and an indemnity-based
payout, participants would prefer indemnity
Overall Value “Hunger is very bad. It is main cause of illness and death of humans and livestock. Getting insurance for this is very important. It is better than selling our asset or asking loan that may not be available.”
pay for the group’s selected amount insured. Next, the participants were given choices of different percentages of the sum insured and asked for their
willingness to pay. The results are shown below in Table 6 and Table 7.

30V. SPECIFIC RISK EVENTS, COSTS, AND COPING
Health Risk Events32% of households experienced at least one major health event in the last year, and FGD participants ranked it as the most likely risk to occur and potentially one of the most impactful if it were to happen, clearly indicating a demand for insurance protection. There are many different causes of health shocks, each with its own type and volume of costs associated with it. Studies have shown that offering comprehensive health microinsurance is likely to be unsustainable without a significant subsidy.15 However, by understanding the types of costs common to all health events and the current coping mechan 42% sims and behavior, insurers and other stakeholders can find ways to offer more narrow and targeted types of coverage that complement existing health financing mechanisms, thereby providing valuable protection.
Health Risk Experience
The observed frequency of health events is slightly higher in urban areas (34% of urban HHs vs. 28% of
Product Specific Design Implications – Crop Insurance• Benefit amounts: It will be reasonable to establish the sum insured between USD 200-USD 250.
• Premium Affordability is a major challenge given most participants choose a premium rate of 5% or less. Any premium set above this will face major challenges and may need significant subsidies to make it affordable to the target client base.
• Claims payout preference was for indemnity. Any index product will face challenges in communication and understanding (besides other issues such as basis risk) for the client base. If using indemnity some efficiencies in claims validation will be needed to keep costs down.
• Premium collection preference was for a formal financial institution such as a MFI or Bank. They will likely need some handling fee or commission to be factored in the pricing.
• Scale: Given the low sum insured and premium rate, it will be very important to attain scale very quickly and efficiently to make the product sustainable.
• Other programs: It will be important to look at the lessons from other crop insurance products in the market in Ethiopia and other comparable countries.
Table 6. WTP for Crop Insurance (% of Coverage)
Seasonal Premium (% of Coverage)
No. of Participants Stating WTP (N=37)
Price 1 (15%) 2
Price 2 (10%) 3
Price 3 (5%) 4
<5% 27
Table 7. WTP for Crop Insurance (ETB)Seasonal Premium
(ETB)No. of Participants Stating WTP (N=37)
>1000 2
501 - 1000 2
100 - 500 25
<100 6
15 McCord, M., R. Koven, and B. Magnoni. “The Magical Balance – MILK Lessons Learned.” Summary presentation of the Microinsurance Learning and Knowledge Project. 2014. http://www.microinsurancecentre.org/resources/documents/busi-ness-case-for-microinsurance/the-magical-balance-milk-lessons-learned.html

WHAT PEOPLE WANT: INVESTIGATING INCLUSIVE INSURANCE DEMAND IN ETHIOPIA
31
rural HHs). This may be as a result of the social and physical environment, including densely populated areas, air quality, sanitation, infectious disease and other related characteristics of urban areas. Figure 21 shows the breakdown by type of health shock. Malaria, severe diarrheoa and tuberculosis were the most common illnesses reported.
Types and Amounts of Costs Experienced
The financial costs of health shocks extend far beyond the cost of treatment itself, and taken together have the potential to set families way behind or prevent them from even seeking care. Types of costs reported by those who experienced a health shock include:
• Diagnostic related, such as consultation fees, laboratory tests, and costs for transportation to a medical facility. For some respondents, transportation costs alone can be prohibitive. As shown in Figure 22, almost all survey respondents incurred these types of costs, though the amounts were relatively low.
• Treatment related, such as the cost of medicine, procedures at a medical facility, supplies, etc. While almost all health events incurred costs for medicine, only about 1/3 of respondents reported the other types of costs. These costs, if incurred, tend to be more expensive.
Figure 21. Occurrence by Type of Health Shock
Figure 22. Types and Amounts of Incurred Costs Reported after a Health Shock
Medicine
Average USD 42(ETB 919)
93%Consultation With
A Doctor
Average USD 23(ETB 509)
96%Lab Tests
79%Average USD 21
(ETB 466)
Other Cost@ Medical Facility
31%Average USD 63
(ETB 1,395)
Lost Incomes
31%Med USD 68(ETB 1,500)Transportation
To/FromMedical Facility
63%Average USD 23
(ETB 511)
Supplies
37%Average USD 30
(ETB 651)
Other CostAssociated w/ Illness
24%Average USD 73
(ETB 1,597)
Treatment-relatedDiagnostic-related
OpportunityCost
Proportion of HH’s Reporting Type of Expense Incurred (Average Amount, if Incurred)
ChronicIllness16%
Other SeriousIllness49%
Disability28%
Surgery7%

32V. SPECIFIC RISK EVENTS, COSTS, AND COPING
• Opportunity-costs in the form of lost income of either the sick person or a caretaker. While only reported by 31% of those who experienced a health shock, these are the highest costs reported, and can have longer-lasting effects. The cumulative effect of inability to work was one of the key worries mentioned by FGD participants when discussing illness.
By understanding the frequency and amount of these costs, insurers can identify the particular types of expenses and costs that they wish to cover, and how they can market this as being beneficial and meeting needs of clients. Differences between urban and rural households can also be targeted. For example, for rural households, the transportation costs were relatively high compared to consultation fees and tests, likely because of challenges in access to care facilities (see Box 3). Rural households also spent proportionately more on medicines, while urban respondents reported significantly higher other costs at a medical care facility, indicating that they might be electing to or able to undergo more expensive treatments that rural households do not. Alternatively,
rural people may not wish to stay at a facility any longer than absolutely necessary, and therefore opt for a treatment alternative that allows them to return home more quickly. Figure 23 provides the breakdown of the types of costs for urban and rural households.
The combined magnitude of the individual types of costs resulted in various levels of hardship for respondents; 21% of respondents indicated that the event caused great financial hardship, while another 30% indicate moderate hardship. To help quantify overall coverage requirements, Figure 25 provides the distribution of costs. For example, a benefit amount of USD 75 (ETB 1650) would cover the total costs experienced by about 75% of rural respondents and 67% of urban respondents. In less than 15% percent of cases would a much larger benefit of USD 150 (ETB 3300) or more be required, likely in the case of surgeries or chronic illnesses (Figure 24). Benefit levels may need to be tailored to urban vs. rural clients: average reported shock costs in urban areas are almost 3 times higher than in rural areas, USD 138 (ETB 2,028) for urban and USD 48 (ETB 1,061) for rural.
Figure 23. Health Shock Costs and Frequency by Urban and Rural
Rural: % of Affected Households Reporting This Type of CostRural: Avg. Amount of Cost Reported, If Incurred (USD)
Urban: % of Affected Households Reporting This Type of CostUrban: Avg. Amount of Cost Reported, If Incurred (USD)
93%
76%
95%
37%
29%
61%
24%
98%
81%
92%
37%
33%
64%
24%
26
28
24
34
29
51
42
85
28
109
Consultation with A Doctor
Lab Test
Medicine
Supplies
Cost / Savings
Transportation
Other cost At A Medical Facility
3
7
11
15

WHAT PEOPLE WANT: INVESTIGATING INCLUSIVE INSURANCE DEMAND IN ETHIOPIA
33
Box 3. Health Facility AccessAccess to facilities has an impact on the cost and use of medical care. Most respondents visit a health center when sick, as shown in the figure below; rural residents were more likely to visit a health center, and urban residents were more likely to visit a hospital.
22% of rural respondents indicated they went to two or more places for treatment, while just 12% of urban respondents sought treatment in two or more places. This indicates that some rural households may have an inefficient process of seeking care due to access challenges.
Figure 24. Average Cost by Type of Health Shock (USD)
Figure 25. Distribution of Costs Incurred by a Household During a Health Shock: Urban and Rural (USD)
Surgery Chronic Disability Other SeriousIllness
Minor Illness
464
USD 17891 78 26
0-250 251-500 >1000 126-150501-750 751-100054%
51%
59%
16%
15%
18%
8%
8%
7%
4%
4%
4%3%
2%
2%
14%
17%
8%
Overall
Urban
RuralAvg: USD 4850%: USD 18
Avg: USD 105
50%: USD 24 Avg: USD 137
50%: USD 222%2%
>150USD2%
UrbanRural
1% 3%
49%
23%1%
32%
2% 1%3% 5%
69%
20%2%
22%3% 3%
No Treatment Health Post Health Center Health Clinic Pharmacy Hospital Traditional Healer Other
76% 90% 41%36%90%
1-3 Hours By Bus40 Mins Walk 30-60 Mins By Bus30-60 Mins By Taxi17 Mins Walk
Urban ResidentsRural Residents
Health Center HospitalHospitalHealth Center

34V. SPECIFIC RISK EVENTS, COSTS, AND COPING
Coping Mechanisms Used
Insurance needs to be viewed within the context of existing coping mechanisms. 90% of households used one or more coping strategies to cover health expenses, and 20% reported not having certain strategies available when they were needed. Almost 75% reported that the coping mechanisms they used were sufficient to fully financially recover after the health shock, with rural respondents having a bit lower proportion that are able to recover (71%) than urban respondents (76%). This leaves at least 25% of the market who could use additional support, and others who may have elected to not seek treatment because of the cost. Also, despite being able to recover financially, the use of some strategies creates other types of burdens which, if used as a substitute or complement, insurance could alleviate.
Figure 26 shows the top strategies used by households after a health shock.
• Cash and savings are the preferred coping strategies for a health event, as well as gifts or loans from friends and family. According to the savings data reported by respondents, about 25% of households would have enough money to cover the average reported cost of a health shock. However, this would for many mean depleting savings. Some evidence of this may be seen (without causality or correlation): average savings balances of those households that did not report a health shock are more than 20% higher than those who did have a health shock. Insurance could divert some of the savings into premiums payments, protecting remaining savings to use for other financial goals. Focus groups indicated that for serious illnesses and for many low-income families, savings would not be sufficient.
• If savings and funds from friends and family are unavailable or insufficiently available then the household will revert to the next coping strategy, selling assets. Rural respondents were more likely to resort to selling assets than urban respondents (10% vs. 4%). Focus group participants also listed selling assets as a top strategy because it allows them to quickly raise a large amount of money. However, they mentioned that sometimes they must sell at a discount, and that often this means a long recovery period to get back to normal as they lose a productive asset.
• Loans are sometimes necessary but seen as a last resort.
Response to Product Prototypes
In order to gauge possible interest in an insurance solution to better cope with some of the costs commonly incurred in case of an illness, a simple hospital cash insurance product prototype was presented during focus group discussions. The prototype is shown in Box 4.
Most focus group participants saw some value in a proposed hospital cash insurance product which would supplement current coping mechanisms. Table 8 provides information on the responses from FGD participants to various product features.
Figure 26. Coping Strategies Used After a Health Shock
UrbanRural
3%
3%
7%
10%
20%
58%
2%
3%
4%
4%
24%
60%
Loan from SACCOBank/Moneylender
Assistance from Edir
Getting Additional Job or Working More
Selling Assets
Donations or Loanfrom Family or Friends
Cash / Savings

WHAT PEOPLE WANT: INVESTIGATING INCLUSIVE INSURANCE DEMAND IN ETHIOPIA
35
Box 4. Hospital Cash Insurance Product PrototypeBenefits In case of hospitalisation of insured person, for any reason, insured receives
ETB 300 / 500 / 750 / 1000 / 1500 for every night in hospital, up to 40 days maximum. If insured is not hospitalised they receive nothing.
Eligibility Anyone between the ages of 18 and 65
Term of cover 1 year: you can renew every year
If I need to make a claim? Easy claims request, paid within 3 weeks of the insured providing proof of hospitalisation
What if there are questions or problems?
A call-in number for any questions, available any time to all who purchase
Table 8. Focus Group Feedback on Hospital Cash Product Prototype FeaturesProduct feature Responses
Benefit Amount: • Most groups chose a daily benefit amount of ETB 750 (USD 34). Participants said this amount would allow them to visit a (public) hospital without fear of the costs – indicating behavior change effect of insurance.
• Participants said they would use the money to pay for medicine, transportation, lab tests, and other out-of-pocket fees
• Almost all groups discussed using the benefit amount to pay back loans from family and friends, banks, or other moneylenders. Participants understood that insurance money would not be awarded in advance, and therefore they would still need to acquire immediate financing for a health emergency. However, they highlighted the benefit that having insurance should unlock short-term loans – knowing that an insurance payment is coming, they should be able to get people and institutions to lend to them, at lower rates.
Premium Payment • For urban population preference was monthly with salary. For rural population preference was to pay premium after harvest.
Claims Payment • Desired period to receive the insurance payment: 1 week after filing the claim.• Convenient place to receive the benefit: community committee and formal
financial institutions (Banks, MFI’s, cooperatives, SACCO).
Eligibility • A disadvantage highlighted by almost all groups was that the insurance excludes children and elderly.
Participants in both rural and urban areas were interested in purchasing this product. Based on the actual prototype features, and the range of sums assured, the premiums that participants were willing to pay for this product are noted in Table 9 and Table 10. Participants were willing to pay from 5% to 120% of the daily benefit amount for one year of coverage, with most falling in the range of 10-50%.
On average, participants were willing to pay 52% of the daily benefit amount, per year, for
this product, or an average of ETB 35 (USD 1.6) per month. This is close to an
approximate sound premium.

36V. SPECIFIC RISK EVENTS, COSTS, AND COPING
Death Risk Events
Death Risk Experience
Although the financial risk of death was noted by FGD respondents as being limited in terms of cost, likelihood, and level of worry, nearly half of the deaths reported by survey participants over the prior one year were of people who contributed financially to the household. This loss of income to sustain the family represents both a negative impact on the stability of the household, and a verifiable opportunity for insurers to help people manage this loss. What will drive success for new products is how they respond to the various costs faced by the insured when there is a death in the family. For this we need to understand the types of risks and the financial costs of managing them when there is a death in the family.
Types and Amounts of Costs Experienced
The financial risks accompanying death, especially that of a financial contributor to the household, can result in a significant long-term shock because of the various costs. When there is a death, there are:
• Pre-death costs to cover such expenses as end-of-life medical care, and outstanding loans
Product Specific Design Implications – Health Insurance• Understanding the various components of the cost of health events can help insurers design coverage that will
resonate with potential clients. The size of the loss incurred can vary significantly. Components of three types of costs could be covered:• Diagnostic costs, including transportation to facility, consultation fees, and lab tests, were incurred by most but at
relatively low cost. For rural respondents, transportation was proportionately higher.• Treatment costs – costs to purchase medicine were experienced by almost all households and composed one of
the highest expenses for rural households; other treatment costs at a medical facility were low in frequency but high in cost when occurred, particularly for urban residents.
• Lost income – reported by a third of respondents, and the highest cost when it did occur• The perception of financial impact as expressed by FGD participants seems higher than the actual financial impact
of health shocks as reported to the survey. Many people fear a high-cost illness, but many events are manageable with existing resources. A well-designed insurance product could leverage existing strategies such as savings, and provide peace of mind.
• There are significant gaps in current coping mechanisms and no major complementary activities to manage risks were identified. • There is some apparent rationing behavior by people due to limited access to health care facilities (and cost restrictions).• Interest in a hospital cash prototype was high, with close to half of participants willing to pay a realistic premium.
Table 9. WTP for Hospital Cash Insurance (% of Coverage)
Level - % of Daily Benefit
No. of Participants Stating WTP (N=75)
5% - 10% 6
11% - 25% 19
26% - 50% 20
51% -75% 11
76% - 100% 8
More Than 100% 11
Table 10. WTP for Hospital Cash Insurance (ETB)
Monthly Premium (ETB)
No. of Participants Stating WTP (N=75)
5 - 20 33
21 - 50 29
51 - 75 4
76 - 100 9
>100 0
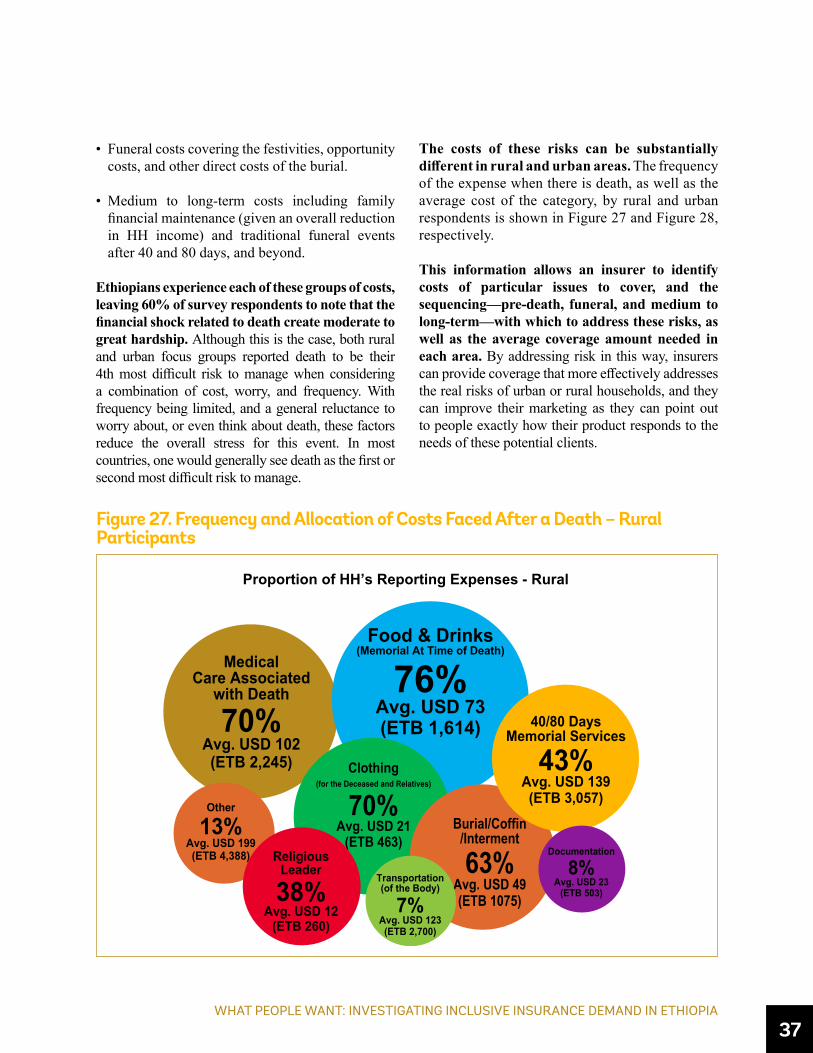
WHAT PEOPLE WANT: INVESTIGATING INCLUSIVE INSURANCE DEMAND IN ETHIOPIA
37
The costs of these risks can be substantially different in rural and urban areas. The frequency of the expense when there is death, as well as the average cost of the category, by rural and urban respondents is shown in Figure 27 and Figure 28, respectively.
This information allows an insurer to identify costs of particular issues to cover, and the sequencing—pre-death, funeral, and medium to long-term—with which to address these risks, as well as the average coverage amount needed in each area. By addressing risk in this way, insurers can provide coverage that more effectively addresses the real risks of urban or rural households, and they can improve their marketing as they can point out to people exactly how their product responds to the needs of these potential clients.
• Funeral costs covering the festivities, opportunity costs, and other direct costs of the burial.
• Medium to long-term costs including family financial maintenance (given an overall reduction in HH income) and traditional funeral events after 40 and 80 days, and beyond.
Ethiopians experience each of these groups of costs, leaving 60% of survey respondents to note that the financial shock related to death create moderate to great hardship. Although this is the case, both rural and urban focus groups reported death to be their 4th most difficult risk to manage when considering a combination of cost, worry, and frequency. With frequency being limited, and a general reluctance to worry about, or even think about death, these factors reduce the overall stress for this event. In most countries, one would generally see death as the first or second most difficult risk to manage.
Figure 27. Frequency and Allocation of Costs Faced After a Death – Rural Participants
Proportion of HH’s Reporting Expenses - Rural
MedicalCare Associated
with Death
70%Avg. USD 102(ETB 2,245)
Other
13%Avg. USD 199(ETB 4,388)
Food & Drinks(Memorial At Time of Death)
76%Avg. USD 73(ETB 1,614)
Clothing(for the Deceased and Relatives)
70%Avg. USD 21
(ETB 463)Burial/Coffin
/Interment
63%Avg. USD 49(ETB 1075)
Transportation(of the Body)
7%Avg. USD 123(ETB 2,700)
40/80 DaysMemorial Services
43%Avg. USD 139(ETB 3,057)
Documentation
8%Avg. USD 23
(ETB 503)
ReligiousLeader
38%Avg. USD 12
(ETB 260)

38V. SPECIFIC RISK EVENTS, COSTS, AND COPING
Figure 28: Frequency and Allocation of Costs Faced After A Death – Urban Participants
Figure 29. Distribution of Expenses After Death – Urban and Rural
Proportion of HH’s Reporting Expenses - Urban
MedicalCare Associated
with Death
80%Avg. USD 318(ETB 6,985)
Other
23%Avg. USD 137(ETB 3,017)
Food & Drinks(Memorial At Time of Death)
87%Avg. USD 145(ETB 3,198)
Clothing(for the Deceased and Relatives)
68%Avg. USD 36
(ETB 800) Burial/Coffin/Interment
66%Avg. USD 184(ETB 4,040)
Transportation(of the Body)
26%Avg. USD 77(ETB 1,690)
40/80 DaysMemorial Services
58%Avg. USD 269(ETB 5,917)
Documentation
13%Avg. USD 44
(ETB 974)
ReligiousLeader
47%Avg. USD 25
(ETB 545)
0-250 251-500 >1000501-750 751-1000
56%
45%
74%
18%
21%
13%
10%
12%
6%
6%
8%
3%
10%
14%
4%
Overall
Urban
Rural
Avg: USD 45650%: USD 210
50%: USD 285 Avg: USD 580
Avg: USD 24350%: USD 127
USD

WHAT PEOPLE WANT: INVESTIGATING INCLUSIVE INSURANCE DEMAND IN ETHIOPIA
39
To help in refining the coverage amounts Figure 29 helps to further narrow the coverage requirements, showing that a rural policy with a sum assured of USD 250 (ETB 5525) would cover the needs of almost three-quarters of the rural population’s costs, excluding opportunity costs. In the urban areas, the coverage would need to be closer to USD 750 (ETB 16,575).
Coping Mechanisms Used
The competition for insurance in these markets is not so much with other insurers but with current (though typically insufficient) coping mechanisms. If the accessibility, proximity to their real needs, and satisfaction with the terms of current coping mechanisms is acceptable to people, it is unlikely that the market will want insurance products.
Figure 30 shows the various coping mechanisms that are applied by rural and urban households to cover the costs related to funerals. This information shows
several issues that could be addressed by insurance, or a combination of better savings and credit, mixed with insurance.
• Most people are using savings, and they are wiping out their reserves to cover the costs of death. Insurance or better loan products could help minimize this negative impact and allow people to retain some resilience.
• Edirs, generally considered as a key source of funeral expense coverage, turn out to be of limited impact, as indeed earlier it was noted by respondents that these are primarily social in nature and the financial benefits are limited.
• Selling assets is a particularly burdensome response, yet in the rural areas it is the second most significant primary coping mechanism. The urgency of the need for cash, often means people sell their assets at a discount simply to get money as quickly as possible. This inflates the costs of coping.
In Ethiopia, the coping mechanisms invoked in the case of a death are substantially painful and leave the HH with often significantly reduced resilience. Given proper products, a fair price, and an effort to show trustworthiness in the intangible death insurance product, insurers should have a significant potential market in both urban and rural areas.
Response to Product Prototypes
Using cash, savings and Edirs, among the most common responses to financial risks associated with death, are not sufficient in most cases. In order to gauge possible interest in an insurance solution to better cope with some of the costs, a simple life insurance product prototype was presented during focus group discussions. The prototype is shown in Box 5.
The life insurance product prototype was acknowledged as a positive addition to risk management strategies, and one for which many people will pay an actuarially derived premium. Table 11 provides key information on the responses from FGD participants to the prototype features.
Figure 30. Coping Mechanisms Used After A Death
RuralUrban
1%
7%
7%
9%
28%
21%
59%
5%
18%
11%
15%
14%
16%
53%
Other
Selling Assets
Additional Job/Work More
Loan from Friend/SACCO/Bank/Moneylender
Assistance from Edir
Donations/gifts from friendsor family (out of Household)
Cash on Hand or Savingsof Any Household Member

40V. SPECIFIC RISK EVENTS, COSTS, AND COPING
Participants in both rural and urban areas were interested in purchasing this product. Based on the actual prototype features, and the range of sums assured, the premiums that participants were willing to pay for this product are noted in Table 13 and Table 12.
Box 5. Life Insurance Product PrototypesBenefits In case of death of insured person -- for any reason – the family
receives ETB _________ If the policyholder does not die during the 1-year period, the family receives nothing
Eligibility Anyone between the ages of 18 and 65. Need a separate policy for each family member who is part of the insurance.
Term of Cover 1 year: you can renew every year
If I Need to Make A Claim? Easy claims request, paid within 3 weeks of the beneficiary providing proof of death
What If There Are Questions or pProblems?
A call-in number for any questions, available any time to all who purchase
Table 11. Focus Group Feedback on Life Insurance Product Prototype FeaturesProduct Feature Responses
Benefit Amount • Sum assured: selected by groups and ranged between USD 340 (ETB 10,000) and USD 760 (ETB 17,500)
• Use of proceeds: Participants would use the insurance benefit to pay burial expenses, cover memorial services, repay loans and buy agricultural inputs and livestock.
Premium Payment and Benefit Collection
• Timing: For rural areas: August / September, or December / January.
• Frequency: Urban prefer to pay monthly with salary, Rural prefer to pay once or twice annually with harvests.
• Convenient place to receive the benefit: Banks, MFIs, cooperatives, village community committees
Eligibility (Individuals Aged 18-65) • One disadvantage mentioned is that, unlike Edirs, where all family members are covered, life insurance is just for one person.
This basic product is one that people will purchase to address some of the risks they have specifically identified. Often death (or life) insurance is an easy starting point for insurers trying to service the low-income market. In this case, over 50% of the participants would pay at least 240 ETB (~10 USD) per year for this prototype.
On average, participants were willing to pay in the order of 2.4% of the sum assured, per year,
for this product.

WHAT PEOPLE WANT: INVESTIGATING INCLUSIVE INSURANCE DEMAND IN ETHIOPIA
41
Product Specific Design Implications – Life Insurance• There are three reasonably distinct types of costs related to death:
• Pre-death costs (primarily medical care associated with the death)• Funeral costs• On-going HH and memorial costs
• Understanding the various components of costs relating to death is an important tool for insurers in developing life insurance products that create value for the market.
• Many people will pay an actuarially derived premium for a basic life product as reflected by the prototype.• Premium timing is important, particularly in rural areas, as monthly premiums will not be possible.• Edirs, while a valuable source of social and financial support, are not a significant or sufficient source of funds
to cover out of pocket costs in case of death. However, as seen in the focus groups, Edirs are perceived as having an important role in preparing households to cope with a death, and participants would therefore prioritize better risk management for other types of risks. There may nevertheless be ways for insurers to link with Edirs to provide better coverage for death and other risk management products, if there is an effective means of aggregating premiums for a number of Edirs, and the products truly respond to the un-met needs. Although most people ranked death as their number four hardship, more than half of the respondents who experienced a death in the last year noted that death yields moderate to great hardship. The current coping mechanisms are often weak, and there is room for well-designed life insurance products in both the urban and rural areas of Ethiopia.
Table 12. WTP for Life Insurance (% of Coverage)
As % of Sum Assured (N=46)Premium as % of
CoverNo. of Participants Stating WTP (N=46)
<1.0% 131.0 - 2.0% 112.0 - 3.0% 4
3.01 - 4.0% 9>4.0% 9
Table 13. WTP for Life Insurance (ETB)Premium in ETB (N=46)
Monthly Premium No. of Participants Stating WTP (N=46)
<5 0
5 - 10 1811 - 20 621 - 40 541 - 60 1361 - 80 2
>80 2
4242ACKNOWLEDGMENTS

43
VI. POTENTIAL CHANNELS FOR DISTRIBUTION OF INSURANCE
WHAT PEOPLE WANT: INVESTIGATING INCLUSIVE INSURANCE DEMAND IN ETHIOPIA
43
The preceding sections have demonstrated that there is both a need for insurance as well as an overall open attitude towards insurance. However, unless insurers have a way of reaching Ethiopians in a cost-effective way, it is difficult to meet this potential demand for insurance.
Therefore, the study looked at potential distribution channels for insurance, getting information on institutions or groups people go to, how often they visit or meet, and how trustworthy and accessible they would perceive these channels to be in terms of insurance.
There are several potential aggregating points for accessing potential microinsurance clients, based on responses regarding membership / patronage of various institutions. As shown in Figure 31, the most common groups are Edirs, savings and credit cooperatives (SACCOs), utility companies, and equbs. Of note is that they are mostly focused on financial services already, but two of the four are informal groups, and thus potentially more difficult for distributing insurance. In considering potential contact points for insurance, it is notable that despite membership, physical access is infrequent for most channels; this will have implications for potential timing of sales and payments, as well as considering ways to use insurance to attract clients more frequently.
To further explore openness to various channels in terms of insurance, the FGDs presented insurance product prototypes and then asked participants where they would be most likely to buy insurance, given accessibility and trust of that channel. Summary results are shown in Table 14.
For most focus groups, trust seemed to be a more important factor than accessibility. Trust seems to be linked to formality and organization, indicating that participants would be concerned about capacity of the institution to undertake insurance transactions rather than general trustworthiness. Without exception, every group indicated a high level of trust for banks to be able to effectively deliver insurance,
Figure 31. Membership and Frequency of Access of Potential Channels – Survey Respondents
FINANCE, COMPETITIVENESS & INNOVATION INSIGHT | LONG-TERM FINANCE
Frequently Occasionally Never/Infrequently
4%
1%
1%21%
2%
0%2%
15%
20%
6%
58%
33%
61%
50%
81%
79%
93%
21%
65%
38%
48%
0 200 400 600 800 1000 1200 1400 1600 1800 2000
MFI
Cooperative
Agri InputSupplier
Equb
SACCO
UtilityCompany
Edir
Number of Respondents Indicating that They Are a Member or ClientFrequency of Access
Type
of In
stitu
tion
or G
roup

44VI. POTENTIAL CHANNELS FOR DISTRIBUTION OF INSURANCE
with participants mentioning characteristics such as professional staff and established systems for collecting money. In contrast, Edirs were ranked low to medium on trust, with most participants mentioning that they are not well organized, informal, and lack expertise to manage more complex financial transactions. Those groups that did rate Edirs as having high trust mentioned
that they are community-based and run by people they know well. In terms of accessibility, Edirs, SACCOs, cooperatives, and MFIs are physically more locally based, and better serve lower-income clients with their existing services. Male and female groups end up with very similar overall rankings and the reasons mentioned were generally consistent.
Table 14. Trust, Ease of Access, and Likelihood of Buying From Potential Distribution Channels (FGDs)
Channel Ease of AccessLevel of Trust (As It Pertains to
Insurance Delivery)Overall “Most Likely to Buy Insurance From”16
Bank Moderate (rural) / easy (urban) – mostly available at the wereda level. Noted that poor do not use them currently because they have no extra income for saving
High – formal and organized, qualified personnel, secure and stable, good customer service
• 19 groups • Average rank of 1.3
MFI Easy / Moderate – easy for those groups who had a branch at the kebele level; moderate for some groups who had to go to wereda to access
High / Medium – formal, well-organized, trusted in the community, but more complex processes and wait times than some other channels
• 24 groups (mostly rural)
• Average rank of 1.8
Cooperative Moderate / Easy – locally situated, most farmers are members. Some groups mentioned that they are accessible only to members
Medium / High – sometimes slow moving and sustainability and capacity is questionable (not as formal as banks / MFIs). Groups indicating high trust felt sense of ownership and mentioned that their local cooperatives had received trainings
• 24 groups (mostly rural)
• Average rank of 2.7
SACCO Easy / Moderate - easy for those groups who had a branch at the kebele level; moderate for some groups who had to go to wereda to access; more likely to serve poorer people
Medium – Not as well established and organized as MFIs and banks
• 17 Groups (mostly rural)
• Average rank of 3.5
Agriculture input supplier
Easy – located at kebele level, but access mostly during farming season
Medium – generally trusted, but complex processes in service provision and concern about being too business-focused and not having time for a non-core activity (insurance)
• 13 Groups (all rural)• Average rank of 3.5
Edir Easy / Moderate – neighborhood based, and frequently accessed for monthly meetings
Low / Medium – Individual’s character is trusted, but there is low financial capacity and expertise, and they are informal and run by volunteers
• 29 groups • Average rank of 3.7
Note: Other channels considered by fewer than 25% of groups were utility companies, post offices, kebele administration, and money transfer agencies. These channels generally were seen as medium to low trust, and moderate to difficult to access.
15 Each group was asked to rank the channels according to the likelihood that they would buy insurance from that channel, with 1 being the mostly likely. Not all groups included all channels in their list.

WHAT PEOPLE WANT: INVESTIGATING INCLUSIVE INSURANCE DEMAND IN ETHIOPIA
45
Key Implications – Distribution• Informal or less formal groups, such as SACCOs and Edirs, reach more people more frequently, and thus are
attractive in terms of generating larger volumes of potential clients. However, potential purchasers of insurance see them as risky because of their informal status. When considering insurance, people are looking for a formal institution that brings stability and financial capacity. Thus, insurers wishing to tap the larger channels will have to work to build capacity in these institutions and focus their marketing to build up confidence among clients.
• Focus groups’ responses to prototypes were strong, and participants showed a strong preference for purchasing from more formal institutions such as MFIs and banks. A well-designed insurance product could draw new clients to such institutions, and potentially facilitate better access as well (e.g. by reducing collateral requirements or risk).
• Alternative channels that are starting to be used in other countries – such as utilities, retailers, post offices, mobile phones, and others – are not yet largely in consideration. Level of access is low, and in terms of perception, most people seem hesitant to consider purchasing a financial service from a non-financial service provider.

4646ACKNOWLEDGMENTS

47
CONCLUSIONS AND RECOMMENDATIONS
WHAT PEOPLE WANT: INVESTIGATING INCLUSIVE INSURANCE DEMAND IN ETHIOPIA
47
Aprerequisite to successful microinsurance is a segmented understanding of the market. This research segments results into rural / urban and male / female perceptions of risk, strategies to manage risk, and potential gaps or burdensome strategies within their approach. Understanding
the markets at this level provides key information to allow for the development of successful microinsurance products in Ethiopia. This research was conducted as a means of addressing the gap in understanding the market. From here, the World Bank project will work with insurers and others in the value chain to manage the rest of the product development cycle shown in Figure 32.
The results of the study show a clear gap between the effects of various financial shocks and households’ ability to cope with these shocks. The coping mechanisms used in the case of a financial shock can be painful and leave a household with often significantly reduced resilience. Insurance is typically not part of the risk management toolkit of low-income people, as the survey results show that experience with, and knowledge of, insurance is very low. However, in the case of microinsurance, this is positive. In most other countries, there is already a substantial negative impression of insurance leading to negative bias, which is rather low in Ethiopia.
People worry most about health-related risks, as well as their assets. Both urban and rural respondents ranked death risks rather low in priority compared to usual expectations, as the respondents noted low financial impact from death due to the culture of community assistance for funerals. However, the reality appears somewhat different.
The analysis provides details on the results of basic prototype testing for five products that were generated from the results of initial FGDs and the household survey. These suggest the following:
Figure 32. Product Development Process
FINANCE, COMPETITIVENESS & INNOVATION INSIGHT | LONG-TERM FINANCE
InstitutionalAssessment
ProductDesign
Roll Out PartnershipDevelopment
ContinuousReview
32Post-survey
FGDs
2,922HH
Surveys
6Pre-survey
FGDsMarket
Research
PilotTesting
PrototypeDesign & Testing
MicroinsuranceProduct
DevelopmentProcess
DemandReport +
Videos fromthe Field
Consists of
Results in
Informs
Inform
Follow Up By

CONCLUSIONS AND RECOMMENDATIONS
48
• There is a benefit to the market and insurers in developing market-segmented products by gender, and by location (rural / urban). The responses were significant such that insurers should see improved uptake over segment-agnostic products.
• The market itself shows broad potential for microinsurance purchase by up to 10 million households, or about 50 million Ethiopians.17
This potential could be better met with a market segmented approach.
• In urban areas risk management approaches that focus on supplemental health are at the top of the list for market demand. These could be enhanced with added-value linkages and the inclusion of both accidental cover that provides medical assistance as well as disability benefits, and, a concerted effort to improve traffic regulations and enforcement. Especially in this case, insurance is not enough. The approach should be around improved risk management which will benefit all parties.
• Death did not score highly on the priority list. It seemed that this was due to the perception that people were covered by local mechanisms, and especially Edirs. However, it also became clear that the Edirs are primarily social, and that people cannot count on them for significant financial contributions to the costs of a funeral. Additionally, there is little available for family assistance after the death of a breadwinner. These risk management areas could benefit from some additional exploration.
• In rural areas, people tend to be concerned about their farming yields, for income and / or subsistence. Ethiopia in particular has very high levels of risk, though there are significant topographical climes that make the diversity intense to such a level that it is difficult to get to scale with any traditional index type product. A broader approach to agriculture and livestock insurance cover is needed. When losses are experienced, they come on three levels: often repaying an input loan, replanting (if early in the season), and in replacing lost income / lost
food stores. Any product should address these components. Additionally, there are issues that require adaptation in agriculture, and insurance can be helpful in providing the comfort level that might help farmers in the transition. The WFP’s R4 program has taken a comprehensive approach to agriculture risk management. This kind of a broader approach to risk management (rather than simply insurance) could be enhanced.
• Segmentation in approaches by gender is also important. There are differences in the women’s approach to risk priorities, such as with women prioritizing road accidents and men with health. The study made clear that women have an important input in decisions around risk management within the household, even when they are not the “head of household”. This suggests that education and marketing around microinsurance products in Ethiopia should be segmented by gender for more effectiveness.
Ethiopia provides a significant opportunity for insurers to expand their businesses, the government to improve the overall stability of the low-income population, and low-income people to stabilize their economic status. However, it is also clear that there is much that is necessary to make this happen. The demand work presented here helps to define the needs and potential risk management responses that could enhance the structure of the project’s product and marketing level inputs. The regulation component of the project shows specific alterations to the legal structure that could improve the ability and motivation of insurers to enter or expand within this market. The supply side component provides guidance for capacity improvements with the industry. The financial education component has uncovered important knowledge gaps and means of “educating” the Ethiopian market. Combining these inputs is critical to implement a comprehensive approach to improving risk management in Ethiopia. One component is not enough, but all responses must include direct consideration of clients’ needs, abilities, and priorities.
17 This comes from the 65% of the survey group determined to be in the range for microinsurance converted conservatively to people and households.

49
REFERENCES
WHAT PEOPLE WANT: INVESTIGATING INCLUSIVE INSURANCE DEMAND IN ETHIOPIA
49
FINANCE, COMPETITIVENESS & INNOVATION INSIGHT | LONG-TERM FINANCE
Central Statistical Agency of Ethiopia (CSA), February 2017. Living Standards Measurement Study (LSMS) – Integrated Surveys on Agriculture Ethiopia Socioeconomic Survey (ESS) 2015/2016. World Bank and National Bank of Ethiopia.
Central Statistical Agency of Ethiopia (CSA), October 2012. Household Consumption and Expenditure (HCE) Survey 2010/11, Analytical Report.
GSMA Intelligence, Country data dashboards. https://www.gsmaintelligence.com/ Data retrieved 17 October 2017.
Klapper, L., A. Lusardi, and P. van Oudheusden. Financial Literacy Around the World: Insights from the Standard and Poor’s Ratings Services Global Financial Literacy Survey. http://gflec.org/wp-content/uploads/2015/11/Finlit_paper_16_F2_singles.pdf
Schreiner, Mark, October 2016. Simple Poverty Scorecard – Ethiopia.
III. MANDATORY REPORTING AND INFORMATION SHARING
50

51
APPENDICES
WHAT PEOPLE WANT: INVESTIGATING INCLUSIVE INSURANCE DEMAND IN ETHIOPIA
51
Appendix 1 – Sampling Frameworks for Household Survey and Focus Group DiscussionsMethodology for establishing sample size. The basis for the computation of sample size was calculated using the following coverage formula:
n = D(Zα/2+Zβ)2 ((P) (1 – P) / (e)2)Where:• n is the required minimum sample size (eligible households), • Zα/2 is a factor to achieve the 90% level of confidence (Corresponding tabular value of 1.28),• Zβ is the power of a test (for 95% power corresponding z value is 1.65)• P is the anticipated proportion for the key indicator,• D is the square root of design effect (2), • e is the acceptable margin of error between actual value and estimate from the survey (4%)
90% Level of
Confidence95%
Power(Zβ) P 1-P D e e2
10% Non-
response
Initial Sample
Size
Planned Sample
Size
1.28 1.65 0.5 0.5 2 0.04 0.0016 268 2677 2945
This particular formula was selected by JaRco’s Senior Statistician to gather a statistically significant amount of data on the target clients and microinsurance in Ethiopia. After taking the non-response rate and proportional sampling adjustments into consideration, 16 zones, 31 weredas, and 59 kebeles (enumeration areas) across the five regions were covered in the household survey. In order
to keep homogeneity at cluster level and to get a sufficient sample size for reporting at the zonal and wereda levels, approximately 50 households were surveyed per kebele, for a total of 2,922 households. The number of clusters / Kebeles assigned in each selected wereda in each region was allocated based on population (Table 15), with the final sampling framework shown in Table 16.
FINANCE, COMPETITIVENESS & INNOVATION INSIGHT | LONG-TERM FINANCE

52APPENDICES
Table 15. Sampled HHs Distributed to the Regions
Region# of HHs Targeted
Per Region Population18 % of Total PopulationTigray 200 5,247,005 6%Amhara 750 21,134,988 22%Addis Ababa* 650 3,433,999 4%Oromia 800 35,467,001 38%SNNPR 550 19,170,007 20%Dire Dawa* 0 466,000 <1%Harar* 0 246,000 <1%Afar 0 1,812,002 2%Benishangul-Gumuz 0 1,066,001 1%Gambela 0 453,999 <1%Somali 0 5,748,998 6.1%Special Enumeration Areas 0 123,001 <1%Total 2950 94,251,001*Cities
18 Ethiopia Central Statistical Agency, Population projection of Ethiopia for all Regions at wereda level from 2014 - 2017, 2017 Regional Population
Table 16. Household Survey Sampling FrameworkRegion Zone Woreda Kebele HHs Surveyed
Amhara (701 Households)
West GojjamSemen Achefer
Esetumite 50Yismala town 50
DegadamotArefa medihani alem 38Feres bet 50
South GonderEbinat
Tare Senba 50Ebinat - Town (Kebele 01) 49
SimadaKebele 21 40Wegada - Town 49
South WelloLegambo
Werenito 50Akesta - Town 50
AmbaselGishen Mariam 38Wuchale - Town 37
North ShewaMenz Geramidir
Anazted 50Mehal Meda - Town 50
Asagirt Welda Hager 50

WHAT PEOPLE WANT: INVESTIGATING INCLUSIVE INSURANCE DEMAND IN ETHIOPIA
53
Oromia(800 Households)
East Welega Zone
LimuAdo Lalisa 50Gelila - Town (Kebele 01) 50
Boeya BosheJawis 49Bilo - Town(Kebele 01) 51
East HarrgeZoneGolo Oda
Tiritira 03 50Burka - Town(Kebele 01) 50
FedisMelka 50Boko - Town(Kebele 01) 50
North Shewa Zone
Hidabu AboteGedebo Jema 50Ejere - Town (Kebele 01) 50
Yya GuleleLemi 50Fital - Town(Kebele 01) 50
Arsi ZoneZiway Dugda
Bite Daba 50Golcho - Town(Kebele 01) 50
SudeGuracha Chisa 50Kula - Town(Kebele 01) 50
SNNPR(550 Households)
WolaytaDamot Gale
Gacheno 50Bodite - Town 50
HumboKoyisha Gola 50Tebela - Town 50
SidamaArbe Gona
Hafursa Nemeto 50Yaya - Town 50
BorichaMudamu Seneka 55Yaya - Town 45
KefaGewata
Adis Birihan 50Konda - Town 50
Cheta Arara 50
Tigray(200 Households) Southern Tigray
Raya AzeboHawulti 50Mehoni - Town 50
OflaKorema Town 49Hashenge 51

54APPENDICES
Addis Abeba(671 Households)
Gulele Sub CityWoreda 3
Ketena 1 50Ketena 5 49
Woreda 6Ketena 2 50Ketena 5 51
Kolfe Keranio Sub City
Woreda 7Ketena 8 50Ketena 10 64
Woreda 10Ketena 3 46Ketena 5 50
Nefas Silik LaftoWoreda 1
Ketena 1 50Ketena 9 50
Woreda 4Ketena 6 50Ketena 8 50
Woreda 8 Ketena 4 61
Region KebeleUrban / Rural Gender Tool Used
Nr. Participants
Economic Profile
Addis Ababa 1 Urban Female Post Survey (Life Prototype)
6 Government Worker
Addis Ababa 1 Urban Male Post Survey (Life Prototype)
6 Government Worker
Addis Ababa 10 Urban Female Post Survey (Health Prototype)
10 Self Employed
Addis Ababa 10 Urban Male Post Survey (Health Prototype)
6 Government Worker
Addis Ababa 3 Urban Female Post Survey (Property Prototype)
9 Self Employed
Addis Ababa 3 Urban Male Post Survey (Property Prototype)
7 Self Employed,Day Labor
Addis Ababa Betel Urban Female Pre-Survey 7 Self Employed, Day Labor
Addis Ababa Betel Urban Male Pre-Survey 8 Self Employed Day Labor
Focus Group Discussion Sampling FrameworkSummaryLocation: Urban-13 Rural-25Gender: Male-22 Female-16Tool Used: Pre-Survey-6 Post-Survey-32Region: Addis Ababa-8 Amhara-6 Oromia-11 SNNPR-7 Tigray-6
Crop (5)Livestock (5)Health (10)Life (6)Property (6)
g

WHAT PEOPLE WANT: INVESTIGATING INCLUSIVE INSURANCE DEMAND IN ETHIOPIA
55
Amhara Ambasel/02 Rural Male Post Survey (Livestock Prototype)
6 Farmer
Amhara Semen Achefer/Yismala
Rural Male Post Survey (Crop Prototype)
7 Farmer
Amhara Asagirt Rural Male Post Survey (Health Prototype)
6 Farmer
Amhara Asagirt Rural Female Post Survey (Health Prototype)
6 Farmer
Amhara Ambasel/Wuchale
Urban Male Post Survey (Property Prototype)
6 Self Employed
Amhara Ambasel/Wuchale
Urban Female Post Survey (Property Prototype)
6 Self Employed
Oromia Gela Gure Rural Female Post Survey (Livestock Prototype)
10 Farmer
Oromia Gela Gure Rural Male Post Survey (Livestock Prototype)
6 Farmer
Oromia Iftu Rural Male Post Survey (Crop Prototype)
9 Farmer
Oromia Halo Rural Male Post Survey (Life Prototype)
7 Farmer
Oromia Halo Rural Female Post Survey (Life Prototype)
8 Farmer
Oromia Illu Dire Rural Male Post Survey (Health Prototype)
10 Farmer
Oromia Illu Dire Rural Female Post Survey (Health Prototype)
10 Farmer
Oromia Wererso Malima Rural Male Pre-Purvey 7 FarmerOromia Wererso Malima Rural Female Pre-Purvey 7 FarmerOromia Boko Urban Male Post Survey
(Property Prototype)9 Self Employed
Oromia Boko Urban Female Post Survey (Property Prototype)
9 Self Employed
SNNPR Abela Sipa Rural Male Post Survey (Livestock Prototype)
7 Farmer
SNNPR Gachano Rural Male Post Survey (Crop Prototype)
8 Farmer
SNNPR Gachano Rural Female Post Survey (Crop Prototype)
6 Farmer
SNNPR Boricha Boneya Chire
Rural Male Post Survey (Health Prototype)
6 Farmer
SNNPR Boricha Boneya Chire
Rural Female Post Survey (Health Prototype)
6 Farmer
SNNPR Beteo Rural Male Pre-Purvey 8 FarmerSNNPR Yaye Urban Female Pre-Purvey 8 Farmer

56APPENDICES
Tigray Geniye Rural Male Post Survey (Livestock Prototype)
10 Farmer
Tigray Adigolo Rural Male Post Survey (Crop pPrototype)
7 Farmer
Tigray Hayalo Rural Female Post Survey (Life Prototype)
10 Farmer
Tigray Wemberta Rural Male Post Survey (Life Prototype)
10 Farmer
Tigray wergiba Rural Male Post Survey (Health Prototype)
7 Farmer
Tigray Tsigia Rural Female Post Survey (Health pPrototype)
8 Farmer / Housewife
Appendix 2 – Additional Survey Data on Perceptions of InsuranceFigure 33. Attitudes Towards Insurance19
Insurers are Stable Financially and Cannot Go Bankrupt Easily
When Somebody is Insured He/She Can Live Without Worry
Disagree59%
Moderate12%
Don't know24%
Agree5%
Disagree59%
Moderate12%
Don't know24%
Agree5%
It Does Not Make Sense to Insure As Nothing SeriousWill Happen to My Family or Me
Insurers Sometimes Manipulate Conditionsor Trick People so They Don’t Have to Pay
Insurance Is A Good Use of Money
Insurance is Expensive
It Does Not Make Sense to Insure BecauseWe Can Manage Problems Ourselves
It is Quick and Easy to Access Benefits/Payoutsfrom Insurance When the Covered Event Happens
Disagree57%
Moderate12%
Don't know23%
Agree8%
Disagree9%
Moderate22%
Don't know27%
Agree41%
Disagree40%
Moderate14%
Don't know40%
Agree6%
Disagree14%
Moderate16%
Don't know42%
Agree29%
Disagree19%
Moderate12%
Don't know51%
Agree18%
Disagree20%
Moderate20%
Don't know44%
Agree15%
Disagree23%
Moderate22%
Don't know25%
Agree30%
Perceptionon Insurersand ServiceProvision
Perceptionon Usefulness/Need forInsurance
19 Participants were asked to whether they agree or disagree with statements about insurance. Responses are reported here with favorable answers toward insurance on the left in green, and answers unfavorable for insurance toward the right, in red.