Embed Size (px)
Citation preview

by Kevin Quinn
A White Paper
How Business Intelligence Should Work
The Connection Between Strategic, Analytical, and
Operational Initiatives

Bringing more than 25 years of software marketing and implementation
experience to his role as Vice President of Product Marketing for Information
Builders, Kevin Quinn oversees the development of marketing for all
product lines.
Mr. Quinn has been credited with helping to define business intelligence
end-user categories through his creation of guidelines for using and
employing business intelligence tools. He has helped companies worldwide
develop information deployment strategies that help accelerate decisions
and improve corporate performance. His efforts in this position have helped
propel Information Builders WebFOCUS and iWay Software solutions to
category leadership in their respective areas. Kevin is also the founder of
Statswizard.Com, an interactive sports statistics Web site that leverages
business intelligence functionality.
Mr. Quinn holds a Bachelor of Science degree in Computer Science from
Queens College in Flushing, New York.
Kevin Quinn

Introduction
Strategic, Analytical, and Operational BI:
How They Impact Each Other
The Problem With BI
How It Should Work
Types of BI Tools: Where They Fit In
Balanced Scorecards and Strategy Maps
Analytic Dashboards
How BI Should Work: Real-World Successes
Case Study: Automobile Manufacturer
Case Study: Commercial Airline
Business Intelligence Maturity Level
Conclusion
Table of Contents
3
4
6
8
11
12
1
2
6
11
14
16

Information Builders1
Introduction
Business intelligence (BI) has been around for a long time, and over the years has taken on many
different forms – reporting, OLAP, ad hoc, performance management, predictive analytics, data
mining, etc. For someone who’s new to the concept of BI, these various solutions can be quite
confusing. Many potential users struggle to understand the differences between the numerous
technologies and methodologies and find it difficult to prioritize them.
But, the fact is that each facet of BI is important, and each plays a vital role in a company’s overall
information strategy. However, few organizations truly understand how these different tools and
techniques should be used together to drive efficiency and effectiveness across the entire enterprise.
After more than 25 years in the industry, I have learned that BI is used in three distinct ways – strate-
gically, analytically, and operationally. These three “levels” of business intelligence, while unique in
their own way, are not mutually exclusive. They should be directly connected to each other, working
in concert. Strategic analysis drives analytical BI, while analytical BI directs the focus of operational
initiatives. And, these operational initiatives are what impact agility, productivity, cost-efficiency,
and profitability.
In this paper, we’ll investigate the various levels of business intelligence, discuss the challenges
organizations face with today’s typical BI deployments, and highlight how to make strategic,
analytical, and operational initiatives work seamlessly together to enhance performance and
boost competitive advantage across an entire organization.
Operational Analytical
Strategic

How Business Intelligence Should Work2
Just how do the three levels of BI relate? In a sense, they perform as a cycle. Let’s start with strategic
BI. The primary goal of strategic business intelligence is to drive the performance of the company
as a whole, as well as the individual departments and business units that produce and deliver the
company’s products or services. Management collaborates and agrees on a strategy, and function-
ality like strategy maps, scorecards, reports, and dashboards are used to communicate the strategy
in the form of measurable goals.
Within that same strategy, several critical success factors will exist. For example, customer satisfac-
tion scores, market share, profit margins, or overhead costs. And, the status of those factors will
reveal the progress – or lack thereof – towards reaching the overall goal(s) of the strategy.
This approach is much like a car’s dashboard, where gauges that are in the red zone or flashing lights
tell the driver that something is wrong, and where the problem may lie. By closely monitoring those
factors, companies can immediately detect where problems exist and take swift corrective action.
Once the strategy is defined, analytical BI comes into play. While strategic BI sets the foundation in
the form of key performance metrics, analytical BI is employed to identify the source of an issue
once it has been uncovered. Tools like analytic dashboards, OLAP, predictive analytics, and ad hoc
queries are utilized to determine the location or cause of a major problem. For example, if profits
are declining, is it because of low sales, or increasing expenses? If customer churn rates are on the
rise, is it because of poor product quality, or lack of success in customer loyalty initiatives? With
analytical BI, companies can investigate the factors that impact business performance from many
different angles.
The results obtained from analytical BI activities then drive operational initiatives. Operational
business intelligence facilitates the kind of day-to-day decision-making that happens at the lower
levels of an organization, and enables the attainment of strategic goals.
For example, Utz Quality Foods uses Information Builders WebFOCUS to help manage the produc-
tion and sales of over 20,000 pounds of potato chips every hour. Utz follows a vendor managed
inventory (VMI) model and is fully responsible for stock levels on the store shelves of the grocery
retailers it conducts business with.
The company’s BI environment allows delivery people (the quintessential example of frontline
operational workers) to send and receive data about promotions and current inventory levels at
retail stores. This helps ensure that products are fresh and available at the 30,000 grocers that they
service. The immediate availability of this type of operational information directly impacts the
company’s ability to reach high-level objectives such as increased sales or greater profitability.
Strategic, Analytical, and Operational BI: How They Impact Each Other

Information Builders3
But, the cycle never ends. New goals must be set, and new areas in need of improvement must be
continuously sought.
The three levels of business intelligence work together. Strategic – Management monitors performance and achievement of strategic goals. Analytical – Analysts isolate and identify issues that impede per-formance. Operational – Initiatives in the form of BI applications and process improvement remedy the identified roadblocks. Notice that the number of people affected by each level increases as you move through the cycle.
The Problem With BI
The reason many BI initiatives fail – or deliver less-than-expected returns – is because companies
purchase, implement, and utilize their business intelligence software without fully understanding
this cycle.
Let’s return to the automobile dashboard analogy, this time taking it a step further.
In the scenario above, a warning light on the dashboard (Strategic) shows that the engine
temperature has reached excessive levels. In the center, we see that further analysis has uncovered

How Business Intelligence Should Work4
which of several scenarios may be causing the issue. It could be a faulty thermostat which
prevents coolant from flowing through the engine. It could be a bad gasket that is making the
engine over-work. Or, it could be a fan belt, which is preventing the cooling of the coolant. In
the third frame (Operational), a mechanic is putting the operational fix in place by repairing the
broken fan belt.
Now, imagine any of these three steps working individually. The red light on the dashboard would
do nothing to help solve the car’s problem if it was not investigated further. And, without the
indicator on the left, a mechanic (automobile analyst) would need to look in hundreds of places to
understand what is truly wrong with the engine, preventing him from focusing on the problem’s
operational fix.
Here are some examples of the issues an organization may face when they focus on just one facet
of BI:
Strategic BI Only
An executive has access to a dashboard that provides performance tracking, but no one else can
view the information it contains. The executive can monitor key metrics, but has no means of com-
municating their importance to other areas of the business, and has no way to identify problems or
uncover areas in need of improvement. This approach is similar to a driver who sees a red light
flashing on his automobile’s dashboard, yet ignores it and hopes the problem either corrects itself
or goes away.
Analytical BI Only
Some firms leverage analytic software solutions to analyze data in a data warehouse to uncover
trends and predict potential outcomes in certain business scenarios. But, no one is directing the
focus of the analysis, making problem detection little more than guesswork. And, when a troubling
trend is uncovered, there is no way to drive new operational efficiencies to correct it.
Operational BI Only
The use of operational business intelligence alone will rarely have a negative effect – or no effect at
all – on a company’s performance. Any use of information at the operational level will deliver positive
results. However, with operational BI alone, there is no way to ensure that the most important
problems and goals are the ones being focused on, and that the entire company, all the way down
to the frontline worker, is aligned towards the achievement of the same strategic objectives.
How It Should Work
Many companies make the mistake of relying too heavily on BI in general, as if without it, they
would have absolutely no way to create, sell, and deliver a product or service. Yet, decades ago,
long before business intelligence and other types of software were introduced, businesses were
successfully run with little more than bookkeepers, manufacturing staff, and a whole lot of paper.
This meant that they had to find manual ways to assess efficiency, but it didn’t prevent them from
operating productively and turning a profit.

Through instinct and bottom line numbers, the ways in which a business should be effectively
operated and/or improved can be understood long before volumes of data are collected and
analyzed. For example, Company ABC produces a specific product and wants to sell it for a profit.
In order to do so, they must build it with minimal overhead expenses, charge more than it cost to
make, have enough inventory on hand to meet customer demands, and ensure that the product is
of high quality to avoid returns.
The point is that businesses don’t run on BI software. They just run better when timely information
can be used to detect and correct problems – or even prevent them proactively – before they
have a major effect on performance.
The key to success is to have a strategy in place before the business is launched. Business intelli-
gence then becomes the tool for communicating that strategy to everyone in the organization,
regardless of their role, and defining and measuring the factors that relate to its achievement.
Information Builders5

Balanced Scorecards and Strategy Maps
Whether a company subscribes to a specific management methodology or not, the benefits of
monitoring and communicating performance results cannot be argued against. By clearly stating
goals and translating them into measurable objectives, organizations can quantify and assess their
progress. Without this, the status of the business can go unchecked for extended periods of time,
which can be particularly detrimental if performance results are negative.
The purpose of performance management is two-fold. First, it enables senior executives to
collaborate on and agree to a corporate strategy. Second, it facilitates the sharing of those goals
with middle management and frontline workers, so everyone is properly aligned and striving to
reach the same objectives.
In Robert Kaplan and David Norton’s book The Balanced Scorecard, strategy maps and leading and
lagging indicators are discussed. This concept is essential to truly effective performance manage-
ment, even for companies that don’t follow the balanced scorecard approach.
Kaplan and Norton claim that the overall goal of a company, or even one of its individual business
units, can be described as a single end result. For example, the primary objective may be higher
profitability, but having everyone in the company monitor only profit levels would serve no
purpose in helping to achieve that goal. Why? Because profit is a lagging indicator, one that relies
on other factors – like increased sales or reduced overhead costs – in order to be reached. These
other factors are referred to as leading indicators.
But, there are many levels to leading indicators. Let’s take a look at reduced overhead costs.
Expenses associated with travel, shipping, manufacturing, human resources, and other business
functions all contribute to overhead. And increased sales can be impacted by sales to new
customers or sales to existing customers.
In this section we’ll focus on sales to existing customers, because its common knowledge that it is
far more profitable to generate repeat business than it is to solicit new clients. Many experts claim
that with skyrocketing advertising and marketing expenses, the cost of acquiring a new customer
can be as much as ten times more than the cost of selling additional products and services to
current accounts.
Types of BI Tools: Where They Fit In
How Business Intelligence Should Work6
Lower CostsIncreased Sales
IncreasedProfitability

So, a company striving to improve profitability may seek to:
Increase sales to existing customers ■
Maintain revenue levels from new clients ■
Reduce travel expenses by booking flights only on discount airlines ■
Each of these initiatives will be represented on the strategy map, and their importance will be
communicated to line of business workers, such as sales reps, or the administrative staff that is
responsible for making travel arrangements. The strategy map may look something like this:
The initiatives that link up to the overall strategy can drill further down into more specific and detailed
operational processes. For example, in order to sell more to existing customers, a company would
need to boost satisfaction levels. In order to improve customer satisfaction, service and support
staff, particularly agents in the contact center, will need to be more courteous and responsive.
Information Builders7
IncreasedProfitability
Maintain Salesto New
Customers
IncreasedRepeat Sales
Increased Sales
Lower TravelCosts
Lower Costs
IncreasedProfitability
Maintain Salesto New
Customers
IncreasedRepeat Sales
Increased Sales
Lower TravelCosts
Lower Costs
ImproveCustomer
Satisfaction
Reduce AverageWait Time

As the strategy, and the specific activities that will support it, are communicated throughout the
company, every individual right down to frontline workers like customer service staff will fully
understand how they play a role in corporate performance.
Strategy map from the WebFOCUS Performance Management Framework (PMF).
Periodic distribution of scorecard reports will then allow employees to view and monitor all key
factors, right down to the level of individual tasks. For example, how well is the customer support
team operating? And, how is each individual agent performing?
Cause and effect scorecard report from WebFOCUS Performance Management Framework (PMF).
Analytic Dashboards
While the strategy map and scorecard enable visualization and communication of high-level goals,
they do not facilitate the detection and correction of things that go awry. But, poor results in any
key area may help identify which aspects of the business need to be further analyzed.
How Business Intelligence Should Work8
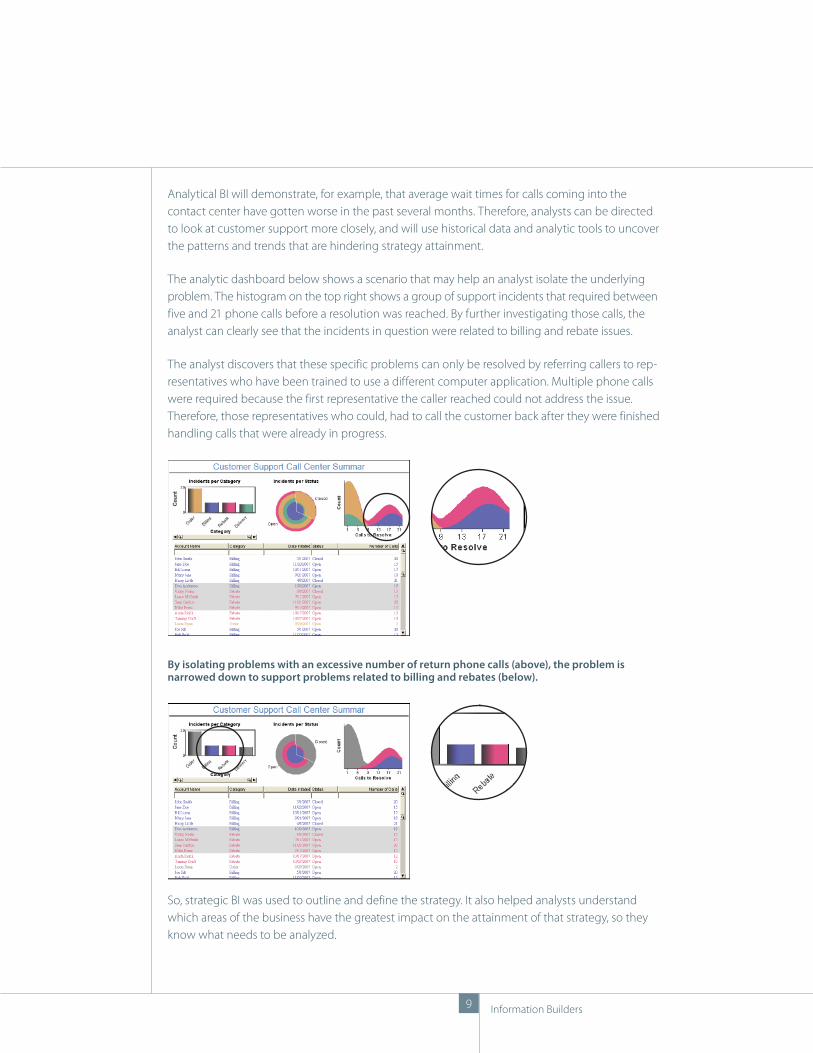
Analytical BI will demonstrate, for example, that average wait times for calls coming into the
contact center have gotten worse in the past several months. Therefore, analysts can be directed
to look at customer support more closely, and will use historical data and analytic tools to uncover
the patterns and trends that are hindering strategy attainment.
The analytic dashboard below shows a scenario that may help an analyst isolate the underlying
problem. The histogram on the top right shows a group of support incidents that required between
five and 21 phone calls before a resolution was reached. By further investigating those calls, the
analyst can clearly see that the incidents in question were related to billing and rebate issues.
The analyst discovers that these specific problems can only be resolved by referring callers to rep-
resentatives who have been trained to use a different computer application. Multiple phone calls
were required because the first representative the caller reached could not address the issue.
Therefore, those representatives who could, had to call the customer back after they were finished
handling calls that were already in progress.
By isolating problems with an excessive number of return phone calls (above), the problem is narrowed down to support problems related to billing and rebates (below).
So, strategic BI was used to outline and define the strategy. It also helped analysts understand
which areas of the business have the greatest impact on the attainment of that strategy, so they
know what needs to be analyzed.
Information Builders9

Next comes problem resolution. Although the above scenario is fictional, the resolution to
follow is based on a real-world initiative that was implemented at a leading telecommunications
provider. This organization effectively utilized both business intelligence and enterprise integration
to deploy a comprehensive operational BI solution.
Customer support information was stored in three separate databases, creating silos of customer data.
This problem is not unique to this company alone. In fact, it is quite common in many organiza-
tions today. Some of you may have experienced this firsthand, waiting on hold to be transferred to
another call center agent, or waiting for the right help desk representative to call you back.
The information contained within these disparate systems was integrated to build a real-time
customer support data warehouse. Transaction-by-transaction updates from all relevant systems
are sent to the warehouse. As a result, all customer-related information is fully centralized, so every
representative can work on and resolve any customer issue.
The days of putting a customer on hold or transferring them to another staff member were over.
Customer satisfaction ratings skyrocketed, repeat sales to existing clients rose sharply, and higher
profitability was easily achieved.
This is how BI should work.
How Business Intelligence Should Work10

Let’s look at two other real-world examples to see how the cycle of BI should work – with strategic
planning driving analytics, and analytics directing the focus of operational initiatives.
Case Study: Automobile Manufacturer
This success story highlights how a well-known automobile manufacturer used business
intelligence at every level of the organization to drive new efficiencies, and reach strategic goals.
The company was experiencing slipping revenues for each of the cars it produced, and
shareholders were demanding increased profitability. But, driving profitability is a multi-
faceted goal. One way to achieve it is to raise prices. However, in an industry as competitive as
automobiles, where buyers are very cost-conscious, that simply wasn’t an option.
Reducing costs is another way to boost profits. But, there are many factors that contribute to over-
head expenses – manufacturing, payroll, warranties, etc. The strategy map below depicts some of
the key initiatives that were agreed upon by senior management, and communicated throughout
the company’s ranks.
Note: The strategies depicted here are significantly simplified to ease understanding of the concepts presented in this paper. In real-world scenarios, these maps will have numerous layers and components. Analysis will typically point to many operational areas that are in need of improvement. Company management will then collaborate to prioritize these operational initiatives. In some cases, several operational initiatives will be underway at the same time. And in other situations, management will undertake smaller, less critical initiatives that can be accomplished quickly, instead of larger, more strategic ones that may take a longer time to complete.
The map helped the company’s business analysts focus their efforts on the right cost-cutting mea-
sures. During the course of their analysis activities, many questions arose. How could the company
cut costs, while maintaining high levels of product quality and support? Perhaps purchasing
cheaper parts from different suppliers would increase profits by reducing the cost of goods sold,
but this may compromise quality and result in higher warranty expenses down the road.
How BI Should Work: Real-World Successes
Information Builders11
GreaterProfitability Per
Automobile
Reduce ExcessiveService
Reduce RepeatServices
Use More ReliableTransmissions
Drive DealershipBest Practices
Lower WarrantyExpenses
LowerManufacturing
Costs
Increased Pricesby 5 Percent
Etc.

An analyst came up with the idea of increasing profitability by driving down warranty costs.
This could be accomplished by providing dealerships with fast and simple access to timely
information. Operating expenses could be dramatically reduced, without sacrificing quality. And,
the cost of building and deploying such a solution was minimal, since the supporting technology
infrastructure was already in place.
The resulting application enabled dealerships to more closely monitor and manage warranty
service, so practices could be optimized (for example, reducing the number of repeat service
appointments, and eliminating excessive service) to increase cost-efficiency. Additionally, since
the dealerships are not owned by the manufacturer (they are partners of the company who sell
and service the products), the application allowed competing dealerships to track each other’s
performance levels.
All performance-related data, including dealership ratings and comparisons, is communicated and
shared via the Internet-based warranty management system. Red flag alerts for repeat services
and other critical issues dynamically notify both the manufacturer and the dealer of potential
problems. When needed, inspectors and trainers are dispatched to delinquent dealerships to
address ongoing troubles.
Today, more than 60,000 employees – from service managers to mechanics – at 14,000 dealerships
use the application daily. As a result, the company has cut as much as $40 to 60 million dollars in
warranty costs, a reduction that contributed significantly to their goal of higher profits.
This is how BI should work.
Case Study: Commercial Airline
The pressures of competition, combined with higher fuel prices, were causing a major airline
to lose money. Those at the highest levels of the organization gave this charge to company
employees – find a way to regain profitability.
But limited budgets made the aggressive advertising and marketing campaigns needed to boost
sales impossible. So, profits would need to be driven through improved operational efficiencies.
The strategy map below depicts part of the company’s strategy to improve profit margins. The
majority of the strategy is aimed at increasing productivity.
An analyst at the airline noticed that many flights, which were typically filled to capacity, were not
selling all their seats. Further investigation showed that trivial maintenance issues, such as a faulty
seat-back table or a torn seat cushion, were preventing the airline from selling tickets for those
seats. But, maintenance workers weren’t always notified of these problems in a timely manner,
because repair-related information was distributed across three disparate applications.
How Business Intelligence Should Work12

What the airline needed was real-time information that would expedite service to planes between
flights. Developers built a report that combines data from the distinct operational sources:
The primary maintenance system, which contains information about plane problems such as ■
broken seats
The parts inventory system, which stores data about the location of replacement parts needed ■
for repairs
The plane routing system, where scheduling information resides ■
This single report keeps all maintenance workers informed about which planes need repairs,
which parts are required to make those repairs, and where those planes are. This enables them
to fix each problem as soon as possible. And, by ensuring that maintenance issues are fixed in the
timeliest fashion possible, the airline can increase seat sales. As a result of this single report, as well
as other operational initiatives, the company quickly returned to its previous levels of profitability.
This is how BI should work.
Note: The strategies depicted here are significantly simplified to ease understanding of the concepts presented in this paper. In real-world scenarios, these maps will have numerous layers and components. Analysis will typically point to many operational areas that are in need of improvement. Company management will then collaborate to prioritize these operational initiatives. In some cases, several operational initiatives will be underway at the same time. And in other situations, management will undertake smaller, less critical initiatives that can be accomplished quickly, instead of larger, more strategic ones that may take a longer time to complete.
Information Builders13
Increase AverageFlight Capacity
Accelerate SeatMaintenance
Return toProfitability
Improve Per-Flight Profits
Lower Payrollby 4 Percent
Increased Pricesby 5 Percent
Etc.

In my experience, organizations who commit to improving their performance through information-
sharing will move through various levels of maturity in their use of business intelligence and inte-
gration technologies. At any given point in time, they will fall into one of the five categories below.
Basic (Management Only)
Organizations in this stage provide reporting to workers at the executive and middle-management
level only. Business is typically run month to month or quarter to quarter. Although reports are
available more frequently, the end of each weekly, monthly, or quarterly cycle are the heaviest BI
usage times. BI is used to monitor but not necessarily manage and guide the business. Information
is looked at as secure and proprietary, and results will often be hidden from lower-level employees
for reasons executives can’t explain. Change is often based on the gut-feel of senior management.
Basic (Shared)
At this level, reports are utilized in the same way as in the previous level. However, the insight gained
from them is looked at more openly, and more readily communicated throughout the organization.
This type of company is more likely to institute change and ideas that come from the bottom up,
instead of relying solely on executive intuition.
Intermediate
These organizations recognize the importance of creating a strategy and communicating it down
through the ranks. They also understand that sharing and monitoring performance at all levels
facilitates greater collaboration and coordination among business units and individual employees.
As a result, they are implementing performance management and analytic solutions, and
promoting analysis at the business unit level, so managers can leverage corporate information to
identify potential organizational improvements.
Advanced
Advanced organizations are aware of the cycle of business intelligence, and understand the
connection between strategic, analytical, and operational intitiatives. Strategy and performance
are clearly communicated to those employees on the frontlines. Analysis is targeted at critical areas
of the business. Frontline workers are armed with access to real-time information, to acclerate and
improve operational decision-making. And, people at all levels collaborate to develop new ideas
for efficiency enhancements.
Expert
What could be better than the advanced use of information? The truth is, companies who have
reached the advanced level have often realized maximum efficiency from the information they
currently have. It’s those expert businesses that have learned to take it a step further.
In addition to previously being BI users at the advanced level who fully understand the entire BI
cycle, expert organizations have two key traits. They are forward-thinking and have implemented
predictive analytics at the operational level to anticipate the factors that affect core activities. For
example, they may predict the customers that are most likely to remain loyal or those most likely
to defect – and use that information to maximize retention. Or, they may predict inventory levels
for more effective demand planning.
Business Intelligence Maturity Level
How Business Intelligence Should Work14

These experts also use business intelligence outside their walls, making information readily
accessible to the extended enterprise. This drive efficiencies not only with internal employees,
but with customers, vendors, agents, resellers, and other strategic business partners. We even see
expert organizations that are looking for ways to generate revenue by utilizing the information
they collect.
The Business Intelligence Maturity Scale
Information Builders15
Monthly and quarter-
ly reports are shared
by management only.
Change is instituted
from the top down
and very slowly.
Monthly and quarter-
ly reports are shared
throughout the orga-
nization. It’s more
likely that change is
only instituted from
bottom up. Change is
instituted slowly.
Performance manage-
ment and analytics
are used more often
to promote and com-
municate change.
Analysis is implement-
ed but not directly
connected to strategy.
The business
intelligence cycle
is instituted and
connected through
all three levels:
strategic, analytical,
and operational.
Frontline operational
initiatives are
implemented within
the organization.
The business
intelligence cycle
is instituted and
connected through
all three levels in
the advanced stage.
New initiatives are
focusing on change
through predictive
analytics and
outbound customer-
and partner-facing
operational initiatives.
Basic (Executives) Basic (Shared) Intermediate Advanced Expert

The topics in this paper highlight a pragmatic approach to utilizing business intelligence software
in general. To conclude, let’s discuss WebFOCUS from Information Builders, and what makes it
the best choice for supporting enterprise-wide initiatives that embrace strategic, analytical, and
operational BI.
Ease of Use
WebFOCUS is specifically designed to empower developers to rapidly build BI applications that
can be utilized by employees at all levels. This expands business intelligence far beyond analysts
and power users – who have always been able to employ complex BI tools – and makes it readily
available to line of business workers who require operational reporting to support their day-to-day
activities and drive process efficiencies across functions.
Scalability
The BI applications that have the greatest impact on operational efficiency are those that are used
by frontline workers, as well as customers and external partners. Therefore, BI environments need
to scale to thousands, tens of thousands, or even millions of users.
WebFOCUS delivers optimum scalability in three areas:
Performance. ■ Companies can build BI applications that support thousands of simultaneous
users, without the need to spend millions of dollars on additional hardware.
Price. ■ Enabling millions of users to retrieve enterprise data is not cost-prohibitive with
WebFOCUS.
Users. ■ Applications built with WebFOUCS are so simple and intuitive that even business
professionals with no technical savvy can run their own reports, with little or no training.
Integration
Business intelligence has had limited impact in many organizations because the solutions used
do not properly support the complexities associated with operational initiatives. For example, the
scope of some of the integration scenarios described in this paper go far beyond the capabilities
of many BI tools on the market today.
Operational BI requires unhindered access to real-time data. Additionally, in many operational
initiatives, vastly different back-end systems must be tightly linked in order to solve a problem.
Therefore, companies need more than BI tools. They need integration software – something that
many BI solutions are lacking.
However, WebFOCUS is built on a robust integration platform that can access and leverage over
300 unique data sources running on over 35 different platforms. So any data, anywhere, can be
effectively used to support operational initiatives.
Conclusion
How Business Intelligence Should Work16

Platform Independence
WebFOCUS can run on any platform and can leverage any enterprise data. So, it allows orga-
nizations to configure the most flexible and fully integrated solution to fit their specific needs
and infrastructure.
Support for the Entire BI Cycle With One, Tightly-Integrated Solution Suite
WebFOCUS is unique in its ability to link all three levels of business intelligence. Information in trans-
action systems can be accessed directly for operational reporting purposes. That same data can also
be incorporated into data warehouses for in-depth analysis by analysts. And, it can be combined
with other information, and aggregated to create key performance indicators (KPIs) for the WebFOCUS
Performance Management Framework, a powerful performance management system.
Information Builders17

Worldwide Offices
Corporate Headquarters Two Penn Plaza, New York, NY 10121-2898 (212) 736-4433 Fax (212) 967-6406 DN7505928.0109
informationbuilders.com [email protected]
Canadian Headquarters 150 York St., Suite 1000, Toronto, ON M5H 3S5 (416) 364-2760 Fax (416) 364-6552
For International Inquiries +1(212) 736-4433
Copyright © 2009 by Information Builders. All rights reserved. [80] All products and product names
mentioned in this publication are trademarks or registered trademarks of their respective companies.
Printed in the U.S.A.
on recycled paper
North America
United States ■ Atlanta,* GA (770) 395-9913
■ Baltimore, MD Professional Services:
(703) 247-5565
Boston,* ■ MA (781) 224-7660
Channels, ■ (800) 969-4636
Charlotte, ■ NC Professional Services:
(704) 494-2680
Chicago,* ■ IL (630) 971-6700
Cincinnati,* ■ OH (513) 891-2338
Dallas,* ■ TX (972) 490-1300
Denver,* ■ CO (303) 770-4440
Detroit,* ■ MI (248) 641-8820
Federal Systems,* ■ DC (703) 276-9006
Hartford, ■ CT (860) 249-7229
Houston,* ■ TX (713) 952-4800
Los Angeles,* ■ CA (310) 615-0735
Minneapolis,* ■ MN (651) 602-9100
New Jersey* ■ Sales: (973) 593-0022
New York,* ■ NY Sales: (212) 736-7928
Professional Services: (212) 736-4433, ext. 4443
Orlando,* ■ FL (407) 804-8000
Philadelphia,* ■ PA Sales: (610) 940-0790
Phoenix, ■ AZ (480) 346-1095
Pittsburgh, ■ PA Sales: (412) 494-9699
St. Louis,* ■ MO (636) 519-1411
San Jose,* ■ CA (408) 453-7600
Seattle, ■ WA (206) 624-9055
Washington,* ■ DC Sales: (703) 276-9006
Professional Services: (703) 247-5565
Canada
Information Builders (Canada) Inc.Calgary ■ (403) 538-5415
Ottawa ■ (613) 233-0865
Montreal* ■ (514) 421-1555
Toronto* ■ (416) 364-2760
Vancouver ■ (604) 688-2499
Mexico
Information Builders MexicoMexico City ■ 52-55-5062-0660
Australia Information Builders Pty. Ltd.
Melbourne* ■ 61-3-9631-7900
Sydney* ■ 61-2-8223-0600
EuropeBelgium* ■ Information Builders Belgium
Brussels 32-2-7430240
France* ■ Information Builders France S.A.
Paris 33-14-507-6600
Germany ■ Information Builders (Deutschland)
Eschborn* 49-6196-77576-0
Netherlands* ■ Information Builders
(Netherlands) B.V.
Amsterdam 31-20-4563333
Portugal ■ Information Builders Portugal
Lisbon 351-217-217-400
Spain ■ Information Builders Iberica S.A.
Barcelona 34-93-344-32-70
Bilbao 34-94-452-50-15
Madrid* 34-91-710-22-75
Switzerland ■ Information Builders Switzerland AG
Dietlikon 41-44-839-49-49
United Kingdom* ■ Information Builders (UK) Ltd.
London 44-845-658-8484
RepresentativesAustria ■ Raiffeisen Informatik Consulting GmbH
Vienna 43-12-1136-3870
Brazil ■ InfoBuild Brazil Ltda.
São Paulo 55-11-3285-1050
China ■
InfoBuild China, Inc.
Shanghai 86-21-5080-5432
Rongji Software Technology Co., Ltd.
Beijing 86-10-5873-2031
Denmark ■ InfoBuild AB
Kista, SE 46-735-23-34-97
Egypt ■ Al-Hisn Al-Waqi (AHAW)
Riyadh, SA 996-1-4412664
Ethiopia ■ MKTY IT Services Plc
Addis Ababa 251-11-5501933
Finland ■ InfoBuild Oy
Vantaa 358-207-580-840
Greece ■ Applied Science
Athens 30-210-699-8225
Guatemala ■ IDS de Centroamerica
Guatemala City 502-2412-4212
Gulf States ■ Al-Hisn Al-Waqi (AHAW)■ Bahrain ■ Kuwait ■ Oman ■ Qatar ■ United Arab Emirates ■ Yemen
Riyadh, SA 996-1-4412664
India* ■ InfoBuild India
Chennai 91-44-42177082
Israel ■ SRL Group Ltd.
Tel Aviv 972-3-7662030
Italy ■ NessPRO Italy S.p.A.
Genoa 39-010-64201-224
Milan 39-02-2515181
Turin 39-011-5513-211
Japan ■ K.K. Ashisuto
Osaka 81-6-6373-7113
Tokyo 81-3-5276-5863
Jordan ■ Al-Hisn Al-Waqi (AHAW)
Riyadh, SA 996-1-4412664
Malaysia ■ Elite Software Technology Sdn Bhd
Kuala Lumpur 60-3-21165682
Norway ■ InfoBuild Norway
Oslo 47-23-10-02-80
Philippines ■ Beacon Frontline Solutions, Inc.
Makati City 63-2-750-1972
Poland/Central and Eastern Europe ■ InfoBuild SP.J.
Warsaw 48-22-657-00-14
Russian Federation ■ FOBOS Plus Co., Ltd.
Moscow 7-495-124-0810
Saudi Arabia ■ Al-Hisn Al-Waqi (AHAW)
Riyadh 996-1-4412664
Singapore ■
Automatic Identification Technology Ltd.
Singapore 65-6286-2922
South Africa ■
InfoBuild South Africa (Pty.) Ltd.
Gauteng 27-83-4600800
Fujitsu Services (Pty.) Ltd.
Johannesburg 27-11-2335911
South Korea ■
Unitech Infocom Co. Ltd.
Seoul 82-2-2026-3100
UVANSYS
Seoul 82-2-832-0705
Sweden ■ InfoBuild AB
Kista 46-735-23-34-97
Taiwan ■ Galaxy Software Services
Taipei 886-2-2586-7890
Thailand ■ Datapro Computer Systems Co. Ltd.
Bangkok 662-679-1927, ext. 200
Venezuela ■ InfoServices Consulting
Caracas 58-212-763-1653
Toll-Free NumberSales, ISV, VAR, and SI Partner Information ■
(800) 969-4636
* Training facilities are located at these branches.


![[Vietnam Mobile Day 2013] - Business intelligence driven marketing](https://img.pdfslide.us/doc/110x75/5445dd25afaf9fdf2a8b46b5/vietnam-mobile-day-2013-business-intelligence-driven-marketing.jpg)
