Embed Size (px)
Citation preview

How BorgWarner Drives Global Supply Chain Visibility
Big Data and Business Analytics ConferenceMarch 23rd, 2018

2
Agenda
• Introductions
• Qlik Business Intelligence for procurement & supply chain
• Supply Chain Analytics at BorgWarner
• What makes us Qlik

3
About Qlik
Founded in 1993HQ in Radnor, PA, USA
+40,000 customers and1,700 partners in more
than 100 countries
10 years’ growth outpacing market
More than 2,500employees
+40,0001,700100

Poor Excellent
48%
37%11%
1% 3%
Source: eft Information 2015 CSCO Report
Supply Chain Executives Challenges & Performance
The Top 3 Business Challenges Driving the Supply Chain Agenda
How Respondents Rate their own Supply Chain
CostContainment& Reduction
Inventory Management
& Optimization
Demand Variability
(Forecasting)


Aug 10, 2017
Driving Supply Chain Visibility at BorgWarner
Dennis RusiewskiMonica Kedzierski

Copyright © 2016 BorgWarner Inc. 7
Business Challenge Starting Point Data is There… But it’s Hard to See Volume, Velocity & Variety of Supply Chain Data Tool Selection From Vision to Reality Business Impact
Agenda

© BorgWarner Inc. 8
BorgWarner at a glance
27,000employees
2016 Sales
$9.07 Billion
consolidated
Financial and Employee information as of December 31, 2016. Locations as of November 21, 2016
62 Locations
17 Countries

© BorgWarner Inc. 9
Strategic Global Operations
BorgWarner partners with customers around the world to bring the right technology to market at the right value.
Locations as of November 21, 2016
24locations
in the Americas
16locationsin Europe
22locationsin Asia

Copyright © 2016 BorgWarner Inc. 10
BorgWarner is experiencing growth. Supply Chain is a key driver of competitiveness, innovation, and profitability. IT systems did not provide visibility vertically or horizontally across our Businesses.
Business Challenge
Our Goal: Transform Supply Chain systems to enable BorgWarner’s growth strategy for the next 5-10 years

Copyright © 2016 BorgWarner Inc. 11
Starting Point
State-of-the-art home… built without a blueprint
• 160 Rooms• 6 Kitchens• Gas lights
Builders Architects
147Wor
kfor
ce
65 Doors to blank walls13 Staircases abandoned24 Skylights into floors
Construction time – 38 Years
Results
• 47 Fireplaces• 10,000 Windows• Intercoms
The Winchester Mystery House

Copyright © 2016 BorgWarner Inc. 12
Data is There…..But it’s Hard to See

Copyright © 2016 BorgWarner Inc. 13
Volume, Velocity & Variety of Supply Chain Data -
Supply Chain DataBusiness Warehouse
Require New Approach

Copyright © 2016 BorgWarner Inc. 14
Supply Chain Data
11
11
11
1
ERP/ Business Warehouse
SAP HANA BIG DATA/Qlik Sense
Require New Approach
Volume, Velocity & Variety of Supply Chain Data -

Copyright © 2016 BorgWarner Inc. 15
High Priority Tool Selection Criteria for Supply Chain
Self-service data visualization
Quickly harmonize and apply business rules to data from multiple sources
Ability to handle transactional-level detail with high performance
Efficient integration with SAP data
Rapid development and deployment capability
Full text index search capability
Mobile device ready

Copyright © 2016 BorgWarner Inc. 16
Global Supply Chain Visibility
Disclaimer: For demonstration purposes all vendors and spend values have been randomized

Copyright © 2016 BorgWarner Inc. 17
Supply Chain Cost Reduction
Disclaimer: For demonstration purposes all vendors and cost reduction values have been randomized

Copyright © 2016 BorgWarner Inc. 18
Business Impact
Enabled culture of data-driven decision making
Delivered global visibility and ease of use
Communicate actionable insights in near real time
Drive corporate competitiveness and profitability
Enable success of BorgWarner growth strategy

Copyright © 2016 BorgWarner Inc. 19
Shipping to multiple RU’s around the world Awarded Strategic Programs “Some Quality Issues”, but continued to be on the Grow list
Business Impact Example– Supplier Strategy
0
1,000
2,000
3,000
4,000
5,000
2013 2014 2015 2016 2017 2019 2020
Supplier X– Rapid Business Growth
41 CPM’s in 2.5 Years Affecting 5 locations 1 Unauthorized Change Average 8D Closure Time : 260 Days
*Over 300 hours spent on quality issues
4 RU’s now have an active exit plan
Qlik Provided a Clear Quality Story
*Spend in ‘000s USD

Copyright © 2016 BorgWarner Inc. 20
• Target solving business problems• Target initial projects that are not overly complex but have high ROI• Actionable Information is great - someone needs to act on it• Ensure you have a strong Executive sponsor• Team up with companies willing to be mentors• Implement a strong governance process • Partner with IT but Business owns the data• Expect push back from IT – disruptive technology• Select the right BI tool
Lessons Learned

See the whole story that lives within your dataInnovative associative model enables users to probe all the possible associations that exist in their data, across all data sources, to answer not just “What happened?”, but “Why?”, and “What is likely to happen?”
A platform for all your visual analytics needsMore than a tool, Qlik’s platform approach enables centrally deployed guided analytics, self-service data visualization, embedded and custom built analytics, collaboration, and reporting
Agility for the business user, with trust and scale for ITSupports the business and IT; data sourcing and preparation, visualization and analytics, collaboration, and reporting — all within a governed framework
Why our approach is uniqueA visual analytics platform
22
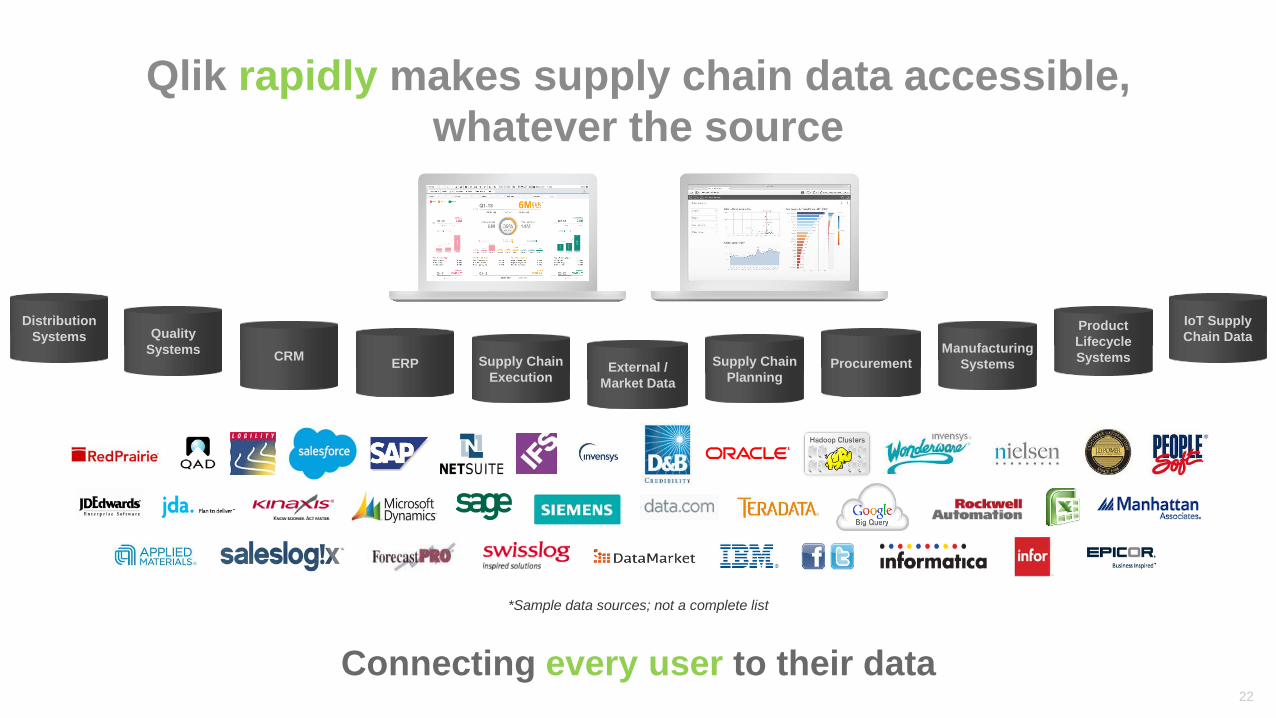
*Sample data sources; not a complete list
Qlik rapidly makes supply chain data accessible, whatever the source
Connecting every user to their data
ERP ProcurementExternal / Market Data
CRM
Product Lifecycle SystemsSupply Chain
Execution
Quality Systems Manufacturing
SystemsSupply Chain Planning
IoT Supply Chain Data
Distribution Systems

23
Qlik platform-enabled visual analytics
Embedded analytics
Custom analytics applications
Self-service data visualization
Qlik® Analytics Platform®
Qlik Sense® Enterprise
Guidedanalytics
Reporting and collaboration
Qlik® NPrintingTM
Decentralized analysis and exploration for
individuals and groups
Centrally deployed guided analytics to multiple knowledge workers
Analytics embedded in web and enterprise
applications
Custom-built analytics applications for internal
and external use
Pixel-perfect report distribution and storytelling
across the enterprise
QlikView®

experience it for yourself
Create an appQlik.com/download
Share an appQlikcloud.com
Try an appSense-demo.qlik.com
Test your skillsQlik.com/us/services/training/skills-assessment

25
Contact Information
Monica KedzierskiEnterprise Global Supply ManagementBorgWarner [email protected]. 248-396-9729
John TruskowskiTerritory Sales Manager (Michigan)[email protected]. 248-312-8740

Questions?