Embed Size (px)
Citation preview

ISEN 614 Advanced Quality Control (Anomaly and Change Detection) Dr. Yu Ding
1
Hotelling T2 control chart
• CASE II: the in-control µ0 and 0 are NOT known. We need to
estimate them from training data.
• CASE II(a), when n = 1

ISEN 614 Advanced Quality Control (Anomaly and Change Detection) Dr. Yu Ding
2
Hotelling T2 control chart
• CASE II(a): when n = 1.
- Test statistic
- Its distribution and UCL

ISEN 614 Advanced Quality Control (Anomaly and Change Detection) Dr. Yu Ding
3
Hotelling T2 control chart
• Derivation of the distribution of T2 under CASE II(a)

ISEN 614 Advanced Quality Control (Anomaly and Change Detection) Dr. Yu Ding
4
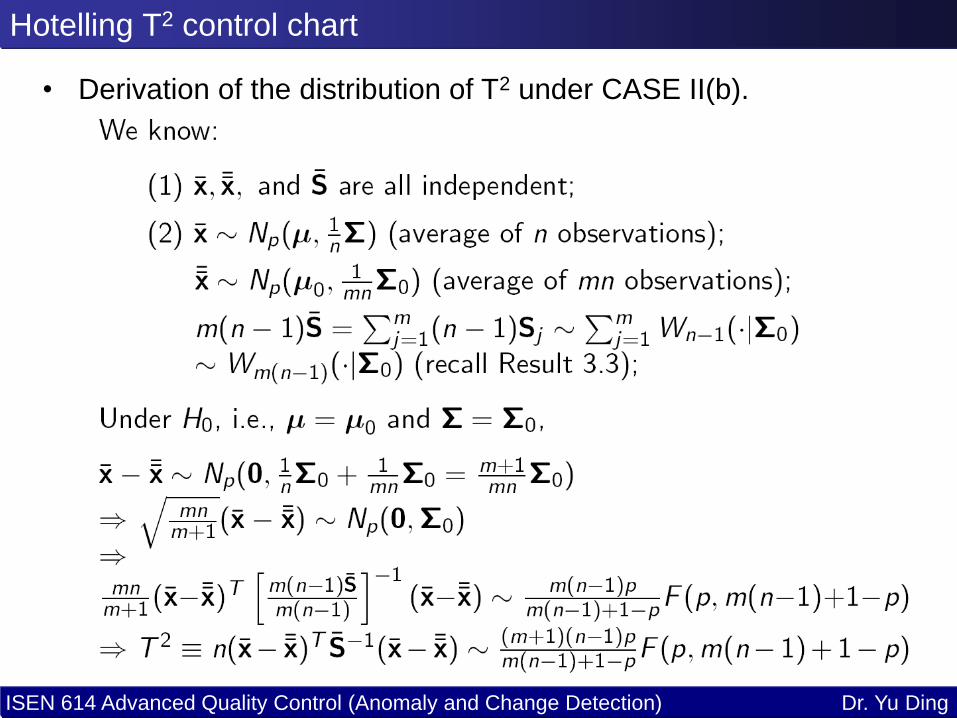
Hotelling T2 control chart
• CASE II(b): when n > 1.

ISEN 614 Advanced Quality Control (Anomaly and Change Detection) Dr. Yu Ding
5
Hotelling T2 control chart
• CASE II(b): when n > 1.
- Test statistic
- Its distribution and UCL
ISEN 614 Advanced Quality Control (Anomaly and Change Detection) Dr. Yu Ding
6
Hotelling T2 control chart
• Derivation of the distribution of T2 under CASE II(b).

ISEN 614 Advanced Quality Control (Anomaly and Change Detection) Dr. Yu Ding
7
Hotelling T2 control chart
• Relation of UCL under CASE II(b) to UCL under CASE I
• Be aware that how large m (and n) should be is relative to the value of
p. For example, for n=5, in order for 2 distribution to approximate F
distribution,p m required
2 > 50
10 >75
20 > 100
ISEN 614 Advanced Quality Control (Anomaly and Change Detection) Dr. Yu Ding
8
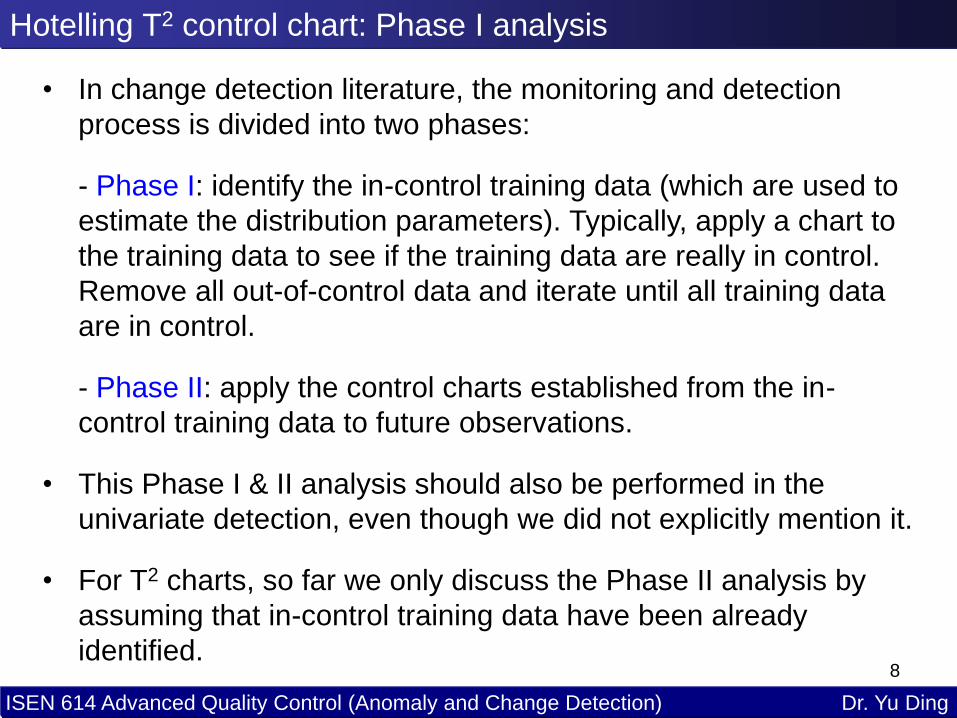
Hotelling T2 control chart: Phase I analysis
• In change detection literature, the monitoring and detection
process is divided into two phases:
- Phase I: identify the in-control training data (which are used to
estimate the distribution parameters). Typically, apply a chart to
the training data to see if the training data are really in control.
Remove all out-of-control data and iterate until all training data
are in control.
- Phase II: apply the control charts established from the in-
control training data to future observations.
• This Phase I & II analysis should also be performed in the
univariate detection, even though we did not explicitly mention it.
• For T2 charts, so far we only discuss the Phase II analysis by
assuming that in-control training data have been already
identified.

ISEN 614 Advanced Quality Control (Anomaly and Change Detection) Dr. Yu Ding
9
Hotelling T2 control chart: Phase I analysis
• Phase I analysis: when n > 1

ISEN 614 Advanced Quality Control (Anomaly and Change Detection) Dr. Yu Ding
10
Hotelling T2 control chart: Phase I analysis
• Derivation of the distribution of T2 for Phase I analysis

ISEN 614 Advanced Quality Control (Anomaly and Change Detection) Dr. Yu Ding
11
Hotelling T2 control chart: Phase I analysis
• Derivation of the distribution of T2 for Phase I analysis

ISEN 614 Advanced Quality Control (Anomaly and Change Detection) Dr. Yu Ding
12
Hotelling T2 control chart: Phase I analysis
• Phase I analysis: when n = 1
How good is this
approximation?
dist UCL
F 35.72
2 17.6
exact 12.0
for one chosen set of
p, n, m, and α.

ISEN 614 Advanced Quality Control (Anomaly and Change Detection) Dr. Yu Ding
13
Hotelling T2 control chart: Summary
• Summary table for Hotelling T2 control charts

ISEN 614 Advanced Quality Control (Anomaly and Change Detection) Dr. Yu Ding
14
Hotelling T2 control chart: Example 3.3
• Example 3.3 T2 chart. Study the Madison, Wisconsin, Police
Department data shown in the following table.
- Use data on x1 = Legal Appearances Hours and x2= Extraordinary Event
Hours, construct a T2 chart. Does the process represented by the
bivariate observations appear to be in control? set =0.05.
- Using the data of x1 = Legal Appearances Hours and x2= Extraordinary
Event Hours to estimate 0 and 0 for future observation x=(x1, x2)T

ISEN 614 Advanced Quality Control (Anomaly and Change Detection) Dr. Yu Ding
15
Hotelling T2 control chart: Example 3.3
• (Example 3.3)
T2 chart 95% probability contour

ISEN 614 Advanced Quality Control (Anomaly and Change Detection) Dr. Yu Ding
16
Hotelling T2 control chart: Example 3.3
• (Example 3.3)
revised T2 chart

ISEN 614 Advanced Quality Control (Anomaly and Change Detection) Dr. Yu Ding
17
Multivariate CUSUM chart
• As we mentioned before, Hotelling T2 chart does not perform
well when the magnitude of change is small, just like what a
Shewhart suffers. We can increase the sample size, or we can
implement a multivariate version of CUSUM or EWMA to help
enhance the sensitivity of detection for small changes.
• Basic setting.

ISEN 614 Advanced Quality Control (Anomaly and Change Detection) Dr. Yu Ding
18
Multivariate CUSUM chart
• Procedure for m-CUSUM
ISEN 614 Advanced Quality Control (Anomaly and Change Detection) Dr. Yu Ding
19
Multivariate CUSUM chart
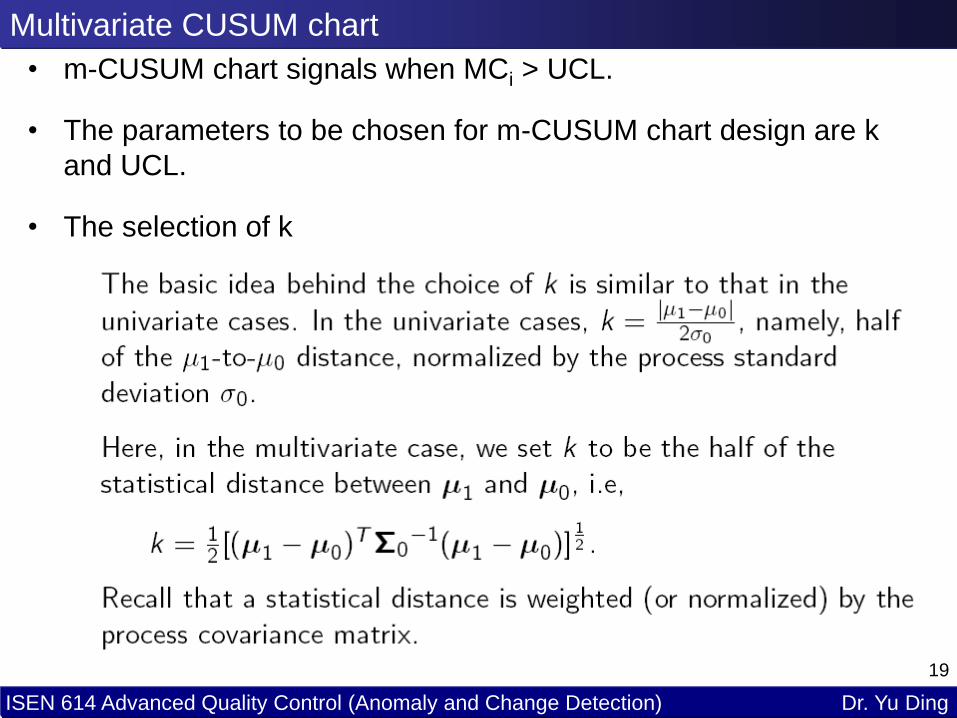
• m-CUSUM chart signals when MCi > UCL.
• The parameters to be chosen for m-CUSUM chart design are k
and UCL.
• The selection of k

ISEN 614 Advanced Quality Control (Anomaly and Change Detection) Dr. Yu Ding
20
Multivariate CUSUM chart
• The selection of UCL
- We have to utilize the Monte Carl simulation method to
evaluate the ARL under a choose UCL.
- Some results have been documented in literature.
- The above figure only list UCL's for p = 2, 3, and 10. In case
that you have a p that is not tabulated, you can find the UCL
by interpolation.

ISEN 614 Advanced Quality Control (Anomaly and Change Detection) Dr. Yu Ding
21
Multivariate EWMA chart
• Same set up as in m-CUSUM, and still n = 1. After collecting the
ith observation, define:
• An m-EWMA chart signals when:

ISEN 614 Advanced Quality Control (Anomaly and Change Detection) Dr. Yu Ding
22
Multivariate EWMA chart
• Selection of r and UCL
- Selection of r is very similar to the selection of in the
univariate case. A small r gives longer memory and is good
for detection small changes, while a large r gives shorter
memory and is good for detecting large changes. When
r = 1, an m-EWMA becomes a T2 chart.
- Selecting UCL

ISEN 614 Advanced Quality Control (Anomaly and Change Detection) Dr. Yu Ding
23
Multivariate EWMA chart
Note that here in the table is the statistical distance between
µ0 and the shifted mean we try to detect.

ISEN 614 Advanced Quality Control (Anomaly and Change Detection) Dr. Yu Ding
24
Multivariate EWMA chart: Example 3.4
• Example 3.4: Try to use a CUSUM chart to see if there is any
change in the Madison, Police Department data in Example 3.3.
Select control limits corresponding to ARL0 =200, and use
k=0.5, where is the mean shift to be
detected.
• Here p = 5. But in the data table given in the previous slide, the
UCLs for ARL0=200 and p= 2, 3 and 10 are listed. We need to
utilize an interpolation to decide UCL for p = 5.
2)()()( 01
1
011 μμΣμμμ
T
44.5
55.5
66.5
77.5
88.5
99.510
0 1 2 3 4 5 6 7 8 9 10 11
UCL
p
UCL for p = 5
is estimated as 6.6.

ISEN 614 Advanced Quality Control (Anomaly and Change Detection) Dr. Yu Ding
25
Multivariate EWMA chart: Example 3.4
• Example 3.4: The CUSUM chart: plot the statistic and upper control
limit in the following figure. There is not data point out of control. The
overall process (with five random variables) is stable.

ISEN 614 Advanced Quality Control (Anomaly and Change Detection) Dr. Yu Ding
26
Multivariate EWMA chart: Example 3.4
• Example 3.4: Construct a multivariate EWMA chart for the data of
x1 = Legal Appearances Hours and x2= extraordinary event hours in the
above Table in Example 3.3, with in-control ARL 200. This
multivariate EWMA chart will be used to detect a mean shift of =1
(here means the statistical distance of a mean shift, not the constant
in the univariate EWMA).
• Given that =1, p=2 and ARL0= 200, r is chosen as 0.16 and h4= 9.35.
The MEWMA chart is plotted as follows. There is no signal of out of
control.
m-EWMA
chart

ISEN 614 Advanced Quality Control (Anomaly and Change Detection) Dr. Yu Ding
27
Multivariate EWMA chart: Example 3.4
• Example 3.4: The conclusion appears different from the T2 chart in
Example 3.3. In fact, when we apply the EWMA chart, we first centered
the x's, namely that the mean of x were subtracted. Does that explain
the difference in the charts?
• If we apply T2 to the centered x1 and x2 with an alpha=0.05, the T2
chart looks like
0 2 4 6 8 10 12 14 160
1
2
3
4
5
6
7
8
9
10
UCL=5.99 for α=0.05

ISEN 614 Advanced Quality Control (Anomaly and Change Detection) Dr. Yu Ding
28
Multivariate EWMA chart: Example 3.4
• Example 3.4: One of the reasons for this discrepancy is that we
selected different values of error. We set = 0.05 when using T2
chart. But when we use h4 in the EWMA, it corresponds to ARL0=200.
Although ARL0 does not exactly equal to 1/ for a control chart other an
x-bar chart, we may use 1/ as an approximation to elaborate the
difference.
• When set =0.05, the ARL0 for T2 chart is about 20, which is far smaller
than ARL0=200 as when the EWMA is used. That is, the m-EWMA
chart will see much fewer alarms than the T2 chart (only about one-
tenth of T2 chart). That intuitively explains why when we saw an out-of-
control process indicated in the T2 chart but was not detected by the m-
EWMA.
ISEN 614 Advanced Quality Control (Anomaly and Change Detection) Dr. Yu Ding
29
Multivariate EWMA chart: Example 3.4
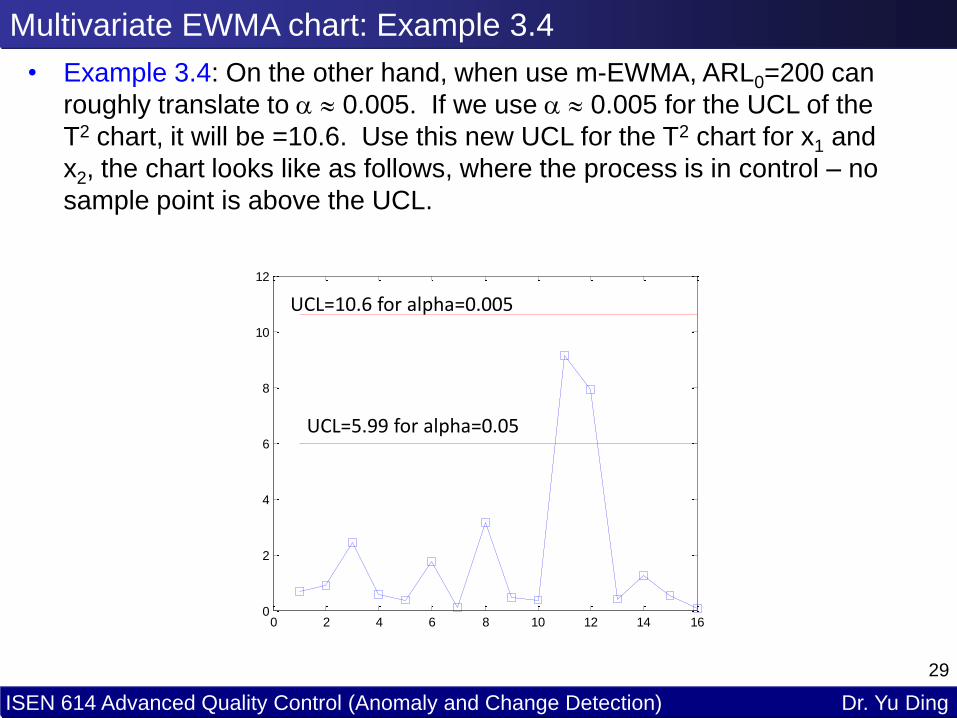
• Example 3.4: On the other hand, when use m-EWMA, ARL0=200 can
roughly translate to 0.005. If we use 0.005 for the UCL of the
T2 chart, it will be =10.6. Use this new UCL for the T2 chart for x1 and
x2, the chart looks like as follows, where the process is in control – no
sample point is above the UCL.
0 2 4 6 8 10 12 14 160
2
4
6
8
10
12
UCL=5.99 for alpha=0.05
UCL=10.6 for alpha=0.005

ISEN 614 Advanced Quality Control (Anomaly and Change Detection) Dr. Yu Ding
30
Multivariate EWMA chart: Example 3.4
• Example 3.4: we plot T2 and EWMA together on the same graph: the
dotted black line is EWMA and the blue solid line is T2. We find that
had we used a much smaller UCL for m-EWMA, it will not identify the
same out-of-control points as the T2 chart did. That is because here we
have a spike-type change (a type of change different from a sustained
mean shift) and EWMA is not sensitive to detecting a spike. Rather,
EWMA is good at detecting a sustained mean shift.
0 2 4 6 8 10 12 14 160
2
4
6
8
10
12
UCL=10.6 for alpha=0.005
h4=9.35 for m-EWMA
UCL=5.99 for alpha=0.05


![by - Virginia Tech...Klatt [24] formulated an economic process control model based on dependent multiple characteristics and utilized the Hotelling T2 control chart. Latimer et al](https://img.pdfslide.us/doc/110x75/5fb0217097417e1371194ea4/by-virginia-tech-klatt-24-formulated-an-economic-process-control-model-based.jpg)