Embed Size (px)
Citation preview

Horizon Oil (HZN.AX) 4 March 2020
HZN ends 1H21 with net cash of US$11m HZN reported 1H21 sales of US$26.3m, down 50% on the previous comparable period (pcp) of US$52.7m and an underlying NPAT of US$0.4m down over 100% on pcp (US$9.5m). This primarily reflected lower oil production (0.65 mm barrels (bbl) versus 0.75 mm bbl in the pcp) and lower oil prices (average Brent lowered from US$62 /bbl to ~US$44/bbl from 1H20 to 1H21).
On and off market buy backs announced. Given HZN’s strong capital position it has announced an on-market buy-back of up to 100m shares (~8% of issued equity) and an off market buy back at $0.083 per share of unmarketable parcels (~1,300 shareholders with less than 6,329 shares so ~4m shares at a total potential cost of ~US$0.25m).
We note that the IMC options (300m at A$0.061) are now well in the money so we would expect them to be exercised before expiry in September 2021 raising A$18.3m.
HZN will repay US$15m of debt in 2H21 and had net cash of US$11m at 31 December. Assuming the options exercise (US$14m) and HZN is free cash flow positive in the 2H (very conservative assumption given current Brent oil price), HZN could buy back all 100m shares at an average price of $0.125 and still end the year in a net cash position.
Beibu development fabrication on track The final investment decision (FID) was made on the WZ12-8 East project in China (HZN interest 26.95%) in October 2020. The WZ12-8 East project is the first phase of a possible multi-phase development, depending on how successful the initial production is. The first phase is forecast to recover 0.6 mm bbls (HZN's share). HZN share of the capital costs is ~US$15m. The fabrication of the well head platform has been commenced and is progressing well. First production is forecast to be in Q1 2022 at ~4,000 bopd.
Valuation Our base case fully diluted valuation for HZN is US$0.12 per share or A$0.15 at an AUD/USD exchange rate of 0.80 and a forecast Brent oil price of US$70/bbl from FY23.
If we assume a US$80/bbl Brent oil price from FY23 our base case valuation lifts to US$0.16 per share or A$0.18 at an AUD/USD exchange rate of 0.85.
If we assume a US$60/bbl Brent oil price from FY23 our base case valuation falls to US$0.09 per share or A$0.12 at an AUD/USD exchange rate of 0.76.
Horizon Oil Ltd. is an oil and petroleum exploration, development and production company. It operates through the following segments: New Zealand Development, New Zealand Exploration and China Exploration and Development. The company was founded in 1969 and is headquartered in Woolloomooloo, Australia.
Stock HZN.ASX
Price A$0.083
Market cap A$108m
Valuation range A$0.12 – A$0.18
Company data
Net cash (Sept. 2020) US$11m
Shares on issue 1,302.0m
Next news
Late April 2021 3Q21 Production report
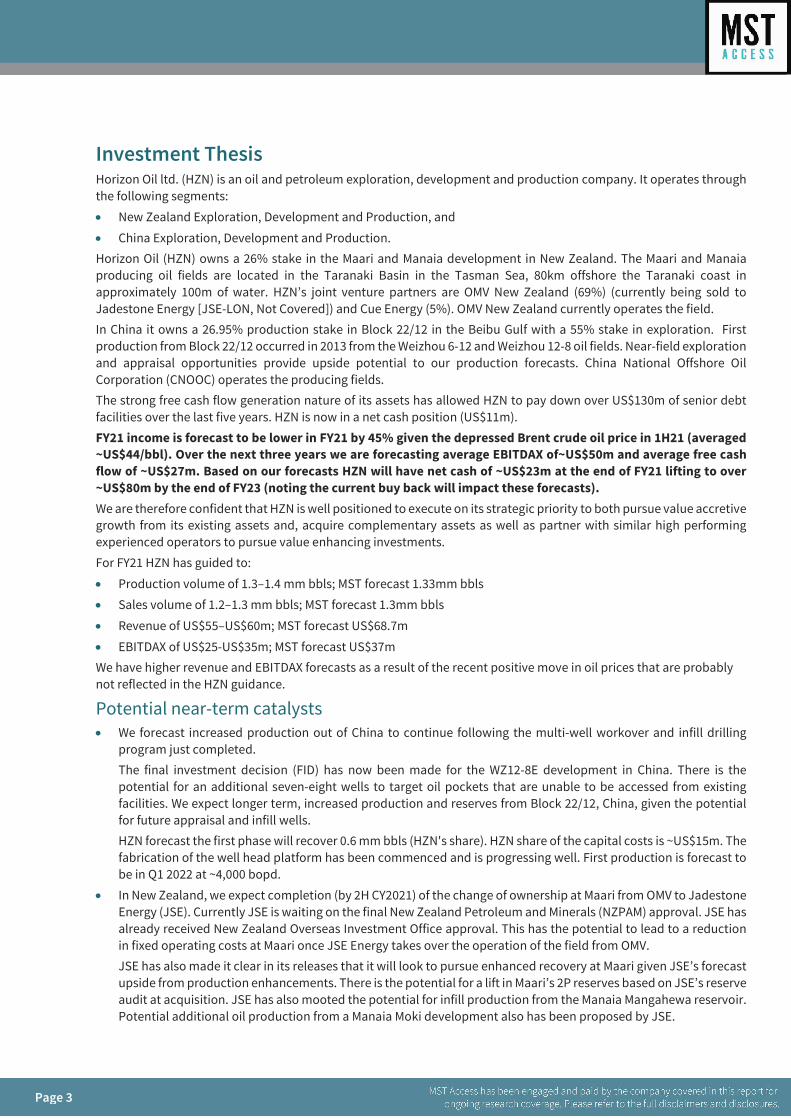
HZN Share Price (A$)
Source: FactSet
David Fraser [email protected]
0.00
0.01
0.02
0.03
0.04
0.05
0.06
0.07
0.08
0.09
0.10
Feb-20 Apr-20 Jun-20 Aug-20 Oct-20 Dec-20 Feb-21

Horizon Oil (HZN.AX) 4 March 2020
Page 2
Financials
Source: Company, MST Access
Horizon Oil HZN-AUYear end 30 JuneMARKET DATAPrice $ 0.083Effective US$ Price US$ 0.06552 week high / low A$ 0.09 - 0.04Valuation A$ 0.15Market capitalisation A$m 108.1Shares on issue (basic) m 1302.0Partly paid m 1.5Share Appreciation Rights m 67.3IMC Options m 300.0Other Options m 0.0Potential shares on issue (diluted) m 1670.7INVESTMENT FUNDAMENTALS FY19 FY20 FY21 FY22 FY23 PROFIT AND LOSS (US$m) FY19 FY20 FY21 FY22 FY23EPS reported US ¢ 2.7 (4.2) 0.1 0.7 1.3 Sales post hedging 122.4 84.0 67.9 83.3 93.3EPS reported diluted US ¢ 2.2 (4.2) 0.1 0.6 1.0 Other income 4.4 0.0 0.8 0.8 0.8EPS underlying US ¢ 1.8 0.5 0.3 0.7 1.3 Total Income 126.8 84.0 68.8 84.1 94.2EPS underlying diluted US ¢ 1.4 0.5 0.2 0.6 1.0 Operating costs (38.4) (38.5) (34.8) (40.4) (41.3)
EBITDAX 93.0 50.6 36.3 50.8 60.0P/E reported x 3.1 (1.0) 55.6 8.8 5.2 Exploration expenditure (4.6) (5.0) (2.3) (7.1) (7.1)P/E underlying x 4.6 8.2 22.7 8.8 5.2 EBITDA 88.4 45.5 33.9 43.7 52.9P/E underlying (diluted) x 5.8 8.2 28.0 10.8 6.3 Depreciation & Amortisation (39.4) (26.7) (23.9) (24.5) (24.1)
EBIT 49.0 18.8 10.1 19.2 28.8Dividend A ¢ 0.0 0.0 0.0 0.0 0.0 Net interest (11.7) (3.8) (2.1) (0.8) 0.0Payout ratio % 0.0% 0.0% 0.0% 0.0% 0.0% Pretax Profit 37.3 15.0 7.9 18.4 28.8Yield (Y/E/ spot) % 0.0% 0.0% 0.0% 0.0% 0.0% New Zealand Royalties (1.7) (2.9) (1.4) (2.5) (2.9)Franking % 0.0% 0.0% 0.0% 0.0% 0.0% Tax expense (30%) (11.7) (5.4) (2.8) (6.3) (9.5)Gross Yield (Y/E/ spot) % 0.0% 0.0% 0.0% 0.0% 0.0% NPAT (underlying) 23.9 6.7 3.7 9.7 16.4Book value / share US ¢ 10.8 6.4 5.4 5.9 6.9 Impairments / Other 11.9 (61.8) (2.2) 0.0 0.0Price to book (NAV) x 1.1 1.0 1.5 1.4 1.2 Reported NPAT 35.8 (55.1) 1.5 9.7 16.4NTA / share US ¢ 10.8 6.4 5.4 5.9 6.9 BALANCE SHEET (US$m) FY19 FY20 FY21 FY22 FY23Price to NTA x 1.1 1.0 1.5 1.4 1.2 Cash 21.5 25.9 31.9 49.0 82.7
Receivables 8.1 7.9 7.0 8.6 9.6Year end shares m 1,303 1,303 1,303 1,303 1,303 Inventory 5.5 3.5 3.5 4.3 4.8Average diluted shares m 1,654 1,303 1,603 1,603 1,603 Other 4.3 1.4 1.4 1.4 1.4Year end share price A$ 0.120 0.061 0.083 0.083 0.083 Current assets 39.4 38.8 43.8 63.2 98.5Year end share price US$ 0.084 0.042 0.065 0.065 0.065 Exploration phase expenditure 56.9 8.2 0.0 0.0 0.0Market cap (Y/E / Spot) US$m 109.7 54.8 84.7 84.7 84.7 Oil and Gas assets 157.4 116.7 97.2 80.1 63.3Net debt /(cash) US$m 26.3 (1.6) (22.6) (49.0) (82.7) Other 8.9 7.9 7.7 7.5 7.3Enterprise value US$m 136.1 53.2 62.1 35.7 1.9 Non current assets 223.2 132.9 104.9 87.6 70.6EV/EBITDAX x 1.5 1.1 1.7 0.7 0.0 Total Assets 262.7 171.6 148.7 150.8 169.1Gearing (net debt / EBITDAX) x 0.3 (0.0) (0.7) (1.1) (1.6) Accounts Payable 11.5 6.9 6.7 6.9 7.0
Borrowings 9.5 12.2 0.0 0.0 0.0Free cash flow US$m 62.6 28.7 21.0 26.4 33.8 Other 4.5 4.3 4.3 4.3 4.3Free cash flow per share US ¢ 4.8 2.2 1.6 2.0 2.6 Current liabilities 25.5 23.4 11.0 11.1 11.3Price to free cash flow x 1.8 1.9 4.0 3.2 2.5 Borrowings 38.3 12.1 9.3 0.0 0.0Free cash flow yield % 57% 52% 25% 31% 40% Provisions 29.0 34.0 37.3 41.1 45.2
Other 28.5 19.3 20.3 21.3 22.4DIVISIONAL FY19 FY20 FY21 FY22 FY23 Non current liabilities 95.8 65.4 67.0 62.4 67.6Brent Oil price forecast (US$) 69.1 52.3 52.8 61.4 70.0 Total Liabilities 121.4 88.8 77.9 73.5 78.9HZN Crude Oil Production ('000 bbls) Equity 174.8 174.8 174.8 174.8 174.8China (Beibu Gulf) 1,002 908 903 889 916 Retained earnings (49.4) (104.5) (103.0) (93.4) (76.9)New Zealand (Maari) 602 568 427 475 427 Reserves / Other 15.9 12.6 (1.0) (4.2) (7.6)Total ('000 bbls) 1,605 1,476 1,330 1,364 1,343 Total equity 141.3 82.9 70.8 77.2 90.2
Valuation CASH FLOW (US$m) FY19 FY20 FY21 FY22 FY23US$m Low Base High EBITDAX 93.0 50.6 36.3 50.8 60.0FY26 Brent oil price (US$/bbl) 60 70 80 Change in working capital (0.0) 0.9 0.7 (2.2) (1.4)Discount rate used in NPV10 calculations 12% 10% 8% Net interest (6.5) (3.4) (1.9) (0.7) 0.0China (Beibu Gulf) (FY21 NPV @ 12%, 10%, 8%) 130 174 225 Royalties & Tax paid (13.7) (11.3) (5.9) (7.3) (10.7)New Zealand (Maari) (FY21 NPV @ 12%, 10%, 8%) 28 37 48 Other 0.0 0.0 0.0 0.0 0.0Corporate Costs Allocation (48) (48) (48) Operating cash flow 72.8 36.7 29.2 40.6 48.0Option Exercise 14 15 16 Capital expenditure (10.2) (8.1) (11.7) (14.3) (14.3)Enterprise Value 123 177 240 Net investment / Other 0.0 0.0 3.5 0.0 0.0Net Debt / (Cash) (FY21) (23) (23) (23) Investing cash flow (10.2) (8.1) (8.2) (14.3) (14.3)Equity 146 200 263 Change in Equity 0.0 0.0 0.0 0.0 0.0Diluted Shares on Issue 1,659 1,671 1,680 Increase / (decrease) in borrowings (66.8) (24.0) (15.0) (9.3) 0.0Per Share US$ 0.09 0.12 0.16 Dividend / other (1.9) (0.2) 0.0 0.0 0.0AUDUSD 0.76 0.80 0.85 Financing cash flow (68.7) (24.2) (15.0) (9.3) 0.0Per Share A$ 0.12 0.15 0.18 Change in Cash / FX (6.2) 4.4 6.0 17.1 33.8
HZN 12 month relative versus S&P/ASX 200 Energy Index & Brent Oil A$/bbl
30
50
70
90
110
Mar-20 May-20 Jul-20 Sep-20 Dec-20 Feb-21
HZN XEJ Brent (A$/bbl)
Page 3
Page 3
Investment Thesis Horizon Oil ltd. (HZN) is an oil and petroleum exploration, development and production company. It operates through the following segments:
• New Zealand Exploration, Development and Production, and
• China Exploration, Development and Production. Horizon Oil (HZN) owns a 26% stake in the Maari and Manaia development in New Zealand. The Maari and Manaia producing oil fields are located in the Taranaki Basin in the Tasman Sea, 80km offshore the Taranaki coast in approximately 100m of water. HZN’s joint venture partners are OMV New Zealand (69%) (currently being sold to Jadestone Energy [JSE-LON, Not Covered]) and Cue Energy (5%). OMV New Zealand currently operates the field. In China it owns a 26.95% production stake in Block 22/12 in the Beibu Gulf with a 55% stake in exploration. First production from Block 22/12 occurred in 2013 from the Weizhou 6-12 and Weizhou 12-8 oil fields. Near-field exploration and appraisal opportunities provide upside potential to our production forecasts. China National Offshore Oil Corporation (CNOOC) operates the producing fields. The strong free cash flow generation nature of its assets has allowed HZN to pay down over US$130m of senior debt facilities over the last five years. HZN is now in a net cash position (US$11m). FY21 income is forecast to be lower in FY21 by 45% given the depressed Brent crude oil price in 1H21 (averaged ~US$44/bbl). Over the next three years we are forecasting average EBITDAX of~US$50m and average free cash flow of ~US$27m. Based on our forecasts HZN will have net cash of ~US$23m at the end of FY21 lifting to over ~US$80m by the end of FY23 (noting the current buy back will impact these forecasts). We are therefore confident that HZN is well positioned to execute on its strategic priority to both pursue value accretive growth from its existing assets and, acquire complementary assets as well as partner with similar high performing experienced operators to pursue value enhancing investments. For FY21 HZN has guided to:
• Production volume of 1.3–1.4 mm bbls; MST forecast 1.33mm bbls
• Sales volume of 1.2–1.3 mm bbls; MST forecast 1.3mm bbls
• Revenue of US$55–US$60m; MST forecast US$68.7m
• EBITDAX of US$25-US$35m; MST forecast US$37m We have higher revenue and EBITDAX forecasts as a result of the recent positive move in oil prices that are probably not reflected in the HZN guidance.
Potential near-term catalysts • We forecast increased production out of China to continue following the multi-well workover and infill drilling
program just completed. The final investment decision (FID) has now been made for the WZ12-8E development in China. There is the potential for an additional seven-eight wells to target oil pockets that are unable to be accessed from existing facilities. We expect longer term, increased production and reserves from Block 22/12, China, given the potential for future appraisal and infill wells. HZN forecast the first phase will recover 0.6 mm bbls (HZN's share). HZN share of the capital costs is ~US$15m. The fabrication of the well head platform has been commenced and is progressing well. First production is forecast to be in Q1 2022 at ~4,000 bopd.
• In New Zealand, we expect completion (by 2H CY2021) of the change of ownership at Maari from OMV to Jadestone Energy (JSE). Currently JSE is waiting on the final New Zealand Petroleum and Minerals (NZPAM) approval. JSE has already received New Zealand Overseas Investment Office approval. This has the potential to lead to a reduction in fixed operating costs at Maari once JSE Energy takes over the operation of the field from OMV. JSE has also made it clear in its releases that it will look to pursue enhanced recovery at Maari given JSE’s forecast upside from production enhancements. There is the potential for a lift in Maari’s 2P reserves based on JSE’s reserve audit at acquisition. JSE has also mooted the potential for infill production from the Manaia Mangahewa reservoir. Potential additional oil production from a Manaia Moki development also has been proposed by JSE.
Page 4
Page 4
Operating asset overviews, financial forecasts and valuations Key to any oil and gas company financial forecasting is the oil price assumption.
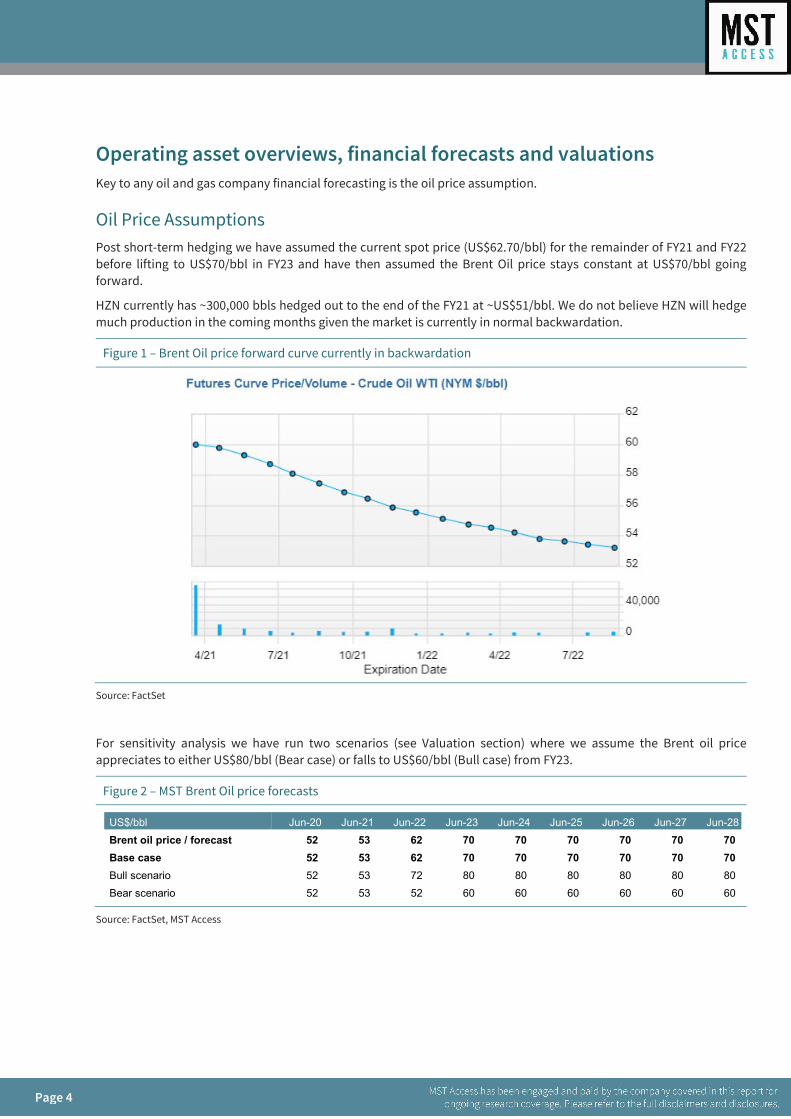
Oil Price Assumptions Post short-term hedging we have assumed the current spot price (US$62.70/bbl) for the remainder of FY21 and FY22 before lifting to US$70/bbl in FY23 and have then assumed the Brent Oil price stays constant at US$70/bbl going forward.
HZN currently has ~300,000 bbls hedged out to the end of the FY21 at ~US$51/bbl. We do not believe HZN will hedge much production in the coming months given the market is currently in normal backwardation.
Figure 1 – Brent Oil price forward curve currently in backwardation
Source: FactSet
For sensitivity analysis we have run two scenarios (see Valuation section) where we assume the Brent oil price appreciates to either US$80/bbl (Bear case) or falls to US$60/bbl (Bull case) from FY23.
Figure 2 – MST Brent Oil price forecasts
Source: FactSet, MST Access
US$/bbl Jun-20 Jun-21 Jun-22 Jun-23 Jun-24 Jun-25 Jun-26 Jun-27 Jun-28Brent oil price / forecast 52 53 62 70 70 70 70 70 70 Base case 52 53 62 70 70 70 70 70 70 Bull scenario 52 53 72 80 80 80 80 80 80 Bear scenario 52 53 52 60 60 60 60 60 60

Page 5
Page 5
Horizon Oil overview Horizon Oil ltd. (HZN) is an oil and petroleum exploration, development and production company. It operates through the following segments:
• New Zealand Exploration, Development and Production,
• China Exploration, Development and Production, and The New Zealand Production segment produces crude oil from the Maari/Manaia fields, which are located in the offshore Taranaki Basin, New Zealand. The New Zealand Exploration segment is involved in the exploration and evaluation of hydrocarbons in one offshore permit area, PMP 38160 Maari/Manaia. The China Exploration and Development segment engages in the Block 22/12 - WZ6-12 and WZ12-8W oil field development and in the exploration and evaluation of hydrocarbons within Block 22/12. The company was founded in 1969 (old Bligh Oil) and is headquartered in Woolloomooloo, Australia.
Strategy HZN’s strategy is to maintain steady production from its producing fields in China and New Zealand over the medium term. This will be achieved with continuing well workovers and the optimisation of production systems. Staged development of the WZ 12-8E in China and associated oil accumulations in China is important to achieving this goal. This is forecast to generate HZN strong free cash over the next two-three years resulting in HZN being in a net cash position of ~US$80m by FY23. HZN continues to be committed to four key priorities being:
• To ensure the safety of its people and enhance the communities it operates in while caring for the environment,
• to optimise the production and minimise operating costs at its two producing assets,
• to pursue value accretive growth from its existing assets, complemented by acquiring complementary assets, and
• to look to partner with similar high performing experienced operators to pursue value enhancing investments.
New Zealand - Maari and Manaia HZN increased its ownership in license PMP 38160 (Maari) from 10% of 26% by buying 16% off Todd Energy in May 2019 for US$17.6m (implied valuation for 100% of US$110m). Remaining ownership of the fields is OMV (69%) (to be acquired by Jadestone Energy once NZPAM approval given) and Cue Taranaki (5%).
Figure 2 – Horizon Oil New Zealand licenses and operations
Source: Company

Page 6
Page 6
Annual gross production from the field has ranged from ~2.2 mm bbls to 2.9mm bbls over the last five years with gross production in FY20 of ~2.2mm bbls. Given Maari’s location to demand and the set-up of the refineries sourcing the production, the crude typically sells at a premium to Brent (~US$3/bbl since FY16, US$4/bbl in FY20).
Figure 3 – Maari / Manaia gross production has averaged ~7,000 bbls oil per day (bopd)
Source: Company
As at 30 June 2019, HZN’s net 1P developed liquid reserves at Maari were 1.9 mm bbls with net 2P developed liquid reserves of 4.4 mm bbls.
In Jadestone Energy’s acquisition presentation it stated its Maari forecast net 2P reserves were 13.9 mm bbls implying a gross reserve of 20.1 mm bbls or net 5.2 mm bbls for HZN’s share; i.e. an 18% lift.
Figure 4 – Maari / Manaia facilities overview
Source: Company
Maari Forecasts and Valuation We table below our forecast assumptions for the Maari production and financials.
Key assumptions used in our forecasts:
• Oil price received for Maari crude to continue to earn an US$4.00 premium to Brent
• Gross production of ~4,500 bopd in FY21, lifting to 5,000 bopd in FY22 (post the early CY2021 workover well then declining out to FY28 at 10% per annum. We note that JSE has a 2P reserve production life out to 2031 built into its acquisition assumptions presumably largely reflecting its higher 2P reserves noted above. We also table below JSE’s forecast 2P reserve production profile which has gross production lifting to ~6,500 barrels oil per day (bopd) in FY22 versus MST’s assumed 5,000 bopd.
Page 7
Page 7
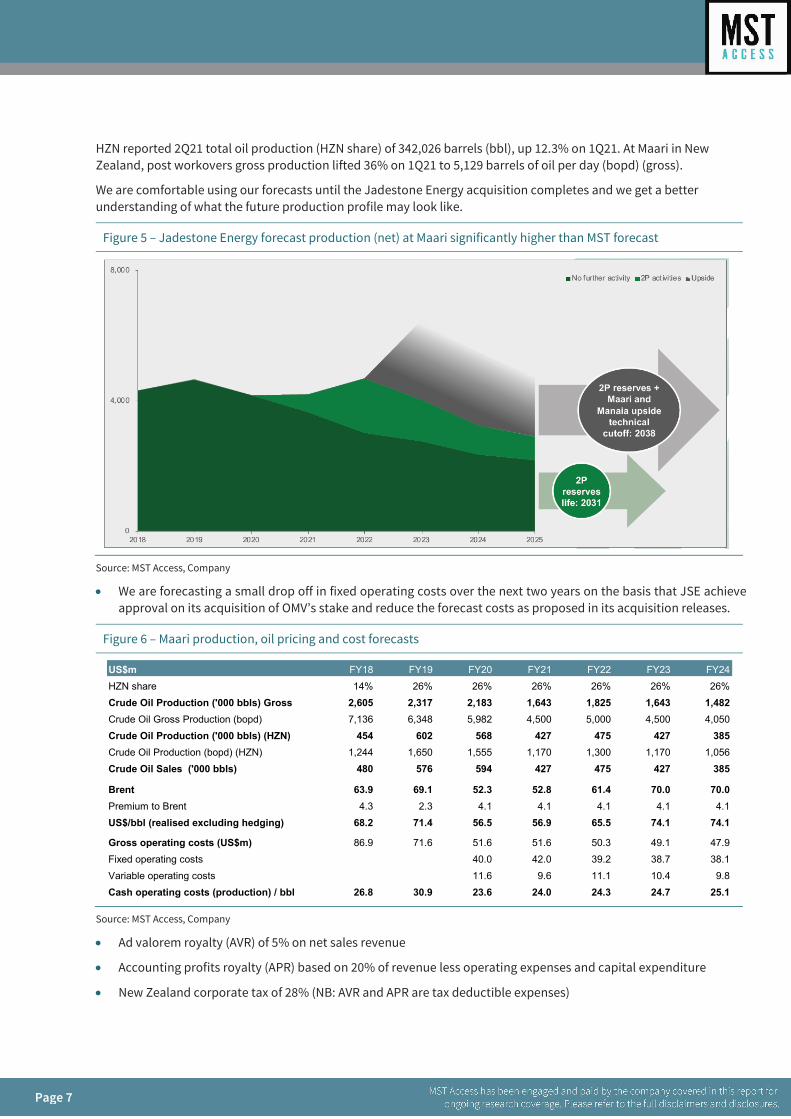
HZN reported 2Q21 total oil production (HZN share) of 342,026 barrels (bbl), up 12.3% on 1Q21. At Maari in New Zealand, post workovers gross production lifted 36% on 1Q21 to 5,129 barrels of oil per day (bopd) (gross).
We are comfortable using our forecasts until the Jadestone Energy acquisition completes and we get a better understanding of what the future production profile may look like.
Figure 5 – Jadestone Energy forecast production (net) at Maari significantly higher than MST forecast
Source: MST Access, Company
• We are forecasting a small drop off in fixed operating costs over the next two years on the basis that JSE achieve approval on its acquisition of OMV’s stake and reduce the forecast costs as proposed in its acquisition releases.
Figure 6 – Maari production, oil pricing and cost forecasts
Source: MST Access, Company
• Ad valorem royalty (AVR) of 5% on net sales revenue
• Accounting profits royalty (APR) based on 20% of revenue less operating expenses and capital expenditure
• New Zealand corporate tax of 28% (NB: AVR and APR are tax deductible expenses)
US$m FY18 FY19 FY20 FY21 FY22 FY23 FY24HZN share 14% 26% 26% 26% 26% 26% 26%Crude Oil Production ('000 bbls) Gross 2,605 2,317 2,183 1,643 1,825 1,643 1,482Crude Oil Gross Production (bopd) 7,136 6,348 5,982 4,500 5,000 4,500 4,050Crude Oil Production ('000 bbls) (HZN) 454 602 568 427 475 427 385Crude Oil Production (bopd) (HZN) 1,244 1,650 1,555 1,170 1,300 1,170 1,056Crude Oil Sales ('000 bbls) 480 576 594 427 475 427 385
Brent 63.9 69.1 52.3 52.8 61.4 70.0 70.0Premium to Brent 4.3 2.3 4.1 4.1 4.1 4.1 4.1US$/bbl (realised excluding hedging) 68.2 71.4 56.5 56.9 65.5 74.1 74.1
Gross operating costs (US$m) 86.9 71.6 51.6 51.6 50.3 49.1 47.9Fixed operating costs 40.0 42.0 39.2 38.7 38.1Variable operating costs 11.6 9.6 11.1 10.4 9.8Cash operating costs (production) / bbl 26.8 30.9 23.6 24.0 24.3 24.7 25.1

Page 8
Page 8
Figure 7 – Maari asset forecast profit and loss
Source: MST Access, Company
• Our asset model assumes production out to FY28 when we assume the site is abandoned. We believe this is likely to prove highly conservative given we would expect the field to continue producing long after this date depending on economics at the time.
• Forecast gross capex of ~$11m - $12m in FY21 lifting in FY22 and FY23 before declining out to FY28 and then a gross abandonment cost of ~$100m in FY28. We note that given HZN has been paying tax and royalties in New Zealand since it acquired it ‘s stake in Maari it is entitled to a tax credit at abandonment. This amounts to 20% of royalties paid and 28% of income tax paid which at this stage will effectively result in a net reduction in the cash abandonment cost of 40%. Thus, HZN’s share of US$100m is ~US$26m less 40% equating to ~US$16m.
Valuation
We table below the forecast cash flows for our US$ NPV10 valuation for HZN’s 26% stake in Maari.
Figure 8 – Maari Forecast US$ NPV10
Source: MST Access, Company
JSE paid US$50m for a 69% stake in November 2019, implying a gross value of US$72m, or US$19m for 26%.
At the time JSE stated its NPV10 2P valuation for its stake was US$180m, implying a gross value of US$261m, or US$68m for 26%. Our valuation is therefore below the midpoint (US$44m) of what JSE paid and what JSE values it at.
At acquisition JSE forecast over US$150m (gross US$217m) of free cash flow from Maari over the next five years, implying HZN’s share is US$56m.
US$m FY18 FY19 FY20 FY21 FY22 FY23 FY24Revenue 32.7 41.2 33.6 24.3 31.1 31.6 28.6Operating expenses (12.2) (18.6) (13.4) (13.4) (13.1) (12.8) (12.5)Workover expenditure / Other (1.2) 0.0 (1.0) (1.5) (1.4) (1.2) (1.1)Net operating cash flow 19.3 22.5 19.1 9.4 16.6 17.6 15.0Inventory adjustment (1.6) 1.8 (1.1) 1.2 1.2 1.2 1.2Exploration & Development (Cash) (4.7) (1.7) (1.3) (1.5) (4.0) (4.0) (2.0)Depreciation and Amortisation (10.4) (18.0) (10.8) (7.5) (8.3) (7.5) (6.8)EBIT 2.6 4.5 5.9 1.6 5.5 7.3 7.4Net interest (0.4) 2.3 0.0 0.0 0.0 0.0 0.0PBT 2.2 6.8 5.9 1.6 5.5 7.3 7.4NZ Royalties (AVR & APR) (0.9) (1.7) (2.7) (1.4) (2.5) (2.9) (2.8)
Cashflow FY21 FY22 FY23 FY24 FY25 FY26 FY27 FY28Net operating cash flow 9.4 16.6 17.6 15.0 12.5 10.6 8.9 8.1Tax & Royalties (1.5) (3.3) (4.1) (4.1) (3.4) (3.0) (2.5) 1.4Exploration & Capex (1.5) (4.0) (4.0) (2.0) (1.5) (1.1) (0.8) (16.0)Free Cash flow 6.4 9.3 9.5 8.9 7.6 6.5 5.6 (6.5)FCF Timing Factor 0.3 1.3 2.3 3.3 4.3 5.3 6.3 7.3Discount Factor 1.0 1.1 1.2 1.4 1.5 1.7 1.8 2.0Discounted FCF 6.2 8.2 7.6 6.5 5.0 3.9 3.0 (3.2)
NPV10 37 31 23 15 9 4 (0) (3)
Page 9
Page 9
China - Beibu Gulf HZN owns a 26.95% production stake in Block 22/12 in the Beibu Gulf with a 55% stake in exploration.
Block 22/12 was initially awarded to Bligh Oil which became Horizon Oil in November 2002. Roc Oil farmed into the Block in 2002 to drill the WZ 6-12-1 well and also undertook operatorship.
Following the discoveries at WZ 6-12-1 and WZ 6-12 South in 2006, HZN and its co-venturers commenced formulating the development for these and the previously discovered WZ 12-8 West in consultation with the China National Offshore Oil Corporation (CNOOC).
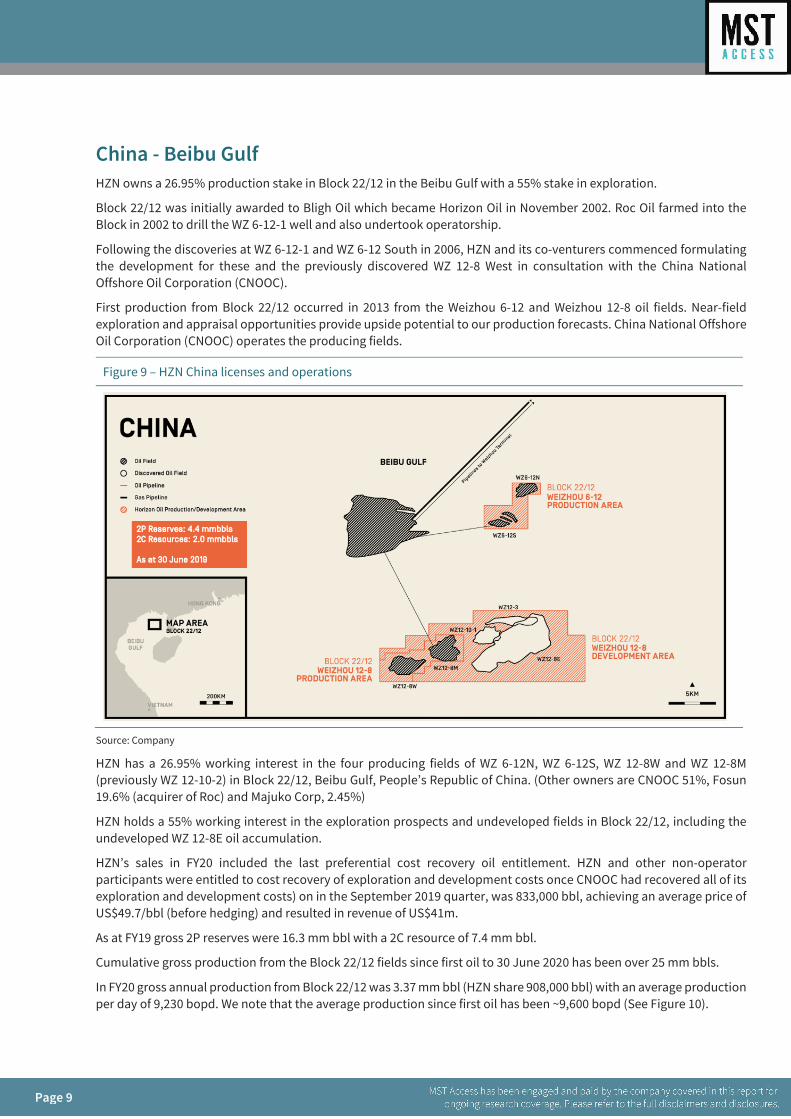
First production from Block 22/12 occurred in 2013 from the Weizhou 6-12 and Weizhou 12-8 oil fields. Near-field exploration and appraisal opportunities provide upside potential to our production forecasts. China National Offshore Oil Corporation (CNOOC) operates the producing fields.
Figure 9 – HZN China licenses and operations
Source: Company
HZN has a 26.95% working interest in the four producing fields of WZ 6-12N, WZ 6-12S, WZ 12-8W and WZ 12-8M (previously WZ 12-10-2) in Block 22/12, Beibu Gulf, People’s Republic of China. (Other owners are CNOOC 51%, Fosun 19.6% (acquirer of Roc) and Majuko Corp, 2.45%)
HZN holds a 55% working interest in the exploration prospects and undeveloped fields in Block 22/12, including the undeveloped WZ 12-8E oil accumulation.
HZN’s sales in FY20 included the last preferential cost recovery oil entitlement. HZN and other non-operator participants were entitled to cost recovery of exploration and development costs once CNOOC had recovered all of its exploration and development costs) on in the September 2019 quarter, was 833,000 bbl, achieving an average price of US$49.7/bbl (before hedging) and resulted in revenue of US$41m.
As at FY19 gross 2P reserves were 16.3 mm bbl with a 2C resource of 7.4 mm bbl.
Cumulative gross production from the Block 22/12 fields since first oil to 30 June 2020 has been over 25 mm bbls.
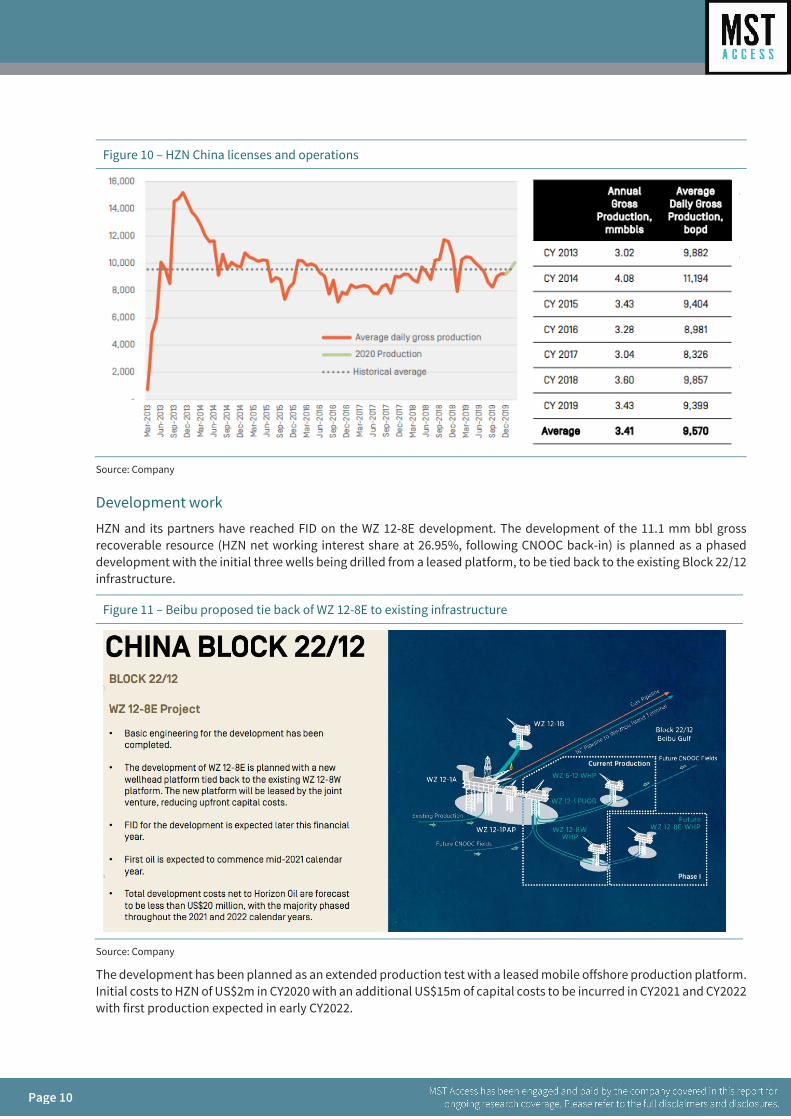
In FY20 gross annual production from Block 22/12 was 3.37 mm bbl (HZN share 908,000 bbl) with an average production per day of 9,230 bopd. We note that the average production since first oil has been ~9,600 bopd (See Figure 10).
Page 10
Page 10
Figure 10 – HZN China licenses and operations
Source: Company
Development work
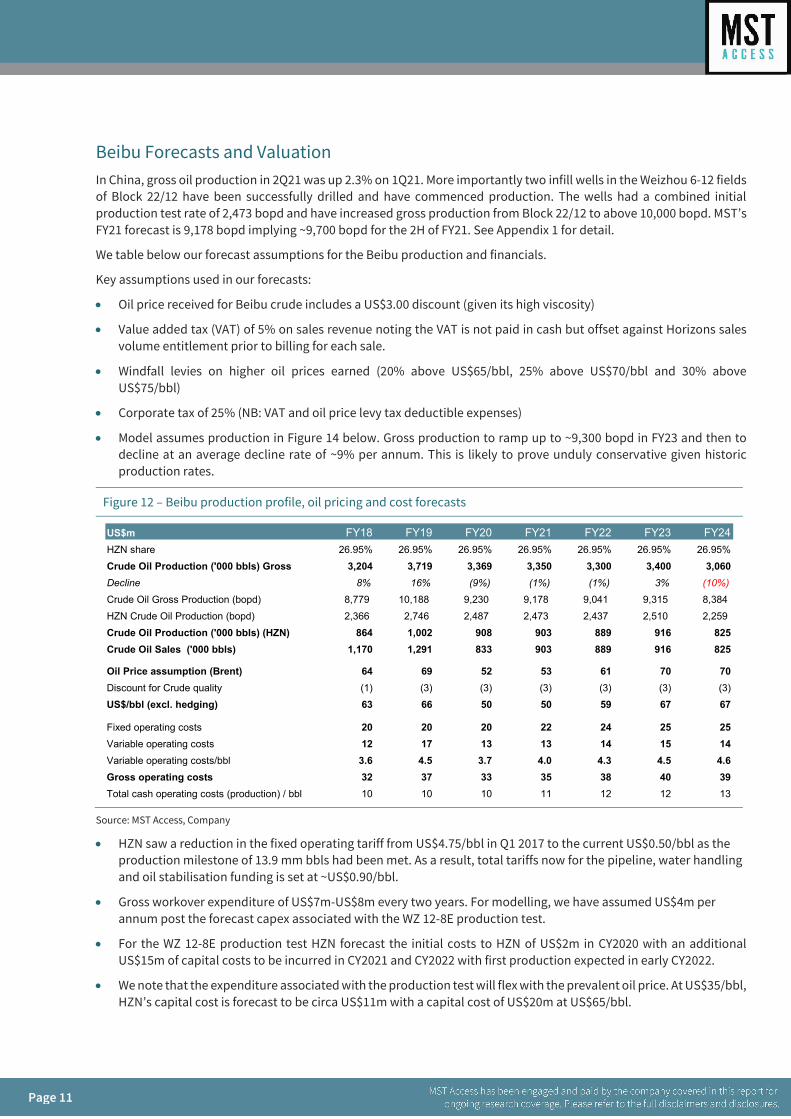
HZN and its partners have reached FID on the WZ 12-8E development. The development of the 11.1 mm bbl gross recoverable resource (HZN net working interest share at 26.95%, following CNOOC back-in) is planned as a phased development with the initial three wells being drilled from a leased platform, to be tied back to the existing Block 22/12 infrastructure.
Figure 11 – Beibu proposed tie back of WZ 12-8E to existing infrastructure
Source: Company
The development has been planned as an extended production test with a leased mobile offshore production platform. Initial costs to HZN of US$2m in CY2020 with an additional US$15m of capital costs to be incurred in CY2021 and CY2022 with first production expected in early CY2022.
Page 11
Page 11
Beibu Forecasts and Valuation In China, gross oil production in 2Q21 was up 2.3% on 1Q21. More importantly two infill wells in the Weizhou 6-12 fields of Block 22/12 have been successfully drilled and have commenced production. The wells had a combined initial production test rate of 2,473 bopd and have increased gross production from Block 22/12 to above 10,000 bopd. MST’s FY21 forecast is 9,178 bopd implying ~9,700 bopd for the 2H of FY21. See Appendix 1 for detail.
We table below our forecast assumptions for the Beibu production and financials.
Key assumptions used in our forecasts:
• Oil price received for Beibu crude includes a US$3.00 discount (given its high viscosity)
• Value added tax (VAT) of 5% on sales revenue noting the VAT is not paid in cash but offset against Horizons sales volume entitlement prior to billing for each sale.
• Windfall levies on higher oil prices earned (20% above US$65/bbl, 25% above US$70/bbl and 30% above US$75/bbl)
• Corporate tax of 25% (NB: VAT and oil price levy tax deductible expenses)
• Model assumes production in Figure 14 below. Gross production to ramp up to ~9,300 bopd in FY23 and then to decline at an average decline rate of ~9% per annum. This is likely to prove unduly conservative given historic production rates.
Figure 12 – Beibu production profile, oil pricing and cost forecasts
Source: MST Access, Company
• HZN saw a reduction in the fixed operating tariff from US$4.75/bbl in Q1 2017 to the current US$0.50/bbl as the production milestone of 13.9 mm bbls had been met. As a result, total tariffs now for the pipeline, water handling and oil stabilisation funding is set at ~US$0.90/bbl.
• Gross workover expenditure of US$7m-US$8m every two years. For modelling, we have assumed US$4m per annum post the forecast capex associated with the WZ 12-8E production test.
• For the WZ 12-8E production test HZN forecast the initial costs to HZN of US$2m in CY2020 with an additional US$15m of capital costs to be incurred in CY2021 and CY2022 with first production expected in early CY2022.
• We note that the expenditure associated with the production test will flex with the prevalent oil price. At US$35/bbl, HZN’s capital cost is forecast to be circa US$11m with a capital cost of US$20m at US$65/bbl.
US$m FY18 FY19 FY20 FY21 FY22 FY23 FY24HZN share 26.95% 26.95% 26.95% 26.95% 26.95% 26.95% 26.95%Crude Oil Production ('000 bbls) Gross 3,204 3,719 3,369 3,350 3,300 3,400 3,060Decline 8% 16% (9%) (1%) (1%) 3% (10%)
Crude Oil Gross Production (bopd) 8,779 10,188 9,230 9,178 9,041 9,315 8,384 HZN Crude Oil Production (bopd) 2,366 2,746 2,487 2,473 2,437 2,510 2,259 Crude Oil Production ('000 bbls) (HZN) 864 1,002 908 903 889 916 825Crude Oil Sales ('000 bbls) 1,170 1,291 833 903 889 916 825
Oil Price assumption (Brent) 64 69 52 53 61 70 70Discount for Crude quality (1) (3) (3) (3) (3) (3) (3)US$/bbl (excl. hedging) 63 66 50 50 59 67 67
Fixed operating costs 20 20 20 22 24 25 25Variable operating costs 12 17 13 13 14 15 14Variable operating costs/bbl 3.6 4.5 3.7 4.0 4.3 4.5 4.6Gross operating costs 32 37 33 35 38 40 39Total cash operating costs (production) / bbl 10 10 10 11 12 12 13
Page 12
Page 12
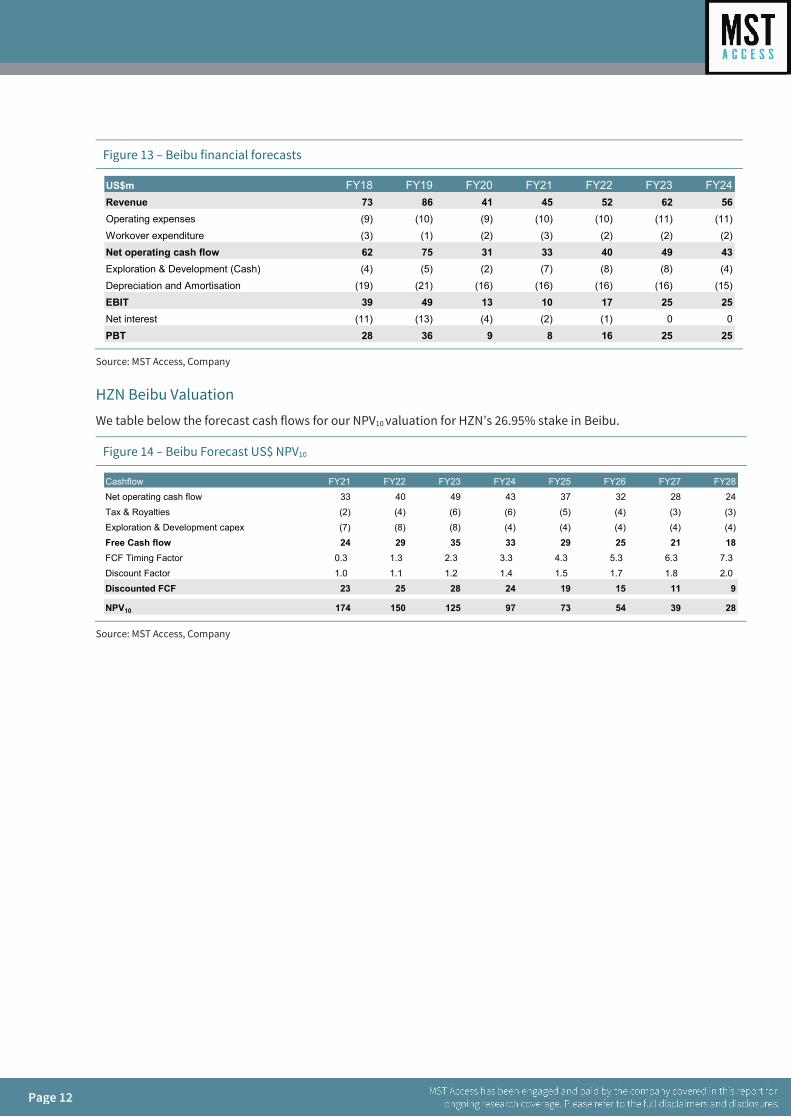
Figure 13 – Beibu financial forecasts
Source: MST Access, Company
HZN Beibu Valuation
We table below the forecast cash flows for our NPV10 valuation for HZN’s 26.95% stake in Beibu.
Figure 14 – Beibu Forecast US$ NPV10
Source: MST Access, Company
US$m FY18 FY19 FY20 FY21 FY22 FY23 FY24Revenue 73 86 41 45 52 62 56Operating expenses (9) (10) (9) (10) (10) (11) (11)Workover expenditure (3) (1) (2) (3) (2) (2) (2)Net operating cash flow 62 75 31 33 40 49 43Exploration & Development (Cash) (4) (5) (2) (7) (8) (8) (4)Depreciation and Amortisation (19) (21) (16) (16) (16) (16) (15)EBIT 39 49 13 10 17 25 25Net interest (11) (13) (4) (2) (1) 0 0PBT 28 36 9 8 16 25 25
Cashflow FY21 FY22 FY23 FY24 FY25 FY26 FY27 FY28Net operating cash flow 33 40 49 43 37 32 28 24Tax & Royalties (2) (4) (6) (6) (5) (4) (3) (3)Exploration & Development capex (7) (8) (8) (4) (4) (4) (4) (4)Free Cash flow 24 29 35 33 29 25 21 18FCF Timing Factor 0.3 1.3 2.3 3.3 4.3 5.3 6.3 7.3 Discount Factor 1.0 1.1 1.2 1.4 1.5 1.7 1.8 2.0 Discounted FCF 23 25 28 24 19 15 11 9
NPV10 174 150 125 97 73 54 39 28

Page 13
Page 13
Horizon Oil Group Financial Forecasts We have tabled our HZN group forecasts below:
Figure 18 – Total Horizon Oil Forecast Production and Sales
Source: MST Access, Company
HZN sold its PNG assets for US3.5m (book value US$5.7m) so we have assumed a US$2.2m loss in our reported FY21.
Figure 19 – Horizon Oil Forecast Underlying Profit
Source: MST Access, Company
We table below our forecast cash flow statement for HZN.
US$m FY18 FY19 FY20 FY21 FY22 FY23 FY24Maari & Manaia 454 602 568 427 475 427 385Beibu 864 1,002 908 903 889 916 825Total Production ('000 bbls) 1,318 1,605 1,476 1,330 1,364 1,343 1,210Maari & Manaia 480 576 594 427 475 427 385Beibu 1,170 1,291 833 903 889 916 825Total Sales ('000 bbls) 1,650 1,867 1,428 1,330 1,364 1,343 1,210
US$/bbl (excl. hedging) 64 68 52 52 61 69 69US$/bbl (incl. hedging) 61 66 59 51 61 69 69US$/bbl Cash op. costs 16 18 15 17 17 18 19US$/bbl Costs incl. workovers etc 19 18 17 21 20 20 22
US$m FY18 FY19 FY20 FY21 FY22 FY23 FY24Sales Revenue 106.2 126.7 74.9 69.6 83.3 93.3 84.1Oil hedging gains (losses) (6.1) (4.3) 9.1 (1.6)Total Sales 100.0 122.4 84.0 67.9 83.3 93.3 84.1Other income 0.8 4.4 0.0 0.8 0.8 0.8 0.8Total Income 100.9 126.8 84.0 68.8 84.1 94.2 84.9Total operating expenditure (32.4) (33.8) (33.5) (32.5) (33.3) (34.1) (35.0)
EBITDAX 68.5 93.0 50.6 36.3 50.8 60.0 49.9Exploration & Development (5.8) (4.6) (5.0) (2.3) (7.1) (7.1) (4.1)EBITDA 62.7 88.4 45.5 33.9 43.7 52.9 45.8Depreciation (0.3) (0.1) (0.4) (0.4) (0.4) (0.4) (0.4)Amortisation (29.2) (39.3) (26.4) (23.5) (24.1) (23.7) (21.4)EBIT 33.2 49.0 18.8 10.1 19.2 28.8 24.0Interest income 0.0 0.0 0.0 0.0 0.0 0.0 0.1Interest expense (14.3) (11.7) (3.9) (2.2) (0.8) 0.0 0.0Net Interest (14.3) (11.7) (3.8) (2.1) (0.8) 0.0 0.1Underlying PBT 18.9 37.3 15.0 7.9 18.4 28.8 24.1NZ Royalty expense (0.9) (1.7) (2.9) (1.4) (2.5) (2.9) (2.8)Taxation (5.4) (10.7) (5.4) (2.0) (4.8) (7.8) (6.4)Underlying NPAT 12.1 23.9 6.7 3.7 9.7 16.4 13.3Minority interests 0.0 0.0 0.0 0.0 0.0 0.0 0.0HZN Security Holders 12.1 23.9 6.7 3.7 9.7 16.4 13.3

Page 14
Page 14
Figure 20 – Horizon Oil Forecast Cash Flow Statement
Source: MST Access, Company
US$m FY18 FY19 FY20 FY21 FY22 FY23 FY24EBITDAX 68.5 93.0 50.6 36.3 50.8 60.0 49.9Increase in Working Capital 14.5 (15.6) 0.3 0.7 (2.2) (1.4) 1.6Other (14.7) 15.6 0.6 0.0 0.0 0.0 0.0Cashflow - pre interest & tax 68.2 93.0 51.5 37.0 48.6 58.7 51.5Cash interest earned 0.0 0.0 0.0 0.0 0.0 0.0 0.1Cash interest paid (9.4) (6.5) (3.5) (1.9) (0.7) 0.0 0.0NZ Royalty expense (0.9) (1.7) (2.9) (1.4) (2.5) (2.9) (2.8)Tax Paid (0.4) (12.0) (8.4) (4.5) (4.8) (7.8) (6.4)Operating Cashflow 57.6 72.8 36.7 29.2 40.6 48.0 42.4Exploration phase (7.8) (2.7) (2.3) (2.9) (3.6) (3.6) (2.1)Oil & Gas assets (13.3) (7.5) (5.8) (8.6) (10.6) (10.6) (6.1)China restoration fund 0.0 0.0 0.0 0.0 0.0 0.0 0.0Plant & Equipment (0.0) (0.1) (0.0) (0.1) (0.1) (0.1) (0.1)Acquisitions/Investments (16.7) 0.0 0.0 0.0 0.0 0.0 0.0Divestments 0.0 0.0 0.0 3.5 0.0 0.0 0.0Other Investing Cash Flow 0.0 0.0 0.0 0.0 0.0 0.0 0.0Net investing (37.7) (10.2) (8.1) (8.2) (14.3) (14.3) (8.3)Increase in Equity 0.0 0.0 0.0 0.0 0.0 0.0 0.0(Decrease) in Equity 0.0 0.0 0.0 0.0 0.0 0.0 0.0Incr / (Decr) in Equity 0.0 0.0 0.0 0.0 0.0 0.0 0.0Cash Dividends Paid 0.0 0.0 0.0 0.0 0.0 0.0 0.0Debt draw down 0.0 94.6 0.0 0.0 0.0 0.0 0.0Debt repayments (16.8) (161.4) (24.0) (15.0) (9.3) 0.0 0.0Other Financing Cash Flow 0.0 (1.9) (0.2) 0.0 0.0 0.0 0.0Net financing (16.8) (68.7) (24.2) (15.0) (9.3) 0.0 0.0Incr / (Decr) in Cash 3.1 (6.2) 4.4 6.0 17.1 33.8 34.1Cash beginning 24.5 27.6 21.5 25.9 31.9 49.0 82.7FX Impact (0.0) (0.0) 0.0 0.0 0.0 0.0 0.0Cash end 27.6 21.5 25.9 31.9 49.0 82.7 116.9
Free cash flow 19.9 62.6 28.7 21.0 26.4 33.8 34.1
Net debt / (Cash) 84.4 26.3 (1.6) (22.6) (49.0) (82.7) (116.9)

Page 15
Page 15
Horizon Oil Valuation We have derived a valuation for Horizon Oil using a sum of the parts (SOP) valuation: i.e. Net present value of the operating asserts discounted at 10% (NPV10) adjusted for other assets and liabilities.
Capital structure
On top of the 1,302m shares on issue HZN has partly paid shares, options and share appreciation rights (SARS) that can issue over time.
HZN has two tranches of options issued:
• 1m options with an exercise price of $0.20 with an expiry date of 2 November 2020
• 300m options with IMC Group with an exercise price of $0.061 with an expiry date of 15 September 2021
It also has ~106m share appreciation rights (SARS) (management performance incentives) that vest according to the company’s total shareholder return (TSR). The TSR is calculated with reference to the volume weighted average share price (VWAP) at the end of the vesting period relative to the performance of the S&P/ASX 200 Energy Index (XEJ).
Before any SARS are issued the company must have achieved a TSR of at least 10% over the relevant period being the period from issue to vesting.
Then:
• if the company TSR is equal to the XEJ performance, 50% of the SARS will vest,
• if the company TSR is >= 14% to the XEJ performance, 100% of the SARS will vest, and
between equal performance to XEJ and 14% outperformance, the vesting is graduated.
If the TSR hurdle is met, the SARs vest and are in the money at the date they vest. If they are not exercised at the vesting date but at a later date when the 10-day VWAP is less than the exercise price, then the holder will not receive any compensation.
If the holder exercises and the 10 day VWAP on exercise date is greater than the exercise price, the board may elect to compensate the holder in either cash or shares and the value to be settled is the delta between the 10 day VWAP at exercise and the exercise price * number of SARs. NB: By exercise price, it is referring to the HZN 10-day VWAP on 30 June at the time the relevant tranche of SARs were granted (often referred in disclosure as the ‘strike price’).
We have assumed for the options and SARS exercise at a share price equal to our valuation: i.e. (A$0.15)
• outstanding options (with an exercise price below our valuation) vest and issue which includes all the IMC Investments Ltd (IMC) options (NB: IMC have Foreign Investment Review Board (FIRB) approval to go to 85% ownership),
• 100% of the Share Appreciation Rights (SARS) that are eligible to vest are issued. We assume this given if the stock reaches our valuation the HZN performance is likely to be greater than the 14% over the S&P/ASX200 Energy Index hurdle rate.
• Additionally, we assume the SARS are issued as stock rather than the company paying out cash (notional $5.0m value in Figure 23 above).
This results in a diluted number of shares on issue of ~1,671m.
Sum of the Parts Valuation For the two producing assets we have discounted free cash flows at 10.0% as noted above in the asset overviews. We have then adjusted for option cash raised (300m IMC options exercisable at $0.061), ongoing corporate liability allocation and then adjusted for forecast FY21 net cash to determine an equity value. We then convert the US$ valuation at an AUD/USD cross rate of 0.80. (Spot AUD/USD is 0.78)
Page 16
Page 16
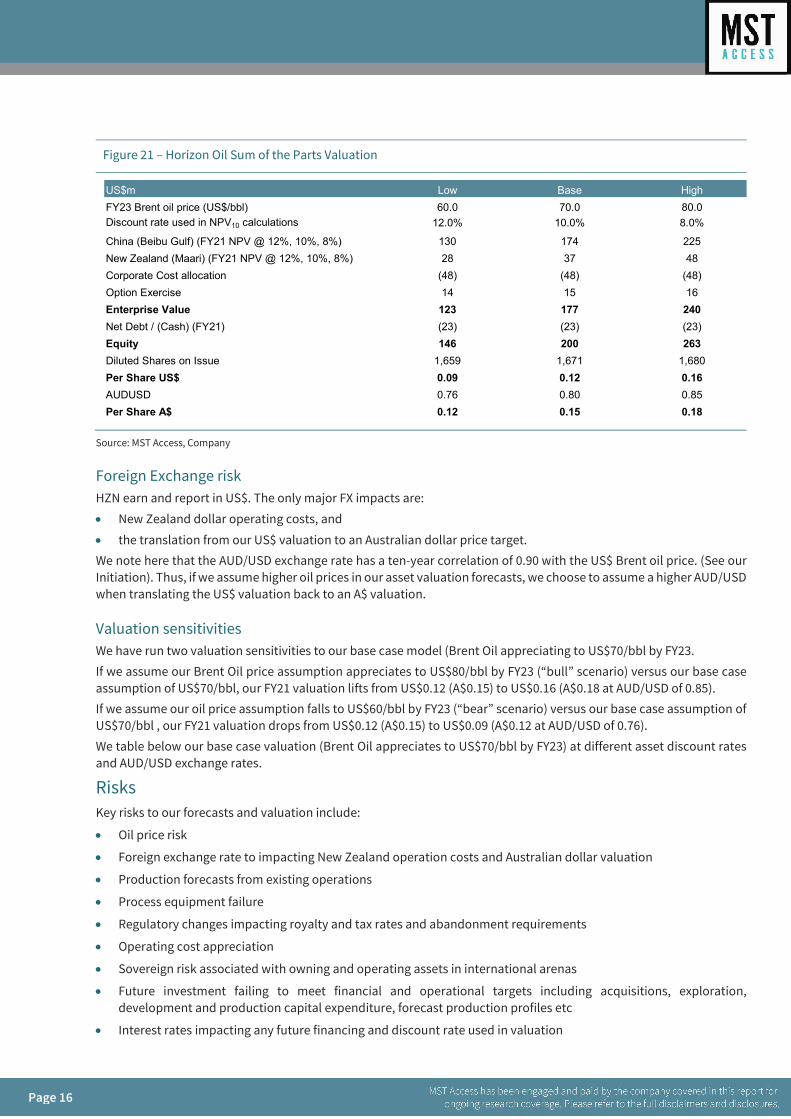
Figure 21 – Horizon Oil Sum of the Parts Valuation
Source: MST Access, Company
Foreign Exchange risk HZN earn and report in US$. The only major FX impacts are:
• New Zealand dollar operating costs, and
• the translation from our US$ valuation to an Australian dollar price target. We note here that the AUD/USD exchange rate has a ten-year correlation of 0.90 with the US$ Brent oil price. (See our Initiation). Thus, if we assume higher oil prices in our asset valuation forecasts, we choose to assume a higher AUD/USD when translating the US$ valuation back to an A$ valuation.
Valuation sensitivities We have run two valuation sensitivities to our base case model (Brent Oil appreciating to US$70/bbl by FY23. If we assume our Brent Oil price assumption appreciates to US$80/bbl by FY23 (“bull” scenario) versus our base case assumption of US$70/bbl, our FY21 valuation lifts from US$0.12 (A$0.15) to US$0.16 (A$0.18 at AUD/USD of 0.85). If we assume our oil price assumption falls to US$60/bbl by FY23 (“bear” scenario) versus our base case assumption of US$70/bbl , our FY21 valuation drops from US$0.12 (A$0.15) to US$0.09 (A$0.12 at AUD/USD of 0.76). We table below our base case valuation (Brent Oil appreciates to US$70/bbl by FY23) at different asset discount rates and AUD/USD exchange rates.
Risks Key risks to our forecasts and valuation include:
• Oil price risk
• Foreign exchange rate to impacting New Zealand operation costs and Australian dollar valuation
• Production forecasts from existing operations
• Process equipment failure
• Regulatory changes impacting royalty and tax rates and abandonment requirements
• Operating cost appreciation
• Sovereign risk associated with owning and operating assets in international arenas
• Future investment failing to meet financial and operational targets including acquisitions, exploration, development and production capital expenditure, forecast production profiles etc
• Interest rates impacting any future financing and discount rate used in valuation
US$mFY23 Brent oil price (US$/bbl)Discount rate used in NPV10 calculations
China (Beibu Gulf) (FY21 NPV @ 12%, 10%, 8%)New Zealand (Maari) (FY21 NPV @ 12%, 10%, 8%)Corporate Cost allocationOption ExerciseEnterprise ValueNet Debt / (Cash) (FY21)EquityDiluted Shares on IssuePer Share US$AUDUSDPer Share A$
0.850.18
0.800.15
High
225
Base
174
80.0
0.760.12
37(48)1514
177(23)
240(23)263200
Low
13028
(48)
60.0
48(48)
70.010.0% 8.0%12.0%
1,6800.16
123(23)146
1,6590.09
1,6710.12
16
Page 17
Page 17
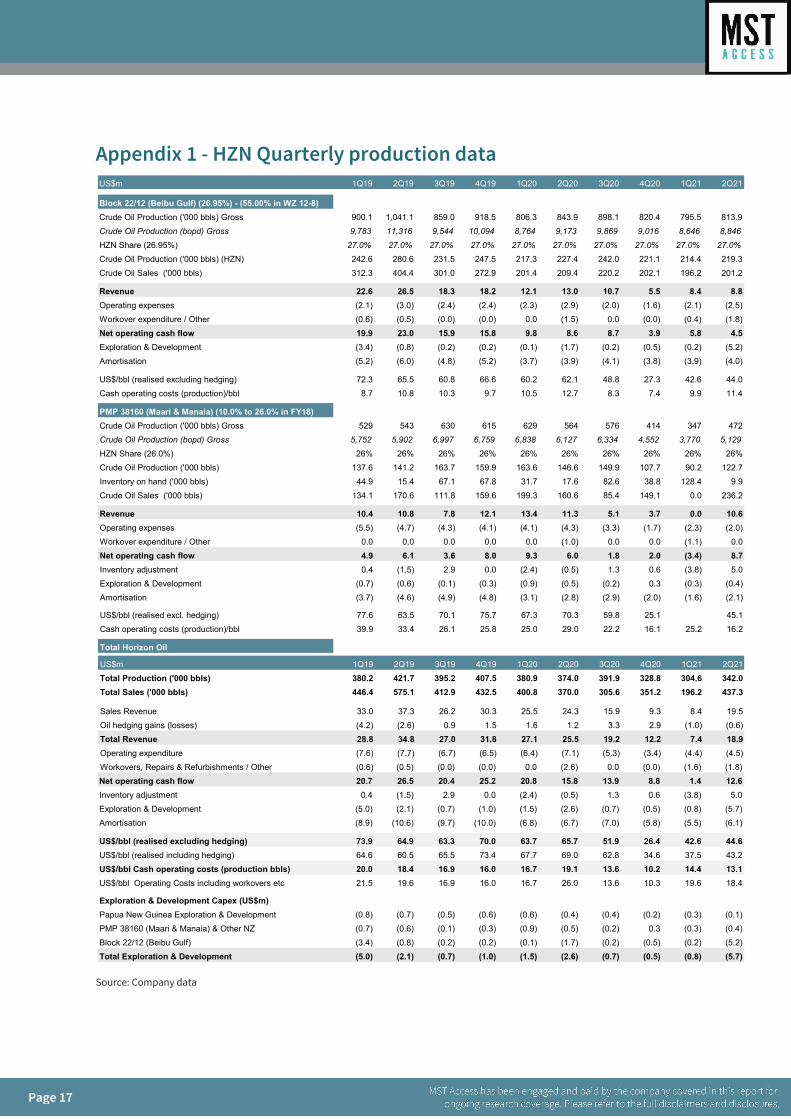
Appendix 1 - HZN Quarterly production data
Source: Company data
US$m 1Q19 2Q19 3Q19 4Q19 1Q20 2Q20 3Q20 4Q20 1Q21 2Q21
Block 22/12 (Beibu Gulf) (26.95%) - (55.00% in WZ 12-8)Crude Oil Production ('000 bbls) Gross 900.1 1,041.1 859.0 918.5 806.3 843.9 898.1 820.4 795.5 813.9Crude Oil Production (bopd) Gross 9,783 11,316 9,544 10,094 8,764 9,173 9,869 9,016 8,646 8,846
HZN Share (26.95%) 27.0% 27.0% 27.0% 27.0% 27.0% 27.0% 27.0% 27.0% 27.0% 27.0%
Crude Oil Production ('000 bbls) (HZN) 242.6 280.6 231.5 247.5 217.3 227.4 242.0 221.1 214.4 219.3Crude Oil Sales ('000 bbls) 312.3 404.4 301.0 272.9 201.4 209.4 220.2 202.1 196.2 201.2
Revenue 22.6 26.5 18.3 18.2 12.1 13.0 10.7 5.5 8.4 8.8Operating expenses (2.1) (3.0) (2.4) (2.4) (2.3) (2.9) (2.0) (1.6) (2.1) (2.5)Workover expenditure / Other (0.6) (0.5) (0.0) (0.0) 0.0 (1.5) 0.0 (0.0) (0.4) (1.8)Net operating cash flow 19.9 23.0 15.9 15.8 9.8 8.6 8.7 3.9 5.8 4.5Exploration & Development (3.4) (0.8) (0.2) (0.2) (0.1) (1.7) (0.2) (0.5) (0.2) (5.2)Amortisation (5.2) (6.0) (4.8) (5.2) (3.7) (3.9) (4.1) (3.8) (3.9) (4.0)
US$/bbl (realised excluding hedging) 72.3 65.5 60.8 66.6 60.2 62.1 48.8 27.3 42.6 44.0Cash operating costs (production)/bbl 8.7 10.8 10.3 9.7 10.5 12.7 8.3 7.4 9.9 11.4
PMP 38160 (Maari & Manaia) (10.0% to 26.0% in FY18)Crude Oil Production ('000 bbls) Gross 529 543 630 615 629 564 576 414 347 472Crude Oil Production (bopd) Gross 5,752 5,902 6,997 6,759 6,838 6,127 6,334 4,552 3,770 5,129
HZN Share (26.0%) 26% 26% 26% 26% 26% 26% 26% 26% 26% 26%Crude Oil Production ('000 bbls) 137.6 141.2 163.7 159.9 163.6 146.6 149.9 107.7 90.2 122.7Inventory on hand ('000 bbls) 44.9 15.4 67.1 67.8 31.7 17.6 82.6 38.8 128.4 9.9Crude Oil Sales ('000 bbls) 134.1 170.6 111.8 159.6 199.3 160.6 85.4 149.1 0.0 236.2
Revenue 10.4 10.8 7.8 12.1 13.4 11.3 5.1 3.7 0.0 10.6Operating expenses (5.5) (4.7) (4.3) (4.1) (4.1) (4.3) (3.3) (1.7) (2.3) (2.0)Workover expenditure / Other 0.0 0.0 0.0 0.0 0.0 (1.0) 0.0 0.0 (1.1) 0.0Net operating cash flow 4.9 6.1 3.6 8.0 9.3 6.0 1.8 2.0 (3.4) 8.7Inventory adjustment 0.4 (1.5) 2.9 0.0 (2.4) (0.5) 1.3 0.6 (3.8) 5.0Exploration & Development (0.7) (0.6) (0.1) (0.3) (0.9) (0.5) (0.2) 0.3 (0.3) (0.4)Amortisation (3.7) (4.6) (4.9) (4.8) (3.1) (2.8) (2.9) (2.0) (1.6) (2.1)
US$/bbl (realised excl. hedging) 77.6 63.5 70.1 75.7 67.3 70.3 59.8 25.1 45.1Cash operating costs (production)/bbl 39.9 33.4 26.1 25.8 25.0 29.0 22.2 16.1 25.2 16.2
Total Horizon Oil
US$m 1Q19 2Q19 3Q19 4Q19 1Q20 2Q20 3Q20 4Q20 1Q21 2Q21Total Production ('000 bbls) 380.2 421.7 395.2 407.5 380.9 374.0 391.9 328.8 304.6 342.0Total Sales ('000 bbls) 446.4 575.1 412.9 432.5 400.8 370.0 305.6 351.2 196.2 437.3
Sales Revenue 33.0 37.3 26.2 30.3 25.5 24.3 15.9 9.3 8.4 19.5Oil hedging gains (losses) (4.2) (2.6) 0.9 1.5 1.6 1.2 3.3 2.9 (1.0) (0.6)Total Revenue 28.8 34.8 27.0 31.8 27.1 25.5 19.2 12.2 7.4 18.9Operating expenditure (7.6) (7.7) (6.7) (6.5) (6.4) (7.1) (5.3) (3.4) (4.4) (4.5)Workovers, Repairs & Refurbishments / Other (0.6) (0.5) (0.0) (0.0) 0.0 (2.6) 0.0 (0.0) (1.6) (1.8)Net operating cash flow 20.7 26.5 20.4 25.2 20.8 15.8 13.9 8.8 1.4 12.6Inventory adjustment 0.4 (1.5) 2.9 0.0 (2.4) (0.5) 1.3 0.6 (3.8) 5.0Exploration & Development (5.0) (2.1) (0.7) (1.0) (1.5) (2.6) (0.7) (0.5) (0.8) (5.7)Amortisation (8.9) (10.6) (9.7) (10.0) (6.8) (6.7) (7.0) (5.8) (5.5) (6.1)
US$/bbl (realised excluding hedging) 73.9 64.9 63.3 70.0 63.7 65.7 51.9 26.4 42.6 44.6US$/bbl (realised including hedging) 64.6 60.5 65.5 73.4 67.7 69.0 62.8 34.6 37.5 43.2US$/bbl Cash operating costs (production bbls) 20.0 18.4 16.9 16.0 16.7 19.1 13.6 10.2 14.4 13.1US$/bbl Operating Costs including workovers etc 21.5 19.6 16.9 16.0 16.7 26.0 13.6 10.3 19.6 18.4
Exploration & Development Capex (US$m)Papua New Guinea Exploration & Development (0.8) (0.7) (0.5) (0.6) (0.6) (0.4) (0.4) (0.2) (0.3) (0.1)PMP 38160 (Maari & Manaia) & Other NZ (0.7) (0.6) (0.1) (0.3) (0.9) (0.5) (0.2) 0.3 (0.3) (0.4)Block 22/12 (Beibu Gulf) (3.4) (0.8) (0.2) (0.2) (0.1) (1.7) (0.2) (0.5) (0.2) (5.2)Total Exploration & Development (5.0) (2.1) (0.7) (1.0) (1.5) (2.6) (0.7) (0.5) (0.8) (5.7)
Level 13, 14 Martin Place, Sydney, NSW 2000 Main +61 2 8999 9988 www.mstfinancial.com.au
Disclaimers MST Access is a registered business name of MST Financial Services Pty Ltd (ACN 617 475 180 “MST Financial”) which is a limited liability company incorporated in Australia on 10 April 2017 and holds an Australian Financial Services Licence (Number: 500 557). This research is issued in Australia through MST Access which is the research division of MST Financial. The research and any access to it, is intended only for "wholesale clients" within the meaning of the Corporations Act 2001 of Australia. Any advice given by MST Access is general advice only and does not take into account your personal circumstances, needs or objectives. You should, before acting on this advice, consider the appropriateness of the advice, having regard to your objectives, financial situation and needs. If our advice relates to the acquisition, or possible acquisition, of a particular financial product you should read any relevant Product Disclosure Statement or like instrument.
This report has been commissioned by Horizon Oil Limited and prepared and issued by David Fraser of MST Access in consideration of a fee payable by Horizon Oil Limited. MST Access receives fees from the company referred to in this document, for research services and other financial services or advice we may provide to that company. The analyst has received assistance from the company in preparing this document. The company has provided the analyst with communication with senior management and information on the company and industry. As part of due diligence, the analyst has independently and critically reviewed the assistance and information provided by the company to form the opinions expressed in the report. Diligent care has been taken by the analyst to maintain an honest and fair objectivity in writing this report and making the recommendation. Where MST Access has been commissioned to prepare Content and receives fees for its preparation, please note that NO part of the fee, compensation or employee remuneration paid will either directly or indirectly impact the Content provided.
Accuracy of content: All information used in the publication of this report has been compiled from publicly available sources that are believed to be reliable, however we do not guarantee the accuracy or completeness of this report and have not sought for this information to be independently verified. Opinions contained in this report represent those of MST Access at the time of publication. Forward-looking information or statements in this report contain information that is based on assumptions, forecasts of future results, estimates of amounts not yet determinable, and therefore involve known and unknown risks, uncertainties and other factors which may cause the actual results, performance or achievements of their subject matter to be materially different from current expectations.
Exclusion of Liability: To the fullest extent allowed by law, MST Access shall not be liable for any direct, indirect or consequential losses, loss of profits, damages, costs or expenses incurred or suffered by you arising out or in connection with the access to, use of or reliance on any information contained on this note. No guarantees or warranties regarding accuracy, completeness or fitness for purpose are provided by MST Access, and under no circumstances will any of MST Financial’s officers, representatives, associates or agents be liable for any loss or damage, whether direct, incidental or consequential, caused by reliance on or use of the content
General Advice Warning MST Access Research may not it be construed as personal advice or recommendation. MST encourages investors to seek independent financial advice regarding the suitability of investments for their individual circumstances and recommends that investments be independently evaluated. Investments involve risks and the value of any investment or income may go down as well as up. Investors may not get back the full amount invested. Past performance is not indicative of future performance. Estimates of future performance are based on assumptions that may not be realised. If provided, and unless otherwise stated, the closing price provided is that of the primary exchange for the issuer’s securities or investments. The information contained within MST Access Research is published solely for information purposes and is not a solicitation or offer to buy or sell any financial instrument or participate in any trading or investment strategy. Analysis contained within MST Access Research publications is based upon publicly available information and may include numerous assumptions. Investors should be aware that different assumptions can and do result in materially different results.
MST Access Research is distributed only as may be permitted by law. It is not intended for distribution or use by any person or entity located in a jurisdiction where distribution, publication, availability or use would be prohibited. MST makes no claim that MST Access Research content may be lawfully viewed or accessed outside of Australia. Access to MST Access Research content may not be legal for certain persons and in certain jurisdictions. If you access this service or content from outside of Australia, you are responsible for compliance with the laws of your jurisdiction and/or the jurisdiction of the third party receiving such content. MST Access Research is provided to our clients through our proprietary research portal and distributed electronically by MST to its MST Access clients. Some MST Access Research products may also be made available to its clients via third party vendors or distributed through alternative electronic means as a convenience. Such alternative distribution methods are at MST’s discretion.
Access and Use Any access to or use of MST Access Research is subject to the Terms and Conditions of MST Access Research. By accessing or using MST Access Research you hereby agree to be bound by our Terms and Conditions and hereby consent to MST collecting and using your personal data (including cookies) in accordance with our Privacy Policy (https://mstfinancial.com.au/privacy-policy/), including for the purpose of a) setting your preferences and b) collecting readership data so we may deliver an improved and personalised service to you. If you do not agree to our Terms and Conditions and/or if you do not wish to consent to MST’s use of your personal data, please do not access this service.
Copyright of the information contained within MST Access Research (including trademarks and service marks) are the property of their respective owners. MST Access Research, or any portion thereof, may not be reprinted, sold or redistributed without the prior and written consent of MST