Embed Size (px)
Citation preview

HONGKONG ELECTRIC HOLDINGS LTD
Doc. Title: Lamma Water Quality Monitoring During Dredging Works Page i
LAMMA POWER STATION EXTENTION; Contract 03/9008 Doc No. : LTLD-32-1-138-G Revision : 1 Date : 14.3.2005
Saipem
TABULATION OF REVISED PAGES REVISIONS REVISIONS PAGE
0 1 2 3 4 5 6 7 PAGE
0 1 2 3 4 5 6 7
1 51 2 52 3 53 4 54 5 55 6 56 7 57 8 58 9 59 10 60 11 61 12 62 13 63 14 64 15 65
16 66
17 67
18 68
19 69
20 70 21 71 22 72 23 73 24 74 25 75 26 76 27 77 28 78 29 79 30 80 31 81 32 82 33 83 34 ATTACHMENTS/APPENDIX 35 A 36 B 37 C 38 39 40 41 42 43 44 45 46 47 48 49 50
HONGKONG ELECTRIC HOLDINGS LTD
Doc. Title: Lamma Water Quality Monitoring During Dredging Works Page ii
Saipem
Saipem Asia Sdn. Bhd
Lamma Power Station Extension
– Supply and Installation of Submarine Gas Pipeline
Lamma Water Quality Monitoring During
Dredging Works Monitoring Report (Version 1.1)
February 2005
Approved By
(Project Director: Dr. HF Chan)
REMARKS:
The information supplied and contained within this report is, to the best of our knowledge, correct at the time of printing.
CINOTECH accepts no responsibility for changes made to this report by third parties.
CINOTECH CONSULTANTS LTD Room 1602-1610, Delta House,
3 On Yiu Street, Shatin, NT, Hong Kong
Tel: (852) 2151 2083 Fax: (852) 3107 1388Email: [email protected]

HONGKONG ELECTRIC HOLDINGS LTD
Doc. Title: Lamma Water Quality Monitoring During Dredging Works Page iii
Saipem
TABLE OF CONTENTS
Page EXECUTIVE SUMMARY.......................................................................................................1 Introduction............................................................................................................................1 Environmental Monitoring Works...........................................................................................1
1 INTRODUCTION............................................................................................................2 Background ...........................................................................................................................2 Project Organizations ............................................................................................................3 Construction Programme.......................................................................................................3 Summary of EM&A Requirements.........................................................................................3
2 WATER QUALITY MONITORING .................................................................................4 Monitoring Requirements.......................................................................................................4 Monitoring Parameters ..........................................................................................................4 Monitoring Equipment............................................................................................................4 Monitoring Frequency and Duration ......................................................................................5 Monitoring Locations .............................................................................................................5 Monitoring Methodology, Calibration Details and QA/QC Procedures...................................6 Results and Observations......................................................................................................6
3 ENVIRONMENTAL AUDIT ............................................................................................8 Review of Environmental Monitoring Procedures ..................................................................8 Implementation Status of Event Action Plans ........................................................................8 Implementation Status of Mitigation Measures ......................................................................8
4 CONCLUSIONS AND RECOMMENDATIONS..............................................................9 Conclusions ...........................................................................................................................9 LIST OF TABLES Table 1.1 Key Project Contacts Table 2.1 Water Quality Monitoring Parameters Table 2.2 Water Quality Monitoring Equipment Table 2.3 Frequency and Parameters of Water Quality Monitoring Table 2.4 Locations of Water Quality Monitoring Stations LIST OF FIGURES Figure 1 Locations of Water Quality Monitoring Stations
HONGKONG ELECTRIC HOLDINGS LTD
Doc. Title: Lamma Water Quality Monitoring During Dredging Works Page iv
Saipem
LIST OF APPENDICES
A Copy of Calibration Certificate of Monitoring Equipment B Action and Limit Levels for Water Quality Monitoring C Water Quality Monitoring Results and the Graphical Presentation D Event Action Plan for Water Quality E Monitoring Schedule F Construction Phase Mitigation Measures and their Implementation (Gas
Pipeline)

HONGKONG ELECTRIC HOLDINGS LTD
Doc. Title: Lamma Water Quality Monitoring During Dredging Works Page v
Saipem
LIST OF ABBREVIATION
DO Dissolved Oxygen
EIA Environmental Impact Assessment
EM&A Environmental Monitoring and Audit
ET Environmental Team
GPS Global Positioning System
GRS Gas Receiving Station
HEC Hong Kong Electric Co. Ltd
HOKLAS The Hong Kong Laboratory Accreditation Scheme
LNG Liquefied Natural Gas
QA/QC Quality Assurance / Quality Control
SS Suspended Solids

Saipem Asia Sdn. Bhd. Lamma Power Station Extension Supply and Installation of Submarine Gas Pipeline
Lamma Water Quality Monitoring During Dredging Works
MA4017\R\M\LTLD-32-1-138-G Cinotech 1
EXECUTIVE SUMMARY
Introduction 1. This is the first Environmental Monitoring and Audit (EM&A) Report prepared by
Cinotech Consultants Limited (ET-Cinotech) for the dredging works at the Lamma Shore Approach (approximately 0.7km) for the project “Lamma Project Station Extension – Supply and Installation of Submarine Gas Pipeline” (the Project). The dredging works and the corresponding monitoring works were commenced on 22nd February 2005. This document reported the findings of EM&A Works conducted in February 2005.
Environmental Monitoring Works 2. Environmental monitoring for the Project was performed as stipulated in the Work
Procedure and the results were checked and reviewed. 3. Summary of the non-compliance of the monitoring events is tabulated Table I.
Table I Summary Table for Non-compliance Recorded No. of
Exceedances Media / Nature Action
Level Limit Level
Action Taken Results of action taken Remarks
DO 0 0
Turbidity 0 0
SS 0 0
N.A. N.A. -
Water Quality
4. Water quality monitoring was commenced on 22nd February 2005 for 3 days a
week. 5. There was no exceedance for all the parameters. No major pollution sources
were identified during the monitoring.

Saipem Asia Sdn. Bhd. Lamma Power Station Extension Supply and Installation of Submarine Gas Pipeline
Lamma Water Quality Monitoring During Dredging Works
MA4017\R\M\LTLD-32-1-138-G Cinotech 2
1 INTRODUCTION
Background
1.1 Hong Kong Electric Holdings Ltd. (HEC) intends to develop a 1,800 MW power station in Hong Kong Special Administrative Region (HKSAR) to meet the forecast increase in electricity demand to cope with the social and economical growth of the HKSAR. The proposed power station will be located at reclaimed land in the south of the existing Lamma Power Station at the western edge of Lamma Island, termed Lamma Power Station Extension.
1.2 The proposed Power Station will use natural gas as fuel to generate electricity. The natural gas will be supplied from Guandong Liquefied Natural Gas (GD LNG) Terminal located at Cheng Tou Jiao of Shenzen PRC via a 20 inches diameter gas submarine pipeline.
1.3 HEC awarded Saipem Asia Sdn. Bhd. (hereafter called “the Contractor) for the design, engineering, supply of materials, fabrication, testing at works, delivery to site, complete erection including pre-trenching, pipe laying, rock dumping, testing and pre-commissioning at site, preservation during the Defects Liability Period of Submarine Gas Pipeline under to Project titled “Lamma Power Station Extension – Supply and Installation of Submarine Gas Pipeline” (hereinafter called “the Project”). Cinotech Consultants Limited was subsequently commissioned by the Contractor as the Environmental Team (ET-Cinotech) to provide environmental consultancy services and to undertake the Environmental Monitoring and Audit (EM&A) works for the Project.
1.4 The Project works include Pre-Trenching works, Pipe-Lay installation, Post-Lay Trenching (Jetting) and Rock Dumping works related to the installation of 92 km of 20 inches diameter Submarine Gas Pipeline between Guandong Liquefied Natural Gas Terminal (GD LNG) and the receiving point at Gas Receiving Station (GRS) at South-West of Lamma Extension on Lamma Island of Hong Kong – SAR.
1.5 In particular, trench dredging works are carried out at the Lamma Shore Approach (approximately 0.7 km) for a period of about 45 days and the location is also shown in Figure 1. According Item 4.5 of the “Response to Tenderers’ Query No.2”, a minimum of ten (10) water quality monitoring stations for the dredging works at Lamma shore approach.
1.6 A Work Procedure outlining the monitoring and audit programme to be undertaken for the pre-trenching (dredging) works for the Lamma Shore Approach was submitted and approved. The dredging works and the corresponding monitoring works in accordance with the Work Procedure were commenced on 22nd February 2005.

Saipem Asia Sdn. Bhd. Lamma Power Station Extension Supply and Installation of Submarine Gas Pipeline
Lamma Water Quality Monitoring During Dredging Works
MA4017\R\M\LTLD-32-1-138-G Cinotech 3
Project Organizations
1.7 Different parties with different levels of involvement in the project organization include: • Project Proponent –Hong Kong Electric Holdings Ltd. (HEC) • Contractor – Saipem Asia Sdn. Bhd. • Environmental Team (ET-Cinotech) – Cinotech Consultants Limited
1.8 The key contacts of the ET- Cinotech are shown in Table 1.1.
Table 1.1 Key Project Contacts
Party Name Role Phone No. Fax No.
Dr. Priscilla Choy Project Manager of ET 2151 2089 3107 1388
Ms. Winniss Kong Coordinator 2151 2068 3107 1388 ET-
Cinotech
Mr. Henry Leung Monitoring Team Leader 2151 2087 3107 1388
Construction Programme
1.9 The dredging works for Lamma Shore Approach were commenced on 22nd February 2005.
Summary of EM&A Requirements
1.10 The EM&A programme requires water quality during the dredging works of the Lamma Shore Approach. Full scale water quality monitoring will be carried out within the first two weeks of the construction programme. The frequency of the monitoring after the initial two weeks will then be reduced if no acceptable impact is revealed.
1.11 The EM&A requirements are described in following sections, including: • All monitoring parameters; • Statutory limits for all environmental parameters; • Event / Action Plan.
1.12 This report presents the monitoring results, observations, locations, equipment, period, methodology and QA/QC procedures of the required monitoring parameters, namely water quality for the dredging works of the Lamma Shore Approach.
Saipem Asia Sdn. Bhd. Lamma Power Station Extension Supply and Installation of Submarine Gas Pipeline
Lamma Water Quality Monitoring During Dredging Works
MA4017\R\M\LTLD-32-1-138-G Cinotech 4
2 WATER QUALITY MONITORING
Monitoring Requirements
2.1 In order to ensure that any deterioration in water quality can be readily detected and timely action taken to rectify the situation, a water quality monitoring programme is required.
2.2 Monitoring should be carried out in stages:
1. First Stage: 3 days a week within the first two weeks of the dredging works at Lamma Approach. The monitoring shall be conducted on non-consecutive days.
2. Second Stage: If the monitoring results in first stage are found to be acceptable (no exceedance of water quality related to the Project), the frequency of the monitoring will be reduced to 1 day within the third and fourth weeks of the dredging works, subject to the approval of HEC.
3. Final Stage: If the monitoring results obtained in second stage are found to be acceptable, the monitoring will then cease, subject to the approval of HEC.
Monitoring Parameters
2.3 The following water quality parameters were included in the monitoring programme.
Table 2.1 Water Quality Monitoring Parameters Phase Water Quality Parameters Construction • Temperature (oC)
• Salinity (ppt) • pH (pH value) • Turbidity (NTU) • Dissolved oxygen (DO) (mg/L and % of saturation) • Suspended solids (SS) (mg/L)
Monitoring Equipment
2.4 The water sampler used for water quality monitoring was Kahlsico Water-Bottle Model 135DW150. The sampler with associated equipment complied with the specifications stipulated in the Work Procedure.
2.5 Table 2.2 summarizes the equipment used in the water quality monitoring program. All the monitoring equipment complied with the specifications stipulated in the Work Procedure. Copies of the calibration certificates of are attached in Appendix A.
Saipem Asia Sdn. Bhd. Lamma Power Station Extension Supply and Installation of Submarine Gas Pipeline
Lamma Water Quality Monitoring During Dredging Works
MA4017\R\M\LTLD-32-1-138-G Cinotech 5
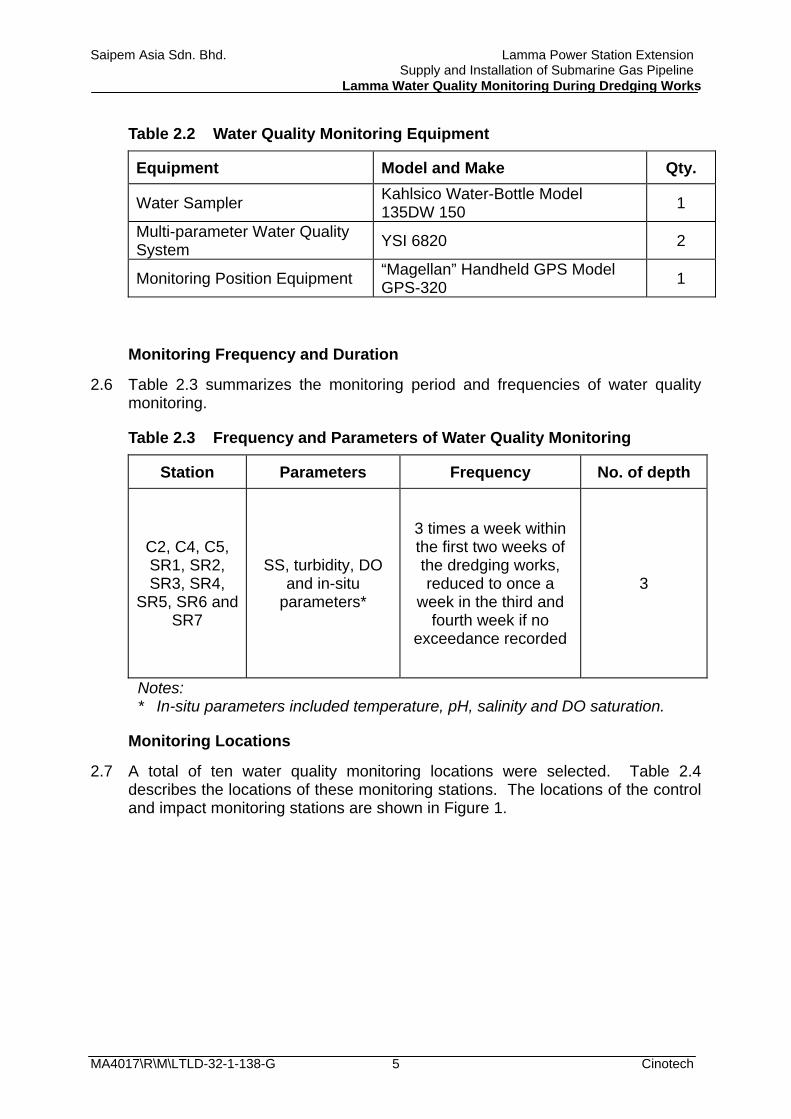
Table 2.2 Water Quality Monitoring Equipment
Equipment Model and Make Qty.
Water Sampler Kahlsico Water-Bottle Model 135DW 150 1
Multi-parameter Water Quality System YSI 6820 2
Monitoring Position Equipment “Magellan” Handheld GPS Model GPS-320 1
Monitoring Frequency and Duration
2.6 Table 2.3 summarizes the monitoring period and frequencies of water quality monitoring.
Table 2.3 Frequency and Parameters of Water Quality Monitoring
Station Parameters Frequency No. of depth
C2, C4, C5, SR1, SR2, SR3, SR4,
SR5, SR6 and SR7
SS, turbidity, DO and in-situ
parameters*
3 times a week within the first two weeks of the dredging works, reduced to once a
week in the third and fourth week if no
exceedance recorded
3
Notes: * In-situ parameters included temperature, pH, salinity and DO saturation.
Monitoring Locations
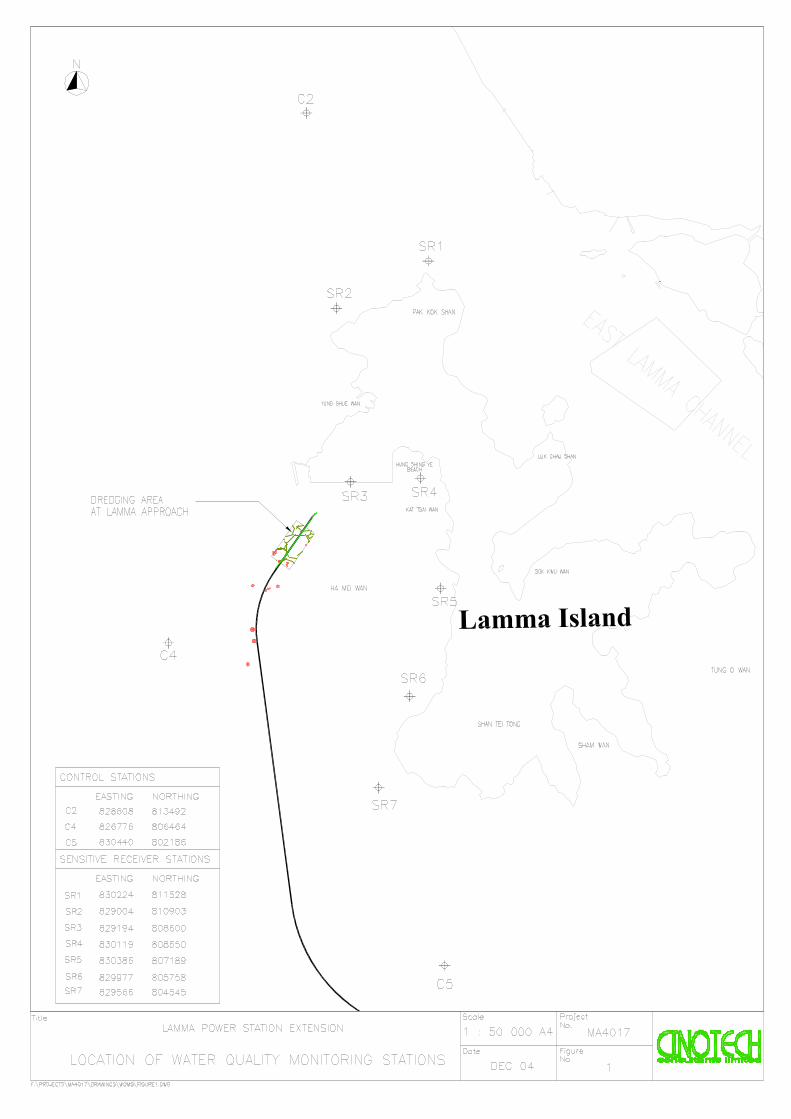
2.7 A total of ten water quality monitoring locations were selected. Table 2.4 describes the locations of these monitoring stations. The locations of the control and impact monitoring stations are shown in Figure 1.

Saipem Asia Sdn. Bhd. Lamma Power Station Extension Supply and Installation of Submarine Gas Pipeline
Lamma Water Quality Monitoring During Dredging Works
MA4017\R\M\LTLD-32-1-138-G Cinotech 6
Table 2.4 Locations of Water Quality Monitoring Stations HK 1980 Grid Station Easting Northing
Control C2 828608 813492 C4 826776 806464 C5 830440 802186
Impact SR1 830224 811528 SR2 829004 810903 SR3 829194 808600 SR4 830119 808650 SR5 830386 807189 SR6 829977 805758 SR7 829566 804545
Monitoring Methodology, Calibration Details and QA/QC Procedures
Instrumentation
2.8 A multi-parameter meter (Model YSI 6820 CE-C-M-Y) was used to measure DO, turbidity, salinity, pH and temperature.
Operating/Analytical Procedures
2.9 At each measurement, two consecutive measurements of in-situ parameters were taken. The probes were retrieved out of the water after the first measurement and then re-deployed for the second measurement. Where the difference in the value between the first and second readings of each set was more than 25% of the value of the first reading, the reading was discarded and further readings were taken.
2.10 For SS measurement, grab samples were collected. Water samples of about 1,000 ml were collected and stored in polyethylene bottles. The sample bottles were packed into an ice-box and delivered to a HOKLAS Laboratory, WELLAB Ltd., for the analysis within 24 hours.
Maintenance and Calibration
2.11 Before each round of monitoring, a zero check in distilled water was performed with the turbidity probe of YSI 6820. The probe was kept in wet condition and then calibrated with a solution of known NTU.
Results and Observations
2.12 The monitoring results and the graphical presentation are shown in Appendix C. Note that in Appendix C, the “sea condition” is given as indicative information and does not necessarily adhere to any standard sea state descriptions. In general, “calm” means small or no waves were observed; “rough” includes white-
Saipem Asia Sdn. Bhd. Lamma Power Station Extension Supply and Installation of Submarine Gas Pipeline
Lamma Water Quality Monitoring During Dredging Works
MA4017\R\M\LTLD-32-1-138-G Cinotech 7
capped sea or rougher; and “moderate” means all conditions in between “calm” and “rough”.
2.13 Water quality monitoring was conducted on 22nd, 24th and 26th February 2005 in both mid-ebb and mid-flood tides while dredging works were taking place as per the monitoring schedule (Appendix E).
2.14 The weather during the monitoring session was cloudy or fine.
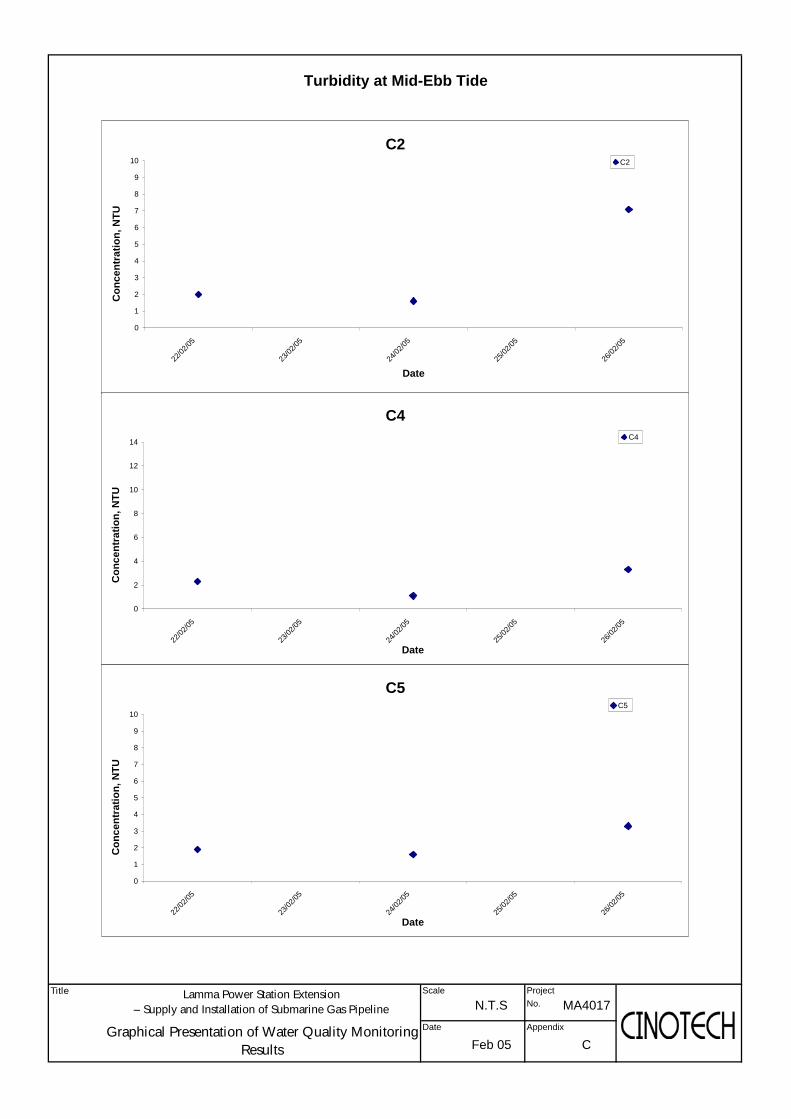
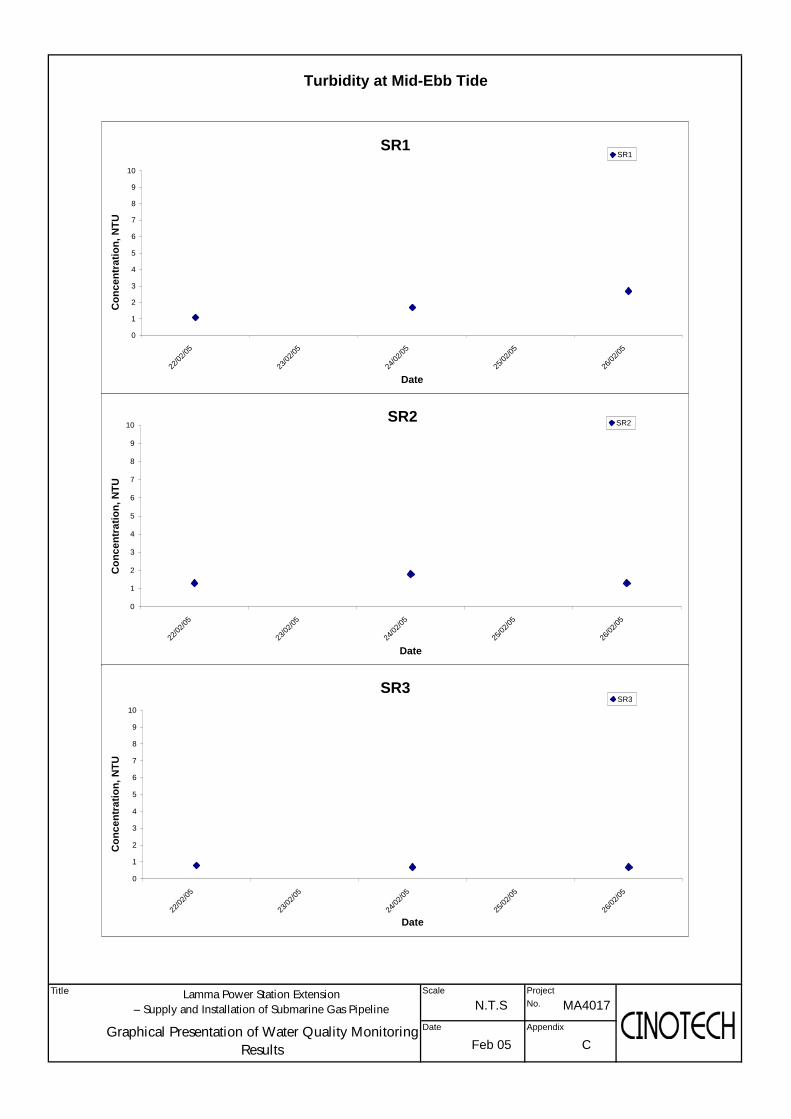
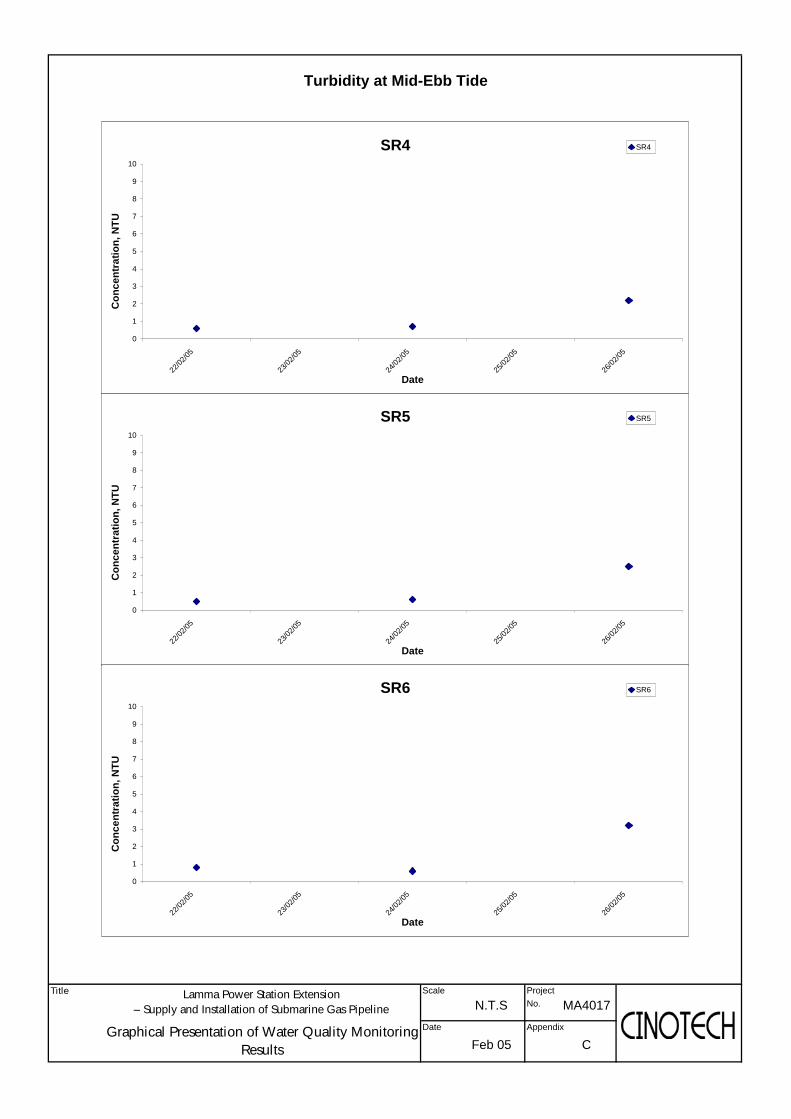
2.15 The results from the impact monitoring stations were compared with that of the control stations. The Action / Limit Levels for the water quality monitoring are summarized in Appendix B.
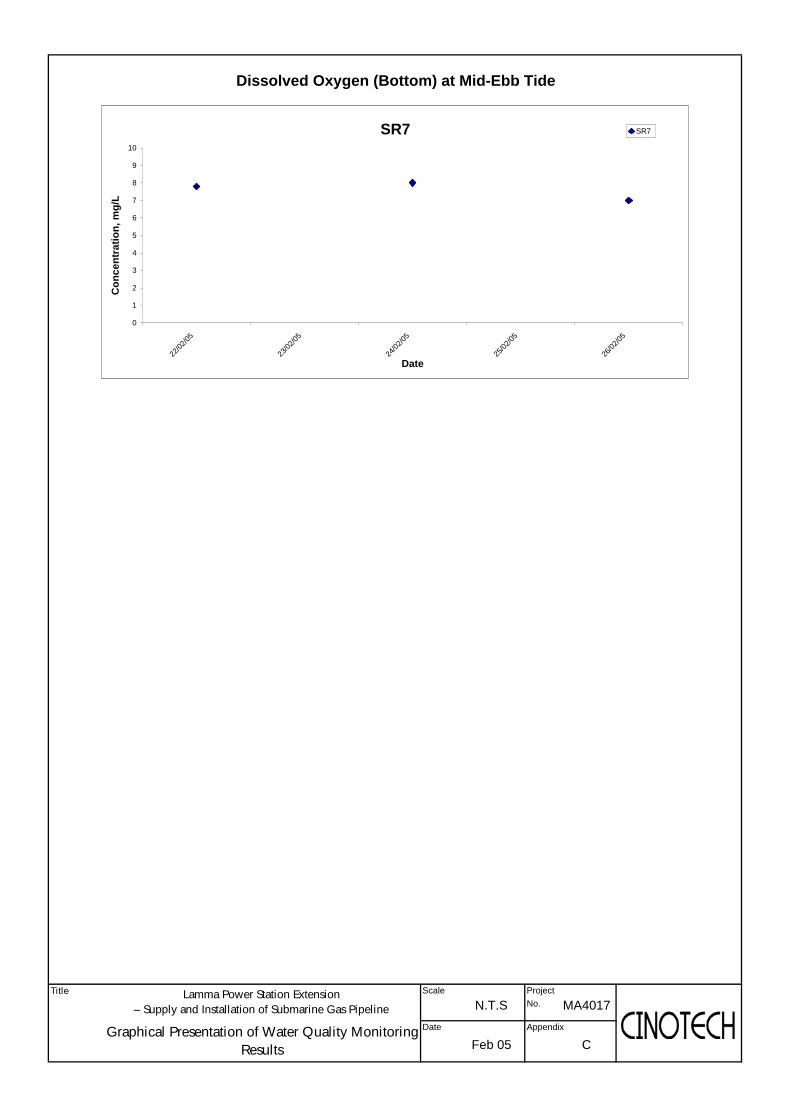
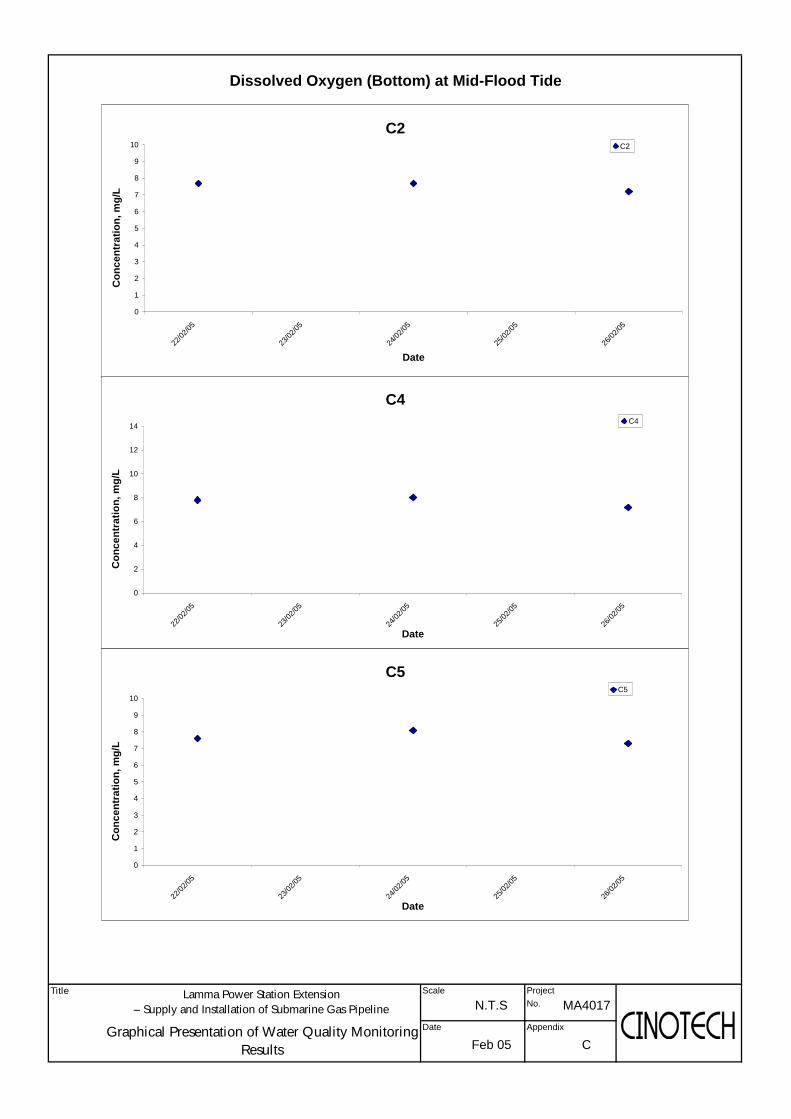
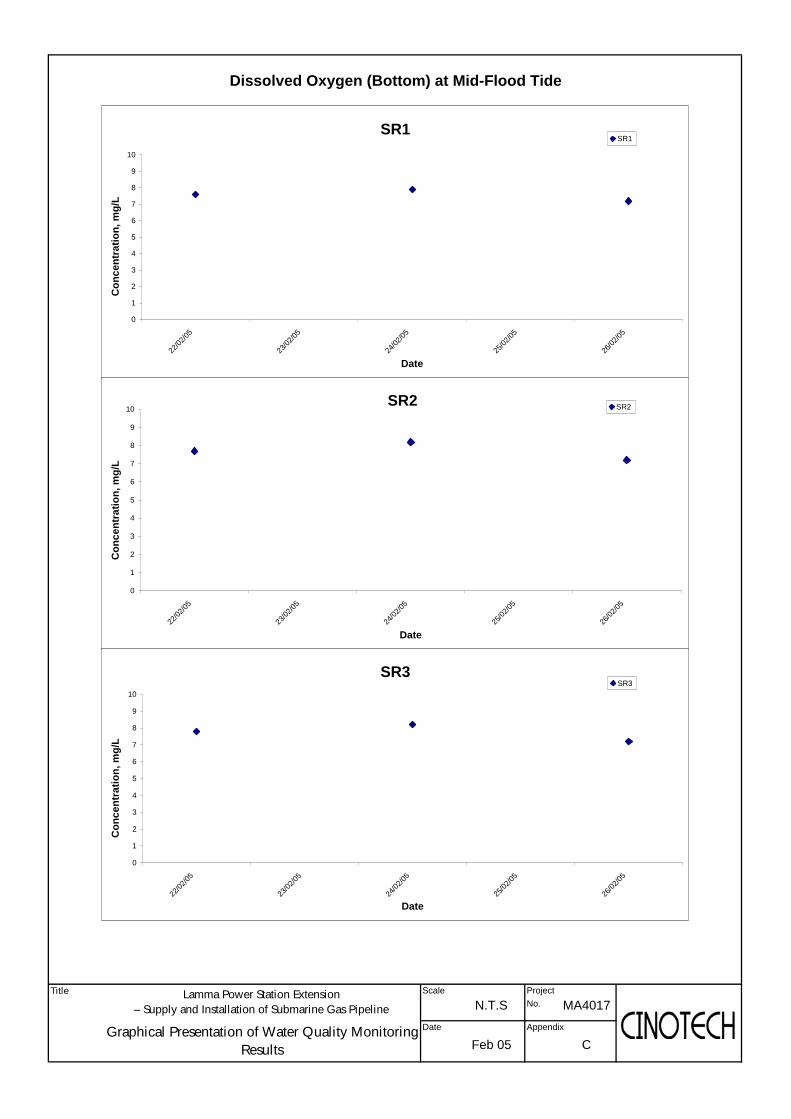
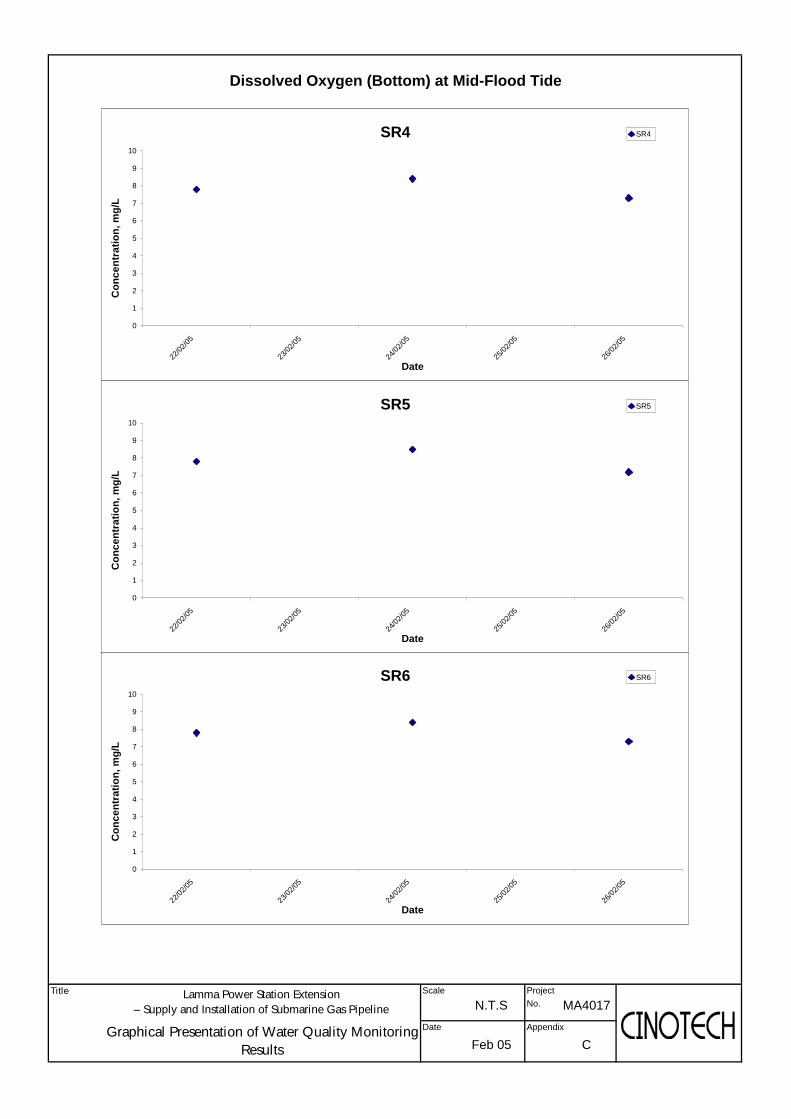
2.16 No exceedances for DO, turbidity and SS concentrations were recorded at the impact monitoring stations. The monitoring data of the impact monitoring stations were comparable to that of the control stations.
2.17 No major pollution source was observed.
Saipem Asia Sdn. Bhd. Lamma Power Station Extension Supply and Installation of Submarine Gas Pipeline
Lamma Water Quality Monitoring During Dredging Works
MA4017\R\M\LTLD-32-1-138-G Cinotech 8
3 ENVIRONMENTAL AUDIT
Review of Environmental Monitoring Procedures
3.1 The monitoring works conducted by the monitoring team were inspected. The following observations have been recorded for the monitoring works: • The monitoring team recorded all observations around the monitoring stations,
which might affect the monitoring result. • The monitoring team recorded the weather and sea conditions on the
monitoring day.
Implementation Status of Event Action Plans
3.2 The Event Action Plan for water quality is presented in Appendix D. No exceedance was recorded in the monitoring event. No further action/ monitoring was required.
Implementation Status of Mitigation Measures
3.3 The implementation status of mitigation measures is summarized in Appendix F.

Saipem Asia Sdn. Bhd. Lamma Power Station Extension Supply and Installation of Submarine Gas Pipeline
Lamma Water Quality Monitoring During Dredging Works
MA4017\R\M\LTLD-32-1-138-G Cinotech 9
4 CONCLUSIONS AND RECOMMENDATIONS
Conclusions
4.1 Environmental monitoring works were performed on 22nd, 24th and 26th February 2005 in accordance with the Work Procedure while dredging works were undertaking. All monitoring results were checked and reviewed.
4.2 There was no Action/Limit Level exceedance for all the water quality parameters. No major pollution sources were identified.

FIGURES

APPENDIX A COPY OF CALIBRATION CERTIFICATE OF MONITORING EQUIPMENT


APPENDIX B ACTION AND LIMIT LEVELS FOR WATER QUALITY MONITORING
Saipem Asia Sdn. Bhd. Lamma Power Station Extension Supply and Installation of Submarine Gas Pipeline
Lamma Water Quality Monitoring During Dredging Works
MA4017\R\M\SZ\App B - Action Limit Levels.doc Cinotech
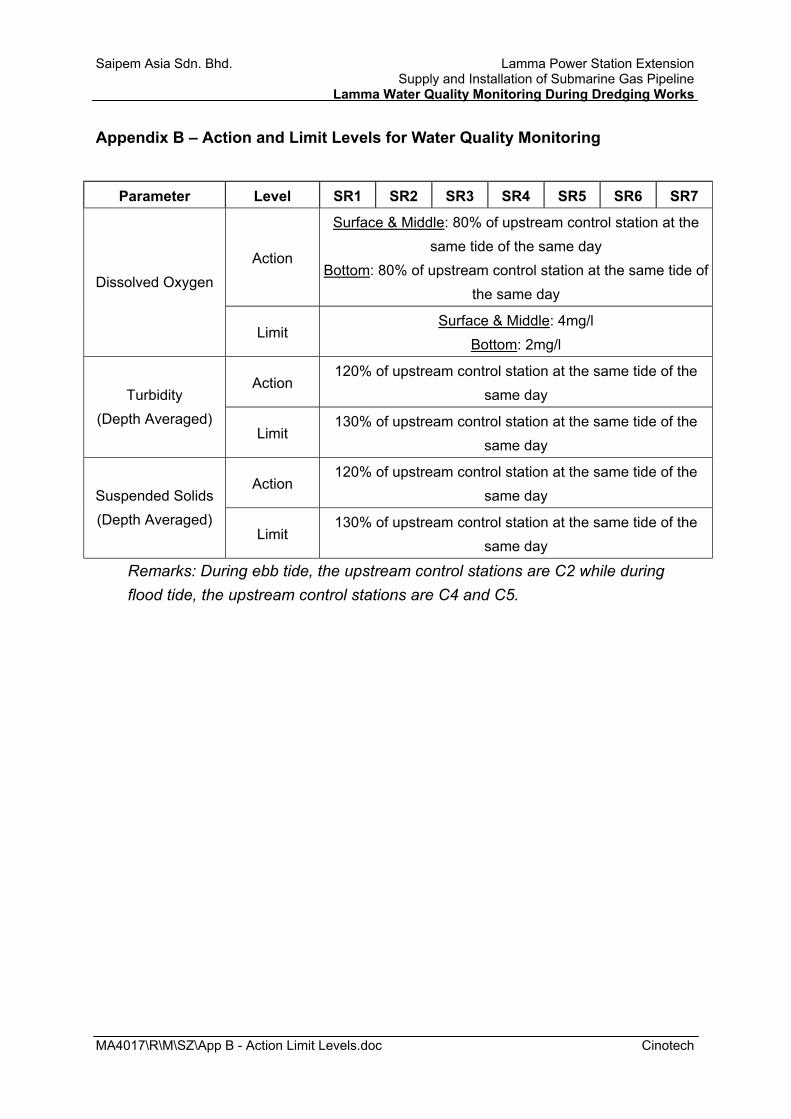
Appendix B – Action and Limit Levels for Water Quality Monitoring
Parameter Level SR1 SR2 SR3 SR4 SR5 SR6 SR7
Action
Surface & Middle: 80% of upstream control station at the same tide of the same day
Bottom: 80% of upstream control station at the same tide of the same day
Dissolved Oxygen
Limit Surface & Middle: 4mg/l
Bottom: 2mg/l
Action 120% of upstream control station at the same tide of the
same day Turbidity (Depth Averaged)
Limit 130% of upstream control station at the same tide of the
same day
Action 120% of upstream control station at the same tide of the
same day Suspended Solids (Depth Averaged)
Limit 130% of upstream control station at the same tide of the
same day
Remarks: During ebb tide, the upstream control stations are C2 while during flood tide, the upstream control stations are C4 and C5.

APPENDIX C WATER QUALITY MONITORING RESULTS AND THE GRAPHICAL PRESENTATION

Appendix C
Water Quality Monitoring Results at Location C2 - Mid-Ebb Tide
Location Weather Sea Sampling Condition Condition** Time Value Average Value Average Value Average Value Average Value Average DA* Value Average DA* Average DA*
16.0 7.9 30.9 95.8 7.8 1.216.0 7.9 30.9 95.0 7.8 1.116.0 7.9 30.9 94.0 7.7 1.716.0 7.9 31.0 93.6 7.7 1.916.0 7.9 31.0 93.1 7.6 2.916.0 8.0 30.9 93.1 7.6 2.816.1 7.8 30.9 96.5 7.9 1.016.1 7.8 30.8 96.3 7.9 1.016.1 7.8 30.9 95.3 7.8 1.516.1 7.8 30.9 95.1 7.8 1.316.1 7.9 30.9 94.3 7.7 2.516.1 7.9 30.9 94.2 7.7 2.316.6 7.8 30.7 96.6 7.8 6.816.7 7.8 30.7 90.8 7.3 6.916.6 7.8 30.8 91.0 7.4 7.016.6 7.8 30.7 89.6 7.2 6.916.6 7.8 30.7 89.2 7.2 7.116.6 7.8 30.7 88.1 7.1 7.4
Water Quality Monitoring Results at Location C2 - Mid-Flood Tide
Location Weather Sea Sampling Condition Condition** Time Value Average Value Average Value Average Value Average Value Average DA* Value Average DA* Average DA*
15.9 8.0 31.0 95.6 7.8 0.615.9 7.9 30.9 95.3 7.8 0.615.9 8.0 31.0 95.4 7.8 1.015.9 8.0 31.0 95.3 7.8 0.815.9 8.0 31.0 93.9 7.7 1.615.9 8.0 31.0 93.7 7.7 1.716.2 7.9 30.7 99.4 8.1 1.216.2 7.9 30.7 98.3 8.0 1.316.2 7.9 30.7 94.7 7.7 1.716.2 7.9 30.7 94.6 7.7 1.816.1 7.9 30.8 93.8 7.7 1.616.1 7.9 30.8 93.7 7.7 1.816.3 7.8 30.2 90.1 7.4 1.516.3 7.7 30.1 91.0 7.4 1.616.3 7.7 30.1 88.6 7.2 3.616.3 7.7 30.2 88.5 7.2 3.616.3 7.7 30.1 87.8 7.2 4.216.3 7.8 30.2 87.6 7.2 4.1
Remarks: * DA: Depth-Averaged ** Calm: Small or no wave; Moderate: Between calm and rough; Rough : White capped or rougher
5
4
10
6
3.1
pH
90.6
7.2
87.7
93.8
7.9 30.7
98.97.9
6
7.2
3
57.8
5
0.9 6
1.7
7.8
Bottom
Surface
Middle
5
Depth (m)
4
4
95.5
95.4
1
13
7 16.1
16.1
16.1
Middle
Bottom
Middle
8
7
8
14
1
Middle
Bottom
Surface
13
1
Bottom
Surface 1
Bottom
Surface
15.9
15.9
Temperature (oC)
16.6
15.9
30.7
16.3 7.47.8
16.2
94.7
30.2
16.2
16.6
7
Surface
Middle
13
16.71
Depth (m) Temperature (oC) pH Salinity ppt
690.3
88.7
7.0 7.1 6
7
7.6
7.2
93.7
16.1 93.8 7.77.9 30.8
7.8 30.8
8.0
8.0
16.3 88.6
14 16.3 7.8 30.2
7.7 30.2
5
Suspended Solids (mg/L)Turbidity(NTU)
5
2.0
6
1.2
1.8 502/22/05 Cloudy Moderate 11:14
02/24/05 Cloudy Moderate 10:00
Cloudy Moderate 18:01
02/26/05 Fine Moderate 10:18
30.9
02/26/05 Fine Moderate 08:10
02/24/05 Cloudy Moderate 17:57
02/22/05
1.6
8.1 1.3
7.7 1.87.9
7.7 1.7
31.0
7.8 30.7
7.8 30.7
Salinity ppt
31.0
DO Saturation (%) Dissolved Oxygen (mg/L)
8.0 31.0
94.3
7
7.9 30.9
7.996.4
7.7
7.8 30.9
7.8
1.1
6.9
7.3
0.6
Suspended Solids (mg/L)
6
6
1.6
7
4
Turbidity(NTU)
2.4
1.0
1.4
7.3
7.2
3.6
4.2
1.6
7.5
7.7
7.9
7.8
7.2
7.8
7.3
7.7
7.7
7.793.8
7.6
95.2
8.0
31.0
31.0 2.9
7.8
7.693.1
7.895.430.9Surface
Bottom
7.916.07Middle
16.0
16.0
13
1 7.9
DO Saturation (%) Dissolved Oxygen (mg/L)

Appendix C
Water Quality Monitoring Results at Location C4 - Mid-Ebb Tide
Location Weather Sea Sampling Condition Condition** Time Value Average Value Average Value Average Value Average Value Average DA* Value Average DA* Average DA*
15.9 7.9 31.1 97.2 8.0 1.915.9 7.9 31.1 96.9 7.9 1.815.9 8.0 31.1 96.1 7.9 2.015.9 8.0 31.1 96.0 7.9 1.715.9 8.0 31.1 95.4 7.8 2.815.9 8.0 31.1 95.2 7.8 3.116.0 8.0 31.0 100.4 8.2 0.616.0 8.0 31.0 100.1 8.2 0.716.0 8.0 31.0 99.2 8.1 1.116.0 8.0 31.0 99.2 8.1 1.016.0 8.0 31.0 98.5 8.1 1.315.9 8.0 31.0 98.4 8.1 1.416.4 7.9 30.3 93.6 7.6 3.216.4 7.9 30.3 90.9 7.4 3.416.4 7.8 30.3 88.5 7.2 3.216.4 7.9 30.3 89.8 7.3 3.116.4 8.0 30.5 91.9 7.5 3.416.4 8.0 30.4 88.5 7.2 3.6
Water Quality Monitoring Results at Location C4 - Mid-Flood Tide
Location Weather Sea Sampling Condition Condition** Time Value Average Value Average Value Average Value Average Value Average DA* Value Average DA* Average DA*
15.9 7.9 31.1 96.9 7.9 1.915.9 7.9 31.1 96.7 7.9 1.815.9 7.9 31.1 96.0 7.9 1.915.9 8.0 31.1 95.9 7.9 1.915.9 8.0 31.1 95.6 7.8 3.515.9 8.0 31.1 95.5 7.8 3.416.1 8.0 31.0 97.2 7.9 1.216.1 8.0 30.9 97.4 8.0 1.316.0 8.0 31.0 96.8 7.9 1.816.0 8.0 31.0 97.1 7.9 1.916.0 8.0 31.0 97.5 8.0 1.816.0 8.0 31.0 97.2 7.9 2.016.3 7.8 30.2 89.9 7.3 3.816.3 7.8 30.2 91.5 7.5 3.716.3 7.8 30.2 88.8 7.3 3.916.3 7.9 30.3 88.7 7.2 3.816.3 7.9 30.3 88.0 7.2 3.916.3 7.9 30.3 87.7 7.2 4.0
Remarks: * DA: Depth-Averaged ** Calm: Small or no wave; Moderate: Between calm and rough; Rough : White capped or rougher
7.9
DO Saturation (%) Dissolved Oxygen (mg/L)
8.015.99Middle
8.0
31.1
31.1 3.0
8.0
7.895.3
8.097.131.1
7.8
7.996.1
7.8
99.2
7.4
7.9
7.3
8.1
7.4
7.2
3.9
4.0
3.8
Suspended Solids (mg/L)
5
7
1.1
5
5
Turbidity(NTU)
1.4
0.7
1.1
31.0
8.0
2.4
3.3
3.5
1.9
7.4
7.8
8.2
8.1
8.0 31.1
98.5
3
8.0 31.0
8.2100.3
8.1
8.0
Salinity ppt
31.1
DO Saturation (%) Dissolved Oxygen (mg/L)
7.9 30.3
8.0 30.5
1.7
8.0 1.3
7.9 1.98.0
8.0 1.9
31.0
02/26/05 Fine Moderate 08:26
02/24/05 Cloudy Moderate 16:16
02/22/05 Cloudy Moderate 15:43
02/26/05 Fine Moderate 12:07
02/24/05 Cloudy Moderate 12:38
02/22/05 Cloudy Moderate 13:44 4
Suspended Solids (mg/L)Turbidity(NTU)
4
2.3
6
1.9
1.9 3
7.9
16.3 88.8
17 16.3 7.9 30.3
7.9 30.3
31.1
7.4
92.3
16.0 97.4 8.08.0 31.0
7.9 30.3
8.0
pH Salinity ppt
689.2
90.2
3.2 3.3 6
8
7.516.41
Depth (m) Temperature (oC)
Surface
Bottom 15.9
15.9
16
1
9
Surface
Middle
17
31.0
16.3 7.47.8
16.1
97.0
30.2
16.0
15.9
15.9
Temperature (oC)
16.4
15.9
16.4
Surface
16
1
Bottom
Surface 1
Bottom
Surface
Middle
Bottom
Middle
9
9
9
16
1
Middle
Bottom
1
16
9 16.0
16.0
16.0
Bottom
Surface
Middle
6
Depth (m)
7
3
96.8
96.0
7
7.2
5
67.9
6
1.9 6
3.5
7.9
3.9
pH
90.7
7.3
87.9
95.6
8.0 31.0
97.38.0
7
7
9
7

Appendix C
Water Quality Monitoring Results at Location C5 - Mid-Ebb Tide
Location Weather Sea Sampling Condition Condition** Time Value Average Value Average Value Average Value Average Value Average DA* Value Average DA* Average DA*
16.0 7.9 31.0 97.4 8.0 0.816.0 7.9 31.0 97.1 7.9 0.816.1 8.0 31.1 96.1 7.8 1.216.1 8.0 31.1 95.9 7.8 1.316.5 8.0 31.3 93.9 7.6 3.416.5 8.0 31.3 93.7 7.6 3.815.8 7.9 30.9 97.5 8.0 1.115.8 7.9 30.9 97.4 8.0 1.115.8 7.9 30.9 97.4 8.0 1.415.8 7.9 30.9 97.3 8.0 1.415.8 7.9 30.9 97.4 8.0 2.215.8 7.9 30.9 97.4 8.0 2.416.4 7.9 30.4 88.2 7.2 3.316.4 7.9 30.3 90.2 7.4 3.416.4 8.0 30.4 89.1 7.3 3.216.4 8.0 30.4 88.4 7.2 3.116.4 8.0 30.4 88.3 7.2 3.216.4 8.0 30.4 88.9 7.2 3.2
Water Quality Monitoring Results at Location C5 - Mid-Flood Tide
Location Weather Sea Sampling Condition Condition** Time Value Average Value Average Value Average Value Average Value Average DA* Value Average DA* Average DA*
16.0 7.9 31.0 97.6 8.0 1.416.0 7.9 31.0 97.2 8.0 1.416.0 8.0 31.0 96.2 7.9 1.216.0 8.0 31.0 96.1 7.9 1.216.7 8.0 31.3 94.3 7.6 8.316.7 8.0 31.3 93.9 7.6 8.116.0 7.9 30.9 100.4 8.2 1.116.0 7.9 30.9 100.2 8.2 1.315.9 7.9 30.9 99.7 8.2 2.015.9 7.9 30.9 99.7 8.2 1.915.9 7.9 31.0 99.1 8.1 2.315.9 8.0 31.0 99.0 8.1 2.316.4 7.8 30.2 91.2 7.4 2.416.4 7.8 30.3 88.9 7.2 2.416.4 7.9 30.3 88.5 7.2 3.116.4 7.9 30.3 89.3 7.3 3.116.4 7.9 30.3 89.8 7.3 3.716.4 7.9 30.3 88.8 7.2 4.0
Remarks: * DA: Depth-Averaged ** Calm: Small or no wave; Moderate: Between calm and rough; Rough : White capped or rougher
7
6
8
4
3.1
pH
90.1
7.3
89.3
94.1
7.9 30.9
100.37.9
7
7.3
5
78.0
10
1.2 7
8.2
7.9
Bottom
Surface
Middle
5
Depth (m)
4
8
97.4
96.2
1
21
11 15.8
15.8
15.8
Middle
Bottom
Middle
12
12
12
23
1
Middle
Bottom
Surface
22
1
Bottom
Surface 1
Bottom
Surface
16.0
16.7
Temperature (oC)
16.4
16.0
16.4
30.9
16.4 7.37.8
16.0
99.7
30.3
15.9
12
Surface
Middle
22
16.41
Depth (m) Temperature (oC)
Surface
Bottom 16.5
16.0
22
1
8.0
pH Salinity ppt
688.8
88.6
3.2 3.3 6
6
15.9 99.1 8.18.0 31.0
7.9
16.4 88.9
22 16.4 7.9 30.3
7.9 30.3
31.3
5
Suspended Solids (mg/L)Turbidity(NTU)
5
1.9
6
0.8
1.3 502/22/05 Cloudy Moderate 13:16
02/24/05 Cloudy Moderate 11:56
Cloudy Moderate 16:10
02/26/05 Fine Moderate 12:10
30.9
02/26/05 Fine Moderate 09:20
02/24/05 Cloudy Moderate 15:59
02/22/05
1.8
8.2 1.2
8.2 2.08.2
8.1 2.3
7.9 30.4
8.0 30.4
8.0 30.4
Salinity ppt
31.0
DO Saturation (%) Dissolved Oxygen (mg/L)
8.0 31.0
97.4
3
7.9 30.9
8.097.5
8.0
7.9 30.9
7.9
3.6
3.4
3.2
1.4
7.3
7.6
8.0
8.0
Suspended Solids (mg/L)
6
8
1.6
7
7
Turbidity(NTU)
2.3
1.1
1.4
7.3
7.3
3.1
3.9
2.4
7.2
8.0
7.3
8.0
7.2
7.3
7.6
7.896.0
7.6
97.4
89.2
8.0
31.1
31.3 3.6
7.9
7.693.8
8.097.331.0
8.016.112Middle
7.9
DO Saturation (%) Dissolved Oxygen (mg/L)

Appendix C
Water Quality Monitoring Results at Location SR1 - Mid-Ebb Tide
Location Weather Sea Sampling Condition Condition** Time Value Average Value Average Value Average Value Average Value Average DA* Value Average DA* Average DA*
16.0 8.0 31.0 93.6 7.7 0.916.0 8.0 30.9 93.4 7.6 0.916.1 8.0 31.0 93.3 7.6 1.216.0 8.0 31.0 93.3 7.6 1.316.1 8.0 31.0 93.5 7.6 1.216.1 8.0 31.0 93.5 7.6 1.216.1 7.9 30.9 94.0 7.7 1.316.1 7.9 30.8 94.0 7.7 1.416.1 7.9 30.9 94.3 7.7 1.516.1 7.9 30.9 94.3 7.7 1.616.1 7.9 30.9 94.1 7.7 2.016.1 7.9 30.9 94.2 7.7 2.116.2 7.9 30.3 94.7 7.7 2.816.2 7.9 30.3 90.3 7.4 2.816.2 7.9 30.3 91.7 7.5 2.516.2 7.9 30.3 90.6 7.4 2.816.2 7.9 30.3 89.7 7.3 2.616.2 7.9 30.3 89.7 7.3 2.6
Water Quality Monitoring Results at Location SR1 - Mid-Flood Tide
Location Weather Sea Sampling Condition Condition** Time Value Average Value Average Value Average Value Average Value Average DA* Value Average DA* Average DA*
16.0 7.9 31.0 95.4 7.8 1.116.0 7.9 31.0 94.9 7.8 1.216.0 8.0 31.0 93.6 7.7 1.016.0 8.0 31.0 93.6 7.7 0.916.0 8.0 31.0 93.5 7.6 1.816.0 8.0 31.0 93.4 7.6 1.616.7 7.9 30.8 95.8 7.7 0.816.7 7.9 30.8 95.8 7.7 0.816.1 7.9 30.8 94.9 7.7 1.216.1 7.9 30.9 94.8 7.7 1.316.1 7.9 30.9 96.4 7.9 3.116.1 7.9 30.9 96.3 7.9 2.516.5 7.8 30.3 87.7 7.1 2.816.5 7.8 30.2 87.6 7.2 2.816.5 7.9 30.3 88.4 7.2 2.916.5 7.9 30.3 87.8 7.1 3.016.5 7.9 30.3 88.3 7.2 3.316.5 7.9 30.3 87.0 7.1 3.3
Remarks: * DA: Depth-Averaged ** Calm: Small or no wave; Moderate: Between calm and rough; Rough : White capped or rougher
8.0
DO Saturation (%) Dissolved Oxygen (mg/L)
8.016.114Middle
8.0
31.0
31.0 1.2
7.7
7.693.5
7.793.531.0
7.6
7.693.3
7.6
94.3
7.3
7.8
7.5
7.7
7.2
7.2
3.0
3.3
2.8
Suspended Solids (mg/L)
6
4
1.7
8
5
Turbidity(NTU)
2.1
1.4
1.6
30.9
7.9
1.3
2.8
2.6
1.2
7.6
7.6
7.7
7.7
8.0 31.0
94.2
7
7.9 30.9
7.794.0
7.7
7.9
Salinity ppt
31.0
DO Saturation (%) Dissolved Oxygen (mg/L)
7.9 30.3
7.9 30.3
1.6
7.7 0.8
7.7 1.37.7
7.9 2.8
30.9
02/26/05 Fine Moderate 09:22
02/24/05 Cloudy Moderate 17:36
02/22/05 Cloudy Moderate 17:45
02/26/05 Fine Moderate 12:24
02/24/05 Cloudy Moderate 10:20
02/22/05 Cloudy Moderate 11:35 6
Suspended Solids (mg/L)Turbidity(NTU)
4
1.1
8
0.9
1.3 5
7.9
16.5 88.1
26 16.5 7.9 30.3
7.9 30.3
31.0
7.3
92.5
16.1 96.4 7.97.9 30.9
7.9 30.3
8.0
pH Salinity ppt
591.2
89.7
2.7 2.7 6
3
7.616.21
Depth (m) Temperature (oC)
Surface
Bottom 16.1
16.0
27
1
14
Surface
Middle
27
30.8
16.5 7.27.8
16.7
94.9
30.3
16.1
16.0
16.0
Temperature (oC)
16.2
16.0
16.2
Surface
26
1
Bottom
Surface 1
Bottom
Surface
Middle
Bottom
Middle
14
14
12
22
1
Middle
Bottom
1
27
14 16.1
16.1
16.1
Bottom
Surface
Middle
5
Depth (m)
3
5
95.2
93.6
4
7.2
4
57.8
8
1.0 4
1.7
7.7
3.0
pH
87.7
7.2
87.7
93.5
7.9 30.9
95.87.9
4
3
4
6

Appendix C
Water Quality Monitoring Results at Location SR2 - Mid-Ebb Tide
Location Weather Sea Sampling Condition Condition** Time Value Average Value Average Value Average Value Average Value Average DA* Value Average DA* Average DA*
16.0 7.9 30.9 94.8 7.8 1.016.0 7.9 30.9 94.3 7.7 0.916.0 7.9 31.0 93.7 7.7 1.216.0 7.9 31.0 93.7 7.7 1.216.1 8.0 31.1 93.6 7.6 1.716.1 8.0 31.1 93.6 7.6 1.716.2 7.9 30.9 96.9 7.9 1.516.2 7.9 30.9 96.3 7.9 1.416.2 7.9 31.0 96.5 7.9 1.716.2 7.9 31.0 97.0 7.9 1.816.2 7.9 31.0 98.0 8.0 2.116.2 7.9 31.0 98.1 8.0 2.316.2 7.9 30.3 94.6 7.7 1.216.2 7.9 30.4 93.2 7.6 1.216.2 7.9 30.4 91.8 7.5 1.216.2 7.9 30.3 91.7 7.5 1.116.2 8.0 30.4 92.0 7.5 1.416.2 7.9 30.4 90.4 7.4 1.6
Water Quality Monitoring Results at Location SR2 - Mid-Flood Tide
Location Weather Sea Sampling Condition Condition** Time Value Average Value Average Value Average Value Average Value Average DA* Value Average DA* Average DA*
15.8 7.9 31.0 96.4 7.9 1.215.8 7.9 31.0 96.3 7.9 1.215.8 8.0 31.0 94.6 7.8 1.215.8 8.0 31.0 94.5 7.8 1.115.8 8.0 31.0 94.4 7.7 1.315.8 8.0 31.0 94.2 7.7 1.416.7 7.6 30.7 105.8 8.5 1.816.5 7.8 30.8 103.4 8.4 1.616.2 7.9 30.8 101.1 8.2 1.116.2 7.9 30.8 101.0 8.2 1.116.1 7.9 30.8 100.2 8.2 1.116.1 7.9 30.8 100.1 8.2 0.916.5 7.9 30.3 87.4 7.1 3.116.5 7.9 30.3 88.2 7.2 3.316.5 7.9 30.3 89.2 7.3 3.516.5 7.8 30.3 86.9 7.1 3.616.4 7.9 30.3 88.1 7.2 4.016.5 7.9 30.3 88.2 7.2 4.0
Remarks: * DA: Depth-Averaged ** Calm: Small or no wave; Moderate: Between calm and rough; Rough : White capped or rougher
7
8
7
4
3.6
pH
87.8
7.2
88.2
94.3
7.9 30.8
104.67.7
7
7.2
3
57.9
9
1.2 4
1.4
7.8
Bottom
Surface
Middle
5
Depth (m)
6
5
96.4
94.6
1
10
6 16.2
16.2
16.2
Middle
Bottom
Middle
5
6
6
11
1
Middle
Bottom
Surface
10
1
Bottom
Surface 1
Bottom
Surface
15.8
15.8
Temperature (oC)
16.2
15.8
16.2
30.8
16.5 7.27.9
16.6
101.1
30.3
16.2
5
Surface
Middle
9
16.21
Depth (m) Temperature (oC)
Surface
Bottom 16.1
16.0
10
1
8.0
pH Salinity ppt
591.8
91.2
1.2 1.3 6
4
16.1 100.2 8.27.9 30.8
7.9
16.5 88.1
9 16.5 7.9 30.3
7.9 30.3
31.0
5
Suspended Solids (mg/L)Turbidity(NTU)
5
1.3
6
1.0
1.2 502/22/05 Cloudy Moderate 11:50
02/24/05 Cloudy Moderate 10:31
Cloudy Moderate 17:34
02/26/05 Fine Moderate 12:40
31.0
02/26/05 Fine Moderate 09:26
02/24/05 Cloudy Moderate 17:26
02/22/05
1.3
8.5 1.7
8.2 1.18.4
8.2 1.0
7.9 30.4
8.0 30.4
7.9 30.4
Salinity ppt
31.0
DO Saturation (%) Dissolved Oxygen (mg/L)
8.0 31.0
98.1
7
7.9 31.0
7.996.6
8.0
7.9 30.9
7.9
1.3
1.2
1.5
1.2
7.6
7.7
7.9
7.9
Suspended Solids (mg/L)
6
4
1.8
6
4
Turbidity(NTU)
2.2
1.5
1.8
7.2
7.2
3.6
4.0
3.2
7.5
7.9
7.5
8.0
7.5
7.7
7.7
7.793.7
7.6
96.8
93.9
8.0
31.0
31.1 1.7
7.8
7.693.6
7.894.630.9
7.916.06Middle
7.9
DO Saturation (%) Dissolved Oxygen (mg/L)

Appendix C
Water Quality Monitoring Results at Location SR3 - Mid-Ebb Tide
Location Weather Sea Sampling Condition Condition** Time Value Average Value Average Value Average Value Average Value Average DA* Value Average DA* Average DA*
15.9 7.9 31.1 95.6 7.8 0.715.9 7.9 31.1 95.2 7.8 0.615.9 7.9 31.1 95.0 7.8 0.715.9 8.0 31.1 94.9 7.8 0.815.9 8.0 31.1 94.8 7.8 0.815.9 8.0 31.1 94.7 7.8 0.816.2 7.9 31.0 100.4 8.2 0.816.2 7.9 31.0 100.4 8.2 0.816.2 7.9 31.0 100.3 8.2 0.616.2 7.9 31.0 100.5 8.2 0.616.2 7.9 31.0 100.9 8.2 0.716.2 7.9 31.0 101.0 8.2 0.816.3 7.9 30.3 94.5 7.7 0.716.3 7.9 30.3 91.9 7.5 0.716.3 7.9 30.4 91.5 7.5 0.616.3 7.9 30.3 91.1 7.4 0.616.3 7.9 30.3 90.5 7.4 0.916.3 7.9 30.3 92.1 7.5 0.9
Water Quality Monitoring Results at Location SR3 - Mid-Flood Tide
Location Weather Sea Sampling Condition Condition** Time Value Average Value Average Value Average Value Average Value Average DA* Value Average DA* Average DA*
15.9 7.9 31.0 98.4 8.1 1.015.9 7.9 31.0 98.4 8.1 0.915.9 8.0 31.1 95.6 7.8 1.215.9 8.0 31.1 95.4 7.8 1.115.7 8.0 31.1 94.9 7.8 0.915.7 8.0 31.1 94.7 7.8 1.016.4 7.9 30.9 97.9 7.9 0.516.3 7.9 31.0 99.3 8.1 0.516.2 8.0 30.9 99.3 8.1 0.916.1 8.0 30.9 99.5 8.1 1.016.0 8.0 30.9 99.8 8.2 0.515.9 8.0 30.9 99.9 8.2 0.616.5 7.9 30.3 88.0 7.2 4.016.5 7.9 30.3 88.5 7.2 4.016.5 7.9 30.3 89.1 7.3 3.616.4 7.9 30.3 86.6 7.1 3.816.4 7.9 30.3 89.0 7.2 3.816.4 7.9 30.3 87.4 7.1 3.9
Remarks: * DA: Depth-Averaged ** Calm: Small or no wave; Moderate: Between calm and rough; Rough : White capped or rougher
Dissolved Oxygen (mg/L)
Middle
7.9
DO Saturation (%)
31.1
8.015.957.8
7.894.8
7.895.4
93.2
8.0
31.1
31.1
7.895.0
7.8
100.4
7.2
7.2
3.7
3.9
4.0
Suspended Solids (mg/L)
4
3
0.7
4
3
Turbidity(NTU)
0.8
0.8
0.6
7.6
7.8
8.2
8.2
7.5
8.1
7.5
8.2
7.5
7.6
1.1
0.7
0.9
1.0
101.0
5
7.9 31.0
8.2100.4
8.2
7.9 31.0
7.9
Salinity ppt
31.0
DO Saturation (%) Dissolved Oxygen (mg/L)
7.9 30.3
7.9 30.3
7.9 30.4
0.7
8.0 0.5
8.1 1.08.1
8.2 0.6
31.0
02/26/05 Fine Moderate 09:30
02/24/05 Cloudy Moderate 17:04
02/22/05 Cloudy Moderate 17:11
02/26/05 Fine Moderate 12:53
02/24/05 Cloudy Moderate 10:55
02/22/05 Cloudy Moderate 12:15 6
Suspended Solids (mg/L)Turbidity(NTU)
5
0.8
8
0.7
0.8 4
0.8
16.5 87.9
8 16.4 7.9 30.3
7.9 30.3
8.28.0 30.9
7.9
31.1
8.0 31.1
7.88.0
pH Salinity ppt
491.3
91.3
0.6 0.7 5
3
16.31
Depth (m) Temperature (oC)
Surface
Bottom 15.9
15.9
8
1
4
Surface
Middle
8
31.0
16.5 7.27.9
16.4
99.4
30.3
16.2
16.0 99.9
15.9
15.7
Temperature (oC)
16.3
15.9
16.3
Surface
7
1
Bottom
Surface 1
Bottom
Surface
Middle
Bottom
Middle
5
4
5
8
1
Middle
Bottom
1
7
4 16.2
16.2
16.2
Bottom
Surface
Middle
6
Depth (m)
4
11
98.4
95.5
6
7.2
3
48.0
4
1.2 5
1.0
7.8
3.9
pH
88.3
7.2
88.2
94.8
8.0 30.9
98.67.9
6
6
6
3

Appendix C
Water Quality Monitoring Results at Location SR4 - Mid-Ebb Tide
Location Weather Sea Sampling Condition Condition** Time Value Average Value Average Value Average Value Average Value Average DA* Value Average DA* Average DA*
15.5 7.9 31.1 99.1 8.2 0.615.5 7.9 31.1 98.6 8.1 0.615.5 7.9 31.1 96.4 8.0 0.615.5 7.9 31.1 95.9 7.9 0.615.5 8.0 31.1 94.9 7.8 0.515.5 8.0 31.1 94.8 7.8 0.516.2 7.8 30.9 101.5 8.3 0.616.2 7.9 31.0 101.2 8.3 0.716.2 7.9 31.0 100.7 8.2 0.816.2 7.9 31.0 100.5 8.2 0.716.2 7.9 31.0 100.3 8.2 0.616.2 7.9 31.0 100.4 8.2 0.516.3 8.0 30.4 94.0 7.7 1.416.3 8.0 30.4 92.5 7.6 1.516.3 8.0 30.4 90.9 7.4 2.216.3 8.0 30.4 91.0 7.4 2.116.4 8.0 30.4 89.6 7.3 2.816.4 8.0 30.4 90.0 7.3 2.7
Water Quality Monitoring Results at Location SR4 - Mid-Flood Tide
Location Weather Sea Sampling Condition Condition** Time Value Average Value Average Value Average Value Average Value Average DA* Value Average DA* Average DA*
15.5 7.9 31.1 93.1 7.7 1.115.6 7.9 31.1 93.8 7.7 1.015.6 8.0 31.1 94.5 7.8 0.615.5 8.0 31.1 94.6 7.8 0.615.5 8.0 31.1 94.7 7.8 0.815.5 8.0 31.1 94.7 7.8 0.716.4 8.0 31.0 101.5 8.2 0.116.4 8.0 30.9 101.4 8.2 0.116.3 8.0 31.0 101.3 8.2 0.116.3 8.0 31.0 101.4 8.2 0.116.2 8.0 31.0 102.8 8.4 0.116.2 8.0 31.0 102.8 8.4 0.116.4 7.9 30.3 88.5 7.2 3.416.4 7.9 30.3 87.4 7.1 3.416.4 7.9 30.3 90.0 7.3 3.616.4 7.9 30.3 88.9 7.2 3.616.4 7.9 30.3 88.9 7.2 3.616.4 7.9 30.3 89.0 7.3 3.5
Remarks: * DA: Depth-Averaged ** Calm: Small or no wave; Moderate: Between calm and rough; Rough : White capped or rougher
7
6
9
3
3.5
pH
88.0
7.3
89.0
94.7
8.0 31.0
101.58.0
7
7.3
4
57.8
6
0.6 5
0.8
7.8
Bottom
Surface
Middle
3
Depth (m)
4
3
93.5
94.6
1
6
4 16.2
16.2
16.2
Middle
Bottom
Middle
4
4
4
7
1
Middle
Bottom
Surface
6
1
Bottom
Surface 1
Bottom
Surface
15.6
15.5
Temperature (oC)
16.3
15.6
16.4
31.0
16.4 7.27.9
16.4
101.4
30.3
16.3
4
Surface
Middle
7
16.31
Depth (m) Temperature (oC)
Surface
Bottom 15.5
15.5
6
1
8.0
pH Salinity ppt
391.0
89.8
2.2 2.2 3
4
16.2 102.8 8.48.0 31.0
7.9
16.4 89.5
7 16.4 7.9 30.3
7.9 30.3
31.1
4
Suspended Solids (mg/L)Turbidity(NTU)
3
0.6
6
0.6
0.6 402/22/05 Cloudy Moderate 12:25
02/24/05 Cloudy Moderate 11:03
Cloudy Moderate 17:00
02/26/05 Fine Moderate 13:02
31.0
02/26/05 Fine Moderate 09:34
02/24/05 Cloudy Moderate 16:55
02/22/05
0.1
8.2 0.1
8.2 0.18.2
8.4 0.1
8.0 30.4
8.0 30.4
8.0 30.4
Salinity ppt
31.1
DO Saturation (%) Dissolved Oxygen (mg/L)
8.0 31.1
100.4
5
7.9 31.0
8.3101.4
8.2
7.9 31.0
7.9
0.8
1.5
2.8
1.1
7.6
7.8
8.3
8.2
Suspended Solids (mg/L)
4
3
0.7
3
3
Turbidity(NTU)
0.6
0.7
0.8
7.3
7.3
3.6
3.6
3.4
7.3
7.7
7.4
8.2
7.3
7.7
7.8
8.096.2
7.8
100.6
93.3
8.0
31.1
31.1 0.5
8.1
7.894.9
8.298.931.1
7.915.54Middle
7.9
DO Saturation (%) Dissolved Oxygen (mg/L)
Appendix C
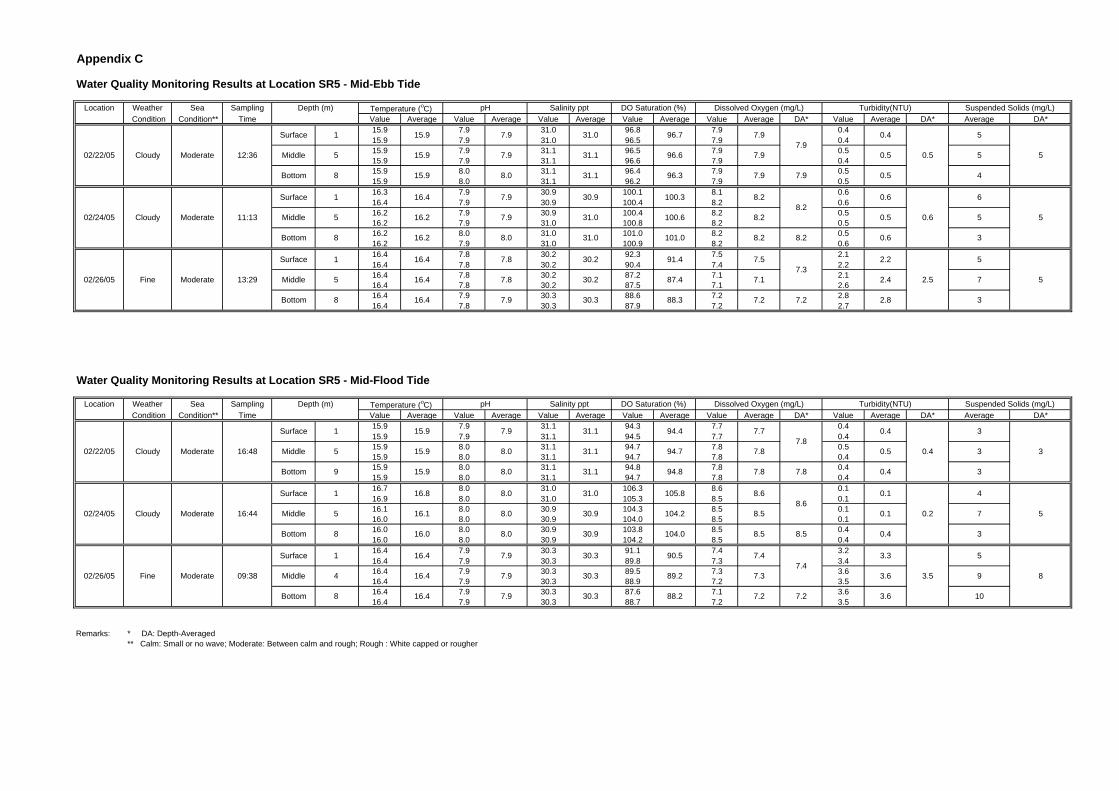
Water Quality Monitoring Results at Location SR5 - Mid-Ebb Tide
Location Weather Sea Sampling Condition Condition** Time Value Average Value Average Value Average Value Average Value Average DA* Value Average DA* Average DA*
15.9 7.9 31.0 96.8 7.9 0.415.9 7.9 31.0 96.5 7.9 0.415.9 7.9 31.1 96.5 7.9 0.515.9 7.9 31.1 96.6 7.9 0.415.9 8.0 31.1 96.4 7.9 0.515.9 8.0 31.1 96.2 7.9 0.516.3 7.9 30.9 100.1 8.1 0.616.4 7.9 30.9 100.4 8.2 0.616.2 7.9 30.9 100.4 8.2 0.516.2 7.9 31.0 100.8 8.2 0.516.2 8.0 31.0 101.0 8.2 0.516.2 7.9 31.0 100.9 8.2 0.616.4 7.8 30.2 92.3 7.5 2.116.4 7.8 30.2 90.4 7.4 2.216.4 7.8 30.2 87.2 7.1 2.116.4 7.8 30.2 87.5 7.1 2.616.4 7.9 30.3 88.6 7.2 2.816.4 7.8 30.3 87.9 7.2 2.7
Water Quality Monitoring Results at Location SR5 - Mid-Flood Tide
Location Weather Sea Sampling Condition Condition** Time Value Average Value Average Value Average Value Average Value Average DA* Value Average DA* Average DA*
15.9 7.9 31.1 94.3 7.7 0.415.9 7.9 31.1 94.5 7.7 0.415.9 8.0 31.1 94.7 7.8 0.515.9 8.0 31.1 94.7 7.8 0.415.9 8.0 31.1 94.8 7.8 0.415.9 8.0 31.1 94.7 7.8 0.416.7 8.0 31.0 106.3 8.6 0.116.9 8.0 31.0 105.3 8.5 0.116.1 8.0 30.9 104.3 8.5 0.116.0 8.0 30.9 104.0 8.5 0.116.0 8.0 30.9 103.8 8.5 0.416.0 8.0 30.9 104.2 8.5 0.416.4 7.9 30.3 91.1 7.4 3.216.4 7.9 30.3 89.8 7.3 3.416.4 7.9 30.3 89.5 7.3 3.616.4 7.9 30.3 88.9 7.2 3.516.4 7.9 30.3 87.6 7.1 3.616.4 7.9 30.3 88.7 7.2 3.5
Remarks: * DA: Depth-Averaged ** Calm: Small or no wave; Moderate: Between calm and rough; Rough : White capped or rougher
Dissolved Oxygen (mg/L)
Middle
7.9
DO Saturation (%)
31.0
7.915.957.9
7.996.3
7.996.7
91.4
8.0
31.1
31.1
7.996.6
7.9
100.6
7.4
7.2
3.6
3.6
3.3
Suspended Solids (mg/L)
5
6
0.6
3
5
Turbidity(NTU)
0.6
0.6
0.5
7.3
7.8
8.2
8.2
7.2
7.7
7.1
8.2
7.2
7.5
0.4
2.2
2.8
0.4
101.0
5
8.0 31.0
8.2100.3
8.2
7.9 30.9
7.9
Salinity ppt
31.1
DO Saturation (%) Dissolved Oxygen (mg/L)
7.8 30.2
7.9 30.3
7.8 30.2
0.2
8.6 0.1
8.5 0.18.6
8.5 0.4
31.0
02/26/05 Fine Moderate 09:38
02/24/05 Cloudy Moderate 16:44
02/22/05 Cloudy Moderate 16:48
02/26/05 Fine Moderate 13:29
02/24/05 Cloudy Moderate 11:13
02/22/05 Cloudy Moderate 12:36 5
Suspended Solids (mg/L)Turbidity(NTU)
5
0.5
4
0.4
0.5 5
0.5
16.4 89.2
8 16.4 7.9 30.3
7.9 30.3
8.58.0 30.9
7.9
31.1
8.0 31.1
7.88.0
pH Salinity ppt
587.4
88.3
2.4 2.5 7
3
16.41
Depth (m) Temperature (oC)
Surface
Bottom 15.9
15.9
8
1
5
Surface
Middle
8
31.0
16.4 7.47.9
16.8
104.2
30.3
16.1
16.0 104.0
15.9
15.9
Temperature (oC)
16.4
15.9
16.4
Surface
8
1
Bottom
Surface 1
Bottom
Surface
Middle
Bottom
Middle
4
5
5
9
1
Middle
Bottom
1
8
5 16.2
16.2
16.4
Bottom
Surface
Middle
5
Depth (m)
7
3
94.4
94.7
8
7.2
3
37.8
3
0.5 3
0.4
7.8
3.5
pH
90.5
7.3
88.2
94.8
8.0 30.9
105.88.0
5
9
10
4
Appendix C
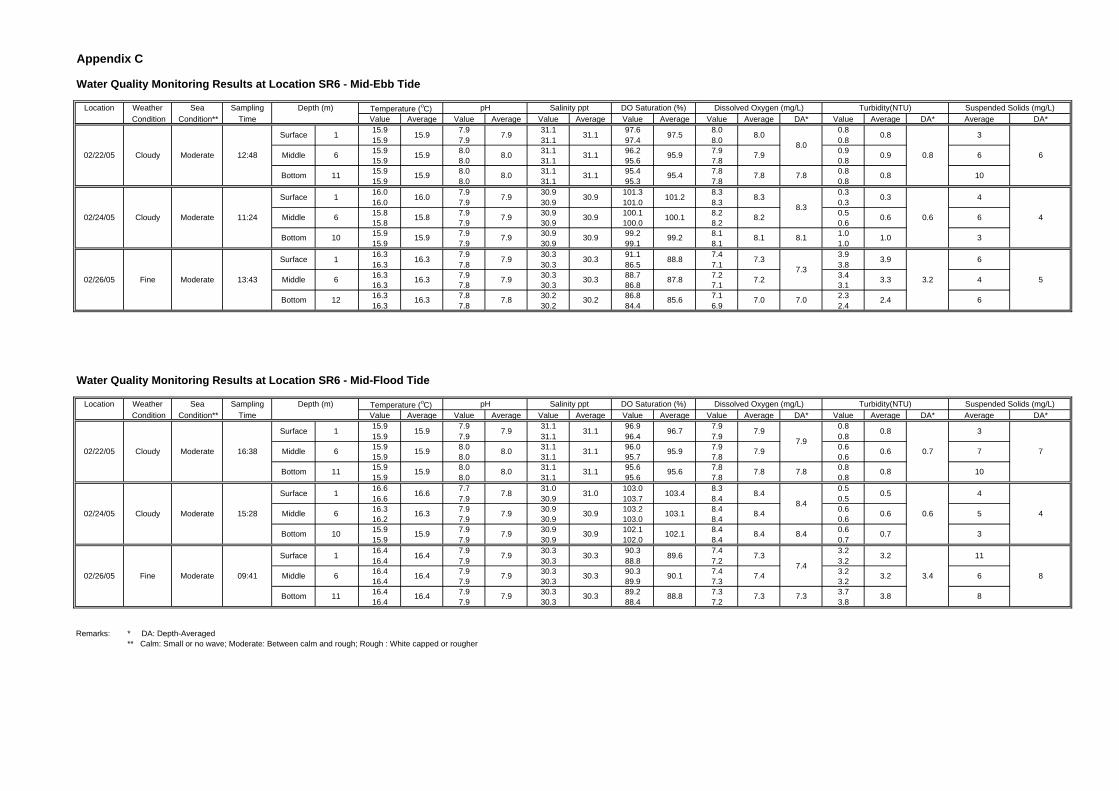
Water Quality Monitoring Results at Location SR6 - Mid-Ebb Tide
Location Weather Sea Sampling Condition Condition** Time Value Average Value Average Value Average Value Average Value Average DA* Value Average DA* Average DA*
15.9 7.9 31.1 97.6 8.0 0.815.9 7.9 31.1 97.4 8.0 0.815.9 8.0 31.1 96.2 7.9 0.915.9 8.0 31.1 95.6 7.8 0.815.9 8.0 31.1 95.4 7.8 0.815.9 8.0 31.1 95.3 7.8 0.816.0 7.9 30.9 101.3 8.3 0.316.0 7.9 30.9 101.0 8.3 0.315.8 7.9 30.9 100.1 8.2 0.515.8 7.9 30.9 100.0 8.2 0.615.9 7.9 30.9 99.2 8.1 1.015.9 7.9 30.9 99.1 8.1 1.016.3 7.9 30.3 91.1 7.4 3.916.3 7.8 30.3 86.5 7.1 3.816.3 7.9 30.3 88.7 7.2 3.416.3 7.8 30.3 86.8 7.1 3.116.3 7.8 30.2 86.8 7.1 2.316.3 7.8 30.2 84.4 6.9 2.4
Water Quality Monitoring Results at Location SR6 - Mid-Flood Tide
Location Weather Sea Sampling Condition Condition** Time Value Average Value Average Value Average Value Average Value Average DA* Value Average DA* Average DA*
15.9 7.9 31.1 96.9 7.9 0.815.9 7.9 31.1 96.4 7.9 0.815.9 8.0 31.1 96.0 7.9 0.615.9 8.0 31.1 95.7 7.8 0.615.9 8.0 31.1 95.6 7.8 0.815.9 8.0 31.1 95.6 7.8 0.816.6 7.7 31.0 103.0 8.3 0.516.6 7.9 30.9 103.7 8.4 0.516.3 7.9 30.9 103.2 8.4 0.616.2 7.9 30.9 103.0 8.4 0.615.9 7.9 30.9 102.1 8.4 0.615.9 7.9 30.9 102.0 8.4 0.716.4 7.9 30.3 90.3 7.4 3.216.4 7.9 30.3 88.8 7.2 3.216.4 7.9 30.3 90.3 7.4 3.216.4 7.9 30.3 89.9 7.3 3.216.4 7.9 30.3 89.2 7.3 3.716.4 7.9 30.3 88.4 7.2 3.8
Remarks: * DA: Depth-Averaged ** Calm: Small or no wave; Moderate: Between calm and rough; Rough : White capped or rougher
11
6
8
4
3.4
pH
89.6
7.4
88.8
95.6
7.9 30.9
103.47.8
8
7.3
3
77.9
10
0.6 7
0.8
7.9
Bottom
Surface
Middle
4
Depth (m)
5
3
96.7
95.9
1
10
6 15.8
15.9
16.0
Middle
Bottom
Middle
6
6
6
11
1
Middle
Bottom
Surface
10
1
Bottom
Surface 1
Bottom
Surface
15.9
15.9
Temperature (oC)
16.3
15.9
16.3
16.4 7.37.9
16.6
103.1
30.3
16.3
15.9 102.1
6
Surface
Middle
12
16.31
Depth (m) Temperature (oC)
Surface
Bottom 15.9
15.9
11
1
587.8
85.6
3.3 3.2 4
6
7.88.0
pH Salinity ppt
7.9 30.9
7.9
31.1
8.0 31.1
31.0
16.4 90.1
11 16.4 7.9 30.3
7.9 30.3
6
Suspended Solids (mg/L)Turbidity(NTU)
3
0.8
10
0.8
0.9 6
0.8
02/22/05 Cloudy Moderate 12:48
02/24/05 Cloudy Moderate 11:24
02/26/05 Fine Moderate 13:43
02/22/05 Cloudy Moderate 16:38
02/24/05 Cloudy Moderate 15:28
02/26/05 Fine Moderate 09:41
0.6
8.4 0.5
8.4 0.68.4
8.4 0.78.4
7.8 30.2
7.9 30.3
Salinity ppt
31.1
DO Saturation (%) Dissolved Oxygen (mg/L)
6
7.9 30.9
8.3101.2
8.1
7.9 30.9
7.9 30.9
0.7
3.9
2.4
0.8
7.3
7.8
8.3
8.2
7.0
7.9
7.2
8.1
7.0
7.3
Suspended Solids (mg/L)
4
4
0.6
3
6
Turbidity(NTU)
1.0
0.3
0.6
7.4
7.3
3.2
3.8
3.2
88.8
8.0
31.1
31.1
95.9
100.1
99.2
7.9 30.3
7.895.4
8.097.5
7.9
7.8
Dissolved Oxygen (mg/L)
Middle
7.9
DO Saturation (%)
31.1
8.015.968.0

Appendix C
Water Quality Monitoring Results at Location SR7 - Mid-Ebb Tide
Location Weather Sea Sampling Condition Condition** Time Value Average Value Average Value Average Value Average Value Average DA* Value Average DA* Average DA*
15.9 7.9 31.1 96.6 7.9 1.315.9 8.0 31.1 96.3 7.9 1.315.9 8.0 31.1 95.8 7.8 1.015.9 8.0 31.1 95.8 7.8 1.015.9 8.0 31.1 95.2 7.8 1.215.9 8.0 31.1 95.1 7.8 1.115.9 7.9 30.9 101.7 8.3 0.815.8 7.9 30.9 100.8 8.3 0.915.8 7.9 30.9 98.8 8.1 1.915.8 7.9 30.9 98.6 8.1 2.315.8 7.9 30.9 97.8 8.0 2.615.8 7.9 30.9 97.7 8.0 2.916.4 7.7 30.2 86.5 7.1 1.916.4 7.7 30.2 85.8 7.0 1.916.4 7.8 30.2 86.9 7.1 1.816.4 7.7 30.2 86.4 7.0 1.916.4 7.8 30.2 85.5 7.0 1.916.4 7.8 30.2 84.8 6.9 2.0
Water Quality Monitoring Results at Location SR7 - Mid-Flood Tide
Location Weather Sea Sampling Condition Condition** Time Value Average Value Average Value Average Value Average Value Average DA* Value Average DA* Average DA*
15.9 7.9 31.1 95.8 7.8 0.915.9 7.9 31.1 95.6 7.8 1.015.9 8.0 31.1 96.3 7.9 1.015.9 8.0 31.1 96.4 7.9 1.115.9 8.0 31.1 95.4 7.8 1.715.9 8.0 31.1 95.2 7.8 1.716.1 7.9 30.9 102.7 8.4 0.616.1 7.9 30.9 102.6 8.4 0.615.9 7.9 30.9 103.2 8.5 0.515.8 7.9 30.9 103.2 8.5 0.615.8 7.9 30.9 100.7 8.3 0.815.8 7.9 30.9 100.4 8.2 0.916.4 7.9 30.3 90.1 7.3 3.016.4 7.9 30.3 87.9 7.2 3.116.4 7.9 30.3 89.7 7.3 3.216.4 7.9 30.3 89.4 7.3 3.216.4 7.9 30.3 87.6 7.1 3.216.4 7.9 30.3 88.3 7.2 3.3
Remarks: * DA: Depth-Averaged ** Calm: Small or no wave; Moderate: Between calm and rough; Rough : White capped or rougher
Dissolved Oxygen (mg/L)
Middle
8.0
DO Saturation (%)
31.1
8.015.9127.9
7.895.2
7.996.5
86.2
8.0
31.1
31.1
7.895.8
7.8
98.7
7.3
7.2
3.2
3.3
3.1
Suspended Solids (mg/L)
6
6
1.9
8
9
Turbidity(NTU)
2.8
0.9
2.1
7.1
7.8
8.3
8.1
7.0
7.8
7.1
8.0
7.0
7.1
1.3
1.9
2.0
1.0
97.8
6
7.9 30.9
8.2101.3
8.0
7.9 30.9
7.9
Salinity ppt
31.1
DO Saturation (%) Dissolved Oxygen (mg/L)
7.7 30.2
7.8 30.2
7.8 30.2
0.7
8.4 0.6
8.5 0.68.5
8.3 0.9
30.9
02/26/05 Fine Moderate 09:44
02/24/05 Cloudy Moderate 15:41
02/22/05 Cloudy Moderate 16:26
02/26/05 Fine Moderate 13:59
02/24/05 Cloudy Moderate 11:35
02/22/05 Cloudy Moderate 12:58 6
Suspended Solids (mg/L)Turbidity(NTU)
5
1.2
6
1.3
1.0 7
1.2
16.4 89.6
22 16.4 7.9 30.3
7.9 30.3
8.37.9 30.9
7.9
31.1
8.0 31.1
7.88.0
pH Salinity ppt
786.7
85.2
1.9 1.9 5
6
16.41
Depth (m) Temperature (oC)
Surface
Bottom 15.9
15.9
22
1
12
Surface
Middle
22
30.9
16.4 7.37.9
16.1
103.2
30.3
15.9
15.8 100.6
15.9
15.9
Temperature (oC)
16.4
15.9
16.4
Surface
21
1
Bottom
Surface 1
Bottom
Surface
Middle
Bottom
Middle
12
11
12
22
1
Middle
Bottom
1
22
12 15.8
15.8
15.9
Bottom
Surface
Middle
4
Depth (m)
4
5
95.7
96.4
7
7.2
4
47.9
5
1.1 4
1.7
7.9
3.2
pH
89.0
7.3
88.0
95.3
7.9 30.9
102.77.9
4
7
10
4
Title Scale Project
N.T.S No. MA4017Date Appendix
Feb 05 C
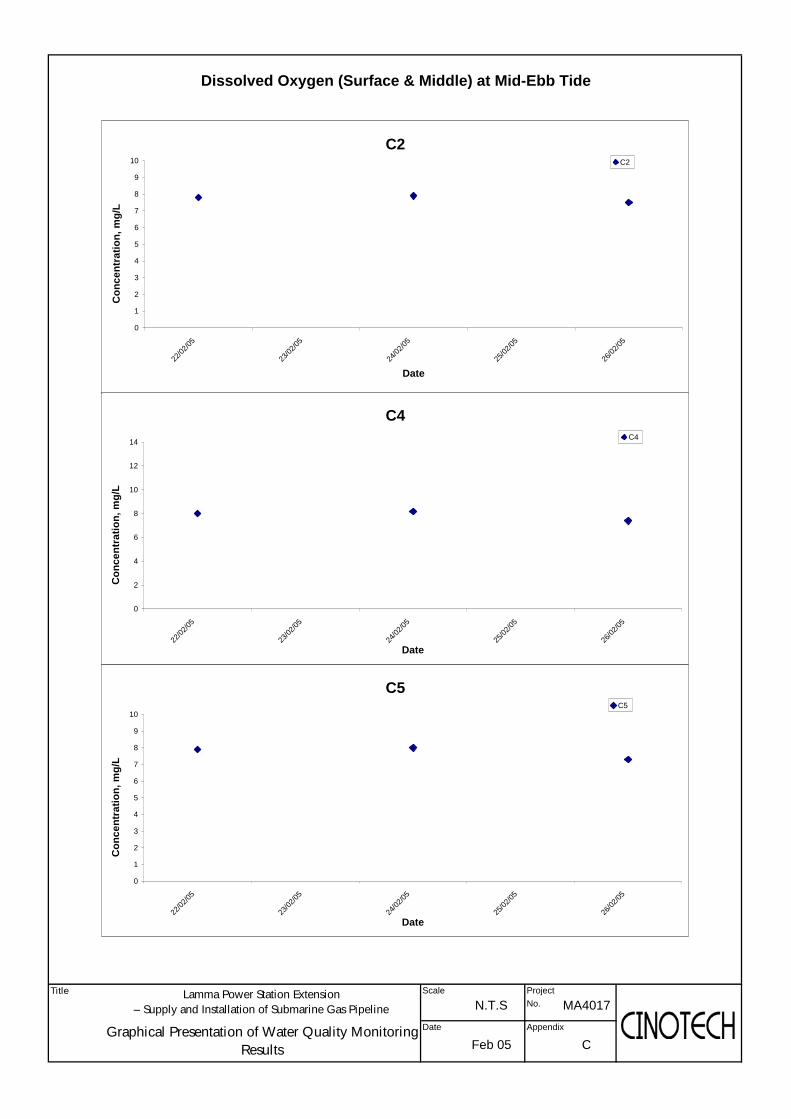
Dissolved Oxygen (Surface & Middle) at Mid-Ebb Tide
Graphical Presentation of Water Quality MonitoringResults
Lamma Power Station Extension– Supply and Installation of Submarine Gas Pipeline
C5
0
1
2
3
4
5
6
7
8
9
10
22/02
/05
23/02
/05
24/02
/05
25/02
/05
26/02
/05
Date
Con
cent
ratio
n, m
g/L
C5
C2
0
1
2
3
4
5
6
7
8
9
10
22/02
/05
23/02
/05
24/02
/05
25/02
/05
26/02
/05
Date
Con
cent
ratio
n, m
g/L
C2
C4
0
2
4
6
8
10
12
14
22/02
/05
23/02
/05
24/02
/05
25/02
/05
26/02
/05
Date
Con
cent
ratio
n, m
g/L
C4

Title Scale Project
N.T.S No. MA4017Date Appendix
Feb 05 C
Dissolved Oxygen (Surface & Middle) at Mid-Ebb Tide
Graphical Presentation of Water Quality MonitoringResults
Lamma Power Station Extension– Supply and Installation of Submarine Gas Pipeline
SR1
0
1
2
3
4
5
6
7
8
9
10
22/02
/05
23/02
/05
24/02
/05
25/02
/05
26/02
/05
Date
Con
cent
ratio
n, m
g/L
SR1
SR2
0
1
2
3
4
5
6
7
8
9
10
22/02
/05
23/02
/05
24/02
/05
25/02
/05
26/02
/05
Date
Con
cent
ratio
n, m
g/L
SR2
SR3
0
1
2
3
4
5
6
7
8
9
10
22/02
/05
23/02
/05
24/02
/05
25/02
/05
26/02
/05
Date
Con
cent
ratio
n, m
g/L
SR3

Title Scale Project
N.T.S No. MA4017Date Appendix
Feb 05 C
Dissolved Oxygen (Surface & Middle) at Mid-Ebb Tide
Graphical Presentation of Water Quality MonitoringResults
Lamma Power Station Extension– Supply and Installation of Submarine Gas Pipeline
SR4
0
1
2
3
4
5
6
7
8
9
10
22/02
/05
23/02
/05
24/02
/05
25/02
/05
26/02
/05
Date
Con
cent
ratio
n, m
g/L
SR4
SR5
0
1
2
3
4
5
6
7
8
9
10
22/02
/05
23/02
/05
24/02
/05
25/02
/05
26/02
/05
Date
Con
cent
ratio
n, m
g/L
SR5
SR6
0
1
2
3
4
5
6
7
8
9
10
22/02
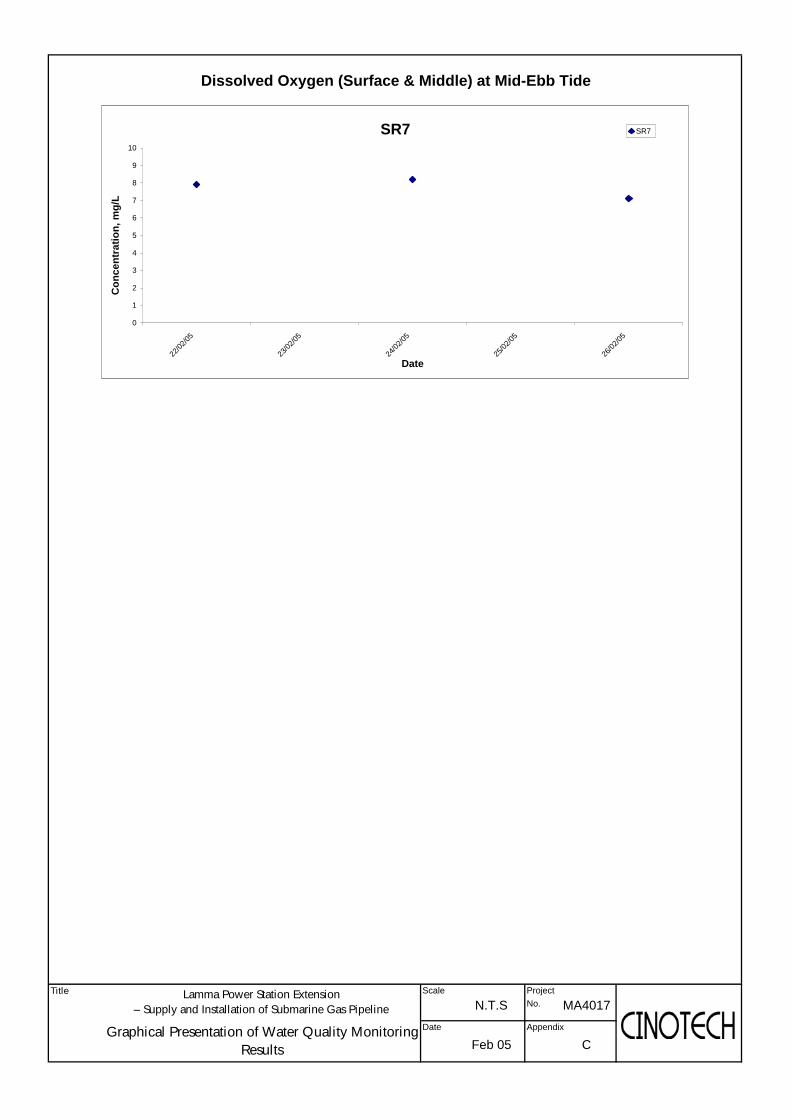
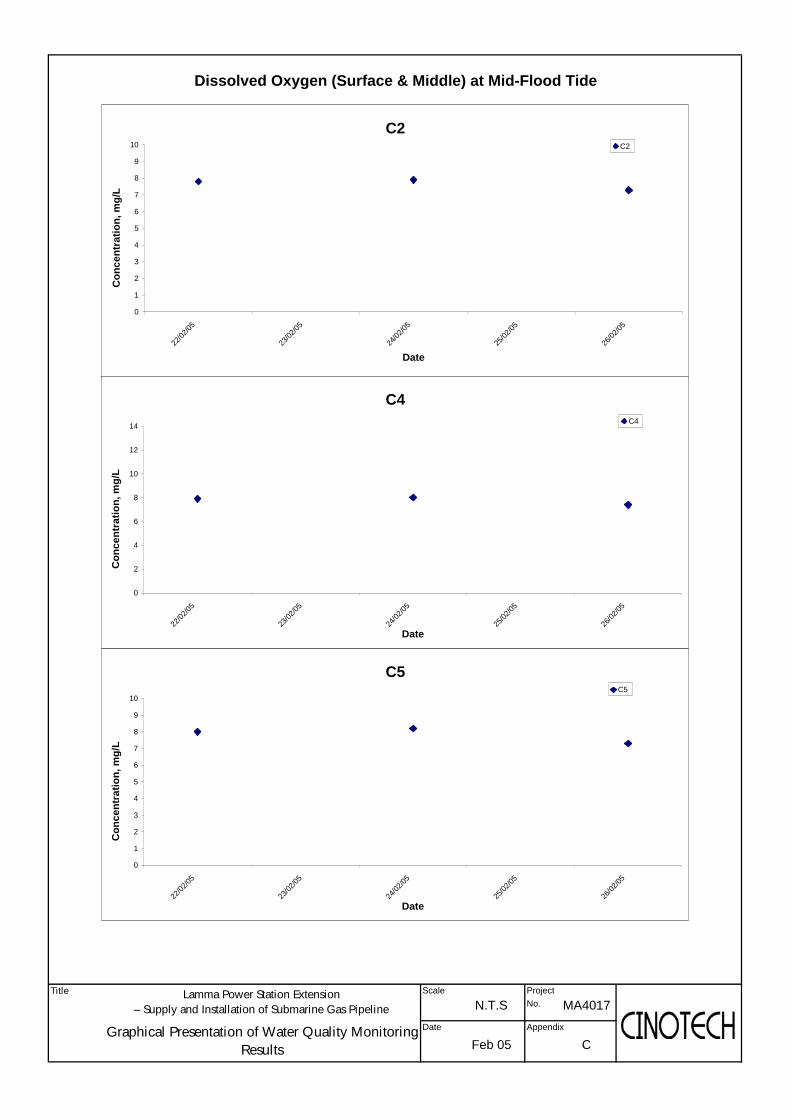
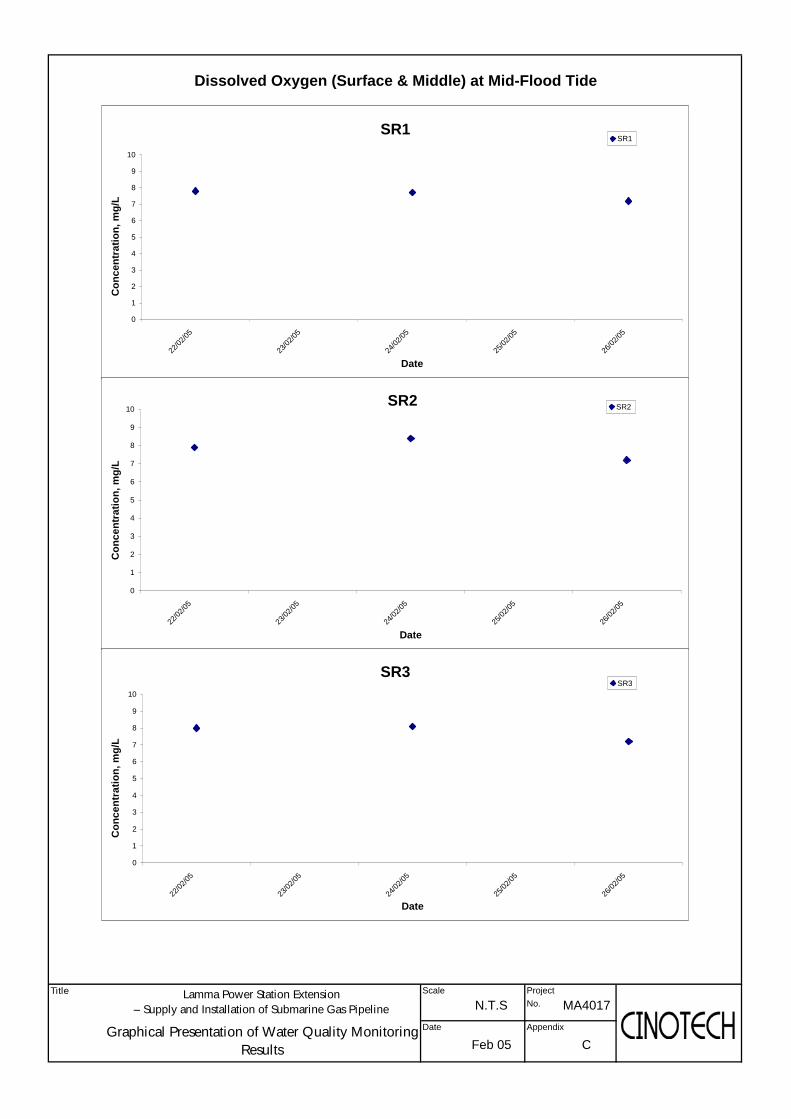
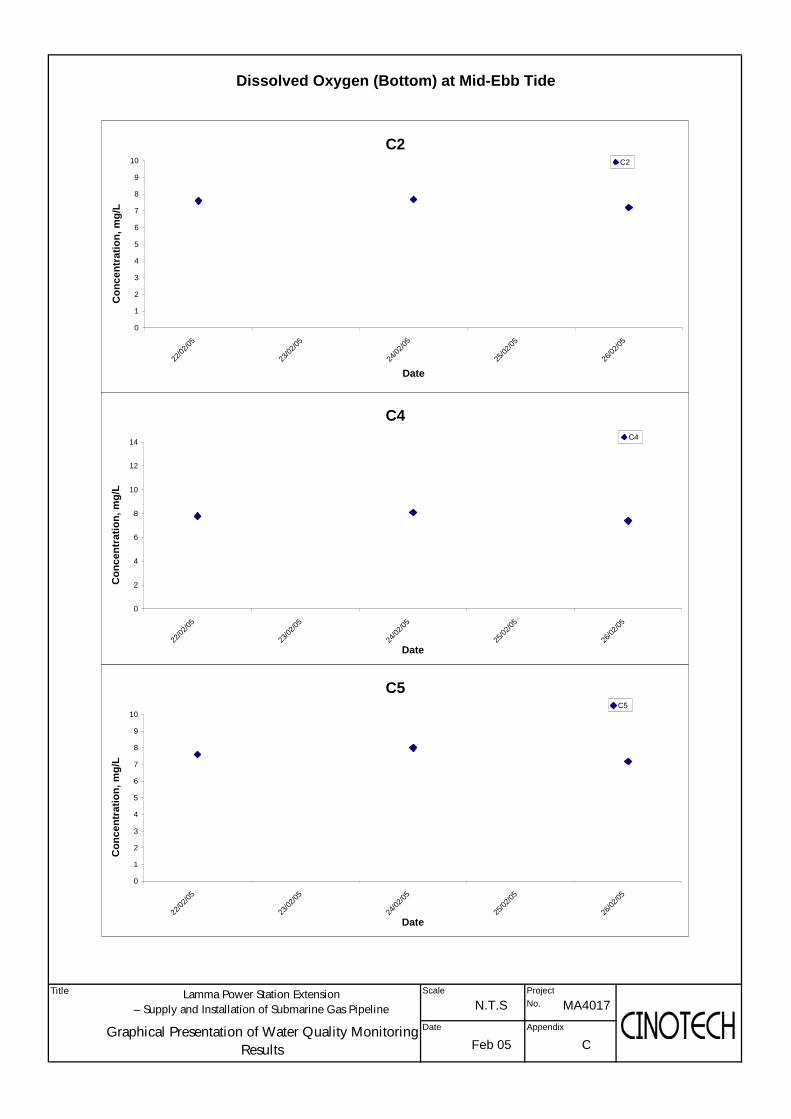
/05
23/02
/05
24/02
/05
25/02
/05
26/02
/05
Date
Con
cent
ratio
n, m
g/L
SR6
Title Scale Project
N.T.S No. MA4017Date Appendix
Feb 05 C
Lamma Power Station Extension– Supply and Installation of Submarine Gas Pipeline
Dissolved Oxygen (Surface & Middle) at Mid-Ebb Tide
Graphical Presentation of Water Quality MonitoringResults
SR7
0
1
2
3
4
5
6
7
8
9
10
22/02
/05
23/02
/05
24/02
/05
25/02
/05
26/02
/05
Date
Con
cent
ratio
n, m
g/L
SR7
Title Scale Project
N.T.S No. MA4017Date Appendix
Feb 05 C
Dissolved Oxygen (Surface & Middle) at Mid-Flood Tide
Graphical Presentation of Water Quality MonitoringResults
Lamma Power Station Extension– Supply and Installation of Submarine Gas Pipeline
C5
0
1
2
3
4
5
6
7
8
9
10
22/02
/05
23/02
/05
24/02
/05
25/02
/05
26/02
/05
Date
Con
cent
ratio
n, m
g/L
C5
C2
0
1
2
3
4
5
6
7
8
9
10
22/02
/05
23/02
/05
24/02
/05
25/02
/05
26/02
/05
Date
Con
cent
ratio
n, m
g/L
C2
C4
0
2
4
6
8
10
12
14
22/02
/05
23/02
/05
24/02
/05
25/02
/05
26/02
/05
Date
Con
cent
ratio
n, m
g/L
C4
Title Scale Project
N.T.S No. MA4017Date Appendix
Feb 05 C
Lamma Power Station Extension– Supply and Installation of Submarine Gas Pipeline
Dissolved Oxygen (Surface & Middle) at Mid-Flood Tide
Graphical Presentation of Water Quality MonitoringResults
SR1
0
1
2
3
4
5
6
7
8
9
10
22/02
/05
23/02
/05
24/02
/05
25/02
/05
26/02
/05
Date
Con
cent
ratio
n, m
g/L
SR1
SR2
0
1
2
3
4
5
6
7
8
9
10
22/02
/05
23/02
/05
24/02
/05
25/02
/05
26/02
/05
Date
Con
cent
ratio
n, m
g/L
SR2
SR3
0
1
2
3
4
5
6
7
8
9
10
22/02
/05
23/02
/05
24/02
/05
25/02
/05
26/02
/05
Date
Con
cent
ratio
n, m
g/L
SR3

Title Scale Project
N.T.S No. MA4017Date Appendix
Feb 05 C
Dissolved Oxygen (Surface & Middle) at Mid-Flood Tide
Lamma Power Station Extension– Supply and Installation of Submarine Gas Pipeline
Graphical Presentation of Water Quality MonitoringResults
SR5
0
1
2
3
4
5
6
7
8
9
10
22/02
/05
23/02
/05
24/02
/05
25/02
/05
26/02
/05
Date
Con
cent
ratio
n, m
g/L
SR5
SR6
0
1
2
3
4
5
6
7
8
9
10
22/02
/05
23/02
/05
24/02
/05
25/02
/05
26/02
/05
Date
Con
cent
ratio
n, m
g/L
SR6
SR4
0
1
2
3
4
5
6
7
8
9
10
22/02
/05
23/02
/05
24/02
/05
25/02
/05
26/02
/05
Date
Con
cent
ratio
n, m
g/L
SR4

Title Scale Project
N.T.S No. MA4017Date Appendix
Feb 05 C
Lamma Power Station Extension– Supply and Installation of Submarine Gas Pipeline
Graphical Presentation of Water Quality MonitoringResults
Dissolved Oxygen (Surface & Middle) at Mid-Flood Tide
SR7
0
1
2
3
4
5
6
7
8
9
10
22/02
/05
23/02
/05
24/02
/05
25/02
/05
26/02
/05
Date
Con
cent
ratio
n, m
g/L
SR7
Title Scale Project
N.T.S No. MA4017Date Appendix
Feb 05 C
Dissolved Oxygen (Bottom) at Mid-Ebb Tide
Graphical Presentation of Water Quality MonitoringResults
Lamma Power Station Extension– Supply and Installation of Submarine Gas Pipeline
C5
0
1
2
3
4
5
6
7
8
9
10
22/02
/05
23/02
/05
24/02
/05
25/02
/05
26/02
/05
Date
Con
cent
ratio
n, m
g/L
C5
C2
0
1
2
3
4
5
6
7
8
9
10
22/02
/05
23/02
/05
24/02
/05
25/02
/05
26/02
/05
Date
Con
cent
ratio
n, m
g/L
C2
C4
0
2
4
6
8
10
12
14
22/02
/05
23/02
/05
24/02
/05
25/02
/05
26/02
/05
Date
Con
cent
ratio
n, m
g/L
C4

Title Scale Project
N.T.S No. MA4017Date Appendix
Feb 05 C
Dissolved Oxygen (Bottom) at Mid-Ebb Tide
Graphical Presentation of Water Quality MonitoringResults
Lamma Power Station Extension– Supply and Installation of Submarine Gas Pipeline
SR1
0
1
2
3
4
5
6
7
8
9
10
22/02
/05
23/02
/05
24/02
/05
25/02
/05
26/02
/05
Date
Con
cent
ratio
n, m
g/L
SR1
SR2
0
1
2
3
4
5
6
7
8
9
10
22/02
/05
23/02
/05
24/02
/05
25/02
/05
26/02
/05
Date
Con
cent
ratio
n, m
g/L
SR2
SR3
0
1
2
3
4
5
6
7
8
9
10
22/02
/05
23/02
/05
24/02
/05
25/02
/05
26/02
/05
Date
Con
cent
ratio
n, m
g/L
SR3

Title Scale Project
N.T.S No. MA4017Date Appendix
Feb 05 C
Dissolved Oxygen (Bottom) at Mid-Ebb Tide
Graphical Presentation of Water Quality MonitoringResults
Lamma Power Station Extension– Supply and Installation of Submarine Gas Pipeline
SR4
0
1
2
3
4
5
6
7
8
9
10
22/02
/05
23/02
/05
24/02
/05
25/02
/05
26/02
/05
Date
Con
cent
ratio
n, m
g/L
SR4
SR5
0
1
2
3
4
5
6
7
8
9
10
22/02
/05
23/02
/05
24/02
/05
25/02
/05
26/02
/05
Date
Con
cent
ratio
n, m
g/L
SR5
SR6
0
1
2
3
4
5
6
7
8
9
10
22/02
/05
23/02
/05
24/02
/05
25/02
/05
26/02
/05
Date
Con
cent
ratio
n, m
g/L
SR6
Title Scale Project
N.T.S No. MA4017Date Appendix
Feb 05 CGraphical Presentation of Water Quality Monitoring
Results
Lamma Power Station Extension– Supply and Installation of Submarine Gas Pipeline
Dissolved Oxygen (Bottom) at Mid-Ebb Tide
SR7
0
1
2
3
4
5
6
7
8
9
10
22/02
/05
23/02
/05
24/02
/05
25/02
/05
26/02
/05
Date
Con
cent
ratio
n, m
g/L
SR7
Title Scale Project
N.T.S No. MA4017Date Appendix
Feb 05 C
Dissolved Oxygen (Bottom) at Mid-Flood Tide
Graphical Presentation of Water Quality MonitoringResults
Lamma Power Station Extension– Supply and Installation of Submarine Gas Pipeline
C5
0
1
2
3
4
5
6
7
8
9
10
22/02
/05
23/02
/05
24/02
/05
25/02
/05
26/02
/05
Date
Con
cent
ratio
n, m
g/L
C5
C2
0
1
2
3
4
5
6
7
8
9
10
22/02
/05
23/02
/05
24/02
/05
25/02
/05
26/02
/05
Date
Con
cent
ratio
n, m
g/L
C2
C4
0
2
4
6
8
10
12
14
22/02
/05
23/02
/05
24/02
/05
25/02
/05
26/02
/05
Date
Con
cent
ratio
n, m
g/L
C4
Title Scale Project
N.T.S No. MA4017Date Appendix
Feb 05 C
Lamma Power Station Extension– Supply and Installation of Submarine Gas Pipeline
Dissolved Oxygen (Bottom) at Mid-Flood Tide
Graphical Presentation of Water Quality MonitoringResults
SR1
0
1
2
3
4
5
6
7
8
9
10
22/02
/05
23/02
/05
24/02
/05
25/02
/05
26/02
/05
Date
Con
cent
ratio
n, m
g/L
SR1
SR2
0
1
2
3
4
5
6
7
8
9
10
22/02
/05
23/02
/05
24/02
/05
25/02
/05
26/02
/05
Date
Con
cent
ratio
n, m
g/L
SR2
SR3
0
1
2
3
4
5
6
7
8
9
10
22/02
/05
23/02
/05
24/02
/05
25/02
/05
26/02
/05
Date
Con
cent
ratio
n, m
g/L
SR3
Title Scale Project
N.T.S No. MA4017Date Appendix
Feb 05 C
Dissolved Oxygen (Bottom) at Mid-Flood Tide
Lamma Power Station Extension– Supply and Installation of Submarine Gas Pipeline
Graphical Presentation of Water Quality MonitoringResults
SR5
0
1
2
3
4
5
6
7
8
9
10
22/02
/05
23/02
/05
24/02
/05
25/02
/05
26/02
/05
Date
Con
cent
ratio
n, m
g/L
SR5
SR6
0
1
2
3
4
5
6
7
8
9
10
22/02
/05
23/02
/05
24/02
/05
25/02
/05
26/02
/05
Date
Con
cent
ratio
n, m
g/L
SR6
SR4
0
1
2
3
4
5
6
7
8
9
10
22/02
/05
23/02
/05
24/02
/05
25/02
/05
26/02
/05
Date
Con
cent
ratio
n, m
g/L
SR4

Title Scale Project
N.T.S No. MA4017Date Appendix
Feb 05 C
Lamma Power Station Extension– Supply and Installation of Submarine Gas Pipeline
Graphical Presentation of Water Quality MonitoringResults
Dissolved Oxygen (Bottom) at Mid-Flood Tide
SR7
0
1
2
3
4
5
6
7
8
9
10
22/02
/05
23/02
/05
24/02
/05
25/02
/05
26/02
/05
Date
Con
cent
ratio
n, m
g/L
SR7
Title Scale Project
N.T.S No. MA4017Date Appendix
Feb 05 C
Turbidity at Mid-Ebb Tide
Graphical Presentation of Water Quality MonitoringResults
Lamma Power Station Extension– Supply and Installation of Submarine Gas Pipeline
C5
0
1
2
3
4
5
6
7
8
9
10
22/02
/05
23/02
/05
24/02
/05
25/02
/05
26/02
/05
Date
Con
cent
ratio
n, N
TU
C5
C2
0
1
2
3
4
5
6
7
8
9
10
22/02
/05
23/02
/05
24/02
/05
25/02
/05
26/02
/05
Date
Con
cent
ratio
n, N
TU
C2
C4
0
2
4
6
8
10
12
14
22/02
/05
23/02
/05
24/02
/05
25/02
/05
26/02
/05
Date
Con
cent
ratio
n, N
TU
C4
Title Scale Project
N.T.S No. MA4017Date Appendix
Feb 05 C
Turbidity at Mid-Ebb Tide
Graphical Presentation of Water Quality MonitoringResults
Lamma Power Station Extension– Supply and Installation of Submarine Gas Pipeline
SR1
0
1
2
3
4
5
6
7
8
9
10
22/02
/05
23/02
/05
24/02
/05
25/02
/05
26/02
/05
Date
Con
cent
ratio
n, N
TU
SR1
SR2
0
1
2
3
4
5
6
7
8
9
10
22/02
/05
23/02
/05
24/02
/05
25/02
/05
26/02
/05
Date
Con
cent
ratio
n, N
TU
SR2
SR3
0
1
2
3
4
5
6
7
8
9
10
22/02
/05
23/02
/05
24/02
/05
25/02
/05
26/02
/05
Date
Con
cent
ratio
n, N
TU
SR3
Title Scale Project
N.T.S No. MA4017Date Appendix
Feb 05 C
Turbidity at Mid-Ebb Tide
Graphical Presentation of Water Quality MonitoringResults
Lamma Power Station Extension– Supply and Installation of Submarine Gas Pipeline
SR4
0
1
2
3
4
5
6
7
8
9
10
22/02
/05
23/02
/05
24/02
/05
25/02
/05
26/02
/05
Date
Con
cent
ratio
n, N
TU
SR4
SR5
0
1
2
3
4
5
6
7
8
9
10
22/02
/05
23/02
/05
24/02
/05
25/02
/05
26/02
/05
Date
Con
cent
ratio
n, N
TU
SR5
SR6
0
1
2
3
4
5
6
7
8
9
10
22/02
/05
23/02
/05
24/02
/05
25/02
/05
26/02
/05
Date
Con
cent
ratio
n, N
TU
SR6

Title Scale Project
N.T.S No. MA4017Date Appendix
Feb 05 CGraphical Presentation of Water Quality Monitoring
Results
Lamma Power Station Extension– Supply and Installation of Submarine Gas Pipeline
Turbidity at Mid-Ebb Tide
SR7
0
1
2
3
4
5
6
7
8
9
10
22/02
/05
23/02
/05
24/02
/05
25/02
/05
26/02
/05
Date
Con
cent
ratio
n, N
TUSR7

Title Scale Project
N.T.S No. MA4017Date Appendix
Feb 05 C
Turbidity at Mid-Flood Tide
Graphical Presentation of Water Quality MonitoringResults
Lamma Power Station Extension– Supply and Installation of Submarine Gas Pipeline
C5
0
1
2
3
4
5
6
7
8
9
10
22/02
/05
23/02
/05
24/02
/05
25/02
/05
26/02
/05
Date
Con
cent
ratio
n, N
TU
C5
C2
0
1
2
3
4
5
6
7
8
9
10
22/02
/05
23/02
/05
24/02
/05
25/02
/05
26/02
/05
Date
Con
cent
ratio
n, N
TU
C2
C4
0
2
4
6
8
10
12
14
22/02
/05
23/02
/05
24/02
/05
25/02
/05
26/02
/05
Date
Con
cent
ratio
n, N
TU
C4

Title Scale Project
N.T.S No. MA4017Date Appendix
Feb 05 C
Lamma Power Station Extension– Supply and Installation of Submarine Gas Pipeline
Turbidity at Mid-Flood Tide
Graphical Presentation of Water Quality MonitoringResults
SR1
0
1
2
3
4
5
6
7
8
9
10
22/02
/05
23/02
/05
24/02
/05
25/02
/05
26/02
/05
Date
Con
cent
ratio
n, N
TU
SR1
SR2
0
1
2
3
4
5
6
7
8
9
10
22/02
/05
23/02
/05
24/02
/05
25/02
/05
26/02
/05
Date
Con
cent
ratio
n, N
TU
SR2
SR3
0
1
2
3
4
5
6
7
8
9
10
22/02
/05
23/02
/05
24/02
/05
25/02
/05
26/02
/05
Date
Con
cent
ratio
n, N
TU
SR3
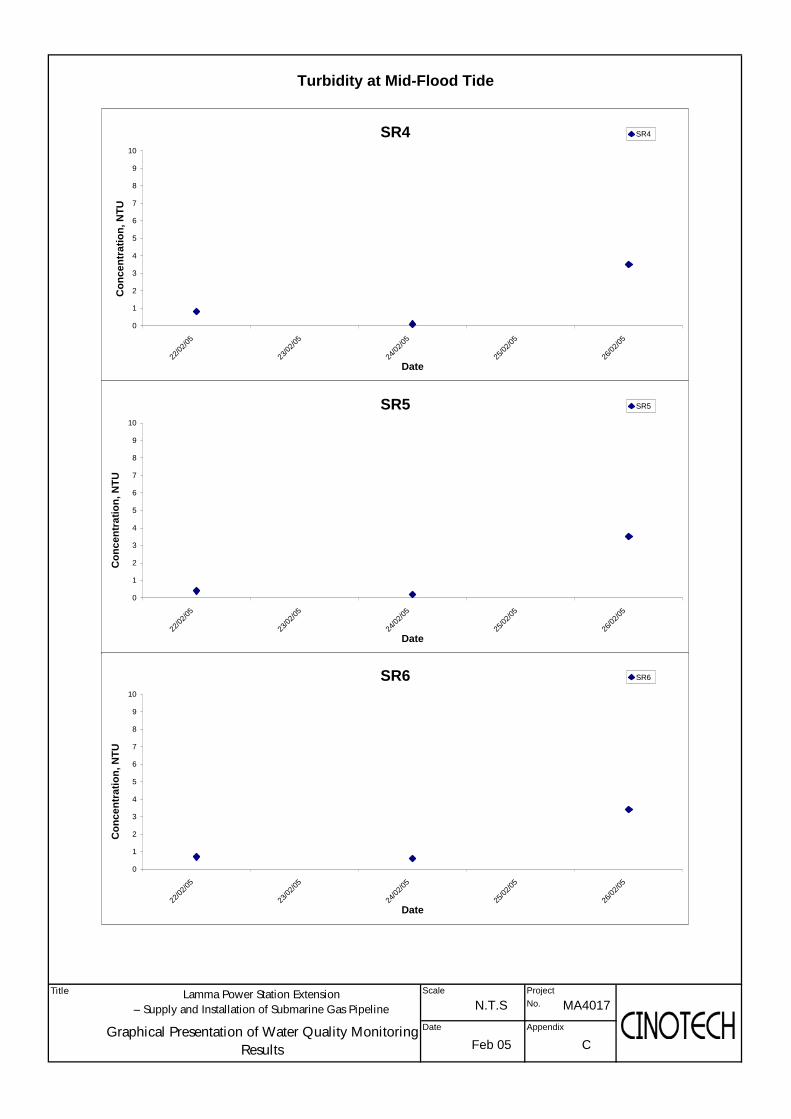
Title Scale Project
N.T.S No. MA4017Date Appendix
Feb 05 C
Turbidity at Mid-Flood Tide
Lamma Power Station Extension– Supply and Installation of Submarine Gas Pipeline
Graphical Presentation of Water Quality MonitoringResults
SR5
0
1
2
3
4
5
6
7
8
9
10
22/02
/05
23/02
/05
24/02
/05
25/02
/05
26/02
/05
Date
Con
cent
ratio
n, N
TU
SR5
SR6
0
1
2
3
4
5
6
7
8
9
10
22/02
/05
23/02
/05
24/02
/05
25/02
/05
26/02
/05
Date
Con
cent
ratio
n, N
TU
SR6
SR4
0
1
2
3
4
5
6
7
8
9
10
22/02
/05
23/02
/05
24/02
/05
25/02
/05
26/02
/05
Date
Con
cent
ratio
n, N
TUSR4

Title Scale Project
N.T.S No. MA4017Date Appendix
Feb 05 C
Lamma Power Station Extension– Supply and Installation of Submarine Gas Pipeline
Graphical Presentation of Water Quality MonitoringResults
Turbidity at Mid-Flood Tide
SR7
0
1
2
3
4
5
6
7
8
9
10
22/02
/05
23/02
/05
24/02
/05
25/02
/05
26/02
/05
Date
Con
cent
ratio
n, N
TUSR7
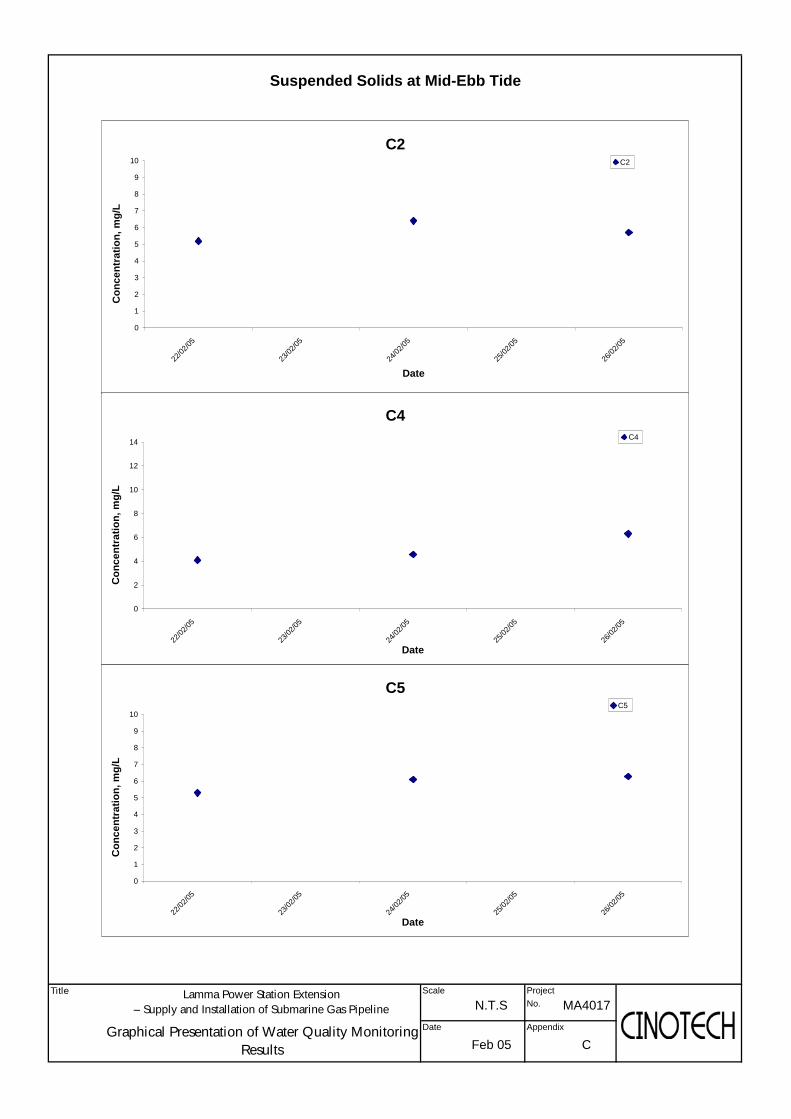
Title Scale Project
N.T.S No. MA4017Date Appendix
Feb 05 C
Suspended Solids at Mid-Ebb Tide
Graphical Presentation of Water Quality MonitoringResults
Lamma Power Station Extension– Supply and Installation of Submarine Gas Pipeline
C5
0
1
2
3
4
5
6
7
8
9
10
22/02
/05
23/02
/05
24/02
/05
25/02
/05
26/02
/05
Date
Con
cent
ratio
n, m
g/L
C5
C2
0
1
2
3
4
5
6
7
8
9
10
22/02
/05
23/02
/05
24/02
/05
25/02
/05
26/02
/05
Date
Con
cent
ratio
n, m
g/L
C2
C4
0
2
4
6
8
10
12
14
22/02
/05
23/02
/05
24/02
/05
25/02
/05
26/02
/05
Date
Con
cent
ratio
n, m
g/L
C4
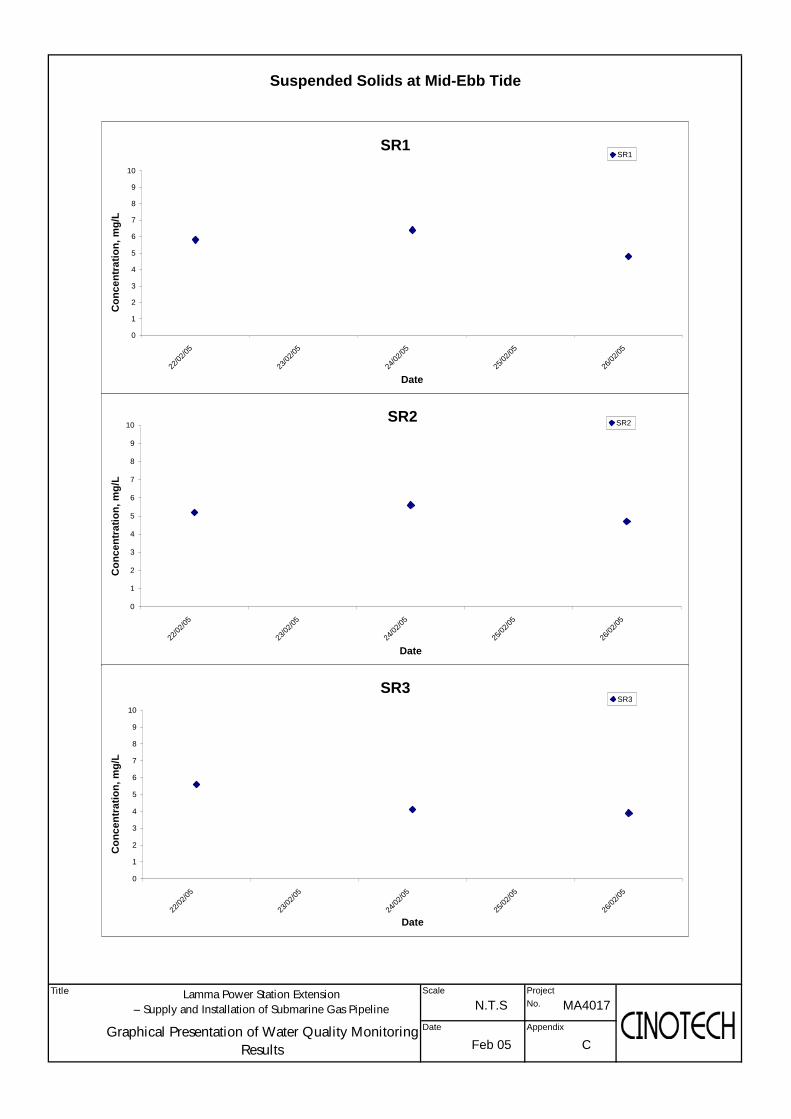
Title Scale Project
N.T.S No. MA4017Date Appendix
Feb 05 C
Suspended Solids at Mid-Ebb Tide
Graphical Presentation of Water Quality MonitoringResults
Lamma Power Station Extension– Supply and Installation of Submarine Gas Pipeline
SR1
0
1
2
3
4
5
6
7
8
9
10
22/02
/05
23/02
/05
24/02
/05
25/02
/05
26/02
/05
Date
Con
cent
ratio
n, m
g/L
SR1
SR2
0
1
2
3
4
5
6
7
8
9
10
22/02
/05
23/02
/05
24/02
/05
25/02
/05
26/02
/05
Date
Con
cent
ratio
n, m
g/L
SR2
SR3
0
1
2
3
4
5
6
7
8
9
10
22/02
/05
23/02
/05
24/02
/05
25/02
/05
26/02
/05
Date
Con
cent
ratio
n, m
g/L
SR3

Title Scale Project
N.T.S No. MA4017Date Appendix
Feb 05 C
Suspended Solids at Mid-Ebb Tide
Graphical Presentation of Water Quality MonitoringResults
Lamma Power Station Extension– Supply and Installation of Submarine Gas Pipeline
SR4
0
1
2
3
4
5
6
7
8
9
10
22/02
/05
23/02
/05
24/02
/05
25/02
/05
26/02
/05
Date
Con
cent
ratio
n, m
g/L
SR4
SR5
0
1
2
3
4
5
6
7
8
9
10
22/02
/05
23/02
/05
24/02
/05
25/02
/05
26/02
/05
Date
Con
cent
ratio
n, m
g/L
SR5
SR6
0
1
2
3
4
5
6
7
8
9
10
22/02
/05
23/02
/05
24/02
/05
25/02
/05
26/02
/05
Date
Con
cent
ratio
n, m
g/L
SR6

Title Scale Project
N.T.S No. MA4017Date Appendix
Feb 05 C
Lamma Power Station Extension– Supply and Installation of Submarine Gas Pipeline
Suspended Solids at Mid-Ebb Tide
Graphical Presentation of Water Quality MonitoringResults
SR7
0
1
2
3
4
5
6
7
8
9
10
22/02
/05
23/02
/05
24/02
/05
25/02
/05
26/02
/05
Date
Con
cent
ratio
n, m
g/L
SR7
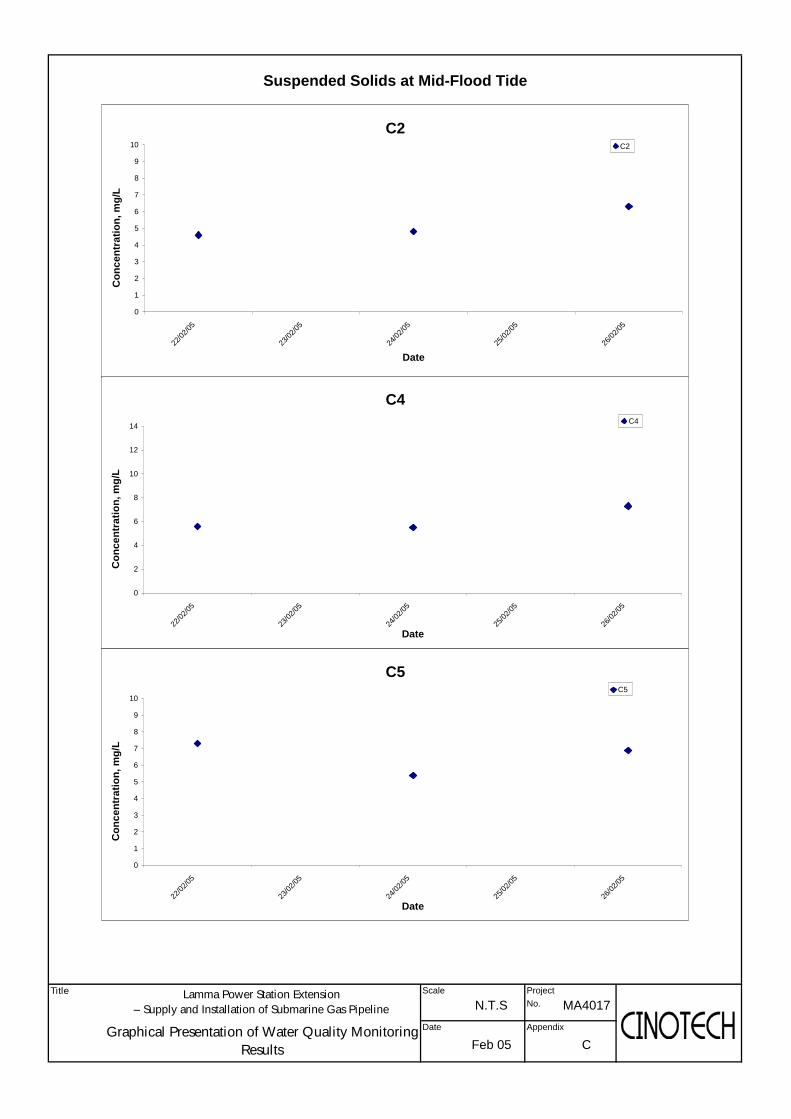
Title Scale Project
N.T.S No. MA4017Date Appendix
Feb 05 C
Suspended Solids at Mid-Flood Tide
Graphical Presentation of Water Quality MonitoringResults
Lamma Power Station Extension– Supply and Installation of Submarine Gas Pipeline
C5
0
1
2
3
4
5
6
7
8
9
10
22/02
/05
23/02
/05
24/02
/05
25/02
/05
26/02
/05
Date
Con
cent
ratio
n, m
g/L
C5
C2
0
1
2
3
4
5
6
7
8
9
10
22/02
/05
23/02
/05
24/02
/05
25/02
/05
26/02
/05
Date
Con
cent
ratio
n, m
g/L
C2
C4
0
2
4
6
8
10
12
14
22/02
/05
23/02
/05
24/02
/05
25/02
/05
26/02
/05
Date
Con
cent
ratio
n, m
g/L
C4

Title Scale Project
N.T.S No. MA4017Date Appendix
Feb 05 C
Lamma Power Station Extension– Supply and Installation of Submarine Gas Pipeline
Suspended Solids at Mid-Flood Tide
Graphical Presentation of Water Quality MonitoringResults
SR1
0
1
2
3
4
5
6
7
8
9
10
22/02
/05
23/02
/05
24/02
/05
25/02
/05
26/02
/05
Date
Con
cent
ratio
n, m
g/L
SR1
SR2
0
1
2
3
4
5
6
7
8
9
10
22/02
/05
23/02
/05
24/02
/05
25/02
/05
26/02
/05
Date
Con
cent
ratio
n, m
g/L
SR2
SR3
0
1
2
3
4
5
6
7
8
9
10
22/02
/05
23/02
/05
24/02
/05
25/02
/05
26/02
/05
Date
Con
cent
ratio
n, m
g/L
SR3
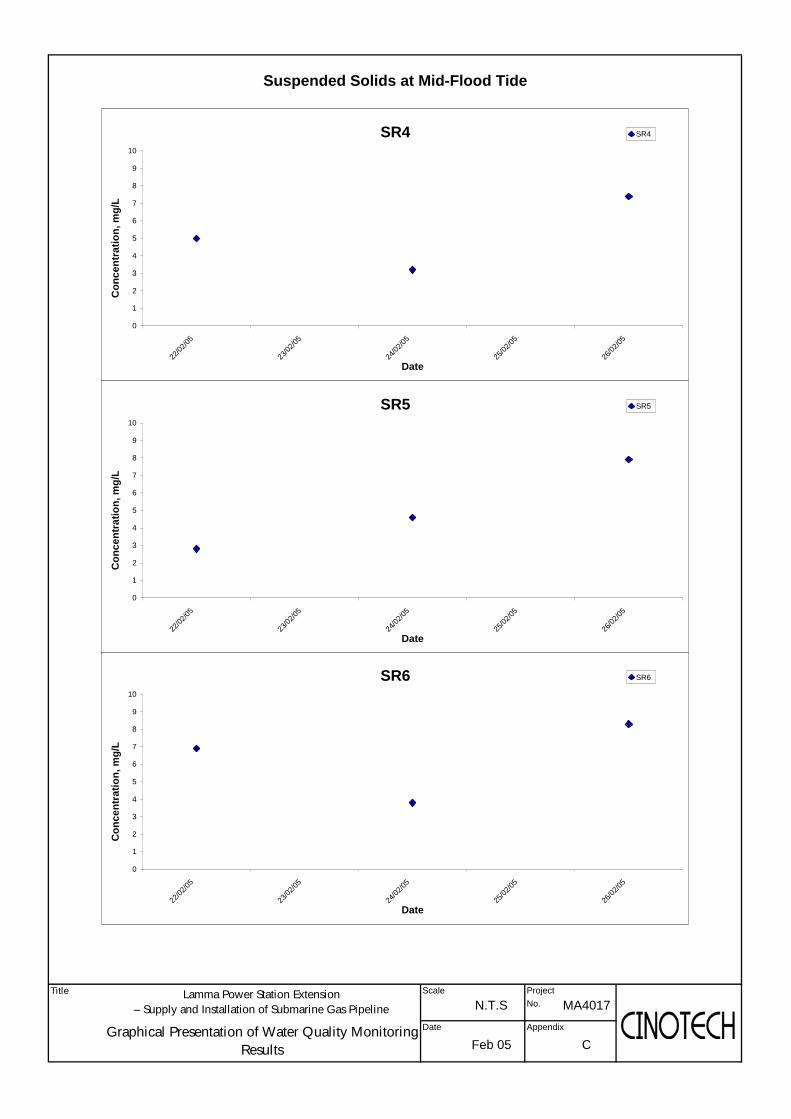
Title Scale Project
N.T.S No. MA4017Date Appendix
Feb 05 C
Suspended Solids at Mid-Flood Tide
Lamma Power Station Extension– Supply and Installation of Submarine Gas Pipeline
Graphical Presentation of Water Quality MonitoringResults
SR5
0
1
2
3
4
5
6
7
8
9
10
22/02
/05
23/02
/05
24/02
/05
25/02
/05
26/02
/05
Date
Con
cent
ratio
n, m
g/L
SR5
SR6
0
1
2
3
4
5
6
7
8
9
10
22/02
/05
23/02
/05
24/02
/05
25/02
/05
26/02
/05
Date
Con
cent
ratio
n, m
g/L
SR6
SR4
0
1
2
3
4
5
6
7
8
9
10
22/02
/05
23/02
/05
24/02
/05
25/02
/05
26/02
/05
Date
Con
cent
ratio
n, m
g/L
SR4
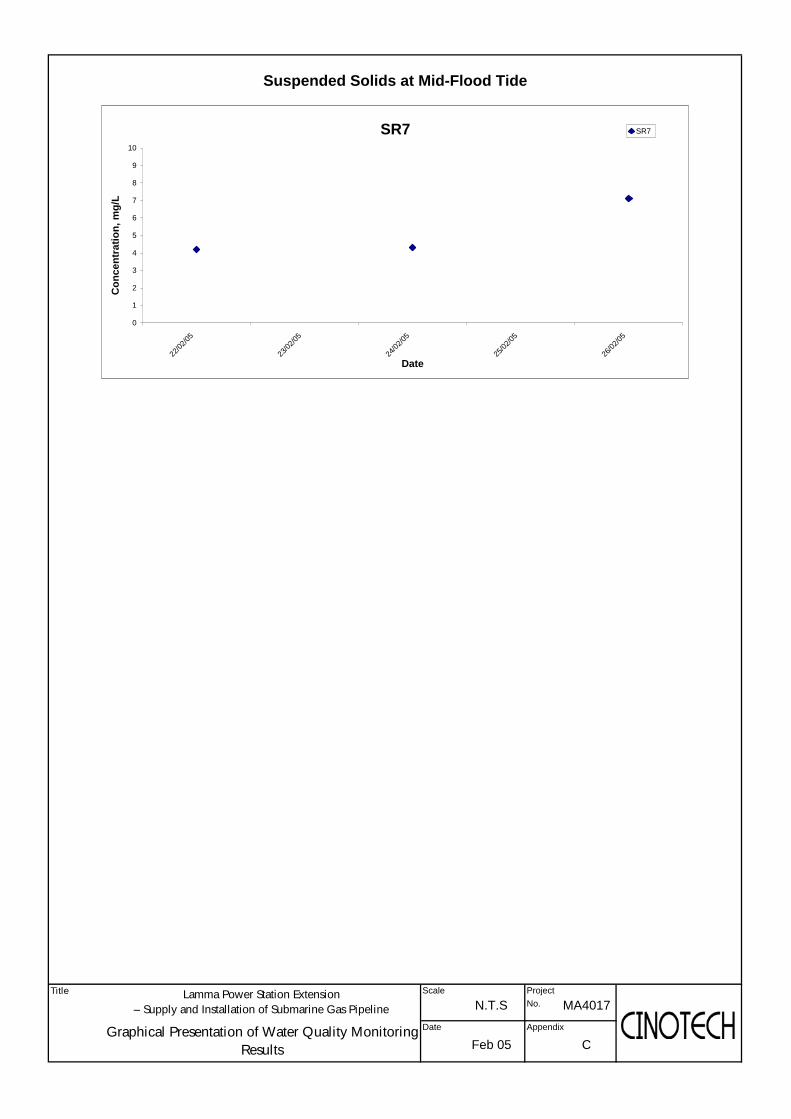
Title Scale Project
N.T.S No. MA4017Date Appendix
Feb 05 C
Lamma Power Station Extension– Supply and Installation of Submarine Gas Pipeline
Graphical Presentation of Water Quality MonitoringResults
Suspended Solids at Mid-Flood Tide
SR7
0
1
2
3
4
5
6
7
8
9
10
22/02
/05
23/02
/05
24/02
/05
25/02
/05
26/02
/05
Date
Con
cent
ratio
n, m
g/L
SR7

APPENDIX D EVENT ACTION PLAN FOR WATER QUALITY
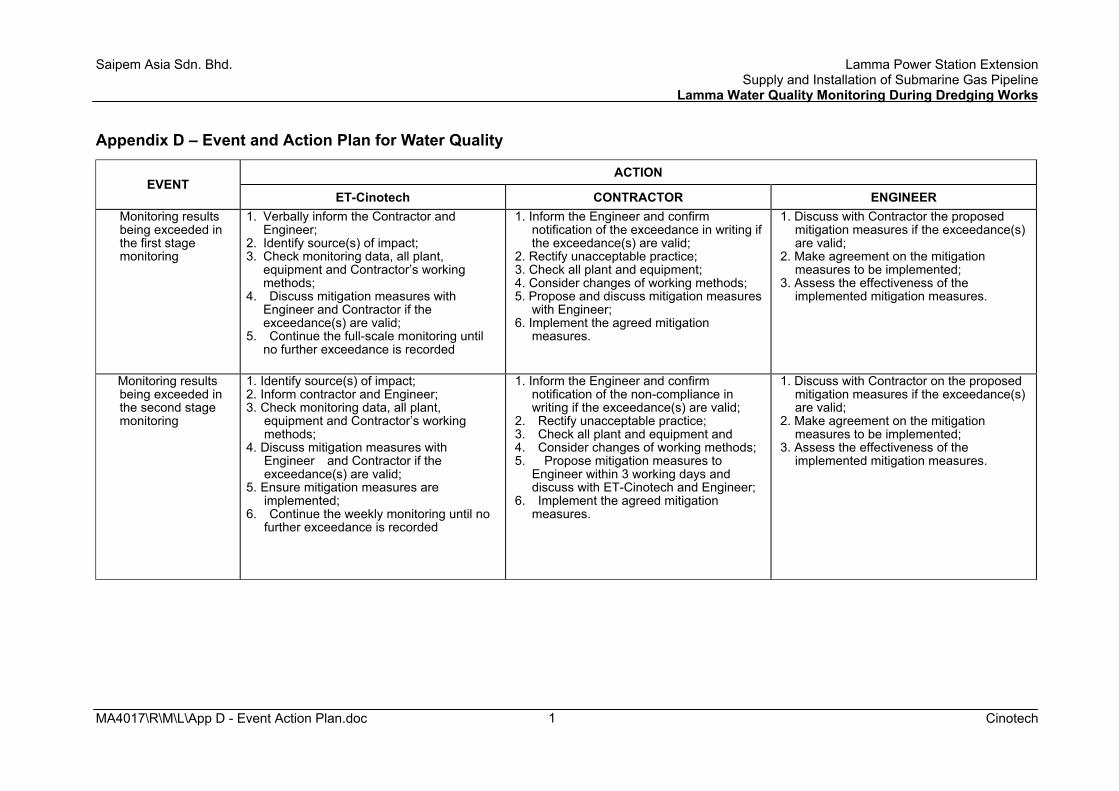
Saipem Asia Sdn. Bhd. Lamma Power Station Extension Supply and Installation of Submarine Gas Pipeline Lamma Water Quality Monitoring During Dredging Works
MA4017\R\M\L\App D - Event Action Plan.doc Cinotech 1
Appendix D – Event and Action Plan for Water Quality
ACTION EVENT
ET-Cinotech CONTRACTOR ENGINEER Monitoring results being exceeded in the first stage monitoring
1. Verbally inform the Contractor and Engineer;
2. Identify source(s) of impact; 3. Check monitoring data, all plant,
equipment and Contractor’s working methods;
4. Discuss mitigation measures with Engineer and Contractor if the exceedance(s) are valid;
5. Continue the full-scale monitoring until no further exceedance is recorded
1. Inform the Engineer and confirm notification of the exceedance in writing if the exceedance(s) are valid;
2. Rectify unacceptable practice; 3. Check all plant and equipment; 4. Consider changes of working methods; 5. Propose and discuss mitigation measures
with Engineer; 6. Implement the agreed mitigation
measures.
1. Discuss with Contractor the proposed mitigation measures if the exceedance(s) are valid;
2. Make agreement on the mitigation measures to be implemented;
3. Assess the effectiveness of the implemented mitigation measures.
Monitoring results being exceeded in the second stage monitoring
1. Identify source(s) of impact; 2. Inform contractor and Engineer; 3. Check monitoring data, all plant,
equipment and Contractor’s working methods;
4. Discuss mitigation measures with Engineer and Contractor if the exceedance(s) are valid;
5. Ensure mitigation measures are implemented;
6. Continue the weekly monitoring until no further exceedance is recorded
1. Inform the Engineer and confirm notification of the non-compliance in writing if the exceedance(s) are valid;
2. Rectify unacceptable practice; 3. Check all plant and equipment and 4. Consider changes of working methods; 5. Propose mitigation measures to
Engineer within 3 working days and discuss with ET-Cinotech and Engineer;
6. Implement the agreed mitigation measures.
1. Discuss with Contractor on the proposed mitigation measures if the exceedance(s) are valid;
2. Make agreement on the mitigation measures to be implemented;
3. Assess the effectiveness of the implemented mitigation measures.

APPENDIX E MONITORING SCEDULE
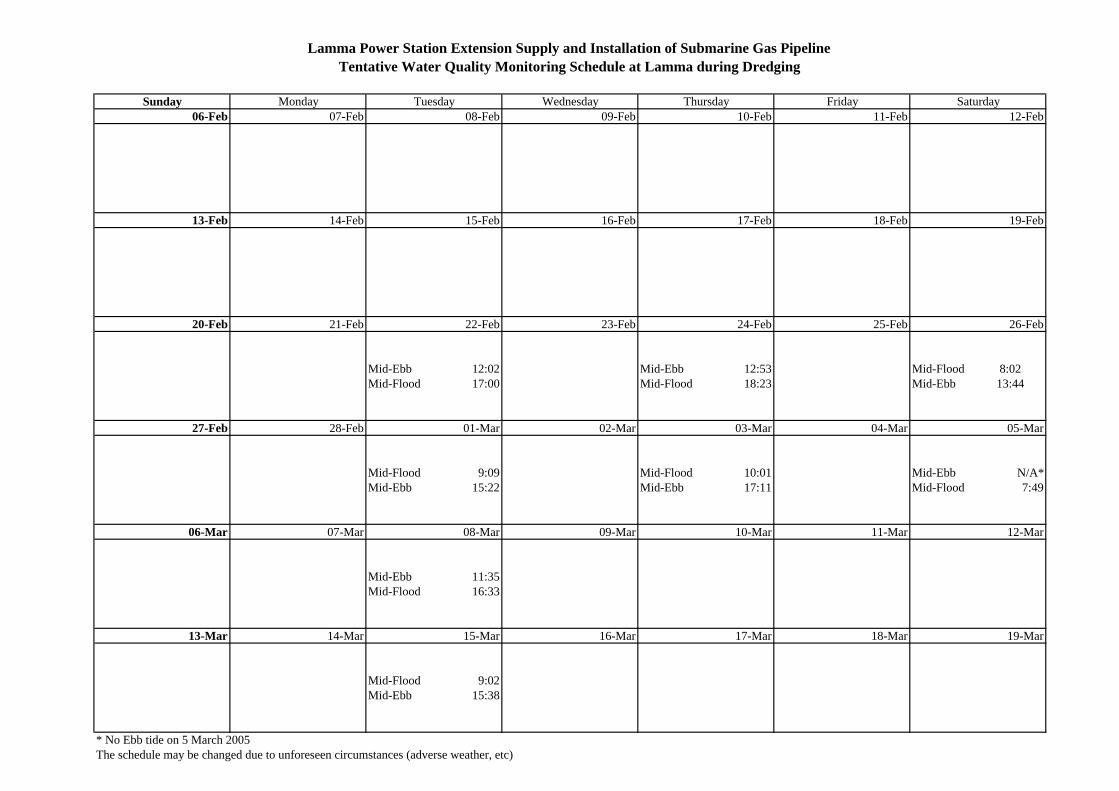
06-Feb 07-Feb 08-Feb 09-Feb 10-Feb 11-Feb 12-Feb
13-Feb 14-Feb 15-Feb 16-Feb 17-Feb 18-Feb 19-Feb
20-Feb 21-Feb 22-Feb 23-Feb 24-Feb 25-Feb 26-Feb
Mid-Ebb 12:02 Mid-Ebb 12:53 Mid-Flood 8:02Mid-Flood 17:00 Mid-Flood 18:23 Mid-Ebb 13:44
27-Feb 28-Feb 01-Mar 02-Mar 03-Mar 04-Mar 05-Mar
Mid-Flood 9:09 Mid-Flood 10:01 Mid-Ebb N/A*Mid-Ebb 15:22 Mid-Ebb 17:11 Mid-Flood 7:49
06-Mar 07-Mar 08-Mar 09-Mar 10-Mar 11-Mar 12-Mar
Mid-Ebb 11:35Mid-Flood 16:33
13-Mar 14-Mar 15-Mar 16-Mar 17-Mar 18-Mar 19-Mar
Mid-Flood 9:02Mid-Ebb 15:38
* No Ebb tide on 5 March 2005The schedule may be changed due to unforeseen circumstances (adverse weather, etc)
Lamma Power Station Extension Supply and Installation of Submarine Gas PipelineTentative Water Quality Monitoring Schedule at Lamma during Dredging
Thursday Friday SaturdaySunday Monday Tuesday Wednesday
APPENDIX F CONSTRUCTION PHASE MITIGATION MEASURES AND THEIR IMPLEMENTATION (GAS PIPELINE)
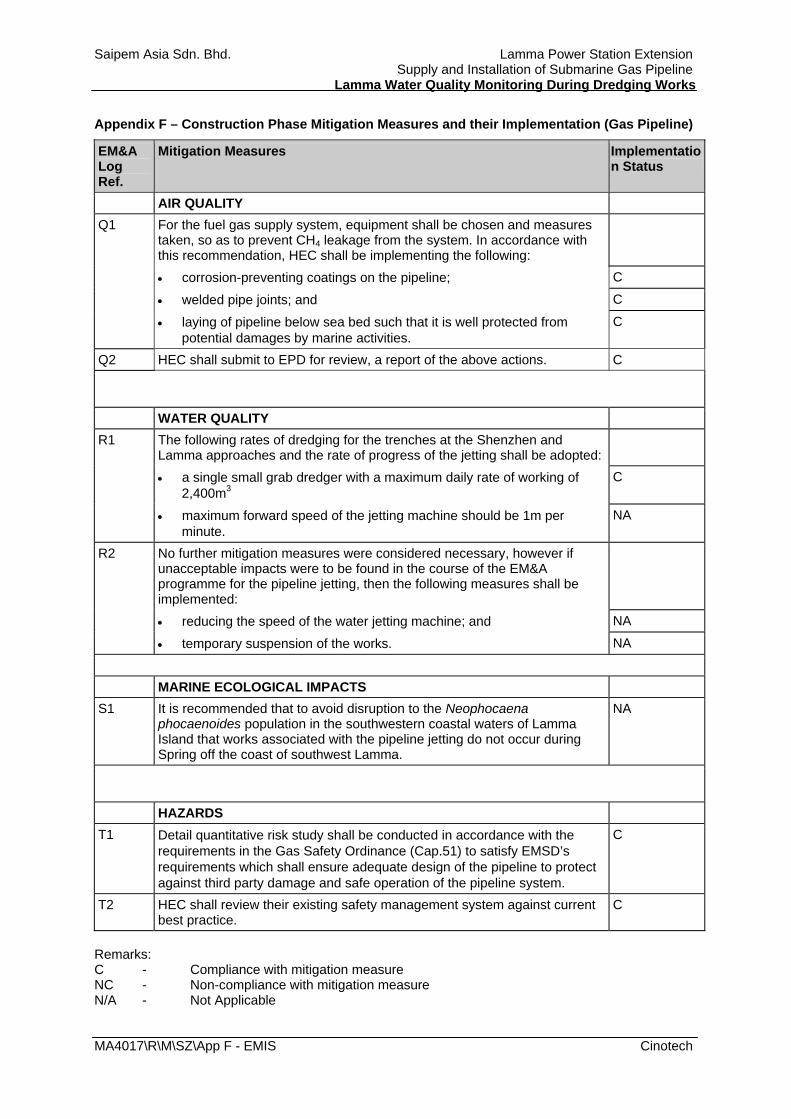
Saipem Asia Sdn. Bhd. Lamma Power Station Extension Supply and Installation of Submarine Gas Pipeline
Lamma Water Quality Monitoring During Dredging Works
MA4017\R\M\SZ\App F - EMIS Cinotech
Appendix F – Construction Phase Mitigation Measures and their Implementation (Gas Pipeline)
EM&A Log Ref.
Mitigation Measures Implementation Status
AIR QUALITY For the fuel gas supply system, equipment shall be chosen and measures taken, so as to prevent CH4 leakage from the system. In accordance with this recommendation, HEC shall be implementing the following:
• corrosion-preventing coatings on the pipeline; C
• welded pipe joints; and C
Q1
• laying of pipeline below sea bed such that it is well protected from potential damages by marine activities.
C
Q2 HEC shall submit to EPD for review, a report of the above actions. C
WATER QUALITY The following rates of dredging for the trenches at the Shenzhen and Lamma approaches and the rate of progress of the jetting shall be adopted:
• a single small grab dredger with a maximum daily rate of working of 2,400m3
C
R1
• maximum forward speed of the jetting machine should be 1m per minute.
NA
No further mitigation measures were considered necessary, however if unacceptable impacts were to be found in the course of the EM&A programme for the pipeline jetting, then the following measures shall be implemented:
• reducing the speed of the water jetting machine; and NA
R2
• temporary suspension of the works. NA
MARINE ECOLOGICAL IMPACTS S1 It is recommended that to avoid disruption to the Neophocaena
phocaenoides population in the southwestern coastal waters of Lamma Island that works associated with the pipeline jetting do not occur during Spring off the coast of southwest Lamma.
NA
HAZARDS T1 Detail quantitative risk study shall be conducted in accordance with the
requirements in the Gas Safety Ordinance (Cap.51) to satisfy EMSD’s requirements which shall ensure adequate design of the pipeline to protect against third party damage and safe operation of the pipeline system.
C
T2 HEC shall review their existing safety management system against current best practice.
C
Remarks: C - Compliance with mitigation measure NC - Non-compliance with mitigation measure N/A - Not Applicable