Embed Size (px)
Citation preview
Journal of Operational Meteorology
Article
Lammers, M. R., J. D. Horel, 2014: Verification of National Weather Service spot forecasts using surface observations. J. Operational Meteor., 2 (1), 17, doi: http://dx.doi.org/10.15191/nwajom.2014.02##.
Verification of National Weather Service Spot Forecasts Using Surface Observations
MATTHEW R. LAMMERSUniversity of Utah, Salt Lake City, UT
JOHN D. HORELUniversity of Utah, Salt Lake City, UT
(Manuscript received Day Month Year; review completed Day Month Year)
ABSTRACT
Software has been developed to evaluate National Weather Service spot forecasts. Fire management officials request spot forecasts from National Weather Service Weather Forecast Offices to provide detailed guidance as to atmospheric conditions in the vicinity of planned prescribed burns as well as wildfires that do not have incident meteorologists on site. This open source software with online display capabilities is used to examine an extensive set of spot forecasts of maximum temperature, minimum relative humidity, and maximum wind speed from April 2009 through November 2013 nationwide. The forecast values are compared to the closest available surface observations at stations installed primarily for fire weather and aviation applications. The accuracy of the spot forecasts is compared to those available from the National Digital Forecast Database (NDFD).
Spot forecasts for a selected prescribed burn are used to illustrate issues associated with the verification procedures. Cumulative statistics for National Weather Service County Warning Areas and for the nation are presented. Basic error and accuracy metrics for all available spot forecasts and the entire nation indicate that the skill of the spot forecasts is higher than that available from the NDFD, with the greatest improvement for maximum temperature and the least improvement for maximum wind speed.
_____________________
1. Introduction
A 2008 National Oceanic and Atmospheric Administration (NOAA) report entitled, “Fire Weather
Research: A Burning Agenda for NOAA,” outlined the need for more robust forecast verification for
wildland fire incidents (NOAA SAB 2008). National Weather Service (NWS) forecasters at Weather
Forecast Offices (WFOs) have issued 103,370 forecasts, often at very short notice, requested by fire and
emergency management professionals for specific locations, or “spots”, during the April 2009 -
Corresponding author address: Matthew Lammers, 135 S 1460 E Rm 819 (WBB), Salt Lake City, UT 84112E-mail: [email protected]
1
1
2
345678910111213141516171819202122232425262728293031
32
33
34
35
36
37
38
123
November 2013 period. Spot forecasts are requested for prescribed burns, wildfires, search and
rescue operations, and hazardous material incidents (Fig. 1). The Medford, OR (MFR) WFO
issued the most prescribed burn forecasts while the Missoula, MT (MSO) WFO has been
responsible for the most wildfire forecasts during this period. Nationwide, spot forecasts are
issued twice as often for prescribed burns than for wildfires. NWS forecasters rarely receive
detailed feedback from fire and emergency management professionals on the usefulness of their
spot forecasts and no quantitative evaluation of spot forecasts has been undertaken nationwide.
Prescribed fires on federal or state land have operating plans that contain thresholds for
atmospheric variables such as wind speed and relative humidity beyond which they should not
commence burning. Spot forecasts play a central role in determining whether a burn is initiated
on a given day. Of the 16,600+ prescribed burns undertaken in 2012, only 14 escaped (Wildland
Fire Lessons Learned Center 2013). However, public reaction to this small number of escapes is
overwhelmingly negative. Outcry from the Lower North Fork Fire, which broke out in
smoldering litter four days after the prescribed burn work, destroyed 23 homes and 3 fatalities
and led to modifications of the Colorado state constitution to allow victims of prescribed burn
escapes to sue the state (Ingold 2012).
The nation is increasingly at risk for loss of life and damage to property as a result of
wildfires (Calkin et al. 2014). During 2003, fires near San Diego, California destroyed over
3500 homes and killed 22 people (Hirschberg and Abrams 2011). Three fires (High Park,
Waldo Canyon, and Black Forest) in the Front Range of Colorado in 2012 and 2013 destroyed a
total of 1117 homes. Forecast guidance, issued by WFO forecasters initially and later by
Incident Meteorologists as wildfires grow in extent and potential for harm, helps to determine
the magnitude and placement of responding firefighters. In some circumstances, there is little
that can be done to contain explosively developing conflagrations, but even when the ability to
control a fire is diminished, accuracy in forecasting timing and intensity is essential. The deaths
39
40
41
42
43
44
45
46
47
48
49
50
51
52
53
54
55
56
57
58
59
60
61
62
63
of 19 firefighters in Yarnell, AZ, caused in part by a sudden wind shift outflowing from a
thunderstorm, underscores the need for capturing the wide range of possible fire weather
conditions.
As reviewed by Myrick and Horel (2006), the goals of forecast verification fall into three
categories:
administrative (assess overall forecast performance for strategic planning),
scientific (improve understanding of the nature and causes of forecast errors to
improve future forecasts),
economic (assess the value of the forecasts to the end users).
This research is focused on the first two categories. Joliffe and Stephenson (2003) and Wilks
(2006) define objective estimates of forecast quality that are appropriate for administrative-
oriented verification at the national level as well as scientific-oriented verification that can
provide feedback directly to the forecasters. Both needs can be addressed as outlined by
Murphy and Winkler (1986) either in terms of measures-oriented or distributions-oriented
verification. The former is centered on statistics such as bias, root-mean squared error, or other
skill scores developed to contrast forecasts with verifying data. Nevertheless, as Murphy and
Winkler (1986) state regarding measures-oriented approaches, “they are not particularly helpful
when it comes to obtaining a more detailed understanding of the strengths and weaknesses in
forecasts or to identifying ways in which the forecasts might be improved”.
The distributions-oriented method alleviates some of these concerns in part by presenting
more detailed information about the relationships between the forecasts and the verifying
observations. It allows for any type of forecast to be examined, whether for a discrete or
continuous variable and whether done in a categorical or probabilistic manner. The locations of
errors are also exposed more effectively, as breaking up the joint, marginal, and conditional
distributions allows for the inspection of categorical errors that only occur under certain
64
65
66
67
68
69
70
71
72
73
74
75
76
77
78
79
80
81
82
83
84
85
86
87
88
conditions. Horel et al. (2014) illustrate how the skill of forecasts for fire weather applications
can be evaluated using both measure- and distribution-oriented statistics.
Brown and Murphy (1987) provide an excellent example of evaluating fire weather
forecasts. Forecasts issued by the Boise WFO in 1984 were evaluated for the Black Rock
Ranger Station in Wyoming. The forecasters were instructed to issue not only an anticipated
value, but also projected 25th and 75th percentile values. They found a slight warm/dry bias in
maximum temperature and minimum relative humidity forecasts. They suggest that the biases
are due to the forecasters’ perceptions of the consequences to fire professionals of
underforecasting the maximum temperature and maximum wind speed, while overforecasting
minimum relative humidity, such that fire danger calculations would then be underestimated.
The forecaster does not desire to leave the fire officials ill prepared for potential curing of fuels.
Brown and Murphy (1987) also suggested that difficulties in quantifying uncertainty by the
forecasters (i.e., predicting the upper and lower quartile values) led to negative skill in relative
humidity and wind speed relative to climatological forecasts.
The objectives of this research have been to: (1) facilitate the transfer from research to
operations of methodologies to verify spot forecasts and (2) assess the degree of improvement
provided by such forecasts relative to those available from the National Digital Forecast
Database (NDFD) (Glahn and Ruth 2003). Forecasters require verification of their spot
forecasts to help improve those forecasts, and fire and emergency management personnel need
to be able to develop confidence regarding the skill of those forecasts. To demonstrate the
capabilities of the tools developed, we limit this study to evaluating quantitatively maximum
temperature, minimum relative humidity, and maximum wind speed. These variables are central
to estimates of fire spread rates and hence affect fire management and containment activities.
Lammers (2014) describes the procedures developed to verify spot forecasts and a broader
set of cases and statistics than possible here. Before summarizing national statistics primarily
89
90
91
92
93
94
95
96
97
98
99
100
101
102
103
104
105
106
107
108
109
110
111
112
113
for prescribed burns, we illustrate validating spot forecasts using a prescribed burn case (Box
Creek), and cumulative statistics from the Tucson WFO. Lammers (2014) examines many
moreadditional prescribed burn and wildfire cases, statistics for other WFOs, and cumulative
statistics for wildfire spot forecasts in greater detail.
2. Data
a. Spot Forecasts
Spot forecasts are issued by forecasters at NWS WFOs for four primary purposes:
prescribed burns, wildfires, search and rescue, and hazardous materials (Fig. 1). Professionals
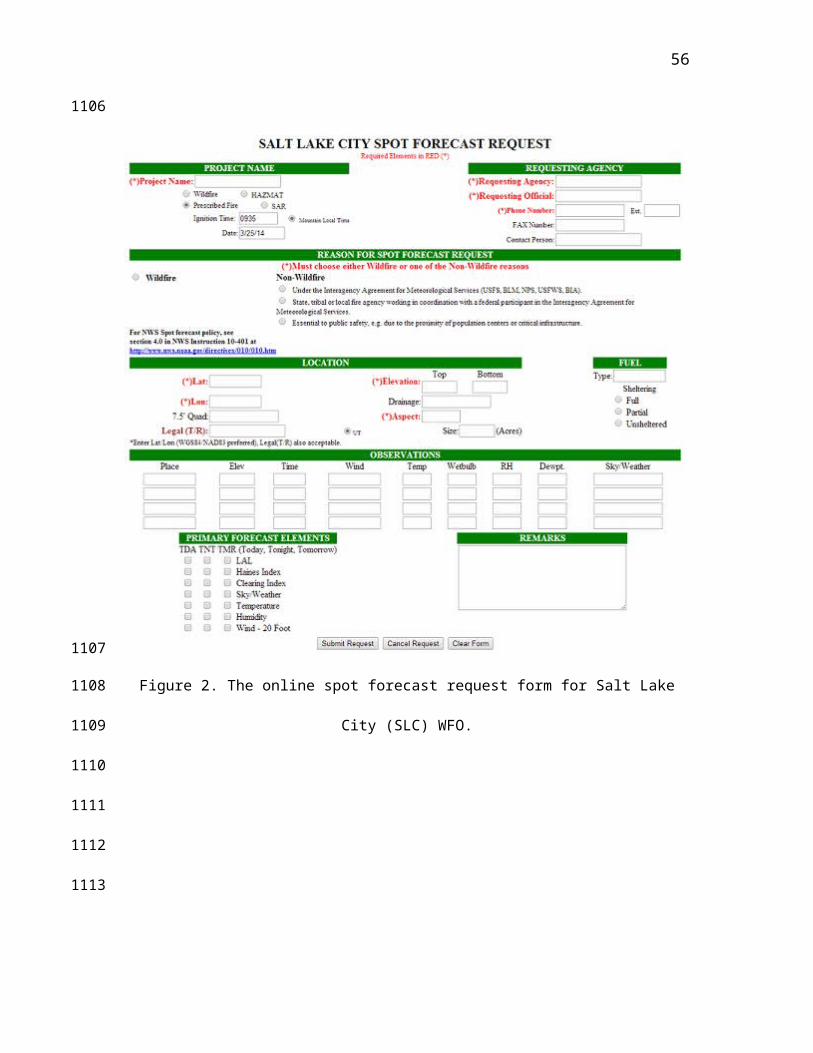
submit an online request form outlining the reason for needing the forecast and other pertinent
information (Fig. 2). The resulting request is stored as a text document (Fig. 3).
The spot forecast itself contains four primary sections, each of which is represented in the
example product in Fig. 4. The first contains basic information: name of the fire, land
ownership, time the forecast was issued, and contact information for the forecast office. The
second section is a free form discussion of anticipated conditions, including wind shifts, trends,
potential for thunderstorms and lightning, or simply providing context for the forecasted
conditions relative to recent observed values. Detailed forecasts follow of requested values for
the requested time periods. Often these periods are “Today” or “Rest of Today,” “Tonight,” and
the next day. Finally, the spot forecast identifies the forecaster responsible, the requestor, and
the type of request.
From the Graphical Forecast Editor (GFE) within their Automated Weather Interactive
Processing System (AWIPS) workstation, forecasters can choose to populate the requested
specific forecast values for each time period from the locally stored gridded fields at the WFO
or enter the requested values manually (Mathewson 1996; Hansen 2001). The forecast grid files
114
115
116
117
118
119
120
121
122
123
124
125
126
127
128
129
130
131
132
133
134
135
136
137
138
at the WFOs are often at higher spatial resolution than those stored as part of the NDFD
national products. Considerable effort is spent by forecasters adjusting numerical guidance and
previous forecast fields to update their local grids several times per day (Myrick and Horel
2006; Stuart et al. 2007; Horel et al. 2014). After reviewing additional information, the
forecaster may then choose to adjust the values initially populated by the GFE as needed based
on their interpretation of the forecast situation. Integrating forecaster experience and conceptual
models with datasets available on AWIPS is a useful approach in operational forecasting (Andra
et al. 2002; Morss and Ralph 2007). Whether by request or forecaster prerogative, the “Today”
forecast regularly includes more detailed hourly or bi-hourly values, which can prove highly
useful to end users in the case of a frontal passage or anticipated wind shift.
b. NDFD Forecasts
NWS WFOs release their forecasts for their respective County Warning Areas (CWAs) as
gridded products, which are stored nationally as part of the NDFD at 5 km horizontal resolution
during the majority of the period evaluated in this study (Glahn and Ruth 2003). A goal of this
study is to assess the extent to which the numerical components of the spot forecasts provide
improved forecast guidance relative to the NDFD forecasts. Of course, the NDFD forecasts can
replace neither the critical “Discussion” section provided by the forecaster nor the valuable
information on terrain-relative flows (e.g., up-slope/up-valley) often provided within the
forecast guidance, broken down by time period, that take into account local knowledge of
topographic features.
The online web tools developed as part of this project make it possible to compare NDFD
and spot forecasts for all available forecasts. However, in order to evaluate a consistent set of
NDFD and spot forecasts, the 0900 UTC NDFD forecasts for the afternoon/evening (6-, 9-, 12-,
139
140
141
142
143
144
145
146
147
148
149
150
151
152
153
154
155
156
157
158
159
160
161
162
163
and 15-hour forecasts for 15, 18, 21, and 24 UTC) are used as a baseline for comparison with
spot forecasts issued commonly in the early morning. NDFD values are extracted from the
nearest neighbor grid points to the spot forecast locations.
c. Validation Datasets
Fire professionals rely most heavily on surface observing stations installed by land agencies
as part of the Remote Automated Weather System (RAWS, Horel and Dong 2010). There were,
as of November 2013, 2277 RAWS stations in operation from which data are archived in the
MesoWest database (Horel et al. 2002). Equally relevant for this study to validate the spot and
NDFD forecasts are the additional 2289 NWS/Federal Aviation Administration stations as of
November 2013. As shown in Fig. 5, the density of the observations from these two networks
varies across the nation, with the highest number in California. While data from an additional
25,000 surface observing stations are available in MesoWest (see http://mesowest.utah.edu),
the RAWS and NWS/FAA networks are relied on most heavily by NWS forecasters issuing
spot forecasts. In addition, forecasters depend on standardized equipment and maintenance
standards (Horel and Dong 2010), e.g., both networks report temperature and relative humidity
at ~2 m (~6.6 ft). Permanent RAWS stations report wind speed at 6.1 meters (20 ft), which has
been the desired height for fire management operations, as well as the height at which wind
speed is generally forecast in spot forecasts. Temporary RAWS stations are often deployed to
support planning for prescribed burns and provide wind speed at 3 m (10 ft). NWS/FAA
stations report wind speed at 10 m to meet the goals of aviation applications (33 ft).
The National Center for Environmental Prediction (NCEP) has generated the Real-Time
Mesoscale Analysis (RTMA) since 2006, providing hourly analyses of surface atmospheric
variables (de Pondeca et al. 2011). This study used the operational 5 km gridded fields available
164
165
166
167
168
169
170
171
172
173
174
175
176
177
178
179
180
181
182
183
184
185
186
187
188
during most of this study period, although operational RTMA grids are now available at 2.5 km
resolution. While it can be generally assumed that nearly all NWS/FAA and most RAWS
observations are used in the RTMA analyses, some RAWS observations are not received in
time for the RTMA due to latencies in satellite data transmission. The analyses provide a point
of comparison within at most a few km of the location requested for the spot forecast. We focus
here on validating the spot forecasts relative to nearby observations; see Lammers (2014) for
more in-depth discussion about verifying the forecasts using the RTMA grids.
3. Methods
a. Text Parsing
The mix of textual and numerical values contained in spot forecasts (Fig. 4) makes it
difficult to extract pertinent information for verification. The numerical values contained within
the spot forecasts are not separated and sent to a centralized online database. NWS forecasters
rely on the GFE to translate quantitative information into text products for the general public
and other customers. However, validating spot forecasts requires the inverse, reverting from text
products back to numerical values. Hence, natural language methodologies were developed as
part of this project to parse the forecast values from the freeform text of the spot forecasts. The
resulting code was found to be adequate to evaluate spot forecasts for all CWAs, and minimize
the number of forecasts dropped due to inability to parse the text properly (i.e., 9854 forecasts
of the 71,070 forecasts issued during the study period were not able to be processed).
Development of the validation web tools has focused on analyzing those spot forecasts that
are labeled “WILDFIRE” or “PRESCRIBED”. Large sections of text for those spot forecast
types are ignored because they are outside the scope of the research, e.g., the “Discussion”
section. Most spot forecasts for prescribed burns are issued in the morning for the remainder of
189
190
191
192
193
194
195
196
197
198
199
200
201
202
203
204
205
206
207
208
209
210
211
212
213
the day, such that the section following the “Discussion” focuses on “Today” or “Rest of
Today.” Requests for prescribed spot forecasts often are submitted the night before scheduled
burn operations, but the forecasts are not required nor desired until early morning. Within the
“Today” or “Rest of Today” block, relevant numerical values are obtained for maximum
temperature, minimum relative humidity, and maximum wind speed.
Handling wind is more complicated than what is required for temperature or humidity.
Consider the following snippets of content from spot forecasts. “LIGHT AND VARIABLE
WINDS BECOMING SOUTHWEST 5 MPH EARLY IN THE AFTERNOON…THEN
BECOMING LIGHT AND VARIABLE LATE IN THE AFTERNOON.” Or:
“UPSLOPE/UPVALLEY 6 to 11 MPH. GUSTY AND ERRATIC IN THE VICINITY OF
THUNDERSTORMS.” While an end user can glean useful information from such forecasts, the
lack of specificity makes it difficult to validate against observations that are reported at typically
hourly intervals. What is the wind speed corresponding to light and variable? When specifically
is early or late afternoon? What direction is upslope or upvalley? What is gusty and erratic?
Hence, a pragmatic approach was adopted to simply focus on the maximum wind speed
forecasted, ignoring directional terms or phrases related to wind gusts. Forecasters in a specific
CWA may be required to forecast winds at a single level or multiple levels using different
definitions (e.g., “20 FT”, “20 FOOT,”, “EYE LEVEL,” or “GENERAL”). To obtain the most
reasonable maximum wind speed forecast value for validation, 20 ft winds are preferred, since
that is the height of permanent RAWS sensors. If there are two forecasts for wind speed for the
day (e.g., one that is more free-flowing, and one that specifies by hour or every two hours), then
the maximum of all the values is kept.
214
215
216
217
218
219
220
221
222
223
224
225
226
227
228
229
230
231
232
233
234
235
236
237
238
b. Verification
As described previously, the spot and NDFD forecasts are compared to RAWS and
NWS/FAA observations as well as RTMA analyses. It is important to distinguish between the
broader capabilities of the online web tools developed as part of this project and the more
restrictive limits used to address the objectives of this study. For this study, the latitude and
longitude extracted from the request form are used to define the station nearest to the spot
forecast location within a horizontal distance of 50 km and vertical distance of 333 m. Only
1054 forecasts were removed from the analysis because they did not have a station within those
distances. The maximum temperature and wind speed and minimum relative humidity are
determined and stored from all values available between 16 UTC and 24 UTC and simple range
checks are used to eliminate occasionally erroneous values. The maximum temperature and
wind speed and minimum relative humidity from all RTMA values between 16 UTC and 24
UTC at the nearest neighboring gridpoint to the spot forecast location were also obtained.
Similar values were also extracted from the NDFD grids for comparison to the spot forecasts.
Measures-oriented metrics that are used to evaluate the spot and NDFD forecasts are the
average difference between forecasts and verifying data (i.e., the bias or Mean Error, ME) and
Median Absolute Error (MAE), which is less sensitive to outliers than the mean absolute error.
c. Online Tools
As described by Murphy (1991), the large dimensionality implicit in forecast verification
inhibits documenting all of the characteristics of these spot forecasts in this single study. For the
April 2009 – November 2013 period, there were 44,901 prescribed burn and 16,280 wildfire
forecasts that could be verified. It is important as well to be able to examine forecast skill as a
239
240
241
242
243
244
245
246
247
248
249
250
251
252
253
254
255
256
257
258
259
260
261
262
263
function of the particular values of the forecasts or the verifying observations or analyses.
Hence, a central goal of this study was to develop tools that forecasters and end users can use to
evaluate the forecasts of interest to them, rather than attempting to relate cumulative statistics
over a limited sample of broad categories to their needs. These tools are available at
http://meso1.chpc.utah.edu/jfsp/.
In order to be able to rapidly query such a large data set that is continually updating, a
comma-separated text file containing every valid forecast with the corresponding nearby
observations, NDFD forecasts, and RTMA values is created. To alleviate the complexity of the
multivariate nature of the spot forecasts, the open source Crossfilter code developed by Square,
Inc., is used that allows for near-instantaneous slicing on each axis of a multidimensional data
set. That allows users to create histograms conditioned on ranges of values in multiple
dimensions, i.e., within selected elevation ranges, times of year, values of variables (for
example, maximum temperature in the range 20-25oC), etc. These histograms then can be
adjusted dynamically by the user based on selections in other histograms. The Crossfilter object
is instantiated by simply pulling in the necessary information in comma-separated format.
Filters are generated on one or more of the variables so that the user can make selections based
on ranges of values, but also visualize the impact of other selections on these variables.
Consider the verification data available at http://meso1.chpc.utah.edu/jfsp/
statsAllWF.html for all wildfires starting 1 April 2009 and updating daily. A short description
of the forecasts available for this page is provided, followed by a histogram of the number of
forecasts broken down by date, a series of other tabs, and a map with red markers for accurate
spot forecasts issued during that period. Black markers are forecasts that are assumed to have
less skill since they deviated from the surface observation by user-selectable values that default
to ±2.5oC, ±5% relative humidity, and ±2.5 m s-1 (Fig. 6). By clicking on any of the markers, a
window is displayed that contains the parsed values from each of the data sets that were used
264
265
266
267
268
269
270
271
272
273
274
275
276
277
278
279
280
281
282
283
284
285
286
287
288
for verifying that forecast. There are also links to the spot forecast and to the MesoWest page
for that station for the day of the forecast to be able to examine the observed conditions in more
detail.
On either side of the histogram of forecasts binned by month are two “brushes.” Dragging
them to restrict the range of allowable months adjusts the markers on the map to only reflect
those forecasts that were issued during that time frame. It also modifies all of the other
multivariate histograms that are initially hidden within the clickable tabs. As many of these tabs
can be opened as are desired by the user, and brushes can be used on every histogram to pare
down the number of forecasts to only those they wish to view on the map and see reflected in
the histograms. By leveraging these web tools, basic questions about the distributions of errors
and the relationships between variables can be addressed without searching endless archived
figures. Since the intention is for such tools to be used operationally, they must be dynamic such
that recent forecasts are constantly being provided to the forecasters and end users.
4. Analysis and Discussion
a. Box Creek Prescribed Fire
The Box Creek Prescribed Fire occurred in the Fishlake National Forest of Southern Utah in
May 2012 (USFS 2012). A crew ignited a test fire on 15 May that burned for a few days under
containment. According to the Facilitated Learning Analysis (FLA), spot forecasts were
requested “and referenced against observed weather conditions and feedback was given to the
meteorologist. The spots lined up with conditions on the ground very well. This provided the
RXB2 (Burn Boss) with much confidence in the meteorologist’s forecasts” (USFS 2012). The
FLA also stated that ignitions were halted for several days due to unfavorable winds and did not
resume until 29 May. Mop-up and patrol operations followed until 4 June, when torching and
289
290
291
292
293
294
295
296
297
298
299
300
301
302
303
304
305
306
307
308
309
310
311
312
313
spotting were observed to an extent that on-site resources could not contain it within the
prescription boundary. Weather conditions in this area were warmer and drier on 4 June than
typical for this time of year. No prescribed burn spot forecast was requested on the morning of 4
June since the fire was assumed to be contained. A wildfire spot forecast was requested later
that afternoon and subsequent ones continued to be issued until June 17.
As an illustration of the web tools developed for verifying prescribed and wildfire forecasts,
the sample of 23 spot forecasts and verifying data for this case are accessible via the following
web page: http://meso1.chpc.utah.edu/jfsp/BoxCreek.html. Figure 7 contrasts the spot forecasts
of temperature, relative humidity, and wind speed issued for the Box Creek fire to the
observations from the portable RAWS (FISHLAKE PT #4, assigned MesoWest identifier
TT084) deployed 3 km and 56 m above the average burn elevation, which was sited to support
the prescribed fire operations. Figure 7 also contains the NDFD gridpoint values and RTMA
values at the specified forecast location. Figure 8 shows histograms of differences between the
23 spot forecasts and the corresponding conditions observed at TT084 and analyzed by the
RTMA available using the web page http://meso1.chpc.utah.edu/jfsp/BoxCreek.h tml . The
user-controlled whisker filters available on the web page can be used to isolate, for example,
which forecasts are outliers (i.e., 26 May with a ~7oC temperature error, see also Fig. 7) or the
date when the location requested for the spot forecasts shifted several km further south (29
May).
Using the default thresholds for accuracy for temperature, relative humidity, and wind
speed spot forecasts of 2.5oC, 5%, and 2.5 m s-1, respectively, then Fig. 8 indicates that 18
temperature, 19 relative humidity, and 18 wind speed forecasts would be considered accurate
relative to the observations for this sample of 23 forecasts. However, 3 temperature, 12 relative
humidity, and 21 wind speed forecasts would be considered accurate using the same thresholds
when verified against the RTMA (Fig. 8). The lower accuracy implied by the comparison to
314
315
316
317
318
319
320
321
322
323
324
325
326
327
328
329
330
331
332
333
334
335
336
337
338
the RTMA results in this instance from the RTMA’s warm, dry bias due to a lower
elevation specified in the analyses for the verifying gridpoint (2690 m) compared to that
used by the forecaster (2896 m) or that of TT084 (2952 m).
In order to evaluate the accuracy of the spot forecasts for the Box Creek fire relative to the
values available from the NDFD, Fig. 9 tabulates the departures of the spot and NDFD forecasts
from the TT084 observations into bins defined in terms of their absolute error following the
approach of Myrick and Horel (2006). Note that the sample size is reduced to 19 since four
NDFD forecasts are not available in the NDFD archive at the University of Utah. Columns
reflect increasing error from left to right of the spot forecasts while rows indicate increasing
error from top to bottom of the NDFD forecasts. Each bin is split further such that the values
above (below) the diagonal line indicate forecasts for which the forecaster made no or small
(large) changes relative to the NDFD guidance. The thresholds for distinguishing between small
and large deviations from the NDFD guidance are set for temperature, relative humidity, and
wind speed by default to 1oC, 5%, and 1 m s-1, respectively. It is readily apparent from Fig. 9
that 17 (7) of the 19 temperature spot (NDFD) forecasts would be considered accurate. The light
shading in the left column highlights the 10 cases where the forecasters provided improved
temperature guidance relative to the NDFD values. The forecasters never degraded accurate
NDFD forecasts in this case (dark shading in the top row). However, only 1 relative humidity
and 3 wind speed NDFD forecasts were improved to the point they would be considered
accurate while the accuracy was lowered forof 3 NDFD wind speed forecasts was lowered.
b. Tucson WFO
The Tucson CWA in the southeast corner of Arizona experiences, not surprisingly, hot and
dry conditions (i.e., there are no spot forecasts issued for maximum temperature below 100C or
339
340
341
342
343
344
345
346
347
348
349
350
351
352
353
354
355
356
357
358
359
360
361
362
363
minimum relative humidity above 60%). There were 214 prescribed burn forecasts issued
during the 2009-2013 period and 258 wildfire forecasts. As summarized in Figs. 10a and 10b,
Tucson forecasters tend to overforecast maximum temperature and underforecast minimum
relative humidity. We will show later that the Tucson warm, dry bias of ~1.7oC and 3% for
prescribed burn forecasts differs from the majority of WFOs that exhibit a slight cool, wet bias
relative to the observations. Further, only ~10% of prescribed burn forecasts (Fig. 10a) and
~20% of wildfire forecasts (not shown) called for maximum temperatures less than what was
observed. NDFD forecasts exhibit less noticeable biases in temperature or relative humidity
(Figs. 10c and 10d).
As summarized in Fig. 11a, 74% of the NDFD maximum temperature forecasts for
prescribed burns in the Tucson CWA are considered accurate while 65% of the spot forecasts
exhibit similar accuracy. Tucson forecasters modify by more than 1oC accurate NDFD forecasts
60% of the time and thereby reduce the accuracy of NDFD forecasts for 24% of these cases
(dark shading in the top row) while 14.5% of inaccurate NDFD forecasts are improved (light
shading in the left column). Similarly, the accuracy of NDFD relative humidity forecasts is
higher than that of the spot forecasts with more reductions in accuracy than improvements.
Forecasters adjust on average the temperatures to be nearly 30C warmer and relative humidity to
be ~7% drier than the corresponding NDFD values (not shown). The maximum wind speed spot
forecasts issued by the Tucson WFO for prescribed burns improve upon the NDFD gridded
values more often than they degrade them (Fig. 11c). The marginal percentage of accurate spot
forecasts is 69.8% while that of NDFD forecasts is 64.7%. For wildfire spot forecasts, this
improvement is enhanced (not shown), with spot forecasts improving on 20.4% of cases while
they degraded only 6.1% of them.
Hence, Tucson forecasters tend to supply temperature and humidity (wind) spot forecasts
that are less (more) accurate than the gridded values they provide for general applications.
364
365
366
367
368
369
370
371
372
373
374
375
376
377
378
379
380
381
382
383
384
385
386
387
388
These forecasts tend to err conservatively for fire weather operations by anticipating higher fire
danger via higher maximum temperature and lower minimum relative humidity forecasts.
c. Cumulative Statistics
Cumulative statistics for prescribed burns nationwide are now summarized with less
information presented for wildfires due to constraints on publication length. A total of 44,901
(16,280) prescribed burn (wildfire) spot forecasts were analyzed for the afternoon forecast
period between 1 April 2009 and 30 November 2013 with at least one prescribed burn forecast
issued in every state as well as Puerto Rico (Fig. 12a). The months with the most prescribed
burn forecasts were April 2010 and March and April 2012 (Fig. 13a). Whereas prescribed burn
forecasts are spread fairly evenly throughout the country, wildfire forecasts are concentrated in
the western United States with sizeable numbers in Florida as well as from Eastern Michigan
through North Dakota (Fig. 12b). As shown in Fig. 13b, the months with the largest number of
spot forecasts issued for wildfires are July and August with 1,043 spot forecasts that could be
verified during August 2011; only 3 wildfire forecasts were verified during December 2009.
As summarized in Table 1, the temperature spot forecasts for prescribed burns have a slight
cool bias (-0.5oC ME) and a 1.3oC MAE when verified against the observed maximum
temperatures. The slight cool bias is evident in the forecast error histogram (Fig. 14) with the
bimodal peak surrounding zero resulting from binning in Celsius temperature forecasts that are
available frequently asin integer Fahrenheit values. Comparing NDFD forecasts to the
observations suggests that the NDFD forecasts are more biased (-1.7oC ME), less accurate
(1.7oC MAE), and their errors relative to observations skewed more negatively than the spot
forecasts (Table 1 and Fig. 14). Overall, the RTMA temperatures exhibit a cool bias relative to
389
390
391
392
393
394
395
396
397
398
399
400
401
402
403
404
405
406
407
408
409
410
411
412
the verifying observations that leads the spot forecasts to appear to have higher temperatures
than the RTMA grid values.
Focusing on WFOs with at least 100 prescribed burn forecasts (Fig. 12a), the Phoenix
(PSR) and Tucson (TWC) CWAs are among the few that exhibit a warm bias in Fig. 15a, with
most CWAs exhibiting cool biases (e.g., particularly Reno, REV and Grand Junction, GJT).
WFOs in the western United States and those containing large sections of the Appalachian
Mountains tend toward higher MAE values than those in the Great Plains and the South (Fig.
15b). Both Melbourne, FL (MLB) and Springfield, MO (SGF) provide accurate exhibit high
temperature forecasts accuracy with MAEs of just 1.1oC. Only one forecast issued by
Springfield had a temperature error greater than 5oC out of 165 forecasts. The cool biases
evident in REV and GJT contribute to large MAE values for temperature as well (Fig. 15b).
Figure 16 tabulates the temperature errors of spot forecasts for prescribed burns compared
to those for NDFD forecasts. The values in the upper left bin are ones where the NDFD and
spot forecasts were accurate and the forecaster either made only minor changes of less than 1oC
(40.4%) or else they made slightly more substantive changes (18.8%). Of greater interest are the
sums excluding the upper left bin of: (1) the light shaded values in the left column (i.e., where
the forecasters made changes relative to the NDFD gridded values that resulted in accurate
forecasts) and (2) the dark shaded values in the uppermost row (i.e., where the NDFD forecasts
were accurate and the manual adjustments provided by the forecasters degraded the skillful
forecast available from the NDFD). For maximum temperature forecasts those values are 16.1%
compared to 6.5%, which suggests that the manual intervention by the forecasters improved the
spot forecast compared to NDFD forecasts by 9.6% (Table 2). Of particular note are the 2.8% of
the forecasts in Fig. 16a where the NDFD forecasts deviated from the verifying observations by
more than 7.5oC while the forecasters adjusted those values substantively and provided spot
forecasts within 2.5oC. .
413
414
415
416
417
418
419
420
421
422
423
424
425
426
427
428
429
430
431
432
433
434
435
436
437
As summarized in Table 1, spot forecasts for prescribed burns performed better than the
NDFD gridded forecasts for minimum relative humidity in terms of both bias (1.5% wet bias for
spot forecasts, 6.0% wet bias for NDFD) and accuracy (5.3% MAE for spot forecasts, 6.0% for
NDFD). The cumulative error histograms confirm the slight wet biases of both spot and NDFD
forecasts (Fig. 17). The RTMA grid values tend to have higher relative humidity than the
nearest observations that leads to the apparent dry bias of the spot forecasts relative to the
RTMA (Table 1).
Forecasters at most WFOs tend to have a wet bias (i.e., positive ME for most CWAs in Fig.
18a). Notable exceptions are Tucson discussed previously as well as Eureka (EKA; see
Lammers 2014 for discussion of relative humidity errors in the EKA CWA). The regions with
less accurate minimum relative humidity forecasts are those with generally higher relative
humidity values in general: the Pacific Coastal states, the Central Appalachian Mountains, and
parts of the Great Plains (Fig. 18b). CWAs in the desert southwest and other regions where
relative humidity values tend to be low exhibit higher accuracy in terms of MAE, e.g., . The top
office for relative humidity was Midland/Odessa (MAF) provided overall the most accurate
relative humidity forecasts. , due in part to the consistently dry conditions under which forecasts
are issued. The smaller the range of possible values for relative humidity, the less likely large
errors can occur.
As shown in Fig. 19, the assumption of accurate minimum relative humidity forecasts to be
within 5% of a nearby observation reduces the overall accuracy of both NDFD and spot
forecasts. Alternatively, one can simply assume an accuracy threshold of 10% and add the
percentages in the first two columns (rows) for the spot (and NDFD) forecasts. The relative
accuracy of the spot vs. NDFD forecasts for minimum relative humidity forecasts is less than
that for maximum temperature. Forecasters improved substantively upon 15.7% of the NDFD
438
439
440
441
442
443
444
445
446
447
448
449
450
451
452
453
454
455
456
457
458
459
460
461
forecasts and degraded 11%, which suggests an improvement in accuracy of 4.7% as a result of
forecasters adjusting the NDFD values for the nation as a whole (Table 2).
A smaller sample of 38,017 prescribed burn forecasts for maximum wind speed is available
due to the greater difficulty in parsing the spot wind speed forecasts. As evident in Table 1, both
spot and NDFD forecasts exhibit slight overforecasting errors (ME values of 0.2 m s-1 and 0.4 m
s-1, respectively). Validating maximum wind speed forecasts relative to the RTMA rather than
nearby observations leads to similar ME and MAE values (Table 1). The positive biases are also
evident in the histograms in Fig. 20 although the values appear slightly shifted to the left simply
because the values are plotted at the lower edges of the 1 m s-1 bins. The positive biases
apparent for the larger number of prescribed burns in the western CWAs dominate over the
CWAs in the central and eastern United States with negative biases calculated from smaller
sample sizes (Fig. 21a). There is less regional homogeneity in terms of MAE, although Rocky
Mountain offices are slightly less accurate (Figure 21b). Jackson, MS WFO (JAN) issued the
most accurate maximum wind speed forecasts, with a MAE value Median Absolute Error of
only 0.85 m s-1 over 537 forecasts. As evident in the upper left bin in Fig. 22, accurate forecasts
were provided 65.1% of the time by both the prescribed burn spot and NDFD forecasts.
Adjustments by the forecasters for 11% of the poor NDFD forecasts result in accurate spot
forecasts although modifications to 9.4% of the NDFD forecasts degraded them (Table 2).
Briefly summarizing the spot forecasts provided for wildfires, the maximum temperature
forecasts overall have a -0.3oC ME while the NDFD forecast errors are more negatively skewed
with a cool bias of -1.5oC (Table 1). The MAE of the wildfire spot (NDFD) forecasts versus the
observations is 1.7oC (2.0oC), suggesting that the wildfire spot forecasts improve upon NDFD
gridded values for maximum temperature (Table 1). As shown in Table 2, 66.6% (59.1%) of
the wildfire spot (NDFD) maximum temperature forecasts are judged to be accurate (within
2.5oC of nearby observations), reflecting a substantive improvement of accuracy for 7.5% of the
462
463
464
465
466
467
468
469
470
471
472
473
474
475
476
477
478
479
480
481
482
483
484
485
486
wildfire forecasts. As shown in Table 1, the ME for wildfire spot relative humidity forecasts is
only 0.7%, while NDFD forecasts have a ME of 4.1% with a 1.05% lower MAE for spot
forecasts compared to NDFD forecasts. Forecasters provided accurate minimum relative
humidity forecasts 51.3% of the time, an increase of 3.8% compared to NDFD forecasts (Table
2).
Forecasting maximum wind speed effectively is crucial for containing and combatting
wildfires, especially in their early stages. As shown in Table 1, the ME for spot (NDFD)
forecasts is 0.7 m s-1 (0.8 m s-1) and corresponding MAE values of 1.5 m s-1 (1.6 m s-1),
respectively. All of the Western United States offices save San Diego have positive biases for
wind speed, while the Eastern offices have varying ME values (not shown). Similar to the
prescribed burn maximum wind speed forecasts, 58.2% of the wildfire maximum wind speed
forecasts supplied by the NDFD grids are equally accurate to those provided by the spot
forecasts (Table 2). Adjustments to the NDFD grid values by the forecasters provided only a net
increase in accurate forecasts of 1.6%.
5. Conclusions
The objective of this study was to develop a framework to evaluate spot forecasts for the
benefit of the forecasters who provide them as well as the fire and emergency management
professionals who request them. While commercial software is available for individuals to
quantify metrics and distributions of forecast errors, flexible open source web tools were
developed to allow users to evaluate the cases of interest to them, which helps identify the
causes and ramifications of forecast errors. To implement these verification tools is beyond the
scope of this study and requires transitioning or developing similar capabilities in an operational
entity, such as the NWS Performance Branch.
487
488
489
490
491
492
493
494
495
496
497
498
499
500
501
502
503
504
505
506
507
508
509
510
511
Spot forecasts are integral to the current fire management system in place in the United
States. They guide officials in prescribed burn and wildfire decision making, helping to protect
life and property. As shown in this research, spot forecasts have added skill above the gridded
guidance issued by forecast offices in forecasting for specific locations the daily maximum
temperature, minimum relative humidity, and maximum sustained wind speed. There remain
areas for improvement in both the forecasting process and our verification techniques, but we
have shown that these text products can be verified in an automated and systematic manner, and
that meaningful information can be extracted by such verification to help forecasters and end
users alike.
a. Prescribed Burn and Wildfire Spot Forecasts
Prescribed burns are anticipated in management plans developed by wildland fire
management officials at lead times of months or even years for publicly owned locations.
Wildfires are spontaneous and can occur anywhere there is fuel to burn. Forecasters are called
upon to provide detailed forecasts conditions for both types of fires. Because of the need for
immediate assessment of potential fire danger, wildfire forecasts are turned around quickly,
with 71% having lead time (the difference between the recorded receipt of the request and spot
forecast issuance) less than 50 minutes. For prescribed burns, only 27% are issued in 50 minutes
or less from the recorded receipt of the request, suggesting that forecasters have more time to
evaluate the forecast situation.
An objective of this study was to assess the specific guidance provided by the forecasters
relative to that available from the grids they develop for more general purposes that are archived
as part of the NDFD. This evaluation is far from a comprehensive evaluation of the skill of the
spot forecasts, since it is restricted to assessing the spot forecasts of temperature, relative
512
513
514
515
516
517
518
519
520
521
522
523
524
525
526
527
528
529
530
531
532
533
534
535
536
humidity, and wind speed during the afternoon relative to NDFD grids available earlier in the
day at 0900 UTC. Every summary metric (e.g., see Tables 1 and 2) indicates that the accuracy
of spot forecasts is higher than that of the values obtained from the NDFD grids for both
prescribed burns and wildfires. The improvement is largest for maximum temperature (9.6%
and 7.5% for prescribed burns and wildfires, respectively) and lowest for maximum wind speed
(1.6% for both categories). While forecasters often adjust their forecasts to deviate from the
NDFD values, those adjustments do not display substantial improvement for maximum wind
speed while adding considerable value for maximum temperature.
b. Recommendations
Forecast verification is a continual, ongoing process. Tools must be in place that make it
possible for the forecasters and users of the forecasts to quickly examine cases and aggregate
statistics of interest to them using their experience and local knowledge, rather than depending
on bulk statistical metrics accumulated on national scales as summarized in this study. In order
to develop useful verification tools for spot forecasts operationally requires minimizing some of
the underlying limitations identified during this study.
The principal recommendation of this study is to leave the decisions as to what to verify and
how to verify the forecasts in the hands of the forecasters and end users by developing flexible
methods to explore the multidimensional nature of the forecasts. Foremost is simply the need to
be able to examine the following in a centralized framework: the requests, the forecasts,
geolocation information, and nearby observations and other information relevant to analyzing
the forecast situation. While this may seem obvious, it has never been possible before this study
developed such capabilities. Then, the user should be able to explore and control interactively
537
538
539
540
541
542
543
544
545
546
547
548
549
550
551
552
553
554
555
556
557
558
559
560
561
key parameters (e.g., distance to the verifying observations, forecast lead times, magnitudes of
the parameters, or magnitudes of the errors). Currently, much of the verification performed on
the federal level centers on aggregate statistics that fail to capture the nuance necessary for
evaluating spot forecasts. In order to make the tools described in this study more appropriate
for operational use, several limitations need to be overcome as summarized here and detailed
below:
• Isolate quantitative numerical values separately from qualitative alphabetical descriptors.
• Make forecast wind level a numerical parameter adjustable within the request form, so that
even when it is not “20-Foot,” the level is known for evaluation.
• Store the name of or abbreviation referencing the specific station that should be used for
verification as part of the request form. This should include stations from networks not used in
this study.
• Evaluate other variables
• Expand the verification time window.
1) SEPARATE NUMERICAL VALUES AND TEXT IN THE SPOT FORECAST
As every WFO coordinates locally with its user community to specify the fields to be
included in the spot request, creating a text parser that correctly captures the intention of the
forecasts on a national basis is a complex and frustrating endeavor. The parsing algorithms
developed here occasionally still fail either by eliminating forecasts from consideration (most
often for wind speed) or populating spurious values for verification. Forecasters and end users
need to evaluate all forecasts, otherwise the utility of the verification process is undermined. Of
course, the factors that make parsing difficult add value for fire and emergency management
professionals, contributing layers of detail on timing and variability that help to make critical
562
563
564
565
566
567
568
569
570
571
572
573
574
575
576
577
578
579
580
581
582
583
584
585
586
personnel and containment decisions. This free form information should not be removed from
the spot forecasts, nor should all the requests be standardized into a single request form on a
national basis. Rather, alternative methods to separate the basic numerical information from the
free form information should be straightforward to implement.
2) IMPROVE CONSISTENCY IN THE REQUEST FORM
The adjustments required during this study to capture all the variations to simply define the
height of the wind forecasts should be avoided in the future. Initially, it was assumed after
inspection of many request and forecast pairs that to parse maximum wind speed from the
forecasts required searching for “20 FOOT” or “20 FT.” However, forecast offices changed
over time their definitions (e.g., the Salt Lake City WFO in late-2010 switched to “20-FOOT”
while others switched to 20FT) or, due to requests from their users, other offices use “EYE
LEVEL” (Boise) or “GENERAL” (Marquette). Presumably, in the latter cases, communication
with those specific user communities could lead to standardization of what is provided to them.
More generally, the level of the wind should be specified in the request form (not input or
selectable independently by the forecaster in the spot forecast) so that the values provided in the
spot forecast are numerical values supplemented by the height descriptor from the request form.
3) ALLOW USERS TO SPECIFY THE VERIFICATION DATA
The number of forecasts that were not analyzed in this study because of lack of nearby
observations was relatively small because observations at often large distances from the spot
location were allowed to be used (up to 50 km). Apparent systematic biases when verifying the
forecasts relative to the RTMA values (Table 1) suggest that verifying the spot forecasts relative
587
588
589
590
591
592
593
594
595
596
597
598
599
600
601
602
603
604
605
606
607
608
609
610
611
to nearby observations remains the best approach at this time. However, evaluating spot
forecasts particularly in complex terrain necessitates allowing users to ascertain which
observations to use. This study and the web tools developed for it relied only on NWS/FAA and
RAWS observations to take advantage of their established maintenance and siting standards.
The Meteorological Assimilation Data Ingest System (MADIS) and MesoWest currently
aggregate observations from over 20,000 other locations from government agencies,
commercial firms, and the public, which allow for more widespread areal coverage and
increased likelihood of a nearby observation to be closer to the spot location. However, using
these other observations introduces greater uncertainty as to maintenance of the sensors, siting,
etc. Nevertheless, with further development, the web tools that were developed here could be
expanded to include features allowing forecasters and users to see a wider variety of
observations against which they could compare their forecast rather than just the closest
NWS/FAA or RAWS station.
4) EVALUATE OTHER VARIABLES
As can be seen from Fig. 4, there are many other atmospheric variables and indices that
forecast offices include in their spot forecasts. Efforts are currently underway by researchers at
the Desert Research Institute to assess and verify upper-air variables (specifically Haines Index,
Clearing Index, and Transport Winds) that play a significant role in smoke dispersion. The
intention is to use upper-air soundings and model reanalysis data to provide a similarly designed
web based system to the one that has been developed for this research. If more WFOs chose to
provide their spot forecasts with time series of forecast values at regular intervals (hourly or 3-
hourly) rather than simply maxima or minima or conditions specific generally in local times
612
613
614
615
616
617
618
619
620
621
622
623
624
625
626
627
628
629
630
631
632
633
634
635
(e.g., early or late afternoon), then verification of such products would be simpler. The GFE in
AWIPS is likely capable of auto-populating such fields.
Evaluating the Discussion section, likely the most important part of the spot forecast to the
end user, will be difficult to perform objectively. However, increased efforts should be made to
have fire and emergency management personnel take advantage of the web form available to
them to provide feedback and critique forecast guidance. At the present time, it is not possible
using that form to tie specific comments made by an end user to the guidance for which the
feedback relates.
5) EXPAND THE VERIFICATION TIME WINDOW
While this research focused entirely on verification for daytime forecasts that appeared in
the first time frame of the forecast, it is not unreasonable that a similar process could provide
assessments for the subsequent two periods often present in these forecasts. A more robust
parsing system could also easily differentiate between nighttime forecasts, which focus on
minimum temperature and maximum relative humidity. Based on our findings concerning the
quality of spot forecasts relative to NDFD grids, it would be useful to discern how that skill
extends through 24 and 36 hours. Forecasts could also be compared to assess how often and
under what conditions offices adjust them in subsequent forecast periods. For example, a
forecast issued for a prescribed burn on Monday morning might anticipate a maximum
temperature of 24oC for Tuesday (the third forecast period in the spot forecast), a value which is
modified in a subsequent forecast to 28oC. Whether that modification improved the forecast or
not is useful for understanding the thought process of a forecaster.
636
637
638
639
640
641
642
643
644
645
646
647
648
649
650
651
652
653
654
655
656
657
658
659
Acknowledgements. We would like to thank the members of the MesoWest group at the
University of Utah for their assistance with accessing the database of surface observations and
gridded datasets. Feedback from NWS forecasters and regional managers provided important
insight on the diverse issues associated with formulating spot forecasts. We also thank Virgil
Middendorf from NWS Billings WFO for providing all of the spot forecasts and their requests.
Funding for this project was provided by the Joint Fire Science Program under grant 12-1-05-3.
_____________________________
REFERENCES
Andra, Jr., D.L., E.M. Quoetone, and W.F. Bunting, 2002: Warning decision making: the
relative roles of conceptual models, technology, strategy, and forecaster expertise on 3 May
1999. Wea. Forecasting, 17, 559-566.
Brown, B.G., and A.H. Murphy, 1987: Quantification of uncertainty in fire-weather forecasts:
some results of operational and experimental forecasting programs. Wea. Forecasting, 2,
190-205.
Calkin, D.E., J.D. Cohen, M.A. Finney, and M.P. Thompson, 2014: How risk management can
prevent future wildfire disasters in the wildland-urban interface. Proceedings of the
National Academy of Sciences (PNAS), 111 (2), 746-751.
Calvert, E.B., 1925: Weather forecasting as an aid in preventing and controlling forest fires.
Mon. Wea. Rev., 53, 187-190.
De Pondeca, M.S.F.V, G.S. Manikin, G. DiMego, S.G. Benjamin, D.F. Parrish, R.J. Purser,
W.S. Wu, J.D. Horel, D.T. Myrick, Y. Lin, R.M. Aune, D. Keyser, B. Colman, G. Mann, J.
Vavra, 2011: The Real-Time Mesoscale Analysis at NOAA’s National Centers for
Environmental Prediction: current status and development. Wea. Forecasting, 26 (5), 593-
660
661
662
663
664
665
666
667
668
669
670
671
672
673
674
675
676
677
678
679
680
681
682
612.
Glahn, H.R., and D.P. Ruth, 2003: The new digital forecast database of the National Weather
Service. Bull. Amer. Met. Soc., 84 (2), 195-201.
Hansen, T., M. Mathewson, T.J. LeFebvre, and M. Romberg, 2001: Forecast meteorology using
the GFESuite. 17th International Conference on Interactive Information Processing Systems
for Meteorology, Oceanography, and Hydrology, Albuquerque, NM, American
Meteorological Society, 42-46. [Available online at
http://gfesuite.noaa.gov/publications/papers/IIPS/2001/TracyAMS2001.pdf.]
Hirschberg, P.A., and E. Abrams, eds., 2011: A weather and climate enterprise strategic
implementation plan for generating and communicating forecast uncertainty information.
American Meteorological Society, 91 pp. [Available online at
www.ametsoc.org/boardpges/cwce/docs/BEC/ACUF/2011-02-20-ACUF-Final-
Report.pdf.].
Horel, J., M. Splitt, L. Dunn, J. Pechmann, B. White, C. Ciliberti, S. Lazarus, J. Slemmer, D.
Zaff, and J. Burks, 2002: Mesowest: cooperative mesonets in the western United States.
Bull. Amer. Met. Soc., 83 (2), 211-225.
Horel, J., and X. Dong, 2010: An evaluation of the distribution of Remote Automated Weather
Stations (RAWS). Journal of Appl. Meteor. and Clim., 49, 1563-1578.
Horel, J., R. Ziel, C. Galli, J. Pechmann, X. Dong, 2014: An evaluation of fire danger and
behavior indices in the Great Lakes region calculated from station and gridded weather
information. International Journal of Wildland Fire, 23, 202–214.
Ingold, J., 2012: Deal reached on paying Lower North Fork Fire victims. The Denver Post.
683
684
685
686
687
688
689
690
691
692
693
694
695
696
697
698
699
700
701
702
703
704
Jolliffe, I.T. and D.B. Stephenson, 2003: Forecast Verification: A Practitioner’s Guide in
Atmospheric Science. Chichester, UK: Wiley & Sons. 240 pp.
Lammers, M.R, 2014: Verification of National Weather Service Sspot Fforecasts Uusing
Ssurface Oobservations. MS Thesis. University of Utah, Salt Lake City, UT. 131 pp.
Mathewson, M. A., 1996: Using the AWIPS forecast preparation system (AFPS). Preprints,
Twelfth International Conference on Interactive Information and Processing Systems for
Meteorology, Oceanography, and Hydrology, Atlanta, GA, American Meteorological
Society. [Available online at
http://gfesuite.noaa.gov/publications/papers/IIPS/Mark96/MarksAMSPaper.html.]
Morss, R.E., and F.M Ralph, 2007: Use of information by National Weather Service forecasters
and emergency managers during CALJET and PACJET-2001. Wea. Forecasting, 22, 539-
555.
Murphy, A.H., and R.L. Winkler, 1986: A general framework for forecast verification. Mon.
Wea. Rev., 115, 1330-1338.
Murphy, A.H., 1991: Forecast verification: its complexity and dimensionality. Mon. Wea. Rev.,
119, 1590–1601.
Myrick, D.T., and J.D. Horel, 2006: Verification of surface temperature forecasts from the
National Digital Forecast Database over the western United States. Wea. Forecasting, 21
(5), 869-892.
NOAA SAB, 2008: Fire weather research: a burning agenda for NOAA. National
Oceanographic and Atmospheric Administration. [Available online at
http://www.sab.noaa.gov/Reports/2008/FWRWGreportFINALfromSABtoNOAA_11_03_0
705
706
707
708
709
710
711
712
713
714
715
716
717
718
719
720
721
722
723
724
725
726
8.pdf.]
Stuart, N. A., D. M. Schultz, G. Klein, 2007: Maintaining the role of humans in the forecast
process: Analyzing the psyche of expert forecasters. Bull. Amer. Meteor. Soc., 88, 1893–
1898.
USFS, 2012: Box Creek Prescribed Fire Escape – Facilitated Learning Analysis. Fishlake
National Forest. 26 pp. [Available online at http://wildfirelessons.net/
Communities/Resources/ViewIncident/?DocumentKey=4ad53aa2-14d6-4244-a32c-
ed87a3a63ec6.]
USFS, 2014: Facilitated Learning Analysis Implementation Guide. 49 pp. [Available online at
http://www.wildfirelessons.net/communities/resources/viewdocument/ ?
DocumentKey=180d1fad-7c2d-4f46-98a5-89e75c5443d1.]
Wildland Fire Lessons Learned Center, 2013: 2012 Escaped Prescribed Fire Review Summary.
12 pp. [Available online at
http://wildfirelessons.net/Communities/Resources/ViewIncident/?
DocumentKey=8bcbdeb7-875e-48ef-96ed-7d43ff602eb2.]
Wilks, D.S. 2011. Statistical Methods in the Atmospheric Sciences, 3rd Ed. San Diego, CA:
Elsevier, Inc. 676 pp.
727
728
729
730
731
732
733
734
735
736
737
738
739
740
741
742
743
31
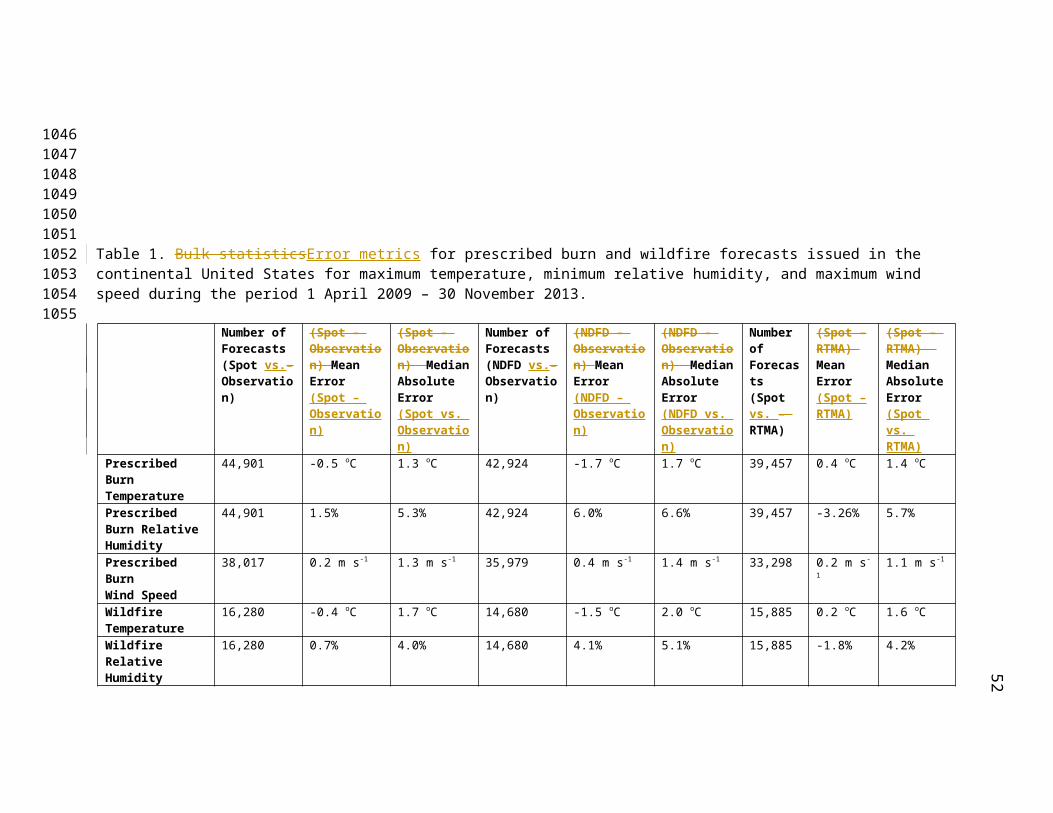
Table 1. Bulk statisticsError metrics for prescribed burn and wildfire forecasts issued in the continental United States for maximum temperature, minimum relative humidity, and maximum wind speed during the period 1 April 2009 – 30 November 2013.
Number of Forecasts (Spot vs.– Observation)
(Spot – Observation) Mean Error(Spot – Observation)
(Spot – Observation) Median Absolute Error(Spot vs. Observation)
Number of Forecasts (NDFD vs.– Observation)
(NDFD – Observation) Mean Error(NDFD – Observation)
(NDFD – Observation) Median Absolute Error(NDFD vs. Observation)
Number of Forecasts (Spot vs. – RTMA)
(Spot – RTMA) Mean Error(Spot – RTMA)
(Spot – RTMA) Median Absolute Error(Spot vs. RTMA)
Prescribed Burn Temperature
44,901 -0.5 oC 1.3 oC 42,924 -1.7 oC 1.7 oC 39,457 0.4 oC 1.4 oC
Prescribed Burn Relative Humidity
44,901 1.5% 5.3% 42,924 6.0% 6.6% 39,457 -3.26% 5.7%
Prescribed BurnWind Speed
38,017 0.2 m s-1 1.3 m s-1 35,979 0.4 m s-1 1.4 m s-1 33,298 0.2 m s-1 1.1 m s-1
WildfireTemperature
16,280 -0.4 oC 1.7 oC 14,680 -1.5 oC 2.0 oC 15,885 0.2 oC 1.6 oC
Wildfire Relative Humidity
16,280 0.7% 4.0% 14,680 4.1% 5.1% 15,885 -1.8% 4.2%
WildfireWind Speed
8,860 0.7 m s-1 1.5 m s-1 8,075 0.8 m s-1 1.6 m s-1 8,872 0.3 m s-1 1.4 m s-1
744745746747748749750751752
753754755756757758759760
32
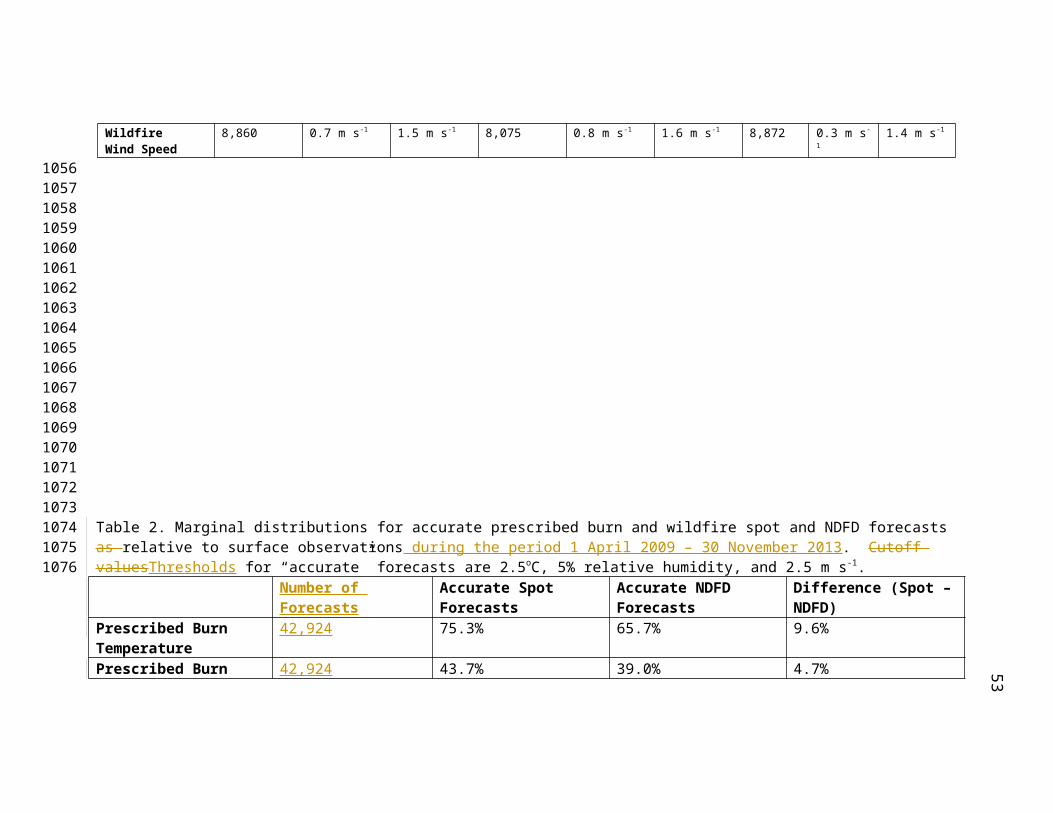
Table 2. Marginal distributions for accurate prescribed burn and wildfire spot and NDFD forecasts as relative to surface observations during the period 1 April 2009 – 30 November 2013. Cutoff valuesThresholds for “accurate” forecasts are 2.5oC, 5% relative humidity, and 2.5 m s-1.
Number of Forecasts Accurate Spot Forecasts Accurate NDFD Forecasts
Difference (Spot – NDFD)
Prescribed Burn Temperature
42,924 75.3% 65.7% 9.6%
Prescribed Burn Relative Humidity
42,924 43.7% 39.0% 4.7%
Prescribed Burn Wind Speed
35,979 76.1% 74.5% 1.6%
Wildfire Temperature 14,680 66.6% 59.1% 7.5%Wildfire Relative Humidity
14,680 53.3% 49.5% 3.8%
Wildfire Wind Speed 8,075 70.4% 68.8% 1.6%
761762763764765766767768769770771772
773774775776777778
779
33
a) b)
c) d)
780
781
782
783
784
785
786
787
788
789
790
791
792
793
794795796797798
34
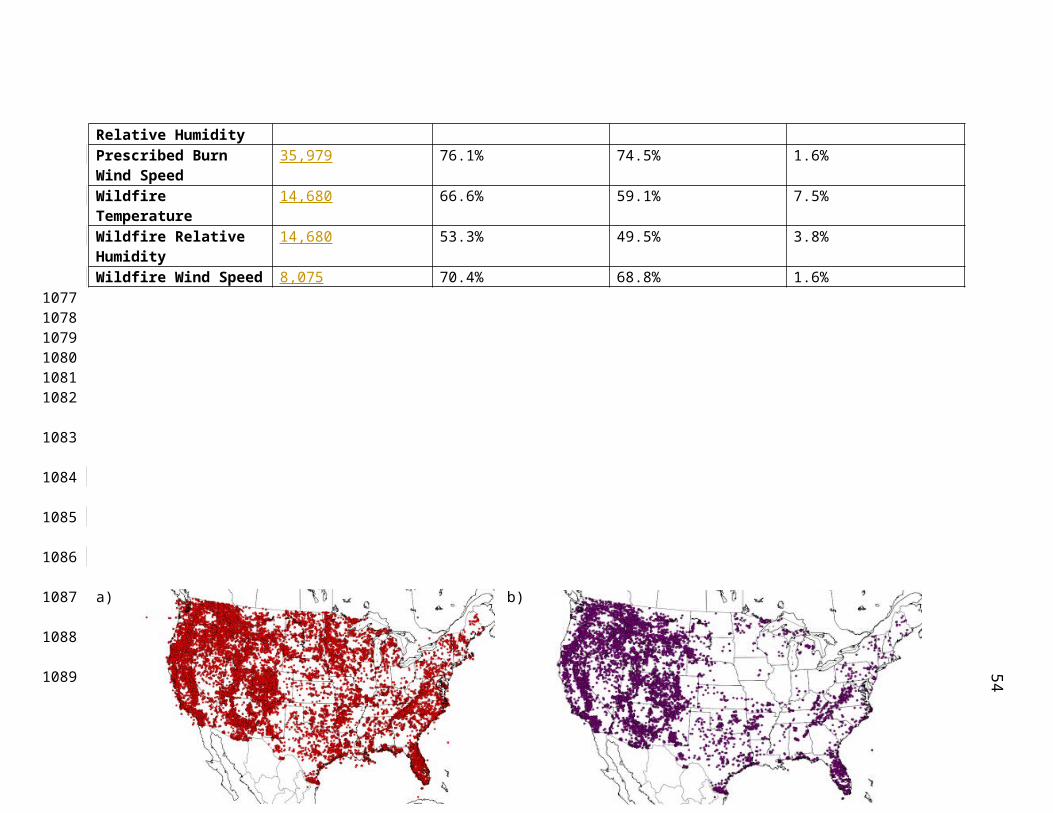
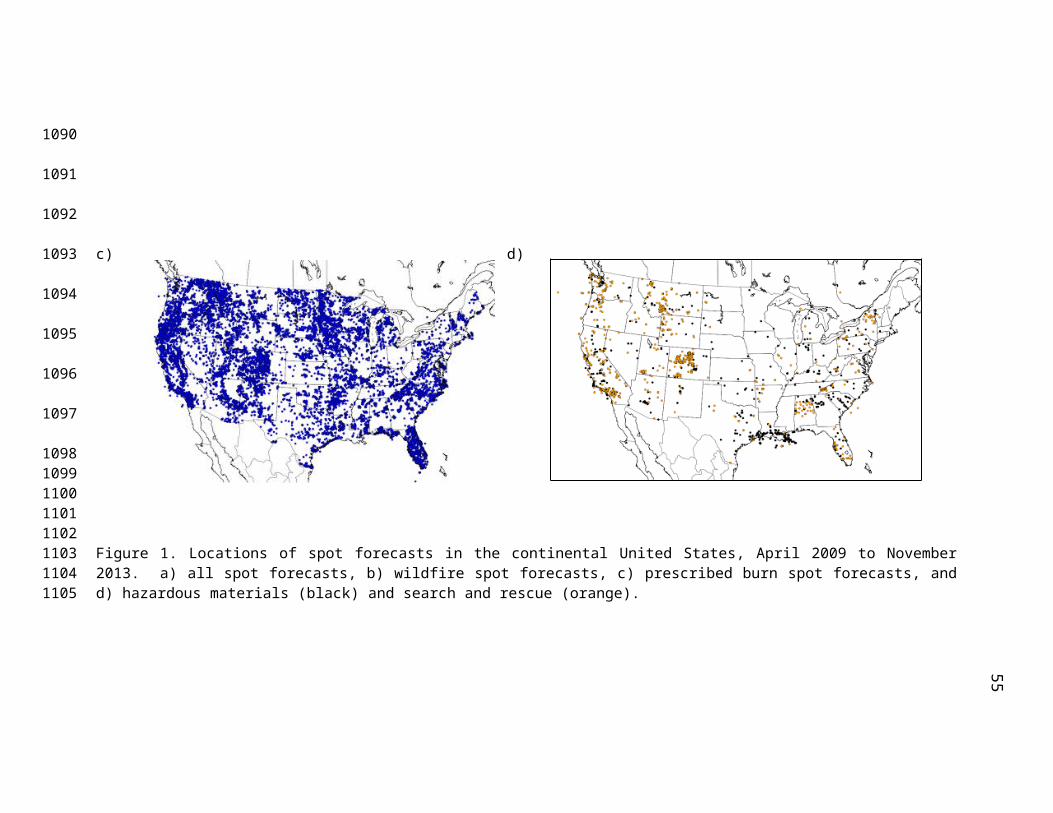
Figure 1. Locations of spot forecasts in the continental United States, April 2009 to November 2013. a) all spot forecasts, b) wildfire spot forecasts, c) prescribed burn spot forecasts, and d) hazardous materials (black) and search and rescue (orange).
799800
35
Figure 2. The online spot forecast request form for Salt Lake City (SLC) WFO.
801
802
803
804
805
806
807
808
36
Figure 3. Example request form for Patch Springs Wildfire, 20 August 2013.
809
810
811
812
37
Figure 4. Example spot forecast from Patch Springs Wildfire, 20 August 2013.
813
814
38
Figure 5. Locations of NWS/FAA and RAWS stations in MesoWest.
815
816
817
818
819
820
821
39
Figure 6. Illustration of the map section of the web tools available at http://meso1.chpc.utah.edu/jfsp/ . Shown are markers for prescribed burn spot forecasts issued in the southern Appalachian Mountains on 1 April 2014. Upon clicking a marker, a box appears containing information about the spot forecast and the verification values, in this case for the Barker II Prescribed Burn. This box also contains links to the MesoWest page for the verifying station and to the spot forecast itself.
822
823824825826
40
a)
b)
c)
Figure 7. Forecasts and verifying data during the Box Creek prescribed burn and subsequent wildfire. Data are for a) maximum temperature (oC), b) minimum relative humidity (%), and c) maximum wind speed (m s-1).
827828829830831832833834835836837838839840841842843844845846847848849850851852853
854
855
856857858859860861862863864
41
a) b)
c) d)
e) f)
Figure 8. Histograms of differences between Box Creek spot forecasts and observations at TT084. Histograms are for a) maximum temperature (oC), c) minimum relative humidity, and e) maximum wind speed (m s-1); b) as in a) except verified against the RTMA, d) as in c) except verified against the RTMA, and f) as in e) except verified against the RTMA.
865
866
867
868
869
870
871
872
873
874
875
876
877
878
879
880
881
882
883
884885886887888889890891892893
42
a)
b)
894
895
896
897
898
899
900
901
902
903
904
905
906
907
908
909
910
911
912
913
914
915
916
917
918
43
c)
Figure 9. Count of the number of cases for absolute differences between spot forecasts and observations (columns) and NDFD forecasts and observations (rows) for the Box Creek case for: a) maximum temperature (oC), b) minimum relative humidity (%), and c) maximum wind speed (m s-1). Marginal counts for the spot (NDFD) errors are shown in the bottom column (right row). Values above (below) the diagonal lines in each bin indicate spot forecasts that are within (greater than) specified ranges of the NDFD forecast values. These ranges are 1oC, 5%, and 1 m s-1 of the NDFD forecast for temperature, relative humidity, and wind speed, respectively. Each marginal count is also separated into values differentiating between spot forecasts within (outside) the specified ranges of the NDFD values. Light (dark) shading denotes the cases where forecasters provided accurate (inaccurate) forecasts when the NDFD forecasts were inaccurate (accurate).
919
920
921
922
923
924
925
926
927928929930931932933934935936937938939940941942943944945946947948949950951952953954955956957958
44
a) b)
c) d)
Figure 10. Histograms of errors for prescribed burn spot forecasts for the Tucson CWA: a) maximum temperature (oC), b) minimum relative humidity (%). c) As in a) except for NDFD forecasts. d) As in b) except for NDFD forecasts.
959960961962963964
966
968969970971
45
a)
b)
c)
972973
974
975
976
977
978
979
980
981
982
983
984
985
986
9879889899909919929939949959969979989991000100110021003100410051006
46
Figure 11. Percentages of the total number of cases for absolute differences between spot forecasts and observations (columns) and NDFD forecasts and observations (rows) for Tucson WFO prescribed burn forecasts for: a) maximum temperature; b) minimum relative humidity; c) maximum wind speed. Marginal percentages for the spot (NDFD) errors are shown in the bottom column (right row). Values above (below) the diagonal lines in each box indicate the percent of the spot forecasts that are within (greater than) specified ranges of the NDFD forecast values. These ranges are 1oC, 5%, and 1 m s-1 of the NDFD forecast for temperature, relative humidity, and wind speed, respectively. Each marginal percentage is also separated within the parentheses into values differentiating between spot forecasts within (outside) the specified ranges of the NDFD values. Light (dark) shading denotes the cases where forecasters provided accurate (inaccurate) forecasts when the NDFD forecasts were inaccurate (accurate).
1007
1008
1009
1010
1011
1012
1013
1014
1015
1016
1017
101810191020102110221023102410251026102710281029103010311032103310341035
47
Figure 12. a) Number of prescribed burn spot forecasts analyzed as a function of CWA, April 2009 to November 2013. NWS abbreviation for each WFO is indicated.
1036
1037
1038
10391040104110421043
48
b) As in Figure a), but for spot forecasts issued for wildfires.
1044
1045
1046
1047
1048
1049
49
a)
b)
a)
b)
1050
1051
1052
1053
1054
1055
1056
1057
1058
1059
1060
1061
1062
50
Figure 13. a) Prescribed burn spot forecasts by month, b) as in a), but for wildfire spot forecasts.
1064
1065
1066
1067
1068
1069
1070
51
a) b)
Figure 14. All maximum temperature errors (oC) for prescribed burn forecasts for: a) spot forecasts and b) NDFD forecasts.
1071
1072
107310741075
1076
52
a)
b)
Figure 15. a) Mean error (ME) for prescribed burn spot forecasts for maximum temperature (oC) as a function of CWA. b) As in a) except for median absolute error (MAE).
1077
1078
1079
1080
108110821083
53
Figure 16. As in Figure 9a, but for forecasts from all CWAs.
1084
1085
1086
1087
54
a) b)
Figure 17. As in Figure 14, but for minimum relative humidity (%).
1088
1089
1090
1091
1092
1093
55
a)
b)
Figure 18. As in Figure 15, but for minimum relative humidity (%).
1094
1095
1096
1097
1098
1099
56
Figure 19. As in Figure 9b, but for minimum relative humidity (%) forecasts from all CWAs.
1100
1101
1102
11031104
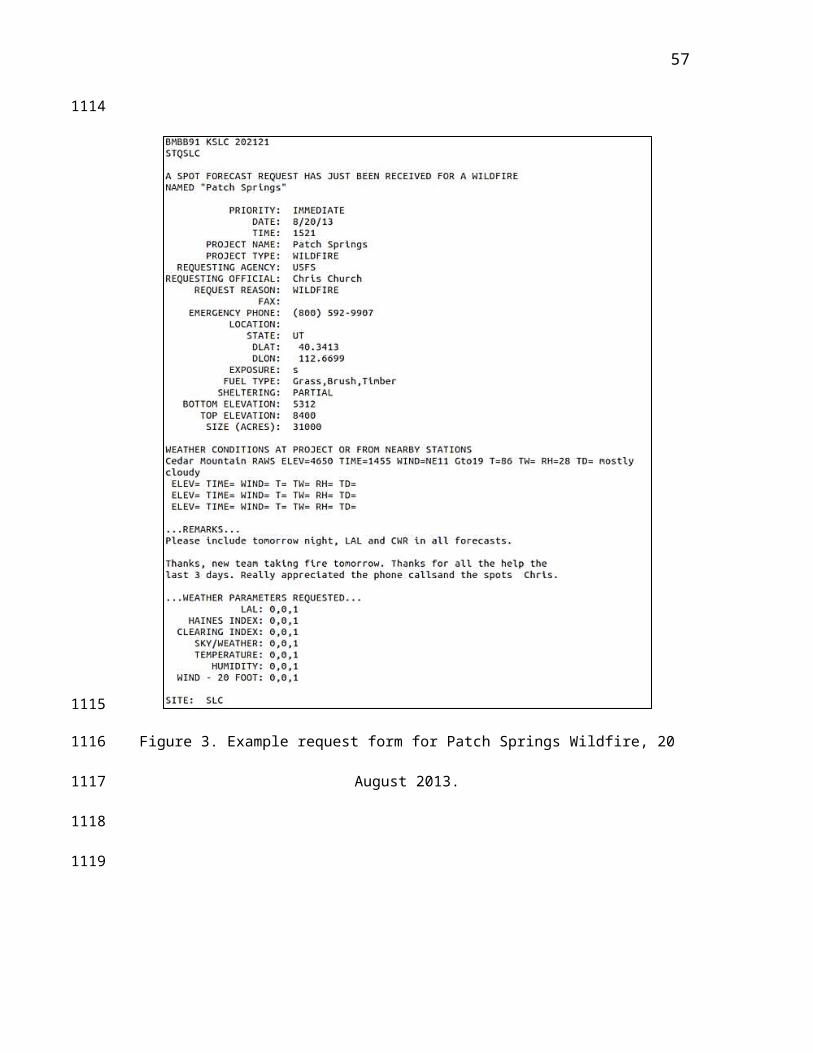
57
a) b)
Figure 20. As in Figure 14, but for maximum wind speed (m s-1).
1105
1106
1107
1108
1109
1110
1111
1112
1113
1114
1115
1116
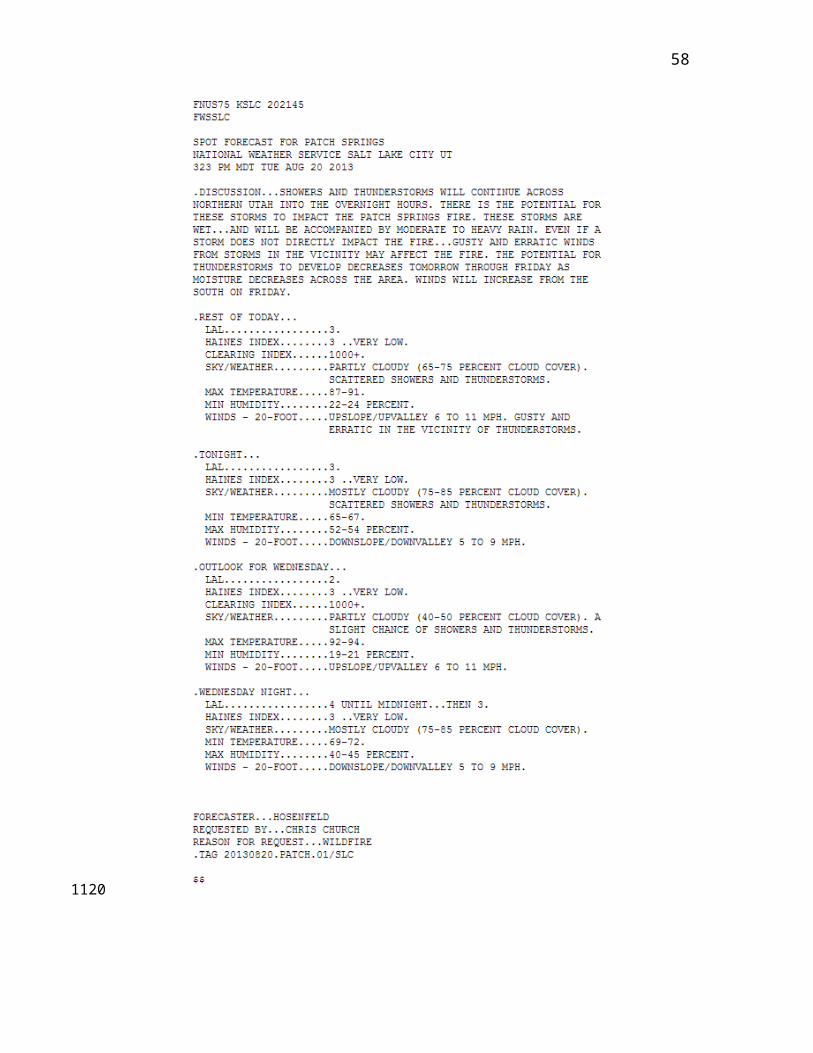
58
a)
b)
Figure 21. As in Figure 15, but for maximum wind speed (m s-1).
1117
1118
1119
1120
11211122
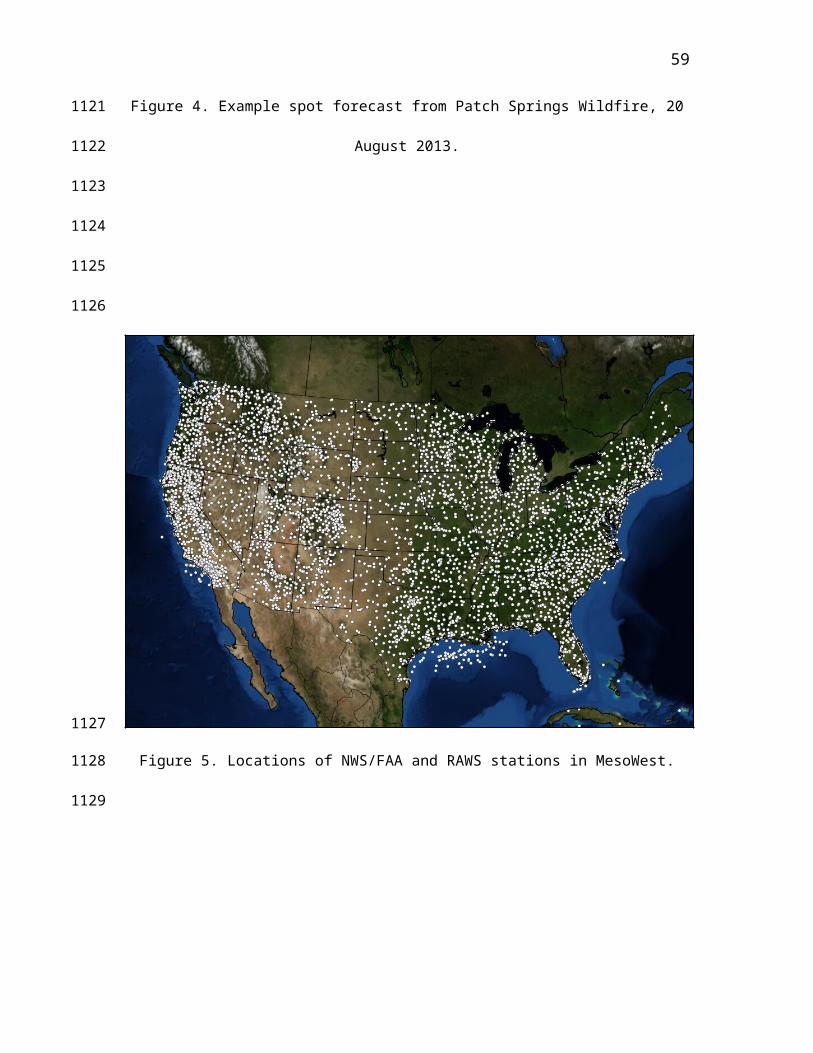
2
Figure 22. As in Figure 16, but for maximum wind speed (m s-1) forecasts from all CWAs.
1123
1124
1125
11261127
1128