Embed Size (px)
Citation preview
Jorge Amaya / Roberto R0mán
CMM
CMM Team: J. Amaya, R. Román, P. Orellana, P. Uribe
Final Conference
31st March 2015, Brussels
Summary Tool description
Characteristics
Inputs
Outputs
Energy Model
Thermal Model
Speed Model
Traction Model
Vehicle Model
Demo 31 march 2015 2
The OSIRIS concept is to develop Optimal Strategies to Innovate and Reduce energy consumption In urban rail Systems by implementing technologies and operational
solutions and tools, whilst testing/demonstrating/assessing their individual and combined benefits in real case scenarios.
OSIRIS Tool has been developed by the Center of Mathematical Modeling in the context of the collaborative research within the OSIRIS Consortium, with contributions from partners
31 march 2015 3
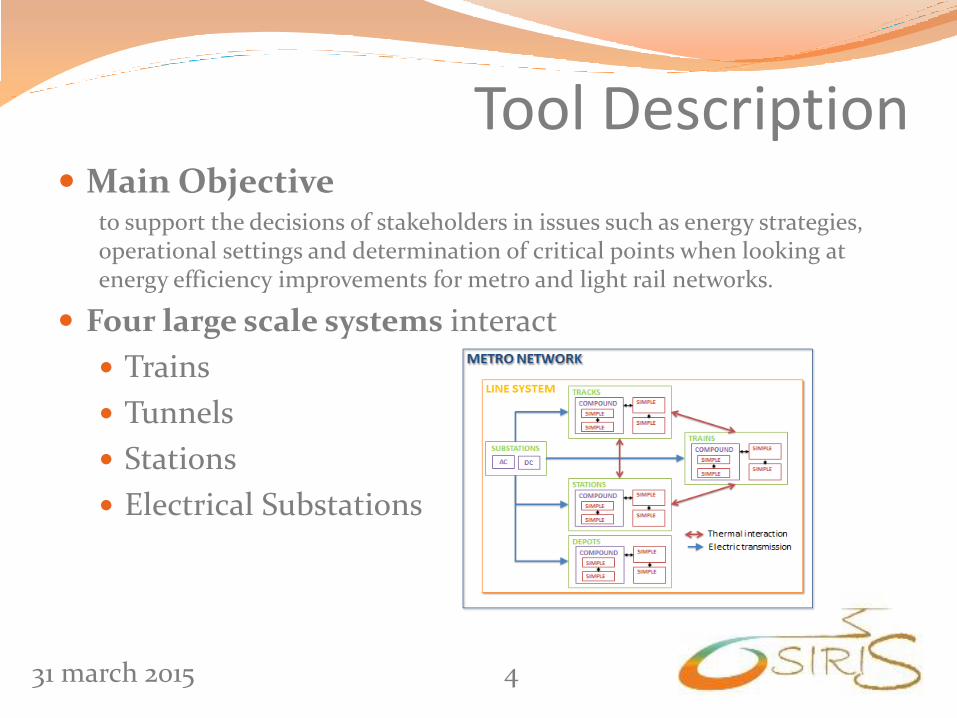
Tool Description Main Objective
to support the decisions of stakeholders in issues such as energy strategies, operational settings and determination of critical points when looking at energy efficiency improvements for metro and light rail networks.
Four large scale systems interact
Trains
Tunnels
Stations
Electrical Substations
31 march 2015 4
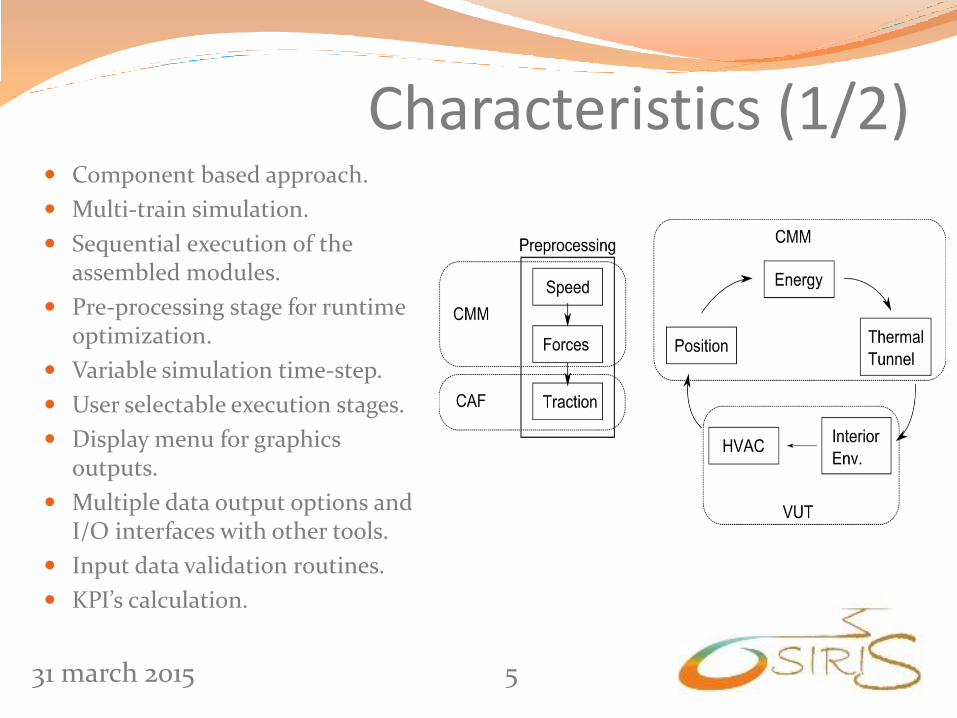
Characteristics (1/2) Component based approach.
Multi-train simulation.
Sequential execution of the assembled modules.
Pre-processing stage for runtime optimization.
Variable simulation time-step.
User selectable execution stages.
Display menu for graphics outputs.
Multiple data output options and I/O interfaces with other tools.
Input data validation routines.
KPI’s calculation.
31 march 2015 5
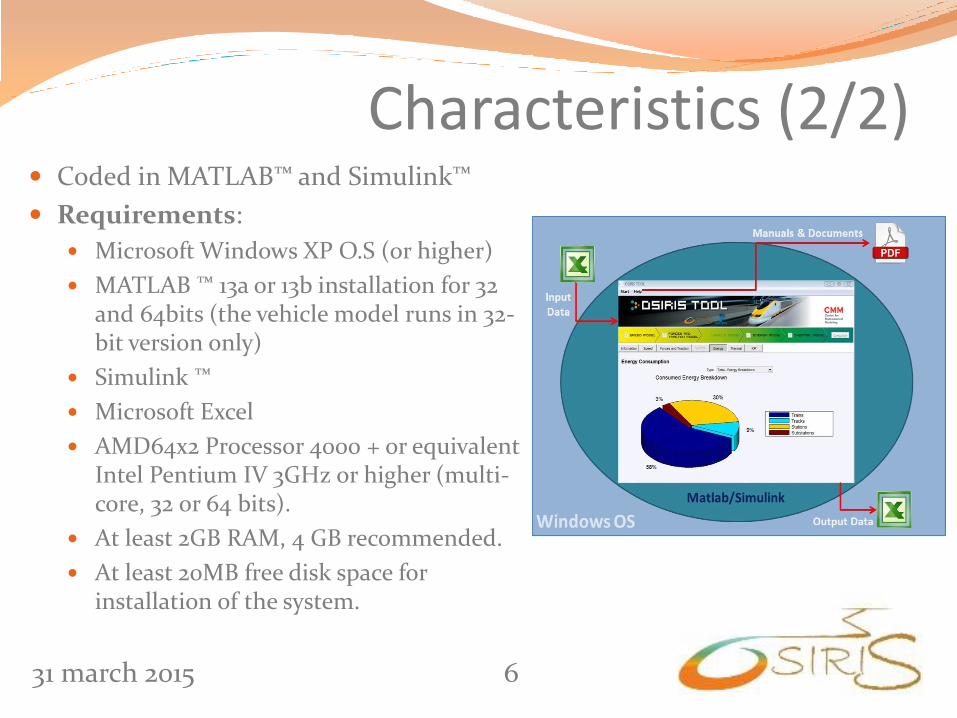
Characteristics (2/2) Coded in MATLAB™ and Simulink™
Requirements:
Microsoft Windows XP O.S (or higher)
MATLAB ™ 13a or 13b installation for 32 and 64bits (the vehicle model runs in 32-bit version only)
Simulink ™
Microsoft Excel
AMD64x2 Processor 4000 + or equivalent Intel Pentium IV 3GHz or higher (multi-core, 32 or 64 bits).
At least 2GB RAM, 4 GB recommended.
At least 20MB free disk space for installation of the system.
31 march 2015 6
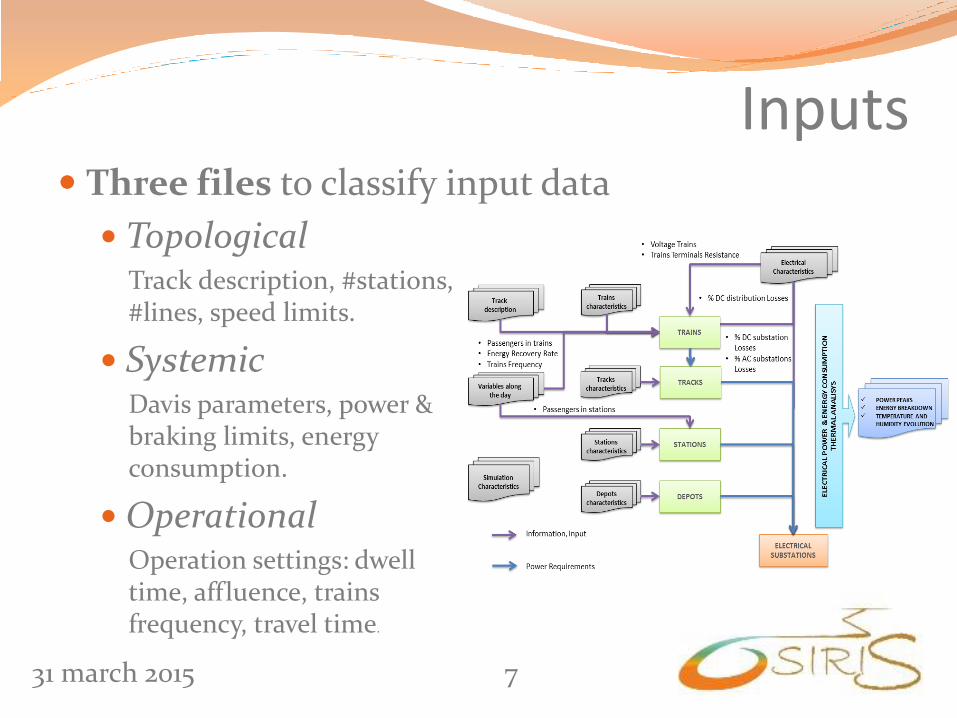
Inputs Three files to classify input data
31 march 2015 7
Topological Track description, #stations, #lines, speed limits.
Systemic Davis parameters, power & braking limits, energy consumption.
Operational Operation settings: dwell time, affluence, trains frequency, travel time.
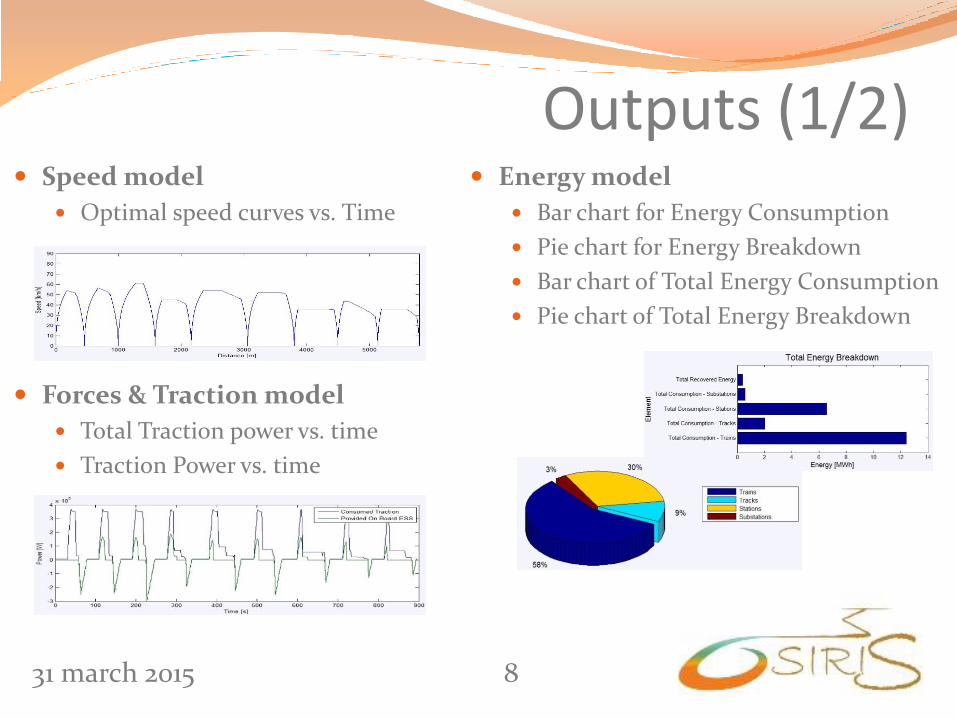
Outputs (1/2) Speed model
Optimal speed curves vs. Time
Forces & Traction model
Total Traction power vs. time
Traction Power vs. time
31 march 2015 8
Energy model
Bar chart for Energy Consumption
Pie chart for Energy Breakdown
Bar chart of Total Energy Consumption
Pie chart of Total Energy Breakdown
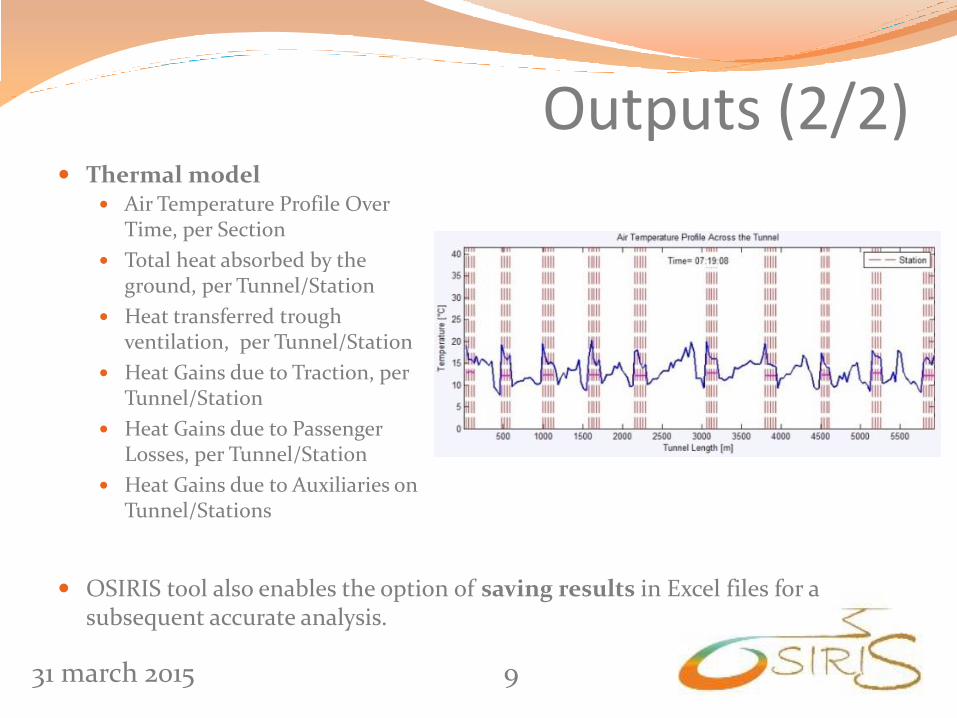
Outputs (2/2) Thermal model
OSIRIS tool also enables the option of saving results in Excel files for a subsequent accurate analysis.
31 march 2015 9
Air Temperature Profile Over Time, per Section
Total heat absorbed by the ground, per Tunnel/Station
Heat transferred trough ventilation, per Tunnel/Station
Heat Gains due to Traction, per Tunnel/Station
Heat Gains due to Passenger Losses, per Tunnel/Station
Heat Gains due to Auxiliaries on Tunnel/Stations
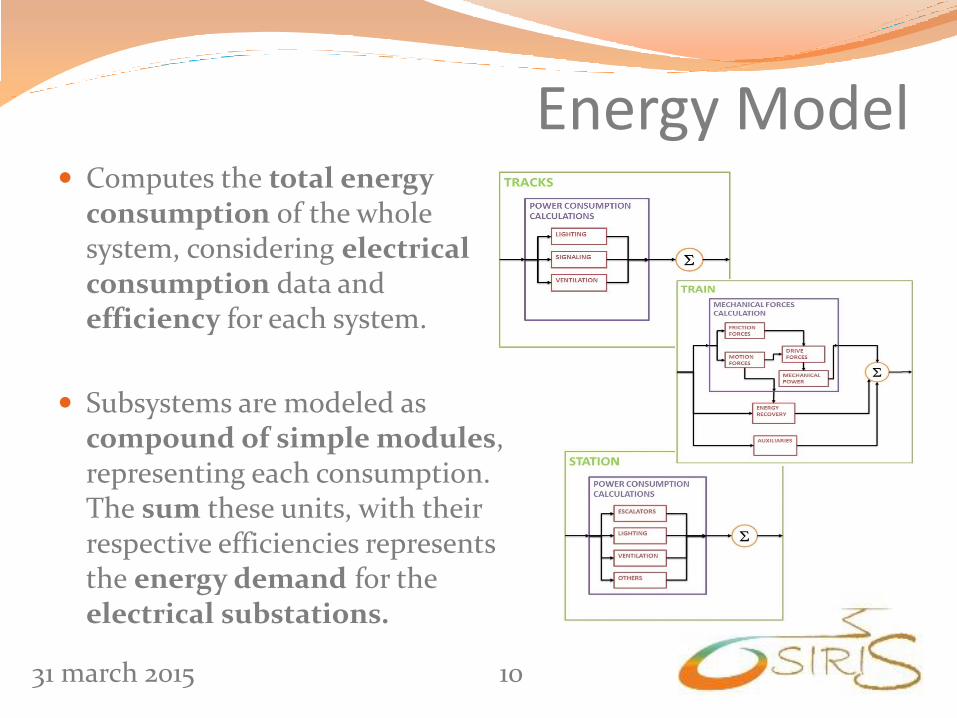
Energy Model Computes the total energy
consumption of the whole system, considering electrical consumption data and efficiency for each system.
Subsystems are modeled as compound of simple modules, representing each consumption. The sum these units, with their respective efficiencies represents the energy demand for the electrical substations.
31 march 2015 10
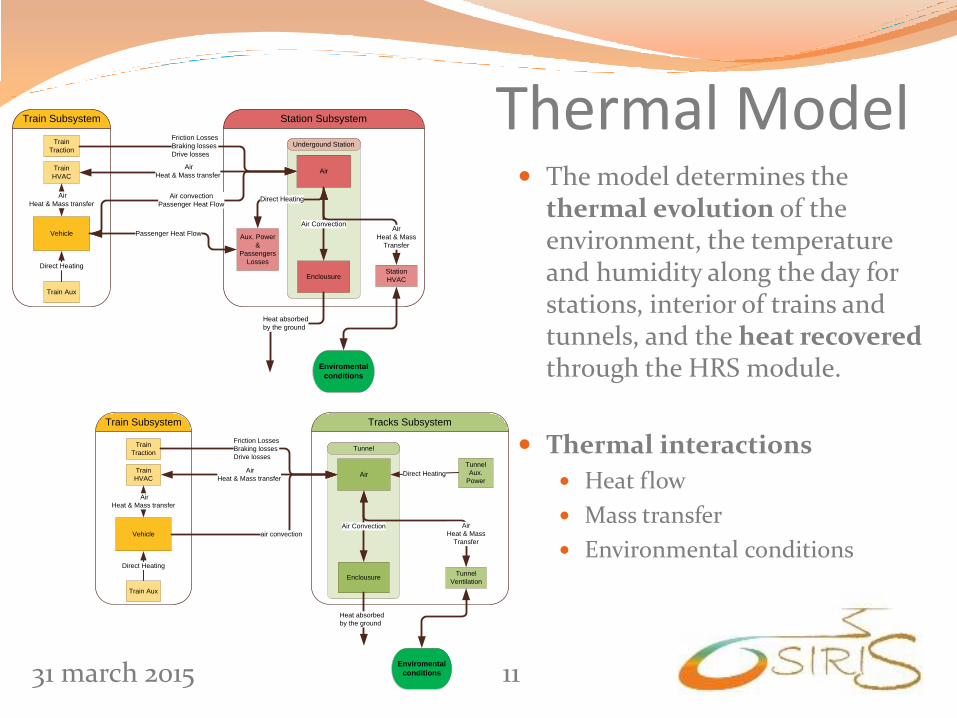
Thermal Model The model determines the
thermal evolution of the environment, the temperature and humidity along the day for stations, interior of trains and tunnels, and the heat recovered through the HRS module.
Thermal interactions
Heat flow
Mass transfer
Environmental conditions
31 march 2015 11
Enclousure
Vehicle
AirTrain
HVAC
Train
Traction
Air Convection
Station
HVAC
Train Aux
Station Subsystem
Air
Heat & Mass transfer
Train Subsystem
Friction Losses
Braking losses
Drive losses
Direct Heating
Air
Heat & Mass
Transfer
Heat absorbed
by the ground
Air
Heat & Mass transfer
Undergound Station
Enviromental
conditions
Air convection
Passenger Heat Flow
Aux. Power
&
Passengers
Losses
Passenger Heat Flow
Direct Heating
Enclousure
Vehicle
Air
air convection
Train
HVAC
Train
Traction
Air Convection
Tunnel
Ventilation
Tunnel
Aux.
Power
Train Aux
Tracks Subsystem
Air
Heat & Mass transfer
Train Subsystem
Friction Losses
Braking losses
Drive losses
Direct Heating
Air
Heat & Mass
Transfer
Direct Heating
Heat absorbed
by the ground
Air
Heat & Mass transfer
Tunnel
Enviromental
conditions
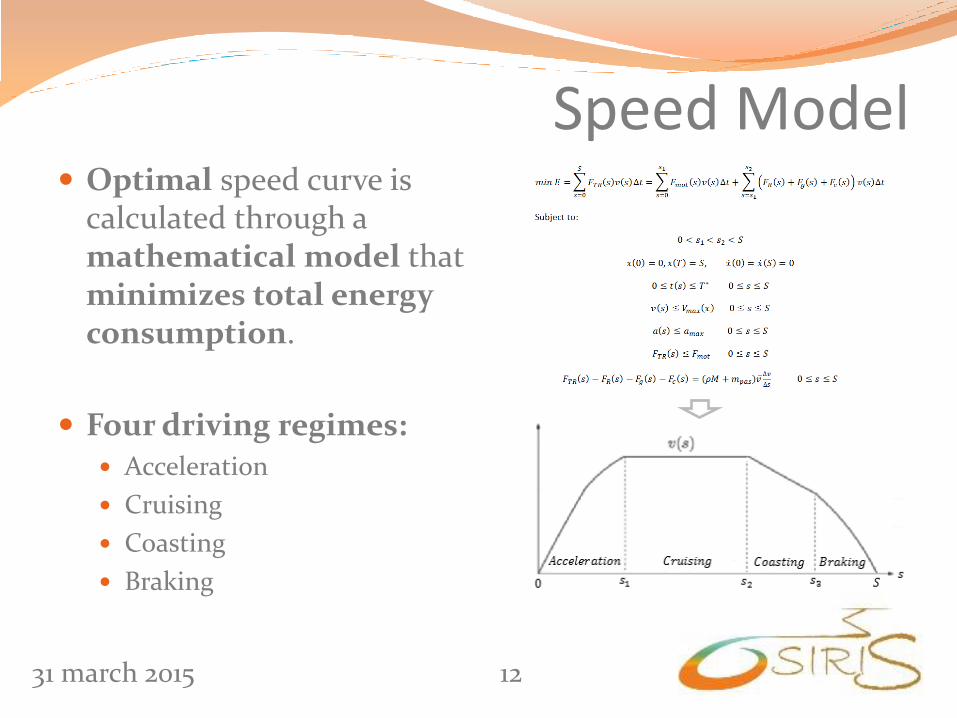
Speed Model Optimal speed curve is
calculated through a mathematical model that minimizes total energy consumption.
Four driving regimes: Acceleration
Cruising
Coasting
Braking
31 march 2015 12
Demo (1/14) Use Case definition
Main data
Topologic
Systemic
Operational
Operation settings
31 march 2015 13
Results Speed Model (CMM)
Traction Model (CAF,CMM)
Vehicle Model (VUT, SIE)
Energy Model (CMM)
Thermal Model (CMM)
KPI
Comparisons with MARCADET
Demo (2/14) Use Case definition
RATP Data
Main data: Topologic
1 Line, 9 Stations
No curvature
Slope along the line
Fixed Speed Limit 80km/h
All underground
31 march 2015 14
Demo (3/14) Use Case definition
Main data: Systemic
Max train power 2,45 MW
Traction efficiency 82%
No ESS (on board or stationary)
Train mass 188 ton
Stations auxiliaries Consumptions 160 kW
31 march 2015 15
Demo (4/14) Use Case definition
Main data: Operational
Two hours of simulation
28 – 31 trains/hours
30 – 45 m3/s ventilation flow
2 – 1097 passengers in trains
31 march 2015 16
Demo (5/14) Use Case definition
Operation settings
Traction model: CMM
Vehicle model simulated (Matlab 32-bit version)
31 march 2015 17
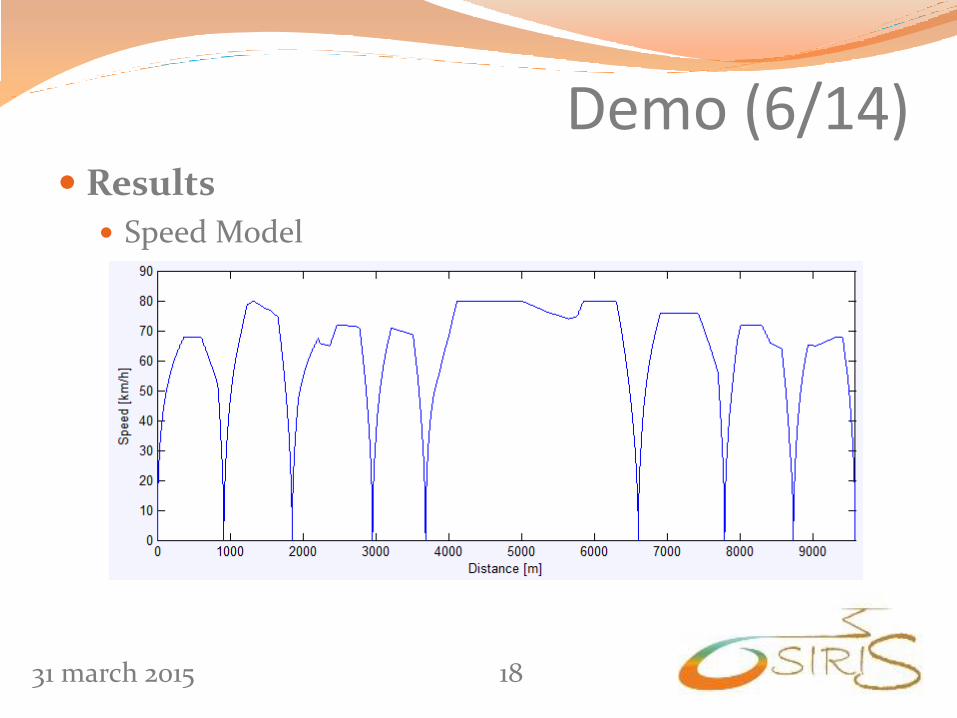
Demo (6/14) Results
Speed Model
31 march 2015 18
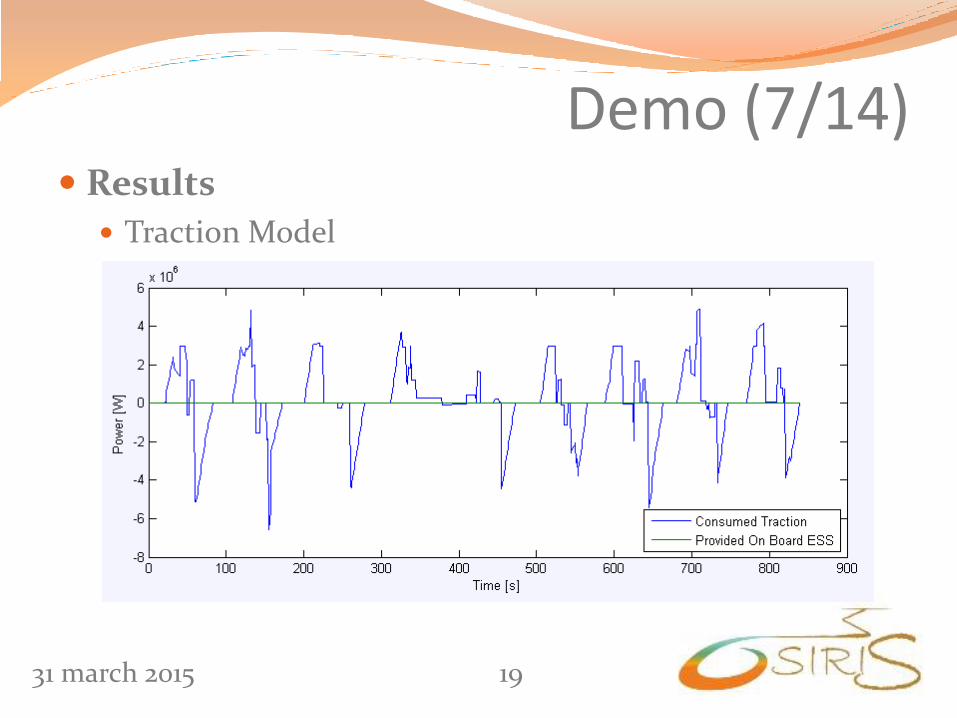
Demo (7/14) Results
Traction Model
31 march 2015 19
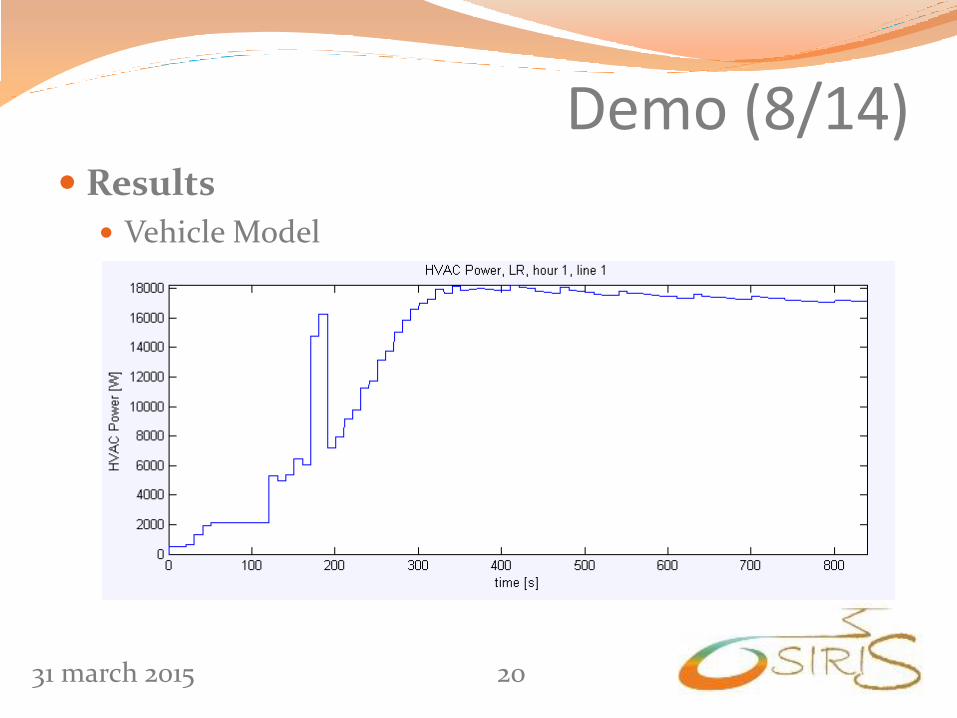
Demo (8/14) Results
Vehicle Model
31 march 2015 20
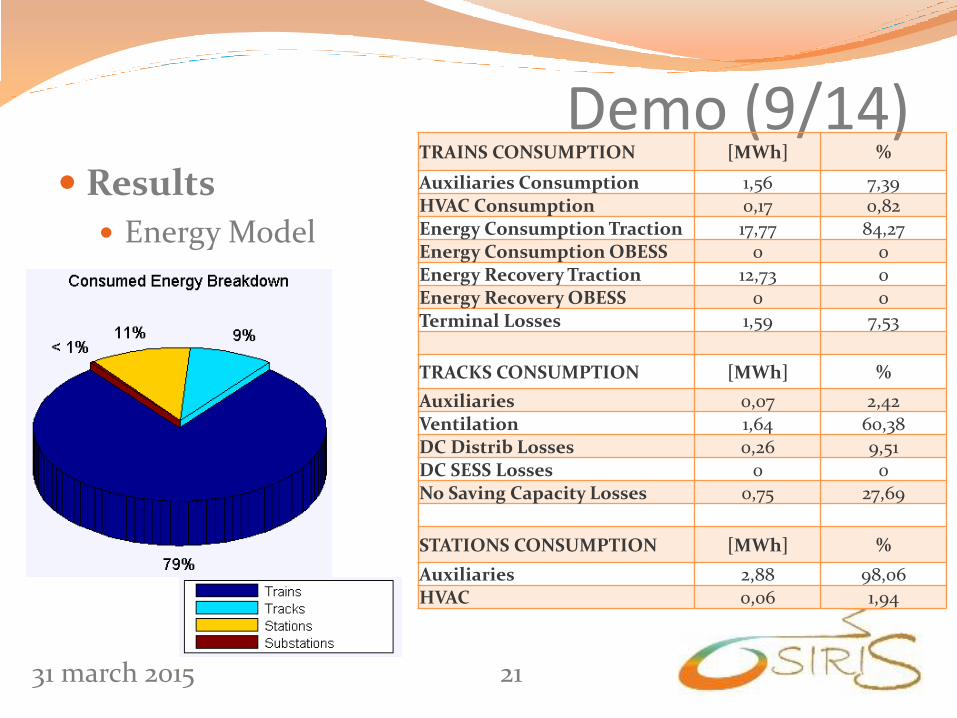
Demo (9/14) Results
Energy Model
31 march 2015 21
TRAINS CONSUMPTION [MWh] %
Auxiliaries Consumption 1,56 7,39 HVAC Consumption 0,17 0,82 Energy Consumption Traction 17,77 84,27 Energy Consumption OBESS 0 0 Energy Recovery Traction 12,73 0 Energy Recovery OBESS 0 0 Terminal Losses 1,59 7,53
TRACKS CONSUMPTION [MWh] %
Auxiliaries 0,07 2,42 Ventilation 1,64 60,38 DC Distrib Losses 0,26 9,51 DC SESS Losses 0 0 No Saving Capacity Losses 0,75 27,69
STATIONS CONSUMPTION [MWh] %
Auxiliaries 2,88 98,06 HVAC 0,06 1,94
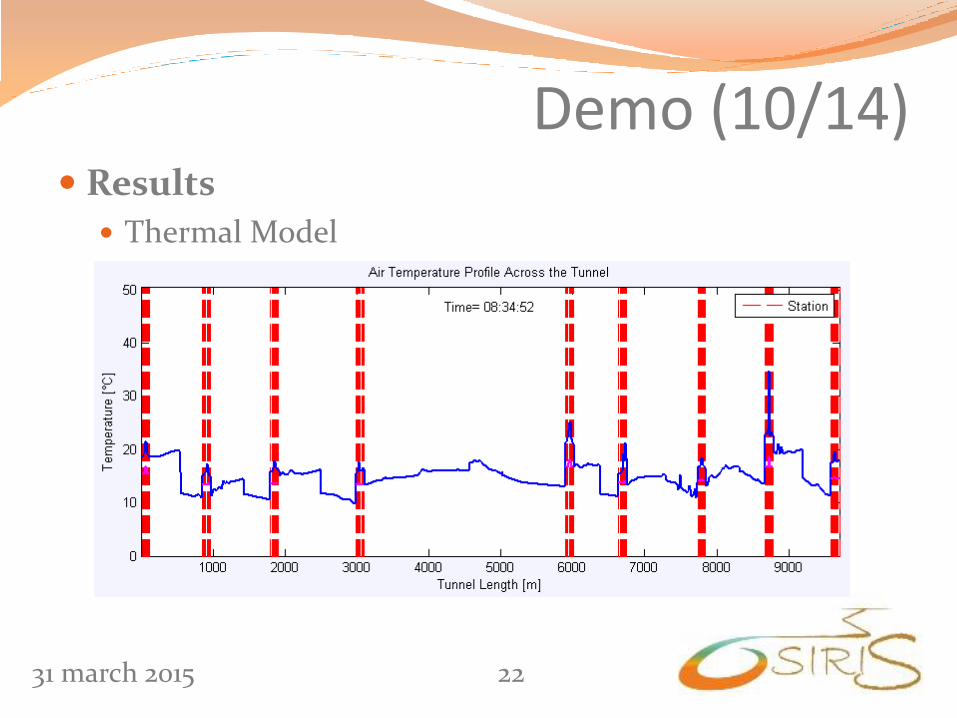
Demo (10/14) Results
Thermal Model
31 march 2015 22
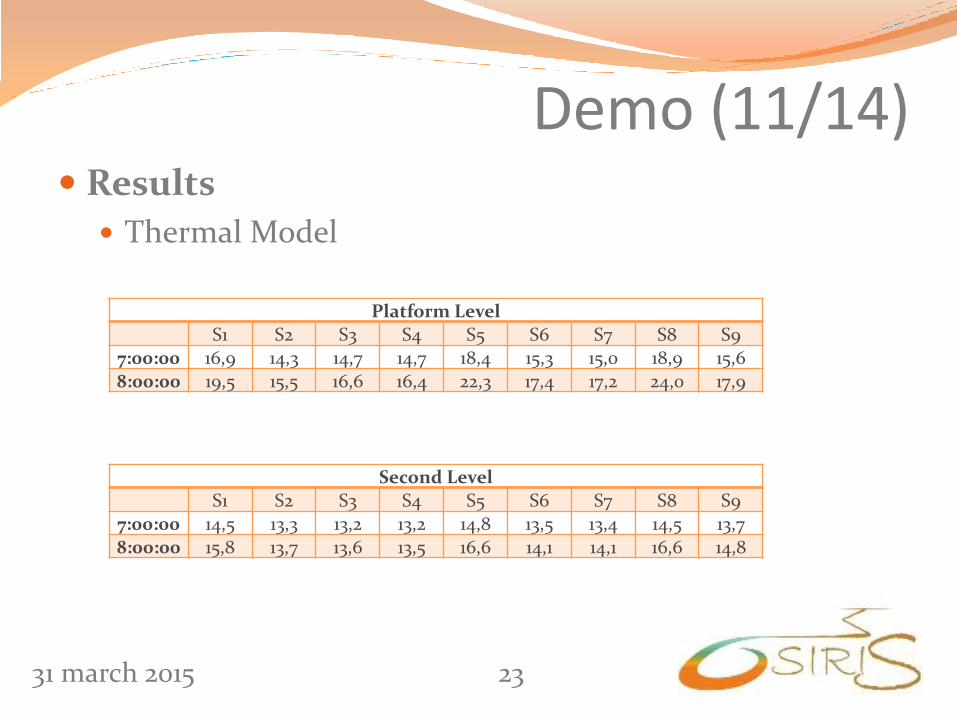
Demo (11/14) Results
Thermal Model
31 march 2015 23
Second Level
S1 S2 S3 S4 S5 S6 S7 S8 S9 7:00:00 14,5 13,3 13,2 13,2 14,8 13,5 13,4 14,5 13,7
8:00:00 15,8 13,7 13,6 13,5 16,6 14,1 14,1 16,6 14,8
Platform Level S1 S2 S3 S4 S5 S6 S7 S8 S9
7:00:00 16,9 14,3 14,7 14,7 18,4 15,3 15,0 18,9 15,6 8:00:00 19,5 15,5 16,6 16,4 22,3 17,4 17,2 24,0 17,9
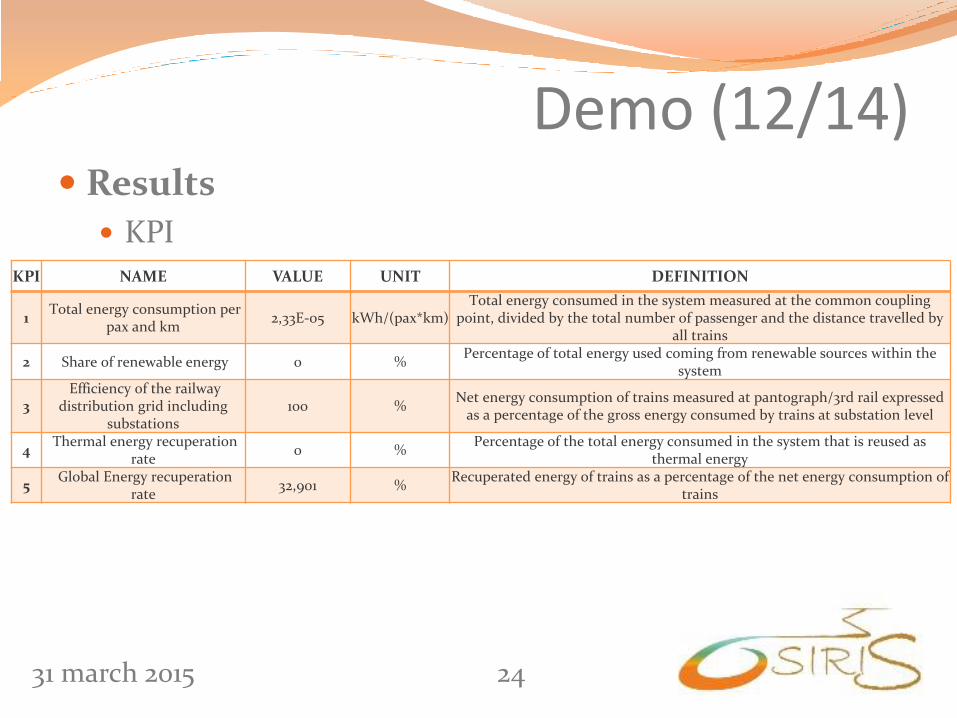
Demo (12/14) Results
KPI
31 march 2015 24
KPI NAME VALUE UNIT DEFINITION
1 Total energy consumption per
pax and km 2,33E-05 kWh/(pax*km)
Total energy consumed in the system measured at the common coupling point, divided by the total number of passenger and the distance travelled by
all trains
2 Share of renewable energy 0 % Percentage of total energy used coming from renewable sources within the
system
3 Efficiency of the railway
distribution grid including substations
100 % Net energy consumption of trains measured at pantograph/3rd rail expressed
as a percentage of the gross energy consumed by trains at substation level
4 Thermal energy recuperation
rate 0 %
Percentage of the total energy consumed in the system that is reused as thermal energy
5 Global Energy recuperation
rate 32,901 %
Recuperated energy of trains as a percentage of the net energy consumption of trains
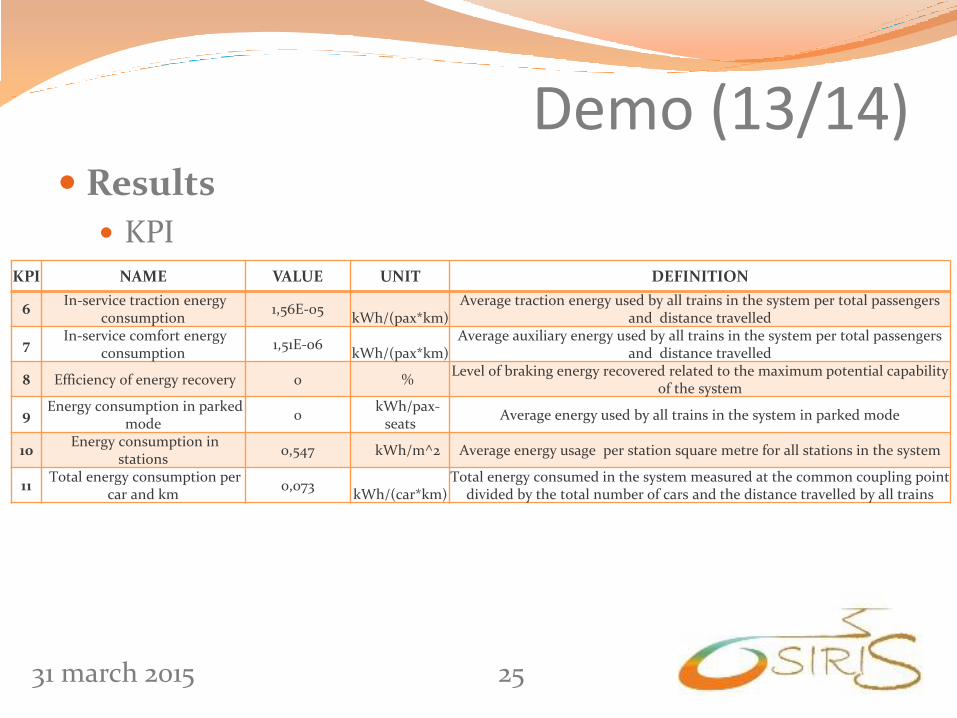
Demo (13/14) Results
KPI
31 march 2015 25
KPI NAME VALUE UNIT DEFINITION
6 In-service traction energy
consumption 1,56E-05
kWh/(pax*km)
Average traction energy used by all trains in the system per total passengers and distance travelled
7 In-service comfort energy
consumption 1,51E-06
kWh/(pax*km)
Average auxiliary energy used by all trains in the system per total passengers and distance travelled
8 Efficiency of energy recovery 0 % Level of braking energy recovered related to the maximum potential capability
of the system
9 Energy consumption in parked
mode 0
kWh/pax-seats
Average energy used by all trains in the system in parked mode
10 Energy consumption in
stations 0,547 kWh/m^2 Average energy usage per station square metre for all stations in the system
11 Total energy consumption per
car and km 0,073
kWh/(car*km)
Total energy consumed in the system measured at the common coupling point divided by the total number of cars and the distance travelled by all trains
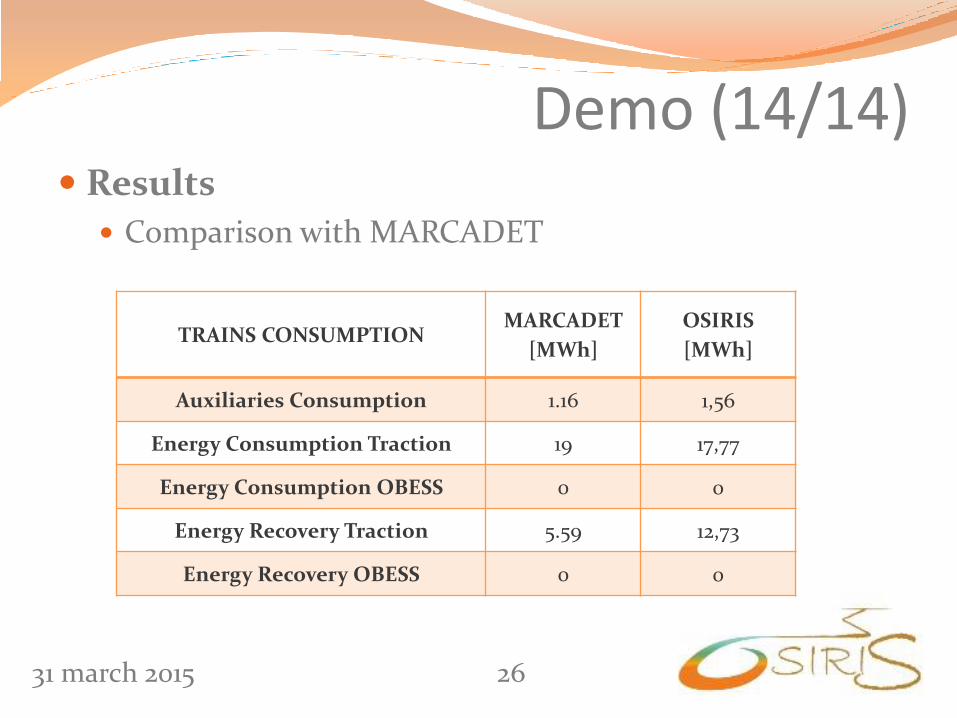
Demo (14/14) Results
Comparison with MARCADET
31 march 2015 26
TRAINS CONSUMPTION MARCADET
[MWh]
OSIRIS
[MWh]
Auxiliaries Consumption 1.16 1,56
Energy Consumption Traction 19 17,77
Energy Consumption OBESS 0 0
Energy Recovery Traction 5.59 12,73
Energy Recovery OBESS 0 0

Thanks for your attention !