Embed Size (px)
Citation preview
IFRS consolidated financial statements for the years ended September 30, 2013, 2012 and 2011 1
Holding Bercy Investissement (HBI)
Consolidated Financial Statements for the Years Ended
September 30, 2013, 2012 and 2011 (prepared in accordance with IFRS)
The English-language version of this document is a free translation from the original, which was prepared in French. All possible
care has been taken to ensure that the translation is an accurate representation of the original. However, in all matters of
interpretation of information, views or opinions expressed therein, the original language version of the document in French takes
precedence over this translation.
IFRS consolidated financial statements for the years ended September 30, 2013, 2012 and 2011 2
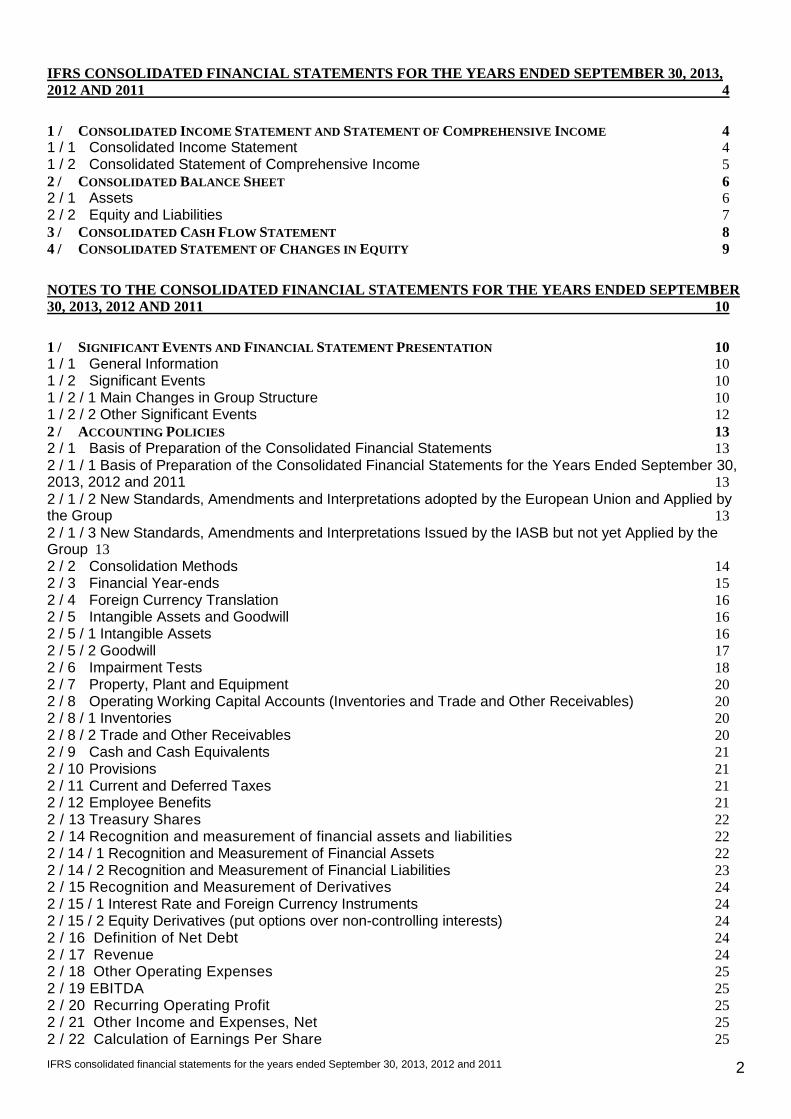
IFRS CONSOLIDATED FINANCIAL STATEMENTS FOR THE YEARS ENDED SEPTEMBER 30, 2013,
2012 AND 2011 4
1 / CONSOLIDATED INCOME STATEMENT AND STATEMENT OF COMPREHENSIVE INCOME 4 1 / 1 Consolidated Income Statement 4 1 / 2 Consolidated Statement of Comprehensive Income 5 2 / CONSOLIDATED BALANCE SHEET 6 2 / 1 Assets 6 2 / 2 Equity and Liabilities 7 3 / CONSOLIDATED CASH FLOW STATEMENT 8 4 / CONSOLIDATED STATEMENT OF CHANGES IN EQUITY 9
NOTES TO THE CONSOLIDATED FINANCIAL STATEMENTS FOR THE YEARS ENDED SEPTEMBER
30, 2013, 2012 AND 2011 10
1 / SIGNIFICANT EVENTS AND FINANCIAL STATEMENT PRESENTATION 10 1 / 1 General Information 10 1 / 2 Significant Events 10 1 / 2 / 1 Main Changes in Group Structure 10 1 / 2 / 2 Other Significant Events 12 2 / ACCOUNTING POLICIES 13 2 / 1 Basis of Preparation of the Consolidated Financial Statements 13 2 / 1 / 1 Basis of Preparation of the Consolidated Financial Statements for the Years Ended September 30, 2013, 2012 and 2011 13 2 / 1 / 2 New Standards, Amendments and Interpretations adopted by the European Union and Applied by the Group 13 2 / 1 / 3 New Standards, Amendments and Interpretations Issued by the IASB but not yet Applied by the Group 13 2 / 2 Consolidation Methods 14 2 / 3 Financial Year-ends 15 2 / 4 Foreign Currency Translation 16 2 / 5 Intangible Assets and Goodwill 16 2 / 5 / 1 Intangible Assets 16 2 / 5 / 2 Goodwill 17 2 / 6 Impairment Tests 18 2 / 7 Property, Plant and Equipment 20 2 / 8 Operating Working Capital Accounts (Inventories and Trade and Other Receivables) 20 2 / 8 / 1 Inventories 20 2 / 8 / 2 Trade and Other Receivables 20 2 / 9 Cash and Cash Equivalents 21 2 / 10 Provisions 21 2 / 11 Current and Deferred Taxes 21 2 / 12 Employee Benefits 21 2 / 13 Treasury Shares 22 2 / 14 Recognition and measurement of financial assets and liabilities 22 2 / 14 / 1 Recognition and Measurement of Financial Assets 22 2 / 14 / 2 Recognition and Measurement of Financial Liabilities 23 2 / 15 Recognition and Measurement of Derivatives 24 2 / 15 / 1 Interest Rate and Foreign Currency Instruments 24 2 / 15 / 2 Equity Derivatives (put options over non-controlling interests) 24 2 / 16 Definition of Net Debt 24 2 / 17 Revenue 24 2 / 18 Other Operating Expenses 25 2 / 19 EBITDA 25 2 / 20 Recurring Operating Profit 25 2 / 21 Other Income and Expenses, Net 25 2 / 22 Calculation of Earnings Per Share 25
IFRS consolidated financial statements for the years ended September 30, 2013, 2012 and 2011 3
2 / 23 Segment Reporting 25 2 / 24 Use of Estimates 28 3 / CHANGES IN GROUP STRUCTURE DURING THE YEARS ENDED SEPTEMBER 30, 2013, 2012 AND 2011 28 4 / ANALYSIS OF CHANGES IN INCOME STATEMENT AND BALANCE SHEET ITEMS 30 4 / 1 Revenue 30 4 / 2 Recurring Operating Profit 33 4 / 3 Earnings Per Share 34 4 / 4 Personnel Costs and Employee Numbers 34 4/ 4/ 1 Analysis of Personnel Costs 34 4/ 4/ 2 Employee Numbers 34 4 / 5 Financial Income and Expenses 35 4 / 6 Other Income and Expenses, Net 35 4 / 7 Income Tax 36 4 / 8 Analysis of Goodwill 37 4 / 9 Analysis of Intangible Assets and Property, Plant and Equipment 38 4 / 9 / 1 Intangible Assets 38 4 / 9 / 2 Property, Plant and Equipment 39 4 / 9 / 3 Analysis of Intangible Assets and Property, Plant and Equipment by Operating Segment 40 4 / 9 / 4 Analysis of Intangible Assets and Property, Plant and Equipment by Geographical Area 40 4 / 10 Non-current Financial Assets 41 4 / 11 Investments in Associates 41 4 / 12 Trade and Other Receivables 42 4 / 13 Deferred Taxes and Other Current Assets 43 4 / 13 / 1 Deferred taxes 43 4 / 13 / 2 Other Current Assets 43 4 / 14 Provisions 44 4 / 15 Debt and Hedging Instruments 46 4/ 15/ 1 Analysis of Debt by Type and Maturity 46 4 / 15 / 2 Derivative Financial Instruments 48 4 / 15 / 3 Financial Covenants 50 4 / 16 Parent Company’s Share Capital and Stock Options 50 4 / 16 / 1 Share Capital and Stock Options 50 4 / 16 / 2 Stock options granted to employees of HBI and its subsidiaries 50 4 / 17 Liabilities Relating to Share Acquisitions and Future Dividend Payments 50 4 / 18 Other Current Liabilities 51 5 / OFF-BALANCE SHEET COMMITMENTS 52 5 / 1 Guarantees Given/Received 52 5 / 2 Commitments under Operating Leases 52 5 / 3 Put Options on Shares in Áreas 53 5 / 4 Put options on shares in TrustHouse Services Group 53 6 / RELATED PARTY TRANSACTIONS 53 6 / 1 Executive Compensation and Benefits 53 6 / 2 Other Related Party Transactions 54 7/ FINANCIAL RISK MANAGEMENT AND FINANCIAL INSTRUMENTS 54 7 / 1 Exposure to Foreign Exchange Risk 54 7 / 2 Exposure to Interest Rate Risk 55 7 / 3 Exposure to Liquidity Risk 56 7 / 4 Exposure to Credit and Counterparty Risk 58 7 / 5 Fair Value of Financial Assets and Liabilities 59 8 / EVENTS AFTER THE BALANCE SHEET DATE 59 9 / ADDITIONAL INFORMATION 60 9 / 1 Statutory Auditors’ Fees paid by the Group's Companies 60 10 / TAX CONSOLIDATION 61 11 / LIST OF CONSOLIDATED COMPANIES AT SEPTEMBER 30, 2013, 2012 AND 2011 64
IFRS consolidated financial statements for the years ended September 30, 2013, 2012 and 2011 4
IFRS Consolidated Financial Statements for the Years Ended September 30, 2013, 2012 and 2011
1 / Consolidated Income Statement and Statement of Comprehensive Income
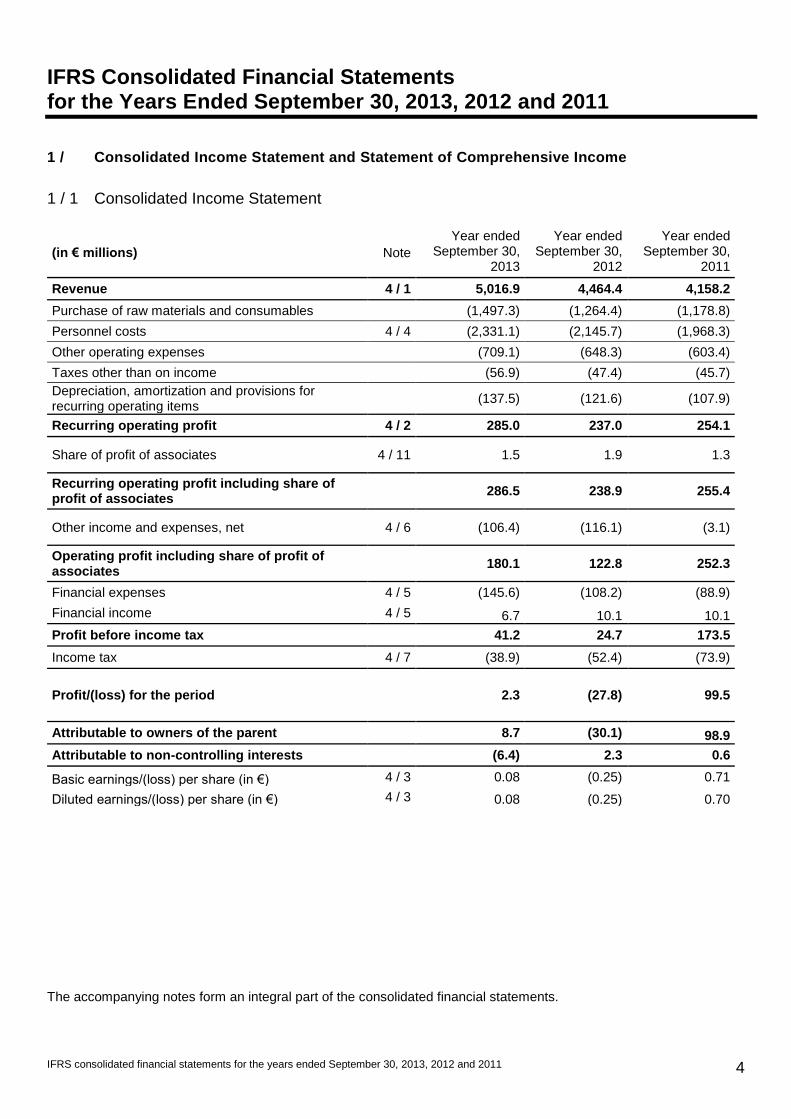
1 / 1 Consolidated Income Statement
(in € millions) Note
Year ended September 30,
2013
Year ended September 30,
2012
Year ended September 30,
2011
Revenue 4 / 1 5,016.9 4,464.4 4,158.2
Purchase of raw materials and consumables (1,497.3) (1,264.4) (1,178.8)
Personnel costs 4 / 4 (2,331.1) (2,145.7) (1,968.3)
Other operating expenses (709.1) (648.3) (603.4)
Taxes other than on income (56.9) (47.4) (45.7)
Depreciation, amortization and provisions for recurring operating items
(137.5) (121.6) (107.9)
Recurring operating profit 4 / 2 285.0 237.0 254.1
Share of profit of associates 4 / 11 1.5 1.9 1.3
Recurring operating profit including share of profit of associates
286.5 238.9 255.4
Other income and expenses, net 4 / 6 (106.4) (116.1) (3.1)
Operating profit including share of profit of associates
180.1 122.8 252.3
Financial expenses 4 / 5 (145.6) (108.2) (88.9)
Financial income 4 / 5 6.7 10.1 10.1
Profit before income tax 41.2 24.7 173.5
Income tax 4 / 7 (38.9) (52.4) (73.9)
Profit/(loss) for the period 2.3 (27.8) 99.5
Attributable to owners of the parent 8.7 (30.1) 98.9
Attributable to non-controlling interests (6.4) 2.3 0.6
Basic earnings/(loss) per share (in €) 4 / 3 0.08 (0.25) 0.71
Diluted earnings/(loss) per share (in €) 4 / 3 0.08 (0.25) 0.70
The accompanying notes form an integral part of the consolidated financial statements.
IFRS consolidated financial statements for the years ended September 30, 2013, 2012 and 2011 5
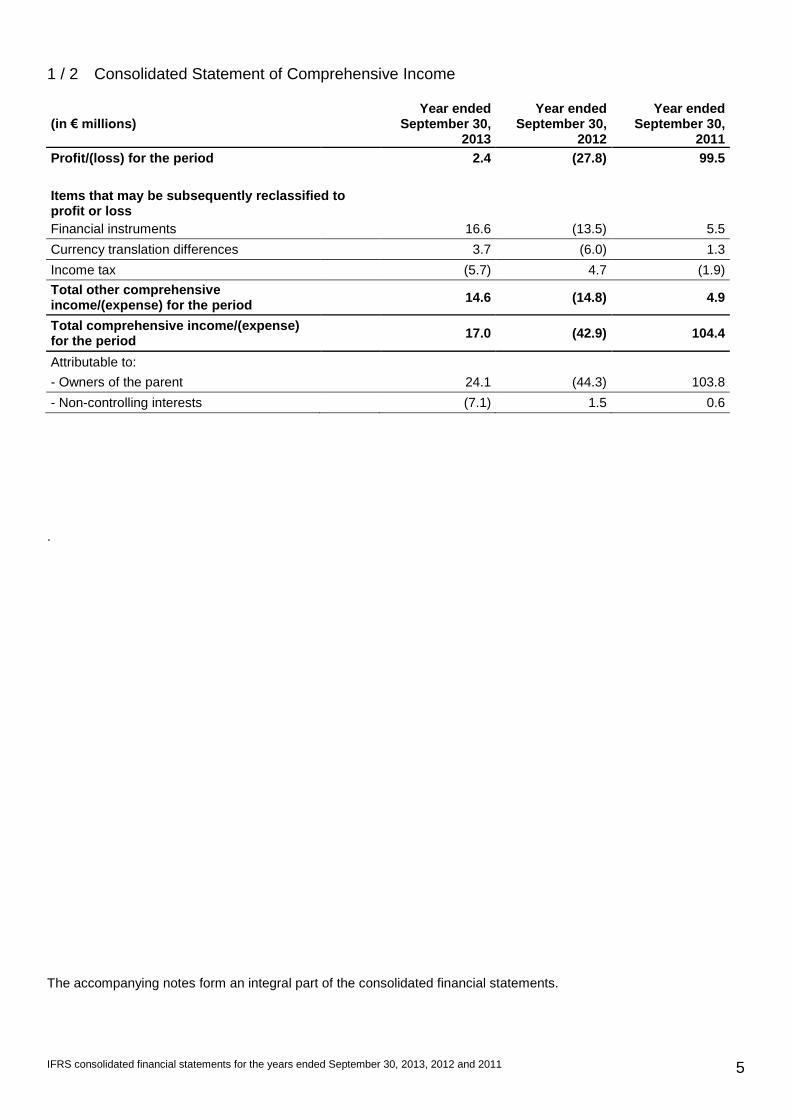
1 / 2 Consolidated Statement of Comprehensive Income
(in € millions) Year ended
September 30, 2013
Year ended September 30,
2012
Year ended September 30,
2011
Profit/(loss) for the period 2.4 (27.8) 99.5
Items that may be subsequently reclassified to profit or loss
Financial instruments 16.6 (13.5) 5.5
Currency translation differences 3.7 (6.0) 1.3
Income tax (5.7) 4.7 (1.9)
Total other comprehensive income/(expense) for the period
14.6 (14.8) 4.9
Total comprehensive income/(expense) for the period
17.0 (42.9) 104.4
Attributable to:
- Owners of the parent 24.1 (44.3) 103.8
- Non-controlling interests (7.1) 1.5 0.6
.
The accompanying notes form an integral part of the consolidated financial statements.
IFRS consolidated financial statements for the years ended September 30, 2013, 2012 and 2011 6
2 / Consolidated Balance Sheet
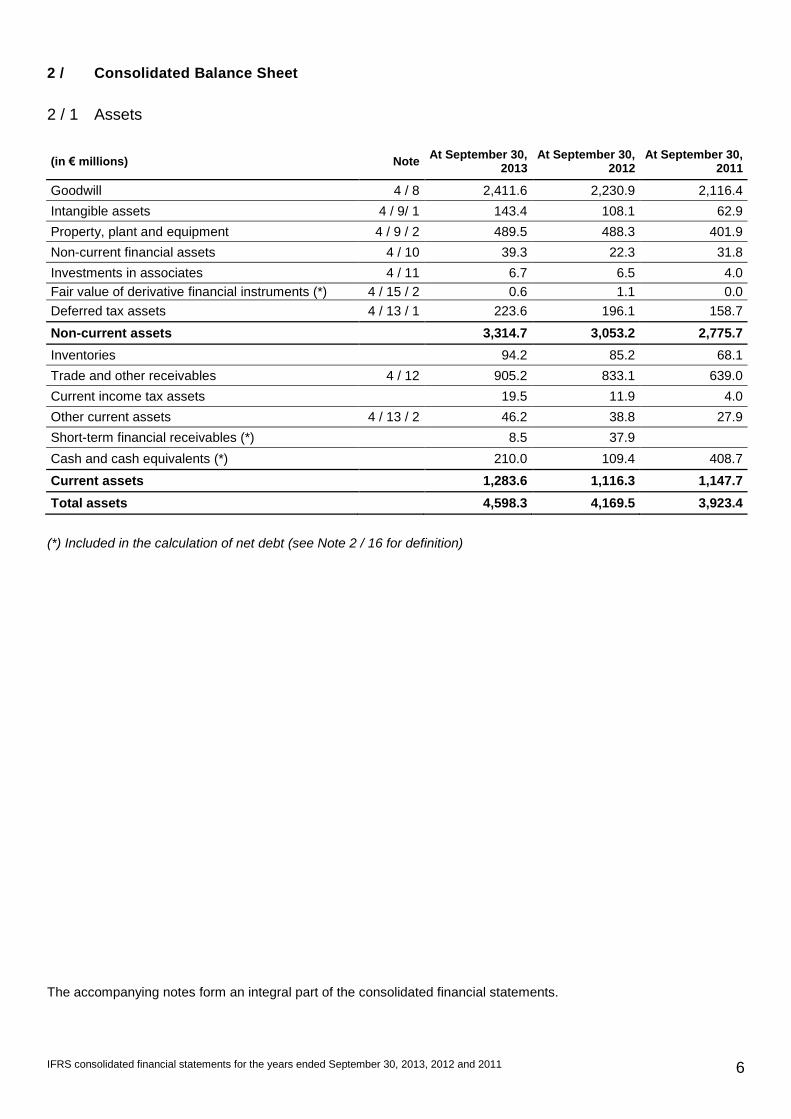
2 / 1 Assets
(in € millions) Note At September 30,
2013 At September 30,
2012 At September 30,
2011
Goodwill 4 / 8 2,411.6 2,230.9 2,116.4
Intangible assets 4 / 9/ 1 143.4 108.1 62.9
Property, plant and equipment 4 / 9 / 2 489.5 488.3 401.9
Non-current financial assets 4 / 10 39.3 22.3 31.8
Investments in associates 4 / 11 6.7 6.5 4.0
Fair value of derivative financial instruments (*) 4 / 15 / 2 0.6 1.1 0.0
Deferred tax assets 4 / 13 / 1 223.6 196.1 158.7
Non-current assets 3,314.7 3,053.2 2,775.7
Inventories 94.2 85.2 68.1
Trade and other receivables 4 / 12 905.2 833.1 639.0
Current income tax assets 19.5 11.9 4.0
Other current assets 4 / 13 / 2 46.2 38.8 27.9
Short-term financial receivables (*) 8.5 37.9
Cash and cash equivalents (*) 210.0 109.4 408.7
Current assets 1,283.6 1,116.3 1,147.7
Total assets 4,598.3 4,169.5 3,923.4
(*) Included in the calculation of net debt (see Note 2 / 16 for definition)
The accompanying notes form an integral part of the consolidated financial statements.
IFRS consolidated financial statements for the years ended September 30, 2013, 2012 and 2011 7
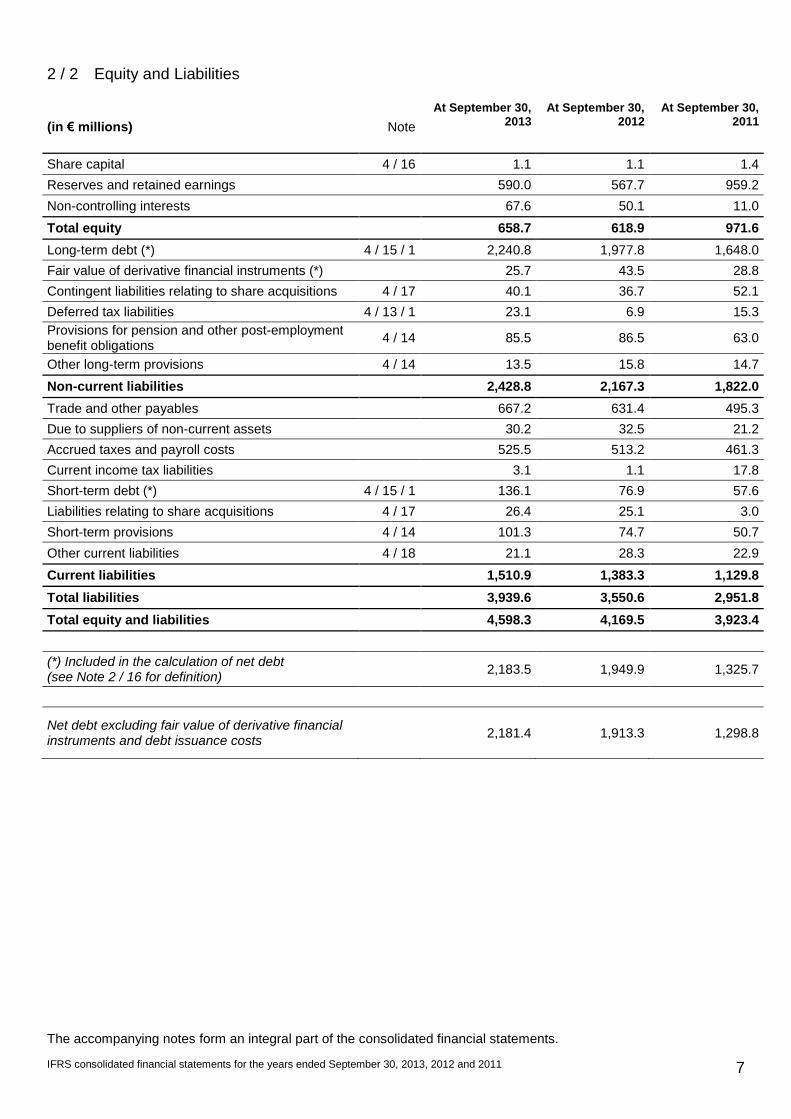
2 / 2 Equity and Liabilities
(in € millions) Note
At September 30, 2013
At September 30, 2012
At September 30, 2011
Share capital 4 / 16 1.1 1.1 1.4
Reserves and retained earnings 590.0 567.7 959.2
Non-controlling interests 67.6 50.1 11.0
Total equity 658.7 618.9 971.6
Long-term debt (*) 4 / 15 / 1 2,240.8 1,977.8 1,648.0
Fair value of derivative financial instruments (*) 25.7 43.5 28.8
Contingent liabilities relating to share acquisitions 4 / 17 40.1 36.7 52.1
Deferred tax liabilities 4 / 13 / 1 23.1 6.9 15.3
Provisions for pension and other post-employment benefit obligations
4 / 14 85.5 86.5 63.0
Other long-term provisions 4 / 14 13.5 15.8 14.7
Non-current liabilities 2,428.8 2,167.3 1,822.0
Trade and other payables 667.2 631.4 495.3
Due to suppliers of non-current assets 30.2 32.5 21.2
Accrued taxes and payroll costs 525.5 513.2 461.3
Current income tax liabilities 3.1 1.1 17.8
Short-term debt (*) 4 / 15 / 1 136.1 76.9 57.6
Liabilities relating to share acquisitions 4 / 17 26.4 25.1 3.0
Short-term provisions 4 / 14 101.3 74.7 50.7
Other current liabilities 4 / 18 21.1 28.3 22.9
Current liabilities 1,510.9 1,383.3 1,129.8
Total liabilities 3,939.6 3,550.6 2,951.8
Total equity and liabilities 4,598.3 4,169.5 3,923.4
(*) Included in the calculation of net debt (see Note 2 / 16 for definition)
2,183.5 1,949.9 1,325.7
Net debt excluding fair value of derivative financial instruments and debt issuance costs
2,181.4 1,913.3 1,298.8
The accompanying notes form an integral part of the consolidated financial statements.
IFRS consolidated financial statements for the years ended September 30, 2013, 2012 and 2011 8
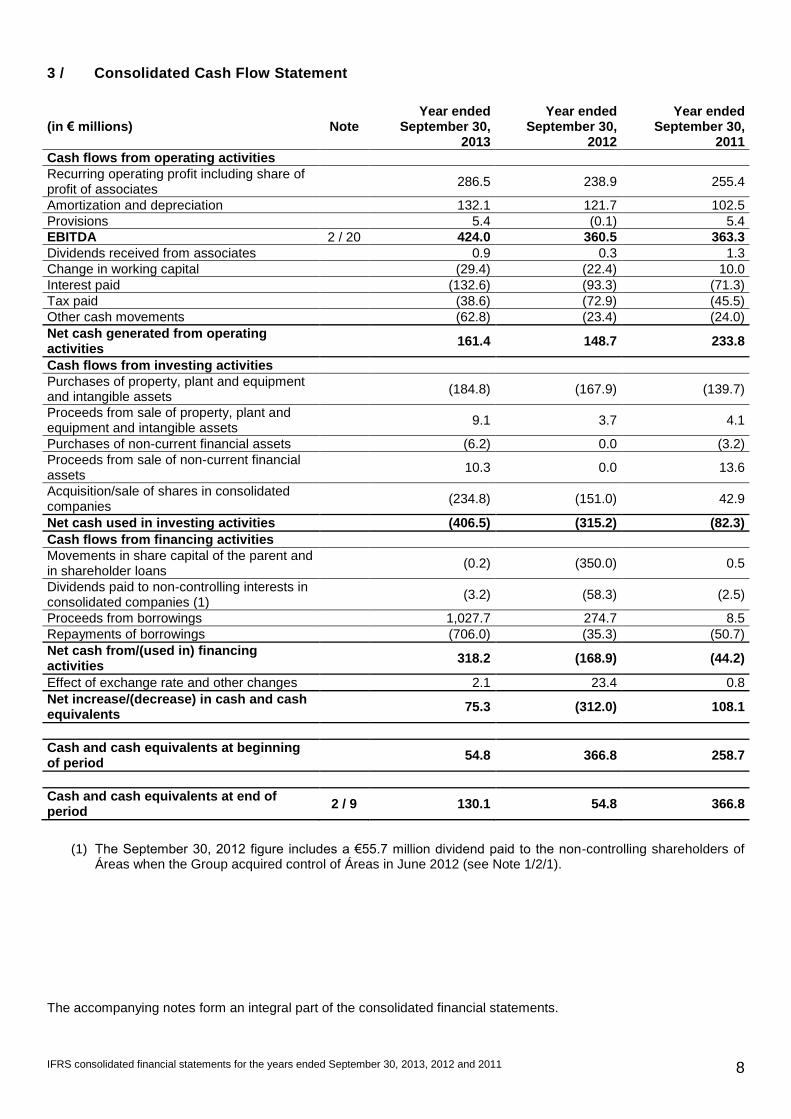
3 / Consolidated Cash Flow Statement
(in € millions) Note Year ended
September 30, 2013
Year ended September 30,
2012
Year ended September 30,
2011
Cash flows from operating activities
Recurring operating profit including share of profit of associates
286.5 238.9 255.4
Amortization and depreciation 132.1 121.7 102.5
Provisions 5.4 (0.1) 5.4
EBITDA 2 / 20 424.0 360.5 363.3
Dividends received from associates 0.9 0.3 1.3
Change in working capital (29.4) (22.4) 10.0
Interest paid (132.6) (93.3) (71.3)
Tax paid (38.6) (72.9) (45.5)
Other cash movements (62.8) (23.4) (24.0)
Net cash generated from operating activities
161.4 148.7 233.8
Cash flows from investing activities
Purchases of property, plant and equipment and intangible assets
(184.8) (167.9) (139.7)
Proceeds from sale of property, plant and equipment and intangible assets
9.1 3.7 4.1
Purchases of non-current financial assets (6.2) 0.0 (3.2)
Proceeds from sale of non-current financial assets
10.3 0.0 13.6
Acquisition/sale of shares in consolidated companies
(234.8) (151.0) 42.9
Net cash used in investing activities (406.5) (315.2) (82.3)
Cash flows from financing activities
Movements in share capital of the parent and in shareholder loans
(0.2) (350.0) 0.5
Dividends paid to non-controlling interests in consolidated companies (1)
(3.2) (58.3) (2.5)
Proceeds from borrowings 1,027.7 274.7 8.5
Repayments of borrowings (706.0) (35.3) (50.7)
Net cash from/(used in) financing activities
318.2 (168.9) (44.2)
Effect of exchange rate and other changes 2.1 23.4 0.8
Net increase/(decrease) in cash and cash equivalents
75.3 (312.0) 108.1
Cash and cash equivalents at beginning of period
54.8 366.8 258.7
Cash and cash equivalents at end of period
2 / 9 130.1 54.8 366.8
(1) The September 30, 2012 figure includes a €55.7 million dividend paid to the non-controlling shareholders of Áreas when the Group acquired control of Áreas in June 2012 (see Note 1/2/1).
The accompanying notes form an integral part of the consolidated financial statements.
IFRS consolidated financial statements for the years ended September 30, 2013, 2012 and 2011 9
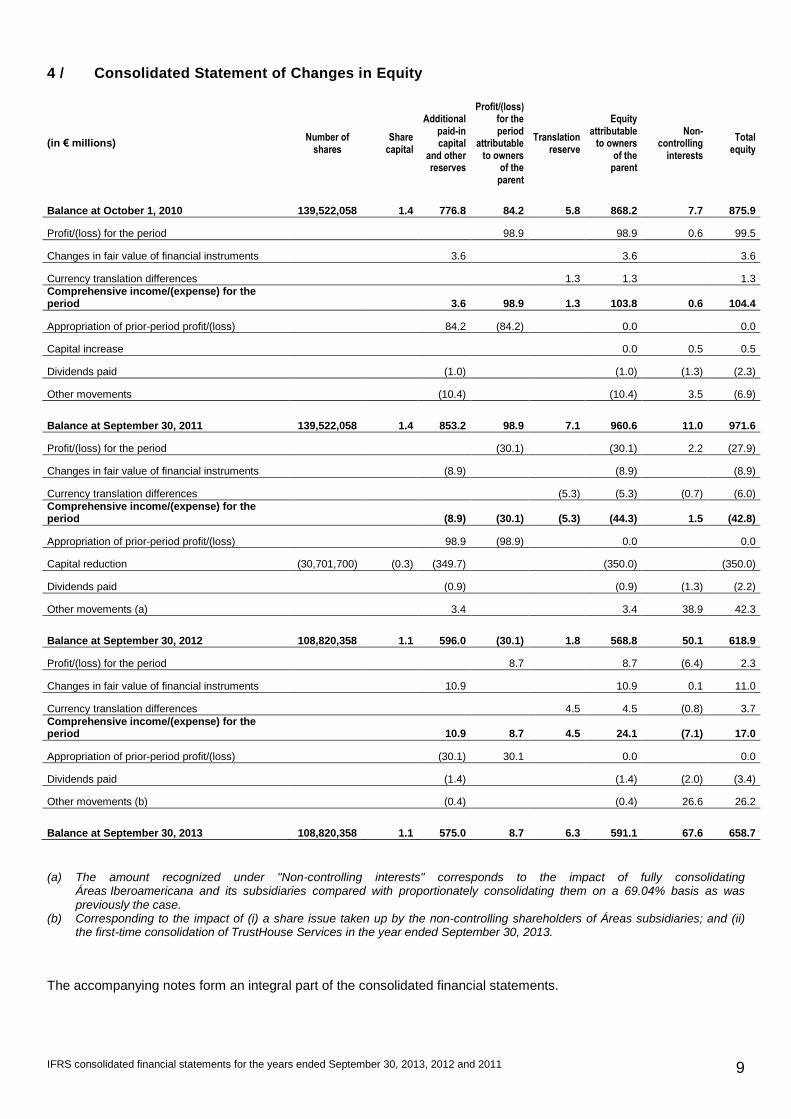
4 / Consolidated Statement of Changes in Equity
(in € millions) Number of
shares Share
capital
Additional paid-in capital
and other reserves
Profit/(loss) for the period
attributable to owners
of the parent
Translation reserve
Equity attributable
to owners of the
parent
Non-controlling
interests
Total equity
Balance at October 1, 2010 139,522,058 1.4 776.8 84.2 5.8 868.2 7.7 875.9
Profit/(loss) for the period 98.9 98.9 0.6 99.5
Changes in fair value of financial instruments 3.6 3.6 3.6
Currency translation differences 1.3 1.3 1.3
Comprehensive income/(expense) for the period 3.6 98.9 1.3 103.8 0.6 104.4
Appropriation of prior-period profit/(loss) 84.2 (84.2) 0.0 0.0
Capital increase 0.0 0.5 0.5
Dividends paid (1.0) (1.0) (1.3) (2.3)
Other movements (10.4) (10.4) 3.5 (6.9)
Balance at September 30, 2011 139,522,058 1.4 853.2 98.9 7.1 960.6 11.0 971.6
Profit/(loss) for the period (30.1) (30.1) 2.2 (27.9)
Changes in fair value of financial instruments (8.9) (8.9) (8.9)
Currency translation differences (5.3) (5.3) (0.7) (6.0)
Comprehensive income/(expense) for the period (8.9) (30.1) (5.3) (44.3) 1.5 (42.8)
Appropriation of prior-period profit/(loss) 98.9 (98.9) 0.0 0.0
Capital reduction (30,701,700) (0.3) (349.7) (350.0) (350.0)
Dividends paid (0.9) (0.9) (1.3) (2.2)
Other movements (a) 3.4 3.4 38.9 42.3
Balance at September 30, 2012 108,820,358 1.1 596.0 (30.1) 1.8 568.8 50.1 618.9
Profit/(loss) for the period 8.7 8.7 (6.4) 2.3
Changes in fair value of financial instruments 10.9 10.9 0.1 11.0
Currency translation differences 4.5 4.5 (0.8) 3.7
Comprehensive income/(expense) for the period 10.9 8.7 4.5 24.1 (7.1) 17.0
Appropriation of prior-period profit/(loss) (30.1) 30.1 0.0 0.0
Dividends paid (1.4) (1.4) (2.0) (3.4)
Other movements (b) (0.4) (0.4) 26.6 26.2
Balance at September 30, 2013 108,820,358 1.1 575.0 8.7 6.3 591.1 67.6 658.7
(a) The amount recognized under "Non-controlling interests" corresponds to the impact of fully consolidating Áreas Iberoamericana and its subsidiaries compared with proportionately consolidating them on a 69.04% basis as was previously the case.
(b) Corresponding to the impact of (i) a share issue taken up by the non-controlling shareholders of Áreas subsidiaries; and (ii) the first-time consolidation of TrustHouse Services in the year ended September 30, 2013.
The accompanying notes form an integral part of the consolidated financial statements.
IFRS consolidated financial statements for the years ended September 30, 2013, 2012 and 2011 10
Notes to the Consolidated Financial statements for the Years ended September 30, 2013, 2012 and 2011
1 / Significant Events and Financial Statement Presentation
1 / 1 General Information
Holding Bercy Investissement (“HBI”) is a French partnership limited by shares (société en commandite par actions) registered and domiciled in France. Its headquarters are located at 61-69 rue de Bercy, Paris, France. At September 30, 2013, HBI was 70.24%-controlled by investment funds managed by Charterhouse and Chequers, 24.75%-controlled by Bagatelle Investissement et Management – “BIM” (which is wholly-owned by Robert Zolade), and 5.01%-controlled by (i) the investment fund SOFIA, (ii) companies of the Intermediate Capital Group (ICG), and (iii) co-investors including a number of Group managers, through specific companies set up for this purpose.
The HBI Elior Group is a major player in Europe's contracted food and support services industry. It operates its businesses of Contract Catering & Support Services and Concession Catering & Travel Retail through companies based in 13 countries – mainly in the Eurozone, the United Kingdom, the USA and Latin America.
1 / 2 Significant Events
1 / 2 / 1 Main Changes in Group Structure
During the year ended September 30, 2013, the Group carried out the following transactions:
- In April 2013, it completed the acquisition of 78% of the share capital of the US-based contract caterer, TrustHouse Services Group (THS), with the remaining 22% owned by THS’ managers. THS generates some $440 million in annual revenue and operates primarily in the Education, Healthcare and Corrections sectors. The total acquisition cost for the Group was around €213 million, of which €100 million was funded by an equity investment by Elior Restauration et Services SA and €118 million by local acquisition financing that matures in April 2019. THS has been fully consolidated by the Group since April 15, 2013.
- In January 2013, it acquired an additional 9.25% of the share capital of Serunión for €19 million following the exercise of a put option by the company’s non-controlling shareholders. Serunión is now wholly owned by the Group.
During the year ended September 30, 2012, the Group carried out the following transactions:
- In April and May 2012 respectively, it acquired the entire capital of Italy-based Gemeaz and the French company Ansamble, which generate aggregate annual contract catering revenue of around €430 million. The total acquisition cost (including net debt assumed) came to €189 million, the majority of which was paid during the year. These transactions gave rise to total goodwill of €162 million (see Note 4 / 7 for further details).
- In June 2012 it acquired control of Áreas Iberoamericana by way of a transfer to Áreas Iberoamericana of the direct stake previously held by the Group in Áreas, an Áreas Iberoamericana subsidiary. In view of the conditions of this transfer, Áreas Iberoamericana and its subsidiaries – which were previously jointly controlled by the Group with Emesa and were proportionately consolidated by HBI on a 69.04% basis until May 31, 2012 – have been fully consolidated since June 1, 2012 based on HBI's 61.55% ownership interest.
These two transactions resulted in an aggregate net cash outflow of €207 million.
IFRS consolidated financial statements for the years ended September 30, 2013, 2012 and 2011 11
During the year ended September 30, 2011, the Group carried out the following transactions:
- On September 28, 2011 it acquired the entire capital of Alessa, a Spanish contract catering company which generates annual revenue of around €50 million. The total acquisition price was €30 million (including net debt assumed), of which €10 million was paid out during the year. Alessa's estimated opening balance sheet was included in the Group's consolidated balance sheet at September 30, 2011. The earnings and cash flows of Alessa and its subsidiaries were consolidated in the financial statements for the year ended September 30, 2012 using the full consolidation method.
- During the first half of the year, the Group sold the entire capital of both its Dutch subsidiary and its Italian meal vouchers subsidiary. The aggregate sale price for these two transactions, net of deconsolidated cash, came to €66 million.
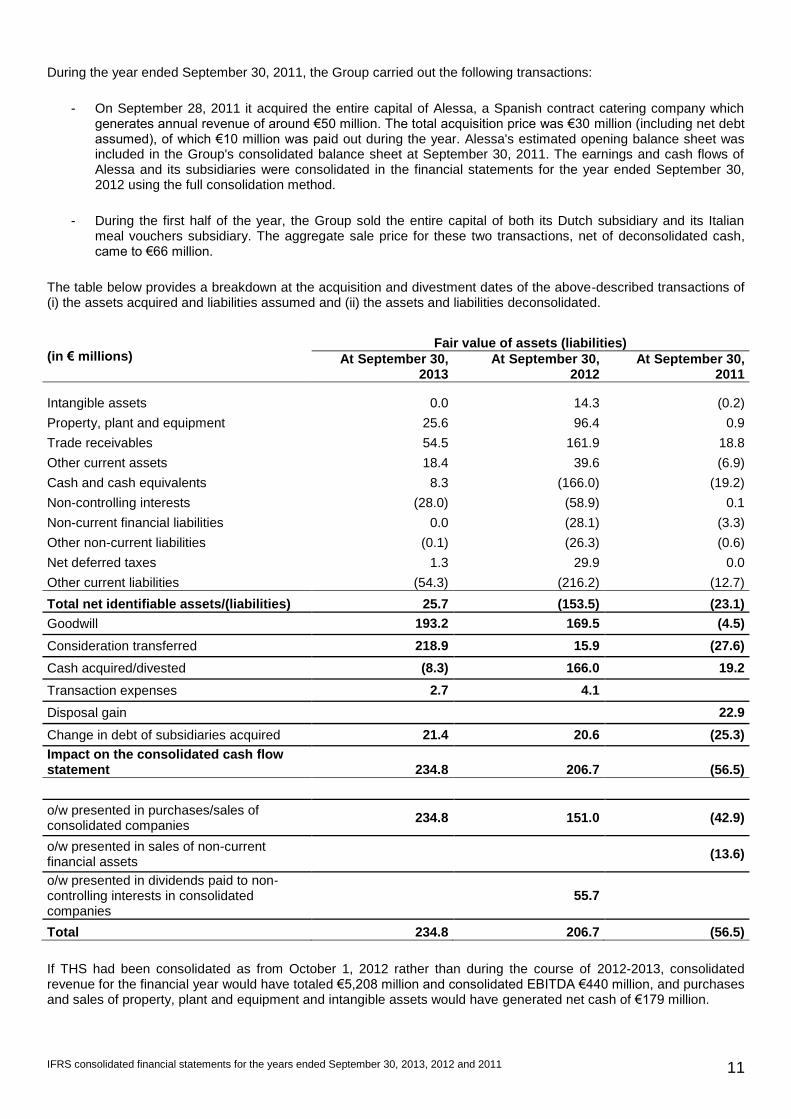
The table below provides a breakdown at the acquisition and divestment dates of the above-described transactions of (i) the assets acquired and liabilities assumed and (ii) the assets and liabilities deconsolidated.
(in € millions) Fair value of assets (liabilities)
At September 30, 2013
At September 30, 2012
At September 30, 2011
Intangible assets 0.0 14.3 (0.2)
Property, plant and equipment 25.6 96.4 0.9
Trade receivables 54.5 161.9 18.8
Other current assets 18.4 39.6 (6.9)
Cash and cash equivalents 8.3 (166.0) (19.2)
Non-controlling interests (28.0) (58.9) 0.1
Non-current financial liabilities 0.0 (28.1) (3.3)
Other non-current liabilities (0.1) (26.3) (0.6)
Net deferred taxes 1.3 29.9 0.0
Other current liabilities (54.3) (216.2) (12.7)
Total net identifiable assets/(liabilities) 25.7 (153.5) (23.1)
Goodwill 193.2 169.5 (4.5)
Consideration transferred 218.9 15.9 (27.6)
Cash acquired/divested (8.3) 166.0 19.2
Transaction expenses 2.7 4.1
Disposal gain 22.9
Change in debt of subsidiaries acquired 21.4 20.6 (25.3)
Impact on the consolidated cash flow statement 234.8 206.7 (56.5)
o/w presented in purchases/sales of consolidated companies
234.8 151.0 (42.9)
o/w presented in sales of non-current financial assets
(13.6)
o/w presented in dividends paid to non-controlling interests in consolidated companies
55.7
Total 234.8 206.7 (56.5)
If THS had been consolidated as from October 1, 2012 rather than during the course of 2012-2013, consolidated revenue for the financial year would have totaled €5,208 million and consolidated EBITDA €440 million, and purchases and sales of property, plant and equipment and intangible assets would have generated net cash of €179 million.
IFRS consolidated financial statements for the years ended September 30, 2013, 2012 and 2011 12
1 / 2 / 2 Other Significant Events
1 / 2 / 2 /1 Restructuring of the Group’s debt – Issuance of Senior Secured Notes by Elior Finance & Co (6.5% p.a. coupon and maturing in May 2020), and amendment and extension of bank credit facilities in 2012 and 2013
Year ended September 30, 2013 In April 2013, Elior Finance & Co SCA – a special purpose vehicle which is not a subsidiary of HBI – raised €350 million in the form of Senior Secured Notes maturing in May 2020 and bearing a 6.5% p.a. coupon which is payable semi-annually. Elior Finance & Co. subsequently on-lent the proceeds of the issuance to HBI in the form of a €350 million term loan, the maturity and other terms and conditions of which mirror those of the Senior Secured Notes. The documentation of this term loan forms part of the documentation of HBI's and Elior's main bank credit facilities. Also in April 2013, HBI and Elior amended their main bank credit facilities by way of an "Amend & Extend" process (third amendment), and in May 2013 Elior raised new money to refinance the non-extended portion of the Group's borrowings as well as its €100 million equity investment in THS (see section 1 /2 / 1 above). As a result of the Amend & Extend process and the raising of new money, the majority of the Group's borrowings now mature in March 2019. At September 30, 2013, the Group's medium and long-term bank credit facilities totaled €1,571.3 million (excluding the above-mentioned loan granted to HBI by Elior Finance & Co.). At that date the Group also had access to an undrawn revolving credit facility totaling €197.8 million, of which €74 million matures in March 2018 and the remaining €123.8 million in June 2016. Lastly, in late May 2013, Elior refinanced its receivables securitization program, increasing the program’s cap to €300 million and extending its maturity to January 2018. At September 30, 2013, the program covered French and Spanish trade receivables and the Group plans to include its Italian subsidiaries' receivables during 2013/2014.
Year ended September 30, 2012 In April 2012, HBI and Elior restructured their financing through an Amend & Extend process which essentially consisted of (i) extending the maturities of the syndicated bank loans of HBI and its subsidiary Elior to bring their principal maturity date to June 2017, and (ii) putting in place a €200 million acquisition financing facility.
The second and third amendments to the Senior Facility Agreement signed by HBI on April 11, 2012 and April 17, 2013 respectively resulted in an extinguishment of debt and the following were immediately recognized in the income statement:
- all of the unamortized issuance costs of the original facility; - the restructuring costs for the new facility.
For the extinguishment of debt resulting from the second amendment signed in April 2012, the analysis was based on the 10% test, i.e. after the debt renegotiation, there was more than a 10% difference between (i) the present value of the new cash flows (discounted using the original effective interest rate) and (ii) the present value of the initial cash flows (also discounted using the original effective interest rate). For the extinguishment of debt resulting from the third amendment signed in April 2013, the analysis took into account the fact that the bank counterparties for the Senior Facility Agreement had changed significantly, which meant that the "existing borrower and lender" condition in IAS39.40 was not met. The above-described renegotiations also led to new credit facilities being set up. The issuance costs for these new facilities were recognized in the balance sheet as a deduction from the related financial liabilities at September 30, 2012 and 2013 respectively, and are being amortized over the life of the debt using the amortized cost method.
1 / 2 / 2 / 2 Buyback of HBI shares
On February 2, 2012 HBI carried out a €350 million share buyback program by purchasing a total of 30,701,700 shares at a price of €11.40 per share. The purchased shares were subsequently cancelled.
IFRS consolidated financial statements for the years ended September 30, 2013, 2012 and 2011 13
2 / Accounting Policies
2 / 1 Basis of Preparation of the Consolidated Financial Statements
2 / 1 / 1 Basis of Preparation of the Consolidated Financial Statements for the Years Ended September 30, 2013, 2012 and 2011
In compliance with European Commission Regulation (EC) number 1606/2002 dated July 19, 2002, the HBI Elior Group’s consolidated financial statements for the years ended September 30, 2013, 2012 and 2011 have been prepared in accordance with International Financial Reporting Standards (IFRS), as published by the International Accounting Standards Board (IASB) and endorsed by the European Union’s Accounting Regulatory Committee. The IFRS and related interpretations adopted by the European Union can be viewed on the European Commission's website at http://ec.europa.eu/internal_market/accounting/ias/index_en.htm
The consolidated financial statements cover the operations, results and cash flows for the twelve-month periods ending on September 30, 2013, 2012 and 2011, as the financial year-end for HBI and its subsidiaries is September 30 of each calendar year. They are presented in millions of euro unless otherwise specified and were authorized for issue by HBI's Managing Partner on April 14, 2014.
The accounting principles in force at September 30, 2013 have been applied for all of the periods presented in these consolidated financial statements.
2 / 1 / 2 New Standards, Amendments and Interpretations adopted by the European Union and Applied by the Group
- Amendments to IFRS 7, "Disclosures – Transfers of Financial Assets", adopted by the EU on November 23, 2011. These amendments introduce requirements to improve the disclosures related to financial instruments.
- Amendments to IAS 1, "Presentation of Items of Other Comprehensive Income", adopted by the EU on June 6, 2012 as part of the convergence project with US GAAP. These amendments require entities to group items of other comprehensive income into those that may be subsequently reclassified to profit or loss and those that will not. In addition, the tax on items included in other comprehensive income must be disclosed separately. Application of this standard impacted the presentation of the Group's consolidated statement of comprehensive income at September 30, 2013.
2 / 1 / 3 New Standards, Amendments and Interpretations Issued by the IASB but not yet Applied by the Group
The standards, amendments and interpretations described below have been issued by the IASB for application in financial years subsequent to 2012-2013. They were adopted by the EU at December 31, 2012, and will therefore be applicable by the Group as from January 1, 2014 unless the Group decides to early adopt them. The practical implications of applying the following standards, amendments and interpretations and their effect on the Group’s financial statements are currently being analyzed but they are not expected to have a material impact on the presentation of the Group's results or on its financial position:
- IFRS 12, “Disclosure of Interests in Other Entities” and amendments to IFRS 10, IFRS 11 and IFRS 12 “Transition Guidance”, which were adopted by the EU in December 2012. This new standard and related amendments set out disclosure requirements regarding ent ities’ interests in subsidiaries, joint arrangements, associates and unconsolidated entities. These disclosure requirements are designed to help readers of financial statements evaluate the basis of control, as well as any restrictions on consolidated assets or liabilities. They are also aimed at helping evaluate the exposure to risks resulting from the entity’s interests in unconsolidated entities and from non-controlling interests in consolidated activities. Application of this standard and these amendments will require the Group to disclose additional information on the financial position and results of its joint ventures and special purpose entities.
- The revised version of IAS 19, “Employee Benefits”, which was adopted by the EU on June 6, 2012 and is effective for annual periods beginning on or after January 1, 2013. This revised standard removes the option
IFRS consolidated financial statements for the years ended September 30, 2013, 2012 and 2011 14
of deferring the recognition of certain actuarial gains and losses in the income statement over employees’ average remaining service period (known as the “corridor” method). The revised standard also requires additional disclosures on the risks related to employee benefit plans and their future cash flow impact. The Group recognized its actuarial gains and losses using the corridor method until September 30, 2013. Application of the revised version of IAS 19 would have had a negative €12 million impact (before tax) on the Group’s equity at September 30, 2013.
2 / 2 Consolidation Methods
The HBI Elior Group uses three different consolidation methods:
Full consolidation
Proportionate consolidation
Consolidation by the equity method
The full consolidation method is used when the consolidated entity is exclusively controlled by the Group's parent company. Control is deemed to exist where the parent company directly or indirectly holds a majority of the entity's voting rights. Alternatively, control may be considered to exist where the parent company has the right to appoint a majority of the entity's Board of Directors or equivalent body for two successive years, or exercises a dominant influence over the entity by virtue of a contract or the entity's articles of incorporation.
In accordance with IAS 27, potential voting rights attached to financial instruments that may, if they were exercised, give HBI and its subsidiaries voting power are taken into account where appropriate when assessing the existence of control and/or significant influence.
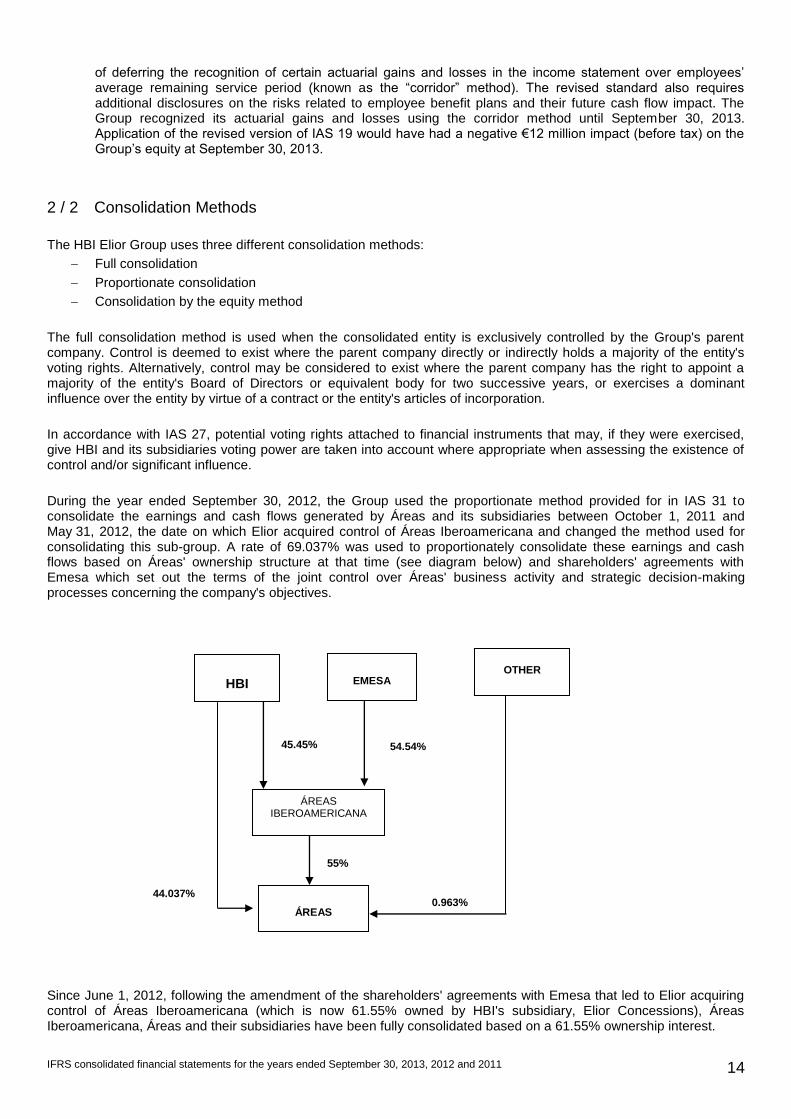
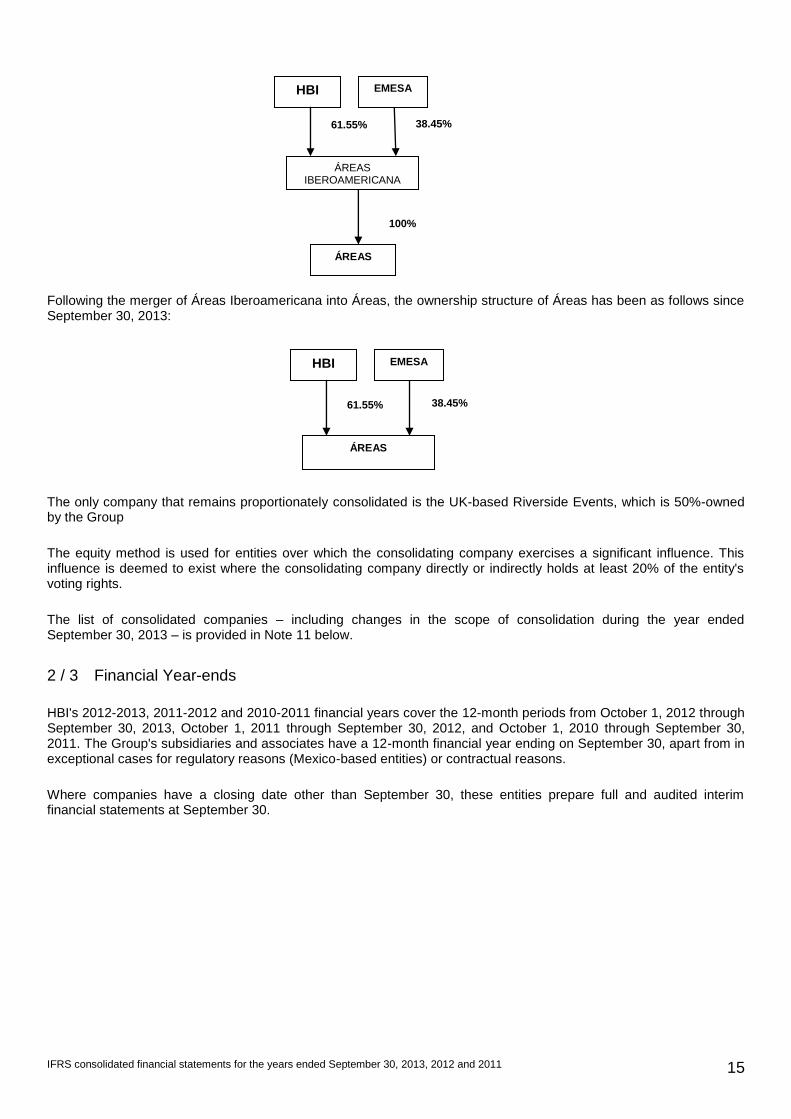
During the year ended September 30, 2012, the Group used the proportionate method provided for in IAS 31 to consolidate the earnings and cash flows generated by Áreas and its subsidiaries between October 1, 2011 and May 31, 2012, the date on which Elior acquired control of Áreas Iberoamericana and changed the method used for consolidating this sub-group. A rate of 69.037% was used to proportionately consolidate these earnings and cash flows based on Áreas' ownership structure at that time (see diagram below) and shareholders' agreements with Emesa which set out the terms of the joint control over Áreas' business activity and strategic decision-making processes concerning the company's objectives.
Since June 1, 2012, following the amendment of the shareholders' agreements with Emesa that led to Elior acquiring control of Áreas Iberoamericana (which is now 61.55% owned by HBI's subsidiary, Elior Concessions), Áreas Iberoamericana, Áreas and their subsidiaries have been fully consolidated based on a 61.55% ownership interest.
HBI
ÁREAS IBEROAMERICANA
ÁREAS
45.45% 54.54%
0.963%
55%
44.037%
EMESA
OTHER
IFRS consolidated financial statements for the years ended September 30, 2013, 2012 and 2011 15
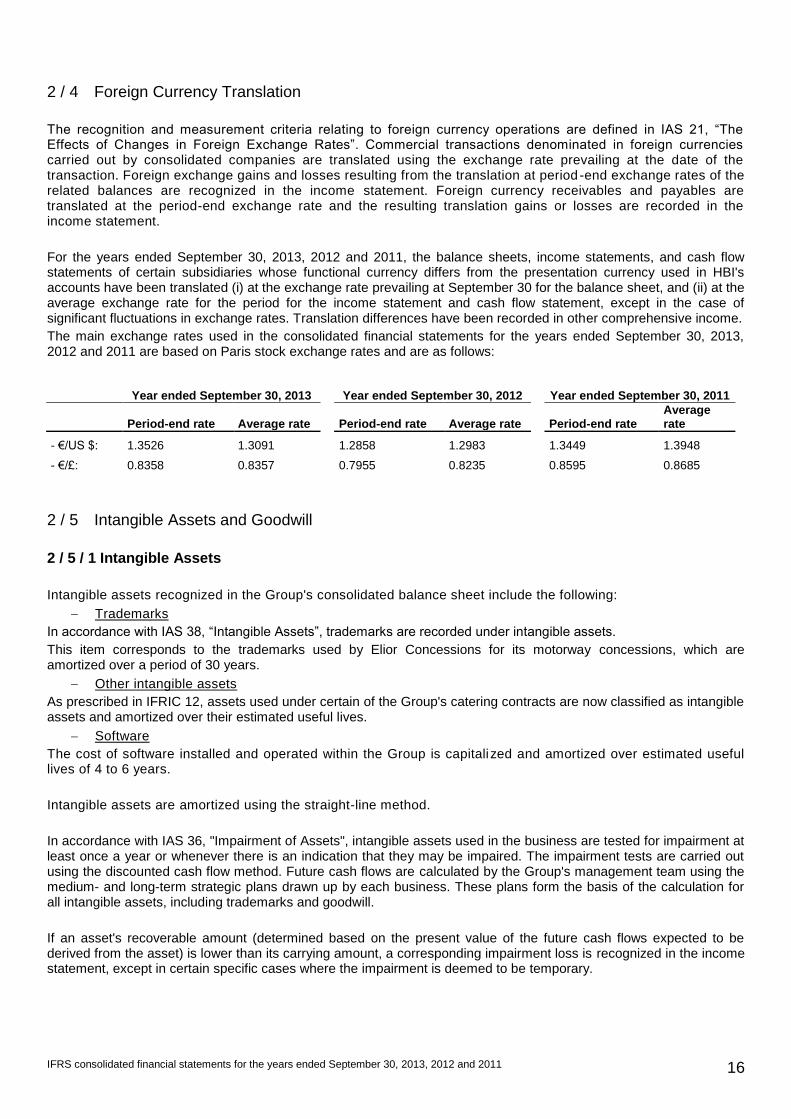
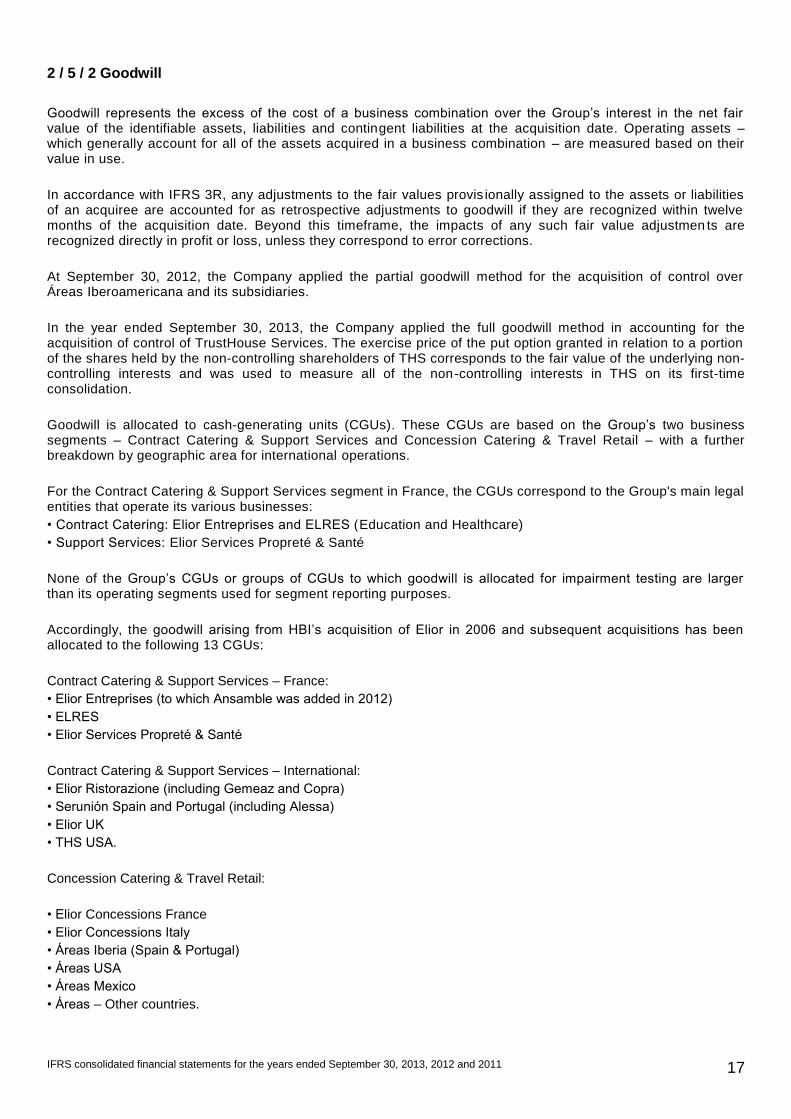
Following the merger of Áreas Iberoamericana into Áreas, the ownership structure of Áreas has been as follows since September 30, 2013:
The only company that remains proportionately consolidated is the UK-based Riverside Events, which is 50%-owned by the Group
The equity method is used for entities over which the consolidating company exercises a significant influence. This influence is deemed to exist where the consolidating company directly or indirectly holds at least 20% of the entity's voting rights.
The list of consolidated companies – including changes in the scope of consolidation during the year ended September 30, 2013 – is provided in Note 11 below.
2 / 3 Financial Year-ends
HBI's 2012-2013, 2011-2012 and 2010-2011 financial years cover the 12-month periods from October 1, 2012 through September 30, 2013, October 1, 2011 through September 30, 2012, and October 1, 2010 through September 30, 2011. The Group's subsidiaries and associates have a 12-month financial year ending on September 30, apart from in exceptional cases for regulatory reasons (Mexico-based entities) or contractual reasons.
Where companies have a closing date other than September 30, these entities prepare full and audited interim financial statements at September 30.
HBI
ÁREAS IBEROAMERICANA
ÁREAS
61.55% 38.45%
EMESA
100%
HBI
ÁREAS
EMESA
61.55% 38.45%
IFRS consolidated financial statements for the years ended September 30, 2013, 2012 and 2011 16
2 / 4 Foreign Currency Translation
The recognition and measurement criteria relating to foreign currency operations are defined in IAS 21, “The Effects of Changes in Foreign Exchange Rates”. Commercial transactions denominated in foreign currencies carried out by consolidated companies are translated using the exchange rate prevailing at the date of the transaction. Foreign exchange gains and losses resulting from the translation at period -end exchange rates of the related balances are recognized in the income statement. Foreign currency receivables and payables are translated at the period-end exchange rate and the resulting translation gains or losses are recorded in the income statement.
For the years ended September 30, 2013, 2012 and 2011, the balance sheets, income statements, and cash flow statements of certain subsidiaries whose functional currency differs from the presentation currency used in HBI's accounts have been translated (i) at the exchange rate prevailing at September 30 for the balance sheet, and (ii) at the average exchange rate for the period for the income statement and cash flow statement, except in the case of significant fluctuations in exchange rates. Translation differences have been recorded in other comprehensive income.
The main exchange rates used in the consolidated financial statements for the years ended September 30, 2013, 2012 and 2011 are based on Paris stock exchange rates and are as follows:
Year ended September 30, 2013 Year ended September 30, 2012 Year ended September 30, 2011
Period-end rate Average rate Period-end rate Average rate Period-end rate Average rate
- €/US $: 1.3526 1.3091 1.2858 1.2983 1.3449 1.3948
- €/£: 0.8358 0.8357 0.7955 0.8235 0.8595 0.8685
2 / 5 Intangible Assets and Goodwill
2 / 5 / 1 Intangible Assets
Intangible assets recognized in the Group's consolidated balance sheet include the following:
Trademarks
In accordance with IAS 38, “Intangible Assets”, trademarks are recorded under intangible assets.
This item corresponds to the trademarks used by Elior Concessions for its motorway concessions, which are amortized over a period of 30 years.
Other intangible assets
As prescribed in IFRIC 12, assets used under certain of the Group's catering contracts are now classified as intangible assets and amortized over their estimated useful lives.
Software
The cost of software installed and operated within the Group is capitalized and amortized over estimated useful lives of 4 to 6 years.
Intangible assets are amortized using the straight-line method.
In accordance with IAS 36, "Impairment of Assets", intangible assets used in the business are tested for impairment at least once a year or whenever there is an indication that they may be impaired. The impairment tests are carried out using the discounted cash flow method. Future cash flows are calculated by the Group's management team using the medium- and long-term strategic plans drawn up by each business. These plans form the basis of the calculation for all intangible assets, including trademarks and goodwill.
If an asset's recoverable amount (determined based on the present value of the future cash flows expected to be derived from the asset) is lower than its carrying amount, a corresponding impairment loss is recognized in the income statement, except in certain specific cases where the impairment is deemed to be temporary.
IFRS consolidated financial statements for the years ended September 30, 2013, 2012 and 2011 17
2 / 5 / 2 Goodwill
Goodwill represents the excess of the cost of a business combination over the Group’s interest in the net fair value of the identifiable assets, liabilities and contingent liabilities at the acquisition date. Operating assets – which generally account for all of the assets acquired in a business combination – are measured based on their value in use.
In accordance with IFRS 3R, any adjustments to the fair values provis ionally assigned to the assets or liabilities of an acquiree are accounted for as retrospective adjustments to goodwill if they are recognized within twelve months of the acquisition date. Beyond this timeframe, the impacts of any such fair value adjustmen ts are recognized directly in profit or loss, unless they correspond to error corrections.
At September 30, 2012, the Company applied the partial goodwill method for the acquisition of control over Áreas Iberoamericana and its subsidiaries.
In the year ended September 30, 2013, the Company applied the full goodwill method in accounting for the acquisition of control of TrustHouse Services. The exercise price of the put option granted in relation to a portion of the shares held by the non-controlling shareholders of THS corresponds to the fair value of the underlying non-controlling interests and was used to measure all of the non-controlling interests in THS on its first-time consolidation.
Goodwill is allocated to cash-generating units (CGUs). These CGUs are based on the Group’s two business segments – Contract Catering & Support Services and Concession Catering & Travel Retail – with a further breakdown by geographic area for international operations.
For the Contract Catering & Support Services segment in France, the CGUs correspond to the Group's main legal entities that operate its various businesses:
• Contract Catering: Elior Entreprises and ELRES (Education and Healthcare)
• Support Services: Elior Services Propreté & Santé
None of the Group’s CGUs or groups of CGUs to which goodwill is allocated for impairment testing are larger than its operating segments used for segment reporting purposes.
Accordingly, the goodwill arising from HBI’s acquisition of Elior in 2006 and subsequent acquisitions has been allocated to the following 13 CGUs:
Contract Catering & Support Services – France:
• Elior Entreprises (to which Ansamble was added in 2012)
• ELRES
• Elior Services Propreté & Santé
Contract Catering & Support Services – International:
• Elior Ristorazione (including Gemeaz and Copra)
• Serunión Spain and Portugal (including Alessa)
• Elior UK
• THS USA.
Concession Catering & Travel Retail:
• Elior Concessions France
• Elior Concessions Italy
• Áreas Iberia (Spain & Portugal)
• Áreas USA
• Áreas Mexico
• Áreas – Other countries.
IFRS consolidated financial statements for the years ended September 30, 2013, 2012 and 2011 18
As stipulated in IAS 36, "Impairment of Assets", goodwill is not amortized but is tested for impairment at least once a year or whenever there is an indication that it may be impaired. For the purpose of these tests, the carrying amount of the CGUs to which goodwill is allocated is compared with their recoverable amount, calculated using the discounted cash flow method. Where impairment in value is identified using this method and is confirmed by a market value analysis, the corresponding impairment loss is recorded under “Other income and expenses, net” in the income statement. A €25 million goodwill impairment loss was recognized in HBI's consolidated financial statements at September 30, 2013, primarily relating to Áreas' assets located in Spain and Portugal. A €63.3 million goodwill impairment loss had already been recognized in relation to these assets at September 30, 2012
No goodwill impairment losses were recognized in the year ended September 30, 2011.
2 / 6 Impairment Tests
The Group’s assets with finite and indefinite useful lives were tested for impairment at September 30, 2013, 2012 and 2011 based on the principles described in Notes 2 / 5 / 1 and 2 / 5 / 2 above.
The recoverable amounts of the CGUs were determined based on their value in use, calculated as the present value of the future cash flows expected to be derived from each CGU. The cash flow projections used for this calculation were based on the revenue forecasts for the first five years of the business plan, adjusted depending on the business and countries concerned and assuming stable or moderate growth in operating margins. Cash flow projections beyond this five-year period are estimated by extrapolating the projections using a long-term growth rate of between 2.0% and 2.5% for subsequent years depending on the countries and segments concerned (which remained relatively stable between 2011 and 2013). This growth rate must not, however, exceed the long-term average growth rate for the overall operating segment.
Future cash flows are discounted using the estimated weighted average cost of capital (WACC) for the segment.
The Group uses a post-tax discount rate applied to post-tax cash flows. IAS 36 recommends applying a pre-tax discount rate to pre-tax cash flows to determine the recoverable amount of a CGU. The same results are obtained using either of these methods.
The cash flows used are based on budgets drawn up for each CGU and validated by Group management.
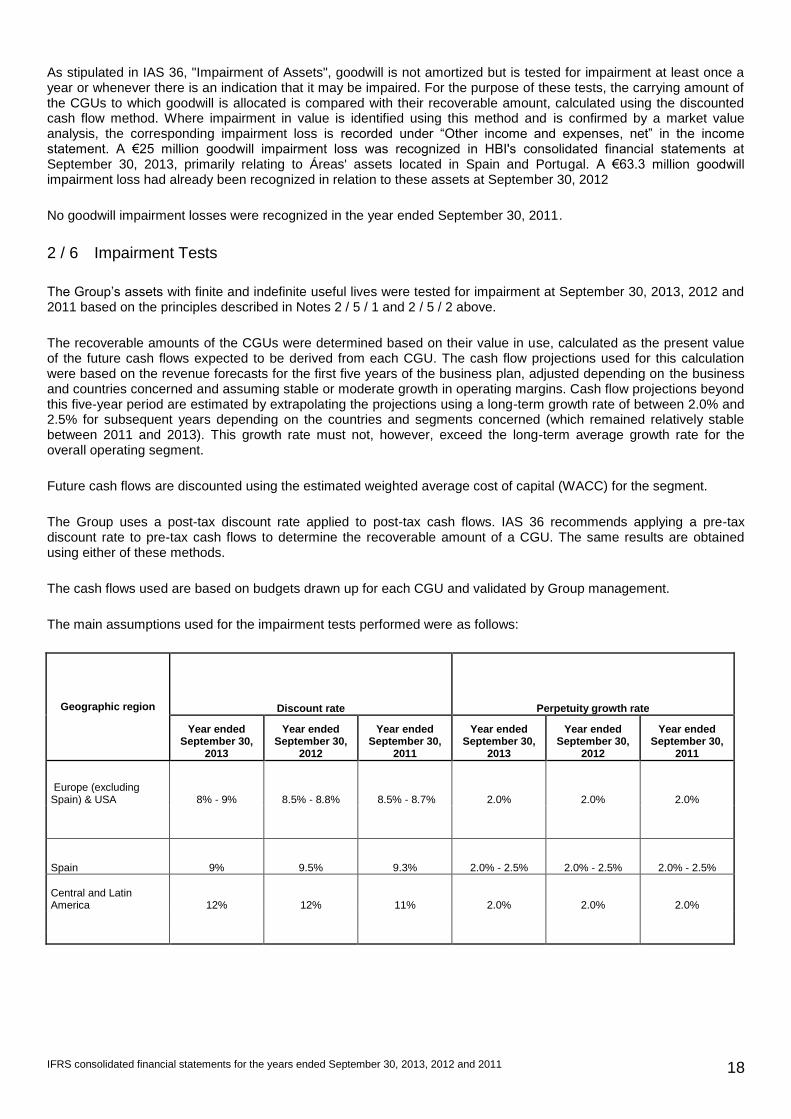
The main assumptions used for the impairment tests performed were as follows:
Geographic region Discount rate Perpetuity growth rate
Year ended September 30,
2013
Year ended September 30,
2012
Year ended September 30,
2011
Year ended September 30,
2013
Year ended September 30,
2012
Year ended September 30,
2011
Europe (excluding Spain) & USA 8% - 9% 8.5% - 8.8% 8.5% - 8.7% 2.0% 2.0% 2.0%
Spain 9% 9.5% 9.3% 2.0% - 2.5% 2.0% - 2.5% 2.0% - 2.5%
Central and Latin America 12% 12% 11% 2.0% 2.0% 2.0%
IFRS consolidated financial statements for the years ended September 30, 2013, 2012 and 2011 19
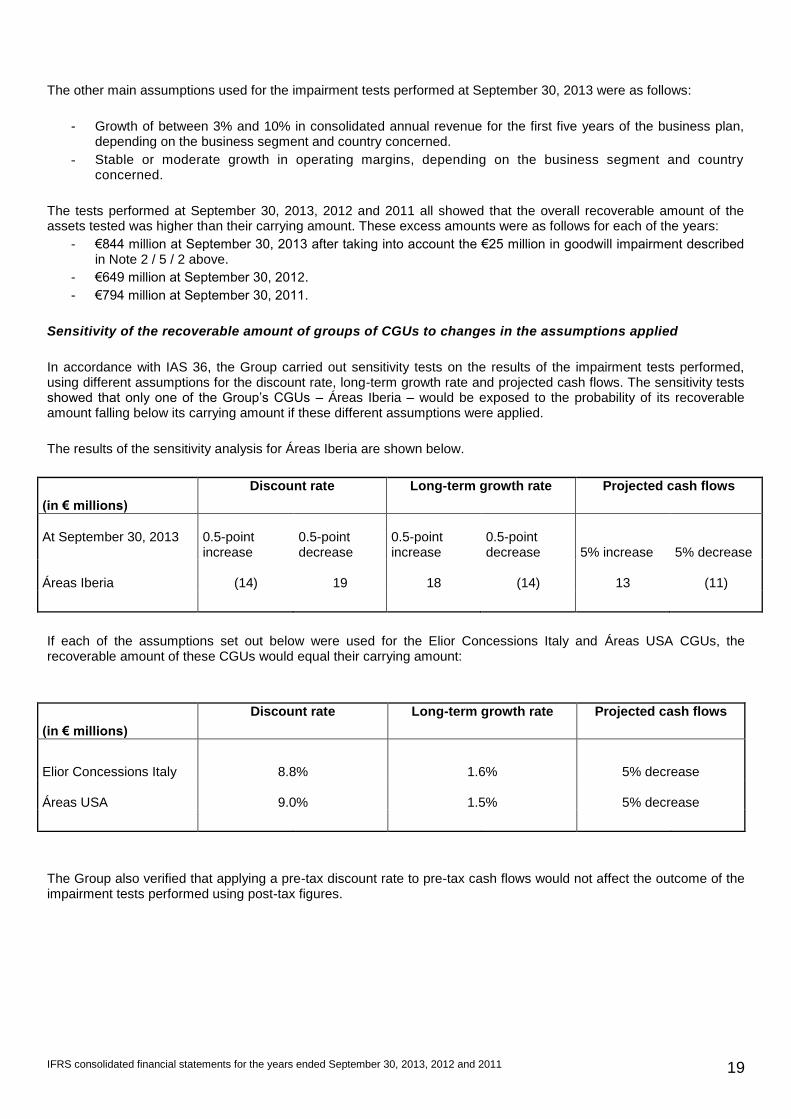
The other main assumptions used for the impairment tests performed at September 30, 2013 were as follows:
- Growth of between 3% and 10% in consolidated annual revenue for the first five years of the business plan, depending on the business segment and country concerned.
- Stable or moderate growth in operating margins, depending on the business segment and country concerned.
The tests performed at September 30, 2013, 2012 and 2011 all showed that the overall recoverable amount of the assets tested was higher than their carrying amount. These excess amounts were as follows for each of the years:
- €844 million at September 30, 2013 after taking into account the €25 million in goodwill impairment described in Note 2 / 5 / 2 above.
- €649 million at September 30, 2012.
- €794 million at September 30, 2011.
Sensitivity of the recoverable amount of groups of CGUs to changes in the assumptions applied
In accordance with IAS 36, the Group carried out sensitivity tests on the results of the impairment tests performed, using different assumptions for the discount rate, long-term growth rate and projected cash flows. The sensitivity tests showed that only one of the Group’s CGUs – Áreas Iberia – would be exposed to the probability of its recoverable amount falling below its carrying amount if these different assumptions were applied.
The results of the sensitivity analysis for Áreas Iberia are shown below.
(in € millions)
Discount rate Long-term growth rate Projected cash flows
At September 30, 2013
0.5-point increase
0.5-point decrease
0.5-point increase
0.5-point decrease 5% increase 5% decrease
Áreas Iberia (14) 19 18 (14) 13 (11)
If each of the assumptions set out below were used for the Elior Concessions Italy and Áreas USA CGUs, the recoverable amount of these CGUs would equal their carrying amount:
(in € millions)
Discount rate Long-term growth rate Projected cash flows
Elior Concessions Italy 8.8% 1.6% 5% decrease
Áreas USA 9.0% 1.5%
5% decrease
The Group also verified that applying a pre-tax discount rate to pre-tax cash flows would not affect the outcome of the impairment tests performed using post-tax figures.
IFRS consolidated financial statements for the years ended September 30, 2013, 2012 and 2011 20
2 / 7 Property, Plant and Equipment
As permitted under IAS 16, “Property, Plant and Equipment” the Group has elected to apply the cost model rather than the revaluation model for measuring property, plant and equipment. The capitalization of borrowing costs provided for in IAS 23R is not applicable to the Group. Property, plant and equipment are depreciated using the straight-line method, over the estimated useful lives of each main class of asset, as follows:
Buildings: between 15 and 25 years
Fixtures and fittings: 10 years
Technical installations: between 10 and 12 years
Machinery and tools: between 5 and 10 years
Office equipment: between 4 and 5 years
Computers: between 3 and 4 years
Vehicles: 4 years
Other: 10 years
The residual values and useful lives of property, plant and equipment are reviewed at each financial year-end based on indicators such as the term of the underlying operating contract.
In accordance with IAS 36, “Impairment of Assets”, property, plant and equipment are tested for impairment at least once a year or whenever there is an indication that they may be impaired. For the purpose of these tests, the carrying amount of the assets concerned is added to that of the goodwill which has been allocated to the relevant CGU and this carrying amount is then compared with the assets’ recoverable amount, calculated using the discounted cash flow method. Where impairment in value is identified using this method and is confirmed by a market value analysis, the corresponding impairment loss is recorded under “Other income and expenses, net” in the income statement. At September 30, 2013 there were no indications that the Group's property, plant or equipment was impaired.
In accordance with IAS 17, items of property, plant and equipment held under finance leases are treated as if they had been purchased outright under a loan agreement. The leased item is recognized as an asset at an amount corresponding to the present value of the minimum lease payments and is depreciated over its estimated useful life. An obligation in the same amount is recognized under debt on the liabilities side of the balance sheet. Lease payments are then apportioned between the finance charge and the reduction of the outstanding liability.
2 / 8 Operating Working Capital Accounts (Inventories and Trade and Other Receivables)
2 / 8 / 1 Inventories
Inventories of raw materials and merchandise are measured at the lower of cost and net realizable value.
The majority of the Group's inventories are measured at the most recent purchase price, given the high turnover rate due to inventories being primarily composed of perishable goods. This method is consistent with the "First-in First-out method" recommended in IAS 2, “Inventories”. Borrowing costs are not included in the measurement.
2 / 8 / 2 Trade and Other Receivables
Trade and other receivables are initially recognized at fair value. If these items subsequently become impaired a provision is recorded in the income statement, calculated either specifically or statistically based on the estimated future loss rates of the operating companies concerned.
The balance sheets of Concession Catering & Travel Retail companies do not generally include significant amounts of trade receivables. In the Contract Catering & Support Services business there is no material exposure to concentrations of customer credit risk at Group level as the relevant companies have a large number of customers and the geographic locations of these customers and the operating sites concerned are highly diverse.
IFRS consolidated financial statements for the years ended September 30, 2013, 2012 and 2011 21
2 / 9 Cash and Cash Equivalents
Cash and cash equivalents are held primarily to meet the Group's short-term cash needs rather than for investment or other purposes. Cash and cash equivalents consist of cash balances, cash in the process of collection, deposits with maturities of less than three months, money-market mutual funds and money-market securities, which can be realized or sold at short notice and are subject to an insignificant risk of changes in value.
Bank overdrafts repayable on demand and current accounts held for treasury management purposes are an integral part of the Group's cash management and are therefore deducted from cash in the cash flow statement whereas they are classified as short-term debt in the balance sheet. These items represent the sole difference between the amounts of cash and cash equivalents presented in the balance sheet and those presented in the cash flow statement.
The cash flow statement is presented based on the indirect method.
2 / 10 Provisions
In accordance with IAS 37, “Provisions, Contingent Liabilities and Contingent Assets”, provisions recorded by the Group are intended to cover liabilities of uncertain timing or amount. These liabilities represent a present legal or constructive obligation of the entity arising from past events, the settlement of which is expected to result in an outflow from the entity of resources embodying economic benefits. They include compensation estimated by the Group and its legal counsel for litigation, claims and disputes brought by third parties. The provisions are discounted when the effect of the time value of money is material. Where discounting is used, the impact on the provision is assessed at each balance sheet date and is recognized in the accounts.
2 / 11 Current and Deferred Taxes
Consolidated income tax corresponds to the aggregate amount of income tax reported by each of the Group's companies, adjusted for any deferred taxes. French subsidiaries that are over 95%-owned by HBI form part of a consolidated tax group headed by HBI.
The Group has elected to apply the following accounting treatment to the business tax (Contribution Economique Territoriale – CET) applicable to French entities pursuant to the 2010 French Finance Act:
- The portion of the CET tax based on the rental value of real estate (CFE) is recognized as an operating expense.
- The portion of the CET tax based on the value added by the business (CVAE) is recognized as an income tax within the meaning of IAS 12.
In accordance with IAS 12, “Income Taxes”, deferred taxes are recognized for (i) all temporary differences between the carrying amount of an asset or liability in the balance sheet and its tax base, and (ii) the carryforward of unused tax losses to the extent that it is probable that future taxable profit will be available against which the unused tax losses can be utilized. Deferred taxes are calculated using the liability method, based on the tax rates and tax laws that have been enacted or substantively enacted at the balance sheet date. The impact of changes in tax rates is recorded in the income statement, except if the related tax was generated by a transaction recognized directly in equity, in which case the impact of the change in tax rate is also recognized in equity. Deferred tax assets and liabilities are not discounted.
The reform introduced by the French Amended Finance Act for 2012 – which limits the amount of tax loss carryforwards that can be offset annually against taxable profit – did not affect the amount of deferred taxes recognized in relation to HBI's tax loss carryforwards at September 30, 2013 or 2012.
2 / 12 Employee Benefits
Statutory retirement bonuses, long-service awards and pension plans
In accordance with IAS 19, “Employee Benefits”, the Group's pension and other post-employment benefit obligations are measured by independent actuaries. A provision to cover these obligations (including the related payroll taxes) is recorded in the consolidated balance sheet.
IFRS consolidated financial statements for the years ended September 30, 2013, 2012 and 2011 22
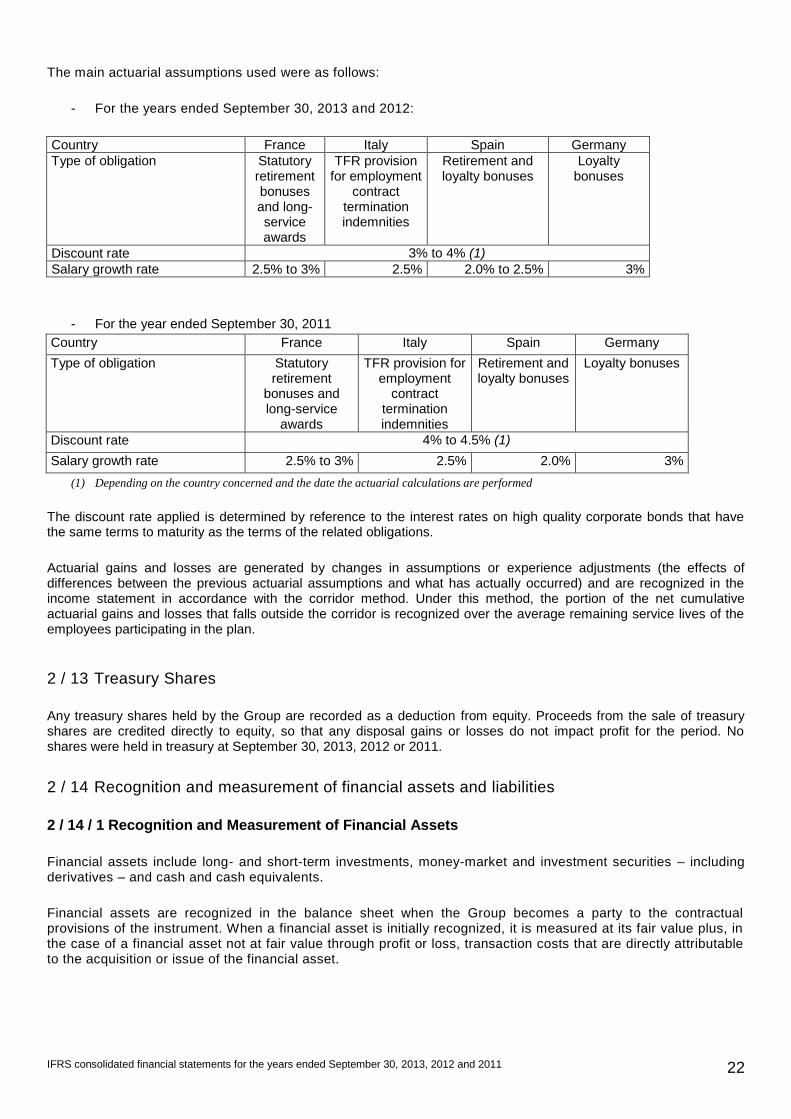
The main actuarial assumptions used were as follows:
- For the years ended September 30, 2013 and 2012:
Country France Italy Spain Germany
Type of obligation Statutory retirement bonuses and long-service awards
TFR provision for employment
contract termination indemnities
Retirement and loyalty bonuses
Loyalty bonuses
Discount rate 3% to 4% (1)
Salary growth rate 2.5% to 3% 2.5% 2.0% to 2.5% 3%
- For the year ended September 30, 2011
Country France Italy Spain Germany
Type of obligation Statutory retirement
bonuses and long-service
awards
TFR provision for employment
contract termination indemnities
Retirement and loyalty bonuses
Loyalty bonuses
Discount rate 4% to 4.5% (1)
Salary growth rate 2.5% to 3% 2.5% 2.0% 3%
(1) Depending on the country concerned and the date the actuarial calculations are performed
The discount rate applied is determined by reference to the interest rates on high quality corporate bonds that have the same terms to maturity as the terms of the related obligations.
Actuarial gains and losses are generated by changes in assumptions or experience adjustments (the effects of differences between the previous actuarial assumptions and what has actually occurred) and are recognized in the income statement in accordance with the corridor method. Under this method, the portion of the net cumulative actuarial gains and losses that falls outside the corridor is recognized over the average remaining service lives of the employees participating in the plan.
2 / 13 Treasury Shares
Any treasury shares held by the Group are recorded as a deduction from equity. Proceeds from the sale of treasury shares are credited directly to equity, so that any disposal gains or losses do not impact profit for the period. No shares were held in treasury at September 30, 2013, 2012 or 2011.
2 / 14 Recognition and measurement of financial assets and liabilities
2 / 14 / 1 Recognition and Measurement of Financial Assets
Financial assets include long- and short-term investments, money-market and investment securities – including derivatives – and cash and cash equivalents.
Financial assets are recognized in the balance sheet when the Group becomes a party to the contractual provisions of the instrument. When a financial asset is initially recognized, it is measured at its fair value plus, in the case of a financial asset not at fair value through profit or loss, transaction costs that are directly attributable to the acquisition or issue of the financial asset.
IFRS consolidated financial statements for the years ended September 30, 2013, 2012 and 2011 23
At the acquisition date, the Group classifies financial assets in one of the following four categories defined in IAS 39:
Held-to-maturity investments
Held-to-maturity investments are financial assets with fixed or determinable payments and fixed maturities that an entity has the positive intention and ability to hold to maturity. After initial recognition at fair value they are measured at amortized cost using the effective interest method. The Group did not have any held -to-maturity investments at September 30, 2013, 2012 or 2011.
Loans and receivables
Loans and receivables include advances to non-consolidated companies, other loans and advances, trade receivables and deposits and guarantees. After initial recognition at fair value they are measured at amortized cost using the effective interest method.
Trade receivables are initially recognized at fair value, which generally corresponds to their nominal value, unless the discounting impact is material.
An impairment loss is recorded as an operating expense if the recoverable amount of a loan or receivable is lower than its carrying amount.
Deposits and guarantees correspond to amounts paid to lessors as guarantees for rental payments. The value of these assets is adjusted regularly in line with adjustments to the corresponding rental payments. The impact of discounting these amounts is deemed to be non-material for the Group's consolidated financial statements. Whenever there is an indication that these assets may be impaired, they are tested for impairment and an impairment loss is recorded in the income statement if their estimated recoverable amount is lower than their carrying amount.
Available-for-sale financial assets
These assets are measured at fair value and any gains or losses arising from changes in fair value are recorded directly in equity. When a decline in the fair value of an available-for-sale financial asset has been recognized in equity and there is objective evidence that the asset is impaired, the cumulative loss that has been recognized in equity is removed from equity and recognized in profit or loss. Any reversals of im pairment losses are recognized in the income statement only for debt securities (including bonds).
The cumulative gain or loss previously recognized in equity is recognized in profit or loss when the asset is sold.
Fair value corresponds to the market price for listed securities or an estimate of the fair value of unlisted securities, determined based on financial criteria that are deemed to be the most appropriate for the security concerned. Investments in non-consolidated companies that are not quoted in an active market and whose fair value cannot be reliably measured are stated at cost, less any impairment losses.
Financial assets at fair value through profit or loss
Financial assets at fair value through profit or loss correspond to assets that are held for trading which the Group intends to sell in the near term.
2 / 14 / 2 Recognition and Measurement of Financial Liabilities
Financial liabilities include loans, other borrowings and bank overdrafts, derivatives and trade payables.
Borrowings and other financial liabilities – excluding derivatives – are measured at amortized cost, using the effective interest method. If the liability is issued at a premium or discount or transaction costs are incurred on its issuance, the premium, discount or transaction costs are amortized over the life of the liability using the effective interest method.
IFRS consolidated financial statements for the years ended September 30, 2013, 2012 and 2011 24
2 / 15 Recognition and Measurement of Derivatives
2 / 15 / 1 Interest Rate and Foreign Currency Instruments
In accordance with IAS 39, derivatives are recognized in the balance sheet at fair value. As prescribed in IFRS 7, the fair value of interest rate derivatives corresponds to their market value, calculated by discounting future cash flows at the interest rate prevailing at the balance sheet date.
The method used for recognizing changes in the fair value of derivatives depends on (i) whether there is formal designation and documentation of a hedging relationship in accordance with the criteria in IAS 39, and (ii) the type of hedge used:
If there is no hedging relationship within the meaning of IAS 39, changes in fair value of derivatives are recorded in the income statement.
The effective portion of changes in the fair value of derivatives that are designated and qualify as cash flow hedges is recognized in equity. The gain or loss relating to the ineffective portion is recognized in the income statement.
Changes in the fair value of derivatives that are designated and qualify as fair value hedges are recorded in the income statement, together with any changes in the fair value of the hedged asset or liability that are attributable to the hedged risk.
2 / 15 / 2 Equity Derivatives (put options over non-controlling interests)
When the Group acquires an equity interest in a subsidiary, it may give the non-controlling shareholders of the acquired subsidiary a commitment to subsequently purchase their shares. Such purchase commitments correspond to put options granted by the Group.
In accordance with the revised version of IFRS 3, the Group recognizes a financial liability in its consolidated IFRS accounts for put options granted to non-controlling shareholders, with the amount of the liability calculated based on the price formulas in the related contractual documentation. A corresponding adjustment is made to equity and subsequent changes in the value of the financial liability are recognized in equity. For put options granted in connection with acquisitions carried out before the Group’s application of IFRS 3R, any changes in the value of the underlying financial liability that arise subsequent to initial recognition as a result of the change in the estimated value of the options' exercise price are recorded as an adjustment to goodwill, which was the accounting treatment applied prior to IFRS 3R.
In accordance with IAS 32.25, when the Group acquired control of Áreas Iberoamericana in May 2012 with a 61.55% ownership interest, as the new shareholders' agreement provides that the entire amount of the company's profit must be paid out in the form of dividends, a liability was recognized in the consolidated financial statements for the estimated cash outflows required to pay the dividends to Áreas’ minority shareholders for the following five years. This liability – which was deducted in full from equity attributable to non-controlling interests – amounted to €18 million at September 30, 2013 and 2012.
2 / 16 Definition of Net Debt
Net debt as defined by the Group represents short- and long-term debt plus the fair value of derivative financial instruments recognized under liabilities, less cash and cash equivalents, short -term financial receivables and the fair value of derivative financial instruments recognized under assets. It does not include liabilities relating to share acquisitions.
2 / 17 Revenue
Consolidated revenue corresponds to sales of goods and services in the course of the ordinary activities of consolidated companies. It includes all income provided for in the Group's contracts, whether the Group entity concerned is acting as principal (the majority of cases) or agent.
Revenue is measured at the fair value of the consideration received or receivable, net of all discounts and
IFRS consolidated financial statements for the years ended September 30, 2013, 2012 and 2011 25
rebates, VAT and other sales taxes. It is recognized when it is probable that future economic benefits will flow to the Group and these benefits can be measured reliably. No revenue is recognized if there is significant uncertainty about the recoverability of the costs incurred in connection with the rendering of services.
Revenue generated on the rendering of contract catering services and support services or the sale of goods in travel retail stores is recognized when the service is rendered or the goods sold.
2 / 18 Other Operating Expenses
This item includes all recurring operating expenses except costs for the purchase of raw materials and consumables, personnel costs, taxes other than on income, and amortization, depreciation and provision expense.
2 / 19 EBITDA EBITDA is defined as recurring operating profit, including share of profit of associates, before depreciation, amortization and provisions for recurring operating items.
2 / 20 Recurring Operating Profit
Recurring operating profit represents total income less total expenses before (i) other income and expenses, net, (ii) financial income and expenses, (ii) profit/(loss) from discontinued operations or operations held for sale, and (iii) income tax. In accordance with recommendation 2013-01 issued by the French National Accounting Board (ANC), the Group has decided to reclassify "Share of profit of associates", which is now included within recurring operating profit.
2 / 21 Other Income and Expenses, Net
This item consists of income and expenses that are not considered as generated or incurred in the normal course of business, and mainly includes impairment of goodwill and other non-current assets, non-recurring significant restructuring costs, costs incurred in the course of debt restructuring, acquisition cos ts of consolidated subsidiaries, and gains and losses on disposals of assets or investments in consolidated companies. It also includes annual charges to amortization recorded in the consolidated financial statements for intangible assets (notably customer relationships) that are recognized on business combinations.
2 / 22 Calculation of Earnings Per Share
In accordance with IAS 33, basic earnings per share is calculated by dividing profit attributable to owners of the parent by the weighted average number of ordinary shares outstanding during the period excluding ordinary shares purchased by the Company and held as treasury shares.
For the purpose of calculating diluted earnings per share, (i) the weighted average number of ordinary shares outstanding is increased by the weighted average number of additional ordinary shares that would have been outstanding assuming the conversion of all dilutive potential ordinary shares, and (ii) profit attributable to owners of the parent is increased by the amount of dividends and interest recognized in the period in respect of any dilutive potential ordinary shares and is adjusted for any other changes in income or expense that would result from the conversion of the dilutive potential ordinary shares.
Potential ordinary shares are treated as dilutive, when, and only when, their conversion to ordinary shares would decrease earnings per share or increase loss per share.
2 / 23 Segment Reporting
At September 30, 2013, 2012 and 2011, the Group was structured into two main operating segments: Contract Catering & Support Services, and Concession Catering & Travel Retail, as well as an operating segment corresponding to headquarters, holding companies and purchasing entities. The two main operating segments comprise two principal geographic areas – France and International.
IFRS consolidated financial statements for the years ended September 30, 2013, 2012 and 2011 26
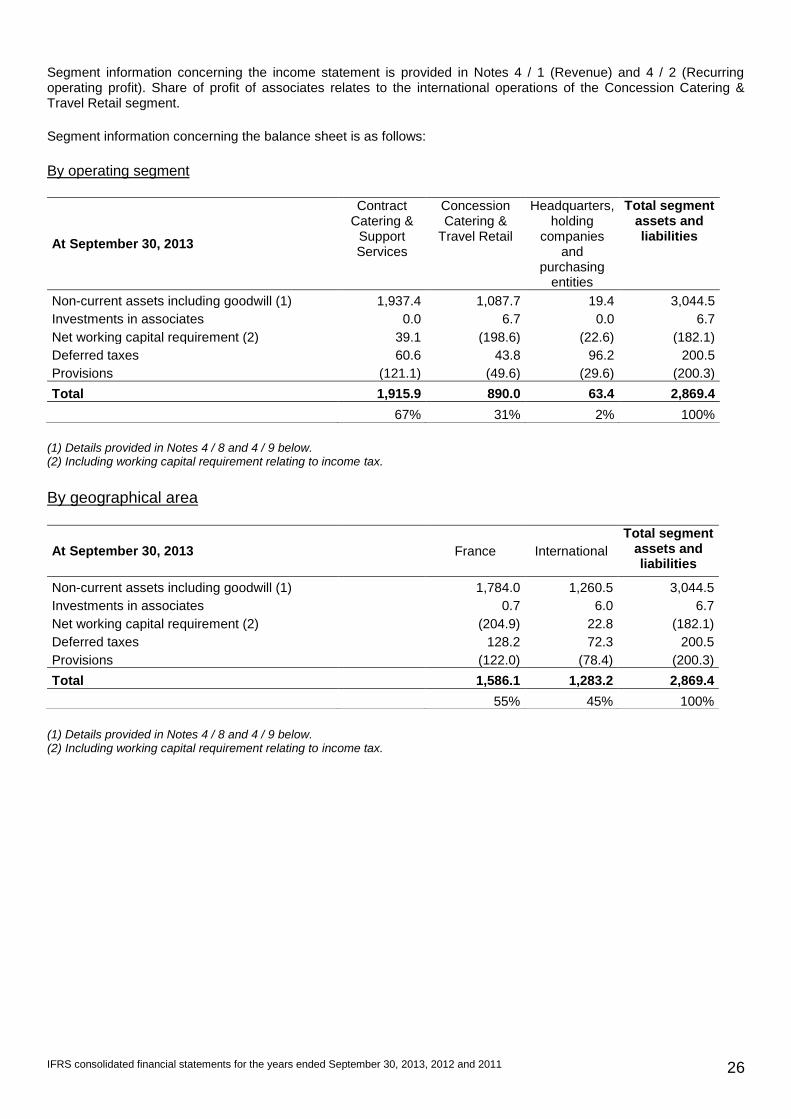
Segment information concerning the income statement is provided in Notes 4 / 1 (Revenue) and 4 / 2 (Recurring operating profit). Share of profit of associates relates to the international operations of the Concession Catering & Travel Retail segment.
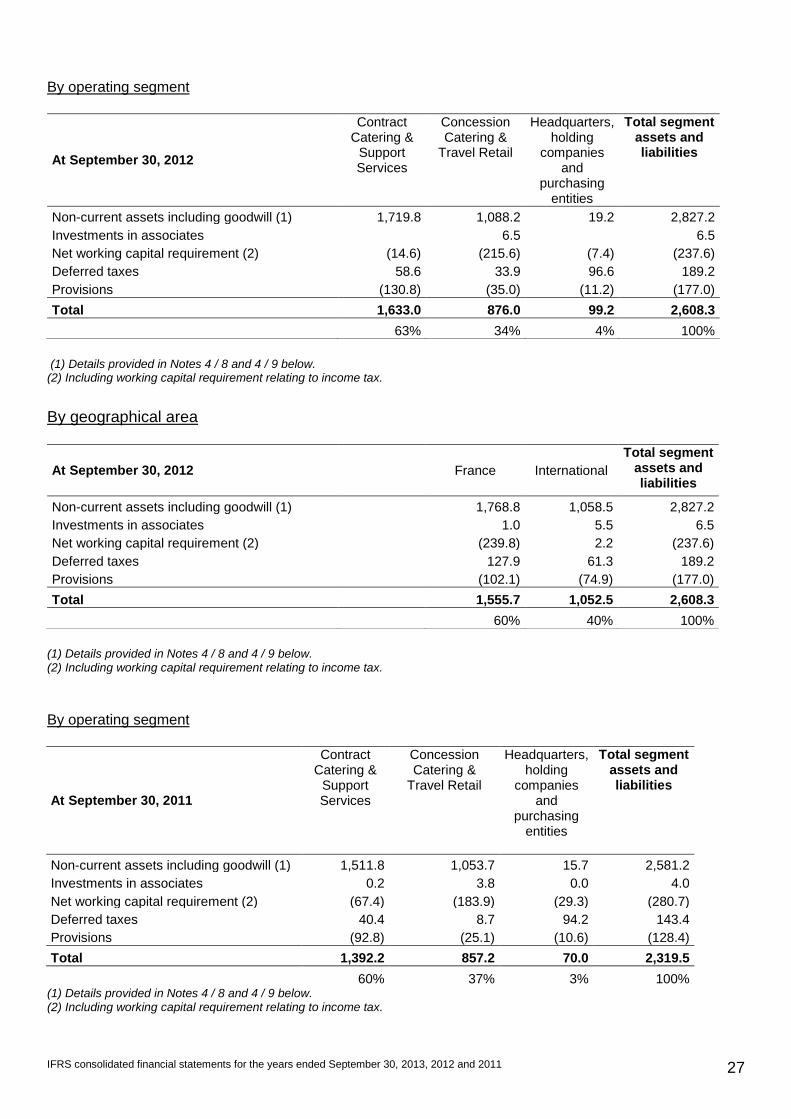
Segment information concerning the balance sheet is as follows:
By operating segment
At September 30, 2013
Contract Catering &
Support Services
Concession Catering &
Travel Retail
Headquarters, holding
companies and
purchasing entities
Total segment assets and liabilities
Non-current assets including goodwill (1) 1,937.4 1,087.7 19.4 3,044.5
Investments in associates 0.0 6.7 0.0 6.7
Net working capital requirement (2) 39.1 (198.6) (22.6) (182.1)
Deferred taxes 60.6 43.8 96.2 200.5
Provisions (121.1) (49.6) (29.6) (200.3)
Total 1,915.9 890.0 63.4 2,869.4
67% 31% 2% 100%
(1) Details provided in Notes 4 / 8 and 4 / 9 below. (2) Including working capital requirement relating to income tax.
By geographical area
At September 30, 2013
France International
Total segment assets and liabilities
Non-current assets including goodwill (1)
1,784.0 1,260.5 3,044.5
Investments in associates
0.7 6.0 6.7
Net working capital requirement (2)
(204.9) 22.8 (182.1)
Deferred taxes
128.2 72.3 200.5
Provisions
(122.0) (78.4) (200.3)
Total 1,586.1 1,283.2 2,869.4
55% 45% 100%
(1) Details provided in Notes 4 / 8 and 4 / 9 below. (2) Including working capital requirement relating to income tax.
IFRS consolidated financial statements for the years ended September 30, 2013, 2012 and 2011 27
By operating segment
At September 30, 2012
Contract Catering &
Support Services
Concession Catering &
Travel Retail
Headquarters, holding
companies and
purchasing entities
Total segment assets and liabilities
Non-current assets including goodwill (1) 1,719.8 1,088.2 19.2 2,827.2
Investments in associates
6.5
6.5
Net working capital requirement (2) (14.6) (215.6) (7.4) (237.6)
Deferred taxes 58.6 33.9 96.6 189.2
Provisions (130.8) (35.0) (11.2) (177.0)
Total 1,633.0 876.0 99.2 2,608.3
63% 34% 4% 100%
(1) Details provided in Notes 4 / 8 and 4 / 9 below. (2) Including working capital requirement relating to income tax.
By geographical area
At September 30, 2012
France International
Total segment assets and liabilities
Non-current assets including goodwill (1)
1,768.8 1,058.5 2,827.2
Investments in associates
1.0 5.5 6.5
Net working capital requirement (2)
(239.8) 2.2 (237.6)
Deferred taxes
127.9 61.3 189.2
Provisions
(102.1) (74.9) (177.0)
Total 1,555.7 1,052.5 2,608.3
60% 40% 100%
(1) Details provided in Notes 4 / 8 and 4 / 9 below. (2) Including working capital requirement relating to income tax.
By operating segment
At September 30, 2011
Contract Catering &
Support Services
Concession Catering &
Travel Retail
Headquarters, holding
companies and
purchasing entities
Total segment assets and liabilities
Non-current assets including goodwill (1) 1,511.8 1,053.7 15.7 2,581.2
Investments in associates 0.2 3.8 0.0 4.0
Net working capital requirement (2) (67.4) (183.9) (29.3) (280.7)
Deferred taxes 40.4 8.7 94.2 143.4
Provisions (92.8) (25.1) (10.6) (128.4)
Total 1,392.2 857.2 70.0 2,319.5
60% 37% 3% 100%
(1) Details provided in Notes 4 / 8 and 4 / 9 below. (2) Including working capital requirement relating to income tax.
IFRS consolidated financial statements for the years ended September 30, 2013, 2012 and 2011 28
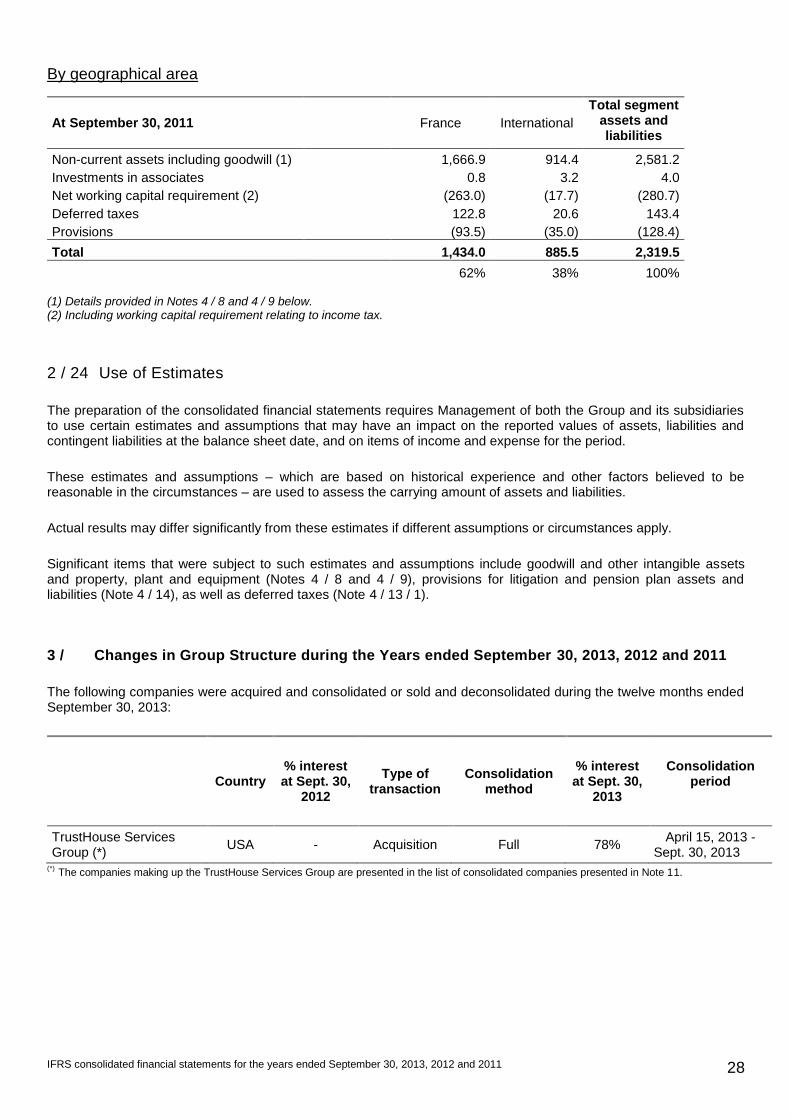
By geographical area
At September 30, 2011
France International
Total segment assets and liabilities
Non-current assets including goodwill (1)
1,666.9 914.4 2,581.2
Investments in associates
0.8 3.2 4.0
Net working capital requirement (2)
(263.0) (17.7) (280.7)
Deferred taxes
122.8 20.6 143.4
Provisions
(93.5) (35.0) (128.4)
Total 1,434.0 885.5 2,319.5
62% 38% 100%
(1) Details provided in Notes 4 / 8 and 4 / 9 below. (2) Including working capital requirement relating to income tax.
2 / 24 Use of Estimates
The preparation of the consolidated financial statements requires Management of both the Group and its subsidiaries to use certain estimates and assumptions that may have an impact on the reported values of assets, liabilities and contingent liabilities at the balance sheet date, and on items of income and expense for the period.
These estimates and assumptions – which are based on historical experience and other factors believed to be reasonable in the circumstances – are used to assess the carrying amount of assets and liabilities.
Actual results may differ significantly from these estimates if different assumptions or circumstances apply.
Significant items that were subject to such estimates and assumptions include goodwill and other intangible assets and property, plant and equipment (Notes 4 / 8 and 4 / 9), provisions for litigation and pension plan assets and liabilities (Note 4 / 14), as well as deferred taxes (Note 4 / 13 / 1).
3 / Changes in Group Structure during the Years ended September 30, 2013, 2012 and 2011
The following companies were acquired and consolidated or sold and deconsolidated during the twelve months ended September 30, 2013:
Country % interest at Sept. 30,
2012
Type of transaction
Consolidation method
% interest at Sept. 30,
2013
Consolidation period
TrustHouse Services Group (*)
USA - Acquisition Full 78% April 15, 2013 -
Sept. 30, 2013 (*)
The companies making up the TrustHouse Services Group are presented in the list of consolidated companies presented in Note 11.
IFRS consolidated financial statements for the years ended September 30, 2013, 2012 and 2011 29
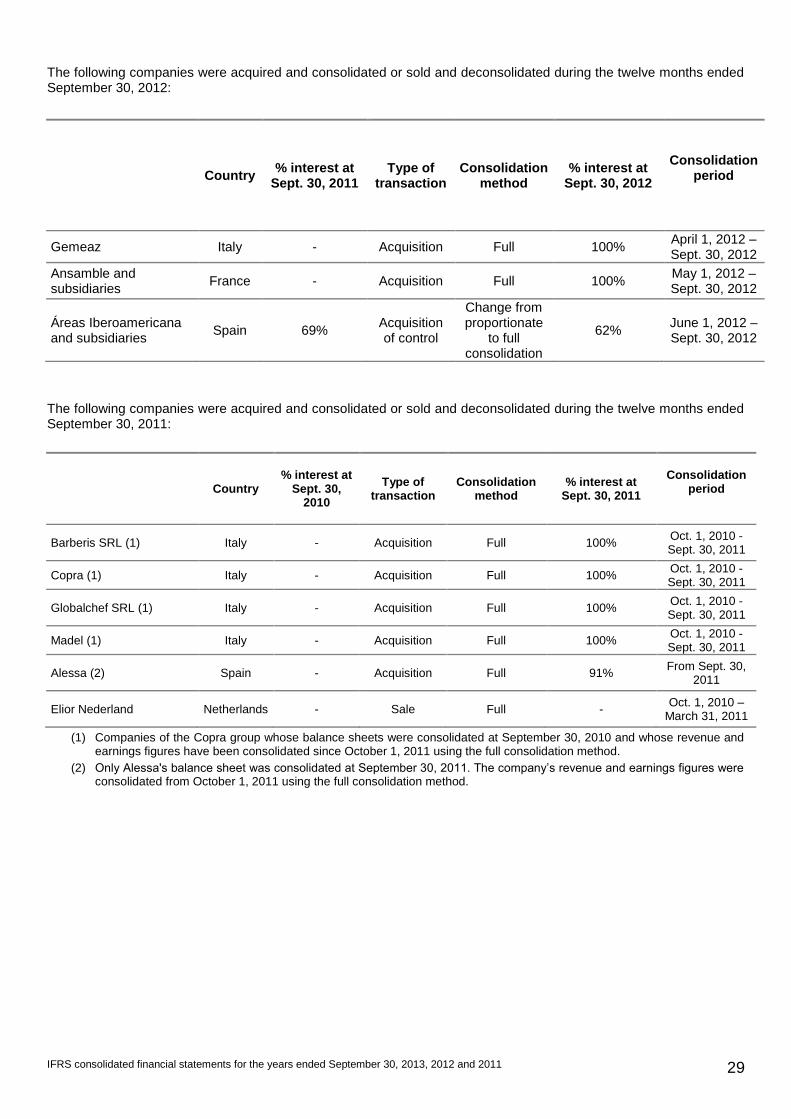
The following companies were acquired and consolidated or sold and deconsolidated during the twelve months ended September 30, 2012:
Country % interest at
Sept. 30, 2011 Type of
transaction Consolidation
method % interest at
Sept. 30, 2012
Consolidation period
Gemeaz Italy - Acquisition Full 100% April 1, 2012 –Sept. 30, 2012
Ansamble and subsidiaries
France - Acquisition Full 100% May 1, 2012 –Sept. 30, 2012
Áreas Iberoamericana and subsidiaries
Spain 69% Acquisition of control
Change from proportionate
to full consolidation
62% June 1, 2012 –Sept. 30, 2012
The following companies were acquired and consolidated or sold and deconsolidated during the twelve months ended September 30, 2011:
Country % interest at
Sept. 30, 2010
Type of transaction
Consolidation method
% interest at Sept. 30, 2011
Consolidation period
Barberis SRL (1) Italy - Acquisition Full 100% Oct. 1, 2010 - Sept. 30, 2011
Copra (1) Italy - Acquisition Full 100% Oct. 1, 2010 - Sept. 30, 2011
Globalchef SRL (1) Italy - Acquisition Full 100% Oct. 1, 2010 - Sept. 30, 2011
Madel (1) Italy - Acquisition Full 100% Oct. 1, 2010 - Sept. 30, 2011
Alessa (2) Spain - Acquisition Full 91% From Sept. 30,
2011
Elior Nederland Netherlands - Sale Full - Oct. 1, 2010 –
March 31, 2011
(1) Companies of the Copra group whose balance sheets were consolidated at September 30, 2010 and whose revenue and earnings figures have been consolidated since October 1, 2011 using the full consolidation method.
(2) Only Alessa's balance sheet was consolidated at September 30, 2011. The company’s revenue and earnings figures were consolidated from October 1, 2011 using the full consolidation method.
IFRS consolidated financial statements for the years ended September 30, 2013, 2012 and 2011 30
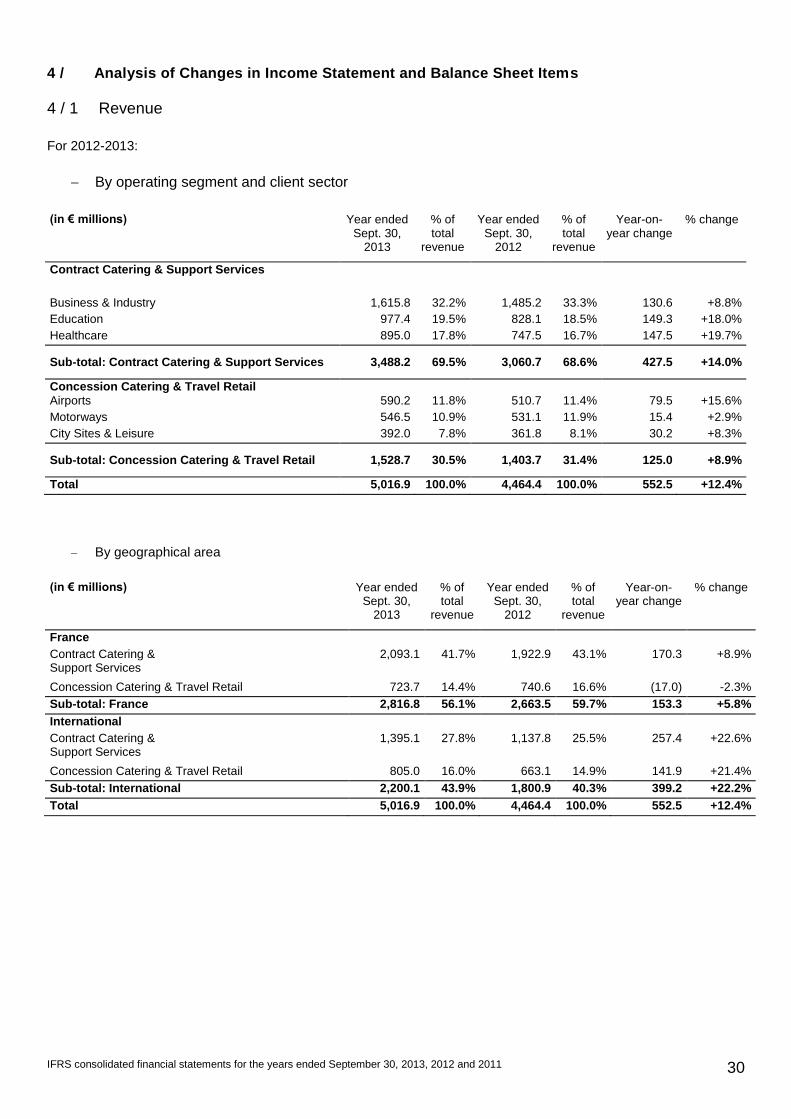
4 / Analysis of Changes in Income Statement and Balance Sheet Items
4 / 1 Revenue
For 2012-2013:
By operating segment and client sector
(in € millions) Year ended
Sept. 30, 2013
% of total
revenue
Year ended Sept. 30,
2012
% of total
revenue
Year-on-year change
% change
Contract Catering & Support Services
Business & Industry 1,615.8 32.2% 1,485.2 33.3% 130.6 +8.8%
Education 977.4 19.5% 828.1 18.5% 149.3 +18.0%
Healthcare 895.0 17.8% 747.5 16.7% 147.5 +19.7%
Sub-total: Contract Catering & Support Services 3,488.2 69.5% 3,060.7 68.6% 427.5 +14.0%
Concession Catering & Travel Retail Airports 590.2 11.8% 510.7 11.4% 79.5 +15.6%
Motorways 546.5 10.9% 531.1 11.9% 15.4 +2.9%
City Sites & Leisure 392.0 7.8% 361.8 8.1% 30.2 +8.3%
Sub-total: Concession Catering & Travel Retail 1,528.7 30.5% 1,403.7 31.4% 125.0 +8.9%
Total 5,016.9 100.0% 4,464.4 100.0% 552.5 +12.4%
By geographical area
(in € millions) Year ended Sept. 30,
2013
% of total
revenue
Year ended Sept. 30,
2012
% of total
revenue
Year-on-year change
% change
France
Contract Catering & Support Services
2,093.1 41.7% 1,922.9 43.1% 170.3 +8.9%
Concession Catering & Travel Retail 723.7 14.4% 740.6 16.6% (17.0) -2.3%
Sub-total: France 2,816.8 56.1% 2,663.5 59.7% 153.3 +5.8%
International
Contract Catering & Support Services
1,395.1 27.8% 1,137.8 25.5% 257.4 +22.6%
Concession Catering & Travel Retail 805.0 16.0% 663.1 14.9% 141.9 +21.4%
Sub-total: International 2,200.1 43.9% 1,800.9 40.3% 399.2 +22.2%
Total 5,016.9 100.0% 4,464.4 100.0% 552.5 +12.4%
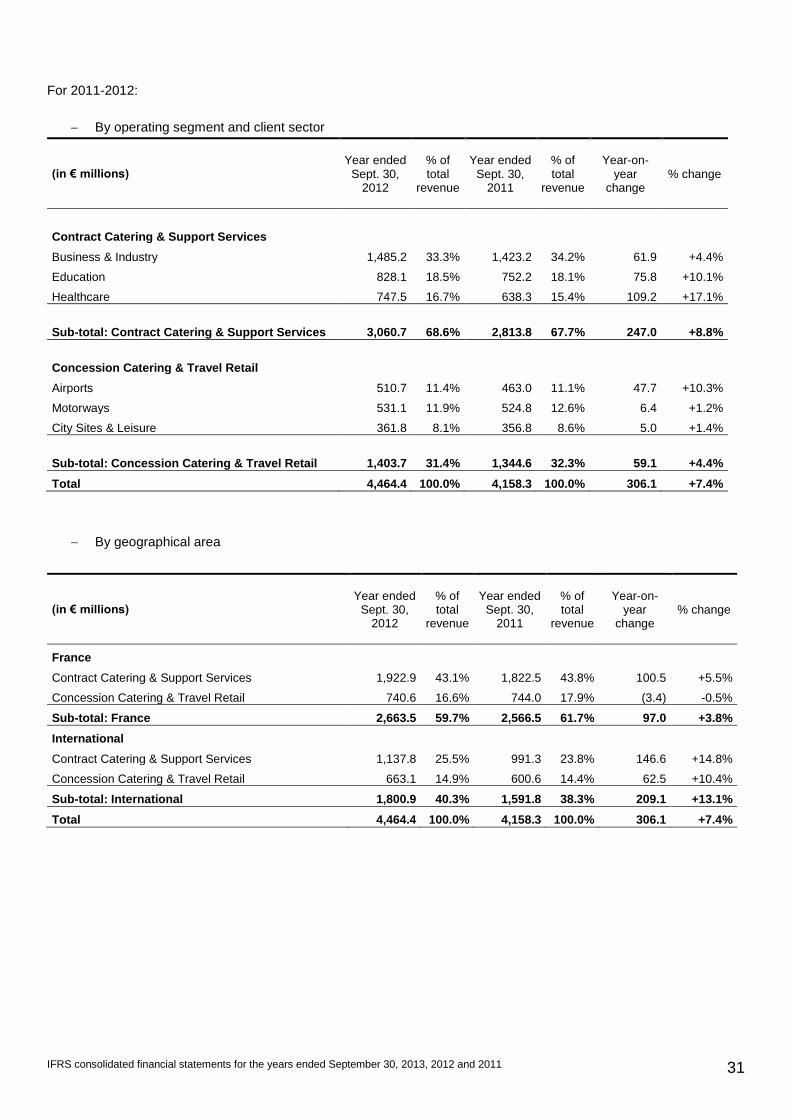
IFRS consolidated financial statements for the years ended September 30, 2013, 2012 and 2011 31
For 2011-2012:
By operating segment and client sector
(in € millions) Year ended
Sept. 30, 2012
% of total
revenue
Year ended Sept. 30,
2011
% of total
revenue
Year-on-year
change % change
Contract Catering & Support Services
Business & Industry 1,485.2 33.3% 1,423.2 34.2% 61.9 +4.4%
Education 828.1 18.5% 752.2 18.1% 75.8 +10.1%
Healthcare 747.5 16.7% 638.3 15.4% 109.2 +17.1%
Sub-total: Contract Catering & Support Services 3,060.7 68.6% 2,813.8 67.7% 247.0 +8.8%
Concession Catering & Travel Retail
Airports 510.7 11.4% 463.0 11.1% 47.7 +10.3%
Motorways 531.1 11.9% 524.8 12.6% 6.4 +1.2%
City Sites & Leisure 361.8 8.1% 356.8 8.6% 5.0 +1.4%
Sub-total: Concession Catering & Travel Retail 1,403.7 31.4% 1,344.6 32.3% 59.1 +4.4%
Total 4,464.4 100.0% 4,158.3 100.0% 306.1 +7.4%
By geographical area
(in € millions) Year ended
Sept. 30, 2012
% of total
revenue
Year ended Sept. 30,
2011
% of total
revenue
Year-on-year
change % change
France
Contract Catering & Support Services 1,922.9 43.1% 1,822.5 43.8% 100.5 +5.5%
Concession Catering & Travel Retail 740.6 16.6% 744.0 17.9% (3.4) -0.5%
Sub-total: France 2,663.5 59.7% 2,566.5 61.7% 97.0 +3.8%
International
Contract Catering & Support Services 1,137.8 25.5% 991.3 23.8% 146.6 +14.8%
Concession Catering & Travel Retail 663.1 14.9% 600.6 14.4% 62.5 +10.4%
Sub-total: International 1,800.9 40.3% 1,591.8 38.3% 209.1 +13.1%
Total 4,464.4 100.0% 4,158.3 100.0% 306.1 +7.4%
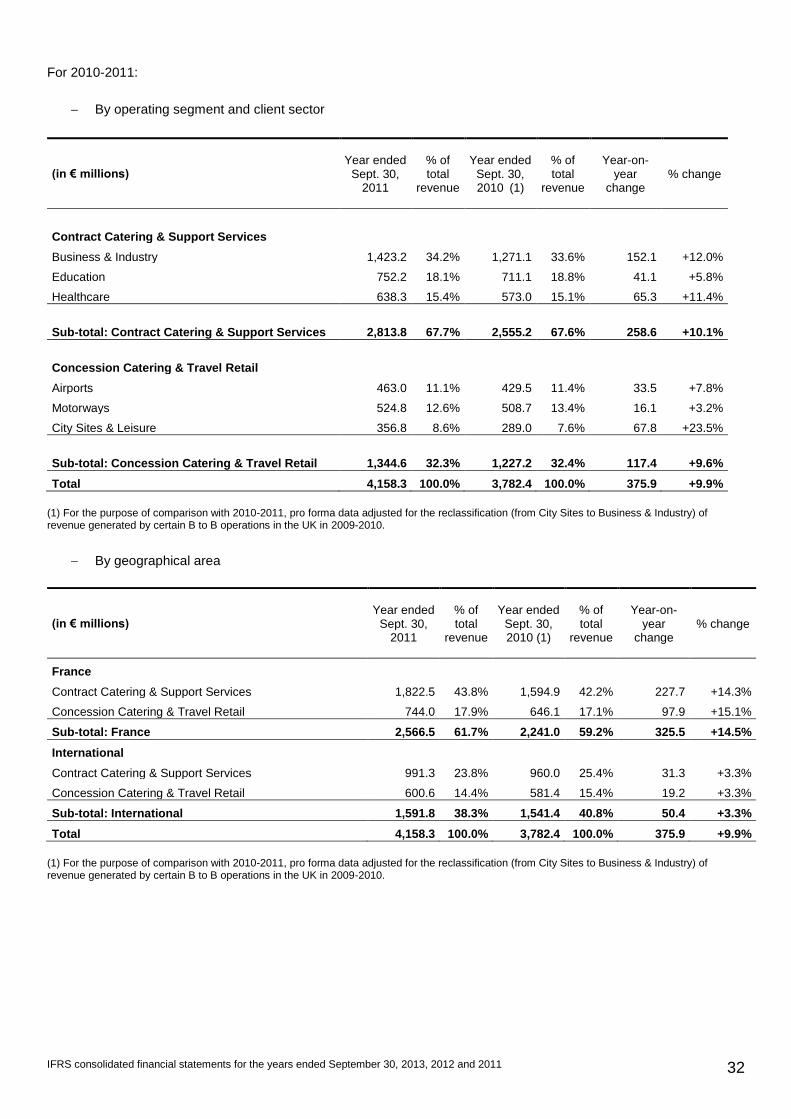
IFRS consolidated financial statements for the years ended September 30, 2013, 2012 and 2011 32
For 2010-2011:
By operating segment and client sector
(in € millions) Year ended
Sept. 30, 2011
% of total
revenue
Year ended Sept. 30, 2010 (1)
% of total
revenue
Year-on-year
change % change
Contract Catering & Support Services
Business & Industry 1,423.2 34.2% 1,271.1 33.6% 152.1 +12.0%
Education 752.2 18.1% 711.1 18.8% 41.1 +5.8%
Healthcare 638.3 15.4% 573.0 15.1% 65.3 +11.4%
Sub-total: Contract Catering & Support Services 2,813.8 67.7% 2,555.2 67.6% 258.6 +10.1%
Concession Catering & Travel Retail
Airports 463.0 11.1% 429.5 11.4% 33.5 +7.8%
Motorways 524.8 12.6% 508.7 13.4% 16.1 +3.2%
City Sites & Leisure 356.8 8.6% 289.0 7.6% 67.8 +23.5%
Sub-total: Concession Catering & Travel Retail 1,344.6 32.3% 1,227.2 32.4% 117.4 +9.6%
Total 4,158.3 100.0% 3,782.4 100.0% 375.9 +9.9%
(1) For the purpose of comparison with 2010-2011, pro forma data adjusted for the reclassification (from City Sites to Business & Industry) of revenue generated by certain B to B operations in the UK in 2009-2010.
By geographical area
(in € millions) Year ended
Sept. 30, 2011
% of total
revenue
Year ended Sept. 30, 2010 (1)
% of total
revenue
Year-on-year
change % change
France
Contract Catering & Support Services 1,822.5 43.8% 1,594.9 42.2% 227.7 +14.3%
Concession Catering & Travel Retail 744.0 17.9% 646.1 17.1% 97.9 +15.1%
Sub-total: France 2,566.5 61.7% 2,241.0 59.2% 325.5 +14.5%
International
Contract Catering & Support Services 991.3 23.8% 960.0 25.4% 31.3 +3.3%
Concession Catering & Travel Retail 600.6 14.4% 581.4 15.4% 19.2 +3.3%
Sub-total: International 1,591.8 38.3% 1,541.4 40.8% 50.4 +3.3%
Total 4,158.3 100.0% 3,782.4 100.0% 375.9 +9.9%
(1) For the purpose of comparison with 2010-2011, pro forma data adjusted for the reclassification (from City Sites to Business & Industry) of revenue generated by certain B to B operations in the UK in 2009-2010.
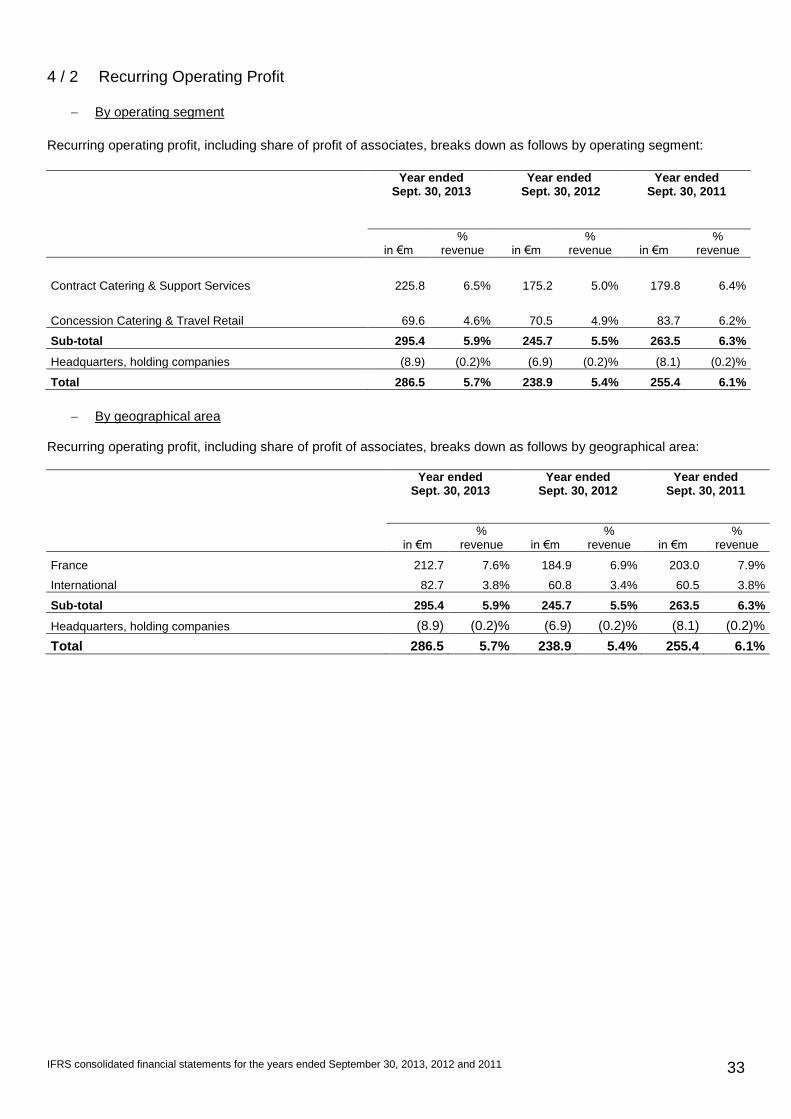
IFRS consolidated financial statements for the years ended September 30, 2013, 2012 and 2011 33
4 / 2 Recurring Operating Profit
By operating segment
Recurring operating profit, including share of profit of associates, breaks down as follows by operating segment:
Year ended Sept. 30, 2013
Year ended Sept. 30, 2012
Year ended Sept. 30, 2011
in €m %
revenue in €m %
revenue in €m %
revenue
Contract Catering & Support Services 225.8 6.5% 175.2 5.0% 179.8 6.4%
Concession Catering & Travel Retail 69.6 4.6% 70.5 4.9% 83.7 6.2%
Sub-total 295.4 5.9% 245.7 5.5% 263.5 6.3%
Headquarters, holding companies (8.9) (0.2)% (6.9) (0.2)% (8.1) (0.2)%
Total 286.5 5.7% 238.9 5.4% 255.4 6.1%
By geographical area
Recurring operating profit, including share of profit of associates, breaks down as follows by geographical area:
Year ended Sept. 30, 2013
Year ended Sept. 30, 2012
Year ended Sept. 30, 2011
in €m %
revenue in €m %
revenue in €m %
revenue
France 212.7 7.6% 184.9 6.9% 203.0 7.9%
International 82.7 3.8% 60.8 3.4% 60.5 3.8%
Sub-total 295.4 5.9% 245.7 5.5% 263.5 6.3%
Headquarters, holding companies (8.9) (0.2)% (6.9) (0.2)% (8.1) (0.2)%
Total 286.5 5.7% 238.9 5.4% 255.4 6.1%
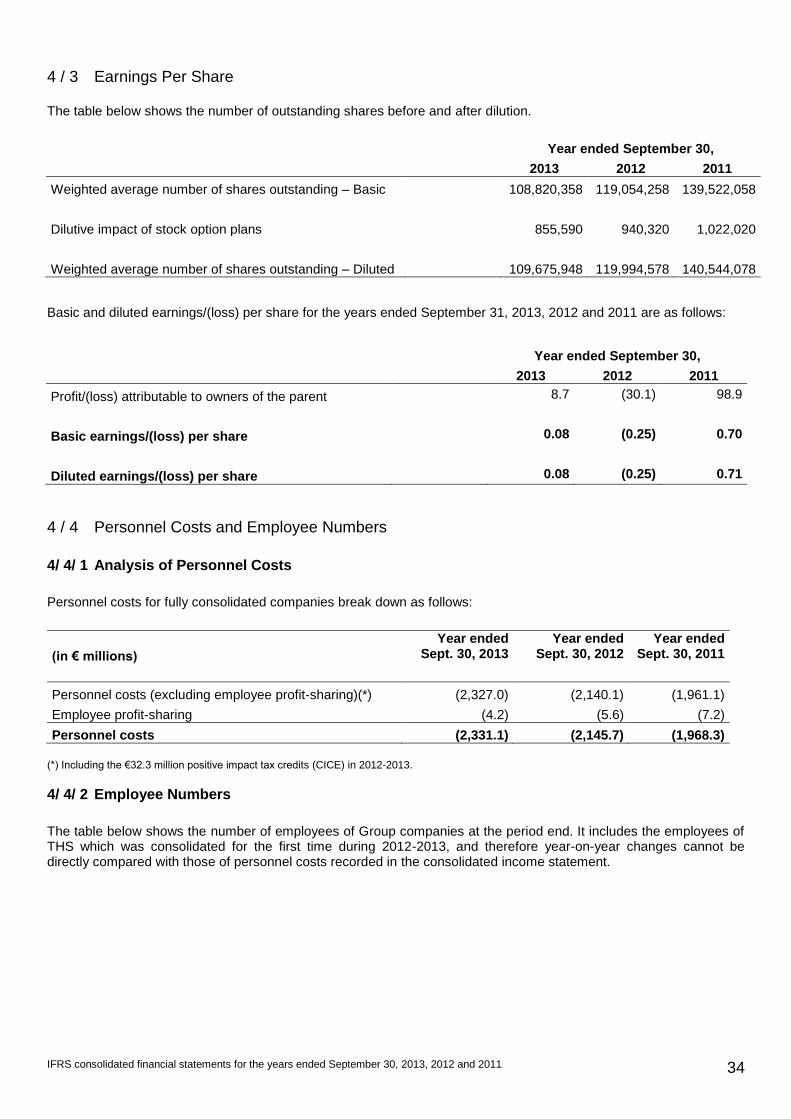
IFRS consolidated financial statements for the years ended September 30, 2013, 2012 and 2011 34
4 / 3 Earnings Per Share
The table below shows the number of outstanding shares before and after dilution.
Year ended September 30,
2013 2012 2011
Weighted average number of shares outstanding – Basic 108,820,358 119,054,258 139,522,058
Dilutive impact of stock option plans 855,590 940,320 1,022,020
Weighted average number of shares outstanding – Diluted 109,675,948 119,994,578 140,544,078
Basic and diluted earnings/(loss) per share for the years ended September 31, 2013, 2012 and 2011 are as follows:
Year ended September 30,
2013 2012 2011
Profit/(loss) attributable to owners of the parent 8.7 (30.1) 98.9
Basic earnings/(loss) per share 0.08 (0.25) 0.70
Diluted earnings/(loss) per share 0.08 (0.25) 0.71
4 / 4 Personnel Costs and Employee Numbers
4/ 4/ 1 Analysis of Personnel Costs
Personnel costs for fully consolidated companies break down as follows:
(in € millions)
Year ended Sept. 30, 2013
Year ended Sept. 30, 2012
Year ended Sept. 30, 2011
Personnel costs (excluding employee profit-sharing)(*) (2,327.0) (2,140.1) (1,961.1)
Employee profit-sharing (4.2) (5.6) (7.2)
Personnel costs (2,331.1) (2,145.7) (1,968.3)
(*) Including the €32.3 million positive impact tax credits (CICE) in 2012-2013.
4/ 4/ 2 Employee Numbers
The table below shows the number of employees of Group companies at the period end. It includes the employees of THS which was consolidated for the first time during 2012-2013, and therefore year-on-year changes cannot be directly compared with those of personnel costs recorded in the consolidated income statement.
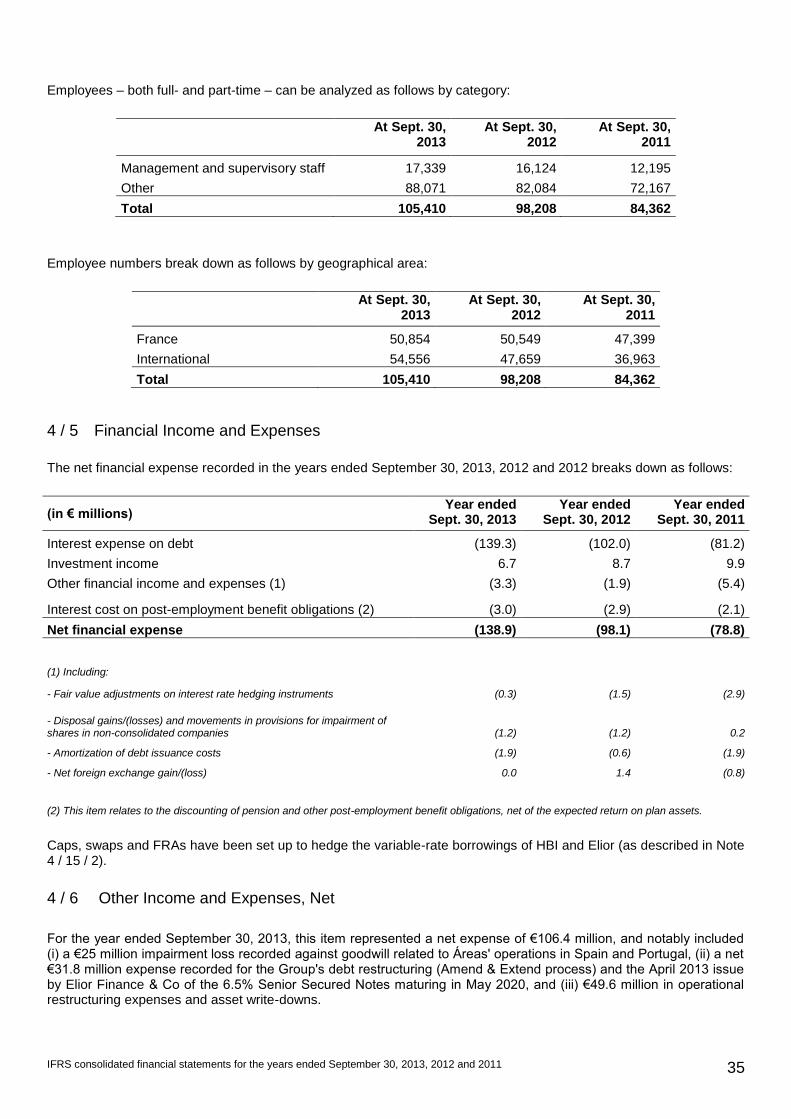
IFRS consolidated financial statements for the years ended September 30, 2013, 2012 and 2011 35
Employees – both full- and part-time – can be analyzed as follows by category:
At Sept. 30, 2013
At Sept. 30, 2012
At Sept. 30, 2011
Management and supervisory staff 17,339 16,124 12,195
Other 88,071 82,084 72,167
Total 105,410 98,208 84,362
Employee numbers break down as follows by geographical area:
At Sept. 30, 2013
At Sept. 30, 2012
At Sept. 30, 2011
France 50,854 50,549 47,399
International 54,556 47,659 36,963
Total 105,410 98,208 84,362
4 / 5 Financial Income and Expenses
The net financial expense recorded in the years ended September 30, 2013, 2012 and 2012 breaks down as follows:
(in € millions) Year ended
Sept. 30, 2013 Year ended
Sept. 30, 2012 Year ended
Sept. 30, 2011
Interest expense on debt (139.3) (102.0) (81.2)
Investment income 6.7 8.7 9.9
Other financial income and expenses (1) (3.3) (1.9) (5.4)
Interest cost on post-employment benefit obligations (2) (3.0) (2.9) (2.1)
Net financial expense (138.9) (98.1) (78.8)
(1) Including:
- Fair value adjustments on interest rate hedging instruments (0.3) (1.5) (2.9)
- Disposal gains/(losses) and movements in provisions for impairment of shares in non-consolidated companies (1.2) (1.2) 0.2
- Amortization of debt issuance costs (1.9) (0.6) (1.9)
- Net foreign exchange gain/(loss) 0.0 1.4 (0.8)
(2) This item relates to the discounting of pension and other post-employment benefit obligations, net of the expected return on plan assets.
Caps, swaps and FRAs have been set up to hedge the variable-rate borrowings of HBI and Elior (as described in Note 4 / 15 / 2).
4 / 6 Other Income and Expenses, Net
For the year ended September 30, 2013, this item represented a net expense of €106.4 million, and notably included (i) a €25 million impairment loss recorded against goodwill related to Áreas' operations in Spain and Portugal, (ii) a net €31.8 million expense recorded for the Group's debt restructuring (Amend & Extend process) and the April 2013 issue by Elior Finance & Co of the 6.5% Senior Secured Notes maturing in May 2020, and (iii) €49.6 million in operational restructuring expenses and asset write-downs.
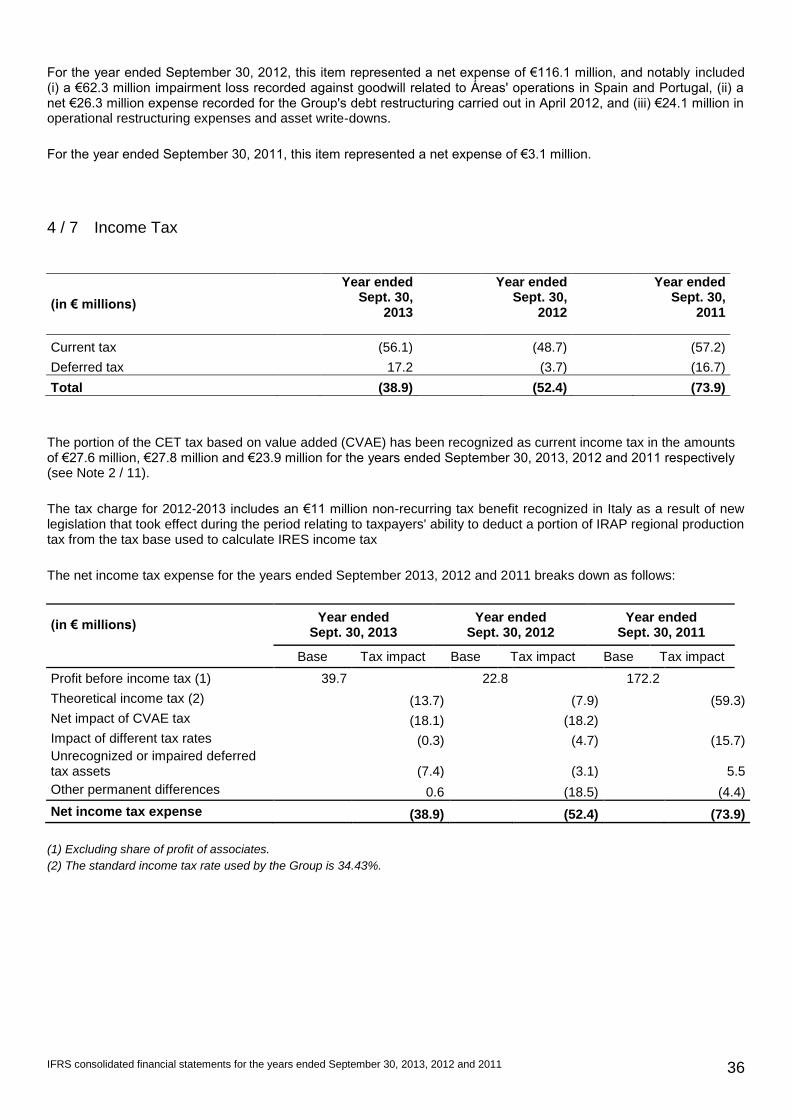
IFRS consolidated financial statements for the years ended September 30, 2013, 2012 and 2011 36
For the year ended September 30, 2012, this item represented a net expense of €116.1 million, and notably included (i) a €62.3 million impairment loss recorded against goodwill related to Áreas' operations in Spain and Portugal, (ii) a net €26.3 million expense recorded for the Group's debt restructuring carried out in April 2012, and (iii) €24.1 million in operational restructuring expenses and asset write-downs.
For the year ended September 30, 2011, this item represented a net expense of €3.1 million.
4 / 7 Income Tax
(in € millions)
Year ended Sept. 30,
2013
Year ended Sept. 30,
2012
Year ended Sept. 30,
2011
Current tax (56.1) (48.7) (57.2)
Deferred tax 17.2 (3.7) (16.7)
Total (38.9) (52.4) (73.9)
The portion of the CET tax based on value added (CVAE) has been recognized as current income tax in the amounts of €27.6 million, €27.8 million and €23.9 million for the years ended September 30, 2013, 2012 and 2011 respectively (see Note 2 / 11).
The tax charge for 2012-2013 includes an €11 million non-recurring tax benefit recognized in Italy as a result of new legislation that took effect during the period relating to taxpayers' ability to deduct a portion of IRAP regional production tax from the tax base used to calculate IRES income tax
The net income tax expense for the years ended September 2013, 2012 and 2011 breaks down as follows:
(in € millions) Year ended
Sept. 30, 2013 Year ended
Sept. 30, 2012 Year ended
Sept. 30, 2011
Base Tax impact Base Tax impact Base Tax impact
Profit before income tax (1) 39.7 22.8 172.2
Theoretical income tax (2) (13.7) (7.9) (59.3)
Net impact of CVAE tax (18.1) (18.2)
Impact of different tax rates (0.3) (4.7) (15.7) Unrecognized or impaired deferred tax assets
(7.4)
(3.1)
5.5
Other permanent differences 0.6 (18.5) (4.4)
Net income tax expense (38.9) (52.4) (73.9)
(1) Excluding share of profit of associates.
(2) The standard income tax rate used by the Group is 34.43%.
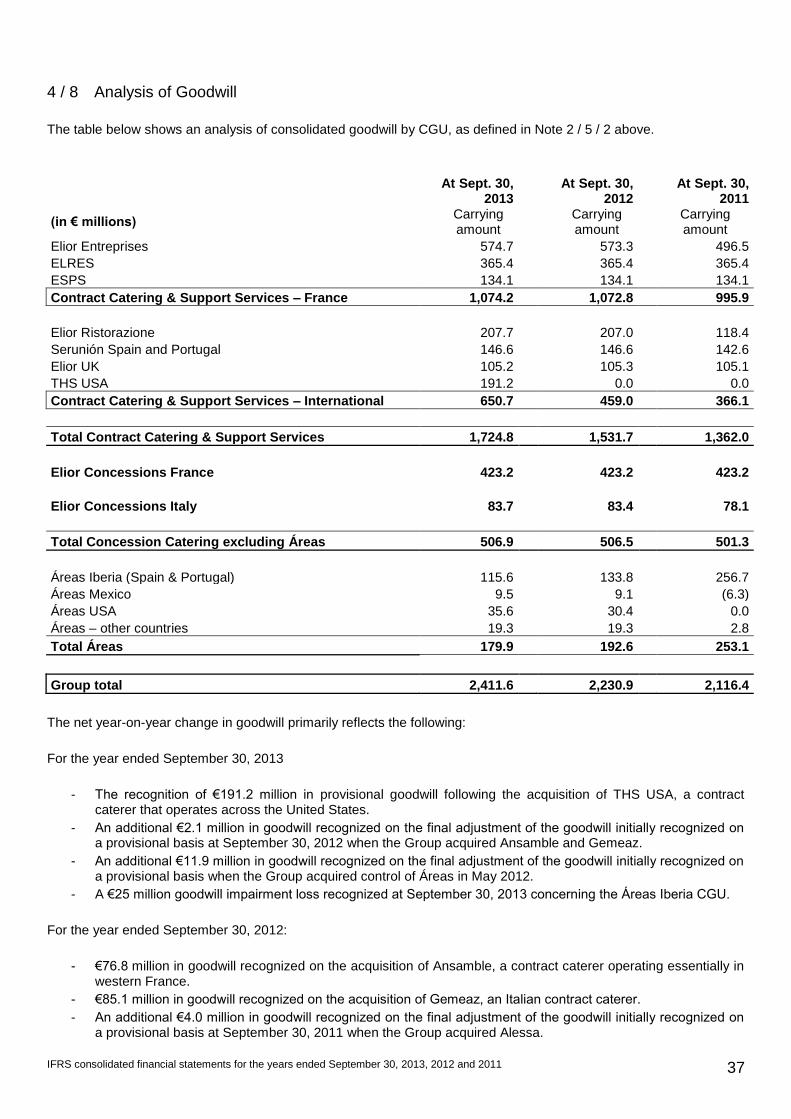
IFRS consolidated financial statements for the years ended September 30, 2013, 2012 and 2011 37
4 / 8 Analysis of Goodwill
The table below shows an analysis of consolidated goodwill by CGU, as defined in Note 2 / 5 / 2 above.
At Sept. 30, 2013
At Sept. 30, 2012
At Sept. 30, 2011
(in € millions) Carrying amount
Carrying amount
Carrying amount
Elior Entreprises 574.7
573.3
496.5
ELRES 365.4
365.4
365.4
ESPS 134.1
134.1
134.1
Contract Catering & Support Services – France 1,074.2 1,072.8 995.9
Elior Ristorazione 207.7
207.0
118.4
Serunión Spain and Portugal 146.6
146.6
142.6
Elior UK 105.2
105.3
105.1
THS USA 191.2
0.0
0.0
Contract Catering & Support Services – International 650.7 459.0 366.1
Total Contract Catering & Support Services 1,724.8 1,531.7 1,362.0
Elior Concessions France 423.2
423.2
423.2
Elior Concessions Italy 83.7
83.4
78.1
Total Concession Catering excluding Áreas 506.9 506.5 501.3
Áreas Iberia (Spain & Portugal) 115.6
133.8
256.7
Áreas Mexico 9.5
9.1
(6.3)
Áreas USA 35.6
30.4
0.0
Áreas – other countries 19.3
19.3
2.8
Total Áreas 179.9 192.6 253.1
Group total 2,411.6 2,230.9 2,116.4
The net year-on-year change in goodwill primarily reflects the following:
For the year ended September 30, 2013
- The recognition of €191.2 million in provisional goodwill following the acquisition of THS USA, a contract caterer that operates across the United States.
- An additional €2.1 million in goodwill recognized on the final adjustment of the goodwill initially recognized on a provisional basis at September 30, 2012 when the Group acquired Ansamble and Gemeaz.
- An additional €11.9 million in goodwill recognized on the final adjustment of the goodwill initially recognized on a provisional basis when the Group acquired control of Áreas in May 2012.
- A €25 million goodwill impairment loss recognized at September 30, 2013 concerning the Áreas Iberia CGU.
For the year ended September 30, 2012:
- €76.8 million in goodwill recognized on the acquisition of Ansamble, a contract caterer operating essentially in western France.
- €85.1 million in goodwill recognized on the acquisition of Gemeaz, an Italian contract caterer.
- An additional €4.0 million in goodwill recognized on the final adjustment of the goodwill initially recognized on a provisional basis at September 30, 2011 when the Group acquired Alessa.
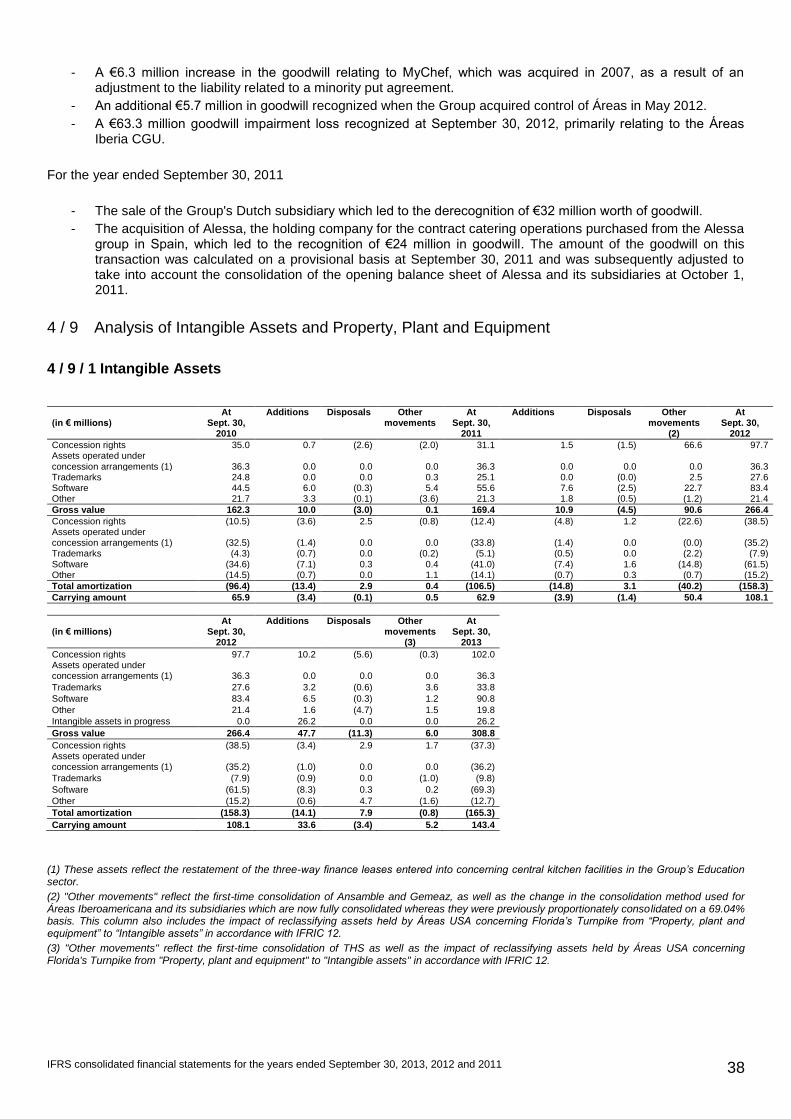
IFRS consolidated financial statements for the years ended September 30, 2013, 2012 and 2011 38
- A €6.3 million increase in the goodwill relating to MyChef, which was acquired in 2007, as a result of an adjustment to the liability related to a minority put agreement.
- An additional €5.7 million in goodwill recognized when the Group acquired control of Áreas in May 2012.
- A €63.3 million goodwill impairment loss recognized at September 30, 2012, primarily relating to the Áreas Iberia CGU.
For the year ended September 30, 2011
- The sale of the Group's Dutch subsidiary which led to the derecognition of €32 million worth of goodwill.
- The acquisition of Alessa, the holding company for the contract catering operations purchased from the Alessa group in Spain, which led to the recognition of €24 million in goodwill. The amount of the goodwill on this transaction was calculated on a provisional basis at September 30, 2011 and was subsequently adjusted to take into account the consolidation of the opening balance sheet of Alessa and its subsidiaries at October 1, 2011.
4 / 9 Analysis of Intangible Assets and Property, Plant and Equipment
4 / 9 / 1 Intangible Assets
(in € millions) At
Sept. 30, 2010
Additions Disposals Other movements
At Sept. 30,
2011
Additions Disposals Other movements
(2)
At Sept. 30,
2012
Concession rights 35.0 0.7 (2.6) (2.0) 31.1 1.5 (1.5) 66.6 97.7 Assets operated under concession arrangements (1) 36.3 0.0 0.0 0.0 36.3 0.0 0.0 0.0 36.3 Trademarks 24.8 0.0 0.0 0.3 25.1 0.0 (0.0) 2.5 27.6 Software 44.5 6.0 (0.3) 5.4 55.6 7.6 (2.5) 22.7 83.4 Other 21.7 3.3 (0.1) (3.6) 21.3 1.8 (0.5) (1.2) 21.4
Gross value 162.3 10.0 (3.0) 0.1 169.4 10.9 (4.5) 90.6 266.4
Concession rights (10.5) (3.6) 2.5 (0.8) (12.4) (4.8) 1.2 (22.6) (38.5) Assets operated under concession arrangements (1) (32.5) (1.4) 0.0 0.0 (33.8) (1.4) 0.0 (0.0) (35.2) Trademarks (4.3) (0.7) 0.0 (0.2) (5.1) (0.5) 0.0 (2.2) (7.9) Software (34.6) (7.1) 0.3 0.4 (41.0) (7.4) 1.6 (14.8) (61.5) Other (14.5) (0.7) 0.0 1.1 (14.1) (0.7) 0.3 (0.7) (15.2)
Total amortization (96.4) (13.4) 2.9 0.4 (106.5) (14.8) 3.1 (40.2) (158.3)
Carrying amount 65.9 (3.4) (0.1) 0.5 62.9 (3.9) (1.4) 50.4 108.1
(in € millions) At
Sept. 30, 2012
Additions Disposals Other movements
(3)
At Sept. 30,
2013
Concession rights 97.7 10.2 (5.6) (0.3) 102.0 Assets operated under concession arrangements (1) 36.3 0.0 0.0 0.0 36.3
Trademarks 27.6 3.2 (0.6) 3.6 33.8
Software 83.4 6.5 (0.3) 1.2 90.8
Other 21.4 1.6 (4.7) 1.5 19.8
Intangible assets in progress 0.0 26.2 0.0 0.0 26.2
Gross value 266.4 47.7 (11.3) 6.0 308.8
Concession rights (38.5) (3.4) 2.9 1.7 (37.3) Assets operated under concession arrangements (1) (35.2) (1.0) 0.0 0.0 (36.2)
Trademarks (7.9) (0.9) 0.0 (1.0) (9.8)
Software (61.5) (8.3) 0.3 0.2 (69.3)
Other (15.2) (0.6) 4.7 (1.6) (12.7)
Total amortization (158.3) (14.1) 7.9 (0.8) (165.3)
Carrying amount 108.1 33.6 (3.4) 5.2 143.4
(1) These assets reflect the restatement of the three-way finance leases entered into concerning central kitchen facilities in the Group’s Education sector.
(2) "Other movements" reflect the first-time consolidation of Ansamble and Gemeaz, as well as the change in the consolidation method used for Áreas Iberoamericana and its subsidiaries which are now fully consolidated whereas they were previously proportionately consolidated on a 69.04% basis. This column also includes the impact of reclassifying assets held by Áreas USA concerning Florida’s Turnpike from “Property, plant and equipment” to “Intangible assets” in accordance with IFRIC 12.
(3) "Other movements" reflect the first-time consolidation of THS as well as the impact of reclassifying assets held by Áreas USA concerning Florida's Turnpike from "Property, plant and equipment" to "Intangible assets" in accordance with IFRIC 12.
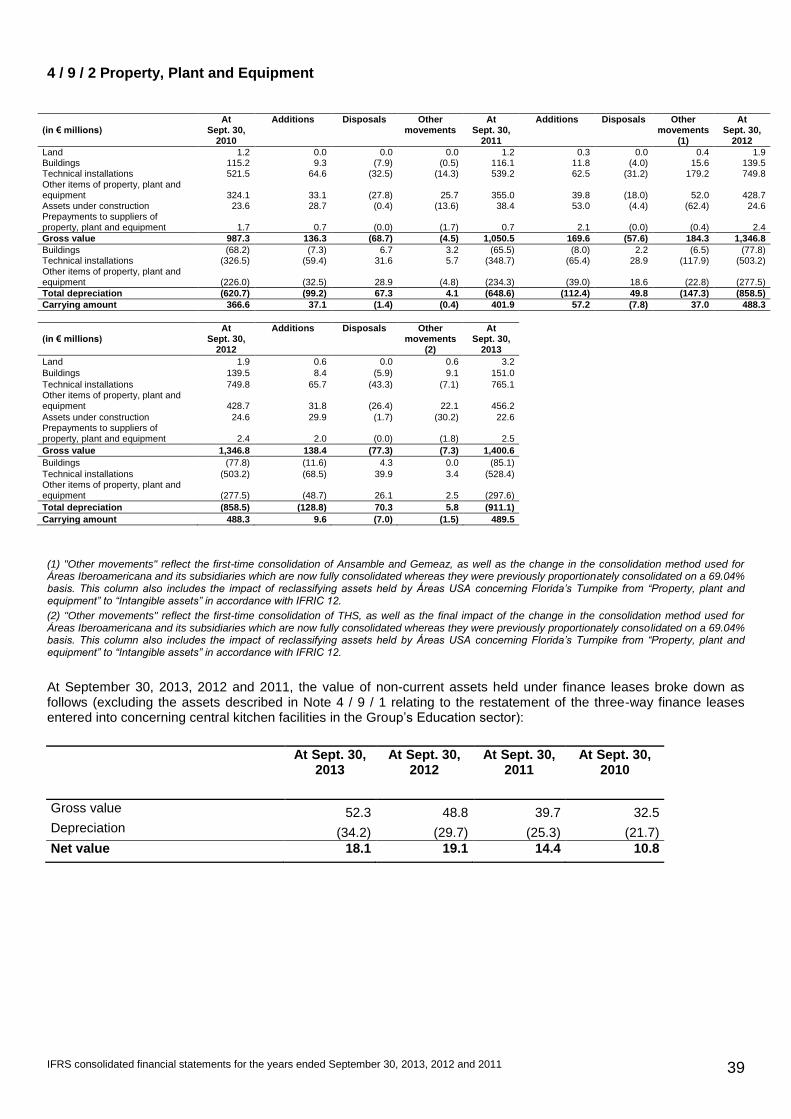
IFRS consolidated financial statements for the years ended September 30, 2013, 2012 and 2011 39
4 / 9 / 2 Property, Plant and Equipment
(in € millions) At
Sept. 30, 2010
Additions Disposals Other movements
At Sept. 30,
2011
Additions Disposals Other movements
(1)
At Sept. 30,
2012
Land 1.2 0.0 0.0 0.0 1.2 0.3 0.0 0.4 1.9 Buildings 115.2 9.3 (7.9) (0.5) 116.1 11.8 (4.0) 15.6 139.5 Technical installations 521.5 64.6 (32.5) (14.3) 539.2 62.5 (31.2) 179.2 749.8 Other items of property, plant and equipment 324.1 33.1 (27.8) 25.7 355.0 39.8 (18.0) 52.0 428.7 Assets under construction 23.6 28.7 (0.4) (13.6) 38.4 53.0 (4.4) (62.4) 24.6 Prepayments to suppliers of property, plant and equipment 1.7 0.7 (0.0) (1.7) 0.7 2.1 (0.0) (0.4) 2.4
Gross value 987.3 136.3 (68.7) (4.5) 1,050.5 169.6 (57.6) 184.3 1,346.8
Buildings (68.2) (7.3) 6.7 3.2 (65.5) (8.0) 2.2 (6.5) (77.8) Technical installations (326.5) (59.4) 31.6 5.7 (348.7) (65.4) 28.9 (117.9) (503.2) Other items of property, plant and equipment (226.0) (32.5) 28.9 (4.8) (234.3) (39.0) 18.6 (22.8) (277.5)
Total depreciation (620.7) (99.2) 67.3 4.1 (648.6) (112.4) 49.8 (147.3) (858.5)
Carrying amount 366.6 37.1 (1.4) (0.4) 401.9 57.2 (7.8) 37.0 488.3
(in € millions) At
Sept. 30, 2012
Additions Disposals Other movements
(2)
At Sept. 30,
2013
Land 1.9 0.6 0.0 0.6 3.2
Buildings 139.5 8.4 (5.9) 9.1 151.0
Technical installations 749.8 65.7 (43.3) (7.1) 765.1 Other items of property, plant and equipment 428.7 31.8 (26.4) 22.1 456.2
Assets under construction 24.6 29.9 (1.7) (30.2) 22.6 Prepayments to suppliers of property, plant and equipment 2.4 2.0 (0.0) (1.8) 2.5
Gross value 1,346.8 138.4 (77.3) (7.3) 1,400.6
Buildings (77.8) (11.6) 4.3 0.0 (85.1)
Technical installations (503.2) (68.5) 39.9 3.4 (528.4) Other items of property, plant and equipment (277.5) (48.7) 26.1 2.5 (297.6)
Total depreciation (858.5) (128.8) 70.3 5.8 (911.1)
Carrying amount 488.3 9.6 (7.0) (1.5) 489.5
(1) "Other movements" reflect the first-time consolidation of Ansamble and Gemeaz, as well as the change in the consolidation method used for Áreas Iberoamericana and its subsidiaries which are now fully consolidated whereas they were previously proportionately consolidated on a 69.04% basis. This column also includes the impact of reclassifying assets held by Áreas USA concerning Florida’s Turnpike from “Property, plant and equipment” to “Intangible assets” in accordance with IFRIC 12.
(2) "Other movements" reflect the first-time consolidation of THS, as well as the final impact of the change in the consolidation method used for Áreas Iberoamericana and its subsidiaries which are now fully consolidated whereas they were previously proportionately consolidated on a 69.04% basis. This column also includes the impact of reclassifying assets held by Áreas USA concerning Florida’s Turnpike from “Property, plant and equipment” to “Intangible assets” in accordance with IFRIC 12.
At September 30, 2013, 2012 and 2011, the value of non-current assets held under finance leases broke down as follows (excluding the assets described in Note 4 / 9 / 1 relating to the restatement of the three-way finance leases entered into concerning central kitchen facilities in the Group’s Education sector):
At Sept. 30, 2013
At Sept. 30, 2012
At Sept. 30, 2011
At Sept. 30, 2010
Gross value 52.3 48.8 39.7 32.5 Depreciation (34.2) (29.7) (25.3) (21.7)
Net value 18.1 19.1 14.4 10.8
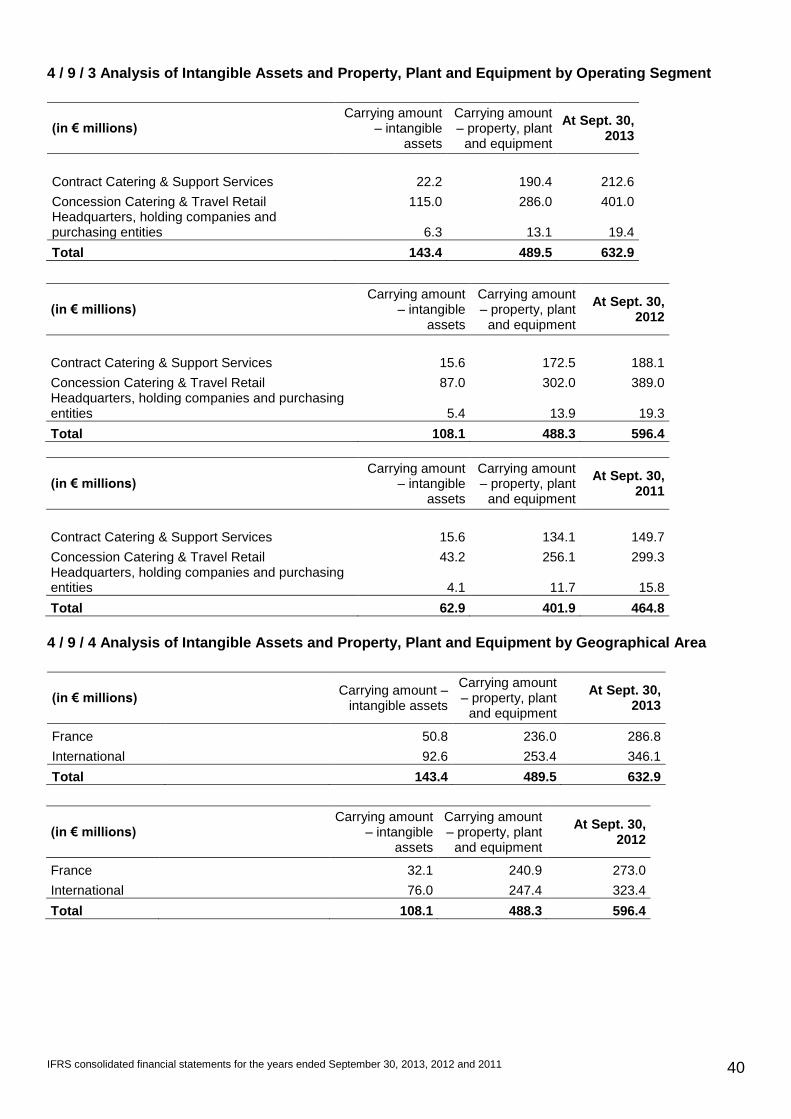
IFRS consolidated financial statements for the years ended September 30, 2013, 2012 and 2011 40
4 / 9 / 3 Analysis of Intangible Assets and Property, Plant and Equipment by Operating Segment
(in € millions) Carrying amount
– intangible assets
Carrying amount – property, plant
and equipment
At Sept. 30, 2013
Contract Catering & Support Services 22.2 190.4 212.6
Concession Catering & Travel Retail 115.0 286.0 401.0 Headquarters, holding companies and purchasing entities 6.3 13.1 19.4
Total 143.4 489.5 632.9
(in € millions) Carrying amount
– intangible assets
Carrying amount – property, plant
and equipment
At Sept. 30, 2012
Contract Catering & Support Services 15.6 172.5 188.1
Concession Catering & Travel Retail 87.0 302.0 389.0 Headquarters, holding companies and purchasing entities 5.4 13.9 19.3
Total 108.1 488.3 596.4
(in € millions) Carrying amount
– intangible assets
Carrying amount – property, plant
and equipment
At Sept. 30, 2011
Contract Catering & Support Services 15.6 134.1 149.7
Concession Catering & Travel Retail 43.2 256.1 299.3 Headquarters, holding companies and purchasing entities 4.1 11.7 15.8
Total 62.9 401.9 464.8
4 / 9 / 4 Analysis of Intangible Assets and Property, Plant and Equipment by Geographical Area
(in € millions) Carrying amount –
intangible assets
Carrying amount – property, plant
and equipment
At Sept. 30, 2013
France 50.8 236.0 286.8
International 92.6 253.4 346.1
Total 143.4 489.5 632.9
(in € millions) Carrying amount
– intangible assets
Carrying amount – property, plant
and equipment
At Sept. 30, 2012
France 32.1 240.9 273.0
International 76.0 247.4 323.4
Total 108.1 488.3 596.4
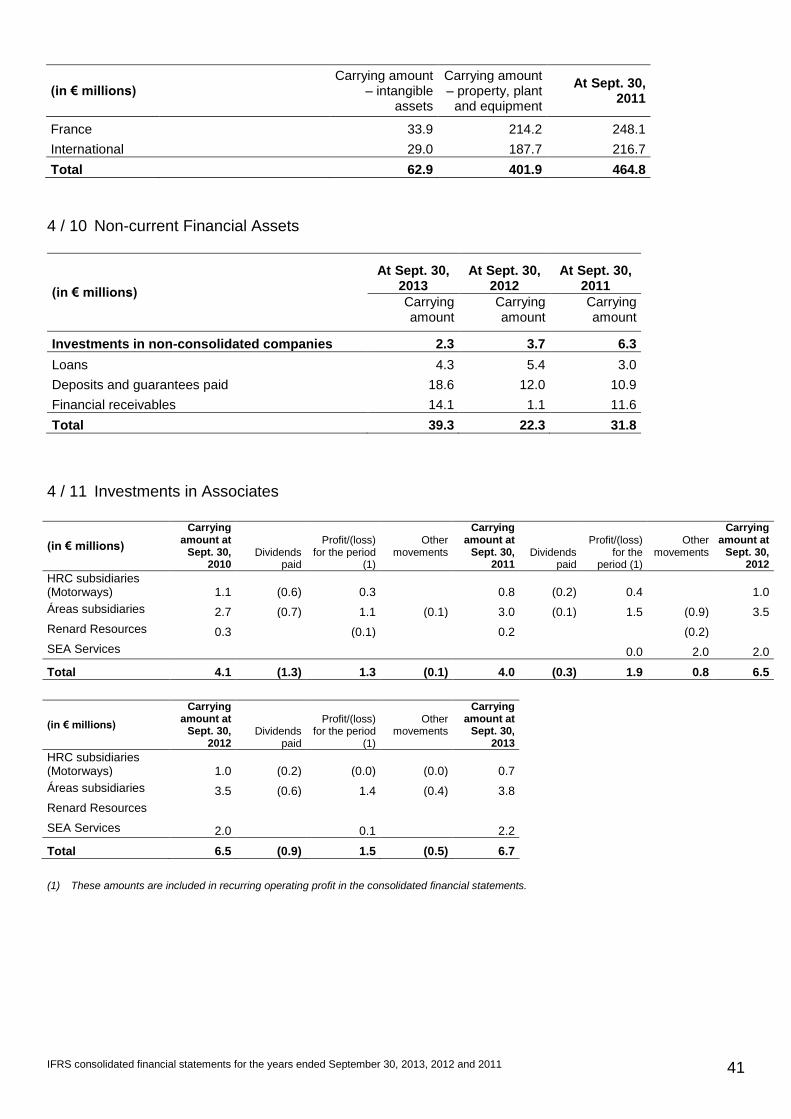
IFRS consolidated financial statements for the years ended September 30, 2013, 2012 and 2011 41
(in € millions) Carrying amount
– intangible assets
Carrying amount – property, plant
and equipment
At Sept. 30, 2011
France 33.9 214.2 248.1
International 29.0 187.7 216.7
Total 62.9 401.9 464.8
4 / 10 Non-current Financial Assets
(in € millions)
At Sept. 30, 2013
At Sept. 30, 2012
At Sept. 30, 2011
Carrying amount
Carrying amount
Carrying amount
Investments in non-consolidated companies 2.3 3.7 6.3
Loans 4.3 5.4 3.0
Deposits and guarantees paid 18.6 12.0 10.9
Financial receivables 14.1 1.1 11.6
Total 39.3 22.3 31.8
4 / 11 Investments in Associates
(in € millions)
Carrying amount at
Sept. 30, 2010
Dividends paid
Profit/(loss) for the period
(1)
Other movements
Carrying amount at
Sept. 30, 2011
Dividends paid
Profit/(loss) for the
period (1)
Other movements
Carrying amount at
Sept. 30, 2012
HRC subsidiaries (Motorways) 1.1 (0.6) 0.3 0.8 (0.2) 0.4 1.0
Áreas subsidiaries 2.7 (0.7) 1.1 (0.1) 3.0 (0.1) 1.5 (0.9) 3.5
Renard Resources 0.3 (0.1) 0.2 (0.2)
SEA Services 0.0 2.0 2.0
Total 4.1 (1.3) 1.3 (0.1) 4.0 (0.3) 1.9 0.8 6.5
(in € millions)
Carrying amount at
Sept. 30, 2012
Dividends paid
Profit/(loss) for the period
(1)
Other movements
Carrying amount at
Sept. 30, 2013
HRC subsidiaries (Motorways) 1.0 (0.2) (0.0) (0.0) 0.7
Áreas subsidiaries 3.5 (0.6) 1.4 (0.4) 3.8
Renard Resources
SEA Services 2.0 0.1 2.2
Total 6.5 (0.9) 1.5 (0.5) 6.7
(1) These amounts are included in recurring operating profit in the consolidated financial statements.
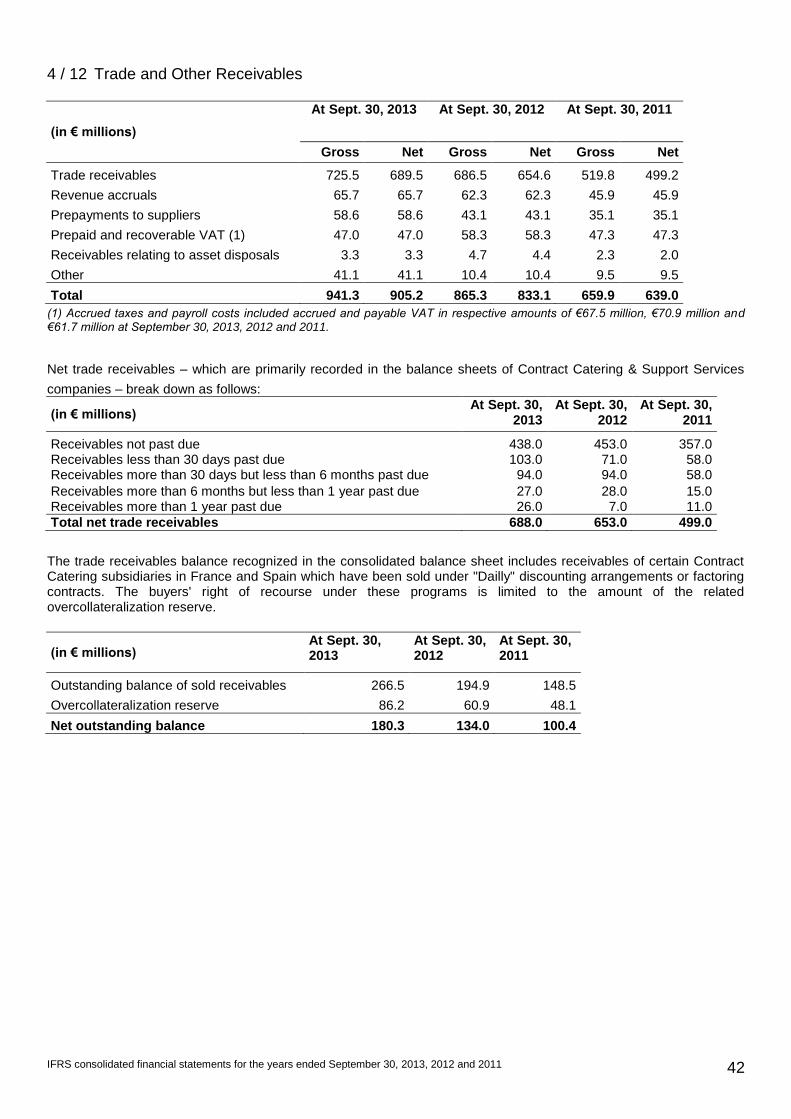
IFRS consolidated financial statements for the years ended September 30, 2013, 2012 and 2011 42
4 / 12 Trade and Other Receivables
(in € millions)
At Sept. 30, 2013 At Sept. 30, 2012 At Sept. 30, 2011
Gross Net Gross Net Gross Net
Trade receivables 725.5 689.5 686.5 654.6 519.8 499.2
Revenue accruals 65.7 65.7 62.3 62.3 45.9 45.9
Prepayments to suppliers 58.6 58.6 43.1 43.1 35.1 35.1
Prepaid and recoverable VAT (1) 47.0 47.0 58.3 58.3 47.3 47.3
Receivables relating to asset disposals 3.3 3.3 4.7 4.4 2.3 2.0
Other 41.1 41.1 10.4 10.4 9.5 9.5
Total 941.3 905.2 865.3 833.1 659.9 639.0
(1) Accrued taxes and payroll costs included accrued and payable VAT in respective amounts of €67.5 million, €70.9 million and €61.7 million at September 30, 2013, 2012 and 2011.
Net trade receivables – which are primarily recorded in the balance sheets of Contract Catering & Support Services
companies – break down as follows:
(in € millions) At Sept. 30,
2013 At Sept. 30,
2012 At Sept. 30,
2011
Receivables not past due 438.0 453.0 357.0 Receivables less than 30 days past due 103.0 71.0 58.0 Receivables more than 30 days but less than 6 months past due 94.0 94.0 58.0
Receivables more than 6 months but less than 1 year past due 27.0 28.0 15.0 Receivables more than 1 year past due 26.0 7.0 11.0
Total net trade receivables 688.0 653.0 499.0
The trade receivables balance recognized in the consolidated balance sheet includes receivables of certain Contract Catering subsidiaries in France and Spain which have been sold under "Dailly" discounting arrangements or factoring contracts. The buyers' right of recourse under these programs is limited to the amount of the related overcollateralization reserve.
(in € millions) At Sept. 30, 2013
At Sept. 30, 2012
At Sept. 30, 2011
Outstanding balance of sold receivables 266.5 194.9 148.5
Overcollateralization reserve 86.2 60.9 48.1
Net outstanding balance 180.3 134.0 100.4
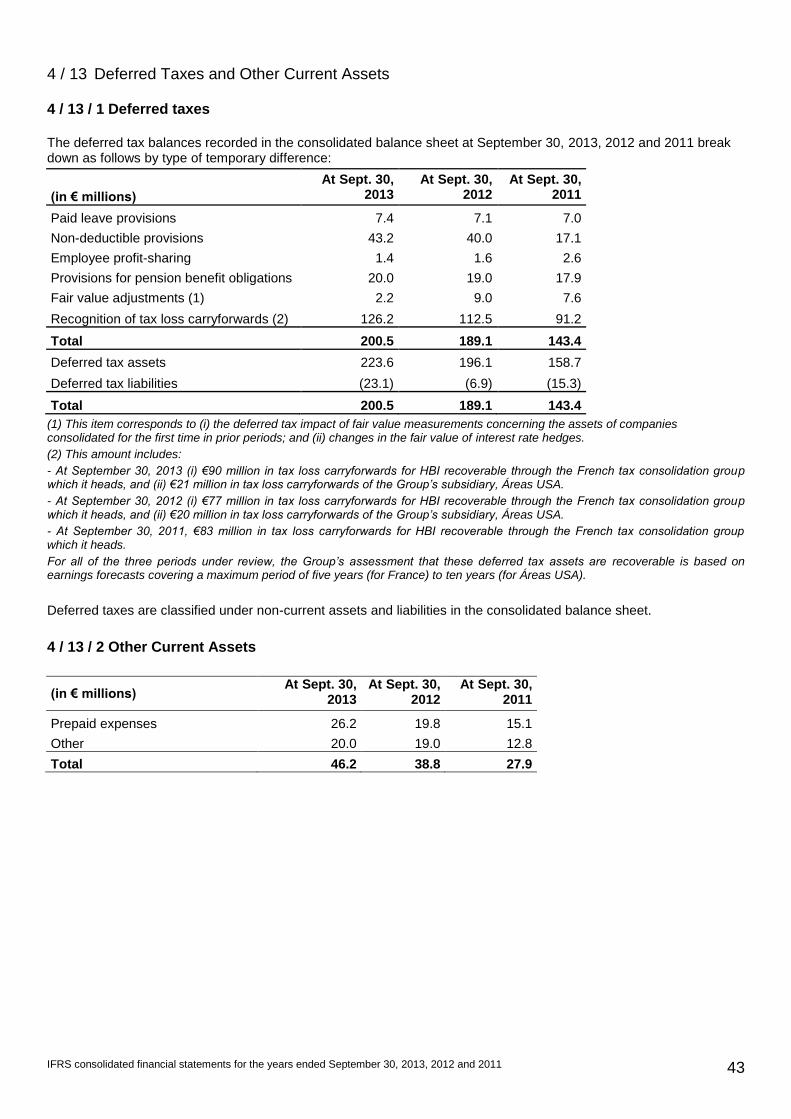
IFRS consolidated financial statements for the years ended September 30, 2013, 2012 and 2011 43
4 / 13 Deferred Taxes and Other Current Assets
4 / 13 / 1 Deferred taxes
The deferred tax balances recorded in the consolidated balance sheet at September 30, 2013, 2012 and 2011 break down as follows by type of temporary difference:
(in € millions)
At Sept. 30, 2013
At Sept. 30, 2012
At Sept. 30, 2011
Paid leave provisions 7.4 7.1 7.0
Non-deductible provisions 43.2 40.0 17.1
Employee profit-sharing 1.4 1.6 2.6
Provisions for pension benefit obligations 20.0 19.0 17.9
Fair value adjustments (1) 2.2 9.0 7.6
Recognition of tax loss carryforwards (2) 126.2 112.5 91.2
Total 200.5 189.1 143.4
Deferred tax assets 223.6 196.1 158.7
Deferred tax liabilities (23.1) (6.9) (15.3)
Total 200.5 189.1 143.4
(1) This item corresponds to (i) the deferred tax impact of fair value measurements concerning the assets of companies consolidated for the first time in prior periods; and (ii) changes in the fair value of interest rate hedges.
(2) This amount includes:
- At September 30, 2013 (i) €90 million in tax loss carryforwards for HBI recoverable through the French tax consolidation group which it heads, and (ii) €21 million in tax loss carryforwards of the Group’s subsidiary, Áreas USA.
- At September 30, 2012 (i) €77 million in tax loss carryforwards for HBI recoverable through the French tax consolidation group which it heads, and (ii) €20 million in tax loss carryforwards of the Group’s subsidiary, Áreas USA.
- At September 30, 2011, €83 million in tax loss carryforwards for HBI recoverable through the French tax consolidation group which it heads.
For all of the three periods under review, the Group’s assessment that these deferred tax assets are recoverable is based on earnings forecasts covering a maximum period of five years (for France) to ten years (for Áreas USA).
Deferred taxes are classified under non-current assets and liabilities in the consolidated balance sheet.
4 / 13 / 2 Other Current Assets
(in € millions) At Sept. 30,
2013 At Sept. 30,
2012 At Sept. 30,
2011
Prepaid expenses 26.2 19.8 15.1
Other 20.0 19.0 12.8
Total 46.2 38.8 27.9
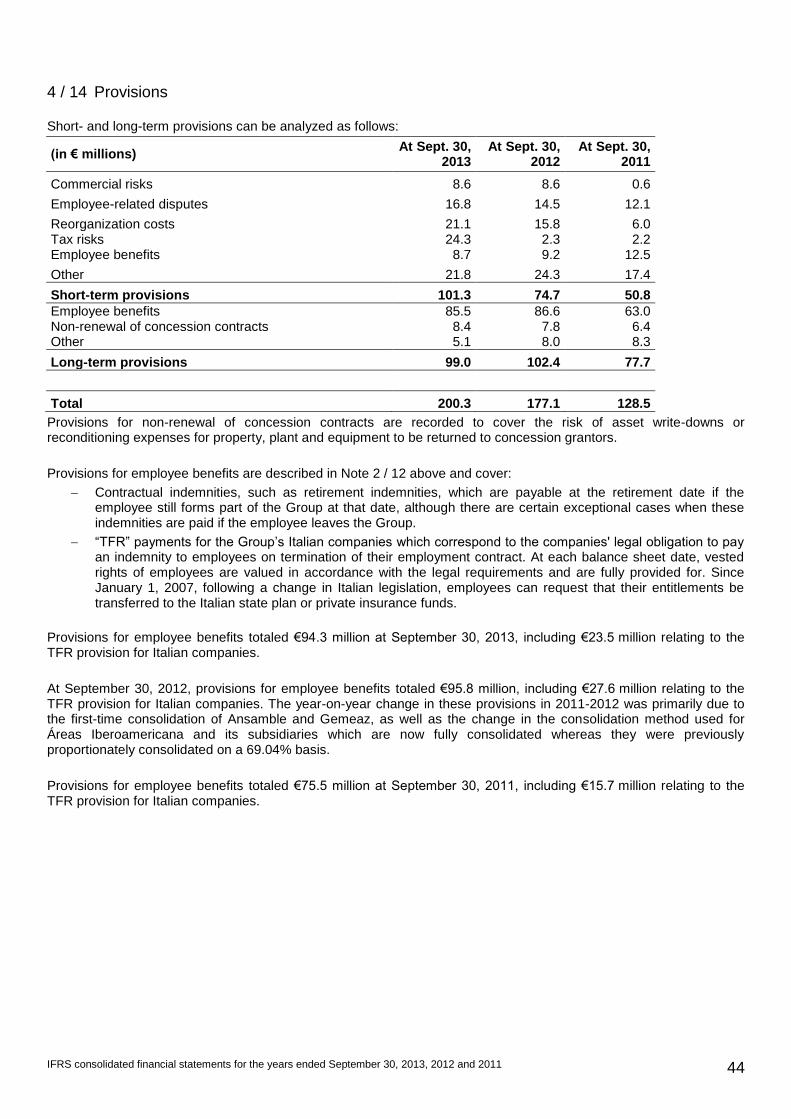
IFRS consolidated financial statements for the years ended September 30, 2013, 2012 and 2011 44
4 / 14 Provisions
Short- and long-term provisions can be analyzed as follows:
(in € millions) At Sept. 30,
2013 At Sept. 30,
2012 At Sept. 30,
2011
Commercial risks 8.6 8.6 0.6
Employee-related disputes 16.8 14.5 12.1
Reorganization costs 21.1 15.8 6.0 Tax risks 24.3 2.3 2.2 Employee benefits 8.7 9.2 12.5
Other 21.8 24.3 17.4
Short-term provisions 101.3 74.7 50.8
Employee benefits 85.5 86.6 63.0 Non-renewal of concession contracts 8.4 7.8 6.4 Other 5.1 8.0 8.3
Long-term provisions 99.0 102.4 77.7
Total 200.3 177.1 128.5
Provisions for non-renewal of concession contracts are recorded to cover the risk of asset write-downs or reconditioning expenses for property, plant and equipment to be returned to concession grantors.
Provisions for employee benefits are described in Note 2 / 12 above and cover:
Contractual indemnities, such as retirement indemnities, which are payable at the retirement date if the employee still forms part of the Group at that date, although there are certain exceptional cases when these indemnities are paid if the employee leaves the Group.
“TFR” payments for the Group’s Italian companies which correspond to the companies' legal obligation to pay an indemnity to employees on termination of their employment contract. At each balance sheet date, vested rights of employees are valued in accordance with the legal requirements and are fully provided for. Since January 1, 2007, following a change in Italian legislation, employees can request that their entitlements be transferred to the Italian state plan or private insurance funds.
Provisions for employee benefits totaled €94.3 million at September 30, 2013, including €23.5 million relating to the TFR provision for Italian companies.
At September 30, 2012, provisions for employee benefits totaled €95.8 million, including €27.6 million relating to the TFR provision for Italian companies. The year-on-year change in these provisions in 2011-2012 was primarily due to the first-time consolidation of Ansamble and Gemeaz, as well as the change in the consolidation method used for Áreas Iberoamericana and its subsidiaries which are now fully consolidated whereas they were previously proportionately consolidated on a 69.04% basis.
Provisions for employee benefits totaled €75.5 million at September 30, 2011, including €15.7 million relating to the TFR provision for Italian companies.
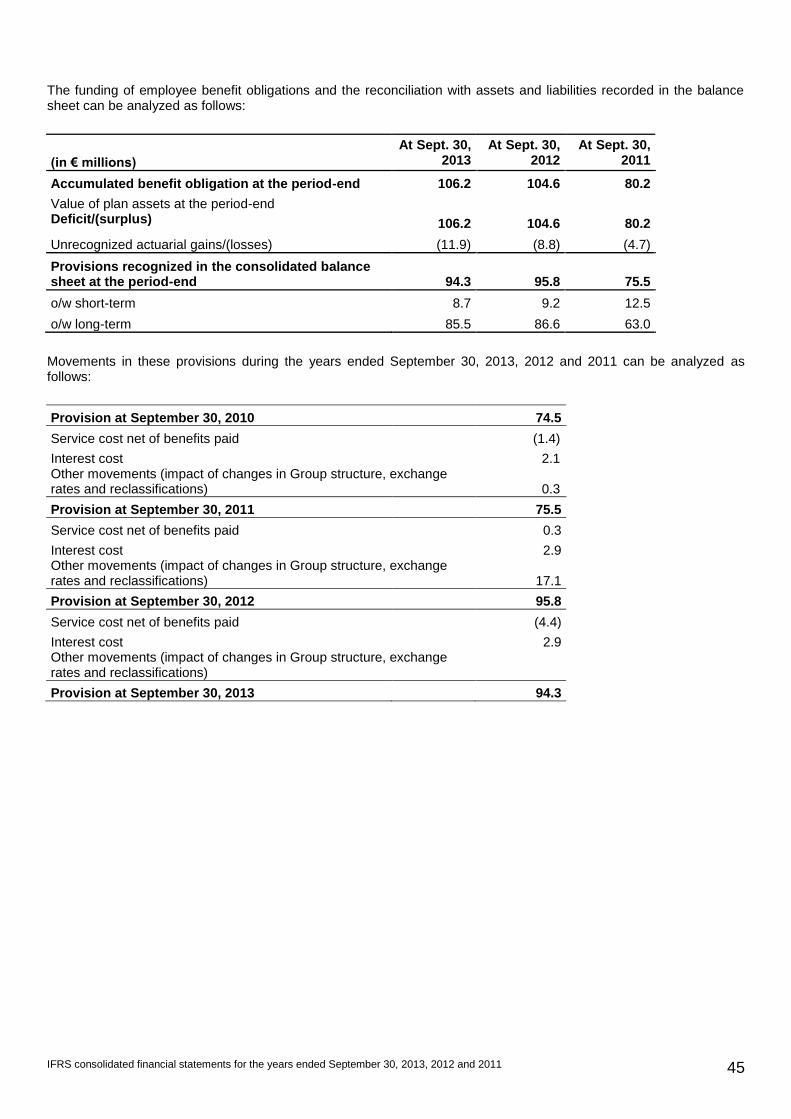
IFRS consolidated financial statements for the years ended September 30, 2013, 2012 and 2011 45
The funding of employee benefit obligations and the reconciliation with assets and liabilities recorded in the balance sheet can be analyzed as follows:
(in € millions)
At Sept. 30, 2013
At Sept. 30, 2012
At Sept. 30, 2011
Accumulated benefit obligation at the period-end 106.2 104.6 80.2
Value of plan assets at the period-end Deficit/(surplus) 106.2 104.6 80.2
Unrecognized actuarial gains/(losses) (11.9) (8.8) (4.7)
Provisions recognized in the consolidated balance sheet at the period-end 94.3 95.8 75.5
o/w short-term 8.7 9.2 12.5
o/w long-term 85.5 86.6 63.0
Movements in these provisions during the years ended September 30, 2013, 2012 and 2011 can be analyzed as follows:
Provision at September 30, 2010 74.5
Service cost net of benefits paid (1.4)
Interest cost 2.1 Other movements (impact of changes in Group structure, exchange rates and reclassifications) 0.3
Provision at September 30, 2011 75.5
Service cost net of benefits paid 0.3
Interest cost 2.9 Other movements (impact of changes in Group structure, exchange rates and reclassifications) 17.1
Provision at September 30, 2012 95.8
Service cost net of benefits paid (4.4)
Interest cost 2.9 Other movements (impact of changes in Group structure, exchange rates and reclassifications)
Provision at September 30, 2013 94.3
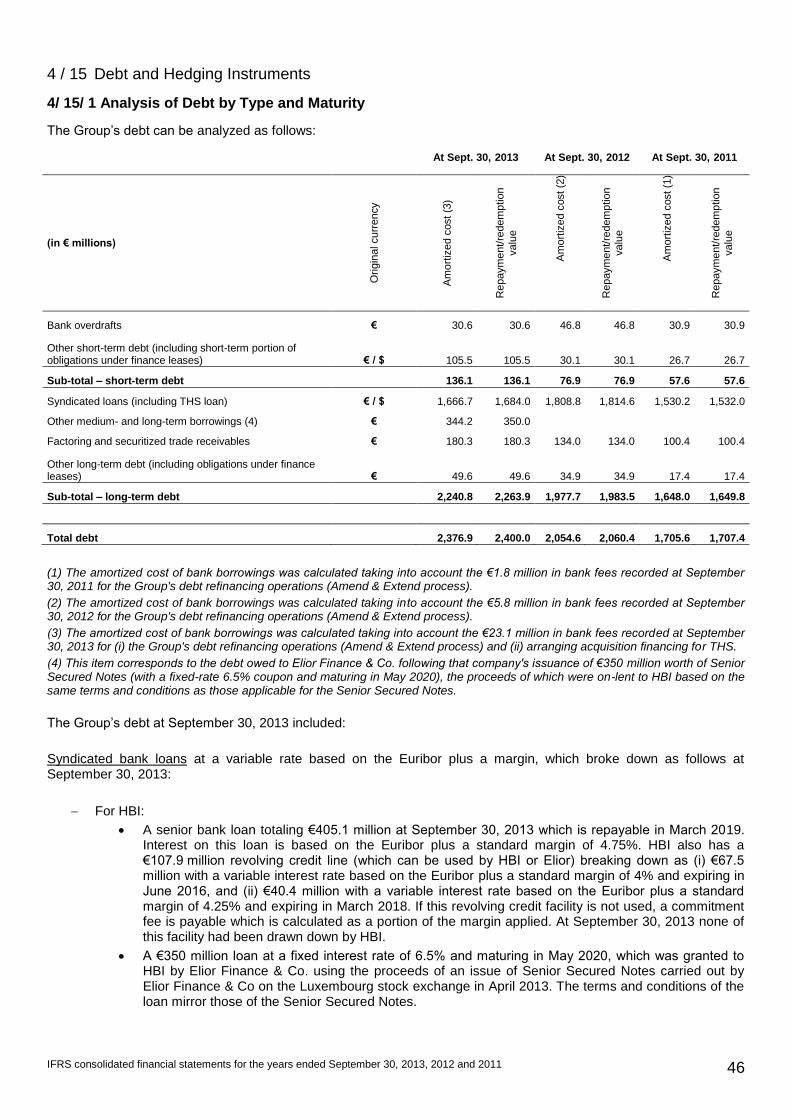
IFRS consolidated financial statements for the years ended September 30, 2013, 2012 and 2011 46
4 / 15 Debt and Hedging Instruments
4/ 15/ 1 Analysis of Debt by Type and Maturity
The Group’s debt can be analyzed as follows:
At Sept. 30, 2013 At Sept. 30, 2012 At Sept. 30, 2011
(in € millions)
Orig
inal curr
ency
Am
ort
ized c
ost (3
)
Repaym
ent/re
dem
ptio
n
valu
e
Am
ort
ized c
ost (2
)
Repaym
ent/re
dem
ptio
n
valu
e
Am
ort
ized c
ost (1
)
Repaym
ent/re
dem
ptio
n
valu
e
Bank overdrafts € 30.6 30.6 46.8 46.8 30.9 30.9
Other short-term debt (including short-term portion of obligations under finance leases) € / $ 105.5 105.5 30.1 30.1 26.7 26.7
Sub-total – short-term debt 136.1 136.1 76.9 76.9 57.6 57.6
Syndicated loans (including THS loan) € / $ 1,666.7 1,684.0 1,808.8 1,814.6 1,530.2 1,532.0
Other medium- and long-term borrowings (4) € 344.2 350.0
Factoring and securitized trade receivables € 180.3 180.3 134.0 134.0 100.4 100.4
Other long-term debt (including obligations under finance leases) € 49.6 49.6 34.9 34.9 17.4 17.4
Sub-total – long-term debt 2,240.8 2,263.9 1,977.7 1,983.5 1,648.0 1,649.8
Total debt 2,376.9 2,400.0 2,054.6 2,060.4 1,705.6 1,707.4
(1) The amortized cost of bank borrowings was calculated taking into account the €1.8 million in bank fees recorded at September 30, 2011 for the Group's debt refinancing operations (Amend & Extend process).
(2) The amortized cost of bank borrowings was calculated taking into account the €5.8 million in bank fees recorded at September 30, 2012 for the Group's debt refinancing operations (Amend & Extend process).
(3) The amortized cost of bank borrowings was calculated taking into account the €23.1 million in bank fees recorded at September 30, 2013 for (i) the Group's debt refinancing operations (Amend & Extend process) and (ii) arranging acquisition financing for THS.
(4) This item corresponds to the debt owed to Elior Finance & Co. following that company's issuance of €350 million worth of Senior Secured Notes (with a fixed-rate 6.5% coupon and maturing in May 2020), the proceeds of which were on-lent to HBI based on the same terms and conditions as those applicable for the Senior Secured Notes.
The Group’s debt at September 30, 2013 included:
Syndicated bank loans at a variable rate based on the Euribor plus a margin, which broke down as follows at September 30, 2013:
For HBI:
A senior bank loan totaling €405.1 million at September 30, 2013 which is repayable in March 2019. Interest on this loan is based on the Euribor plus a standard margin of 4.75%. HBI also has a €107.9 million revolving credit line (which can be used by HBI or Elior) breaking down as (i) €67.5 million with a variable interest rate based on the Euribor plus a standard margin of 4% and expiring in June 2016, and (ii) €40.4 million with a variable interest rate based on the Euribor plus a standard margin of 4.25% and expiring in March 2018. If this revolving credit facility is not used, a commitment fee is payable which is calculated as a portion of the margin applied. At September 30, 2013 none of this facility had been drawn down by HBI.
A €350 million loan at a fixed interest rate of 6.5% and maturing in May 2020, which was granted to HBI by Elior Finance & Co. using the proceeds of an issue of Senior Secured Notes carried out by Elior Finance & Co on the Luxembourg stock exchange in April 2013. The terms and conditions of the loan mirror those of the Senior Secured Notes.
IFRS consolidated financial statements for the years ended September 30, 2013, 2012 and 2011 47
For Elior, a senior bank loan totaling €1,166.2 million at September 30, 2013 and repayable in full in March 2019. Interest on this loan is based on the Euribor plus a standard margin of 4.75%. Elior also has an €89.9 million revolving credit line (which can be used by Elior and its subsidiaries) breaking down as (i) €56.2 million with a variable interest rate based on the Euribor plus a 4% standard margin and expiring in June 2016, and (ii) €33.6 million with a variable interest rate based on the Euribor plus a 4.25% standard margin and expiring in March 2018. If this revolving credit facility is not used, a commitment fee is payable which is calculated as a portion of the margin applied. At September 30, 2013 none of this facility had been drawn down by Elior.
For THS USA, syndicated bank loans made up of (i) a "Term Loan" of which $153 million had been drawn down at September 30, 2013, and (ii) a $40 million "Delayed Draw Term Loan" which has been confirmed until April 2015 and had not been drawn at September 30, 2013. Both of these loans mature in April 2019 and bear interest at a variable rate based on Libor (with a 1.25% floor) plus a standard margin of 4.25%. If the Delayed Draw Term Loan is not used, a commitment fee is payable which is calculated as a limited portion of the margin applied. THS USA also has a $25 million revolving credit line with a variable interest rate based on the Libor plus a standard margin of 3.75% to 4.25% depending on the company's leverage ratio, and expiring in April 2018. At September 30, 2013 none of this facility had been drawn down by THS.
For Áreas SA, a syndicated bank loan made up of (i) an A tranche of $50.0 million, maturing in July 2017 and which had been fully drawn down at September 30, 2013, and (ii) a B tranche of €60.0 million maturing in July 2016, none of which had been drawn down at September 30, 2013. Interest payable on this loan is based on the Libor (for the dollar-denominated tranche) and the Euribor (for the euro-denominated tranche) plus a standard margin of 4.0%.
Liabilities relating to the receivables securitization program as described in Note 4 / 12 above. At September 30, 2013, outstanding securitized receivables – net of the related €86.2 million overcollateralization reserve – stood at €180.3 million. This securitization program was set up at the end of 2006 for a period of five years and has been subsequently extended until June 2018. The ceiling on the program (net of the equivalent of an overcollateralization reserve) is €300 million and it has now been extended to include the receivables of Elior's Spanish and Italian subsidiaries. The Spanish subsidiaries had already begun securitizing their receivables under the program at September 30, 2013 and the Italian subsidiaries will start during the course of 2013-2014. The program’s cost, based on net amounts securitized, represents approximately 2%.
The Group’s debt at September 30, 2012 included:
Syndicated bank loans at a variable rate based on the Euribor plus a margin, which broke down as follows at September 30, 2012:
For HBI, a senior bank loan totaling €650.9 million at September 30, 2012, of which €58.3 million was repayable in June 2014, €58.6 million in June 2015, and €534.1 million in June 2017 following the Amend & Extend process carried out in April 2012. Interest on this loan was based on the Euribor plus an average margin of 4.10%. Also at September 30, 2012 HBI had a €107.9 million revolving credit line (which could be used by HBI or Elior) with a variable interest rate based on the Euribor plus a standard margin of 4.0% and expiring in June 2016. If the facility was not used a commitment fee was payable, calculated as a portion of the margin applied. At September 30, 2012 none of this facility had been drawn down by HBI.
For Elior, a senior bank loan totaling €960.0 million at September 30, 2012, of which €57.4 million was repayable in June 2014, €56.0 million in June 2015, and €846.6 million in June 2017 following the Amend & Extend process carried out in April 2012. Interest on this loan was based on the Euribor plus an average margin of 4.23%. Also at September 30, 2012 Elior had a revolving credit line (which could be used by Elior and its subsidiaries) breaking down as (i) €89.9 million with a variable interest rate based on the Euribor plus a 4.0% margin and expiring in June 2016, and (ii) €22.2 million with a variable interest rate based on Euribor plus a 1.5% margin (this portion of the facility expired in June 2013). If the revolving credit facility was not used, a commitment fee was payable, calculated as a portion of the margin applied. At September 30, 2012, Elior had drawn down €22.2 million under this facility.
For Elior, an acquisition facility drawn down in April 2012 for the acquisitions of Gemeaz and Ansamble, representing an aggregate amount of €200 million with a variable interest rate based on the Euribor plus a 5% margin and expiring in December 2017.
For Áreas SA, a syndicated bank loan made up of (i) an A tranche of $50.0 million maturing in July 2017, of which $26.0 million had been drawn down at September 30, 2012, and (ii) a B tranche of €60.0 million, maturing in July 2016, which had not been drawn down at September 30, 2012. The interest payable on this loan is based on the Libor (for the dollar-denominated tranche) and the Euribor (for the euro-denominated tranche) plus a standard margin of 4.0%.
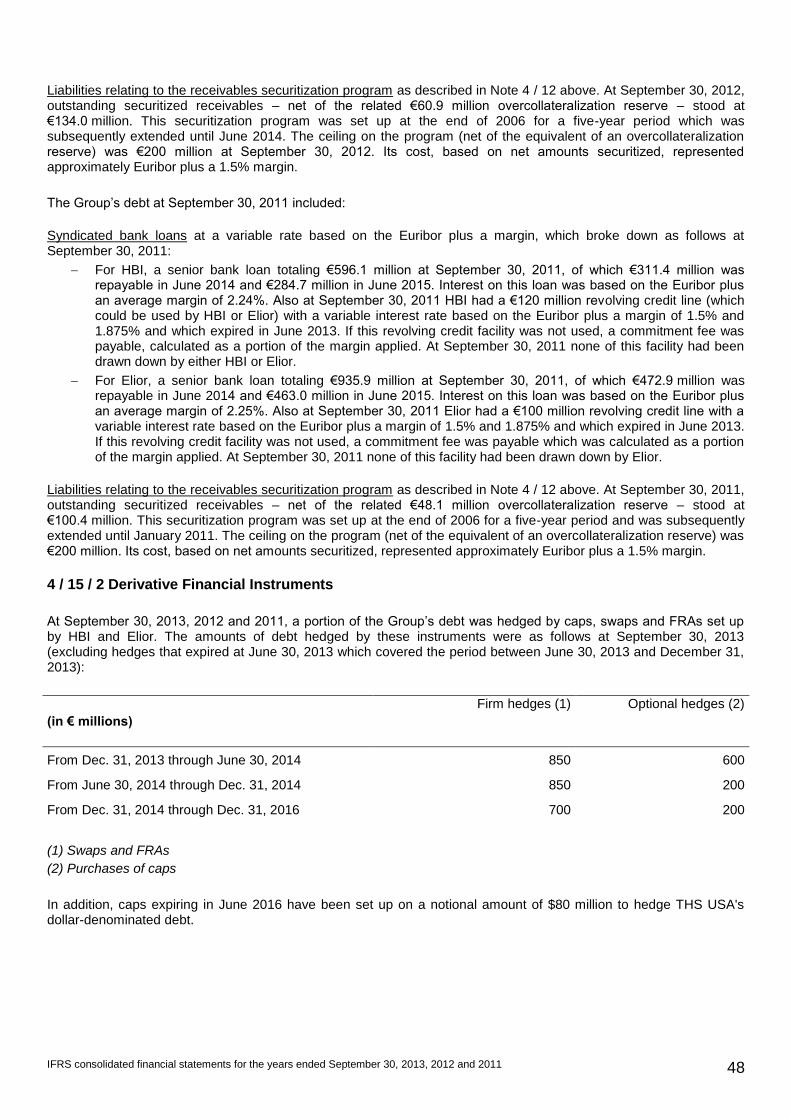
IFRS consolidated financial statements for the years ended September 30, 2013, 2012 and 2011 48
Liabilities relating to the receivables securitization program as described in Note 4 / 12 above. At September 30, 2012, outstanding securitized receivables – net of the related €60.9 million overcollateralization reserve – stood at €134.0 million. This securitization program was set up at the end of 2006 for a five-year period which was subsequently extended until June 2014. The ceiling on the program (net of the equivalent of an overcollateralization reserve) was €200 million at September 30, 2012. Its cost, based on net amounts securitized, represented approximately Euribor plus a 1.5% margin.
The Group’s debt at September 30, 2011 included:
Syndicated bank loans at a variable rate based on the Euribor plus a margin, which broke down as follows at September 30, 2011:
For HBI, a senior bank loan totaling €596.1 million at September 30, 2011, of which €311.4 million was repayable in June 2014 and €284.7 million in June 2015. Interest on this loan was based on the Euribor plus an average margin of 2.24%. Also at September 30, 2011 HBI had a €120 million revolving credit line (which could be used by HBI or Elior) with a variable interest rate based on the Euribor plus a margin of 1.5% and 1.875% and which expired in June 2013. If this revolving credit facility was not used, a commitment fee was payable, calculated as a portion of the margin applied. At September 30, 2011 none of this facility had been drawn down by either HBI or Elior.
For Elior, a senior bank loan totaling €935.9 million at September 30, 2011, of which €472.9 million was repayable in June 2014 and €463.0 million in June 2015. Interest on this loan was based on the Euribor plus an average margin of 2.25%. Also at September 30, 2011 Elior had a €100 million revolving credit line with a variable interest rate based on the Euribor plus a margin of 1.5% and 1.875% and which expired in June 2013. If this revolving credit facility was not used, a commitment fee was payable which was calculated as a portion of the margin applied. At September 30, 2011 none of this facility had been drawn down by Elior.
Liabilities relating to the receivables securitization program as described in Note 4 / 12 above. At September 30, 2011, outstanding securitized receivables – net of the related €48.1 million overcollateralization reserve – stood at €100.4 million. This securitization program was set up at the end of 2006 for a five-year period and was subsequently extended until January 2011. The ceiling on the program (net of the equivalent of an overcollateralization reserve) was €200 million. Its cost, based on net amounts securitized, represented approximately Euribor plus a 1.5% margin.
4 / 15 / 2 Derivative Financial Instruments
At September 30, 2013, 2012 and 2011, a portion of the Group’s debt was hedged by caps, swaps and FRAs set up by HBI and Elior. The amounts of debt hedged by these instruments were as follows at September 30, 2013 (excluding hedges that expired at June 30, 2013 which covered the period between June 30, 2013 and December 31, 2013):
(in € millions)
Firm hedges (1) Optional hedges (2)
From Dec. 31, 2013 through June 30, 2014 850 600
From June 30, 2014 through Dec. 31, 2014 850 200
From Dec. 31, 2014 through Dec. 31, 2016 700 200
(1) Swaps and FRAs
(2) Purchases of caps
In addition, caps expiring in June 2016 have been set up on a notional amount of $80 million to hedge THS USA's dollar-denominated debt.
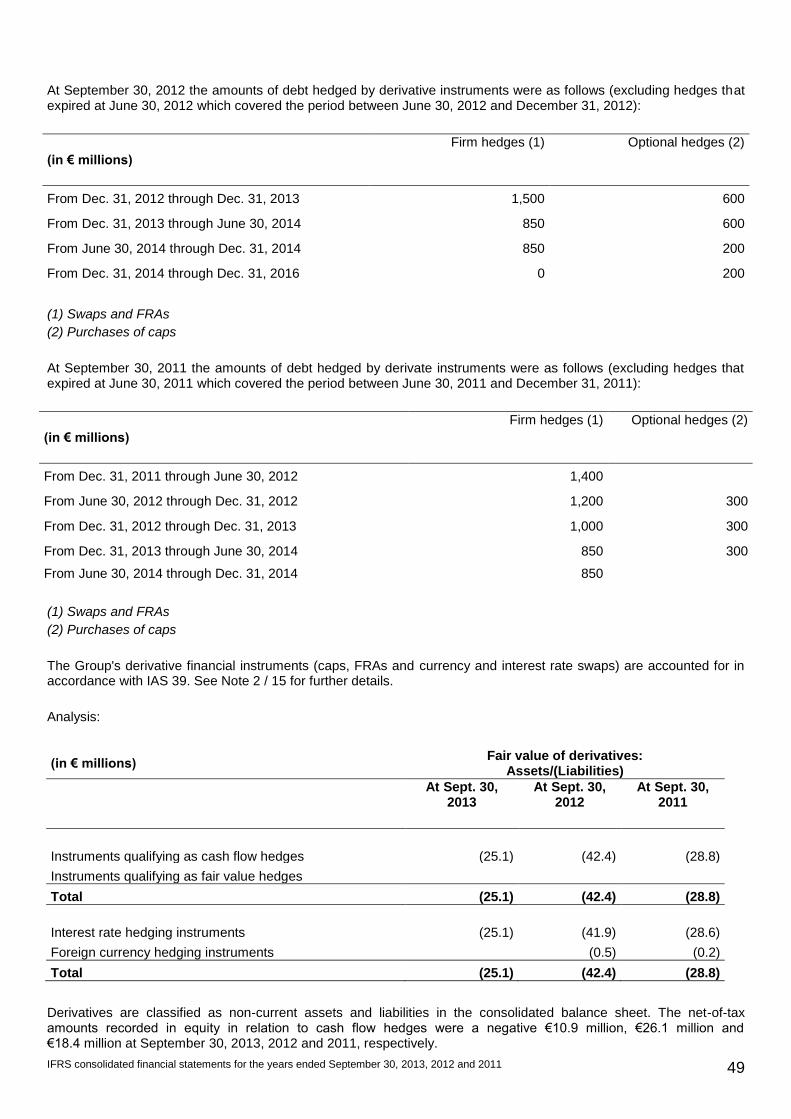
IFRS consolidated financial statements for the years ended September 30, 2013, 2012 and 2011 49
At September 30, 2012 the amounts of debt hedged by derivative instruments were as follows (excluding hedges that expired at June 30, 2012 which covered the period between June 30, 2012 and December 31, 2012):
(in € millions)
Firm hedges (1) Optional hedges (2)
From Dec. 31, 2012 through Dec. 31, 2013 1,500 600
From Dec. 31, 2013 through June 30, 2014 850 600
From June 30, 2014 through Dec. 31, 2014 850 200
From Dec. 31, 2014 through Dec. 31, 2016 0 200
(1) Swaps and FRAs
(2) Purchases of caps
At September 30, 2011 the amounts of debt hedged by derivate instruments were as follows (excluding hedges that expired at June 30, 2011 which covered the period between June 30, 2011 and December 31, 2011):
(in € millions)
Firm hedges (1) Optional hedges (2)
From Dec. 31, 2011 through June 30, 2012 1,400
From June 30, 2012 through Dec. 31, 2012 1,200 300
From Dec. 31, 2012 through Dec. 31, 2013 1,000 300
From Dec. 31, 2013 through June 30, 2014 850 300
From June 30, 2014 through Dec. 31, 2014 850
(1) Swaps and FRAs
(2) Purchases of caps
The Group's derivative financial instruments (caps, FRAs and currency and interest rate swaps) are accounted for in accordance with IAS 39. See Note 2 / 15 for further details.
Analysis:
(in € millions) Fair value of derivatives:
Assets/(Liabilities)
At Sept. 30, 2013
At Sept. 30, 2012
At Sept. 30, 2011
Instruments qualifying as cash flow hedges (25.1) (42.4) (28.8)
Instruments qualifying as fair value hedges
Total (25.1) (42.4) (28.8)
Interest rate hedging instruments (25.1) (41.9) (28.6)
Foreign currency hedging instruments (0.5) (0.2)
Total (25.1) (42.4) (28.8)
Derivatives are classified as non-current assets and liabilities in the consolidated balance sheet. The net-of-tax amounts recorded in equity in relation to cash flow hedges were a negative €10.9 million, €26.1 million and €18.4 million at September 30, 2013, 2012 and 2011, respectively.
IFRS consolidated financial statements for the years ended September 30, 2013, 2012 and 2011 50
4 / 15 / 3 Financial Covenants
The medium- and long-term bank borrowing contracts entered into by HBI and Elior include financial covenants that could trigger compulsory early repayment in the event of non-compliance. The covenants are based on HBI’s consolidated financial ratios and compliance checks are carried out at each quarterly period-end. None of the covenants had been breached at September 30, 2013, 2012 or 2011 or at any of the other quarterly period-ends during the three financial years under review. The annual covenants calculations are reviewed by the auditors.
HBI SCA and Elior SCA's medium- and long-term term borrowing contracts do not include any exceptional clauses compared with the standard legal provisions which apply to this type of contract.
4 / 16 Parent Company’s Share Capital and Stock Options
4 / 16 / 1 Share Capital and Stock Options
At September 30, 2013 and 2012, the share capital of HBI, which is a partnership limited by shares ("société en commandite par actions"), was €1,088,203.58 divided into 108,820,358 shares with a par value of €0.01 each. In January 2012, HBI carried out a share buyback program which led to the cancellation of 30,701,700 shares.
At September 30, 2011, HBI's share capital was €1,395,220.58 divided into 139,522,058 shares with a par value of €0.01 each.
4 / 16 / 2 Stock options granted to employees of HBI and its subsidiaries
Date of Shareholders’
Meeting
Grant date by Managing
Partner Start of
exercise period End of exercise
period
Exercise price
per share (in €)
(1)
Total number of shares under option (2)
Number of grantees
(2)
2012-2013 2011-2012 2010-2011
Feb. 12, 2010 April 15, 2010 April 15, 2014 March 31, 2018 5.71 380,600 421,320 477,020 148
Jan. 18, 2011 April 15, 2011 April 15, 2015 March 31, 2018 5.72 474,990 519,460 545,000 189
Total 855,590 940,780 1,022,020 (1)
Exercise prices have been adjusted to take into account the capital reduction carried out on February 2, 2012. (2)
Adjusted to take into account departures of employee grantees.
4 / 17 Liabilities Relating to Share Acquisitions and Future Dividend Payments
The net amount recorded in the consolidated financial statements at September 30, 2013 for liabilities relating to share acquisitions and future dividend payments totaled €53.8 million. This total primarily includes the following:
- €13.8 million corresponding to the Group’s liability towards the non-controlling shareholders of MyChef (which is fully consolidated) relating to the 11.8% of the company’s capital which is not yet owned by the Group but is covered by cross put and call options which have been exercisable since 2011.
- €1.0 million corresponding to the residual liability relating to the Group's acquisition of full control over Copra Ristorazione.
- €3.7 million relating to additional purchase consideration payable from 2013 for the purchase of shares in Ansamble.
- €18 million corresponding to the liability recognized by way of a deduction from equity attributable to non-controlling interests for the estimated future dividends to be paid to Áreas’ non-controlling shareholders in the five years following the Group's acquisition of control in May 2012.
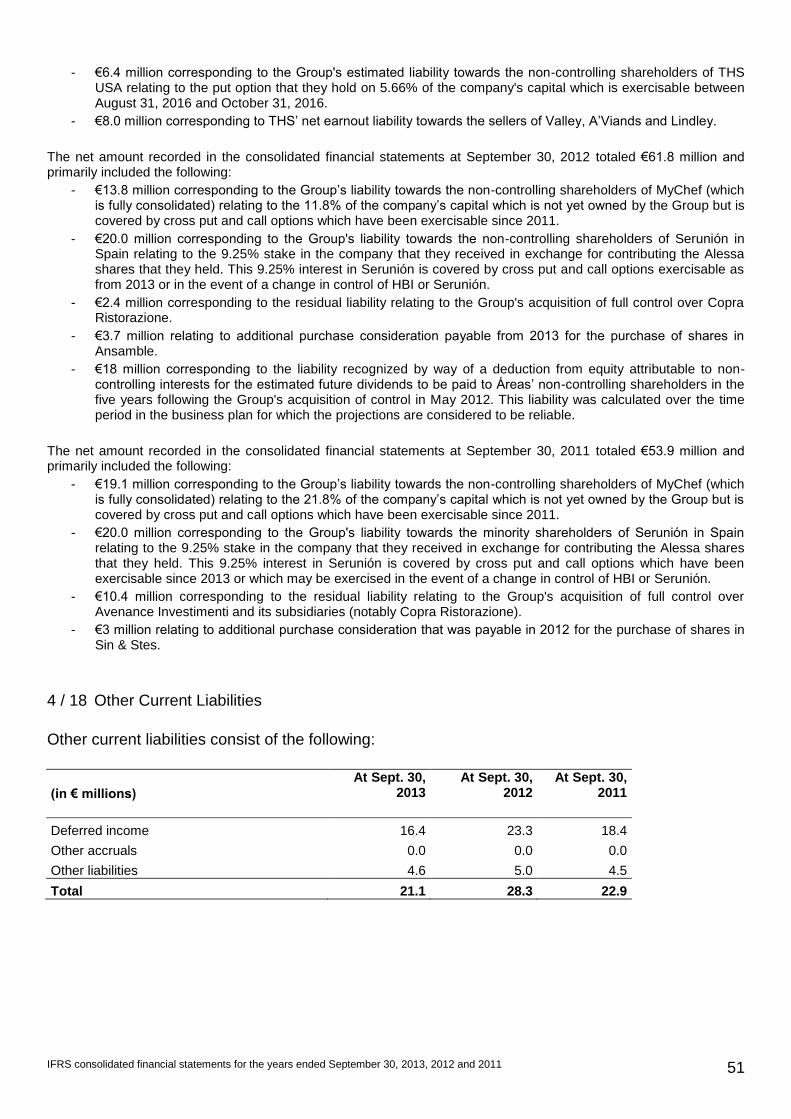
IFRS consolidated financial statements for the years ended September 30, 2013, 2012 and 2011 51
- €6.4 million corresponding to the Group's estimated liability towards the non-controlling shareholders of THS USA relating to the put option that they hold on 5.66% of the company's capital which is exercisable between August 31, 2016 and October 31, 2016.
- €8.0 million corresponding to THS’ net earnout liability towards the sellers of Valley, A’Viands and Lindley.
The net amount recorded in the consolidated financial statements at September 30, 2012 totaled €61.8 million and primarily included the following:
- €13.8 million corresponding to the Group’s liability towards the non-controlling shareholders of MyChef (which is fully consolidated) relating to the 11.8% of the company’s capital which is not yet owned by the Group but is covered by cross put and call options which have been exercisable since 2011.
- €20.0 million corresponding to the Group's liability towards the non-controlling shareholders of Serunión in Spain relating to the 9.25% stake in the company that they received in exchange for contributing the Alessa shares that they held. This 9.25% interest in Serunión is covered by cross put and call options exercisable as from 2013 or in the event of a change in control of HBI or Serunión.
- €2.4 million corresponding to the residual liability relating to the Group's acquisition of full control over Copra Ristorazione.
- €3.7 million relating to additional purchase consideration payable from 2013 for the purchase of shares in Ansamble.
- €18 million corresponding to the liability recognized by way of a deduction from equity attributable to non-controlling interests for the estimated future dividends to be paid to Áreas’ non-controlling shareholders in the five years following the Group's acquisition of control in May 2012. This liability was calculated over the time period in the business plan for which the projections are considered to be reliable.
The net amount recorded in the consolidated financial statements at September 30, 2011 totaled €53.9 million and primarily included the following:
- €19.1 million corresponding to the Group’s liability towards the non-controlling shareholders of MyChef (which is fully consolidated) relating to the 21.8% of the company’s capital which is not yet owned by the Group but is covered by cross put and call options which have been exercisable since 2011.
- €20.0 million corresponding to the Group's liability towards the minority shareholders of Serunión in Spain relating to the 9.25% stake in the company that they received in exchange for contributing the Alessa shares that they held. This 9.25% interest in Serunión is covered by cross put and call options which have been exercisable since 2013 or which may be exercised in the event of a change in control of HBI or Serunión.
- €10.4 million corresponding to the residual liability relating to the Group's acquisition of full control over Avenance Investimenti and its subsidiaries (notably Copra Ristorazione).
- €3 million relating to additional purchase consideration that was payable in 2012 for the purchase of shares in Sin & Stes.
4 / 18 Other Current Liabilities
Other current liabilities consist of the following:
(in € millions)
At Sept. 30, 2013
At Sept. 30, 2012
At Sept. 30, 2011
Deferred income 16.4 23.3 18.4
Other accruals 0.0 0.0 0.0
Other liabilities 4.6 5.0 4.5
Total 21.1 28.3 22.9
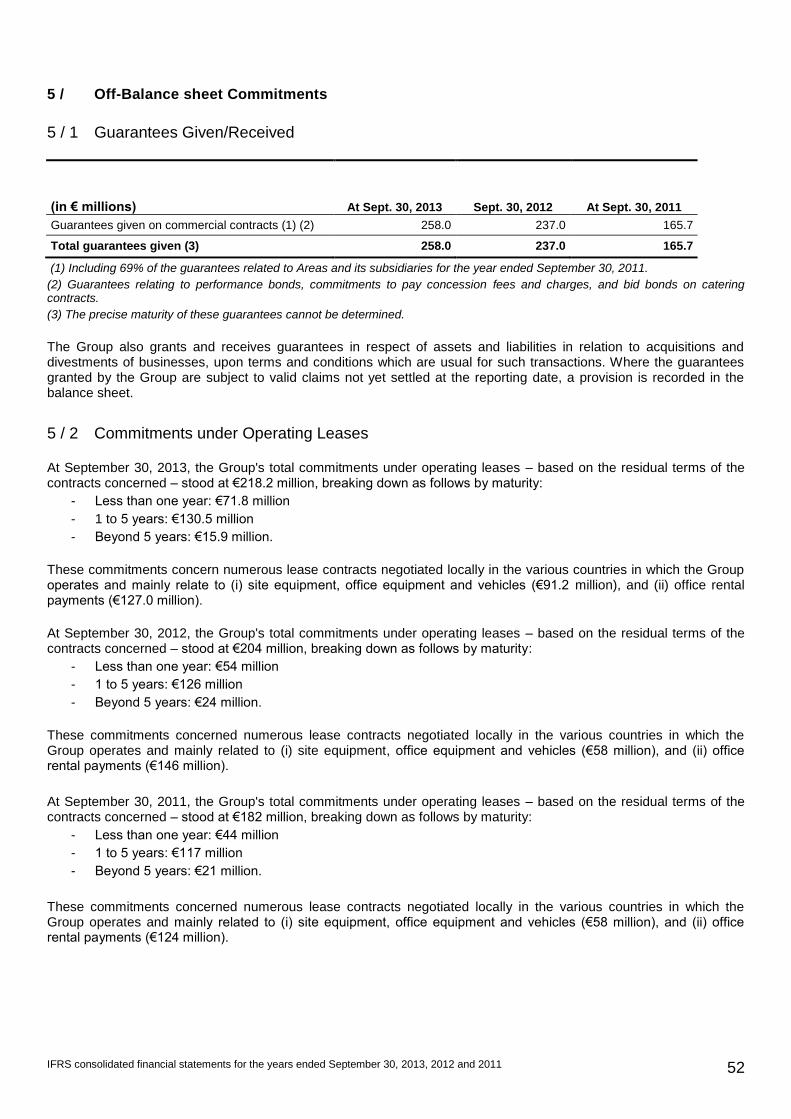
IFRS consolidated financial statements for the years ended September 30, 2013, 2012 and 2011 52
5 / Off-Balance sheet Commitments
5 / 1 Guarantees Given/Received
(in € millions) At Sept. 30, 2013 Sept. 30, 2012 At Sept. 30, 2011
Guarantees given on commercial contracts (1) (2) 258.0 237.0 165.7
Total guarantees given (3) 258.0 237.0 165.7
(1) Including 69% of the guarantees related to Areas and its subsidiaries for the year ended September 30, 2011.
(2) Guarantees relating to performance bonds, commitments to pay concession fees and charges, and bid bonds on catering contracts.
(3) The precise maturity of these guarantees cannot be determined.
The Group also grants and receives guarantees in respect of assets and liabilities in relation to acquisitions and divestments of businesses, upon terms and conditions which are usual for such transactions. Where the guarantees granted by the Group are subject to valid claims not yet settled at the reporting date, a provision is recorded in the balance sheet.
5 / 2 Commitments under Operating Leases
At September 30, 2013, the Group's total commitments under operating leases – based on the residual terms of the contracts concerned – stood at €218.2 million, breaking down as follows by maturity:
- Less than one year: €71.8 million
- 1 to 5 years: €130.5 million
- Beyond 5 years: €15.9 million.
These commitments concern numerous lease contracts negotiated locally in the various countries in which the Group operates and mainly relate to (i) site equipment, office equipment and vehicles (€91.2 million), and (ii) office rental payments (€127.0 million).
At September 30, 2012, the Group's total commitments under operating leases – based on the residual terms of the contracts concerned – stood at €204 million, breaking down as follows by maturity:
- Less than one year: €54 million
- 1 to 5 years: €126 million
- Beyond 5 years: €24 million.
These commitments concerned numerous lease contracts negotiated locally in the various countries in which the Group operates and mainly related to (i) site equipment, office equipment and vehicles (€58 million), and (ii) office rental payments (€146 million).
At September 30, 2011, the Group's total commitments under operating leases – based on the residual terms of the contracts concerned – stood at €182 million, breaking down as follows by maturity:
- Less than one year: €44 million
- 1 to 5 years: €117 million
- Beyond 5 years: €21 million.
These commitments concerned numerous lease contracts negotiated locally in the various countries in which the Group operates and mainly related to (i) site equipment, office equipment and vehicles (€58 million), and (ii) office rental payments (€124 million).
IFRS consolidated financial statements for the years ended September 30, 2013, 2012 and 2011 53
5 / 3 Put Options on Shares in Áreas
Following the transactions carried out in June 2012 which led to the Group acquiring control of Áreas Iberoamericana and the signature of a new shareholders' agreement, Emesa – the minority shareholder in Áreas Iberoamericana with a 38.45% ownership interest – was granted a put option enabling it to sell all of its shares in Áreas Iberoamericana to Elior Concessions in a single transaction.
Following the merger in 2013 between Áreas and Áreas Iberoamericana, this put now covers the Áreas shares held by Emesa.
Emesa will be entitled to exercise its put within a period of three years of certain events occurring, such as if (i) Robert Zolade or any member of his family no longer form part of the governance bodies of the company that controls Elior Concessions (a “Dissociation”), or (ii) there is a change in control of Elior Concessions, which is a direct shareholder of Áreas with a 61.55% ownership interest and a wholly-owned subsidiary of HBI, either directly or indirectly through a change of control of HBI (a “Change of Control”), or (iii) Emesa's shareholding in Áreas falls to below 20% following a dilutive event (a "Dilution").
HBI considers that it has control over the conditions for exercising the put for the following reasons:
- Concerning the “Dissociation” and “Change of Control” conditions, the Group considers that HBI’s shareholders can be deemed to represent the Company. Any decision taken relating to a “Change of Control” could be considered to be a decision taken collectively within HBI, by the Group’s governance bodies.
- Concerning the “Dilution” condition, the only triggering event would be an increase in Áreas' share capital, which requires the approval of HBI.
As these conditions had not been met at September 30, 2013, the put was not recognized in the financial statements at that date.
If the applicable conditions are met and the put is exercised, the purchase price of the shares concerned will be determined by an investment bank specifically commissioned for the purpose, based on the methods and factors commonly used by professional investors. Consequently the purchase price will correspond to the shares' fair value. For the year ended September 30, 2013 the Áreas Group generated €605 million in consolidated revenue and had consolidated EBITDA of €40 million. Its consolidated net debt amounted to €38 million at September 30, 2013.
5 / 4 Put options on shares in TrustHouse Services Group
Following the transactions carried out in April 2013 which led to the Group acquiring control of TrustHouse Services Group and the signature of a new shareholders' agreement, some of the managers (non-controlling shareholders in THS with a 22.07% ownership interest) were granted put options enabling them to sell to Elior, in a single transaction, shares representing an aggregate 5.66% of THS' capital. These put options will be exercisable for a period of two months as from August 31, 2016.
If the put options are exercised, their value at the exercise date will be calculated using the same multiples method as that used when Elior acquired its interest in THS. At September 30, 2013, the liability related to the put options was recognized in an amount of €6.4 million, corresponding to the present value of the related commitment.
6 / Related Party Transactions
6 / 1 Executive Compensation and Benefits
Compensation and benefits are paid to executives, corresponding to individuals who exercise authority and responsibility for the control and management of the Group's entities.
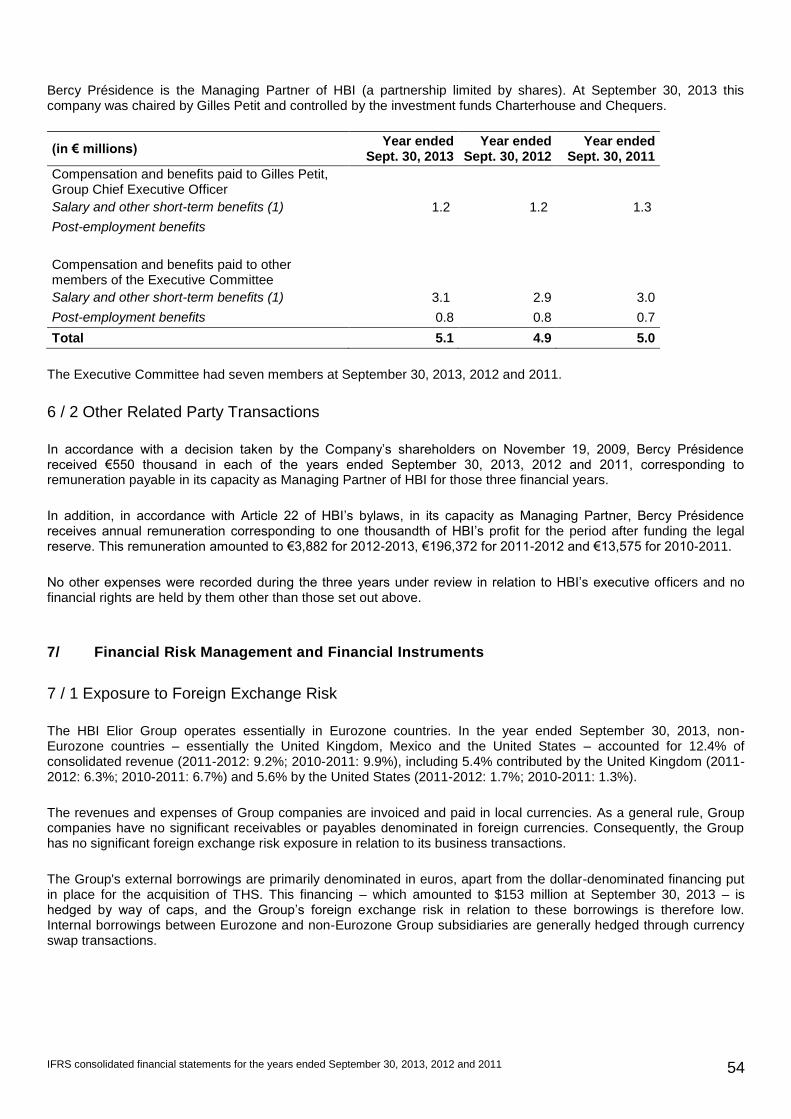
IFRS consolidated financial statements for the years ended September 30, 2013, 2012 and 2011 54
Bercy Présidence is the Managing Partner of HBI (a partnership limited by shares). At September 30, 2013 this company was chaired by Gilles Petit and controlled by the investment funds Charterhouse and Chequers.
(in € millions) Year ended
Sept. 30, 2013 Year ended
Sept. 30, 2012 Year ended
Sept. 30, 2011
Compensation and benefits paid to Gilles Petit, Group Chief Executive Officer
Salary and other short-term benefits (1) 1.2 1.2 1.3
Post-employment benefits
Compensation and benefits paid to other members of the Executive Committee
Salary and other short-term benefits (1) 3.1 2.9 3.0
Post-employment benefits 0.8 0.8 0.7
Total 5.1 4.9 5.0
The Executive Committee had seven members at September 30, 2013, 2012 and 2011.
6 / 2 Other Related Party Transactions
In accordance with a decision taken by the Company’s shareholders on November 19, 2009, Bercy Présidence received €550 thousand in each of the years ended September 30, 2013, 2012 and 2011, corresponding to remuneration payable in its capacity as Managing Partner of HBI for those three financial years.
In addition, in accordance with Article 22 of HBI’s bylaws, in its capacity as Managing Partner, Bercy Présidence receives annual remuneration corresponding to one thousandth of HBI’s profit for the period after funding the legal reserve. This remuneration amounted to €3,882 for 2012-2013, €196,372 for 2011-2012 and €13,575 for 2010-2011.
No other expenses were recorded during the three years under review in relation to HBI’s executive officers and no financial rights are held by them other than those set out above.
7/ Financial Risk Management and Financial Instruments
7 / 1 Exposure to Foreign Exchange Risk
The HBI Elior Group operates essentially in Eurozone countries. In the year ended September 30, 2013, non-Eurozone countries – essentially the United Kingdom, Mexico and the United States – accounted for 12.4% of consolidated revenue (2011-2012: 9.2%; 2010-2011: 9.9%), including 5.4% contributed by the United Kingdom (2011-2012: 6.3%; 2010-2011: 6.7%) and 5.6% by the United States (2011-2012: 1.7%; 2010-2011: 1.3%).
The revenues and expenses of Group companies are invoiced and paid in local currencies. As a general rule, Group companies have no significant receivables or payables denominated in foreign currencies. Consequently, the Group has no significant foreign exchange risk exposure in relation to its business transactions.
The Group's external borrowings are primarily denominated in euros, apart from the dollar-denominated financing put in place for the acquisition of THS. This financing – which amounted to $153 million at September 30, 2013 – is hedged by way of caps, and the Group’s foreign exchange risk in relation to these borrowings is therefore low. Internal borrowings between Eurozone and non-Eurozone Group subsidiaries are generally hedged through currency swap transactions.
IFRS consolidated financial statements for the years ended September 30, 2013, 2012 and 2011 55
The Group has set up currency swaps to hedge its net investment in subsidiaries located in the United Kingdom and the United States. For the three periods under review these hedges represented the following notional amounts:
- £10 million and $160 million at September 30, 2013, of which $140 million concerning HBI and $20 million concerning Áreas SA.
- £10 million and $70 million at September 30, 2012, of which $50 million concerning HBI and $20 million concerning Áreas SA.
- £10 million and $19 million at September 30, 2011.
Elior SCA uses forward currency sale contracts to hedge the net assets of and loans granted to Elior UK. The outstanding amounts of these currency hedges were £47.3 million at September 30, 2013, £51.3 million at September 30, 2012 and £44.3 million at September 30, 2011. Similarly, Areas SA uses forward currency sale contracts to hedge the net assets of and loans granted to its U.S. and Mexican subsidiaries. The outstanding amounts of these currency hedges were $23 million and 128 million pesos at September 30, 2013 and $36 million and 120 million pesos at September 30, 2012 (not applicable at September 30, 2011).
The Group’s sensitivity to changes in exchange rates mainly relates to fluctuations in the value of:
- The pound sterling against the euro: a 5% increase or decrease in this value compared with the average rate of 0.8356 for 2012-2013 would result in a corresponding change in consolidated revenue and recurring operating profit of €14 million and €0.5 million respectively.
- The US dollar against the euro: a 5% increase or decrease in this value compared with the average rate of 1.3091 for 2012-2013 would result in a corresponding change in consolidated revenue and recurring operating profit of €25 million and €1.5 million respectively.
7 / 2 Exposure to Interest Rate Risk
The Group is exposed to the risk of fluctuations in interest rates on debt that is indexed to the Euro Interbank Offered Rate (“Euribor”) plus an applicable margin.
In order to manage interest rate risk, the Group has set up interest rate swaps, caps and FRAs. These hedges mitigate (i) the risk of variable interest rates affecting the fair value of the Group's fixed-rate debt, and (ii) the impact of the Group's variable-rate debt on consolidated cash. Hedges set up using options are referred to as “optional hedges” and other hedges are referred to as “firm hedges”. The net amount of firm hedges set up does not exceed the amount of the Group’s debt for a given period and the net gains or losses on hedges are allocated to the hedged period.
The rates at which the Group’s debt is hedged (against the 6-month Euribor) were as follows at September 30, 2013:
- For the period from December 31, 2013 through June 30, 2014: 2.48% for firm hedges (€850 million) and 3.50% for optional hedges (€600 million).
- For the period from June 30, 2014 through December 31, 2014: 2.48% for firm hedges (€850 million) and 2.5% for optional hedges (€200 million).
- For the period from December 31, 2014 through December 31, 2016: 1.25% for firm hedges (€700 million) and 2.50% for optional hedges (€200 million).
The rates at which the Group’s debt was hedged (against the 6-month Euribor) were as follows at September 30, 2012:
- For the period from December 31, 2012 through December 31, 2013: a net rate of 1.55% for firm hedges (€1,500 million) and a 3.50% rate for optional hedges (€600 million).
- For the period from December 31, 2013 through June 30, 2014: 2.48% for firm hedges (€850 million) and 3.50% for optional hedges (€600 million).
- For the period from June 30, 2014 through December 31, 2014: 2.48% for firm hedges (€850 million) and 2.5% for optional hedges (€200 million).
- For the period from December 31, 2014 through December 31, 2016: 2.50% for optional hedges (€200 million).
The rates at which the Group’s debt was hedged (against the 6-month Euribor) were as follows at September 30, 2011:
- For the period from December 31, 2011 through June 30, 2012: a net rate of 2.32% for firm hedges (€1,400 million).
- For the period from June 30, 2012 through December 31, 2012: 1.70% for firm hedges (€1,200 million).
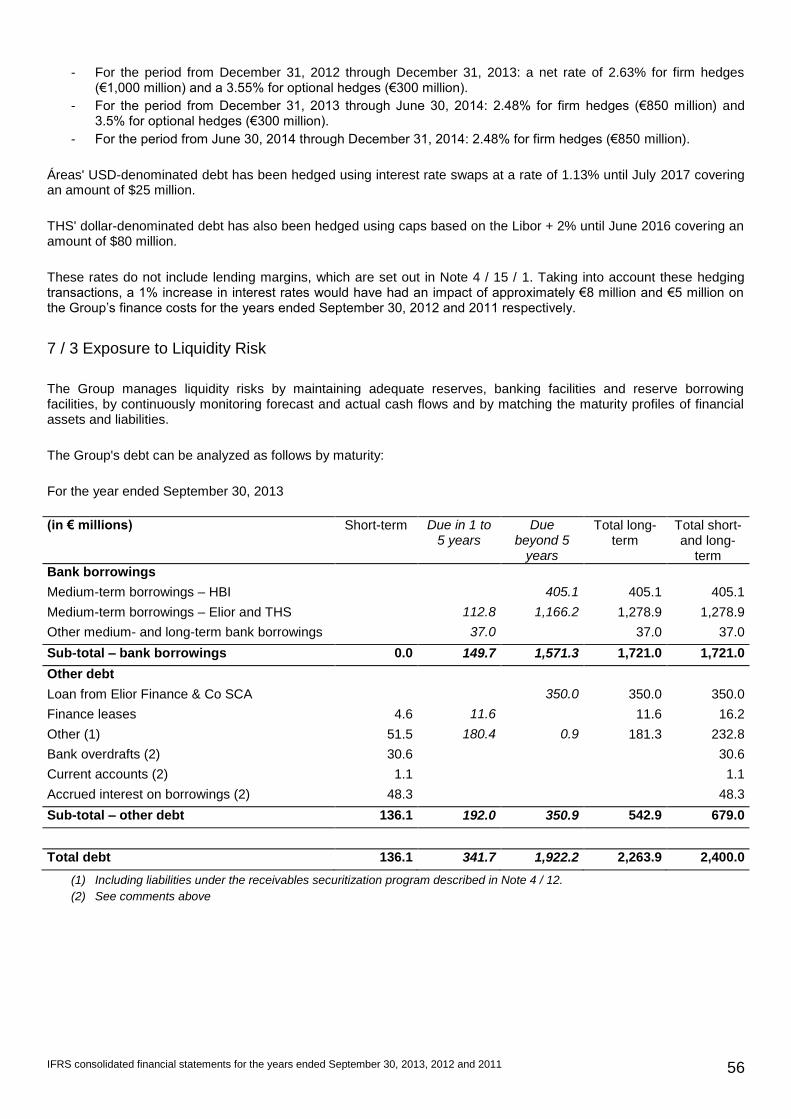
IFRS consolidated financial statements for the years ended September 30, 2013, 2012 and 2011 56
- For the period from December 31, 2012 through December 31, 2013: a net rate of 2.63% for firm hedges (€1,000 million) and a 3.55% for optional hedges (€300 million).
- For the period from December 31, 2013 through June 30, 2014: 2.48% for firm hedges (€850 m illion) and 3.5% for optional hedges (€300 million).
- For the period from June 30, 2014 through December 31, 2014: 2.48% for firm hedges (€850 million).
Áreas' USD-denominated debt has been hedged using interest rate swaps at a rate of 1.13% until July 2017 covering an amount of $25 million.
THS' dollar-denominated debt has also been hedged using caps based on the Libor + 2% until June 2016 covering an amount of $80 million.
These rates do not include lending margins, which are set out in Note 4 / 15 / 1. Taking into account these hedging transactions, a 1% increase in interest rates would have had an impact of approximately €8 million and €5 million on the Group’s finance costs for the years ended September 30, 2012 and 2011 respectively.
7 / 3 Exposure to Liquidity Risk
The Group manages liquidity risks by maintaining adequate reserves, banking facilities and reserve borrowing facilities, by continuously monitoring forecast and actual cash flows and by matching the maturity profiles of financial assets and liabilities.
The Group's debt can be analyzed as follows by maturity:
For the year ended September 30, 2013
(in € millions) Short-term Due in 1 to 5 years
Due beyond 5
years
Total long-term
Total short- and long-
term
Bank borrowings
Medium-term borrowings – HBI 405.1 405.1 405.1
Medium-term borrowings – Elior and THS 112.8 1,166.2 1,278.9 1,278.9
Other medium- and long-term bank borrowings 37.0 37.0 37.0
Sub-total – bank borrowings 0.0 149.7 1,571.3 1,721.0 1,721.0
Other debt
Loan from Elior Finance & Co SCA 350.0 350.0 350.0
Finance leases 4.6 11.6 11.6 16.2
Other (1) 51.5 180.4 0.9 181.3 232.8
Bank overdrafts (2) 30.6 30.6
Current accounts (2) 1.1 1.1
Accrued interest on borrowings (2) 48.3 48.3
Sub-total – other debt 136.1 192.0 350.9 542.9 679.0
Total debt 136.1 341.7 1,922.2 2,263.9 2,400.0
(1) Including liabilities under the receivables securitization program described in Note 4 / 12.
(2) See comments above
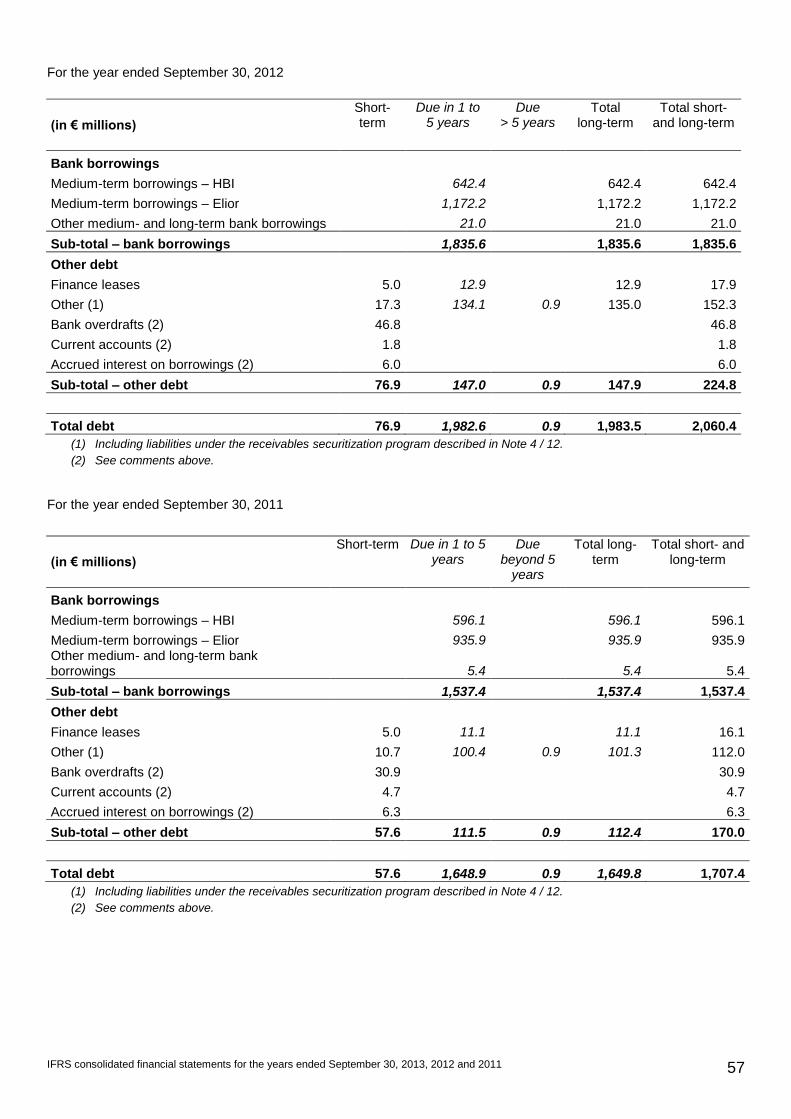
IFRS consolidated financial statements for the years ended September 30, 2013, 2012 and 2011 57
For the year ended September 30, 2012
(in € millions)
Short-term
Due in 1 to 5 years
Due > 5 years
Total long-term
Total short- and long-term
Bank borrowings
Medium-term borrowings – HBI 642.4 642.4 642.4
Medium-term borrowings – Elior 1,172.2 1,172.2 1,172.2
Other medium- and long-term bank borrowings 21.0 21.0 21.0
Sub-total – bank borrowings
1,835.6
1,835.6 1,835.6
Other debt
Finance leases 5.0 12.9
12.9 17.9
Other (1) 17.3 134.1 0.9 135.0 152.3
Bank overdrafts (2) 46.8 46.8
Current accounts (2) 1.8 1.8
Accrued interest on borrowings (2) 6.0 6.0
Sub-total – other debt 76.9 147.0 0.9 147.9 224.8
Total debt 76.9 1,982.6 0.9 1,983.5 2,060.4
(1) Including liabilities under the receivables securitization program described in Note 4 / 12.
(2) See comments above.
For the year ended September 30, 2011
(in € millions)
Short-term Due in 1 to 5 years
Due beyond 5
years
Total long-term
Total short- and long-term
Bank borrowings
Medium-term borrowings – HBI 596.1 596.1 596.1
Medium-term borrowings – Elior 935.9 935.9 935.9 Other medium- and long-term bank borrowings 5.4 5.4 5.4
Sub-total – bank borrowings
1,537.4
1,537.4 1,537.4
Other debt
Finance leases 5.0 11.1
11.1 16.1
Other (1) 10.7 100.4 0.9 101.3 112.0
Bank overdrafts (2) 30.9 30.9
Current accounts (2) 4.7 4.7
Accrued interest on borrowings (2) 6.3 6.3
Sub-total – other debt 57.6 111.5 0.9 112.4 170.0
Total debt 57.6 1,648.9 0.9 1,649.8 1,707.4
(1) Including liabilities under the receivables securitization program described in Note 4 / 12.
(2) See comments above.
IFRS consolidated financial statements for the years ended September 30, 2013, 2012 and 2011 58
7 / 4 Exposure to Credit and Counterparty Risk
Credit and/or counterparty risk is the potential that a party to a contract with the Group will fail to meet its obligations in accordance with agreed terms, leading to a financial loss for the Group.
The main financial instruments that could expose the Group to concentrations of counterparty risk are trade receivables, cash and cash equivalents, investments and derivatives. The Group's maximum exposure to credit risk corresponds to the carrying amount of all of the financial assets recognized in the consolidated financial statements, net of any accumulated impairment losses.
The Group considers that it has very low exposure to concentrations of credit risk in relation to trade receivables. The balance sheets of the Group’s companies operating in the Concession Catering & Travel Retail segment do not generally include significant amounts of trade receivables. In the Contract Catering & Support Services segment there is no material exposure to concentrations of customer credit risk at Group level as the relevant companies have a large number of customers and the geographic locations of these customers and the operating sites concerned are highly diverse.
The Group only enters into hedging agreements with leading financial institutions and it considers that the risk of any of these counterparties defaulting on their contractual obligations to be very low as the financial exposure of each of these financial institutions is limited.
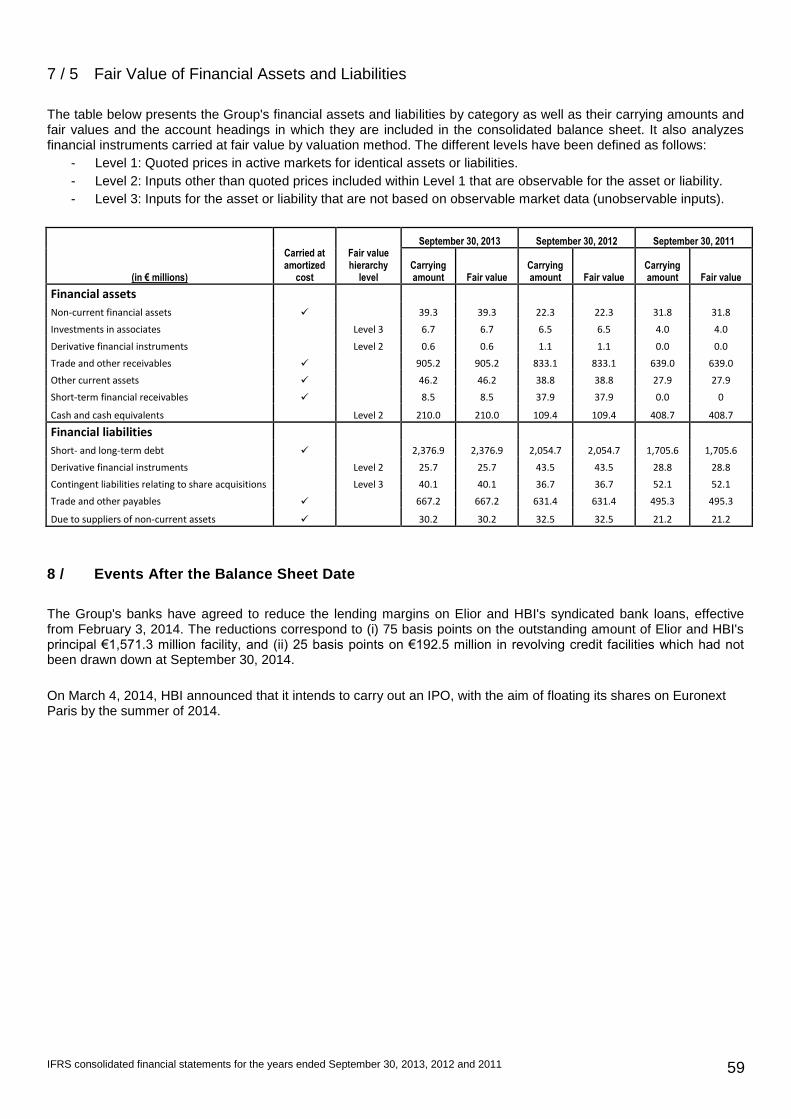
IFRS consolidated financial statements for the years ended September 30, 2013, 2012 and 2011 59
7 / 5 Fair Value of Financial Assets and Liabilities
The table below presents the Group's financial assets and liabilities by category as well as their carrying amounts and fair values and the account headings in which they are included in the consolidated balance sheet. It also analyzes financial instruments carried at fair value by valuation method. The different levels have been defined as follows:
- Level 1: Quoted prices in active markets for identical assets or liabilities.
- Level 2: Inputs other than quoted prices included within Level 1 that are observable for the asset or liability.
- Level 3: Inputs for the asset or liability that are not based on observable market data (unobservable inputs).
(in € millions)
Carried at amortized
cost
Fair value hierarchy
level
September 30, 2013 September 30, 2012 September 30, 2011
Carrying amount Fair value
Carrying amount Fair value
Carrying amount Fair value
Financial assets
Non-current financial assets 39.3 39.3 22.3 22.3 31.8 31.8
Investments in associates Level 3 6.7 6.7 6.5 6.5 4.0 4.0
Derivative financial instruments Level 2 0.6 0.6 1.1 1.1 0.0 0.0
Trade and other receivables 905.2 905.2 833.1 833.1 639.0 639.0
Other current assets 46.2 46.2 38.8 38.8 27.9 27.9
Short-term financial receivables 8.5 8.5 37.9 37.9 0.0 0
Cash and cash equivalents Level 2 210.0 210.0 109.4 109.4 408.7 408.7
Financial liabilities
Short- and long-term debt 2,376.9 2,376.9 2,054.7 2,054.7 1,705.6 1,705.6
Derivative financial instruments Level 2 25.7 25.7 43.5 43.5 28.8 28.8
Contingent liabilities relating to share acquisitions Level 3 40.1 40.1 36.7 36.7 52.1 52.1
Trade and other payables 667.2 667.2 631.4 631.4 495.3 495.3
Due to suppliers of non-current assets 30.2 30.2 32.5 32.5 21.2 21.2
8 / Events After the Balance Sheet Date
The Group's banks have agreed to reduce the lending margins on Elior and HBI's syndicated bank loans, effective from February 3, 2014. The reductions correspond to (i) 75 basis points on the outstanding amount of Elior and HBI's principal €1,571.3 million facility, and (ii) 25 basis points on €192.5 million in revolving credit facilities which had not been drawn down at September 30, 2014.
On March 4, 2014, HBI announced that it intends to carry out an IPO, with the aim of floating its shares on Euronext Paris by the summer of 2014.
IFRS consolidated financial statements for the years ended September 30, 2013, 2012 and 2011 60
9 / Additional Information
9 / 1 Statutory Auditors’ Fees paid by the Group's Companies
Statutory Auditors’ fees for the year ended September 30, 2013 recorded in the income statement and relating to fully consolidated companies amounted to €6.4 million. The total breaks down as €2.7 million for statutory audit work and €3.7 million for audit-related services provided in connection with due diligence procedures for acquisitions and financing operations.
Statutory Auditors’ fees for the years ended September 30, 2012 and 2011 recorded in the income statement and relating to fully consolidated companies amounted to €2.9 million and €2.2 million respectively and related solely to statutory audit work.
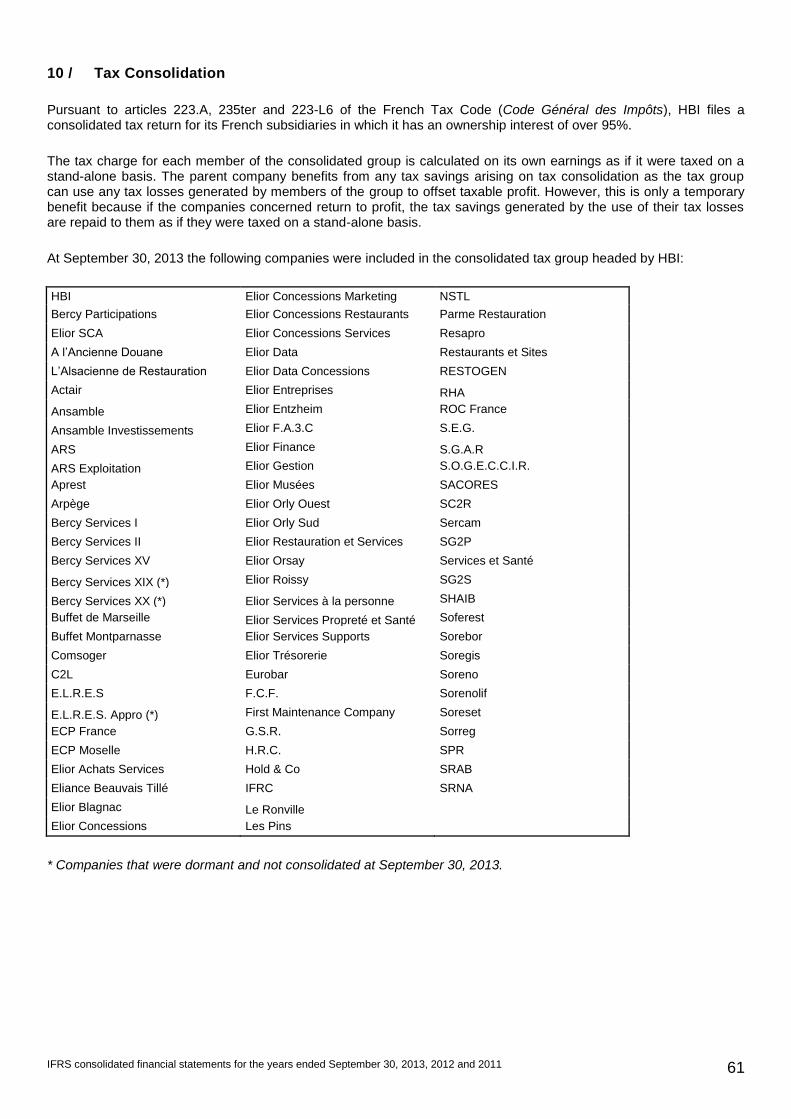
IFRS consolidated financial statements for the years ended September 30, 2013, 2012 and 2011 61
10 / Tax Consolidation
Pursuant to articles 223.A, 235ter and 223-L6 of the French Tax Code (Code Général des Impôts), HBI files a consolidated tax return for its French subsidiaries in which it has an ownership interest of over 95%.
The tax charge for each member of the consolidated group is calculated on its own earnings as if it were taxed on a stand-alone basis. The parent company benefits from any tax savings arising on tax consolidation as the tax group can use any tax losses generated by members of the group to offset taxable profit. However, this is only a temporary benefit because if the companies concerned return to profit, the tax savings generated by the use of their tax losses are repaid to them as if they were taxed on a stand-alone basis.
At September 30, 2013 the following companies were included in the consolidated tax group headed by HBI:
HBI Elior Concessions Marketing NSTL
Bercy Participations Elior Concessions Restaurants Parme Restauration
Elior SCA Elior Concessions Services Resapro
A l’Ancienne Douane Elior Data Restaurants et Sites
L’Alsacienne de Restauration Elior Data Concessions RESTOGEN
Actair Elior Entreprises RHA
Ansamble Elior Entzheim ROC France
Ansamble Investissements Elior F.A.3.C S.E.G.
ARS Elior Finance S.G.A.R
ARS Exploitation Elior Gestion S.O.G.E.C.C.I.R.
Aprest Elior Musées SACORES
Arpège Elior Orly Ouest SC2R
Bercy Services I Elior Orly Sud Sercam
Bercy Services II Elior Restauration et Services SG2P
Bercy Services XV Elior Orsay Services et Santé
Bercy Services XIX (*) Elior Roissy SG2S
Bercy Services XX (*) Elior Services à la personne SHAIB
Buffet de Marseille Elior Services Propreté et Santé Soferest
Buffet Montparnasse Elior Services Supports Sorebor
Comsoger Elior Trésorerie Soregis
C2L Eurobar Soreno
E.L.R.E.S F.C.F. Sorenolif
E.L.R.E.S. Appro (*) First Maintenance Company Soreset
ECP France G.S.R. Sorreg
ECP Moselle H.R.C. SPR
Elior Achats Services Hold & Co SRAB
Eliance Beauvais Tillé IFRC SRNA
Elior Blagnac Le Ronville
Elior Concessions Les Pins
* Companies that were dormant and not consolidated at September 30, 2013.
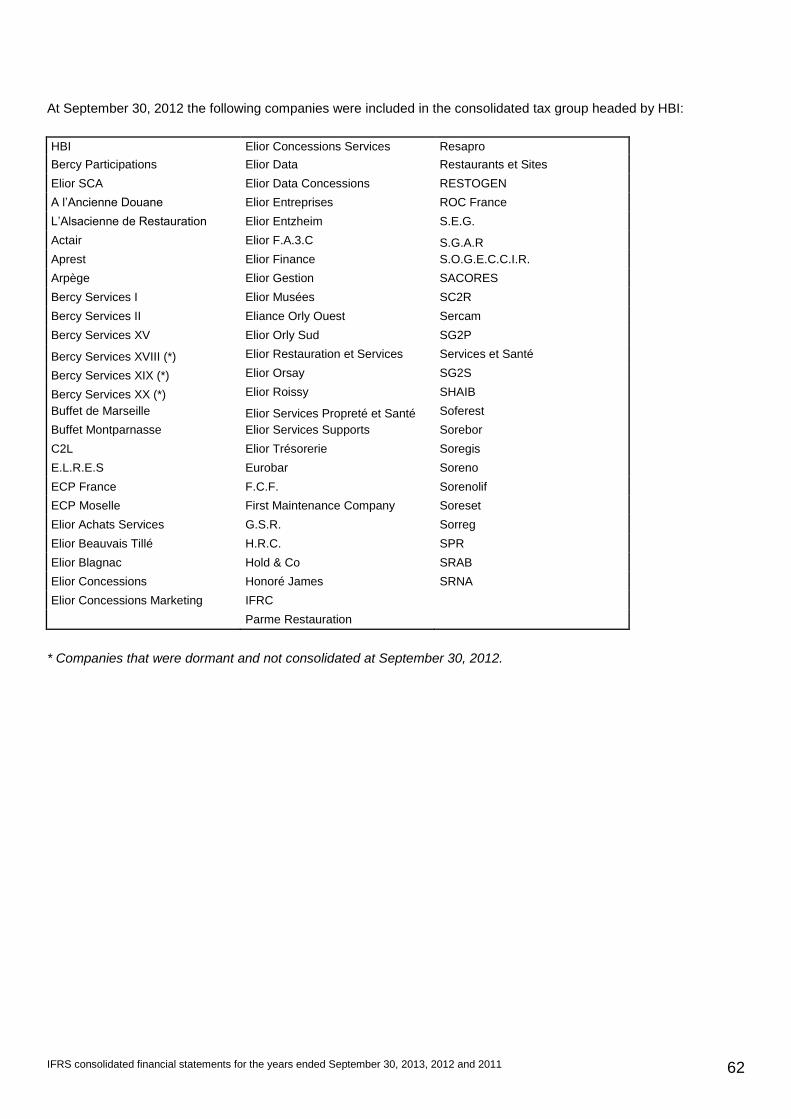
IFRS consolidated financial statements for the years ended September 30, 2013, 2012 and 2011 62
At September 30, 2012 the following companies were included in the consolidated tax group headed by HBI:
HBI Elior Concessions Services Resapro
Bercy Participations Elior Data Restaurants et Sites
Elior SCA Elior Data Concessions RESTOGEN
A l’Ancienne Douane Elior Entreprises ROC France
L’Alsacienne de Restauration Elior Entzheim S.E.G.
Actair Elior F.A.3.C S.G.A.R
Aprest Elior Finance S.O.G.E.C.C.I.R.
Arpège Elior Gestion SACORES
Bercy Services I Elior Musées SC2R
Bercy Services II Eliance Orly Ouest Sercam
Bercy Services XV Elior Orly Sud SG2P
Bercy Services XVIII (*) Elior Restauration et Services Services et Santé
Bercy Services XIX (*) Elior Orsay SG2S
Bercy Services XX (*) Elior Roissy SHAIB
Buffet de Marseille Elior Services Propreté et Santé Soferest
Buffet Montparnasse Elior Services Supports Sorebor
C2L Elior Trésorerie Soregis
E.L.R.E.S Eurobar Soreno
ECP France F.C.F. Sorenolif
ECP Moselle First Maintenance Company Soreset
Elior Achats Services G.S.R. Sorreg
Elior Beauvais Tillé H.R.C. SPR
Elior Blagnac Hold & Co SRAB
Elior Concessions Honoré James SRNA
Elior Concessions Marketing IFRC
Parme Restauration
* Companies that were dormant and not consolidated at September 30, 2012.
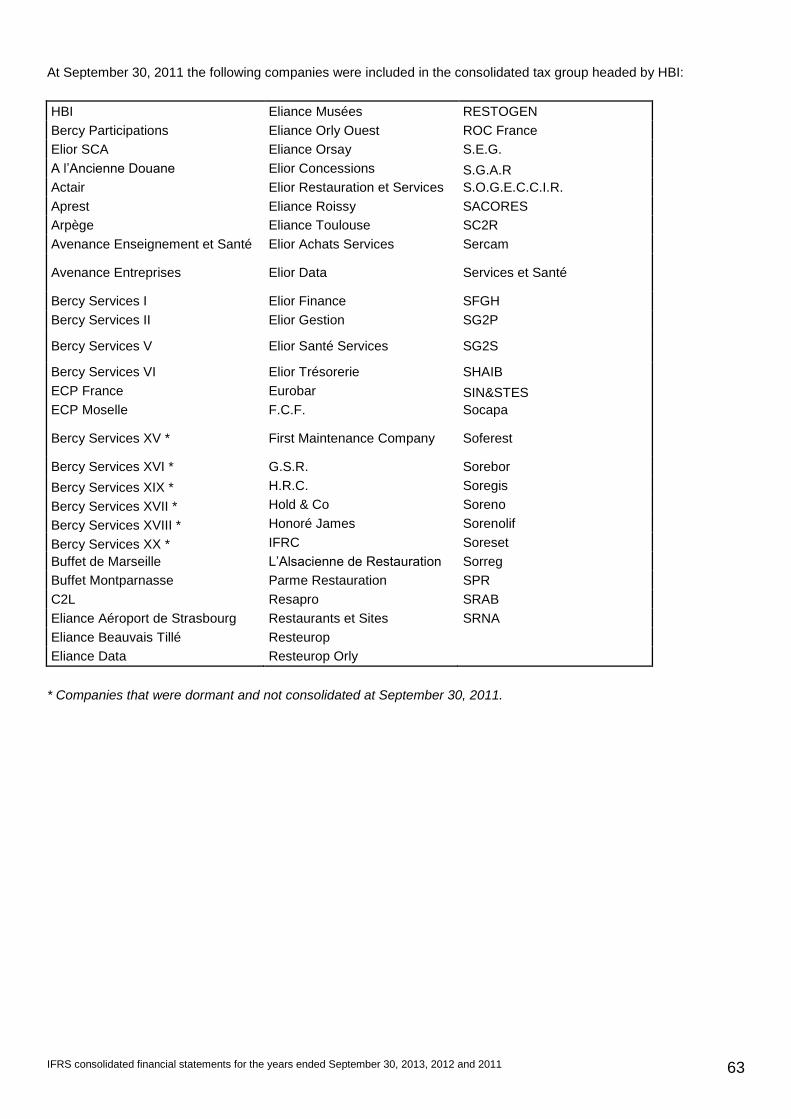
IFRS consolidated financial statements for the years ended September 30, 2013, 2012 and 2011 63
At September 30, 2011 the following companies were included in the consolidated tax group headed by HBI:
HBI Eliance Musées RESTOGEN
Bercy Participations Eliance Orly Ouest ROC France
Elior SCA Eliance Orsay S.E.G.
A l’Ancienne Douane Elior Concessions S.G.A.R
Actair Elior Restauration et Services S.O.G.E.C.C.I.R.
Aprest Eliance Roissy SACORES
Arpège Eliance Toulouse SC2R
Avenance Enseignement et Santé Elior Achats Services Sercam
Avenance Entreprises Elior Data Services et Santé
Bercy Services I Elior Finance SFGH
Bercy Services II Elior Gestion SG2P
Bercy Services V Elior Santé Services SG2S
Bercy Services VI Elior Trésorerie SHAIB
ECP France Eurobar SIN&STES
ECP Moselle F.C.F. Socapa
Bercy Services XV * First Maintenance Company Soferest
Bercy Services XVI * G.S.R. Sorebor
Bercy Services XIX * H.R.C. Soregis
Bercy Services XVII * Hold & Co Soreno
Bercy Services XVIII * Honoré James Sorenolif
Bercy Services XX * IFRC Soreset
Buffet de Marseille L’Alsacienne de Restauration Sorreg
Buffet Montparnasse Parme Restauration SPR
C2L Resapro SRAB
Eliance Aéroport de Strasbourg Restaurants et Sites SRNA
Eliance Beauvais Tillé Resteurop
Eliance Data Resteurop Orly
* Companies that were dormant and not consolidated at September 30, 2011.
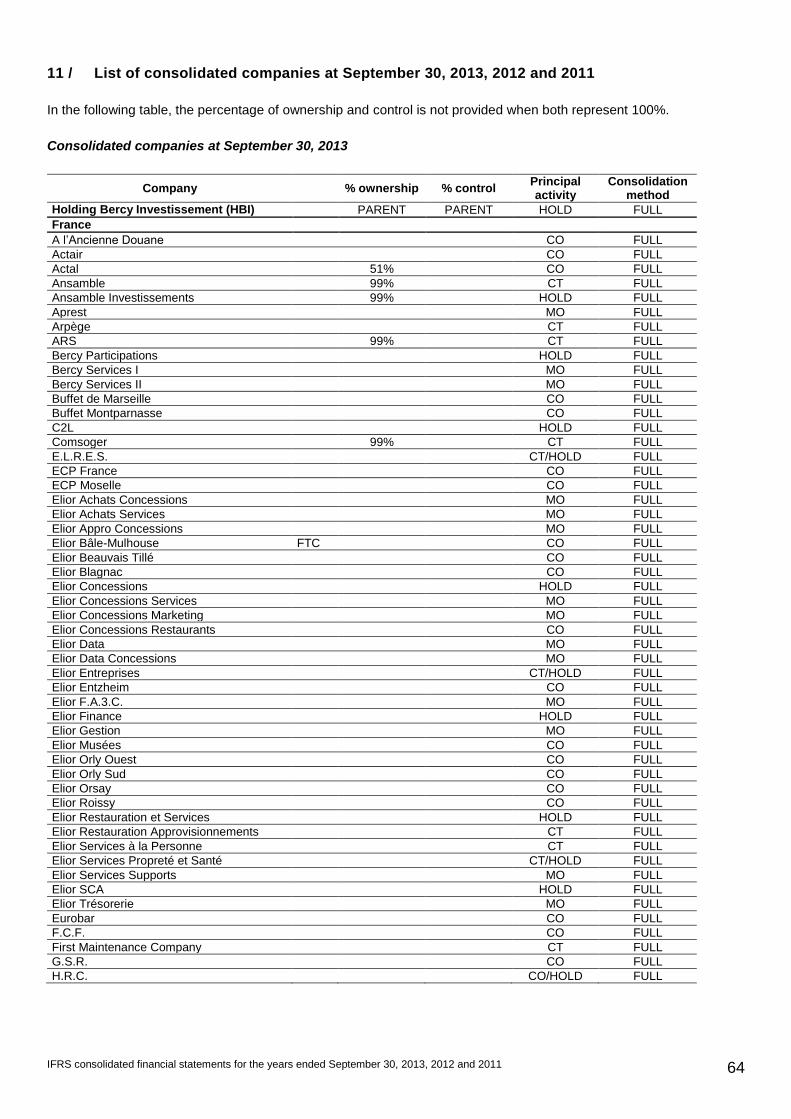
IFRS consolidated financial statements for the years ended September 30, 2013, 2012 and 2011 64
11 / List of consolidated companies at September 30, 2013, 2012 and 2011
In the following table, the percentage of ownership and control is not provided when both represent 100%.
Consolidated companies at September 30, 2013
Company % ownership % control Principal activity
Consolidation method
Holding Bercy Investissement (HBI) PARENT PARENT HOLD FULL
France
A l’Ancienne Douane CO FULL
Actair CO FULL
Actal 51% CO FULL
Ansamble 99% CT FULL
Ansamble Investissements 99% HOLD FULL
Aprest MO FULL
Arpège CT FULL
ARS 99% CT FULL
Bercy Participations HOLD FULL
Bercy Services I MO FULL
Bercy Services II MO FULL
Buffet de Marseille CO FULL
Buffet Montparnasse CO FULL
C2L HOLD FULL
Comsoger 99% CT FULL
E.L.R.E.S. CT/HOLD FULL
ECP France CO FULL
ECP Moselle CO FULL
Elior Achats Concessions MO FULL
Elior Achats Services MO FULL
Elior Appro Concessions MO FULL
Elior Bâle-Mulhouse FTC CO FULL
Elior Beauvais Tillé CO FULL
Elior Blagnac CO FULL
Elior Concessions HOLD FULL
Elior Concessions Services MO FULL
Elior Concessions Marketing MO FULL
Elior Concessions Restaurants CO FULL
Elior Data MO FULL
Elior Data Concessions MO FULL
Elior Entreprises CT/HOLD FULL
Elior Entzheim CO FULL
Elior F.A.3.C. MO FULL
Elior Finance HOLD FULL
Elior Gestion MO FULL
Elior Musées CO FULL
Elior Orly Ouest CO FULL
Elior Orly Sud CO FULL
Elior Orsay CO FULL
Elior Roissy CO FULL
Elior Restauration et Services HOLD FULL
Elior Restauration Approvisionnements CT FULL
Elior Services à la Personne CT FULL
Elior Services Propreté et Santé CT/HOLD FULL
Elior Services Supports MO FULL
Elior SCA HOLD FULL
Elior Trésorerie MO FULL
Eurobar CO FULL
F.C.F. CO FULL
First Maintenance Company CT FULL
G.S.R. CO FULL
H.R.C. CO/HOLD FULL
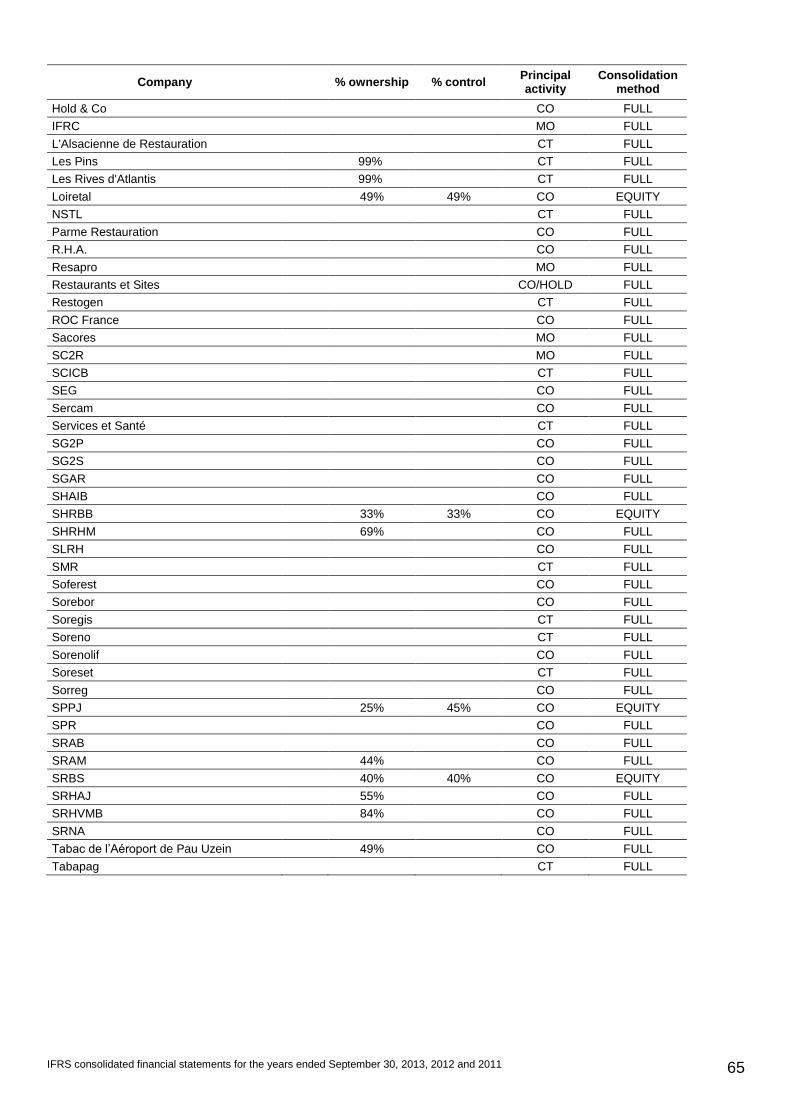
IFRS consolidated financial statements for the years ended September 30, 2013, 2012 and 2011 65
Company % ownership % control Principal activity
Consolidation method
Hold & Co CO FULL
IFRC MO FULL
L'Alsacienne de Restauration CT FULL
Les Pins 99% CT FULL
Les Rives d'Atlantis 99% CT FULL
Loiretal 49% 49% CO EQUITY
NSTL CT FULL
Parme Restauration CO FULL
R.H.A. CO FULL
Resapro MO FULL
Restaurants et Sites CO/HOLD FULL
Restogen CT FULL
ROC France CO FULL
Sacores MO FULL
SC2R MO FULL
SCICB CT FULL
SEG CO FULL
Sercam CO FULL
Services et Santé CT FULL
SG2P CO FULL
SG2S CO FULL
SGAR CO FULL
SHAIB CO FULL
SHRBB 33% 33% CO EQUITY
SHRHM 69% CO FULL
SLRH CO FULL
SMR CT FULL
Soferest CO FULL
Sorebor CO FULL
Soregis CT FULL
Soreno CT FULL
Sorenolif CO FULL
Soreset CT FULL
Sorreg CO FULL
SPPJ 25% 45% CO EQUITY
SPR CO FULL
SRAB CO FULL
SRAM 44% CO FULL
SRBS 40% 40% CO EQUITY
SRHAJ 55% CO FULL
SRHVMB 84% CO FULL
SRNA CO FULL
Tabac de l’Aéroport de Pau Uzein 49% CO FULL
Tabapag CT FULL
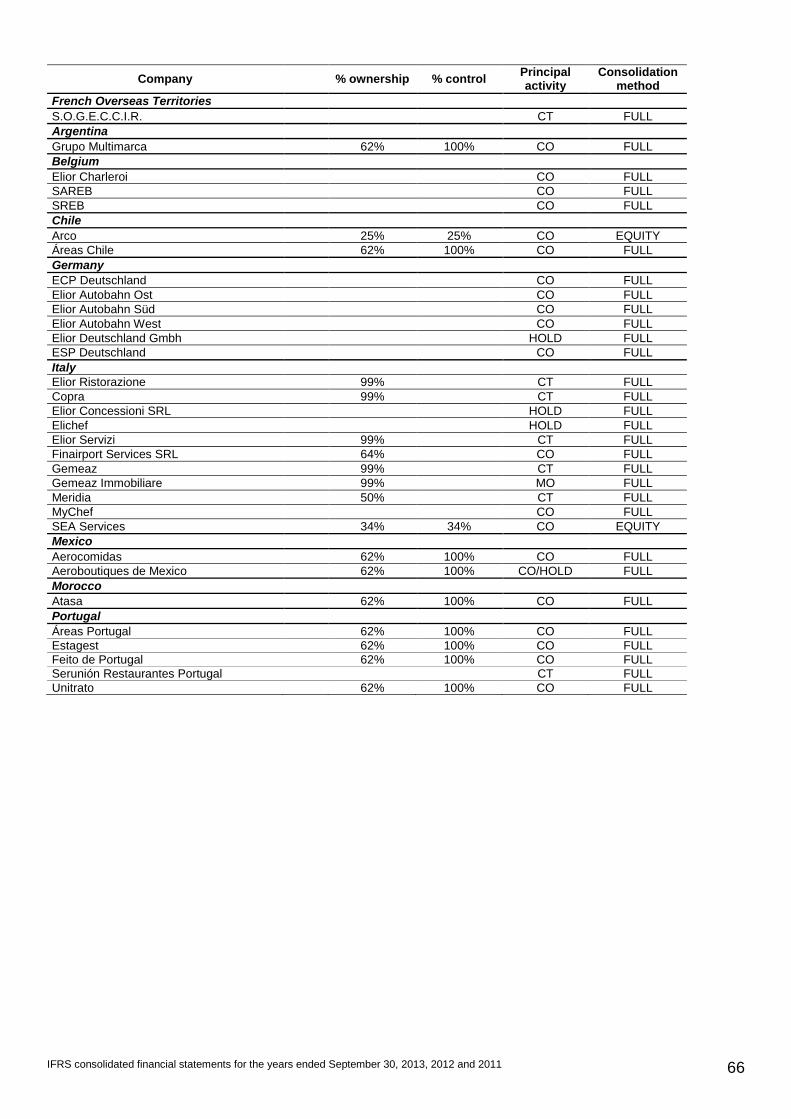
IFRS consolidated financial statements for the years ended September 30, 2013, 2012 and 2011 66
Company % ownership % control Principal activity
Consolidation method
French Overseas Territories
S.O.G.E.C.C.I.R. CT FULL
Argentina
Grupo Multimarca 62% 100% CO FULL
Belgium
Elior Charleroi CO FULL
SAREB CO FULL
SREB CO FULL
Chile
Arco 25% 25% CO EQUITY
Áreas Chile 62% 100% CO FULL
Germany
ECP Deutschland CO FULL
Elior Autobahn Ost CO FULL
Elior Autobahn Süd CO FULL
Elior Autobahn West CO FULL
Elior Deutschland Gmbh HOLD FULL
ESP Deutschland CO FULL
Italy
Elior Ristorazione 99% CT FULL
Copra 99% CT FULL
Elior Concessioni SRL HOLD FULL
Elichef HOLD FULL
Elior Servizi 99% CT FULL
Finairport Services SRL 64% CO FULL
Gemeaz 99% CT FULL
Gemeaz Immobiliare 99% MO FULL
Meridia 50% CT FULL
MyChef CO FULL
SEA Services 34% 34% CO EQUITY
Mexico
Aerocomidas 62% 100% CO FULL
Aeroboutiques de Mexico 62% 100% CO/HOLD FULL
Morocco
Atasa 62% 100% CO FULL
Portugal
Áreas Portugal 62% 100% CO FULL
Estagest 62% 100% CO FULL
Feito de Portugal 62% 100% CO FULL
Serunión Restaurantes Portugal CT FULL
Unitrato 62% 100% CO FULL
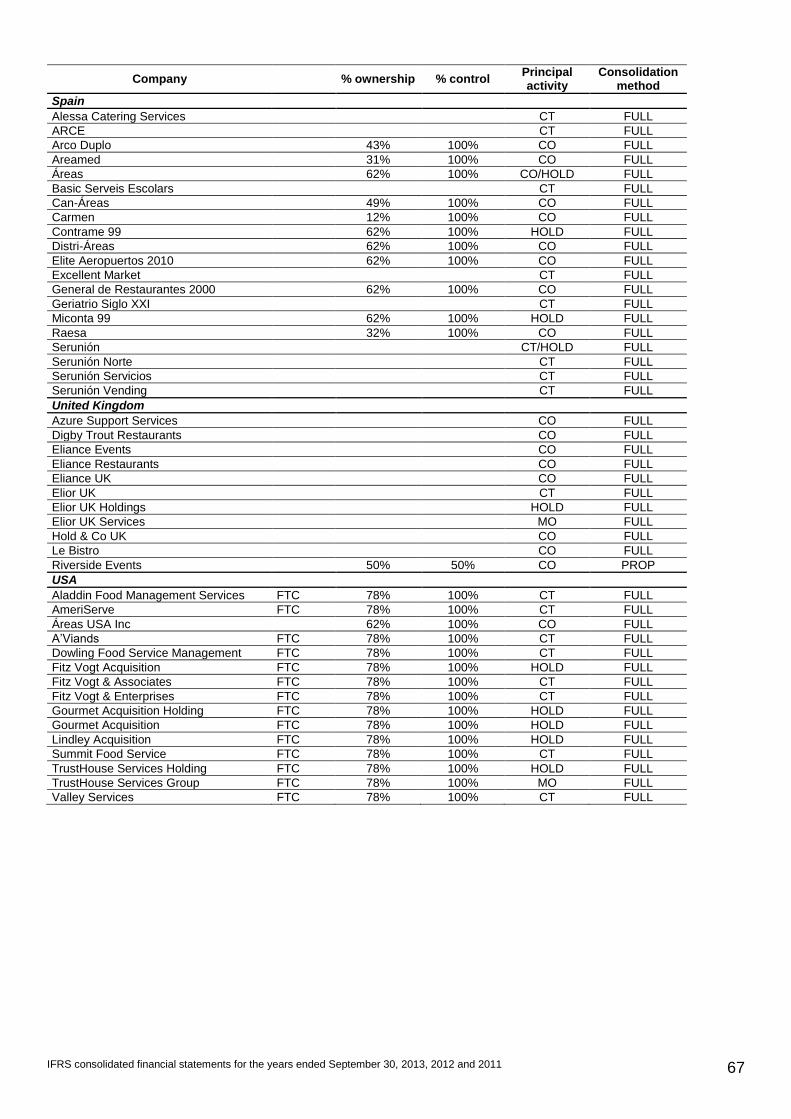
IFRS consolidated financial statements for the years ended September 30, 2013, 2012 and 2011 67
Company % ownership % control Principal activity
Consolidation method
Spain
Alessa Catering Services CT FULL
ARCE CT FULL
Arco Duplo 43% 100% CO FULL
Areamed 31% 100% CO FULL
Áreas 62% 100% CO/HOLD FULL
Basic Serveis Escolars CT FULL
Can-Áreas 49% 100% CO FULL
Carmen 12% 100% CO FULL
Contrame 99 62% 100% HOLD FULL
Distri-Áreas 62% 100% CO FULL
Elite Aeropuertos 2010 62% 100% CO FULL
Excellent Market CT FULL
General de Restaurantes 2000 62% 100% CO FULL
Geriatrio Siglo XXI CT FULL
Miconta 99 62% 100% HOLD FULL
Raesa 32% 100% CO FULL
Serunión CT/HOLD FULL
Serunión Norte CT FULL
Serunión Servicios CT FULL
Serunión Vending CT FULL
United Kingdom
Azure Support Services CO FULL
Digby Trout Restaurants CO FULL
Eliance Events CO FULL
Eliance Restaurants CO FULL
Eliance UK CO FULL
Elior UK CT FULL
Elior UK Holdings HOLD FULL
Elior UK Services MO FULL
Hold & Co UK CO FULL
Le Bistro CO FULL
Riverside Events 50% 50% CO PROP
USA
Aladdin Food Management Services FTC 78% 100% CT FULL
AmeriServe FTC 78% 100% CT FULL
Áreas USA Inc 62% 100% CO FULL
A’Viands FTC 78% 100% CT FULL
Dowling Food Service Management FTC 78% 100% CT FULL
Fitz Vogt Acquisition FTC 78% 100% HOLD FULL
Fitz Vogt & Associates FTC 78% 100% CT FULL
Fitz Vogt & Enterprises FTC 78% 100% CT FULL
Gourmet Acquisition Holding FTC 78% 100% HOLD FULL
Gourmet Acquisition FTC 78% 100% HOLD FULL
Lindley Acquisition FTC 78% 100% HOLD FULL
Summit Food Service FTC 78% 100% CT FULL
TrustHouse Services Holding FTC 78% 100% HOLD FULL
TrustHouse Services Group FTC 78% 100% MO FULL
Valley Services FTC 78% 100% CT FULL
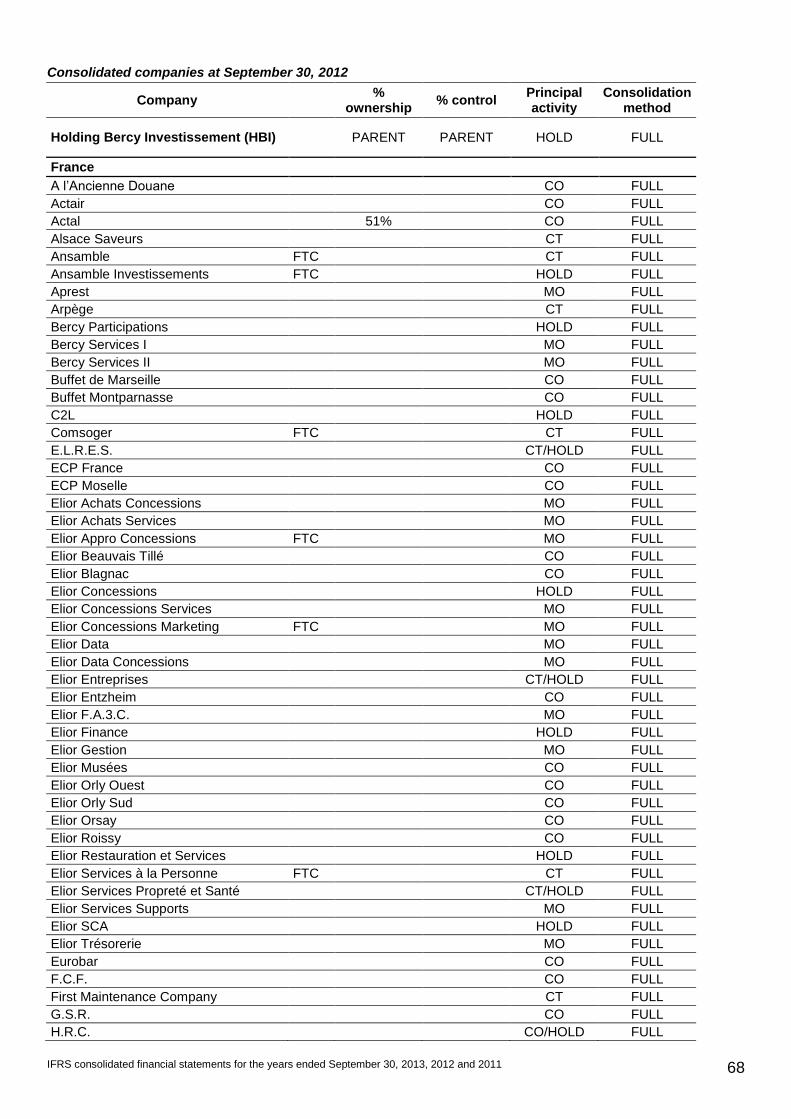
IFRS consolidated financial statements for the years ended September 30, 2013, 2012 and 2011 68
Consolidated companies at September 30, 2012
Company %
ownership % control
Principal activity
Consolidation method
Holding Bercy Investissement (HBI) PARENT PARENT HOLD FULL
France
A l’Ancienne Douane CO FULL
Actair CO FULL
Actal 51% CO FULL
Alsace Saveurs CT FULL
Ansamble FTC CT FULL
Ansamble Investissements FTC HOLD FULL
Aprest MO FULL
Arpège CT FULL
Bercy Participations HOLD FULL
Bercy Services I MO FULL
Bercy Services II MO FULL
Buffet de Marseille CO FULL
Buffet Montparnasse CO FULL
C2L HOLD FULL
Comsoger FTC CT FULL
E.L.R.E.S. CT/HOLD FULL
ECP France CO FULL
ECP Moselle CO FULL
Elior Achats Concessions MO FULL
Elior Achats Services MO FULL
Elior Appro Concessions FTC MO FULL
Elior Beauvais Tillé CO FULL
Elior Blagnac CO FULL
Elior Concessions HOLD FULL
Elior Concessions Services MO FULL
Elior Concessions Marketing FTC MO FULL
Elior Data MO FULL
Elior Data Concessions MO FULL
Elior Entreprises CT/HOLD FULL
Elior Entzheim CO FULL
Elior F.A.3.C. MO FULL
Elior Finance HOLD FULL
Elior Gestion MO FULL
Elior Musées CO FULL
Elior Orly Ouest CO FULL
Elior Orly Sud CO FULL
Elior Orsay CO FULL
Elior Roissy CO FULL
Elior Restauration et Services HOLD FULL
Elior Services à la Personne FTC CT FULL
Elior Services Propreté et Santé CT/HOLD FULL
Elior Services Supports MO FULL
Elior SCA HOLD FULL
Elior Trésorerie MO FULL
Eurobar CO FULL
F.C.F. CO FULL
First Maintenance Company CT FULL
G.S.R. CO FULL
H.R.C. CO/HOLD FULL
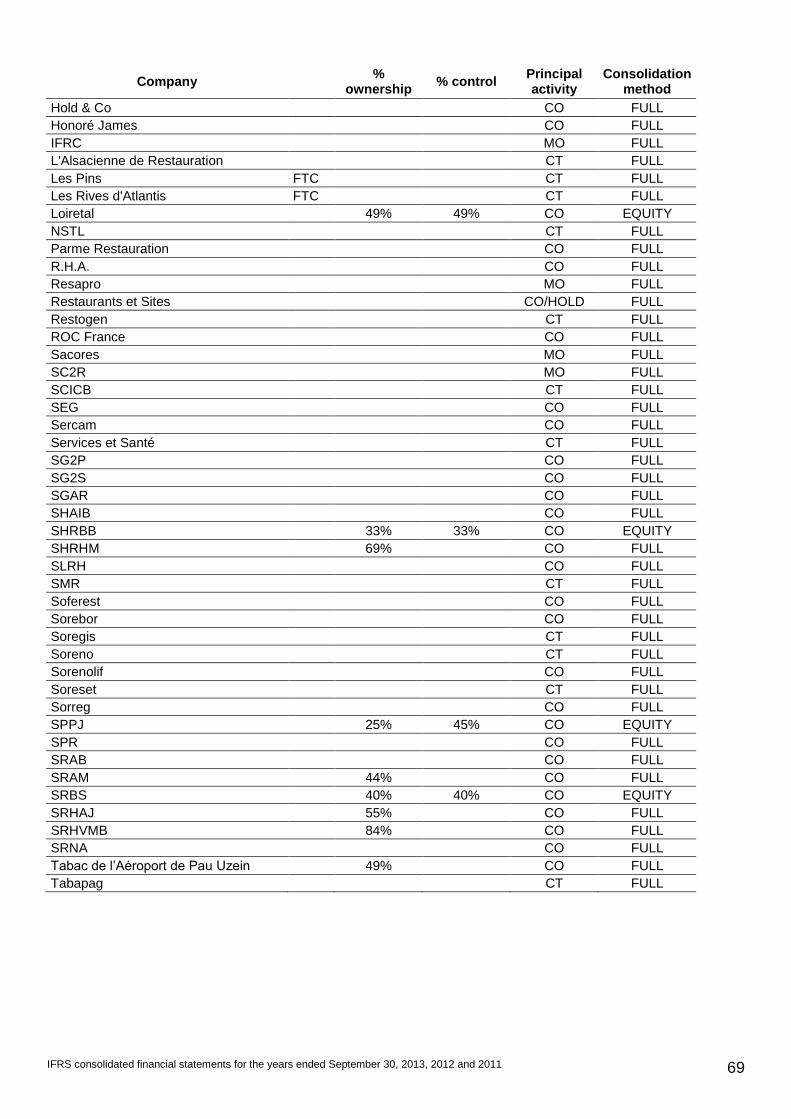
IFRS consolidated financial statements for the years ended September 30, 2013, 2012 and 2011 69
Company %
ownership % control
Principal activity
Consolidation method
Hold & Co CO FULL
Honoré James CO FULL
IFRC MO FULL
L'Alsacienne de Restauration CT FULL
Les Pins FTC CT FULL
Les Rives d'Atlantis FTC CT FULL
Loiretal 49% 49% CO EQUITY
NSTL CT FULL
Parme Restauration CO FULL
R.H.A. CO FULL
Resapro MO FULL
Restaurants et Sites CO/HOLD FULL
Restogen CT FULL
ROC France CO FULL
Sacores MO FULL
SC2R MO FULL
SCICB CT FULL
SEG CO FULL
Sercam CO FULL
Services et Santé CT FULL
SG2P CO FULL
SG2S CO FULL
SGAR CO FULL
SHAIB CO FULL
SHRBB 33% 33% CO EQUITY
SHRHM 69% CO FULL
SLRH CO FULL
SMR CT FULL
Soferest CO FULL
Sorebor CO FULL
Soregis CT FULL
Soreno CT FULL
Sorenolif CO FULL
Soreset CT FULL
Sorreg CO FULL
SPPJ 25% 45% CO EQUITY
SPR CO FULL
SRAB CO FULL
SRAM 44% CO FULL
SRBS 40% 40% CO EQUITY
SRHAJ 55% CO FULL
SRHVMB 84% CO FULL
SRNA CO FULL
Tabac de l’Aéroport de Pau Uzein 49% CO FULL
Tabapag CT FULL
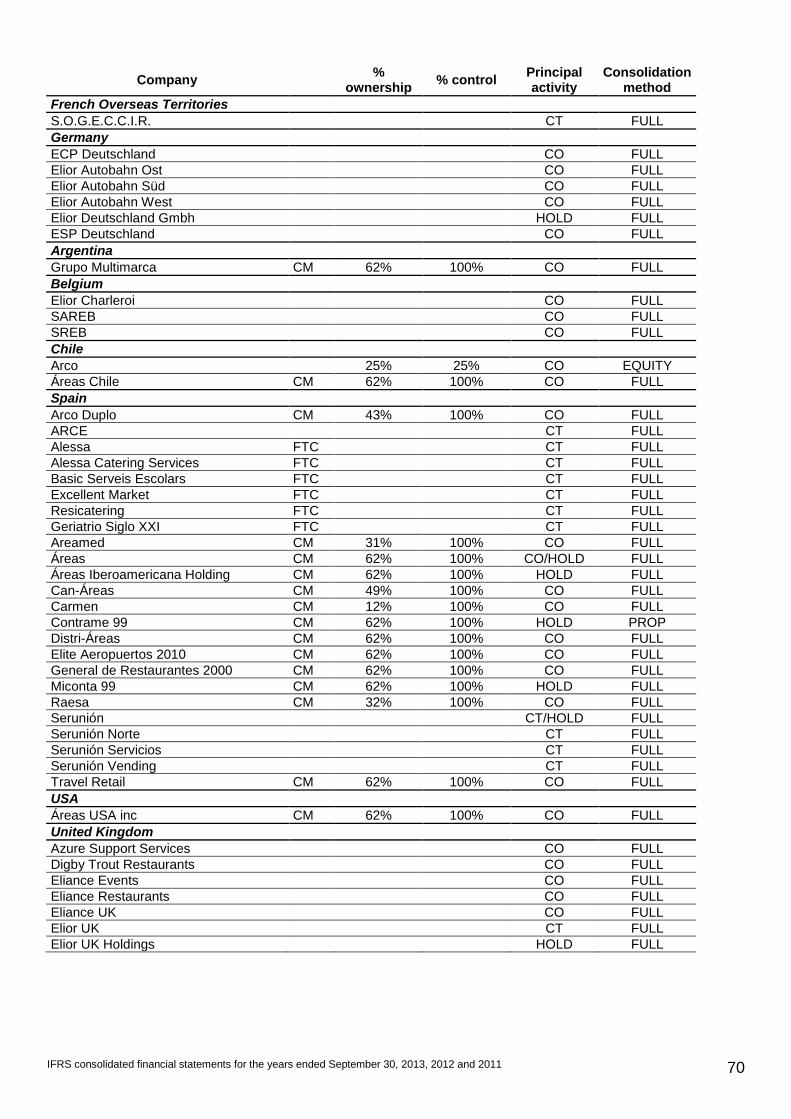
IFRS consolidated financial statements for the years ended September 30, 2013, 2012 and 2011 70
Company %
ownership % control
Principal activity
Consolidation method
French Overseas Territories
S.O.G.E.C.C.I.R. CT FULL
Germany
ECP Deutschland CO FULL
Elior Autobahn Ost CO FULL
Elior Autobahn Süd CO FULL
Elior Autobahn West CO FULL
Elior Deutschland Gmbh HOLD FULL
ESP Deutschland
CO FULL
Argentina
Grupo Multimarca CM 62% 100% CO FULL
Belgium
Elior Charleroi CO FULL
SAREB CO FULL
SREB
CO FULL
Chile
Arco 25% 25% CO EQUITY
Áreas Chile CM 62% 100% CO FULL
Spain
Arco Duplo CM 43% 100% CO FULL
ARCE CT FULL
Alessa FTC CT FULL
Alessa Catering Services FTC CT FULL
Basic Serveis Escolars FTC CT FULL
Excellent Market FTC CT FULL
Resicatering FTC CT FULL
Geriatrio Siglo XXI FTC CT FULL
Areamed CM 31% 100% CO FULL
Áreas CM 62% 100% CO/HOLD FULL
Áreas Iberoamericana Holding CM 62% 100% HOLD FULL
Can-Áreas CM 49% 100% CO FULL
Carmen CM 12% 100% CO FULL
Contrame 99 CM 62% 100% HOLD PROP
Distri-Áreas CM 62% 100% CO FULL
Elite Aeropuertos 2010 CM 62% 100% CO FULL
General de Restaurantes 2000 CM 62% 100% CO FULL
Miconta 99 CM 62% 100% HOLD FULL
Raesa CM 32% 100% CO FULL
Serunión CT/HOLD FULL
Serunión Norte CT FULL
Serunión Servicios CT FULL
Serunión Vending CT FULL
Travel Retail CM 62% 100% CO FULL
USA
Áreas USA inc CM 62% 100% CO FULL
United Kingdom
Azure Support Services CO FULL
Digby Trout Restaurants CO FULL
Eliance Events CO FULL
Eliance Restaurants CO FULL
Eliance UK CO FULL
Elior UK CT FULL
Elior UK Holdings HOLD FULL
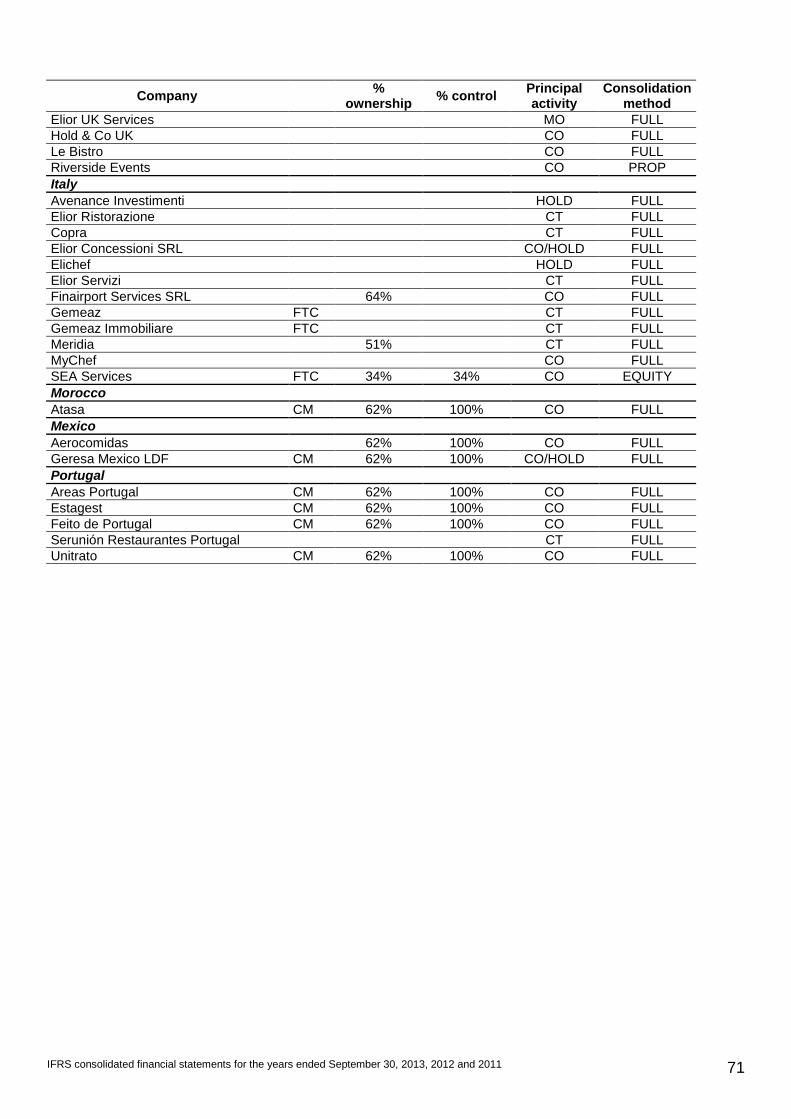
IFRS consolidated financial statements for the years ended September 30, 2013, 2012 and 2011 71
Company %
ownership % control
Principal activity
Consolidation method
Elior UK Services MO FULL
Hold & Co UK CO FULL
Le Bistro CO FULL
Riverside Events
CO PROP
Italy
Avenance Investimenti
HOLD FULL
Elior Ristorazione CT FULL
Copra CT FULL
Elior Concessioni SRL CO/HOLD FULL
Elichef HOLD FULL
Elior Servizi CT FULL
Finairport Services SRL 64% CO FULL
Gemeaz FTC CT FULL
Gemeaz Immobiliare FTC CT FULL
Meridia 51% CT FULL
MyChef CO FULL
SEA Services FTC 34% 34% CO EQUITY
Morocco
Atasa CM 62% 100% CO FULL
Mexico
Aerocomidas 62% 100% CO FULL
Geresa Mexico LDF CM 62% 100% CO/HOLD FULL
Portugal
Areas Portugal CM 62% 100% CO FULL
Estagest CM 62% 100% CO FULL
Feito de Portugal CM 62% 100% CO FULL
Serunión Restaurantes Portugal CT FULL
Unitrato CM 62% 100% CO FULL
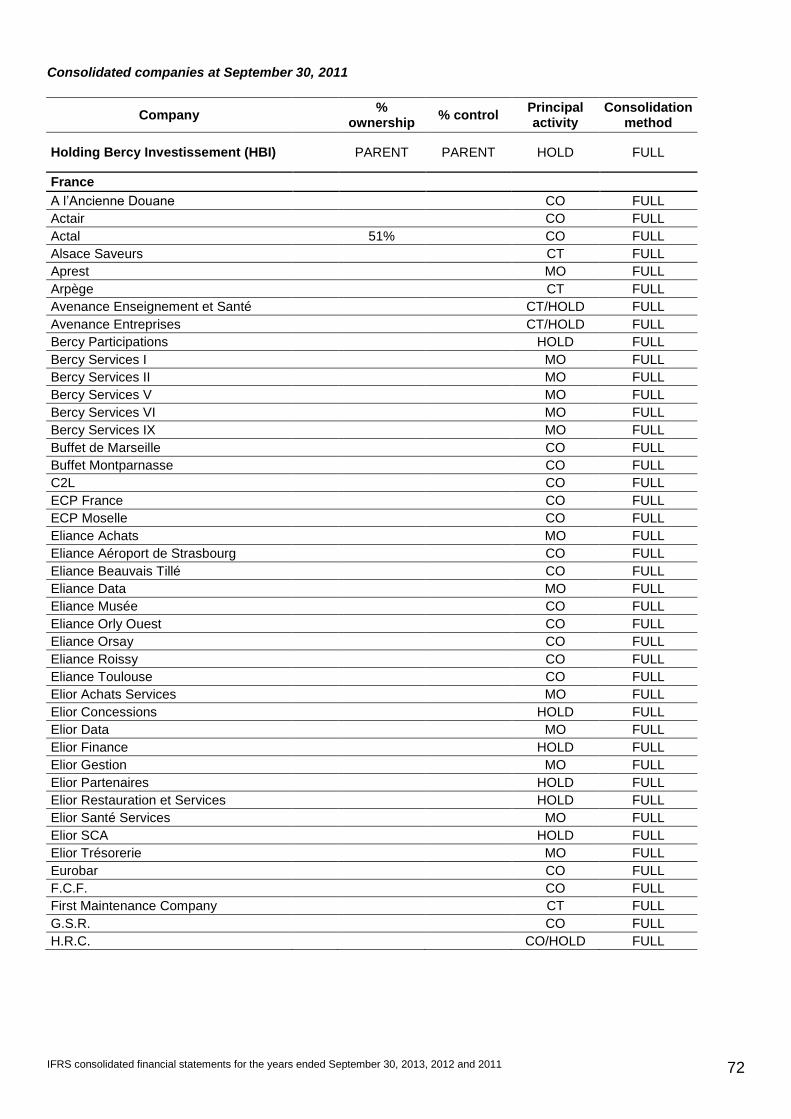
IFRS consolidated financial statements for the years ended September 30, 2013, 2012 and 2011 72
Consolidated companies at September 30, 2011
Company %
ownership % control
Principal activity
Consolidation method
Holding Bercy Investissement (HBI) PARENT PARENT HOLD FULL
France
A l’Ancienne Douane CO FULL
Actair CO FULL
Actal 51% CO FULL
Alsace Saveurs CT FULL
Aprest MO FULL
Arpège CT FULL
Avenance Enseignement et Santé CT/HOLD FULL
Avenance Entreprises CT/HOLD FULL
Bercy Participations HOLD FULL
Bercy Services I MO FULL
Bercy Services II MO FULL
Bercy Services V MO FULL
Bercy Services VI MO FULL
Bercy Services IX MO FULL
Buffet de Marseille CO FULL
Buffet Montparnasse CO FULL
C2L CO FULL
ECP France CO FULL
ECP Moselle CO FULL
Eliance Achats MO FULL
Eliance Aéroport de Strasbourg CO FULL
Eliance Beauvais Tillé CO FULL
Eliance Data MO FULL
Eliance Musée CO FULL
Eliance Orly Ouest CO FULL
Eliance Orsay CO FULL
Eliance Roissy CO FULL
Eliance Toulouse CO FULL
Elior Achats Services MO FULL
Elior Concessions HOLD FULL
Elior Data MO FULL
Elior Finance HOLD FULL
Elior Gestion MO FULL
Elior Partenaires HOLD FULL
Elior Restauration et Services HOLD FULL
Elior Santé Services MO FULL
Elior SCA HOLD FULL
Elior Trésorerie MO FULL
Eurobar CO FULL
F.C.F. CO FULL
First Maintenance Company CT FULL
G.S.R. CO FULL
H.R.C. CO/HOLD FULL
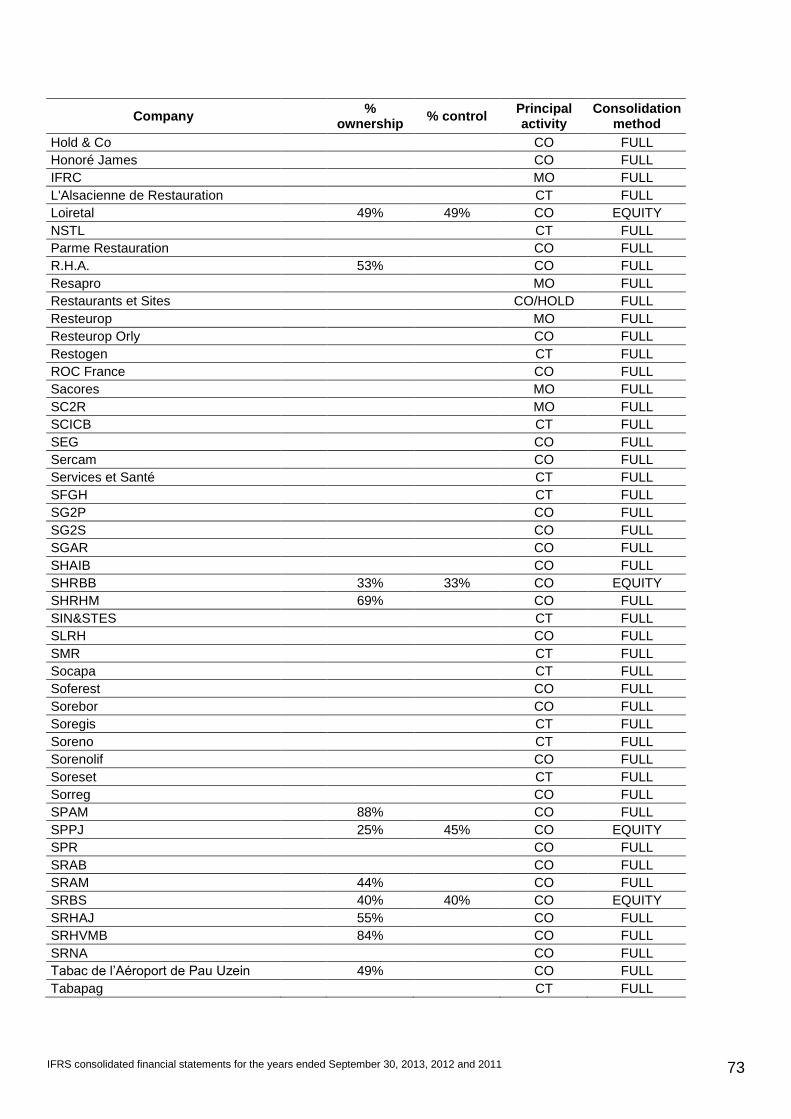
IFRS consolidated financial statements for the years ended September 30, 2013, 2012 and 2011 73
Company %
ownership % control
Principal activity
Consolidation method
Hold & Co CO FULL
Honoré James CO FULL
IFRC MO FULL
L'Alsacienne de Restauration CT FULL
Loiretal 49% 49% CO EQUITY
NSTL CT FULL
Parme Restauration CO FULL
R.H.A. 53% CO FULL
Resapro MO FULL
Restaurants et Sites CO/HOLD FULL
Resteurop MO FULL
Resteurop Orly CO FULL
Restogen CT FULL
ROC France CO FULL
Sacores MO FULL
SC2R MO FULL
SCICB CT FULL
SEG CO FULL
Sercam CO FULL
Services et Santé CT FULL
SFGH CT FULL
SG2P CO FULL
SG2S CO FULL
SGAR CO FULL
SHAIB CO FULL
SHRBB 33% 33% CO EQUITY
SHRHM 69% CO FULL
SIN&STES CT FULL
SLRH CO FULL
SMR CT FULL
Socapa CT FULL
Soferest CO FULL
Sorebor CO FULL
Soregis CT FULL
Soreno CT FULL
Sorenolif CO FULL
Soreset CT FULL
Sorreg CO FULL
SPAM 88% CO FULL
SPPJ 25% 45% CO EQUITY
SPR CO FULL
SRAB CO FULL
SRAM 44% CO FULL
SRBS 40% 40% CO EQUITY
SRHAJ 55% CO FULL
SRHVMB 84% CO FULL
SRNA CO FULL
Tabac de l’Aéroport de Pau Uzein 49% CO FULL
Tabapag CT FULL
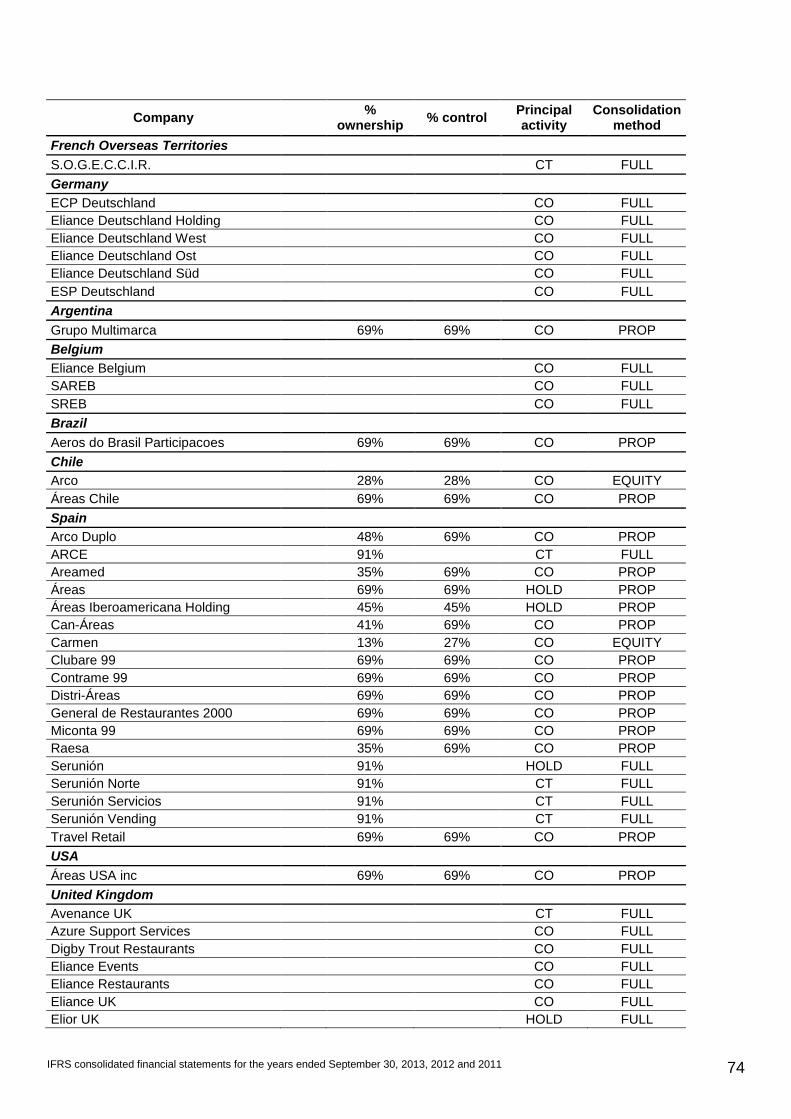
IFRS consolidated financial statements for the years ended September 30, 2013, 2012 and 2011 74
Company %
ownership % control
Principal activity
Consolidation method
French Overseas Territories
S.O.G.E.C.C.I.R. CT FULL
Germany
ECP Deutschland CO FULL
Eliance Deutschland Holding CO FULL
Eliance Deutschland West CO FULL
Eliance Deutschland Ost CO FULL
Eliance Deutschland Süd CO FULL
ESP Deutschland
CO FULL
Argentina
Grupo Multimarca 69% 69% CO PROP
Belgium
Eliance Belgium CO FULL
SAREB CO FULL
SREB
CO FULL
Brazil
Aeros do Brasil Participacoes 69% 69% CO PROP
Chile
Arco 28% 28% CO EQUITY
Áreas Chile 69% 69% CO PROP
Spain
Arco Duplo 48% 69% CO PROP
ARCE 91% CT FULL
Areamed 35% 69% CO PROP
Áreas 69% 69% HOLD PROP
Áreas Iberoamericana Holding 45% 45% HOLD PROP
Can-Áreas 41% 69% CO PROP
Carmen 13% 27% CO EQUITY
Clubare 99 69% 69% CO PROP
Contrame 99 69% 69% CO PROP
Distri-Áreas 69% 69% CO PROP
General de Restaurantes 2000 69% 69% CO PROP
Miconta 99 69% 69% CO PROP
Raesa 35% 69% CO PROP
Serunión 91% HOLD FULL
Serunión Norte 91% CT FULL
Serunión Servicios 91% CT FULL
Serunión Vending 91% CT FULL
Travel Retail 69% 69% CO PROP
USA
Áreas USA inc 69% 69% CO PROP
United Kingdom
Avenance UK CT FULL
Azure Support Services CO FULL
Digby Trout Restaurants CO FULL
Eliance Events CO FULL
Eliance Restaurants CO FULL
Eliance UK CO FULL
Elior UK HOLD FULL
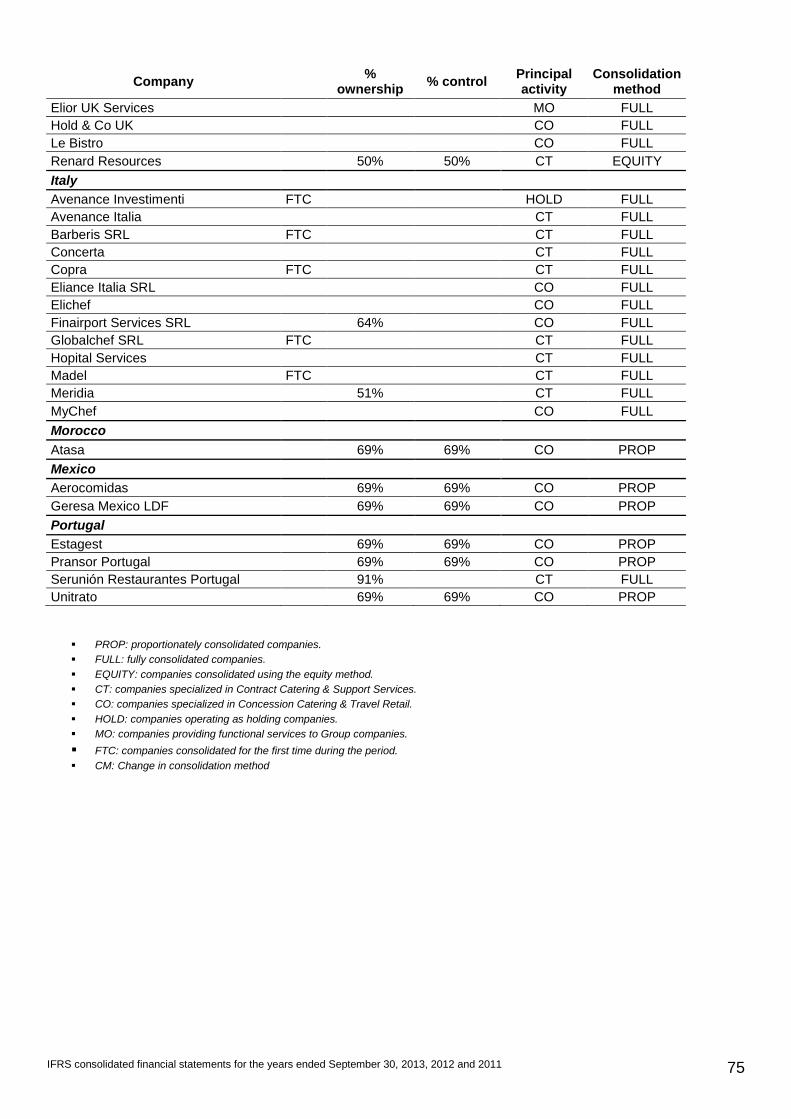
IFRS consolidated financial statements for the years ended September 30, 2013, 2012 and 2011 75
Company %
ownership % control
Principal activity
Consolidation method
Elior UK Services MO FULL
Hold & Co UK CO FULL
Le Bistro CO FULL
Renard Resources 50% 50% CT EQUITY
Italy
Avenance Investimenti FTC
HOLD FULL
Avenance Italia CT FULL
Barberis SRL FTC CT FULL
Concerta CT FULL
Copra FTC CT FULL
Eliance Italia SRL CO FULL
Elichef CO FULL
Finairport Services SRL 64% CO FULL
Globalchef SRL FTC CT FULL
Hopital Services CT FULL
Madel FTC CT FULL
Meridia 51% CT FULL
MyChef CO FULL
Morocco
Atasa 69% 69% CO PROP
Mexico
Aerocomidas 69% 69% CO PROP
Geresa Mexico LDF 69% 69% CO PROP
Portugal
Estagest 69% 69% CO PROP
Pransor Portugal 69% 69% CO PROP
Serunión Restaurantes Portugal 91% CT FULL
Unitrato 69% 69% CO PROP
PROP: proportionately consolidated companies.
FULL: fully consolidated companies.
EQUITY: companies consolidated using the equity method.
CT: companies specialized in Contract Catering & Support Services.
CO: companies specialized in Concession Catering & Travel Retail.
HOLD: companies operating as holding companies.
MO: companies providing functional services to Group companies.
FTC: companies consolidated for the first time during the period. CM: Change in consolidation method