Embed Size (px)
Citation preview
The Jupiter Global FundSociété d’Investissement à Capital Variable (SICAV)
Annual Review and Audited Financial Statements
For the year ended 30 September 2015
R.C.S. B 110.737R.C.S. B 110.737

3
the jupiter global fund
Contents
Contents investment objectives 4
Management, administration and independent auditor 6
directors 8
Chairman’s review 9
report of the depositary and Custodian 10
independent auditor’s report 11
Statement of net assets 13
Statement of operations and Changes in net assets 25
Statement of Changes in Shares issued 29
Statistical information 33
review of portfolio and Schedule of investments■ jupiter asia pacific 45■ jupiter China Select 51■ jupiter dynamic bond 55■ jupiter europa 77■ jupiter european feeder* 86■ jupiter european growth 88■ jupiter european opportunities 93■ jupiter global Convertibles 98■ jupiter global ecology growth 107■ jupiter global emerging Markets unconstrained* 112■ jupiter global equities 118■ jupiter global financials 123■ jupiter india Select 129■ jupiter japan Select 135■ jupiter new europe 138■ jupiter north american equities 142■ jupiter Strategic total return 146
notes to the financial Statements 158
additional information 174
notice of Meeting 175
proxy form
Subscriptions cannot be received on the basis of this report. Subscriptions can only be accepted on the basis of the current prospectus accompanied by the key investor information document or (for Hong Kong investors) key fact statements of the respective funds, supplemented by the latest annual report and semi-annual report if published thereafter.
*Jupiter Global Emerging Markets Unconstrained and Jupiter European Feeder were launched respectively on 9 March 2015 and 28 July 2015. These Funds are not authorised in Hong Kong and not available to Hong Kong residents.
4
the jupiter global fund
Investment Objectives
the jupiter global fund – jupiter asia pacific (‘jupiter asia pacific’)
The investment objective of Jupiter Asia Pacific is to achieve long-term capital growth by investing primarily in quoted companies in any economic sector involved directly or indirectly in the Asian and Pacific Basin markets, excluding Japan.
the jupiter global fund – jupiter China Select (‘jupiter China Select’)
The investment objective of Jupiter China Select is to achieve long-term capital growth by investing in companies that are considered by the Investment Manager to be well positioned to benefit from secular trends associated with the environmentally, socially and economically sustainable development of Greater China.
the jupiter global fund – jupiter dynamic bond(‘jupiter dynamic bond’)
The investment objective of Jupiter Dynamic Bond is to achieve a high income with the prospect of capital growth from a portfolio of investments in global fixed interest securities.
the jupiter global fund – jupiter europa (‘jupiter europa’)
The investment objective of Jupiter Europa is to generate positive long-term returns across varying market conditions principally from a portfolio of investments in European equities and equity related securities.
the jupiter global fund – jupiter european feeder (‘jupiter european feeder’)*
The investment objective of Jupiter European Feeder is to achieve long-term capital growth principally through investment in the Jupiter European Master Fund.
the jupiter global fund – jupiter european growth (‘jupiter european growth’)
The investment objective of Jupiter European Growth is to achieve long-term capital growth by exploiting special investment opportunities in Europe.
the jupiter global fund – jupiter european opportunities (‘jupiter european opportunities’)
The investment objective of Jupiter European Opportunities is to achieve long-term capital growth from investments in companies quoted on a European Stock Exchange.
the jupiter global fund – jupiter global Convertibles(‘jupiter global Convertibles’)
The investment objective of Jupiter Global Convertibles is to achieve long-term capital growth through investment on a global basis in a diversified portfolio of convertible securities.
the jupiter global fund – jupiter global ecology growth(‘jupiter global ecology growth’)
The investment objective of Jupiter Global Ecology Growth is to generate long-term capital growth from investment worldwide in companies that are responding positively to the challenge of environmental sustainability and climate change.
the jupiter global fund – jupiter global emerging Markets unconstrained(‘jupiter global emerging Markets unconstrained’)*
The investment objective of Jupiter Global Emerging Markets Unconstrained is to achieve long-term capital growth through investment in equity and equity-related securities of companies exposed directly or indirectly to emerging market economies worldwide.
the jupiter global fund – jupiter global equities (‘jupiter global equities’)
The investment objective of Jupiter Global Equities is to achieve long-term total return principally through investment in equities on an international basis.
the jupiter global fund – jupiter global financials (‘jupiter global financials’)
The investment objective of Jupiter Global Financials is to achieve long-term capital growth principally through investment in equities of financial sector companies on an international basis.
*Jupiter Global Emerging Markets Unconstrained and Jupiter European Feeder were launched respectively on 9 March 2015 and 28 July 2015. These Funds are not authorised in Hong Kong and not available to Hong Kong residents.
5
the jupiter global fund
Investment Objectives
the jupiter global fund – jupiter india Select(‘jupiter india Select’)
The investment objective of Jupiter India Select is to achieve long-term capital growth through investment primarily in India and selected opportunities in Pakistan, Bangladesh, Sri Lanka, Bhutan, Nepal and the Maldives.
the jupiter global fund – jupiter japan Select (‘jupiter japan Select’)
The investment objective of Jupiter Japan Select is to achieve long-term capital growth through investing primarily in Japan and in selected opportunities in Asia.
the jupiter global fund – jupiter new europe (‘jupiter new europe’)
The investment objective of Jupiter New Europe is to achieve long-term capital growth through investment primarily in Central and Eastern Europe, Russia and Turkey and in addition investment in non European former member states of the Union of Soviet Socialist Republics (‘USSR’).
the jupiter global fund – jupiter north american equities (‘jupiter north american equities’)
The investment objective of Jupiter North American Equities is to achieve long-term capital growth through investing primarily in North American securities.
the jupiter global fund – jupiter Strategic total return(‘jupiter Strategic total return’)
The investment objective of the Jupiter Strategic Total Return is to generate positive long-term returns across varying market conditions from an actively managed portfolio of different asset classes, including equities, bonds, convertible bonds, currencies and money market securities on an international basis.
6
the jupiter global fund
Management, Administration and Independent Auditor
■ Management, administration and independent auditor
directors Adrian Creedy (Chairman) Garth Lorimer Turner* Jacques Elvinger*Patrick Zurstrassen*Paula Moore
registered office 6, route de TrèvesSenningerbergL-2633 Luxembourg
administrator, depositary, paying agent & registrar
J.P. Morgan Bank Luxembourg S.A.6, route de Trèves SenningerbergL-2633 Luxembourg
Management Company RBS (Luxembourg) S.A. 33, rue de Gasperich – Building B L-5826 Hesperange, Luxembourg
independent auditors Ernst & Young S.A. 7, Rue Gabriel LippmanParc d’Activité Syrdall 2L-5365 Munsbach, Luxembourg
legal advisers Elvinger Hoss & Prussen2, Place Winston ChurchillL-1340 Luxembourg
investment Manager Jupiter Asset Management Limited1 Grosvenor PlaceLondon SW1X 7JJUnited KingdomAuthorised and regulated by the Financial Conduct Authority
distributors jupiter asset Management (bermuda) limited11 Brooklyn LaneHamilton HM09Bermudajupiter asset Management limited 1 Grosvenor PlaceLondon SW1X 7JJUnited Kingdomjupiter asset Managers (jersey) limited (until 3 December 2014)Ground Floor4 Wharf StreetSt. Helier, Jersey JE2 3NRChannel Islandsjupiter asset Management (asia) private limitedLevel 31Six Battery Road, Raffles Place Singapore 049909
*Independent
7
the jupiter global fund
Management, Administration and Independent Auditor
■ Management, administration and independent auditor (continued)
uK representative Jupiter Asset Management Limited1 Grosvenor PlaceLondon SW1X 7JJUnited Kingdom
Swiss representative BNP Paribas Securities Services, Parissuccursale de ZurichSelnaustrasse 168002 Zurich Switzerland
hong Kong representative JPMorgan Chase Bank, N.A. Hong Kong Branch21/F, JPMorgan Tower138 Shatin Rural Committee Road Shatin, New TerritoriesHong Kong
8
the jupiter global fund
Directors
■ directors
adrian Creedy (Chairman) Adrian Creedy (British) is the Chief Operating Officer and Company Secretary of Jupiter Fund Management plc. He is a Solicitor of the Supreme Court of England and Wales. He is also a Director of Jupiter Asset Management Limited.
garth lorimer turner* Garth Lorimer Turner (British) is a Solicitor of the Supreme Court of England & Wales, a Solicitor of the Supreme Court of Hong Kong and a Bermuda Barrister & Attorney. He is a director of several companies, including investment funds.
jacques elvinger* Jacques Elvinger (Luxembourgish) is a partner of the Luxembourg law firm of Elvinger Hoss & Prussen.
patrick Zurstrassen* Patrick Zurstrassen (Belgian) is an independent director. He is honorary chairman of the European Confederation of Directors’ Associations.
paula Moore Paula Moore (British) is a Chartered Accountant and a member of the Institute of Chartered Accountants in England and Wales. She is an employee of Jupiter Asset Management Limited and a Director of Jupiter Unit Trust Managers Limited.
*Independent
9
the jupiter global fund
Chairman’s Review
■ Chairman’s review
Dear Shareholder,
The past year has perhaps been even more of a rollercoaster than usual for investors. One of the many noteworthy factors has been the crash in the oil price since the summer of 2014, which saw it fall from $115 per barrel to below $50 at the time of writing. This has therefore been a painful time for nations and businesses that depend on oil revenue. The other side of that equation, however, is that a low oil price is extremely helpful for almost everyone else, whether countries, companies or individuals. Indeed, the International Monetary Fund (IMF) estimates that in 2016, the low oil price will add 0.5-1% to global GDP1 as well as being a major contributory factor to keeping global inflation at historically low rates, and in the UK the benefit of the oil price fall has been estimated as the equivalent of a penny off income tax.
While a low oil price might – in aggregate – be good news it certainly hasn’t all been plain sailing for investors over the past year. It feels like a long time ago now, but over the summer a bad-tempered political drama played out in Greece, as the ruling Syriza-led coalition government sought to negotiate terms for a new bailout with the ‘troika’ of the European Commission, European Central Bank and IMF. The talks went to the ‘11th hour’ and even beyond, as Greece technically went into arrears with the IMF at one stage, but an agreement was eventually reached and Greece continued to be a member of the Eurozone. This averted the immediate insolvency crisis, although arguably Greece’s deep-rooted structural, financial and economic problems remain very far from resolved.
Once investors stopped worrying about Greece, it wasn’t long before China grabbed the headlines. Back in April – and following several quarters of relative strength - developed market equities were riding high. After that, however, indices traded roughly sideways for a while, with Asian and the emerging market equivalents falling in Sterling terms. In August, the decision by China to devalue its currency against the US dollar was the trigger for a worsening of an already fragile situation, as investors became nervous about China’s economic growth. This spilled over into the developed world, resulting in sudden and significant market falls that only found a footing when China took action and eased its monetary policy, reducing interest rates and bank reserve requirements.
The actions of central bankers have just as much power to move markets in the West, of course. For some time both the US Federal Reserve and the Bank of England had been steering markets towards an expectation that interest rates would start to rise again probably before the end of 2015, or perhaps in early 2016. This view has been based on the relatively strong economic growth enjoyed by both the US and UK as labour markets tighten and wage inflation creeps up. In September both the US Federal Reserve and the Bank of England kept interest rates unchanged yet again, which merely heightened speculation about the timing of an eventual rise.
Finally, November sadly saw terrorism make headlines once again. The tragic terrorist attack on Paris, in which 130 people died, was followed by fears of similar attacks across Europe and particularly in Brussels which saw a security lockdown. The knock-on effects of these events are still being felt as this report goes to press.
These are extraordinary times. Political leaders and economic policy makers are clearly having to be somewhat nimble in their thinking and adapt to fast-changing circumstances. As active investors, we will continue to seek to strike that fine balance between investing for the long-term and tuning out short-term distractions, while also being astute about how we adjust to a market landscape that retains all its capacity to surprise.
adrian CreedyChairman
2 December 2015
1Source: IMF, Global Implications of Lower Oil Prices, July 2015
10
the jupiter global fund
Report of the Depositary and Custodian
■ report of the depositary and Custodian
In our capacity as Depositary and Custodian we confirm that, in our opinion, the Management Company and the Board of Directors have managed the Company during the year ended 30 September 2015 in accordance with the provisions of the principal documents of the Company and the Protection of Investors as stated in the Luxembourg Law and rules made there under.
J.P. Morgan Bank Luxembourg S.A.6, route de Trèves, SenningerbergL-2633 Luxembourg2 December 2015
11
To the Shareholders of The Jupiter Global Fund,6, route de TrèvesL-2633 SenningerbergLuxembourg
We have audited the accompanying financial statements of The Jupiter Global Fund and of each of its sub-funds, which comprise the statement of net assets and the schedule of investments as at 30 September 2015 and the statement of operations and changes in net assets for the year then ended, and a summary of significant accounting policies and other notes to the financial statements.
Responsibility of the Board of Directors of the SICAV for the financial statements
The Board of Directors of the SICAV is responsible for the preparation and fair presentation of these financial statements in accordance with Luxembourg legal and regulatory requirements relating to the preparation and presentation of the financial statements and for such internal control as the Board of Directors of the SICAV determines is necessary to enable the preparation and presentation of financial statements that are free from material misstatement, whether due to fraud or error.
Responsibility of the ‘réviseur d’entreprises agréé’
Our responsibility is to express an opinion on these financial statements based on our audit. We conducted our audit in accordance with International Standards on Auditing as adopted for Luxembourg by the ‘Commission de Surveillance du Secteur Financier’. Those standards require that we comply with ethical requirements and plan and perform the audit to obtain reasonable assurance about whether the financial statements are free from material misstatement.
An audit involves performing procedures to obtain audit evidence about the amounts and disclosures in the financial statements. The procedures selected depend on the judgement of the ‘réviseur d’entreprises agréé’, including the assessment of the risks of material misstatement of the financial statements, whether due to fraud or error. In making those risk assessments, the ‘réviseur d’entreprises agréé’ considers internal control relevant to the entity’s preparation and fair presentation of the financial statements in order to design audit procedures that are appropriate in the circumstances, but not for the purpose of expressing an opinion on the effectiveness of the entity’s internal control. An audit also includes evaluating the appropriateness of accounting policies used and the reasonableness of accounting estimates made by the Board of Directors of the SICAV, as well as evaluating the overall presentation of the financial statements.
We believe that the audit evidence we have obtained is sufficient and appropriate to provide a basis for our audit opinion.
the jupiter global fund
Independent Auditor’s Report
12
the jupiter global fund
Independent Auditor’s Report
Opinion
In our opinion, the financial statements give a true and fair view of the financial position of The Jupiter Global Fund and of each of its sub-funds as of 30 September 2015, and of the results of their operations and changes in their net assets for the year then ended in accordance with Luxembourg legal and regulatory requirements relating to the preparation and presentation of the financial statements.
Other matter
Supplementary information included in the annual report has been reviewed in the context of our mandate but has not been subject to specific audit procedures carried out in accordance with the standards described above. Consequently, we express no opinion on such information. However, we have no observation to make concerning such information in the context of the financial statements taken as a whole.
ERNST & YOUNGSociété AnonymeCabinet de révision agréé
Kerry Nichol
Luxembourg, 2 December 2015
13
the jupiter global fund
Statement of Net Assets
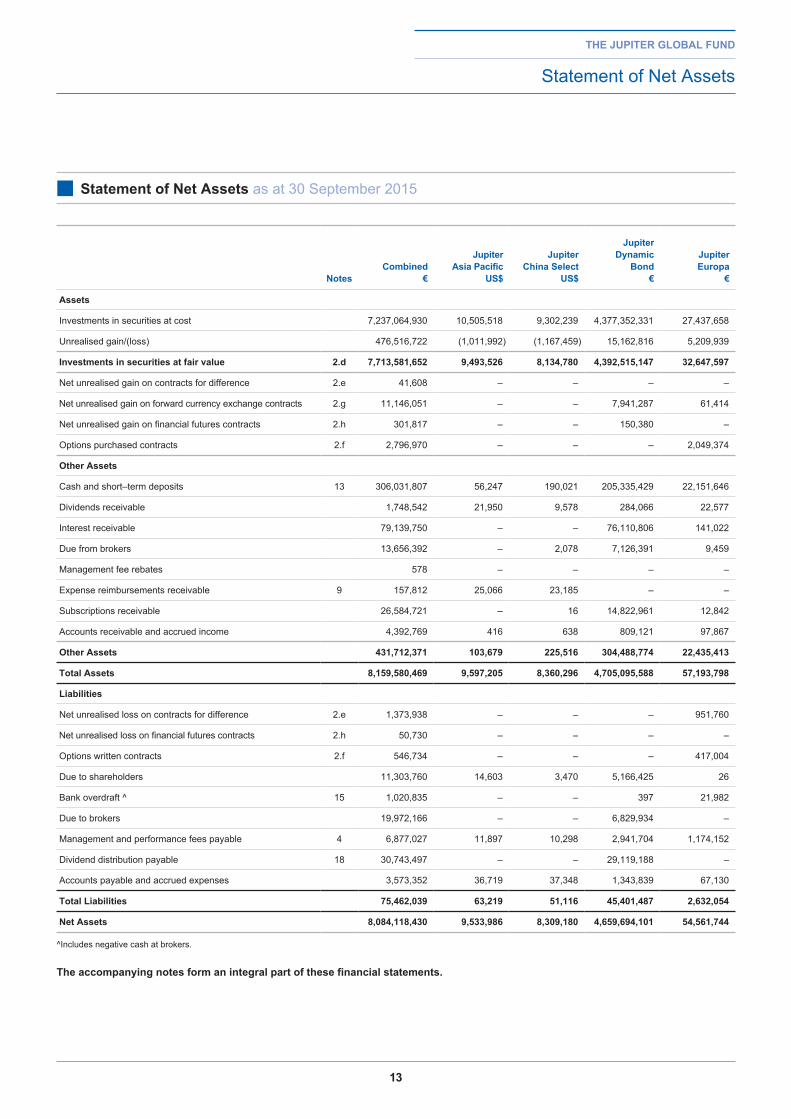
■ Statement of net assets as at 30 September 2015
notesCombined
€
jupiterasia pacific
uS$
jupiter China Select
uS$
jupiter dynamic
bond €
jupiter europa
€
assets
Investments in securities at cost 7,237,064,930 10,505,518 9,302,239 4,377,352,331 27,437,658
Unrealised gain/(loss) 476,516,722 (1,011,992) (1,167,459) 15,162,816 5,209,939
investments in securities at fair value 2.d 7,713,581,652 9,493,526 8,134,780 4,392,515,147 32,647,597
Net unrealised gain on contracts for difference 2.e 41,608 – – – –
Net unrealised gain on forward currency exchange contracts 2.g 11,146,051 – – 7,941,287 61,414
Net unrealised gain on financial futures contracts 2.h 301,817 – – 150,380 –
Options purchased contracts 2.f 2,796,970 – – – 2,049,374
other assets
Cash and short–term deposits 13 306,031,807 56,247 190,021 205,335,429 22,151,646
Dividends receivable 1,748,542 21,950 9,578 284,066 22,577
Interest receivable 79,139,750 – – 76,110,806 141,022
Due from brokers 13,656,392 – 2,078 7,126,391 9,459
Management fee rebates 578 – – – –
Expense reimbursements receivable 9 157,812 25,066 23,185 – –
Subscriptions receivable 26,584,721 – 16 14,822,961 12,842
Accounts receivable and accrued income 4,392,769 416 638 809,121 97,867
other assets 431,712,371 103,679 225,516 304,488,774 22,435,413
total assets 8,159,580,469 9,597,205 8,360,296 4,705,095,588 57,193,798
liabilities
Net unrealised loss on contracts for difference 2.e 1,373,938 – – – 951,760
Net unrealised loss on financial futures contracts 2.h 50,730 – – – –
Options written contracts 2.f 546,734 – – – 417,004
Due to shareholders 11,303,760 14,603 3,470 5,166,425 26
Bank overdraft ^ 15 1,020,835 – – 397 21,982
Due to brokers 19,972,166 – – 6,829,934 –
Management and performance fees payable 4 6,877,027 11,897 10,298 2,941,704 1,174,152
Dividend distribution payable 18 30,743,497 – – 29,119,188 –
Accounts payable and accrued expenses 3,573,352 36,719 37,348 1,343,839 67,130
total liabilities 75,462,039 63,219 51,116 45,401,487 2,632,054
net assets 8,084,118,430 9,533,986 8,309,180 4,659,694,101 54,561,744
^Includes negative cash at brokers.
the accompanying notes form an integral part of these financial statements.

14
the jupiter global fund
Statement of Net Assets
■ Statement of net assets as at 30 September 2015 (continued)
jupiterasia pacific
uS$
jupiter China Select
uS$
jupiter dynamic
bond €
jupiter europa
€
number of shares outstanding:
30 September 2015
Class D CHF Acc HSC – – 1,329,437 –
Class D CHF Q Inc HSC – – 379,200 –
Class D EUR Acc – – 18,345,050 –
Class D EUR B Acc – – – 778,024 (5)
Class D EUR Q Inc – – 2,611,016 –
Class D EUR Q Inc Dist – – 1,003,148 –
Class D GBP Acc HSC – – 2,271,403 –
Class D GBP Q Inc HSC – – 13,088,404 –
Class D USD Acc HSC – – 15,807,841 –
Class D USD B Acc HSC – – – 42,377 (6)
Class D USD Q Inc HSC – – 4,826,903 –
Class I CHF Q Inc HSC – – 2,415,417 –
Class I EUR Acc – – 68,728,010 –
Class I EUR Q Inc – – 64,367,663 –
Class I GBP Q Inc HSC – – 31,764,548 –
Class I USD Q Inc HSC – – 20,950,626 –
Class L AUD Acc HSC – – 483,512 (1) –
Class L AUD M Inc HSC – – 761,505 (2) –
Class L CHF Acc HSC – – 3,586,179 –
Class L CHF Q Inc HSC – – 661,047 –
Class L CNH Acc HSC – – 60,000 (3)^ –
Class L EUR A Acc – – – 807,693
Class L EUR Acc – 17,313 29,342,226 –
Class L EUR B Acc – – – 1,755,530
Class L EUR Q Inc – – 23,171,273 –
Class L EUR Q Inc Dist – – 4,357,131 –
Class L GBP A Inc 359,624 474,407 – –
Class L GBP B Acc HSC – – – 526,869
Class L GBP Q Inc HSC – – 3,819,158 –
Class L SEK Acc HSC – – 273,488 (4) –
Class L SGD Acc HSC – – 2,183,401 –
Class L SGD M Inc HSC – – 4,787,776 –
Class L USD Acc 108,790 79,969 – –
Class L USD Acc HSC – – 36,949,017 –
Class L USD B Acc HSC – – – 293,557
Class L USD M Inc HSC – – 31,963,251 –
Class L USD Q Inc HSC – – 24,303,134 –
(1) Launch date 4 December 2014. (2) Launch date 29 December 2014. (3) Launch date 29 January 2015 .(4) Launch date 6 November 2014. (5) Launch date 24 October 2014. (6) Launch date 30 October 2014. (7) Launch date 17 December 2014. (8) Launch date 9 March 2015. (9) Launch date 4 November 2014. (10) Launch date 30 March 2015. (11) Launch date 28 July 2015. (12) Deactivation date 8 January 2015. ^The CNH classes of the Jupiter Dynamic Bond Fund may only be offered for sale or sold in Hong Kong to ‘professional investors’ within the meaning of the Securities and Futures Ordinance and any rules made thereunder.
the accompanying notes form an integral part of these financial statements.
15
the jupiter global fund
Statement of Net Assets
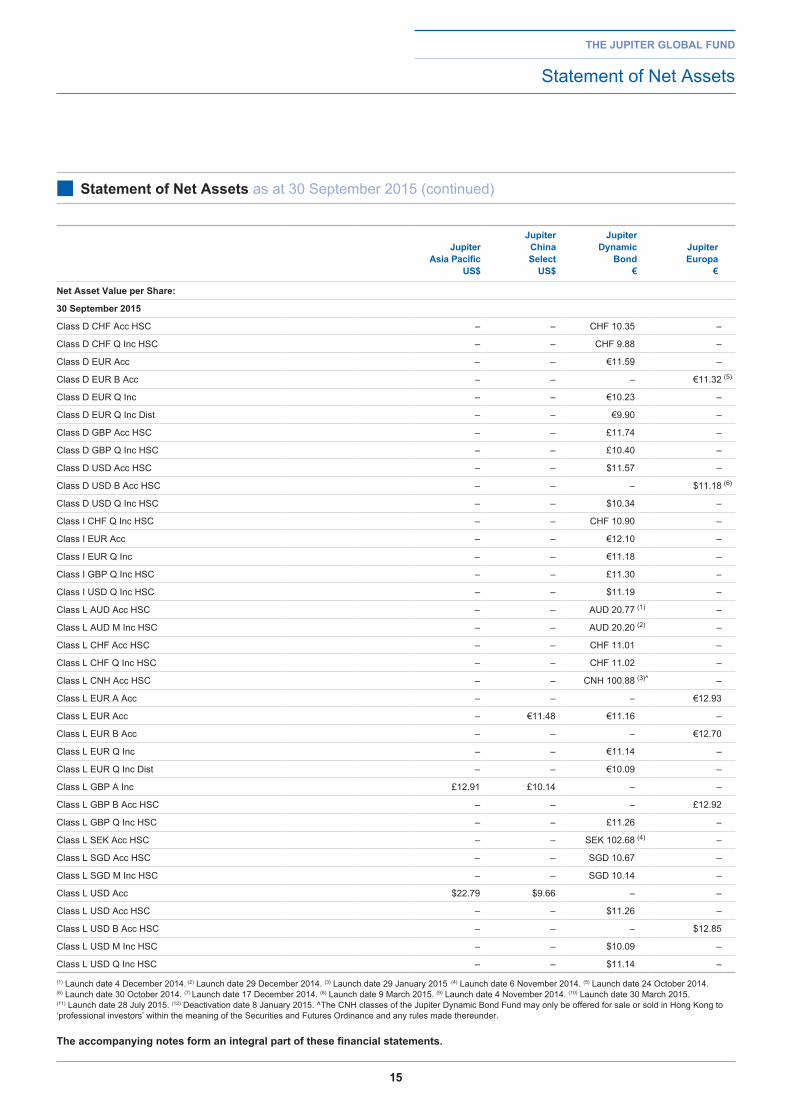
■ Statement of net assets as at 30 September 2015 (continued)
jupiterasia pacific
uS$
jupiter China Select
uS$
jupiter dynamic
bond €
jupiter europa
€
net asset Value per Share:
30 September 2015
Class D CHF Acc HSC – – CHF 10.35 –
Class D CHF Q Inc HSC – – CHF 9.88 –
Class D EUR Acc – – €11.59 –
Class D EUR B Acc – – – €11.32 (5)
Class D EUR Q Inc – – €10.23 –
Class D EUR Q Inc Dist – – €9.90 –
Class D GBP Acc HSC – – £11.74 –
Class D GBP Q Inc HSC – – £10.40 –
Class D USD Acc HSC – – $11.57 –
Class D USD B Acc HSC – – – $11.18 (6)
Class D USD Q Inc HSC – – $10.34 –
Class I CHF Q Inc HSC – – CHF 10.90 –
Class I EUR Acc – – €12.10 –
Class I EUR Q Inc – – €11.18 –
Class I GBP Q Inc HSC – – £11.30 –
Class I USD Q Inc HSC – – $11.19 –
Class L AUD Acc HSC – – AUD 20.77 (1) –
Class L AUD M Inc HSC – – AUD 20.20 (2) –
Class L CHF Acc HSC – – CHF 11.01 –
Class L CHF Q Inc HSC – – CHF 11.02 –
Class L CNH Acc HSC – – CNH 100.88 (3)^ –
Class L EUR A Acc – – – €12.93
Class L EUR Acc – €11.48 €11.16 –
Class L EUR B Acc – – – €12.70
Class L EUR Q Inc – – €11.14 –
Class L EUR Q Inc Dist – – €10.09 –
Class L GBP A Inc £12.91 £10.14 – –
Class L GBP B Acc HSC – – – £12.92
Class L GBP Q Inc HSC – – £11.26 –
Class L SEK Acc HSC – – SEK 102.68 (4) –
Class L SGD Acc HSC – – SGD 10.67 –
Class L SGD M Inc HSC – – SGD 10.14 –
Class L USD Acc $22.79 $9.66 – –
Class L USD Acc HSC – – $11.26 –
Class L USD B Acc HSC – – – $12.85
Class L USD M Inc HSC – – $10.09 –
Class L USD Q Inc HSC – – $11.14 –
(1) Launch date 4 December 2014. (2) Launch date 29 December 2014. (3) Launch date 29 January 2015 .(4) Launch date 6 November 2014. (5) Launch date 24 October 2014. (6) Launch date 30 October 2014. (7) Launch date 17 December 2014. (8) Launch date 9 March 2015. (9) Launch date 4 November 2014. (10) Launch date 30 March 2015. (11) Launch date 28 July 2015. (12) Deactivation date 8 January 2015. ^The CNH classes of the Jupiter Dynamic Bond Fund may only be offered for sale or sold in Hong Kong to ‘professional investors’ within the meaning of the Securities and Futures Ordinance and any rules made thereunder.
the accompanying notes form an integral part of these financial statements.
16
the jupiter global fund
Statement of Net Assets
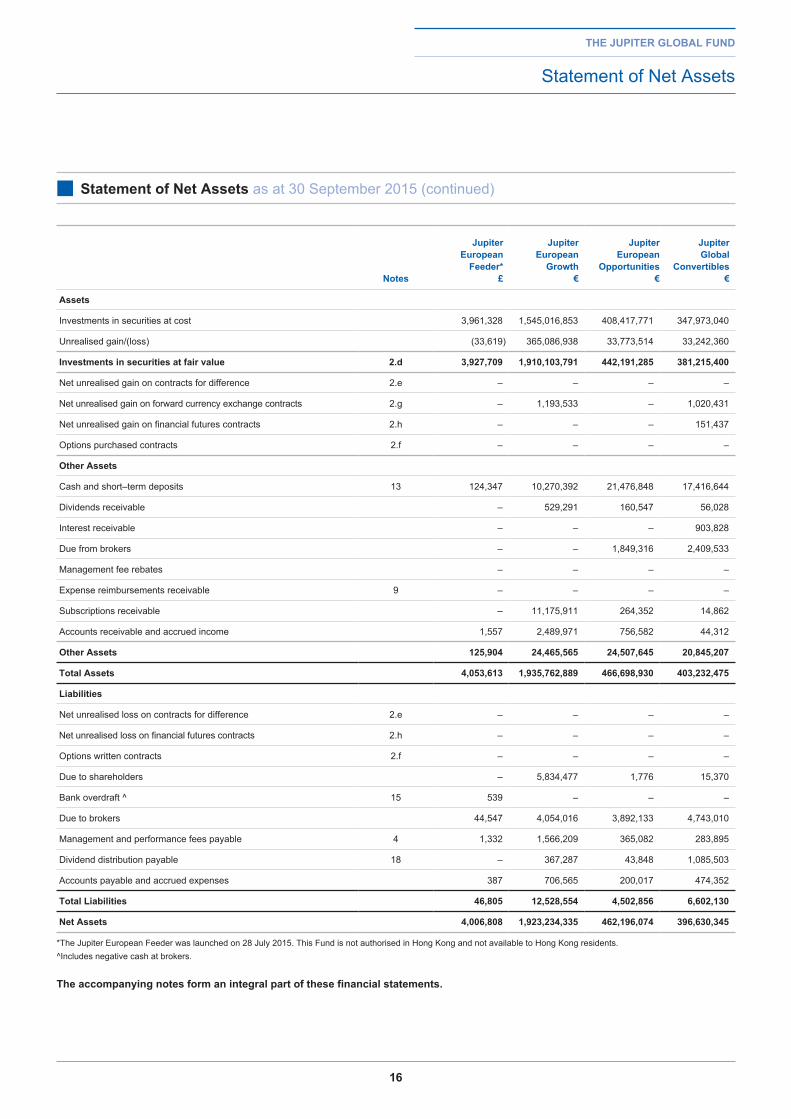
■ Statement of net assets as at 30 September 2015 (continued)
notes
jupiter european
feeder* £
jupiter european
growth €
jupiter european
opportunities €
jupiter global
Convertibles €
assets
Investments in securities at cost 3,961,328 1,545,016,853 408,417,771 347,973,040
Unrealised gain/(loss) (33,619) 365,086,938 33,773,514 33,242,360
investments in securities at fair value 2.d 3,927,709 1,910,103,791 442,191,285 381,215,400
Net unrealised gain on contracts for difference 2.e – – – –
Net unrealised gain on forward currency exchange contracts 2.g – 1,193,533 – 1,020,431
Net unrealised gain on financial futures contracts 2.h – – – 151,437
Options purchased contracts 2.f – – – –
other assets
Cash and short–term deposits 13 124,347 10,270,392 21,476,848 17,416,644
Dividends receivable – 529,291 160,547 56,028
Interest receivable – – – 903,828
Due from brokers – – 1,849,316 2,409,533
Management fee rebates – – – –
Expense reimbursements receivable 9 – – – –
Subscriptions receivable – 11,175,911 264,352 14,862
Accounts receivable and accrued income 1,557 2,489,971 756,582 44,312
other assets 125,904 24,465,565 24,507,645 20,845,207
total assets 4,053,613 1,935,762,889 466,698,930 403,232,475
liabilities
Net unrealised loss on contracts for difference 2.e – – – –
Net unrealised loss on financial futures contracts 2.h – – – –
Options written contracts 2.f – – – –
Due to shareholders – 5,834,477 1,776 15,370
Bank overdraft ^ 15 539 – – –
Due to brokers 44,547 4,054,016 3,892,133 4,743,010
Management and performance fees payable 4 1,332 1,566,209 365,082 283,895
Dividend distribution payable 18 – 367,287 43,848 1,085,503
Accounts payable and accrued expenses 387 706,565 200,017 474,352
total liabilities 46,805 12,528,554 4,502,856 6,602,130
net assets 4,006,808 1,923,234,335 462,196,074 396,630,345
*The Jupiter European Feeder was launched on 28 July 2015. This Fund is not authorised in Hong Kong and not available to Hong Kong residents. ^Includes negative cash at brokers.
the accompanying notes form an integral part of these financial statements.
17
the jupiter global fund
Statement of Net Assets
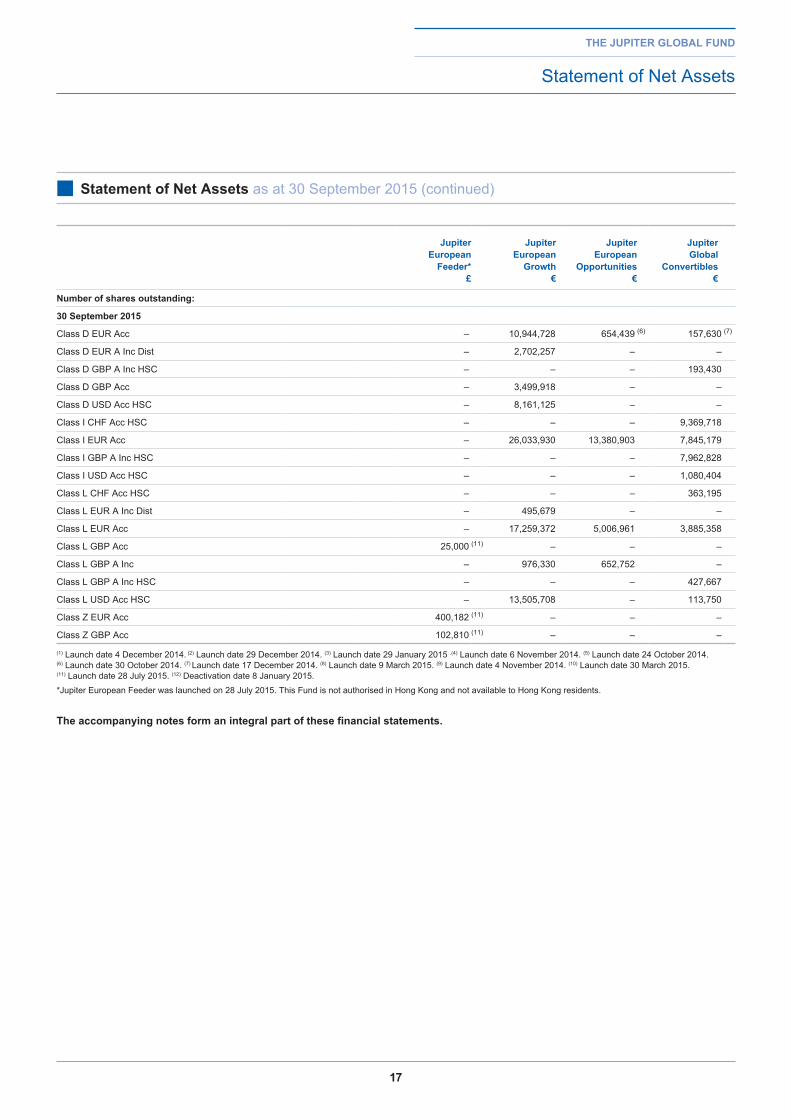
■ Statement of net assets as at 30 September 2015 (continued)
jupiter european
feeder* £
jupiter european
growth €
jupiter european
opportunities €
jupiter global
Convertibles €
number of shares outstanding:
30 September 2015
Class D EUR Acc – 10,944,728 654,439 (6) 157,630 (7)
Class D EUR A Inc Dist – 2,702,257 – –
Class D GBP A Inc HSC – – – 193,430
Class D GBP Acc – 3,499,918 – –
Class D USD Acc HSC – 8,161,125 – –
Class I CHF Acc HSC – – – 9,369,718
Class I EUR Acc – 26,033,930 13,380,903 7,845,179
Class I GBP A Inc HSC – – – 7,962,828
Class I USD Acc HSC – – – 1,080,404
Class L CHF Acc HSC – – – 363,195
Class L EUR A Inc Dist – 495,679 – –
Class L EUR Acc – 17,259,372 5,006,961 3,885,358
Class L GBP Acc 25,000 (11) – – –
Class L GBP A Inc – 976,330 652,752 –
Class L GBP A Inc HSC – – – 427,667
Class L USD Acc HSC – 13,505,708 – 113,750
Class Z EUR Acc 400,182 (11) – – –
Class Z GBP Acc 102,810 (11) – – –
(1) Launch date 4 December 2014. (2) Launch date 29 December 2014. (3) Launch date 29 January 2015 .(4) Launch date 6 November 2014. (5) Launch date 24 October 2014. (6) Launch date 30 October 2014. (7) Launch date 17 December 2014. (8) Launch date 9 March 2015. (9) Launch date 4 November 2014. (10) Launch date 30 March 2015. (11) Launch date 28 July 2015. (12) Deactivation date 8 January 2015. *Jupiter European Feeder was launched on 28 July 2015. This Fund is not authorised in Hong Kong and not available to Hong Kong residents.
the accompanying notes form an integral part of these financial statements.
18
the jupiter global fund
Statement of Net Assets
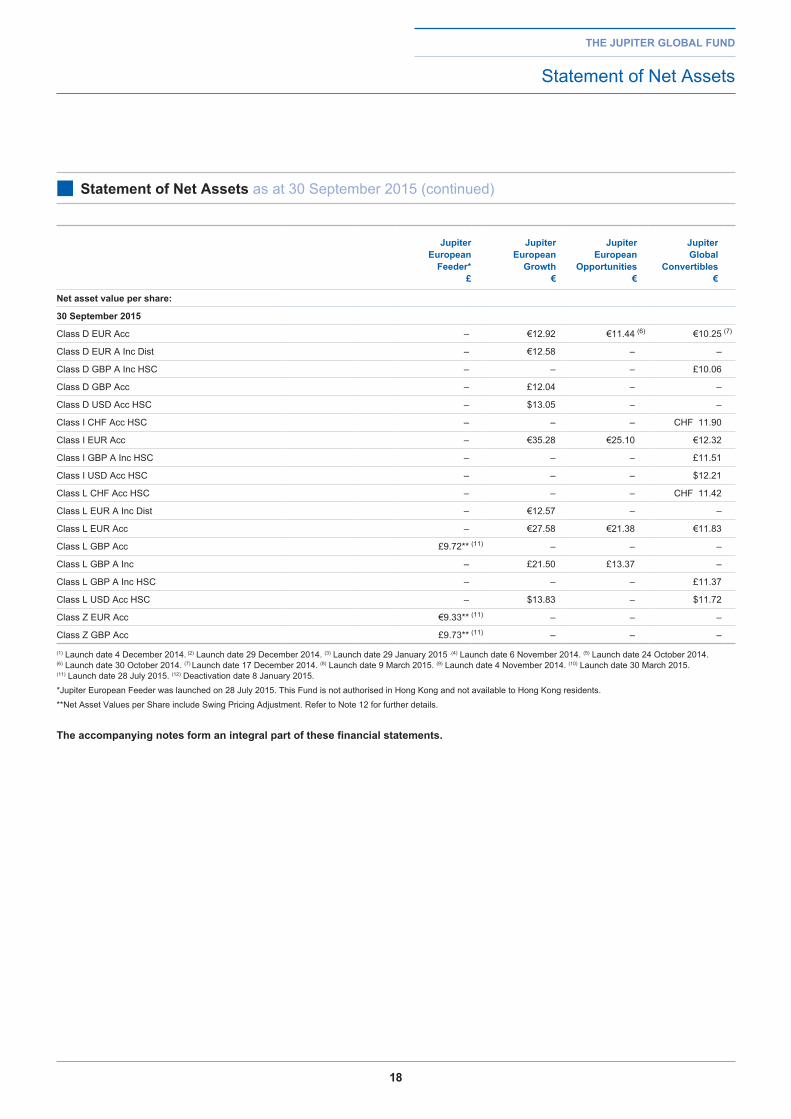
■ Statement of net assets as at 30 September 2015 (continued)
jupiter european
feeder* £
jupiter european
growth €
jupiter european
opportunities €
jupiter global
Convertibles €
net asset value per share:
30 September 2015
Class D EUR Acc – €12.92 €11.44 (6) €10.25 (7)
Class D EUR A Inc Dist – €12.58 – –
Class D GBP A Inc HSC – – – £10.06
Class D GBP Acc – £12.04 – –
Class D USD Acc HSC – $13.05 – –
Class I CHF Acc HSC – – – CHF 11.90
Class I EUR Acc – €35.28 €25.10 €12.32
Class I GBP A Inc HSC – – – £11.51
Class I USD Acc HSC – – – $12.21
Class L CHF Acc HSC – – – CHF 11.42
Class L EUR A Inc Dist – €12.57 – –
Class L EUR Acc – €27.58 €21.38 €11.83
Class L GBP Acc £9.72** (11) – – –
Class L GBP A Inc – £21.50 £13.37 –
Class L GBP A Inc HSC – – – £11.37
Class L USD Acc HSC – $13.83 – $11.72
Class Z EUR Acc €9.33** (11) – – –
Class Z GBP Acc £9.73** (11) – – –
(1) Launch date 4 December 2014. (2) Launch date 29 December 2014. (3) Launch date 29 January 2015 .(4) Launch date 6 November 2014. (5) Launch date 24 October 2014. (6) Launch date 30 October 2014. (7) Launch date 17 December 2014. (8) Launch date 9 March 2015. (9) Launch date 4 November 2014. (10) Launch date 30 March 2015. (11) Launch date 28 July 2015. (12) Deactivation date 8 January 2015. *Jupiter European Feeder was launched on 28 July 2015. This Fund is not authorised in Hong Kong and not available to Hong Kong residents.
**Net Asset Values per Share include Swing Pricing Adjustment. Refer to Note 12 for further details.
the accompanying notes form an integral part of these financial statements.
19
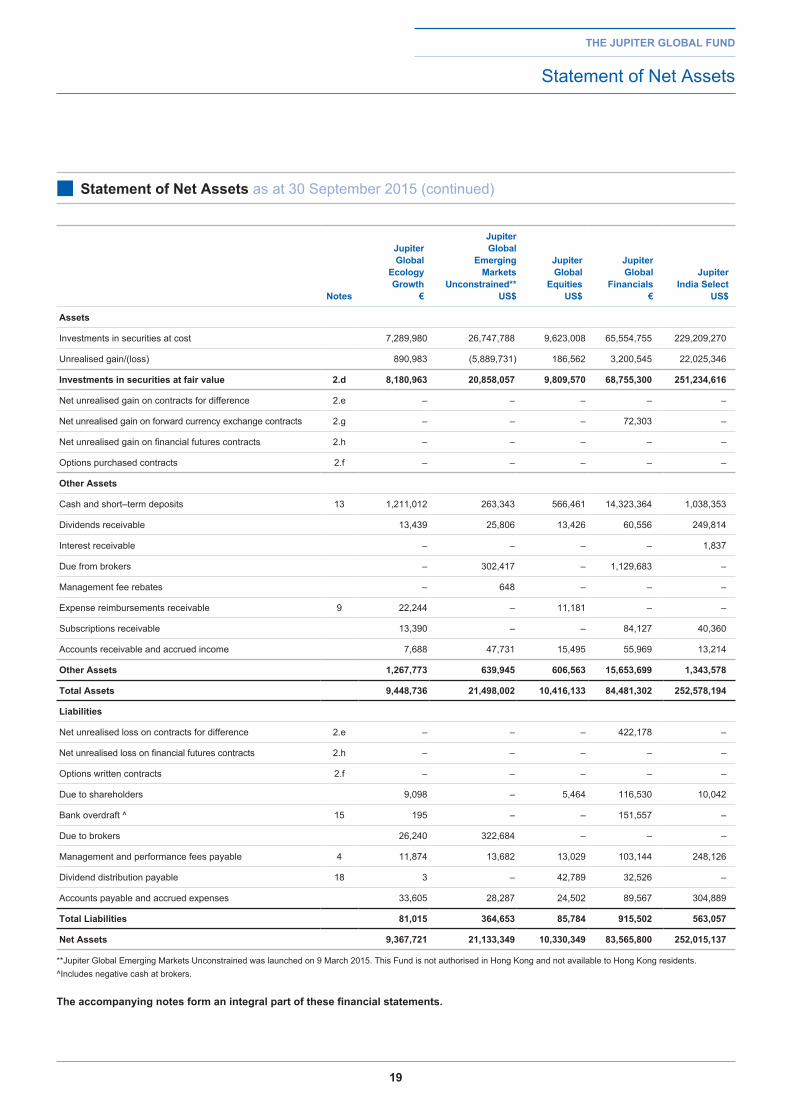
notes
jupiter global
ecology growth
€
jupiter global
emerging Markets
unconstrained** uS$
jupiter global
equities uS$
jupiter global
financials €
jupiter india Select
uS$
assets
Investments in securities at cost 7,289,980 26,747,788 9,623,008 65,554,755 229,209,270
Unrealised gain/(loss) 890,983 (5,889,731) 186,562 3,200,545 22,025,346
investments in securities at fair value 2.d 8,180,963 20,858,057 9,809,570 68,755,300 251,234,616
Net unrealised gain on contracts for difference 2.e – – – – –
Net unrealised gain on forward currency exchange contracts 2.g – – – 72,303 –
Net unrealised gain on financial futures contracts 2.h – – – – –
Options purchased contracts 2.f – – – – –
other assets
Cash and short–term deposits 13 1,211,012 263,343 566,461 14,323,364 1,038,353
Dividends receivable 13,439 25,806 13,426 60,556 249,814
Interest receivable – – – – 1,837
Due from brokers – 302,417 – 1,129,683 –
Management fee rebates – 648 – – –
Expense reimbursements receivable 9 22,244 – 11,181 – –
Subscriptions receivable 13,390 – – 84,127 40,360
Accounts receivable and accrued income 7,688 47,731 15,495 55,969 13,214
other assets 1,267,773 639,945 606,563 15,653,699 1,343,578
total assets 9,448,736 21,498,002 10,416,133 84,481,302 252,578,194
liabilities
Net unrealised loss on contracts for difference 2.e – – – 422,178 –
Net unrealised loss on financial futures contracts 2.h – – – – –
Options written contracts 2.f – – – – –
Due to shareholders 9,098 – 5,464 116,530 10,042
Bank overdraft ^ 15 195 – – 151,557 –
Due to brokers 26,240 322,684 – – –
Management and performance fees payable 4 11,874 13,682 13,029 103,144 248,126
Dividend distribution payable 18 3 – 42,789 32,526 –
Accounts payable and accrued expenses 33,605 28,287 24,502 89,567 304,889
total liabilities 81,015 364,653 85,784 915,502 563,057
net assets 9,367,721 21,133,349 10,330,349 83,565,800 252,015,137
**Jupiter Global Emerging Markets Unconstrained was launched on 9 March 2015. This Fund is not authorised in Hong Kong and not available to Hong Kong residents. ^Includes negative cash at brokers.
the accompanying notes form an integral part of these financial statements.
the jupiter global fund
Statement of Net Assets
■ Statement of net assets as at 30 September 2015 (continued)
20
the jupiter global fund
Statement of Net Assets
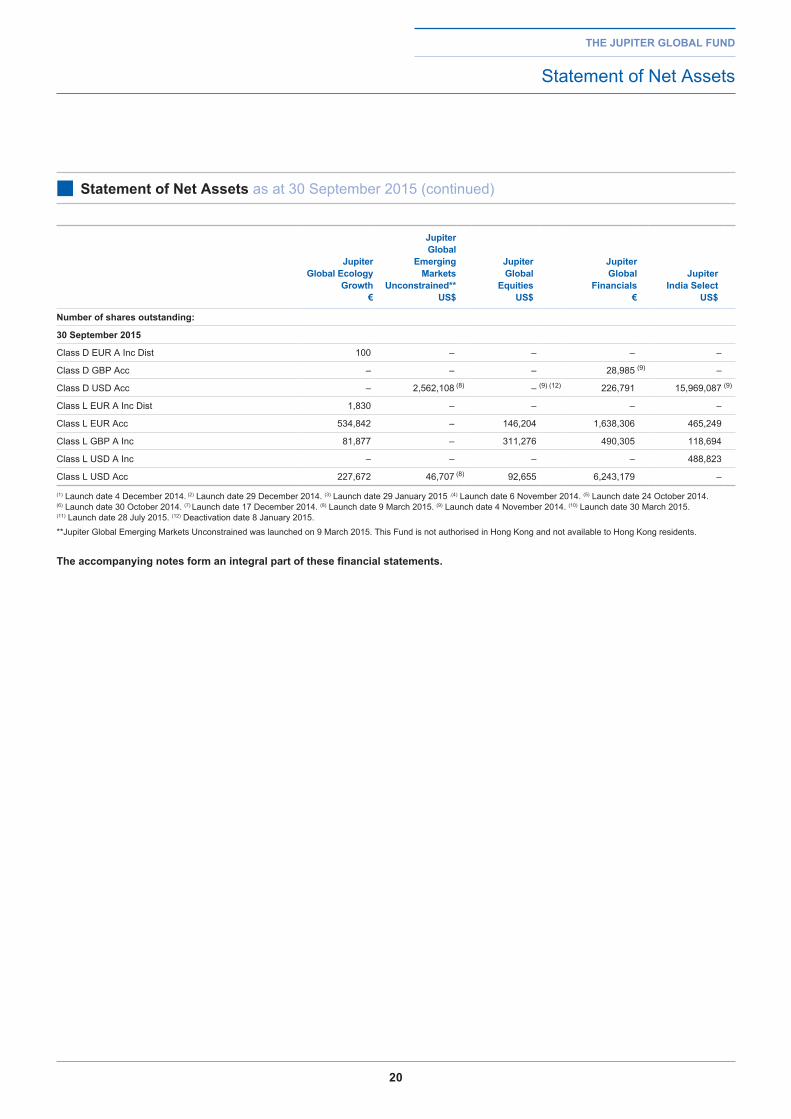
■ Statement of net assets as at 30 September 2015 (continued)
jupiter global ecology
growth €
jupiter global
emerging Markets
unconstrained** uS$
jupiter global
equities uS$
jupiter global
financials €
jupiter india Select
uS$
number of shares outstanding:
30 September 2015
Class D EUR A Inc Dist 100 – – – –
Class D GBP Acc – – – 28,985 (9) –
Class D USD Acc – 2,562,108 (8) – (9) (12) 226,791 15,969,087 (9)
Class L EUR A Inc Dist 1,830 – – – –
Class L EUR Acc 534,842 – 146,204 1,638,306 465,249
Class L GBP A Inc 81,877 – 311,276 490,305 118,694
Class L USD A Inc – – – – 488,823
Class L USD Acc 227,672 46,707 (8) 92,655 6,243,179 –
(1) Launch date 4 December 2014. (2) Launch date 29 December 2014. (3) Launch date 29 January 2015 .(4) Launch date 6 November 2014. (5) Launch date 24 October 2014. (6) Launch date 30 October 2014. (7) Launch date 17 December 2014. (8) Launch date 9 March 2015. (9) Launch date 4 November 2014. (10) Launch date 30 March 2015. (11) Launch date 28 July 2015. (12) Deactivation date 8 January 2015. **Jupiter Global Emerging Markets Unconstrained was launched on 9 March 2015. This Fund is not authorised in Hong Kong and not available to Hong Kong residents.
the accompanying notes form an integral part of these financial statements.
21
the jupiter global fund
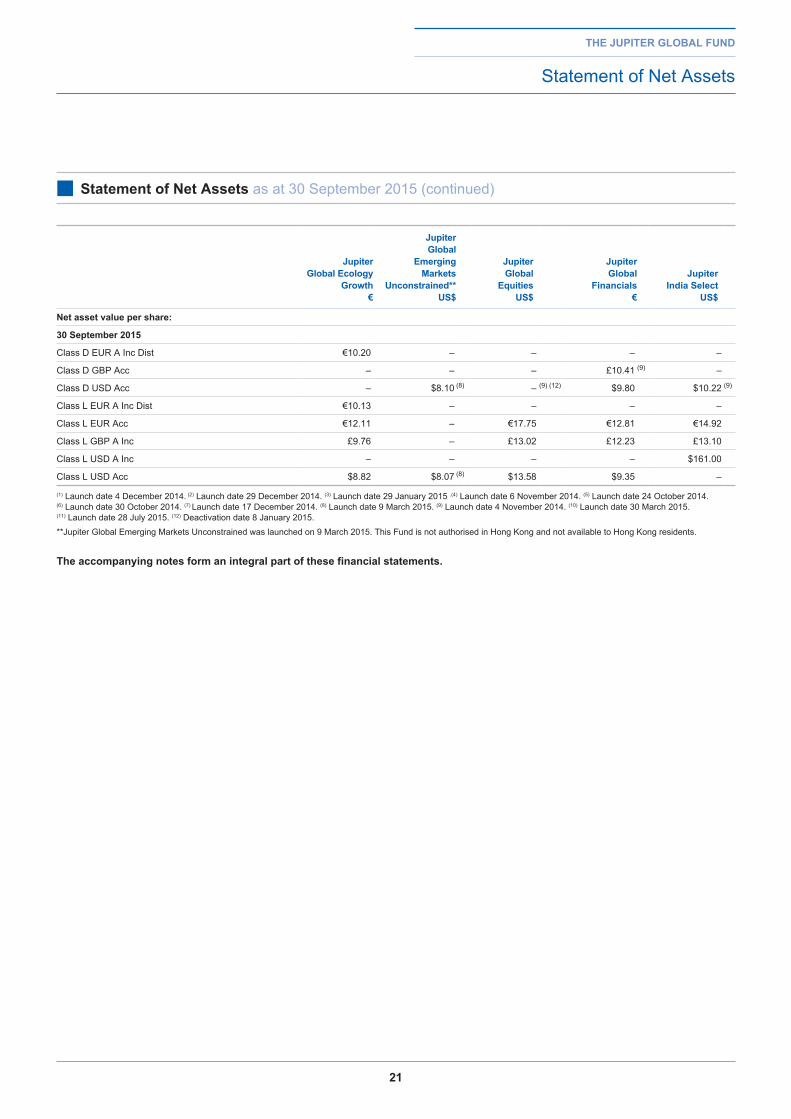
Statement of Net Assets
■ Statement of net assets as at 30 September 2015 (continued)
jupiter global ecology
growth €
jupiter global
emerging Markets
unconstrained** uS$
jupiter global
equities uS$
jupiter global
financials €
jupiter india Select
uS$
net asset value per share:
30 September 2015
Class D EUR A Inc Dist €10.20 – – – –
Class D GBP Acc – – – £10.41 (9) –
Class D USD Acc – $8.10 (8) – (9) (12) $9.80 $10.22 (9)
Class L EUR A Inc Dist €10.13 – – – –
Class L EUR Acc €12.11 – €17.75 €12.81 €14.92
Class L GBP A Inc £9.76 – £13.02 £12.23 £13.10
Class L USD A Inc – – – – $161.00
Class L USD Acc $8.82 $8.07 (8) $13.58 $9.35 –
(1) Launch date 4 December 2014. (2) Launch date 29 December 2014. (3) Launch date 29 January 2015 .(4) Launch date 6 November 2014. (5) Launch date 24 October 2014. (6) Launch date 30 October 2014. (7) Launch date 17 December 2014. (8) Launch date 9 March 2015. (9) Launch date 4 November 2014. (10) Launch date 30 March 2015. (11) Launch date 28 July 2015. (12) Deactivation date 8 January 2015. **Jupiter Global Emerging Markets Unconstrained was launched on 9 March 2015. This Fund is not authorised in Hong Kong and not available to Hong Kong residents.
the accompanying notes form an integral part of these financial statements.
22
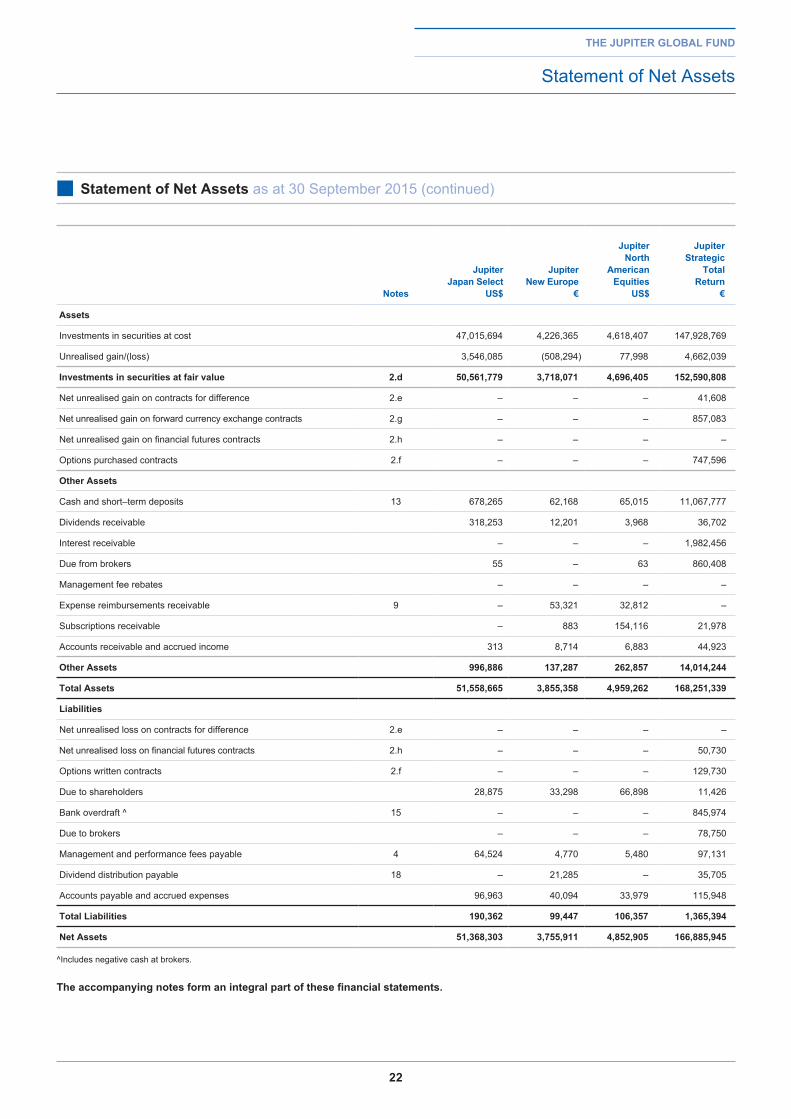
notes
jupiter japan Select
uS$
jupiter new europe
€
jupiter north
american equities
uS$
jupiter Strategic
total return
€
assets
Investments in securities at cost 47,015,694 4,226,365 4,618,407 147,928,769
Unrealised gain/(loss) 3,546,085 (508,294) 77,998 4,662,039
investments in securities at fair value 2.d 50,561,779 3,718,071 4,696,405 152,590,808
Net unrealised gain on contracts for difference 2.e – – – 41,608
Net unrealised gain on forward currency exchange contracts 2.g – – – 857,083
Net unrealised gain on financial futures contracts 2.h – – – –
Options purchased contracts 2.f – – – 747,596
other assets
Cash and short–term deposits 13 678,265 62,168 65,015 11,067,777
Dividends receivable 318,253 12,201 3,968 36,702
Interest receivable – – – 1,982,456
Due from brokers 55 – 63 860,408
Management fee rebates – – – –
Expense reimbursements receivable 9 – 53,321 32,812 –
Subscriptions receivable – 883 154,116 21,978
Accounts receivable and accrued income 313 8,714 6,883 44,923
other assets 996,886 137,287 262,857 14,014,244
total assets 51,558,665 3,855,358 4,959,262 168,251,339
liabilities
Net unrealised loss on contracts for difference 2.e – – – –
Net unrealised loss on financial futures contracts 2.h – – – 50,730
Options written contracts 2.f – – – 129,730
Due to shareholders 28,875 33,298 66,898 11,426
Bank overdraft ^ 15 – – – 845,974
Due to brokers – – – 78,750
Management and performance fees payable 4 64,524 4,770 5,480 97,131
Dividend distribution payable 18 – 21,285 – 35,705
Accounts payable and accrued expenses 96,963 40,094 33,979 115,948
total liabilities 190,362 99,447 106,357 1,365,394
net assets 51,368,303 3,755,911 4,852,905 166,885,945
^Includes negative cash at brokers.
the accompanying notes form an integral part of these financial statements.
the jupiter global fund
Statement of Net Assets
■ Statement of net assets as at 30 September 2015 (continued)
23
the jupiter global fund
Statement of Net Assets
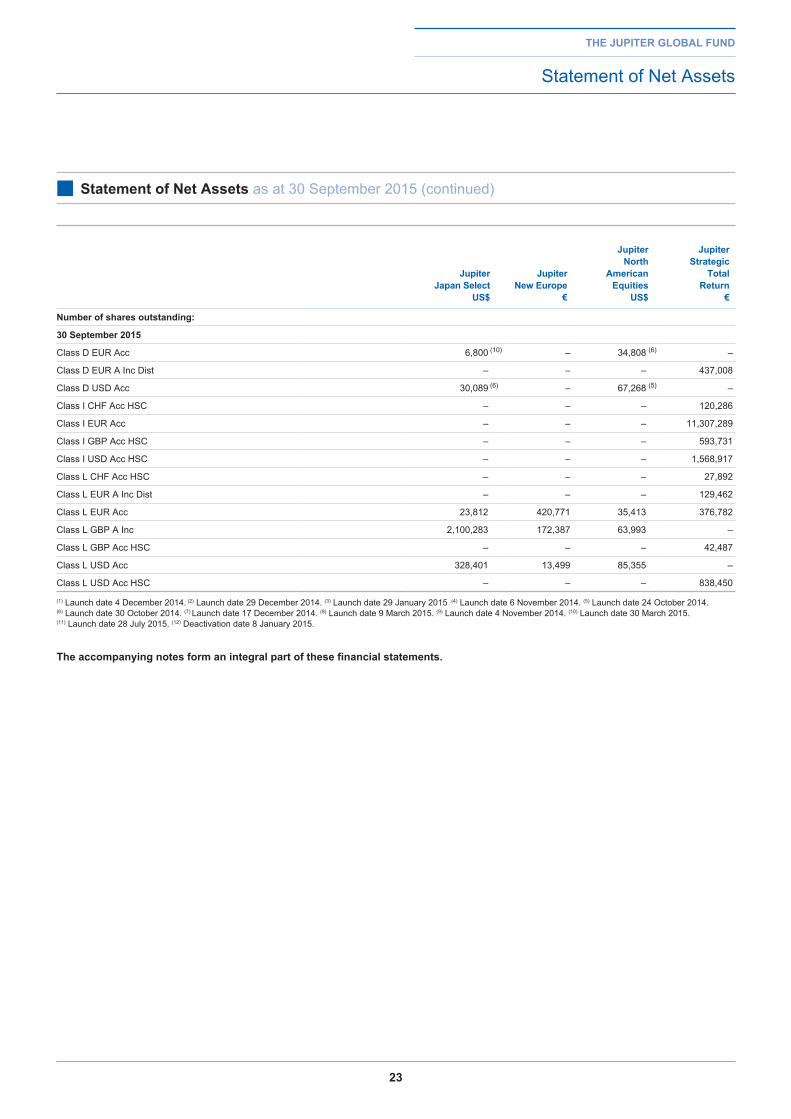
■ Statement of net assets as at 30 September 2015 (continued)
jupiter japan Select
uS$
jupiter new europe
€
jupiter north
american equities
uS$
jupiter Strategic
total return
€
number of shares outstanding:
30 September 2015
Class D EUR Acc 6,800 (10) – 34,808 (6) –
Class D EUR A Inc Dist – – – 437,008
Class D USD Acc 30,089 (6) – 67,268 (5) –
Class I CHF Acc HSC – – – 120,286
Class I EUR Acc – – – 11,307,289
Class I GBP Acc HSC – – – 593,731
Class I USD Acc HSC – – – 1,568,917
Class L CHF Acc HSC – – – 27,892
Class L EUR A Inc Dist – – – 129,462
Class L EUR Acc 23,812 420,771 35,413 376,782
Class L GBP A Inc 2,100,283 172,387 63,993 –
Class L GBP Acc HSC – – – 42,487
Class L USD Acc 328,401 13,499 85,355 –
Class L USD Acc HSC – – – 838,450
(1) Launch date 4 December 2014. (2) Launch date 29 December 2014. (3) Launch date 29 January 2015 .(4) Launch date 6 November 2014. (5) Launch date 24 October 2014. (6) Launch date 30 October 2014. (7) Launch date 17 December 2014. (8) Launch date 9 March 2015. (9) Launch date 4 November 2014. (10) Launch date 30 March 2015. (11) Launch date 28 July 2015. (12) Deactivation date 8 January 2015.
the accompanying notes form an integral part of these financial statements.
24
the jupiter global fund
Statement of Net Assets
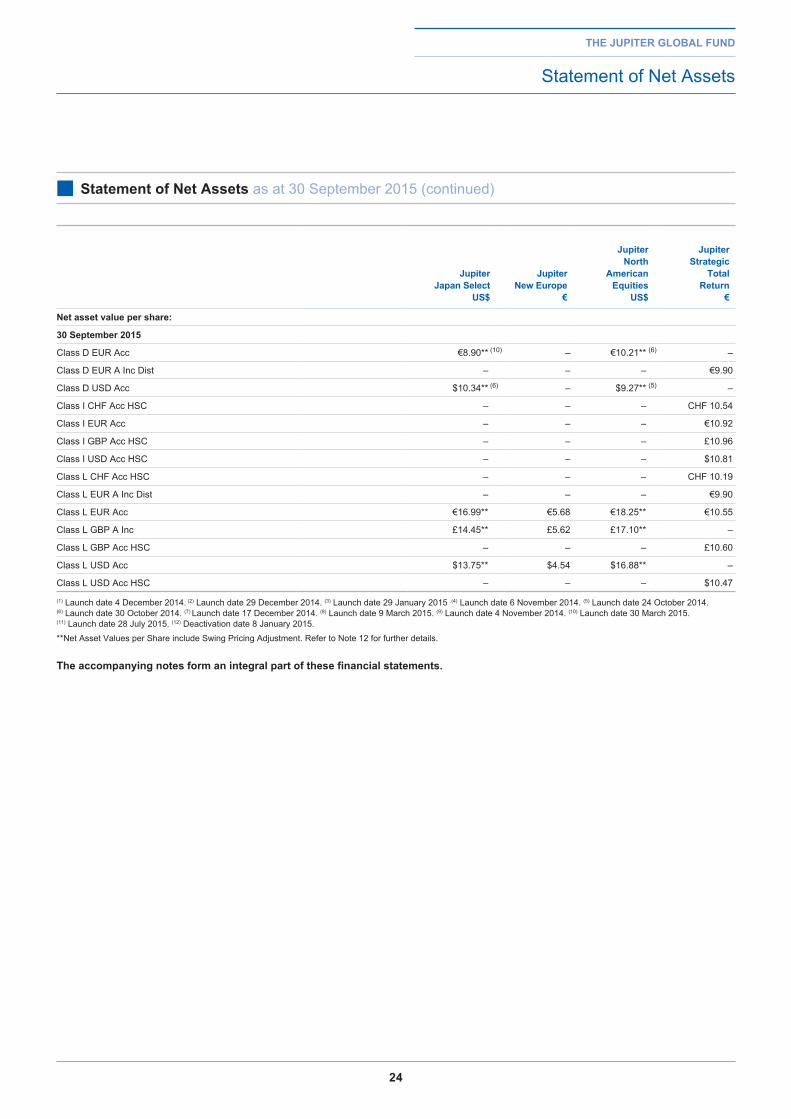
■ Statement of net assets as at 30 September 2015 (continued)
jupiter japan Select
uS$
jupiter new europe
€
jupiter north
american equities
uS$
jupiter Strategic
total return
€
net asset value per share:
30 September 2015
Class D EUR Acc €8.90** (10) – €10.21** (6) –
Class D EUR A Inc Dist – – – €9.90
Class D USD Acc $10.34** (6) – $9.27** (5) –
Class I CHF Acc HSC – – – CHF 10.54
Class I EUR Acc – – – €10.92
Class I GBP Acc HSC – – – £10.96
Class I USD Acc HSC – – – $10.81
Class L CHF Acc HSC – – – CHF 10.19
Class L EUR A Inc Dist – – – €9.90
Class L EUR Acc €16.99** €5.68 €18.25** €10.55
Class L GBP A Inc £14.45** £5.62 £17.10** –
Class L GBP Acc HSC – – – £10.60
Class L USD Acc $13.75** $4.54 $16.88** –
Class L USD Acc HSC – – – $10.47
(1) Launch date 4 December 2014. (2) Launch date 29 December 2014. (3) Launch date 29 January 2015 .(4) Launch date 6 November 2014. (5) Launch date 24 October 2014. (6) Launch date 30 October 2014. (7) Launch date 17 December 2014. (8) Launch date 9 March 2015. (9) Launch date 4 November 2014. (10) Launch date 30 March 2015. (11) Launch date 28 July 2015. (12) Deactivation date 8 January 2015. **Net Asset Values per Share include Swing Pricing Adjustment. Refer to Note 12 for further details.
the accompanying notes form an integral part of these financial statements.
25
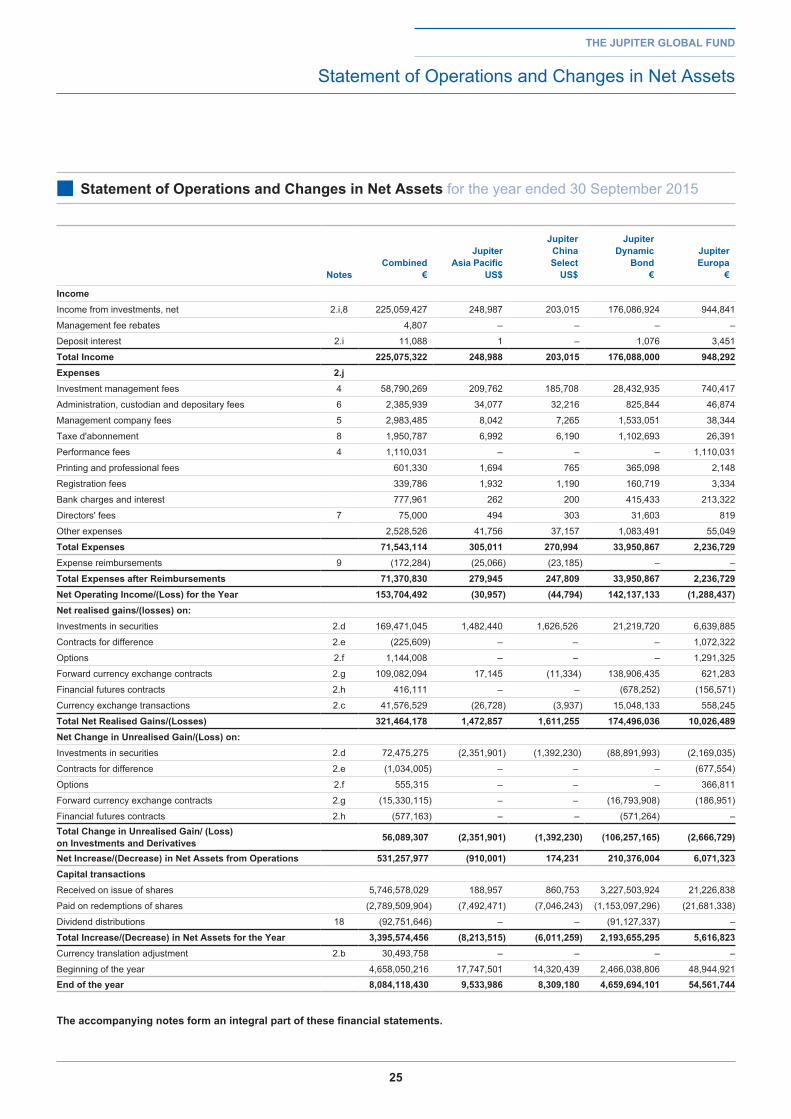
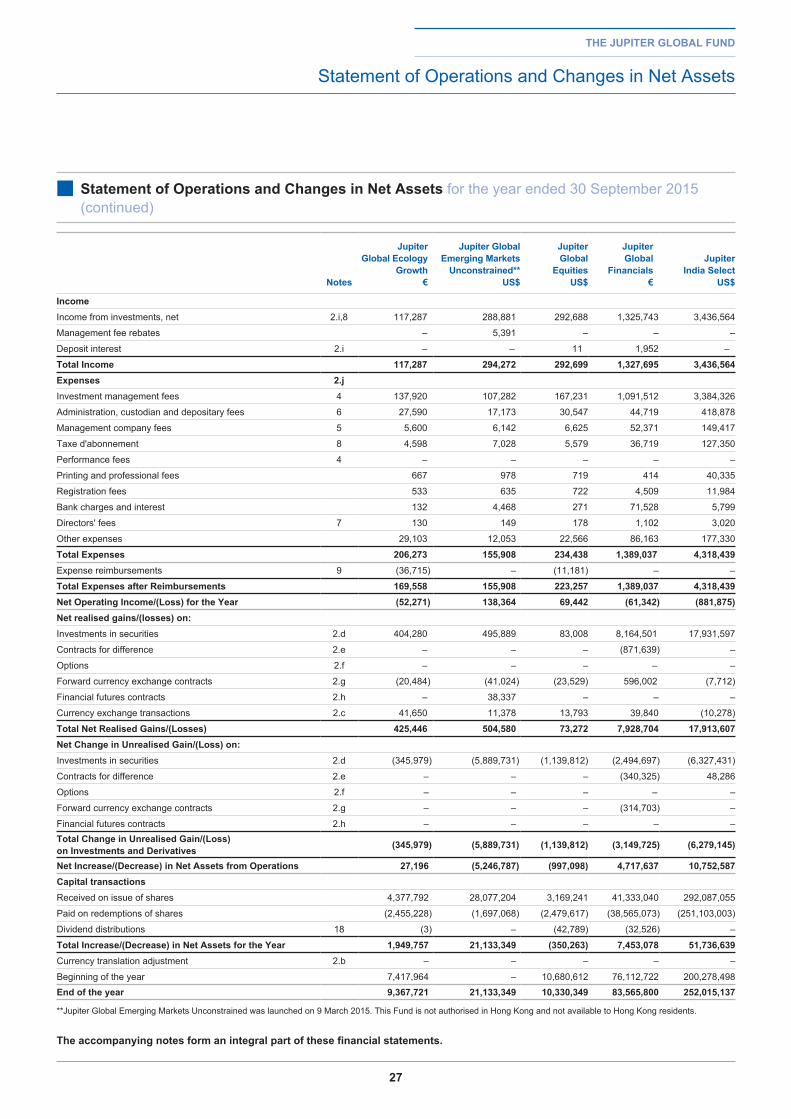
■ Statement of operations and Changes in net assets for the year ended 30 September 2015
notesCombined
€
jupiterasia pacific
uS$
jupiter China Select
uS$
jupiter dynamic
bond €
jupiter europa
€
incomeIncome from investments, net 2.i,8 225,059,427 248,987 203,015 176,086,924 944,841
Management fee rebates 4,807 – – – –
Deposit interest 2.i 11,088 1 – 1,076 3,451
total income 225,075,322 248,988 203,015 176,088,000 948,292 expenses 2.jInvestment management fees 4 58,790,269 209,762 185,708 28,432,935 740,417
Administration, custodian and depositary fees 6 2,385,939 34,077 32,216 825,844 46,874
Management company fees 5 2,983,485 8,042 7,265 1,533,051 38,344
Taxe d'abonnement 8 1,950,787 6,992 6,190 1,102,693 26,391
Performance fees 4 1,110,031 – – – 1,110,031
Printing and professional fees 601,330 1,694 765 365,098 2,148
Registration fees 339,786 1,932 1,190 160,719 3,334
Bank charges and interest 777,961 262 200 415,433 213,322
Directors' fees 7 75,000 494 303 31,603 819
Other expenses 2,528,526 41,756 37,157 1,083,491 55,049
total expenses 71,543,114 305,011 270,994 33,950,867 2,236,729 Expense reimbursements 9 (172,284) (25,066) (23,185) – –
total expenses after reimbursements 71,370,830 279,945 247,809 33,950,867 2,236,729 net operating income/(loss) for the Year 153,704,492 (30,957) (44,794) 142,137,133 (1,288,437)net realised gains/(losses) on:Investments in securities 2.d 169,471,045 1,482,440 1,626,526 21,219,720 6,639,885
Contracts for difference 2.e (225,609) – – – 1,072,322
Options 2.f 1,144,008 – – – 1,291,325
Forward currency exchange contracts 2.g 109,082,094 17,145 (11,334) 138,906,435 621,283
Financial futures contracts 2.h 416,111 – – (678,252) (156,571)
Currency exchange transactions 2.c 41,576,529 (26,728) (3,937) 15,048,133 558,245
total net realised gains/(losses) 321,464,178 1,472,857 1,611,255 174,496,036 10,026,489 net Change in unrealised gain/(loss) on:Investments in securities 2.d 72,475,275 (2,351,901) (1,392,230) (88,891,993) (2,169,035)
Contracts for difference 2.e (1,034,005) – – – (677,554)
Options 2.f 555,315 – – – 366,811
Forward currency exchange contracts 2.g (15,330,115) – – (16,793,908) (186,951)
Financial futures contracts 2.h (577,163) – – (571,264) – total Change in unrealised gain/ (loss) on investments and derivatives 56,089,307 (2,351,901) (1,392,230) (106,257,165) (2,666,729)
net increase/(decrease) in net assets from operations 531,257,977 (910,001) 174,231 210,376,004 6,071,323 Capital transactionsReceived on issue of shares 5,746,578,029 188,957 860,753 3,227,503,924 21,226,838
Paid on redemptions of shares (2,789,509,904) (7,492,471) (7,046,243) (1,153,097,296) (21,681,338)
Dividend distributions 18 (92,751,646) – – (91,127,337) –
total increase/(decrease) in net assets for the Year 3,395,574,456 (8,213,515) (6,011,259) 2,193,655,295 5,616,823 Currency translation adjustment 2.b 30,493,758 – – – –
Beginning of the year 4,658,050,216 17,747,501 14,320,439 2,466,038,806 48,944,921 end of the year 8,084,118,430 9,533,986 8,309,180 4,659,694,101 54,561,744
the accompanying notes form an integral part of these financial statements.
the jupiter global fund
Statement of Operations and Changes in Net Assets
26
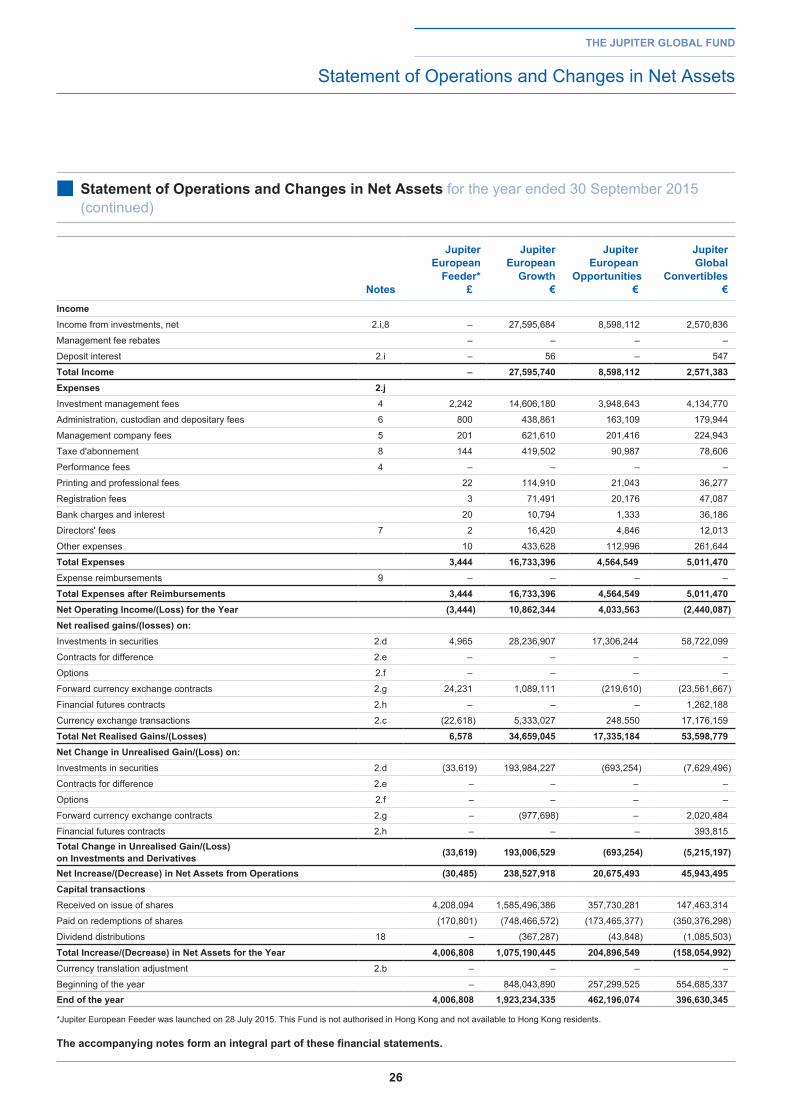
■ Statement of operations and Changes in net assets for the year ended 30 September 2015 (continued)
the jupiter global fund
Statement of Operations and Changes in Net Assets
notes
jupiter european
feeder* £
jupiter european
growth €
jupiter european
opportunities €
jupiter global
Convertibles €
incomeIncome from investments, net 2.i,8 – 27,595,684 8,598,112 2,570,836
Management fee rebates – – – –
Deposit interest 2.i – 56 – 547
total income – 27,595,740 8,598,112 2,571,383 expenses 2.jInvestment management fees 4 2,242 14,606,180 3,948,643 4,134,770
Administration, custodian and depositary fees 6 800 438,861 163,109 179,944
Management company fees 5 201 621,610 201,416 224,943
Taxe d'abonnement 8 144 419,502 90,987 78,606
Performance fees 4 – – – –
Printing and professional fees 22 114,910 21,043 36,277
Registration fees 3 71,491 20,176 47,087
Bank charges and interest 20 10,794 1,333 36,186
Directors' fees 7 2 16,420 4,846 12,013
Other expenses 10 433,628 112,996 261,644
total expenses 3,444 16,733,396 4,564,549 5,011,470 Expense reimbursements 9 – – – –
total expenses after reimbursements 3,444 16,733,396 4,564,549 5,011,470 net operating income/(loss) for the Year (3,444) 10,862,344 4,033,563 (2,440,087)net realised gains/(losses) on:Investments in securities 2.d 4,965 28,236,907 17,306,244 58,722,099
Contracts for difference 2.e – – – –
Options 2.f – – – –
Forward currency exchange contracts 2.g 24,231 1,089,111 (219,610) (23,561,667)
Financial futures contracts 2.h – – – 1,262,188
Currency exchange transactions 2.c (22,618) 5,333,027 248,550 17,176,159
total net realised gains/(losses) 6,578 34,659,045 17,335,184 53,598,779 net Change in unrealised gain/(loss) on:Investments in securities 2.d (33,619) 193,984,227 (693,254) (7,629,496)
Contracts for difference 2.e – – – –
Options 2.f – – – –
Forward currency exchange contracts 2.g – (977,698) – 2,020,484
Financial futures contracts 2.h – – – 393,815 total Change in unrealised gain/(loss) on investments and derivatives (33,619) 193,006,529 (693,254) (5,215,197)
net increase/(decrease) in net assets from operations (30,485) 238,527,918 20,675,493 45,943,495 Capital transactionsReceived on issue of shares 4,208,094 1,585,496,386 357,730,281 147,463,314
Paid on redemptions of shares (170,801) (748,466,572) (173,465,377) (350,376,298)
Dividend distributions 18 – (367,287) (43,848) (1,085,503)
total increase/(decrease) in net assets for the Year 4,006,808 1,075,190,445 204,896,549 (158,054,992)Currency translation adjustment 2.b – – – –
Beginning of the year – 848,043,890 257,299,525 554,685,337 end of the year 4,006,808 1,923,234,335 462,196,074 396,630,345
*Jupiter European Feeder was launched on 28 July 2015. This Fund is not authorised in Hong Kong and not available to Hong Kong residents.
the accompanying notes form an integral part of these financial statements.
27
the jupiter global fund
Statement of Operations and Changes in Net Assets
■ Statement of operations and Changes in net assets for the year ended 30 September 2015 (continued)
notes
jupiter global ecology
growth €
jupiter global emerging Markets
unconstrained** uS$
jupiter global
equities uS$
jupiter global
financials €
jupiter india Select
uS$
incomeIncome from investments, net 2.i,8 117,287 288,881 292,688 1,325,743 3,436,564
Management fee rebates – 5,391 – – –
Deposit interest 2.i – – 11 1,952 –
total income 117,287 294,272 292,699 1,327,695 3,436,564 expenses 2.jInvestment management fees 4 137,920 107,282 167,231 1,091,512 3,384,326
Administration, custodian and depositary fees 6 27,590 17,173 30,547 44,719 418,878
Management company fees 5 5,600 6,142 6,625 52,371 149,417
Taxe d'abonnement 8 4,598 7,028 5,579 36,719 127,350
Performance fees 4 – – – – –
Printing and professional fees 667 978 719 414 40,335
Registration fees 533 635 722 4,509 11,984
Bank charges and interest 132 4,468 271 71,528 5,799
Directors' fees 7 130 149 178 1,102 3,020
Other expenses 29,103 12,053 22,566 86,163 177,330
total expenses 206,273 155,908 234,438 1,389,037 4,318,439 Expense reimbursements 9 (36,715) – (11,181) – –
total expenses after reimbursements 169,558 155,908 223,257 1,389,037 4,318,439 net operating income/(loss) for the Year (52,271) 138,364 69,442 (61,342) (881,875)net realised gains/(losses) on:Investments in securities 2.d 404,280 495,889 83,008 8,164,501 17,931,597
Contracts for difference 2.e – – – (871,639) –
Options 2.f – – – – –
Forward currency exchange contracts 2.g (20,484) (41,024) (23,529) 596,002 (7,712)
Financial futures contracts 2.h – 38,337 – – –
Currency exchange transactions 2.c 41,650 11,378 13,793 39,840 (10,278)
total net realised gains/(losses) 425,446 504,580 73,272 7,928,704 17,913,607 net Change in unrealised gain/(loss) on:Investments in securities 2.d (345,979) (5,889,731) (1,139,812) (2,494,697) (6,327,431)
Contracts for difference 2.e – – – (340,325) 48,286
Options 2.f – – – – –
Forward currency exchange contracts 2.g – – – (314,703) –
Financial futures contracts 2.h – – – – – total Change in unrealised gain/(loss) on investments and derivatives (345,979) (5,889,731) (1,139,812) (3,149,725) (6,279,145)
net increase/(decrease) in net assets from operations 27,196 (5,246,787) (997,098) 4,717,637 10,752,587 Capital transactionsReceived on issue of shares 4,377,792 28,077,204 3,169,241 41,333,040 292,087,055
Paid on redemptions of shares (2,455,228) (1,697,068) (2,479,617) (38,565,073) (251,103,003)
Dividend distributions 18 (3) – (42,789) (32,526) –
total increase/(decrease) in net assets for the Year 1,949,757 21,133,349 (350,263) 7,453,078 51,736,639 Currency translation adjustment 2.b – – – – –
Beginning of the year 7,417,964 – 10,680,612 76,112,722 200,278,498 end of the year 9,367,721 21,133,349 10,330,349 83,565,800 252,015,137
**Jupiter Global Emerging Markets Unconstrained was launched on 9 March 2015. This Fund is not authorised in Hong Kong and not available to Hong Kong residents.
the accompanying notes form an integral part of these financial statements.
28
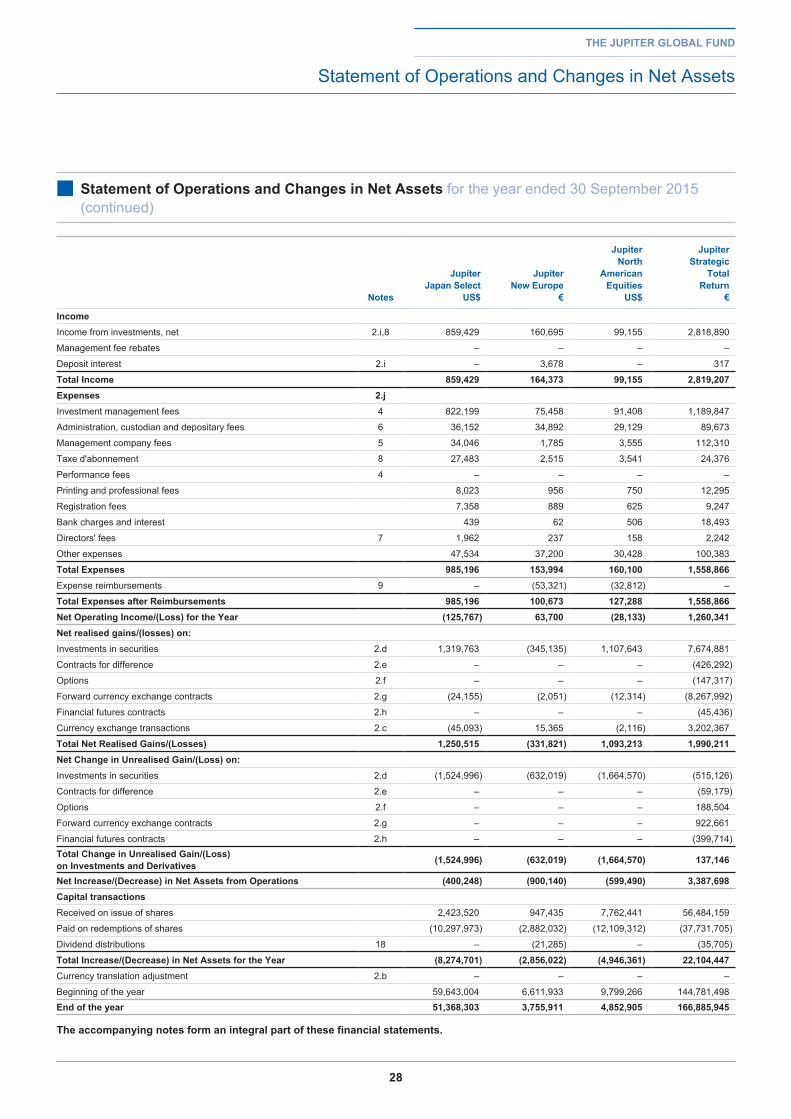
■ Statement of operations and Changes in net assets for the year ended 30 September 2015 (continued)
the jupiter global fund
Statement of Operations and Changes in Net Assets
notes
jupiter japan Select
uS$
jupiter new europe
€
jupiter north
american equities
uS$
jupiter Strategic
total return
€
incomeIncome from investments, net 2.i,8 859,429 160,695 99,155 2,818,890
Management fee rebates – – – –
Deposit interest 2.i – 3,678 – 317
total income 859,429 164,373 99,155 2,819,207 expenses 2.jInvestment management fees 4 822,199 75,458 91,408 1,189,847
Administration, custodian and depositary fees 6 36,152 34,892 29,129 89,673
Management company fees 5 34,046 1,785 3,555 112,310
Taxe d'abonnement 8 27,483 2,515 3,541 24,376
Performance fees 4 – – – –
Printing and professional fees 8,023 956 750 12,295
Registration fees 7,358 889 625 9,247
Bank charges and interest 439 62 506 18,493
Directors' fees 7 1,962 237 158 2,242
Other expenses 47,534 37,200 30,428 100,383
total expenses 985,196 153,994 160,100 1,558,866 Expense reimbursements 9 – (53,321) (32,812) –
total expenses after reimbursements 985,196 100,673 127,288 1,558,866 net operating income/(loss) for the Year (125,767) 63,700 (28,133) 1,260,341 net realised gains/(losses) on:Investments in securities 2.d 1,319,763 (345,135) 1,107,643 7,674,881
Contracts for difference 2.e – – – (426,292)
Options 2.f – – – (147,317)
Forward currency exchange contracts 2.g (24,155) (2,051) (12,314) (8,267,992)
Financial futures contracts 2.h – – – (45,436)
Currency exchange transactions 2.c (45,093) 15,365 (2,116) 3,202,367
total net realised gains/(losses) 1,250,515 (331,821) 1,093,213 1,990,211 net Change in unrealised gain/(loss) on:Investments in securities 2.d (1,524,996) (632,019) (1,664,570) (515,126)
Contracts for difference 2.e – – – (59,179)
Options 2.f – – – 188,504
Forward currency exchange contracts 2.g – – – 922,661
Financial futures contracts 2.h – – – (399,714)total Change in unrealised gain/(loss) on investments and derivatives (1,524,996) (632,019) (1,664,570) 137,146
net increase/(decrease) in net assets from operations (400,248) (900,140) (599,490) 3,387,698 Capital transactionsReceived on issue of shares 2,423,520 947,435 7,762,441 56,484,159
Paid on redemptions of shares (10,297,973) (2,882,032) (12,109,312) (37,731,705)
Dividend distributions 18 – (21,285) – (35,705)
total increase/(decrease) in net assets for the Year (8,274,701) (2,856,022) (4,946,361) 22,104,447 Currency translation adjustment 2.b – – – –
Beginning of the year 59,643,004 6,611,933 9,799,266 144,781,498 end of the year 51,368,303 3,755,911 4,852,905 166,885,945
the accompanying notes form an integral part of these financial statements.
29
the jupiter global fund
Statement of Changes in Shares Issued
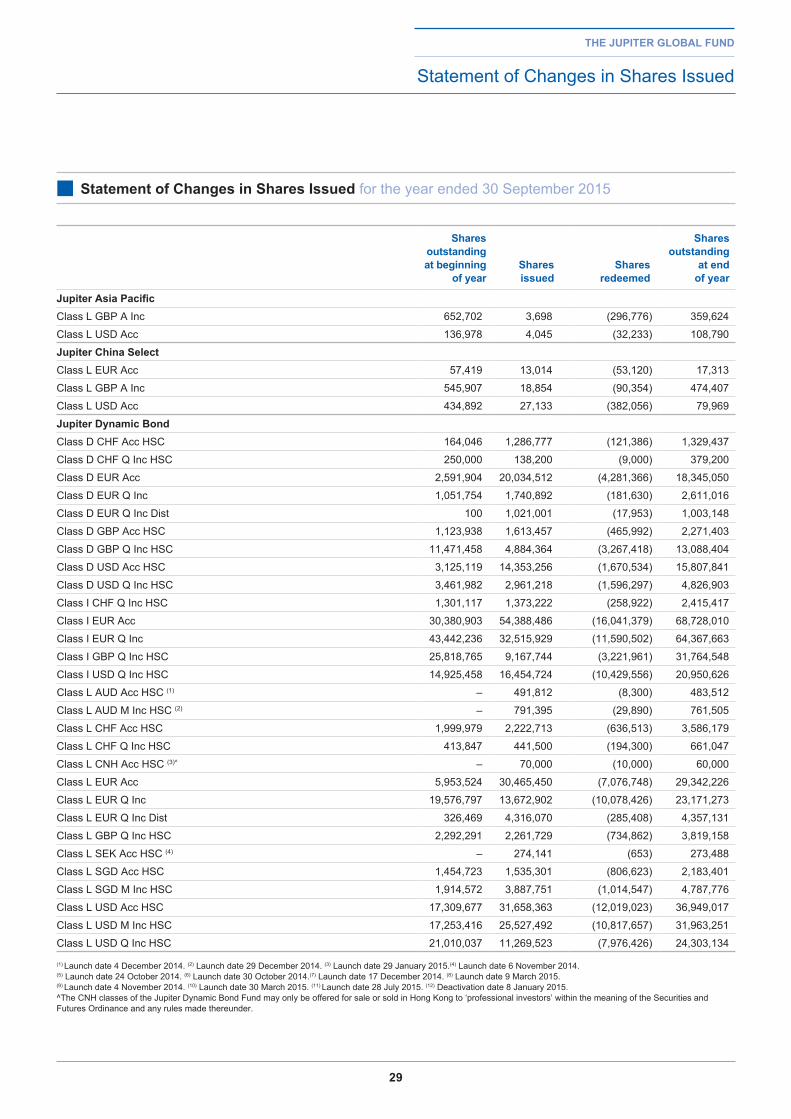
■ Statement of Changes in Shares issued for the year ended 30 September 2015
Shares outstanding
at beginning of year
Shares issued
Shares redeemed
Shares outstanding
at end of year
jupiter asia pacificClass L GBP A Inc 652,702 3,698 (296,776) 359,624
Class L USD Acc 136,978 4,045 (32,233) 108,790
jupiter China SelectClass L EUR Acc 57,419 13,014 (53,120) 17,313
Class L GBP A Inc 545,907 18,854 (90,354) 474,407
Class L USD Acc 434,892 27,133 (382,056) 79,969
jupiter dynamic bondClass D CHF Acc HSC 164,046 1,286,777 (121,386) 1,329,437
Class D CHF Q Inc HSC 250,000 138,200 (9,000) 379,200
Class D EUR Acc 2,591,904 20,034,512 (4,281,366) 18,345,050
Class D EUR Q Inc 1,051,754 1,740,892 (181,630) 2,611,016
Class D EUR Q Inc Dist 100 1,021,001 (17,953) 1,003,148
Class D GBP Acc HSC 1,123,938 1,613,457 (465,992) 2,271,403
Class D GBP Q Inc HSC 11,471,458 4,884,364 (3,267,418) 13,088,404
Class D USD Acc HSC 3,125,119 14,353,256 (1,670,534) 15,807,841
Class D USD Q Inc HSC 3,461,982 2,961,218 (1,596,297) 4,826,903
Class I CHF Q Inc HSC 1,301,117 1,373,222 (258,922) 2,415,417
Class I EUR Acc 30,380,903 54,388,486 (16,041,379) 68,728,010
Class I EUR Q Inc 43,442,236 32,515,929 (11,590,502) 64,367,663
Class I GBP Q Inc HSC 25,818,765 9,167,744 (3,221,961) 31,764,548
Class I USD Q Inc HSC 14,925,458 16,454,724 (10,429,556) 20,950,626
Class L AUD Acc HSC (1) – 491,812 (8,300) 483,512
Class L AUD M Inc HSC (2) – 791,395 (29,890) 761,505
Class L CHF Acc HSC 1,999,979 2,222,713 (636,513) 3,586,179
Class L CHF Q Inc HSC 413,847 441,500 (194,300) 661,047
Class L CNH Acc HSC (3)^ – 70,000 (10,000) 60,000
Class L EUR Acc 5,953,524 30,465,450 (7,076,748) 29,342,226
Class L EUR Q Inc 19,576,797 13,672,902 (10,078,426) 23,171,273
Class L EUR Q Inc Dist 326,469 4,316,070 (285,408) 4,357,131
Class L GBP Q Inc HSC 2,292,291 2,261,729 (734,862) 3,819,158
Class L SEK Acc HSC (4) – 274,141 (653) 273,488
Class L SGD Acc HSC 1,454,723 1,535,301 (806,623) 2,183,401
Class L SGD M Inc HSC 1,914,572 3,887,751 (1,014,547) 4,787,776
Class L USD Acc HSC 17,309,677 31,658,363 (12,019,023) 36,949,017
Class L USD M Inc HSC 17,253,416 25,527,492 (10,817,657) 31,963,251
Class L USD Q Inc HSC 21,010,037 11,269,523 (7,976,426) 24,303,134
(1) Launch date 4 December 2014. (2) Launch date 29 December 2014. (3) Launch date 29 January 2015.(4) Launch date 6 November 2014. (5) Launch date 24 October 2014. (6) Launch date 30 October 2014. (7) Launch date 17 December 2014. (8) Launch date 9 March 2015. (9) Launch date 4 November 2014. (10) Launch date 30 March 2015. (11) Launch date 28 July 2015. (12) Deactivation date 8 January 2015.^The CNH classes of the Jupiter Dynamic Bond Fund may only be offered for sale or sold in Hong Kong to ‘professional investors’ within the meaning of the Securities and Futures Ordinance and any rules made thereunder.
30
the jupiter global fund
Statement of Changes in Shares Issued
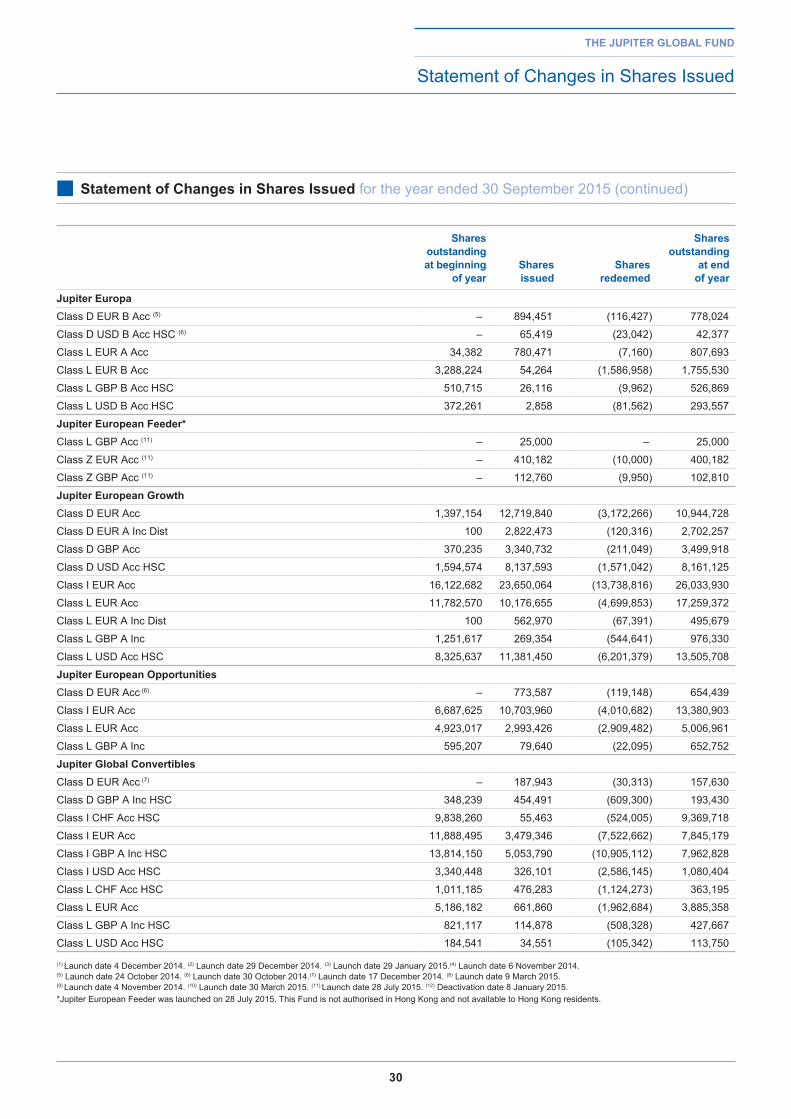
■ Statement of Changes in Shares issued for the year ended 30 September 2015 (continued)
Shares outstanding
at beginning of year
Shares issued
Shares redeemed
Shares outstanding
at end of year
jupiter europaClass D EUR B Acc (5) – 894,451 (116,427) 778,024
Class D USD B Acc HSC (6) – 65,419 (23,042) 42,377
Class L EUR A Acc 34,382 780,471 (7,160) 807,693
Class L EUR B Acc 3,288,224 54,264 (1,586,958) 1,755,530
Class L GBP B Acc HSC 510,715 26,116 (9,962) 526,869
Class L USD B Acc HSC 372,261 2,858 (81,562) 293,557
jupiter european feeder*Class L GBP Acc (11) – 25,000 – 25,000
Class Z EUR Acc (11) – 410,182 (10,000) 400,182
Class Z GBP Acc (11) – 112,760 (9,950) 102,810
jupiter european growthClass D EUR Acc 1,397,154 12,719,840 (3,172,266) 10,944,728
Class D EUR A Inc Dist 100 2,822,473 (120,316) 2,702,257
Class D GBP Acc 370,235 3,340,732 (211,049) 3,499,918
Class D USD Acc HSC 1,594,574 8,137,593 (1,571,042) 8,161,125
Class I EUR Acc 16,122,682 23,650,064 (13,738,816) 26,033,930
Class L EUR Acc 11,782,570 10,176,655 (4,699,853) 17,259,372
Class L EUR A Inc Dist 100 562,970 (67,391) 495,679
Class L GBP A Inc 1,251,617 269,354 (544,641) 976,330
Class L USD Acc HSC 8,325,637 11,381,450 (6,201,379) 13,505,708
jupiter european opportunitiesClass D EUR Acc (6) – 773,587 (119,148) 654,439
Class I EUR Acc 6,687,625 10,703,960 (4,010,682) 13,380,903
Class L EUR Acc 4,923,017 2,993,426 (2,909,482) 5,006,961
Class L GBP A Inc 595,207 79,640 (22,095) 652,752
jupiter global ConvertiblesClass D EUR Acc (7) – 187,943 (30,313) 157,630
Class D GBP A Inc HSC 348,239 454,491 (609,300) 193,430
Class I CHF Acc HSC 9,838,260 55,463 (524,005) 9,369,718
Class I EUR Acc 11,888,495 3,479,346 (7,522,662) 7,845,179
Class I GBP A Inc HSC 13,814,150 5,053,790 (10,905,112) 7,962,828
Class I USD Acc HSC 3,340,448 326,101 (2,586,145) 1,080,404
Class L CHF Acc HSC 1,011,185 476,283 (1,124,273) 363,195
Class L EUR Acc 5,186,182 661,860 (1,962,684) 3,885,358
Class L GBP A Inc HSC 821,117 114,878 (508,328) 427,667
Class L USD Acc HSC 184,541 34,551 (105,342) 113,750
(1) Launch date 4 December 2014. (2) Launch date 29 December 2014. (3) Launch date 29 January 2015.(4) Launch date 6 November 2014. (5) Launch date 24 October 2014. (6) Launch date 30 October 2014. (7) Launch date 17 December 2014. (8) Launch date 9 March 2015. (9) Launch date 4 November 2014. (10) Launch date 30 March 2015. (11) Launch date 28 July 2015. (12) Deactivation date 8 January 2015.*Jupiter European Feeder was launched on 28 July 2015. This Fund is not authorised in Hong Kong and not available to Hong Kong residents.
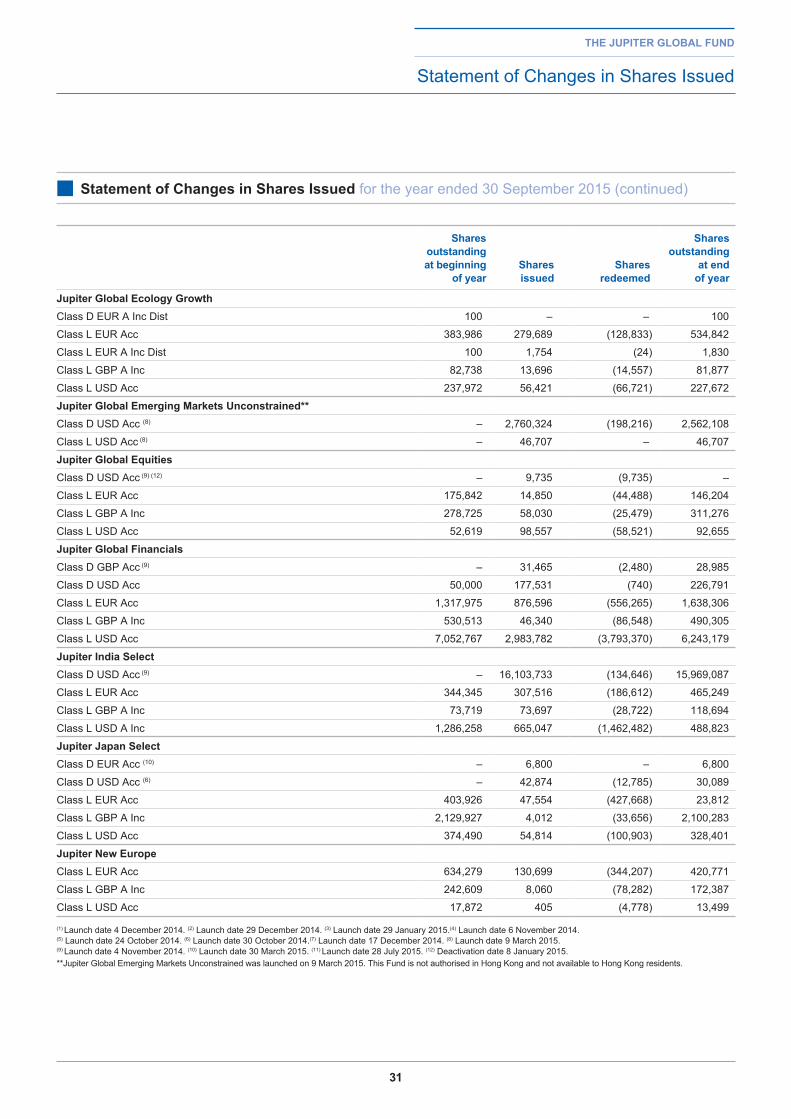
31
the jupiter global fund
Statement of Changes in Shares Issued
■ Statement of Changes in Shares issued for the year ended 30 September 2015 (continued)
Shares outstanding
at beginning of year
Shares issued
Shares redeemed
Shares outstanding
at end of year
jupiter global ecology growthClass D EUR A Inc Dist 100 – – 100
Class L EUR Acc 383,986 279,689 (128,833) 534,842
Class L EUR A Inc Dist 100 1,754 (24) 1,830
Class L GBP A Inc 82,738 13,696 (14,557) 81,877
Class L USD Acc 237,972 56,421 (66,721) 227,672
jupiter global emerging Markets unconstrained**Class D USD Acc (8) – 2,760,324 (198,216) 2,562,108
Class L USD Acc (8) – 46,707 – 46,707
jupiter global equitiesClass D USD Acc (9) (12) – 9,735 (9,735) –
Class L EUR Acc 175,842 14,850 (44,488) 146,204
Class L GBP A Inc 278,725 58,030 (25,479) 311,276
Class L USD Acc 52,619 98,557 (58,521) 92,655
jupiter global financialsClass D GBP Acc (9) – 31,465 (2,480) 28,985
Class D USD Acc 50,000 177,531 (740) 226,791
Class L EUR Acc 1,317,975 876,596 (556,265) 1,638,306
Class L GBP A Inc 530,513 46,340 (86,548) 490,305
Class L USD Acc 7,052,767 2,983,782 (3,793,370) 6,243,179
jupiter india SelectClass D USD Acc (9) – 16,103,733 (134,646) 15,969,087
Class L EUR Acc 344,345 307,516 (186,612) 465,249
Class L GBP A Inc 73,719 73,697 (28,722) 118,694
Class L USD A Inc 1,286,258 665,047 (1,462,482) 488,823
jupiter japan SelectClass D EUR Acc (10) – 6,800 – 6,800
Class D USD Acc (6) – 42,874 (12,785) 30,089
Class L EUR Acc 403,926 47,554 (427,668) 23,812
Class L GBP A Inc 2,129,927 4,012 (33,656) 2,100,283
Class L USD Acc 374,490 54,814 (100,903) 328,401
jupiter new europeClass L EUR Acc 634,279 130,699 (344,207) 420,771
Class L GBP A Inc 242,609 8,060 (78,282) 172,387
Class L USD Acc 17,872 405 (4,778) 13,499
(1) Launch date 4 December 2014. (2) Launch date 29 December 2014. (3) Launch date 29 January 2015.(4) Launch date 6 November 2014. (5) Launch date 24 October 2014. (6) Launch date 30 October 2014. (7) Launch date 17 December 2014. (8) Launch date 9 March 2015. (9) Launch date 4 November 2014. (10) Launch date 30 March 2015. (11) Launch date 28 July 2015. (12) Deactivation date 8 January 2015.**Jupiter Global Emerging Markets Unconstrained was launched on 9 March 2015. This Fund is not authorised in Hong Kong and not available to Hong Kong residents.
32
the jupiter global fund
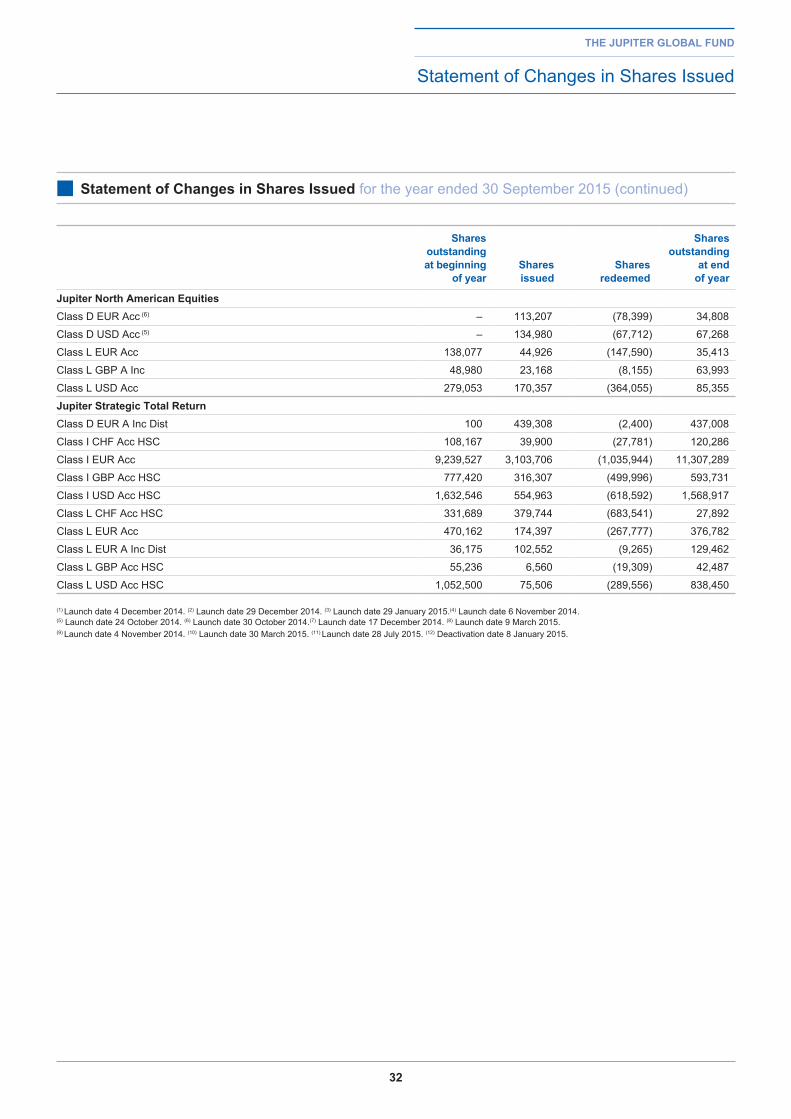
Statement of Changes in Shares Issued
■ Statement of Changes in Shares issued for the year ended 30 September 2015 (continued)
Shares outstanding
at beginning of year
Shares issued
Shares redeemed
Shares outstanding
at end of year
jupiter north american equitiesClass D EUR Acc (6) – 113,207 (78,399) 34,808
Class D USD Acc (5) – 134,980 (67,712) 67,268
Class L EUR Acc 138,077 44,926 (147,590) 35,413
Class L GBP A Inc 48,980 23,168 (8,155) 63,993
Class L USD Acc 279,053 170,357 (364,055) 85,355
jupiter Strategic total returnClass D EUR A Inc Dist 100 439,308 (2,400) 437,008
Class I CHF Acc HSC 108,167 39,900 (27,781) 120,286
Class I EUR Acc 9,239,527 3,103,706 (1,035,944) 11,307,289
Class I GBP Acc HSC 777,420 316,307 (499,996) 593,731
Class I USD Acc HSC 1,632,546 554,963 (618,592) 1,568,917
Class L CHF Acc HSC 331,689 379,744 (683,541) 27,892
Class L EUR Acc 470,162 174,397 (267,777) 376,782
Class L EUR A Inc Dist 36,175 102,552 (9,265) 129,462
Class L GBP Acc HSC 55,236 6,560 (19,309) 42,487
Class L USD Acc HSC 1,052,500 75,506 (289,556) 838,450
(1) Launch date 4 December 2014. (2) Launch date 29 December 2014. (3) Launch date 29 January 2015.(4) Launch date 6 November 2014. (5) Launch date 24 October 2014. (6) Launch date 30 October 2014. (7) Launch date 17 December 2014. (8) Launch date 9 March 2015. (9) Launch date 4 November 2014. (10) Launch date 30 March 2015. (11) Launch date 28 July 2015. (12) Deactivation date 8 January 2015.
33
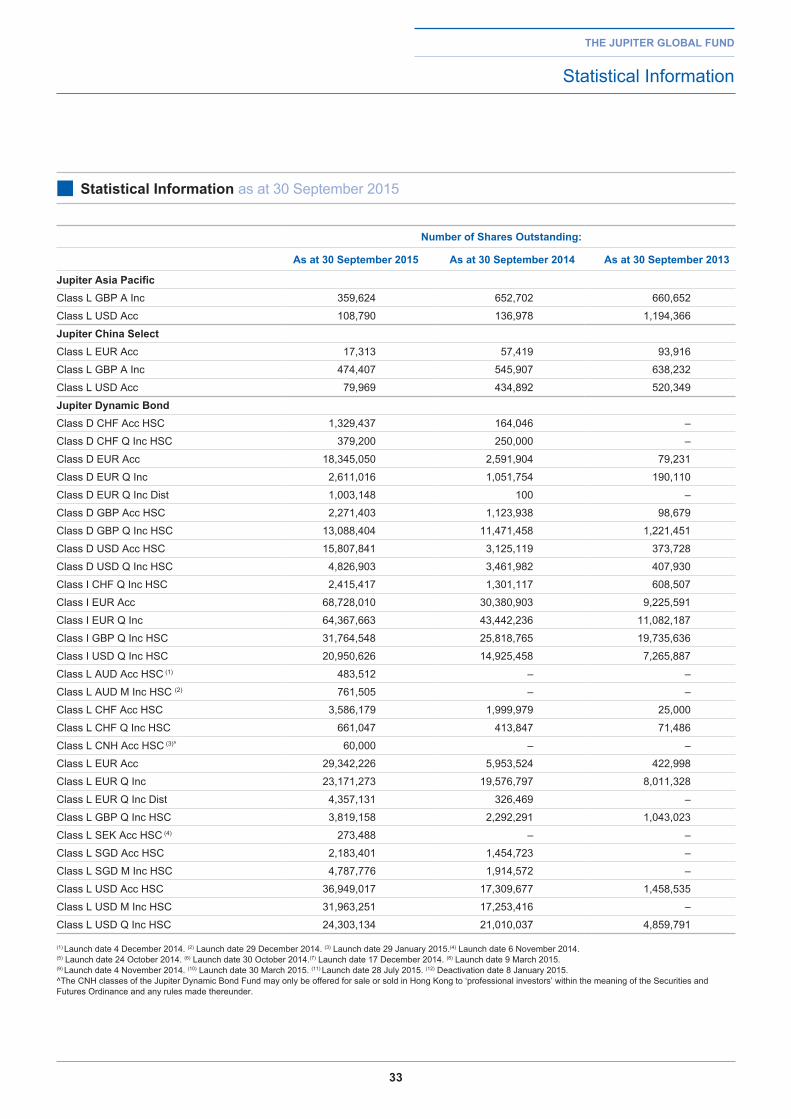
the jupiter global fund
Statistical Information
■ Statistical information as at 30 September 2015
number of Shares outstanding:
as at 30 September 2015 as at 30 September 2014 as at 30 September 2013
jupiter asia pacific Class L GBP A Inc 359,624 652,702 660,652
Class L USD Acc 108,790 136,978 1,194,366
jupiter China SelectClass L EUR Acc 17,313 57,419 93,916
Class L GBP A Inc 474,407 545,907 638,232
Class L USD Acc 79,969 434,892 520,349
jupiter dynamic bond Class D CHF Acc HSC 1,329,437 164,046 –
Class D CHF Q Inc HSC 379,200 250,000 –
Class D EUR Acc 18,345,050 2,591,904 79,231
Class D EUR Q Inc 2,611,016 1,051,754 190,110
Class D EUR Q Inc Dist 1,003,148 100 –
Class D GBP Acc HSC 2,271,403 1,123,938 98,679
Class D GBP Q Inc HSC 13,088,404 11,471,458 1,221,451
Class D USD Acc HSC 15,807,841 3,125,119 373,728
Class D USD Q Inc HSC 4,826,903 3,461,982 407,930
Class I CHF Q Inc HSC 2,415,417 1,301,117 608,507
Class I EUR Acc 68,728,010 30,380,903 9,225,591
Class I EUR Q Inc 64,367,663 43,442,236 11,082,187
Class I GBP Q Inc HSC 31,764,548 25,818,765 19,735,636
Class I USD Q Inc HSC 20,950,626 14,925,458 7,265,887
Class L AUD Acc HSC (1) 483,512 – –
Class L AUD M Inc HSC (2) 761,505 – –
Class L CHF Acc HSC 3,586,179 1,999,979 25,000
Class L CHF Q Inc HSC 661,047 413,847 71,486
Class L CNH Acc HSC (3)^ 60,000 – –
Class L EUR Acc 29,342,226 5,953,524 422,998
Class L EUR Q Inc 23,171,273 19,576,797 8,011,328
Class L EUR Q Inc Dist 4,357,131 326,469 –
Class L GBP Q Inc HSC 3,819,158 2,292,291 1,043,023
Class L SEK Acc HSC (4) 273,488 – –
Class L SGD Acc HSC 2,183,401 1,454,723 –
Class L SGD M Inc HSC 4,787,776 1,914,572 –
Class L USD Acc HSC 36,949,017 17,309,677 1,458,535
Class L USD M Inc HSC 31,963,251 17,253,416 –
Class L USD Q Inc HSC 24,303,134 21,010,037 4,859,791
(1) Launch date 4 December 2014. (2) Launch date 29 December 2014. (3) Launch date 29 January 2015.(4) Launch date 6 November 2014. (5) Launch date 24 October 2014. (6) Launch date 30 October 2014. (7) Launch date 17 December 2014. (8) Launch date 9 March 2015. (9) Launch date 4 November 2014. (10) Launch date 30 March 2015. (11) Launch date 28 July 2015. (12) Deactivation date 8 January 2015.^The CNH classes of the Jupiter Dynamic Bond Fund may only be offered for sale or sold in Hong Kong to ‘professional investors’ within the meaning of the Securities and Futures Ordinance and any rules made thereunder.
34
the jupiter global fund
Statistical Information
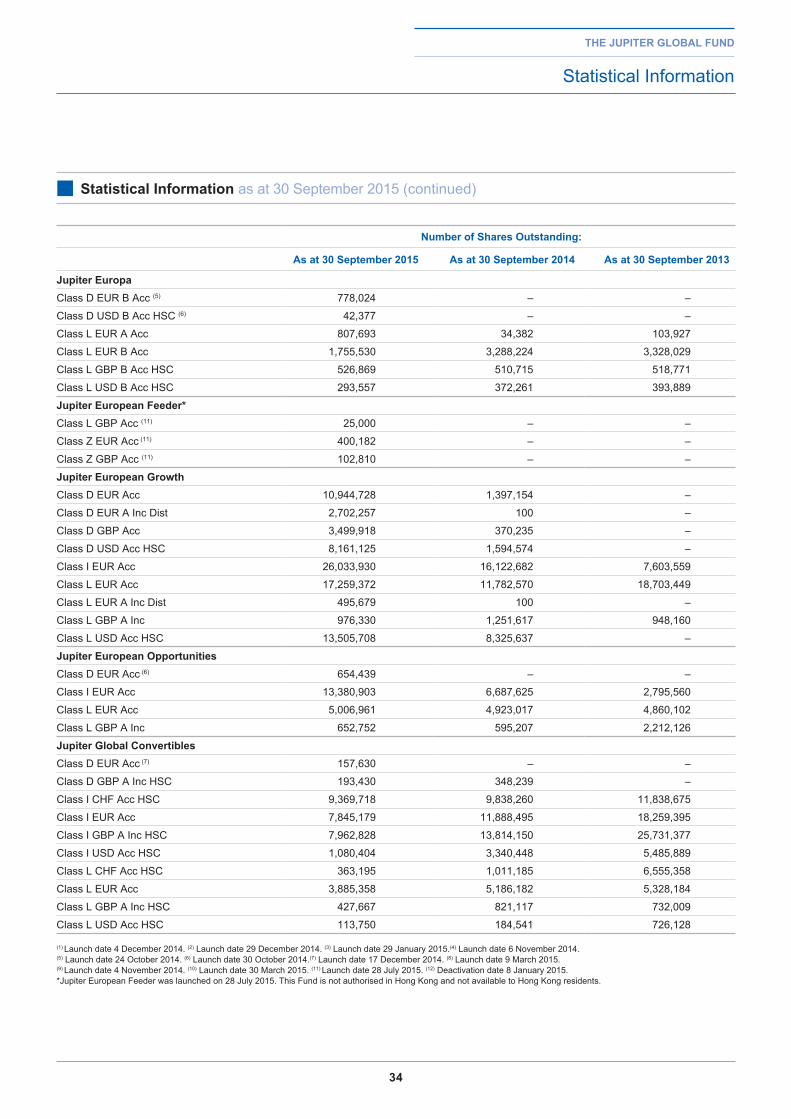
■ Statistical information as at 30 September 2015 (continued)
number of Shares outstanding:
as at 30 September 2015 as at 30 September 2014 as at 30 September 2013
jupiter europa Class D EUR B Acc (5) 778,024 – –
Class D USD B Acc HSC (6) 42,377 – –
Class L EUR A Acc 807,693 34,382 103,927
Class L EUR B Acc 1,755,530 3,288,224 3,328,029
Class L GBP B Acc HSC 526,869 510,715 518,771
Class L USD B Acc HSC 293,557 372,261 393,889
jupiter european feeder*Class L GBP Acc (11) 25,000 – –
Class Z EUR Acc (11) 400,182 – –
Class Z GBP Acc (11) 102,810 – –
jupiter european growth Class D EUR Acc 10,944,728 1,397,154 –
Class D EUR A Inc Dist 2,702,257 100 –
Class D GBP Acc 3,499,918 370,235 –
Class D USD Acc HSC 8,161,125 1,594,574 –
Class I EUR Acc 26,033,930 16,122,682 7,603,559
Class L EUR Acc 17,259,372 11,782,570 18,703,449
Class L EUR A Inc Dist 495,679 100 –
Class L GBP A Inc 976,330 1,251,617 948,160
Class L USD Acc HSC 13,505,708 8,325,637 –
jupiter european opportunities Class D EUR Acc (6) 654,439 – –
Class I EUR Acc 13,380,903 6,687,625 2,795,560
Class L EUR Acc 5,006,961 4,923,017 4,860,102
Class L GBP A Inc 652,752 595,207 2,212,126
jupiter global Convertibles Class D EUR Acc (7) 157,630 – –
Class D GBP A Inc HSC 193,430 348,239 –
Class I CHF Acc HSC 9,369,718 9,838,260 11,838,675
Class I EUR Acc 7,845,179 11,888,495 18,259,395
Class I GBP A Inc HSC 7,962,828 13,814,150 25,731,377
Class I USD Acc HSC 1,080,404 3,340,448 5,485,889
Class L CHF Acc HSC 363,195 1,011,185 6,555,358
Class L EUR Acc 3,885,358 5,186,182 5,328,184
Class L GBP A Inc HSC 427,667 821,117 732,009
Class L USD Acc HSC 113,750 184,541 726,128
(1) Launch date 4 December 2014. (2) Launch date 29 December 2014. (3) Launch date 29 January 2015.(4) Launch date 6 November 2014. (5) Launch date 24 October 2014. (6) Launch date 30 October 2014. (7) Launch date 17 December 2014. (8) Launch date 9 March 2015. (9) Launch date 4 November 2014. (10) Launch date 30 March 2015. (11) Launch date 28 July 2015. (12) Deactivation date 8 January 2015.*Jupiter European Feeder was launched on 28 July 2015. This Fund is not authorised in Hong Kong and not available to Hong Kong residents.
35
the jupiter global fund
Statistical Information
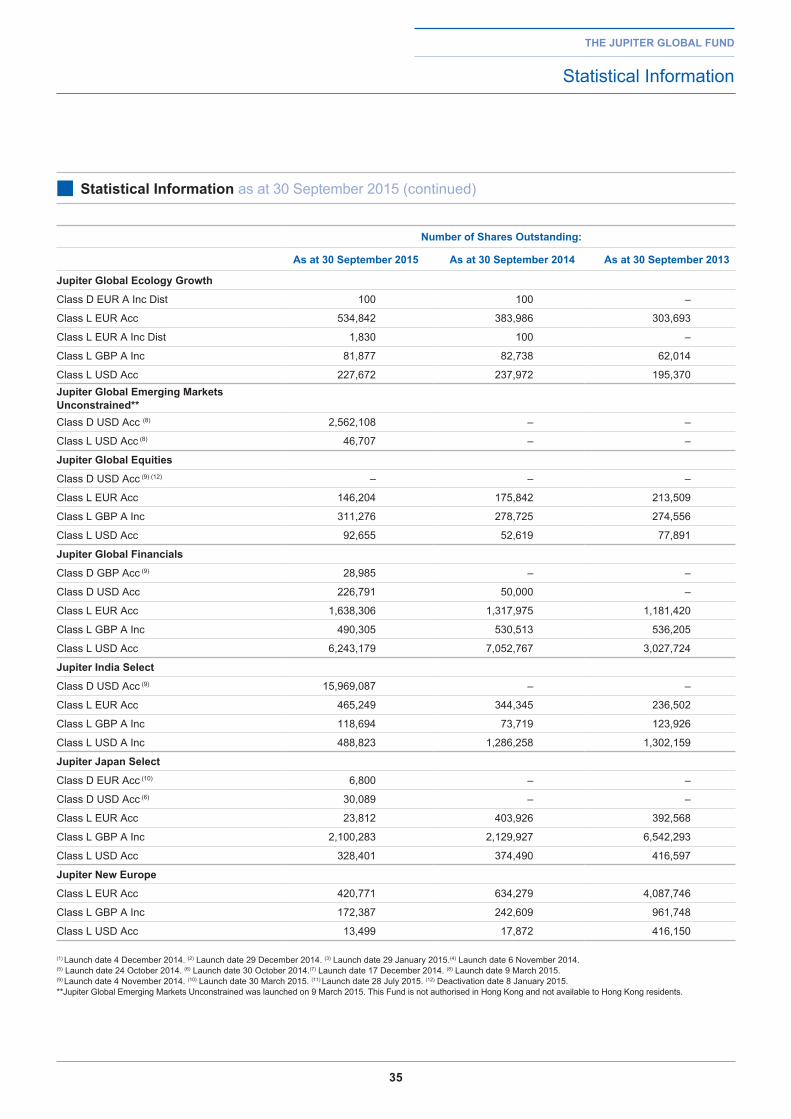
■ Statistical information as at 30 September 2015 (continued)
number of Shares outstanding:
as at 30 September 2015 as at 30 September 2014 as at 30 September 2013
jupiter global ecology growth
Class D EUR A Inc Dist 100 100 –
Class L EUR Acc 534,842 383,986 303,693
Class L EUR A Inc Dist 1,830 100 –
Class L GBP A Inc 81,877 82,738 62,014
Class L USD Acc 227,672 237,972 195,370jupiter global emerging Markets unconstrained**Class D USD Acc (8) 2,562,108 – –
Class L USD Acc (8) 46,707 – –
jupiter global equities
Class D USD Acc (9) (12) – – –
Class L EUR Acc 146,204 175,842 213,509
Class L GBP A Inc 311,276 278,725 274,556
Class L USD Acc 92,655 52,619 77,891
jupiter global financials
Class D GBP Acc (9) 28,985 – –
Class D USD Acc 226,791 50,000 –
Class L EUR Acc 1,638,306 1,317,975 1,181,420
Class L GBP A Inc 490,305 530,513 536,205
Class L USD Acc 6,243,179 7,052,767 3,027,724
jupiter india Select
Class D USD Acc (9) 15,969,087 – –
Class L EUR Acc 465,249 344,345 236,502
Class L GBP A Inc 118,694 73,719 123,926
Class L USD A Inc 488,823 1,286,258 1,302,159
jupiter japan Select
Class D EUR Acc (10) 6,800 – –
Class D USD Acc (6) 30,089 – –
Class L EUR Acc 23,812 403,926 392,568
Class L GBP A Inc 2,100,283 2,129,927 6,542,293
Class L USD Acc 328,401 374,490 416,597
jupiter new europe
Class L EUR Acc 420,771 634,279 4,087,746
Class L GBP A Inc 172,387 242,609 961,748
Class L USD Acc 13,499 17,872 416,150
(1) Launch date 4 December 2014. (2) Launch date 29 December 2014. (3) Launch date 29 January 2015.(4) Launch date 6 November 2014. (5) Launch date 24 October 2014. (6) Launch date 30 October 2014. (7) Launch date 17 December 2014. (8) Launch date 9 March 2015. (9) Launch date 4 November 2014. (10) Launch date 30 March 2015. (11) Launch date 28 July 2015. (12) Deactivation date 8 January 2015.**Jupiter Global Emerging Markets Unconstrained was launched on 9 March 2015. This Fund is not authorised in Hong Kong and not available to Hong Kong residents.
36
the jupiter global fund
Statistical Information
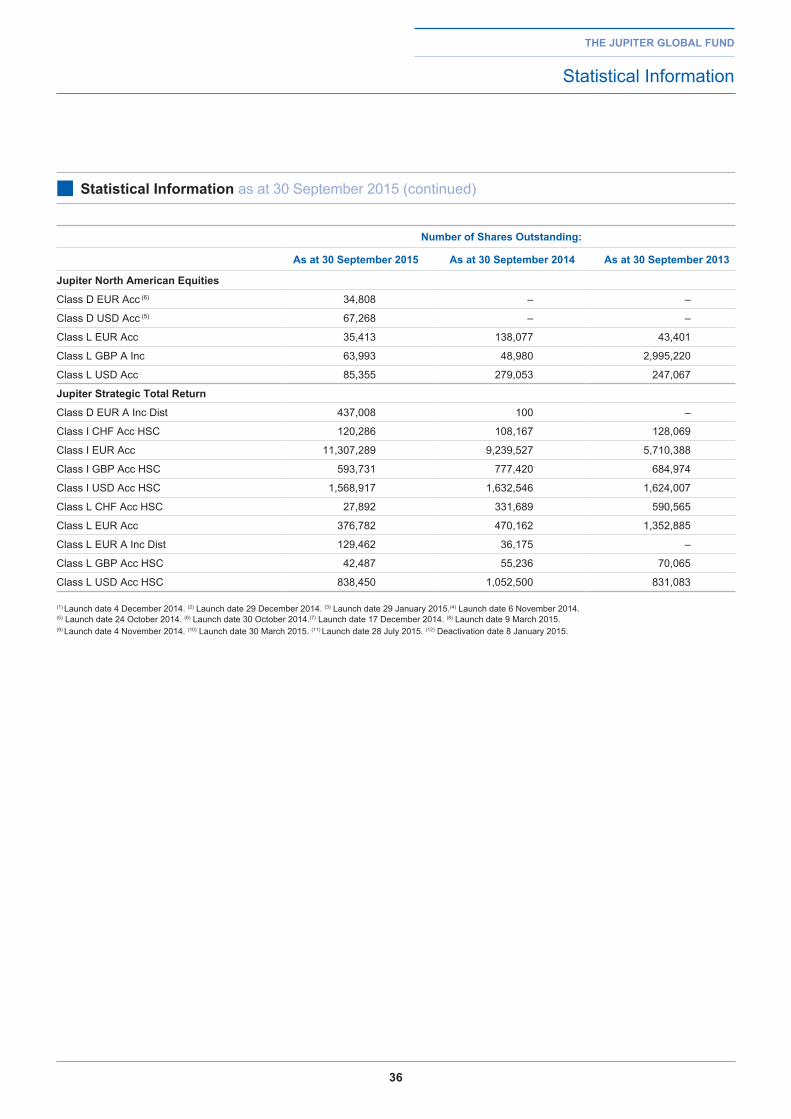
■ Statistical information as at 30 September 2015 (continued)
number of Shares outstanding:
as at 30 September 2015 as at 30 September 2014 as at 30 September 2013
jupiter north american equities
Class D EUR Acc (6) 34,808 – –
Class D USD Acc (5) 67,268 – –
Class L EUR Acc 35,413 138,077 43,401
Class L GBP A Inc 63,993 48,980 2,995,220
Class L USD Acc 85,355 279,053 247,067
jupiter Strategic total return
Class D EUR A Inc Dist 437,008 100 –
Class I CHF Acc HSC 120,286 108,167 128,069
Class I EUR Acc 11,307,289 9,239,527 5,710,388
Class I GBP Acc HSC 593,731 777,420 684,974
Class I USD Acc HSC 1,568,917 1,632,546 1,624,007
Class L CHF Acc HSC 27,892 331,689 590,565
Class L EUR Acc 376,782 470,162 1,352,885
Class L EUR A Inc Dist 129,462 36,175 –
Class L GBP Acc HSC 42,487 55,236 70,065
Class L USD Acc HSC 838,450 1,052,500 831,083
(1) Launch date 4 December 2014. (2) Launch date 29 December 2014. (3) Launch date 29 January 2015.(4) Launch date 6 November 2014. (5) Launch date 24 October 2014. (6) Launch date 30 October 2014. (7) Launch date 17 December 2014. (8) Launch date 9 March 2015. (9) Launch date 4 November 2014. (10) Launch date 30 March 2015. (11) Launch date 28 July 2015. (12) Deactivation date 8 January 2015.
37
the jupiter global fund
Statistical Information
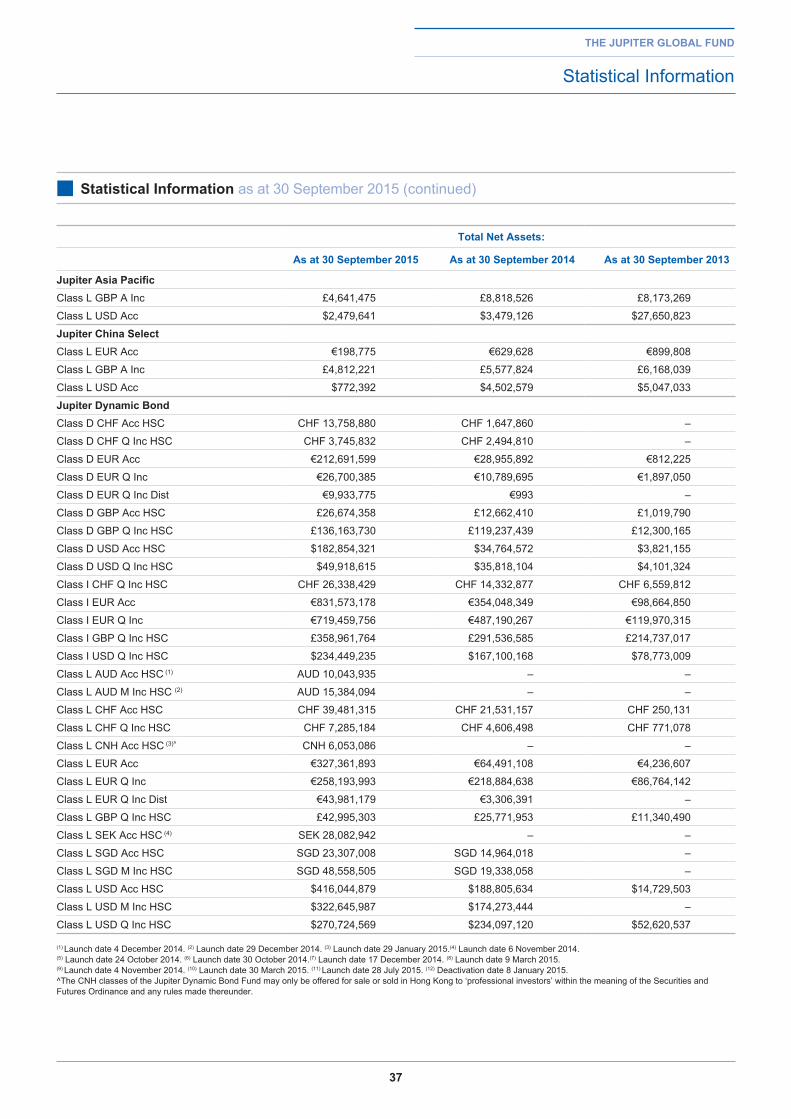
■ Statistical information as at 30 September 2015 (continued)
total net assets:
as at 30 September 2015 as at 30 September 2014 as at 30 September 2013
jupiter asia pacific Class L GBP A Inc £4,641,475 £8,818,526 £8,173,269
Class L USD Acc $2,479,641 $3,479,126 $27,650,823
jupiter China SelectClass L EUR Acc €198,775 €629,628 €899,808
Class L GBP A Inc £4,812,221 £5,577,824 £6,168,039
Class L USD Acc $772,392 $4,502,579 $5,047,033
jupiter dynamic bond Class D CHF Acc HSC CHF 13,758,880 CHF 1,647,860 –
Class D CHF Q Inc HSC CHF 3,745,832 CHF 2,494,810 –
Class D EUR Acc €212,691,599 €28,955,892 €812,225
Class D EUR Q Inc €26,700,385 €10,789,695 €1,897,050
Class D EUR Q Inc Dist €9,933,775 €993 –
Class D GBP Acc HSC £26,674,358 £12,662,410 £1,019,790
Class D GBP Q Inc HSC £136,163,730 £119,237,439 £12,300,165
Class D USD Acc HSC $182,854,321 $34,764,572 $3,821,155
Class D USD Q Inc HSC $49,918,615 $35,818,104 $4,101,324
Class I CHF Q Inc HSC CHF 26,338,429 CHF 14,332,877 CHF 6,559,812
Class I EUR Acc €831,573,178 €354,048,349 €98,664,850
Class I EUR Q Inc €719,459,756 €487,190,267 €119,970,315
Class I GBP Q Inc HSC £358,961,764 £291,536,585 £214,737,017
Class I USD Q Inc HSC $234,449,235 $167,100,168 $78,773,009
Class L AUD Acc HSC (1) AUD 10,043,935 – –
Class L AUD M Inc HSC (2) AUD 15,384,094 – –
Class L CHF Acc HSC CHF 39,481,315 CHF 21,531,157 CHF 250,131
Class L CHF Q Inc HSC CHF 7,285,184 CHF 4,606,498 CHF 771,078
Class L CNH Acc HSC (3)^ CNH 6,053,086 – –
Class L EUR Acc €327,361,893 €64,491,108 €4,236,607
Class L EUR Q Inc €258,193,993 €218,884,638 €86,764,142
Class L EUR Q Inc Dist €43,981,179 €3,306,391 –
Class L GBP Q Inc HSC £42,995,303 £25,771,953 £11,340,490
Class L SEK Acc HSC (4) SEK 28,082,942 – –
Class L SGD Acc HSC SGD 23,307,008 SGD 14,964,018 –
Class L SGD M Inc HSC SGD 48,558,505 SGD 19,338,058 –
Class L USD Acc HSC $416,044,879 $188,805,634 $14,729,503
Class L USD M Inc HSC $322,645,987 $174,273,444 –
Class L USD Q Inc HSC $270,724,569 $234,097,120 $52,620,537
(1) Launch date 4 December 2014. (2) Launch date 29 December 2014. (3) Launch date 29 January 2015.(4) Launch date 6 November 2014. (5) Launch date 24 October 2014. (6) Launch date 30 October 2014. (7) Launch date 17 December 2014. (8) Launch date 9 March 2015. (9) Launch date 4 November 2014. (10) Launch date 30 March 2015. (11) Launch date 28 July 2015. (12) Deactivation date 8 January 2015.^The CNH classes of the Jupiter Dynamic Bond Fund may only be offered for sale or sold in Hong Kong to ‘professional investors’ within the meaning of the Securities and Futures Ordinance and any rules made thereunder.
38
the jupiter global fund
Statistical Information
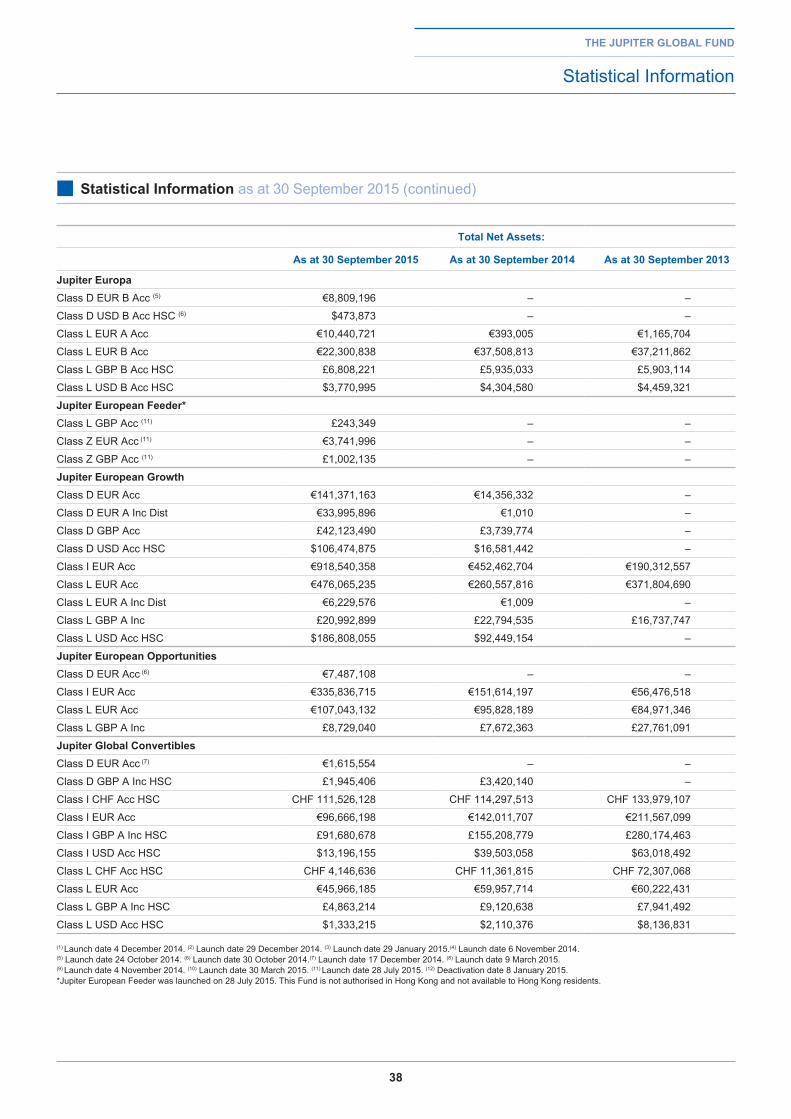
■ Statistical information as at 30 September 2015 (continued)
total net assets:
as at 30 September 2015 as at 30 September 2014 as at 30 September 2013
jupiter europa Class D EUR B Acc (5) €8,809,196 – –
Class D USD B Acc HSC (6) $473,873 – –
Class L EUR A Acc €10,440,721 €393,005 €1,165,704
Class L EUR B Acc €22,300,838 €37,508,813 €37,211,862
Class L GBP B Acc HSC £6,808,221 £5,935,033 £5,903,114
Class L USD B Acc HSC $3,770,995 $4,304,580 $4,459,321
jupiter european feeder*Class L GBP Acc (11) £243,349 – –
Class Z EUR Acc (11) €3,741,996 – –
Class Z GBP Acc (11) £1,002,135 – –
jupiter european growth Class D EUR Acc €141,371,163 €14,356,332 –
Class D EUR A Inc Dist €33,995,896 €1,010 –
Class D GBP Acc £42,123,490 £3,739,774 –
Class D USD Acc HSC $106,474,875 $16,581,442 –
Class I EUR Acc €918,540,358 €452,462,704 €190,312,557
Class L EUR Acc €476,065,235 €260,557,816 €371,804,690
Class L EUR A Inc Dist €6,229,576 €1,009 –
Class L GBP A Inc £20,992,899 £22,794,535 £16,737,747
Class L USD Acc HSC $186,808,055 $92,449,154 –
jupiter european opportunities Class D EUR Acc (6) €7,487,108 – –
Class I EUR Acc €335,836,715 €151,614,197 €56,476,518
Class L EUR Acc €107,043,132 €95,828,189 €84,971,346
Class L GBP A Inc £8,729,040 £7,672,363 £27,761,091
jupiter global Convertibles Class D EUR Acc (7) €1,615,554 – –
Class D GBP A Inc HSC £1,945,406 £3,420,140 –
Class I CHF Acc HSC CHF 111,526,128 CHF 114,297,513 CHF 133,979,107
Class I EUR Acc €96,666,198 €142,011,707 €211,567,099
Class I GBP A Inc HSC £91,680,678 £155,208,779 £280,174,463
Class I USD Acc HSC $13,196,155 $39,503,058 $63,018,492
Class L CHF Acc HSC CHF 4,146,636 CHF 11,361,815 CHF 72,307,068
Class L EUR Acc €45,966,185 €59,957,714 €60,222,431
Class L GBP A Inc HSC £4,863,214 £9,120,638 £7,941,492
Class L USD Acc HSC $1,333,215 $2,110,376 $8,136,831
(1) Launch date 4 December 2014. (2) Launch date 29 December 2014. (3) Launch date 29 January 2015.(4) Launch date 6 November 2014. (5) Launch date 24 October 2014. (6) Launch date 30 October 2014. (7) Launch date 17 December 2014. (8) Launch date 9 March 2015. (9) Launch date 4 November 2014. (10) Launch date 30 March 2015. (11) Launch date 28 July 2015. (12) Deactivation date 8 January 2015.*Jupiter European Feeder was launched on 28 July 2015. This Fund is not authorised in Hong Kong and not available to Hong Kong residents.
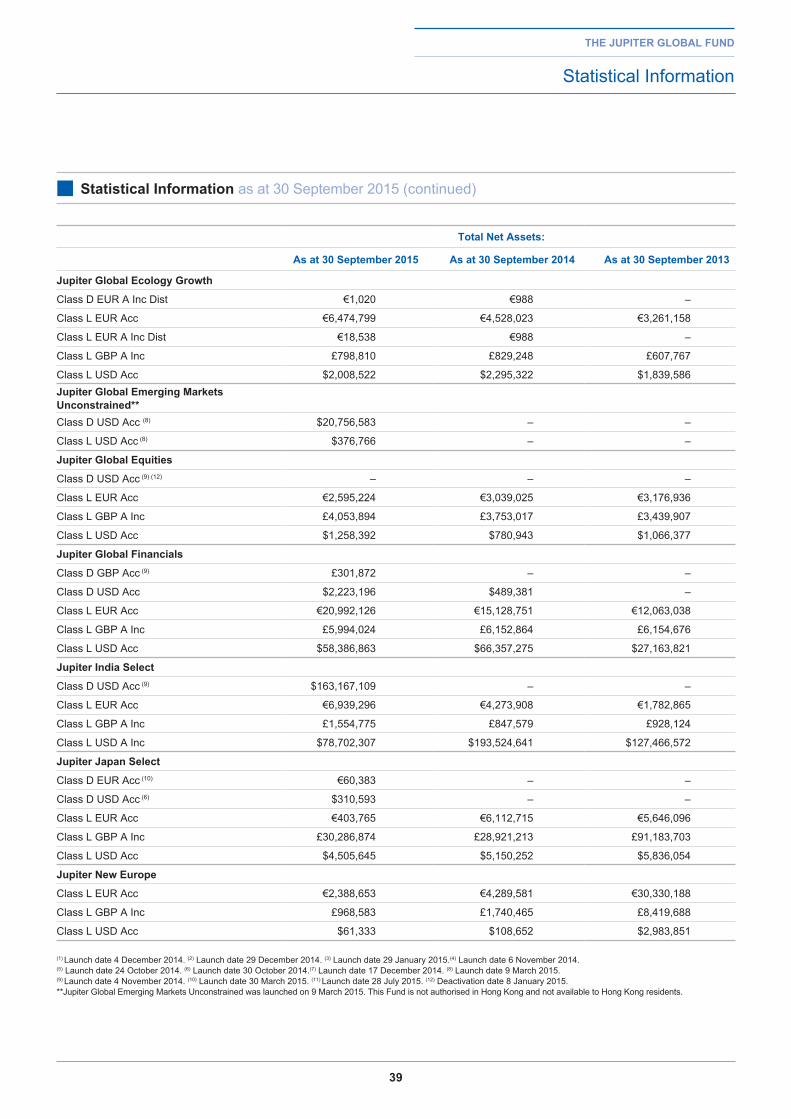
39
the jupiter global fund
Statistical Information
■ Statistical information as at 30 September 2015 (continued)
total net assets:
as at 30 September 2015 as at 30 September 2014 as at 30 September 2013
jupiter global ecology growth
Class D EUR A Inc Dist €1,020 €988 –
Class L EUR Acc €6,474,799 €4,528,023 €3,261,158
Class L EUR A Inc Dist €18,538 €988 –
Class L GBP A Inc £798,810 £829,248 £607,767
Class L USD Acc $2,008,522 $2,295,322 $1,839,586jupiter global emerging Markets unconstrained**Class D USD Acc (8) $20,756,583 – –
Class L USD Acc (8) $376,766 – –
jupiter global equities
Class D USD Acc (9) (12) – – –
Class L EUR Acc €2,595,224 €3,039,025 €3,176,936
Class L GBP A Inc £4,053,894 £3,753,017 £3,439,907
Class L USD Acc $1,258,392 $780,943 $1,066,377
jupiter global financials
Class D GBP Acc (9) £301,872 – –
Class D USD Acc $2,223,196 $489,381 –
Class L EUR Acc €20,992,126 €15,128,751 €12,063,038
Class L GBP A Inc £5,994,024 £6,152,864 £6,154,676
Class L USD Acc $58,386,863 $66,357,275 $27,163,821
jupiter india Select
Class D USD Acc (9) $163,167,109 – –
Class L EUR Acc €6,939,296 €4,273,908 €1,782,865
Class L GBP A Inc £1,554,775 £847,579 £928,124
Class L USD A Inc $78,702,307 $193,524,641 $127,466,572
jupiter japan Select
Class D EUR Acc (10) €60,383 – –
Class D USD Acc (6) $310,593 – –
Class L EUR Acc €403,765 €6,112,715 €5,646,096
Class L GBP A Inc £30,286,874 £28,921,213 £91,183,703
Class L USD Acc $4,505,645 $5,150,252 $5,836,054
jupiter new europe
Class L EUR Acc €2,388,653 €4,289,581 €30,330,188
Class L GBP A Inc £968,583 £1,740,465 £8,419,688
Class L USD Acc $61,333 $108,652 $2,983,851
(1) Launch date 4 December 2014. (2) Launch date 29 December 2014. (3) Launch date 29 January 2015.(4) Launch date 6 November 2014. (5) Launch date 24 October 2014. (6) Launch date 30 October 2014. (7) Launch date 17 December 2014. (8) Launch date 9 March 2015. (9) Launch date 4 November 2014. (10) Launch date 30 March 2015. (11) Launch date 28 July 2015. (12) Deactivation date 8 January 2015.**Jupiter Global Emerging Markets Unconstrained was launched on 9 March 2015. This Fund is not authorised in Hong Kong and not available to Hong Kong residents.
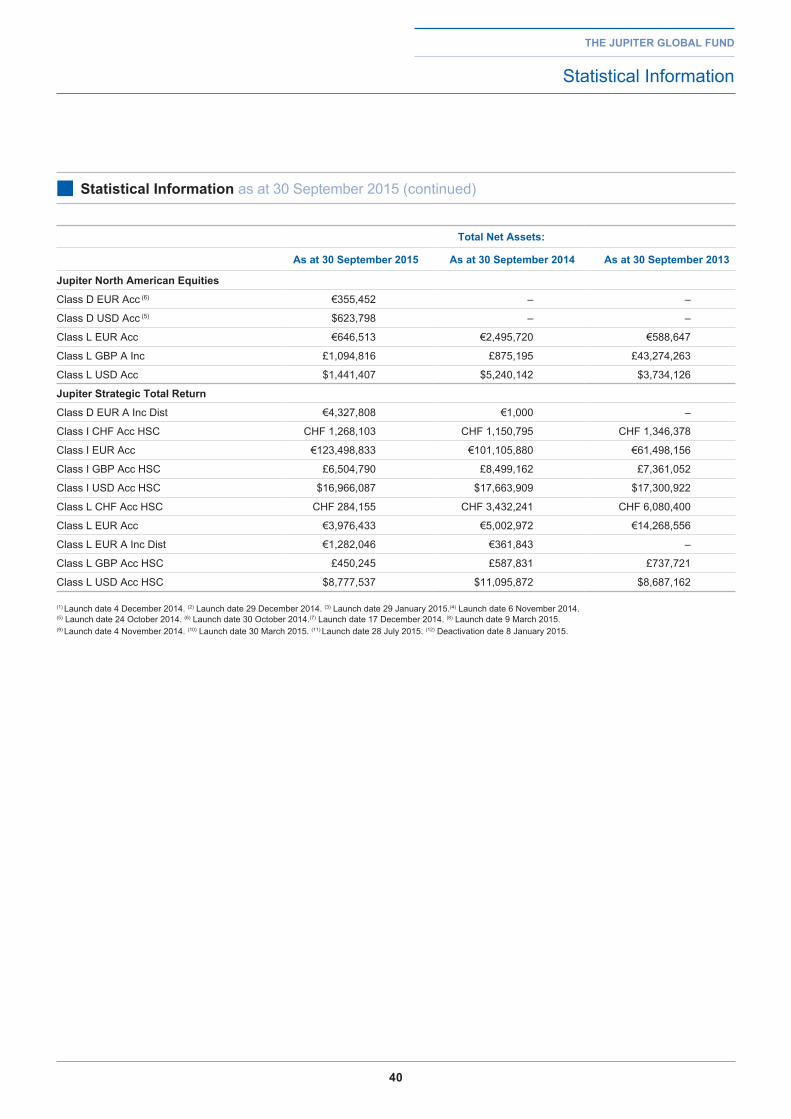
40
the jupiter global fund
Statistical Information
■ Statistical information as at 30 September 2015 (continued)
total net assets:
as at 30 September 2015 as at 30 September 2014 as at 30 September 2013
jupiter north american equities
Class D EUR Acc (6) €355,452 – –
Class D USD Acc (5) $623,798 – –
Class L EUR Acc €646,513 €2,495,720 €588,647
Class L GBP A Inc £1,094,816 £875,195 £43,274,263
Class L USD Acc $1,441,407 $5,240,142 $3,734,126
jupiter Strategic total return
Class D EUR A Inc Dist €4,327,808 €1,000 –
Class I CHF Acc HSC CHF 1,268,103 CHF 1,150,795 CHF 1,346,378
Class I EUR Acc €123,498,833 €101,105,880 €61,498,156
Class I GBP Acc HSC £6,504,790 £8,499,162 £7,361,052
Class I USD Acc HSC $16,966,087 $17,663,909 $17,300,922
Class L CHF Acc HSC CHF 284,155 CHF 3,432,241 CHF 6,080,400
Class L EUR Acc €3,976,433 €5,002,972 €14,268,556
Class L EUR A Inc Dist €1,282,046 €361,843 –
Class L GBP Acc HSC £450,245 £587,831 £737,721
Class L USD Acc HSC $8,777,537 $11,095,872 $8,687,162
(1) Launch date 4 December 2014. (2) Launch date 29 December 2014. (3) Launch date 29 January 2015.(4) Launch date 6 November 2014. (5) Launch date 24 October 2014. (6) Launch date 30 October 2014. (7) Launch date 17 December 2014. (8) Launch date 9 March 2015. (9) Launch date 4 November 2014. (10) Launch date 30 March 2015. (11) Launch date 28 July 2015. (12) Deactivation date 8 January 2015.
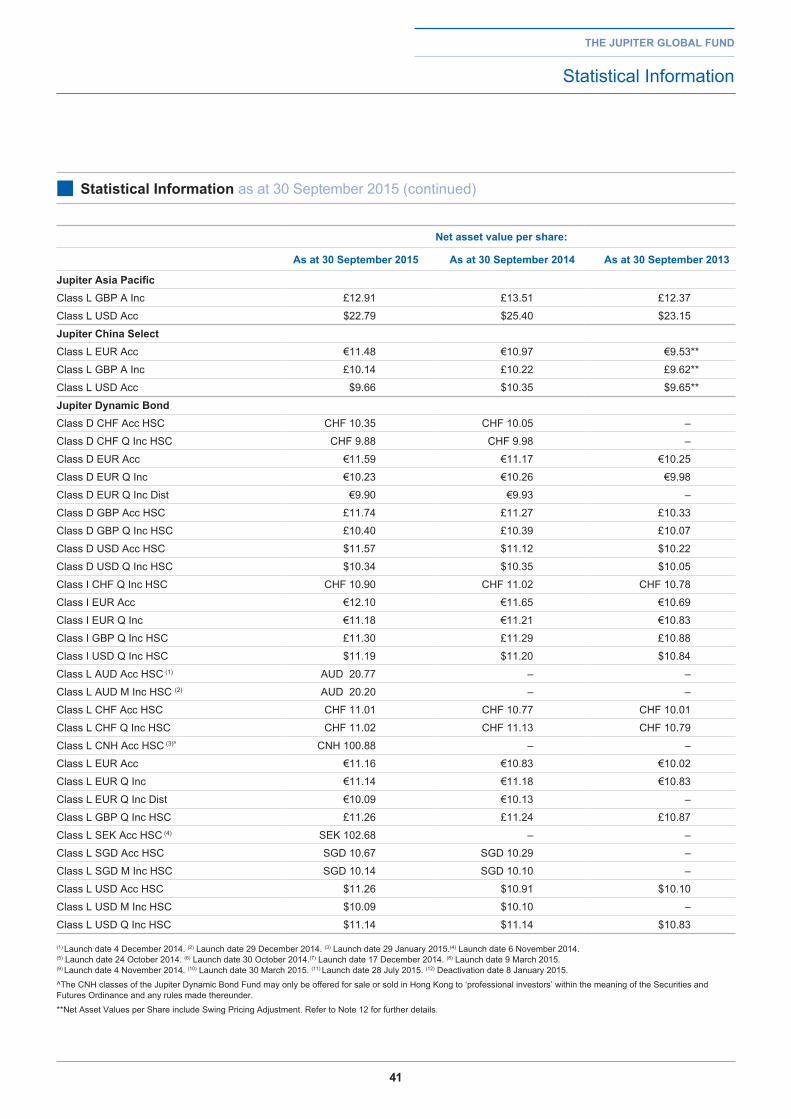
41
the jupiter global fund
Statistical Information
■ Statistical information as at 30 September 2015 (continued)
net asset value per share:
as at 30 September 2015 as at 30 September 2014 as at 30 September 2013
jupiter asia pacific Class L GBP A Inc £12.91 £13.51 £12.37
Class L USD Acc $22.79 $25.40 $23.15
jupiter China SelectClass L EUR Acc €11.48 €10.97 €9.53**
Class L GBP A Inc £10.14 £10.22 £9.62**
Class L USD Acc $9.66 $10.35 $9.65**
jupiter dynamic bond Class D CHF Acc HSC CHF 10.35 CHF 10.05 –
Class D CHF Q Inc HSC CHF 9.88 CHF 9.98 –
Class D EUR Acc €11.59 €11.17 €10.25
Class D EUR Q Inc €10.23 €10.26 €9.98
Class D EUR Q Inc Dist €9.90 €9.93 –
Class D GBP Acc HSC £11.74 £11.27 £10.33
Class D GBP Q Inc HSC £10.40 £10.39 £10.07
Class D USD Acc HSC $11.57 $11.12 $10.22
Class D USD Q Inc HSC $10.34 $10.35 $10.05
Class I CHF Q Inc HSC CHF 10.90 CHF 11.02 CHF 10.78
Class I EUR Acc €12.10 €11.65 €10.69
Class I EUR Q Inc €11.18 €11.21 €10.83
Class I GBP Q Inc HSC £11.30 £11.29 £10.88
Class I USD Q Inc HSC $11.19 $11.20 $10.84
Class L AUD Acc HSC (1) AUD 20.77 – –
Class L AUD M Inc HSC (2) AUD 20.20 – –
Class L CHF Acc HSC CHF 11.01 CHF 10.77 CHF 10.01
Class L CHF Q Inc HSC CHF 11.02 CHF 11.13 CHF 10.79
Class L CNH Acc HSC (3)^ CNH 100.88 – –
Class L EUR Acc €11.16 €10.83 €10.02
Class L EUR Q Inc €11.14 €11.18 €10.83
Class L EUR Q Inc Dist €10.09 €10.13 –
Class L GBP Q Inc HSC £11.26 £11.24 £10.87
Class L SEK Acc HSC (4) SEK 102.68 – –
Class L SGD Acc HSC SGD 10.67 SGD 10.29 –
Class L SGD M Inc HSC SGD 10.14 SGD 10.10 –
Class L USD Acc HSC $11.26 $10.91 $10.10
Class L USD M Inc HSC $10.09 $10.10 –
Class L USD Q Inc HSC $11.14 $11.14 $10.83
(1) Launch date 4 December 2014. (2) Launch date 29 December 2014. (3) Launch date 29 January 2015.(4) Launch date 6 November 2014. (5) Launch date 24 October 2014. (6) Launch date 30 October 2014. (7) Launch date 17 December 2014. (8) Launch date 9 March 2015. (9) Launch date 4 November 2014. (10) Launch date 30 March 2015. (11) Launch date 28 July 2015. (12) Deactivation date 8 January 2015.
^The CNH classes of the Jupiter Dynamic Bond Fund may only be offered for sale or sold in Hong Kong to ‘professional investors’ within the meaning of the Securities and Futures Ordinance and any rules made thereunder.
**Net Asset Values per Share include Swing Pricing Adjustment. Refer to Note 12 for further details.
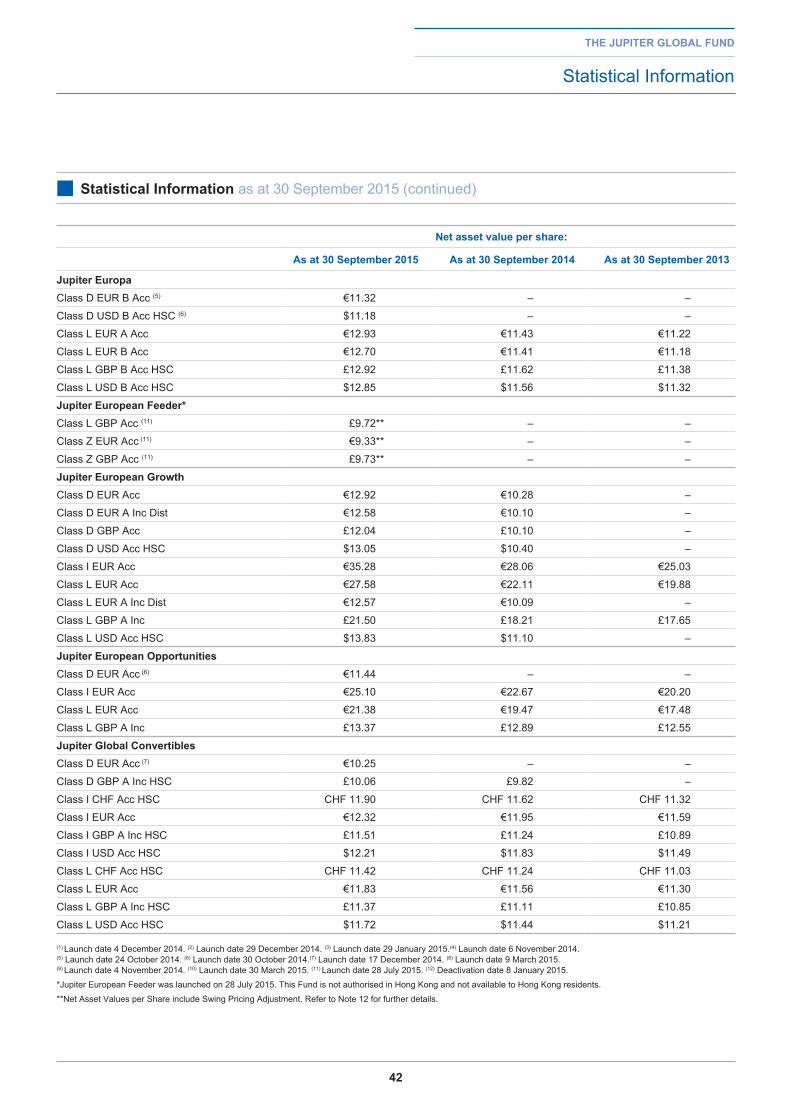
42
the jupiter global fund
Statistical Information
■ Statistical information as at 30 September 2015 (continued)
net asset value per share:
as at 30 September 2015 as at 30 September 2014 as at 30 September 2013
jupiter europa Class D EUR B Acc (5) €11.32 – –
Class D USD B Acc HSC (6) $11.18 – –
Class L EUR A Acc €12.93 €11.43 €11.22
Class L EUR B Acc €12.70 €11.41 €11.18
Class L GBP B Acc HSC £12.92 £11.62 £11.38
Class L USD B Acc HSC $12.85 $11.56 $11.32
jupiter european feeder*Class L GBP Acc (11) £9.72** – –
Class Z EUR Acc (11) €9.33** – –
Class Z GBP Acc (11) £9.73** – –
jupiter european growth Class D EUR Acc €12.92 €10.28 –
Class D EUR A Inc Dist €12.58 €10.10 –
Class D GBP Acc £12.04 £10.10 –
Class D USD Acc HSC $13.05 $10.40 –
Class I EUR Acc €35.28 €28.06 €25.03
Class L EUR Acc €27.58 €22.11 €19.88
Class L EUR A Inc Dist €12.57 €10.09 –
Class L GBP A Inc £21.50 £18.21 £17.65
Class L USD Acc HSC $13.83 $11.10 –
jupiter european opportunities Class D EUR Acc (6) €11.44 – –
Class I EUR Acc €25.10 €22.67 €20.20
Class L EUR Acc €21.38 €19.47 €17.48
Class L GBP A Inc £13.37 £12.89 £12.55
jupiter global Convertibles Class D EUR Acc (7) €10.25 – –
Class D GBP A Inc HSC £10.06 £9.82 –
Class I CHF Acc HSC CHF 11.90 CHF 11.62 CHF 11.32
Class I EUR Acc €12.32 €11.95 €11.59
Class I GBP A Inc HSC £11.51 £11.24 £10.89
Class I USD Acc HSC $12.21 $11.83 $11.49
Class L CHF Acc HSC CHF 11.42 CHF 11.24 CHF 11.03
Class L EUR Acc €11.83 €11.56 €11.30
Class L GBP A Inc HSC £11.37 £11.11 £10.85
Class L USD Acc HSC $11.72 $11.44 $11.21
(1) Launch date 4 December 2014. (2) Launch date 29 December 2014. (3) Launch date 29 January 2015.(4) Launch date 6 November 2014. (5) Launch date 24 October 2014. (6) Launch date 30 October 2014. (7) Launch date 17 December 2014. (8) Launch date 9 March 2015. (9) Launch date 4 November 2014. (10) Launch date 30 March 2015. (11) Launch date 28 July 2015. (12) Deactivation date 8 January 2015.
*Jupiter European Feeder was launched on 28 July 2015. This Fund is not authorised in Hong Kong and not available to Hong Kong residents.
**Net Asset Values per Share include Swing Pricing Adjustment. Refer to Note 12 for further details.
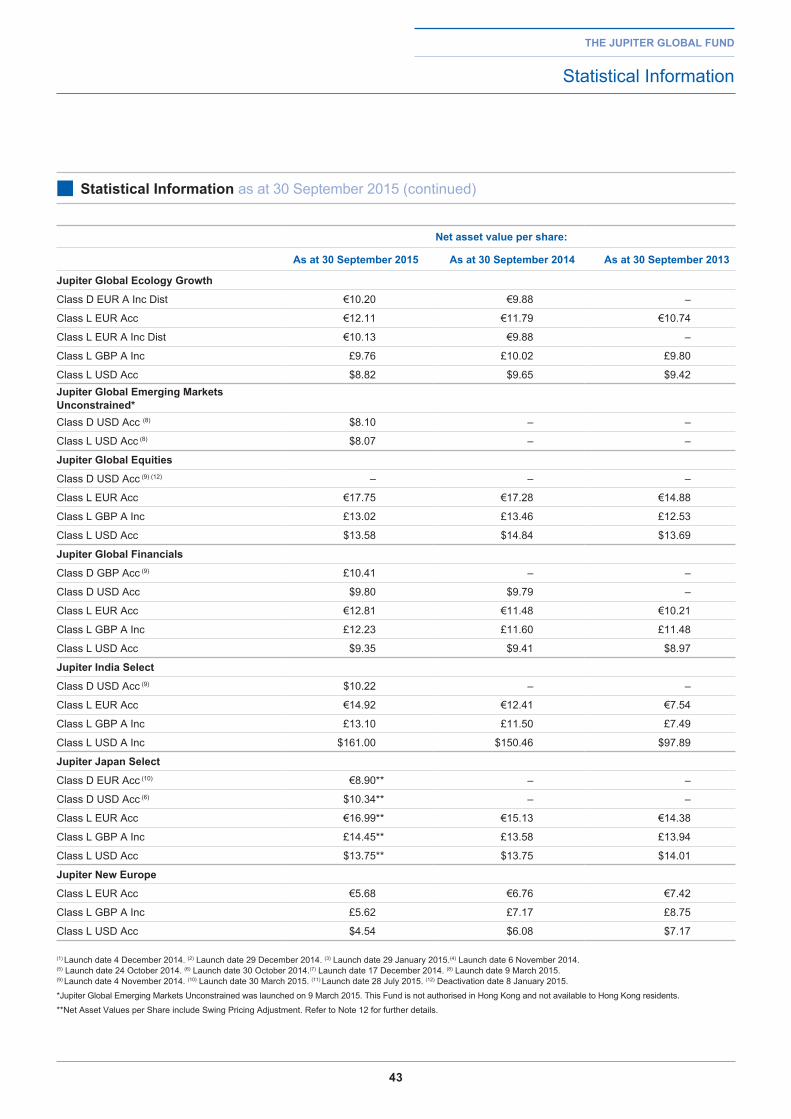
43
the jupiter global fund
Statistical Information
■ Statistical information as at 30 September 2015 (continued)
net asset value per share:
as at 30 September 2015 as at 30 September 2014 as at 30 September 2013
jupiter global ecology growth
Class D EUR A Inc Dist €10.20 €9.88 –
Class L EUR Acc €12.11 €11.79 €10.74
Class L EUR A Inc Dist €10.13 €9.88 –
Class L GBP A Inc £9.76 £10.02 £9.80
Class L USD Acc $8.82 $9.65 $9.42jupiter global emerging Markets unconstrained*Class D USD Acc (8) $8.10 – –
Class L USD Acc (8) $8.07 – –
jupiter global equities
Class D USD Acc (9) (12) – – –
Class L EUR Acc €17.75 €17.28 €14.88
Class L GBP A Inc £13.02 £13.46 £12.53
Class L USD Acc $13.58 $14.84 $13.69
jupiter global financials
Class D GBP Acc (9) £10.41 – –
Class D USD Acc $9.80 $9.79 –
Class L EUR Acc €12.81 €11.48 €10.21
Class L GBP A Inc £12.23 £11.60 £11.48
Class L USD Acc $9.35 $9.41 $8.97
jupiter india Select
Class D USD Acc (9) $10.22 – –
Class L EUR Acc €14.92 €12.41 €7.54
Class L GBP A Inc £13.10 £11.50 £7.49
Class L USD A Inc $161.00 $150.46 $97.89
jupiter japan Select
Class D EUR Acc (10) €8.90** – –
Class D USD Acc (6) $10.34** – –
Class L EUR Acc €16.99** €15.13 €14.38
Class L GBP A Inc £14.45** £13.58 £13.94
Class L USD Acc $13.75** $13.75 $14.01
jupiter new europe
Class L EUR Acc €5.68 €6.76 €7.42
Class L GBP A Inc £5.62 £7.17 £8.75
Class L USD Acc $4.54 $6.08 $7.17
(1) Launch date 4 December 2014. (2) Launch date 29 December 2014. (3) Launch date 29 January 2015.(4) Launch date 6 November 2014. (5) Launch date 24 October 2014. (6) Launch date 30 October 2014. (7) Launch date 17 December 2014. (8) Launch date 9 March 2015. (9) Launch date 4 November 2014. (10) Launch date 30 March 2015. (11) Launch date 28 July 2015. (12) Deactivation date 8 January 2015.
*Jupiter Global Emerging Markets Unconstrained was launched on 9 March 2015. This Fund is not authorised in Hong Kong and not available to Hong Kong residents.
**Net Asset Values per Share include Swing Pricing Adjustment. Refer to Note 12 for further details.
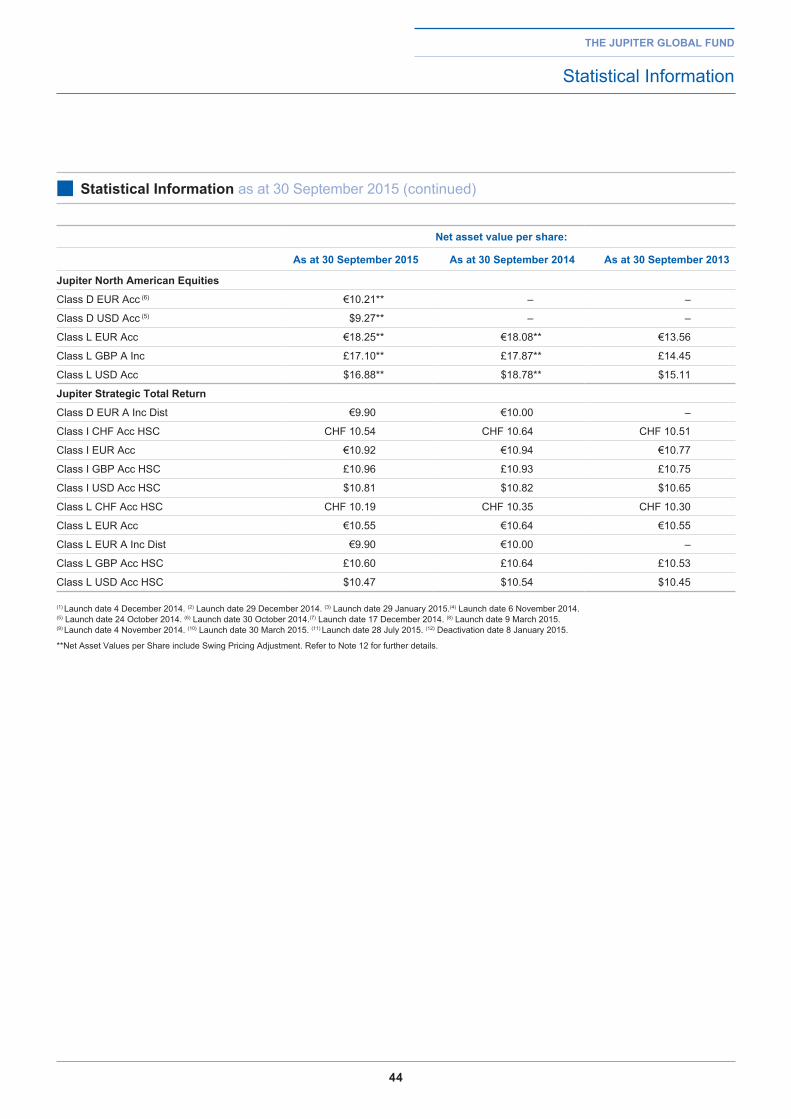
44
the jupiter global fund
Statistical Information
■ Statistical information as at 30 September 2015 (continued)
net asset value per share:
as at 30 September 2015 as at 30 September 2014 as at 30 September 2013
jupiter north american equities
Class D EUR Acc (6) €10.21** – –
Class D USD Acc (5) $9.27** – –
Class L EUR Acc €18.25** €18.08** €13.56
Class L GBP A Inc £17.10** £17.87** £14.45
Class L USD Acc $16.88** $18.78** $15.11
jupiter Strategic total return
Class D EUR A Inc Dist €9.90 €10.00 –
Class I CHF Acc HSC CHF 10.54 CHF 10.64 CHF 10.51
Class I EUR Acc €10.92 €10.94 €10.77
Class I GBP Acc HSC £10.96 £10.93 £10.75
Class I USD Acc HSC $10.81 $10.82 $10.65
Class L CHF Acc HSC CHF 10.19 CHF 10.35 CHF 10.30
Class L EUR Acc €10.55 €10.64 €10.55
Class L EUR A Inc Dist €9.90 €10.00 –
Class L GBP Acc HSC £10.60 £10.64 £10.53
Class L USD Acc HSC $10.47 $10.54 $10.45
(1) Launch date 4 December 2014. (2) Launch date 29 December 2014. (3) Launch date 29 January 2015.(4) Launch date 6 November 2014. (5) Launch date 24 October 2014. (6) Launch date 30 October 2014. (7) Launch date 17 December 2014. (8) Launch date 9 March 2015. (9) Launch date 4 November 2014. (10) Launch date 30 March 2015. (11) Launch date 28 July 2015. (12) Deactivation date 8 January 2015.
**Net Asset Values per Share include Swing Pricing Adjustment. Refer to Note 12 for further details.
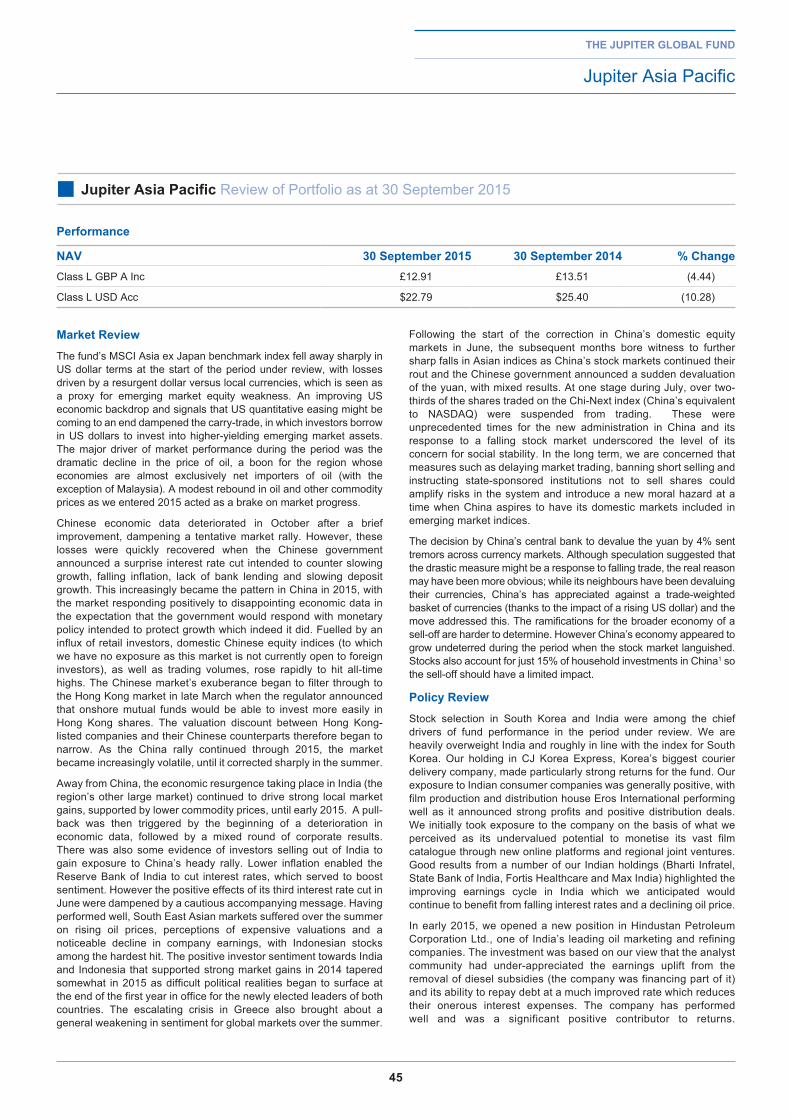
45
performance
naV 30 September 2015 30 September 2014 % ChangeClass L GBP A Inc £12.91 £13.51 (4.44)
Class L USD Acc $22.79 $25.40 (10.28)
Market reviewThe fund’s MSCI Asia ex Japan benchmark index fell away sharply in US dollar terms at the start of the period under review, with losses driven by a resurgent dollar versus local currencies, which is seen as a proxy for emerging market equity weakness. An improving US economic backdrop and signals that US quantitative easing might be coming to an end dampened the carry-trade, in which investors borrow in US dollars to invest into higher-yielding emerging market assets. The major driver of market performance during the period was the dramatic decline in the price of oil, a boon for the region whose economies are almost exclusively net importers of oil (with the exception of Malaysia). A modest rebound in oil and other commodity prices as we entered 2015 acted as a brake on market progress.
Chinese economic data deteriorated in October after a brief improvement, dampening a tentative market rally. However, these losses were quickly recovered when the Chinese government announced a surprise interest rate cut intended to counter slowing growth, falling inflation, lack of bank lending and slowing deposit growth. This increasingly became the pattern in China in 2015, with the market responding positively to disappointing economic data in the expectation that the government would respond with monetary policy intended to protect growth which indeed it did. Fuelled by an influx of retail investors, domestic Chinese equity indices (to which we have no exposure as this market is not currently open to foreign investors), as well as trading volumes, rose rapidly to hit all-time highs. The Chinese market’s exuberance began to filter through to the Hong Kong market in late March when the regulator announced that onshore mutual funds would be able to invest more easily in Hong Kong shares. The valuation discount between Hong Kong-listed companies and their Chinese counterparts therefore began to narrow. As the China rally continued through 2015, the market became increasingly volatile, until it corrected sharply in the summer.
Away from China, the economic resurgence taking place in India (the region’s other large market) continued to drive strong local market gains, supported by lower commodity prices, until early 2015. A pull-back was then triggered by the beginning of a deterioration in economic data, followed by a mixed round of corporate results. There was also some evidence of investors selling out of India to gain exposure to China’s heady rally. Lower inflation enabled the Reserve Bank of India to cut interest rates, which served to boost sentiment. However the positive effects of its third interest rate cut in June were dampened by a cautious accompanying message. Having performed well, South East Asian markets suffered over the summer on rising oil prices, perceptions of expensive valuations and a noticeable decline in company earnings, with Indonesian stocks among the hardest hit. The positive investor sentiment towards India and Indonesia that supported strong market gains in 2014 tapered somewhat in 2015 as difficult political realities began to surface at the end of the first year in office for the newly elected leaders of both countries. The escalating crisis in Greece also brought about a general weakening in sentiment for global markets over the summer.
Following the start of the correction in China’s domestic equity markets in June, the subsequent months bore witness to further sharp falls in Asian indices as China’s stock markets continued their rout and the Chinese government announced a sudden devaluation of the yuan, with mixed results. At one stage during July, over two-thirds of the shares traded on the Chi-Next index (China’s equivalent to NASDAQ) were suspended from trading. These were unprecedented times for the new administration in China and its response to a falling stock market underscored the level of its concern for social stability. In the long term, we are concerned that measures such as delaying market trading, banning short selling and instructing state-sponsored institutions not to sell shares could amplify risks in the system and introduce a new moral hazard at a time when China aspires to have its domestic markets included in emerging market indices.
The decision by China’s central bank to devalue the yuan by 4% sent tremors across currency markets. Although speculation suggested that the drastic measure might be a response to falling trade, the real reason may have been more obvious; while its neighbours have been devaluing their currencies, China’s has appreciated against a trade-weighted basket of currencies (thanks to the impact of a rising US dollar) and the move addressed this. The ramifications for the broader economy of a sell-off are harder to determine. However China’s economy appeared to grow undeterred during the period when the stock market languished. Stocks also account for just 15% of household investments in China1 so the sell-off should have a limited impact.
policy review
Stock selection in South Korea and India were among the chief drivers of fund performance in the period under review. We are heavily overweight India and roughly in line with the index for South Korea. Our holding in CJ Korea Express, Korea’s biggest courier delivery company, made particularly strong returns for the fund. Our exposure to Indian consumer companies was generally positive, with film production and distribution house Eros International performing well as it announced strong profits and positive distribution deals. We initially took exposure to the company on the basis of what we perceived as its undervalued potential to monetise its vast film catalogue through new online platforms and regional joint ventures. Good results from a number of our Indian holdings (Bharti Infratel, State Bank of India, Fortis Healthcare and Max India) highlighted the improving earnings cycle in India which we anticipated would continue to benefit from falling interest rates and a declining oil price.
In early 2015, we opened a new position in Hindustan Petroleum Corporation Ltd., one of India’s leading oil marketing and refining companies. The investment was based on our view that the analyst community had under-appreciated the earnings uplift from the removal of diesel subsidies (the company was financing part of it) and its ability to repay debt at a much improved rate which reduces their onerous interest expenses. The company has performed well and was a significant positive contributor to returns.
the jupiter global fund
Jupiter Asia Pacific
■ jupiter asia pacific Review of Portfolio as at 30 September 2015
46
policy review (continued)
We continue to believe that the best way to generate long term returns for the Fund will be by identifying undervalued companies benefiting from a change in underlying fundamentals yet to be appreciated by other market participants. With that in mind, over the next few months we will be looking to further concentrate the portfolio, focusing more on companies where we have a higher level of conviction.
When China’s domestic stock markets began their downward spiral, we took advantage of market gyrations to concentrate the portfolio further and add to existing positions where we felt the sell-off had been indiscriminate. We initiated a new position in VIPShop, a US-listed Chinese online apparel discount platform. We had been sceptical on the basis of the apparent lack of barriers to entry in its market. However since its initial listing three years ago the company has continued to build on its franchise (as judged by repeat business) and although new entrants have entered they have not been able to get a strong foothold. The sell-off put the stock on a valuation which we considered appealing given the company’s revenue growth forecasts.
Despite further market turbulence in our region towards the end of the summer, the fund performed broadly in line with the benchmark despite some wild stock price moves. The fund has a natural bias to mid and small sized companies as we believe we can identify underappreciated catalysts more easily in this area. However, we are reminded that in a risk-averse environment these are not the logical areas to seek shelter. Ironically, from a sector perspective, not even the defensive strongholds such as telecoms and utilities provided any buffer to the sell-off.
We took advantage of market swings to selectively add to our Taiwan technology holdings where we felt the market had over-reacted to quarterly earnings shortfalls. In our experience, Taiwanese management teams are among the best custodians of their businesses and minority interests are aligned through superior dividend structures and capital management initiatives.
investment outlookDuring times of extreme volatility and uncertainty, we tend to try and borrow the wise words of Warren Buffett in being greedy when others are fearful. Whilst trying to market time the perfect entry point is futile, we take heed from the fact that company valuations are once again moving into an attractive domain. Valuations do not necessarily provide a floor to markets, however we believe it is a good guide when determining an opportune entry point. We can’t therefore ignore the fact that we are getting extremely close to the previous valuation floors of the global financial crisis. We have no crystal ball into the future and are willing to accept that emerging markets companies’ levels of borrowing are rising while corporate returns are well below their peak, however a lot of this appears reflected in today’s prices. The opportunities for bottom-up investors focused on company specifics are gaining in number, and hence our investment activity remains reflective of our enthusiasm in these unstable times.
ben Surteesfund Manager
30 September 2015
1HSBC, 7 July 2015
the jupiter global fund
Jupiter Asia Pacific
■ jupiter asia pacific Review of Portfolio as at 30 September 2015
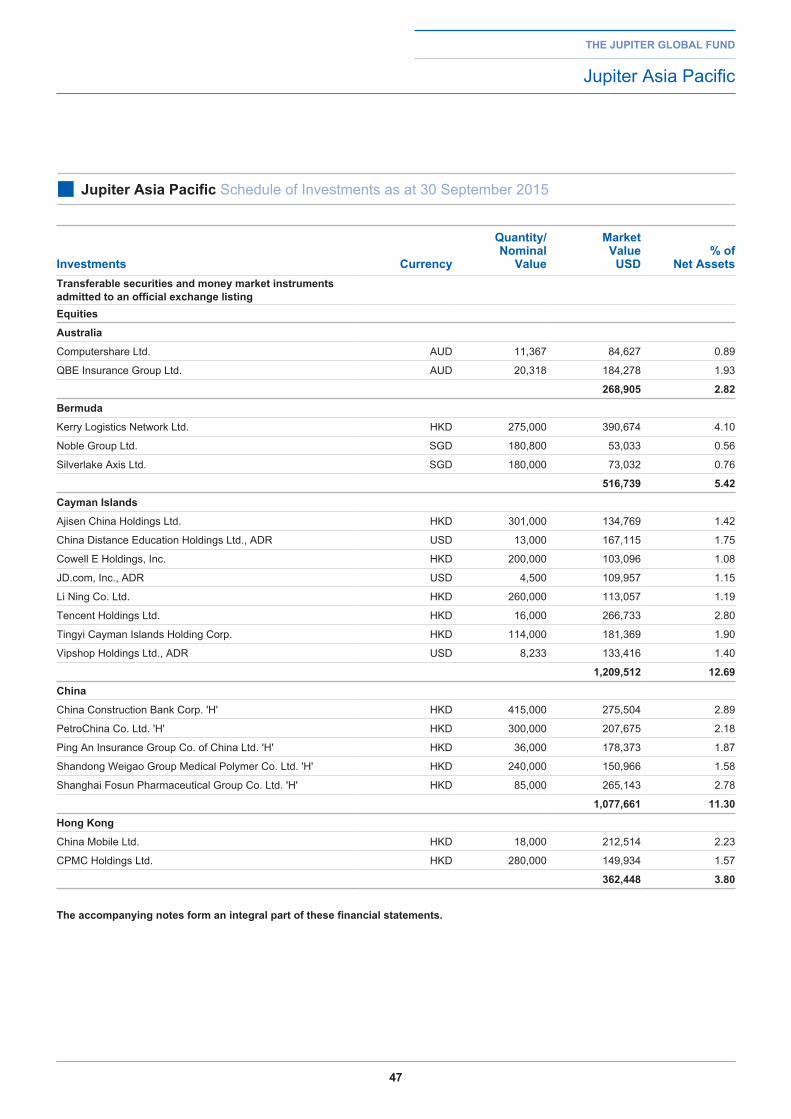
47
the jupiter global fund
Jupiter Asia Pacific
■ jupiter asia pacific Schedule of Investments as at 30 September 2015
investments Currency
Quantity/ nominal
Value
Market Value
uSd% of
net assetstransferable securities and money market instruments admitted to an official exchange listingequities
australia
Computershare Ltd. AUD 11,367 84,627 0.89
QBE Insurance Group Ltd. AUD 20,318 184,278 1.93
268,905 2.82
bermuda
Kerry Logistics Network Ltd. HKD 275,000 390,674 4.10
Noble Group Ltd. SGD 180,800 53,033 0.56
Silverlake Axis Ltd. SGD 180,000 73,032 0.76
516,739 5.42
Cayman islands
Ajisen China Holdings Ltd. HKD 301,000 134,769 1.42
China Distance Education Holdings Ltd., ADR USD 13,000 167,115 1.75
Cowell E Holdings, Inc. HKD 200,000 103,096 1.08
JD.com, Inc., ADR USD 4,500 109,957 1.15
Li Ning Co. Ltd. HKD 260,000 113,057 1.19
Tencent Holdings Ltd. HKD 16,000 266,733 2.80
Tingyi Cayman Islands Holding Corp. HKD 114,000 181,369 1.90
Vipshop Holdings Ltd., ADR USD 8,233 133,416 1.40
1,209,512 12.69
China
China Construction Bank Corp. 'H' HKD 415,000 275,504 2.89
PetroChina Co. Ltd. 'H' HKD 300,000 207,675 2.18
Ping An Insurance Group Co. of China Ltd. 'H' HKD 36,000 178,373 1.87
Shandong Weigao Group Medical Polymer Co. Ltd. 'H' HKD 240,000 150,966 1.58
Shanghai Fosun Pharmaceutical Group Co. Ltd. 'H' HKD 85,000 265,143 2.78
1,077,661 11.30
hong Kong
China Mobile Ltd. HKD 18,000 212,514 2.23
CPMC Holdings Ltd. HKD 280,000 149,934 1.57
362,448 3.80
the accompanying notes form an integral part of these financial statements.
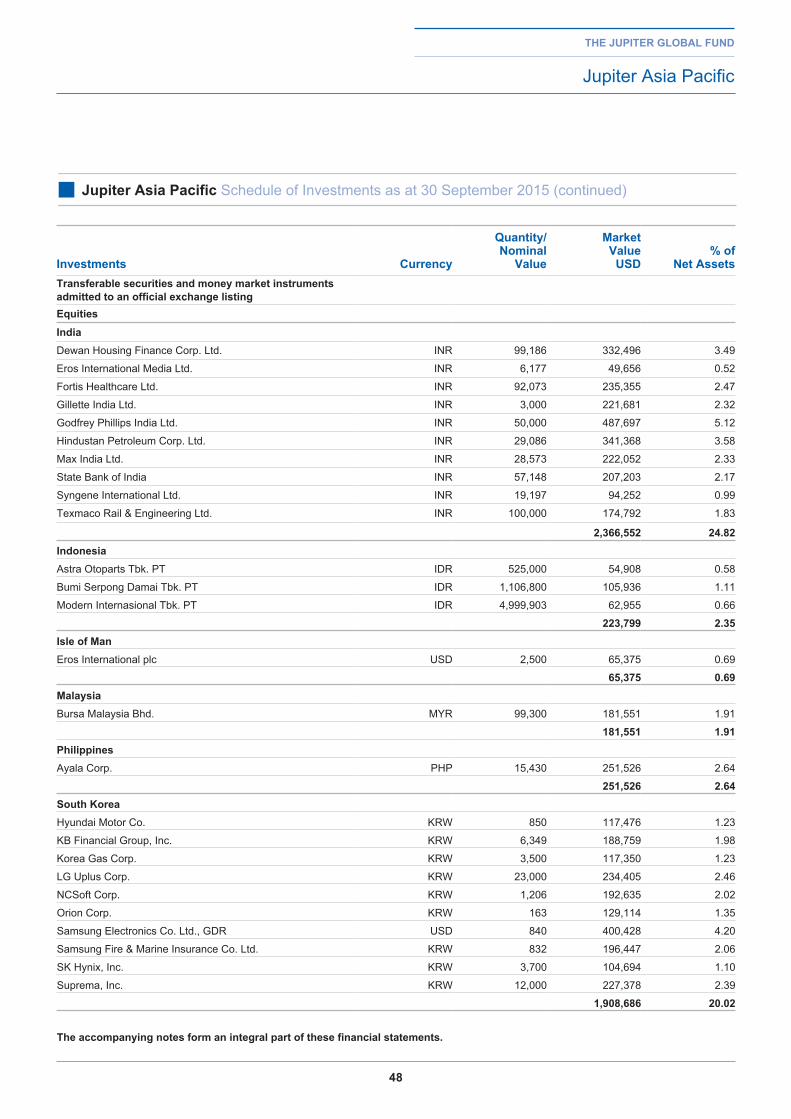
48
the jupiter global fund
Jupiter Asia Pacific
■ jupiter asia pacific Schedule of Investments as at 30 September 2015 (continued)
investments Currency
Quantity/ nominal
Value
Market Value
uSd% of
net assetstransferable securities and money market instruments admitted to an official exchange listingequitiesindiaDewan Housing Finance Corp. Ltd. INR 99,186 332,496 3.49
Eros International Media Ltd. INR 6,177 49,656 0.52
Fortis Healthcare Ltd. INR 92,073 235,355 2.47
Gillette India Ltd. INR 3,000 221,681 2.32
Godfrey Phillips India Ltd. INR 50,000 487,697 5.12
Hindustan Petroleum Corp. Ltd. INR 29,086 341,368 3.58
Max India Ltd. INR 28,573 222,052 2.33
State Bank of India INR 57,148 207,203 2.17
Syngene International Ltd. INR 19,197 94,252 0.99
Texmaco Rail & Engineering Ltd. INR 100,000 174,792 1.83
2,366,552 24.82indonesiaAstra Otoparts Tbk. PT IDR 525,000 54,908 0.58
Bumi Serpong Damai Tbk. PT IDR 1,106,800 105,936 1.11
Modern Internasional Tbk. PT IDR 4,999,903 62,955 0.66
223,799 2.35isle of ManEros International plc USD 2,500 65,375 0.69
65,375 0.69MalaysiaBursa Malaysia Bhd. MYR 99,300 181,551 1.91
181,551 1.91philippinesAyala Corp. PHP 15,430 251,526 2.64
251,526 2.64South KoreaHyundai Motor Co. KRW 850 117,476 1.23
KB Financial Group, Inc. KRW 6,349 188,759 1.98
Korea Gas Corp. KRW 3,500 117,350 1.23
LG Uplus Corp. KRW 23,000 234,405 2.46
NCSoft Corp. KRW 1,206 192,635 2.02
Orion Corp. KRW 163 129,114 1.35
Samsung Electronics Co. Ltd., GDR USD 840 400,428 4.20
Samsung Fire & Marine Insurance Co. Ltd. KRW 832 196,447 2.06
SK Hynix, Inc. KRW 3,700 104,694 1.10
Suprema, Inc. KRW 12,000 227,378 2.39
1,908,686 20.02
the accompanying notes form an integral part of these financial statements.
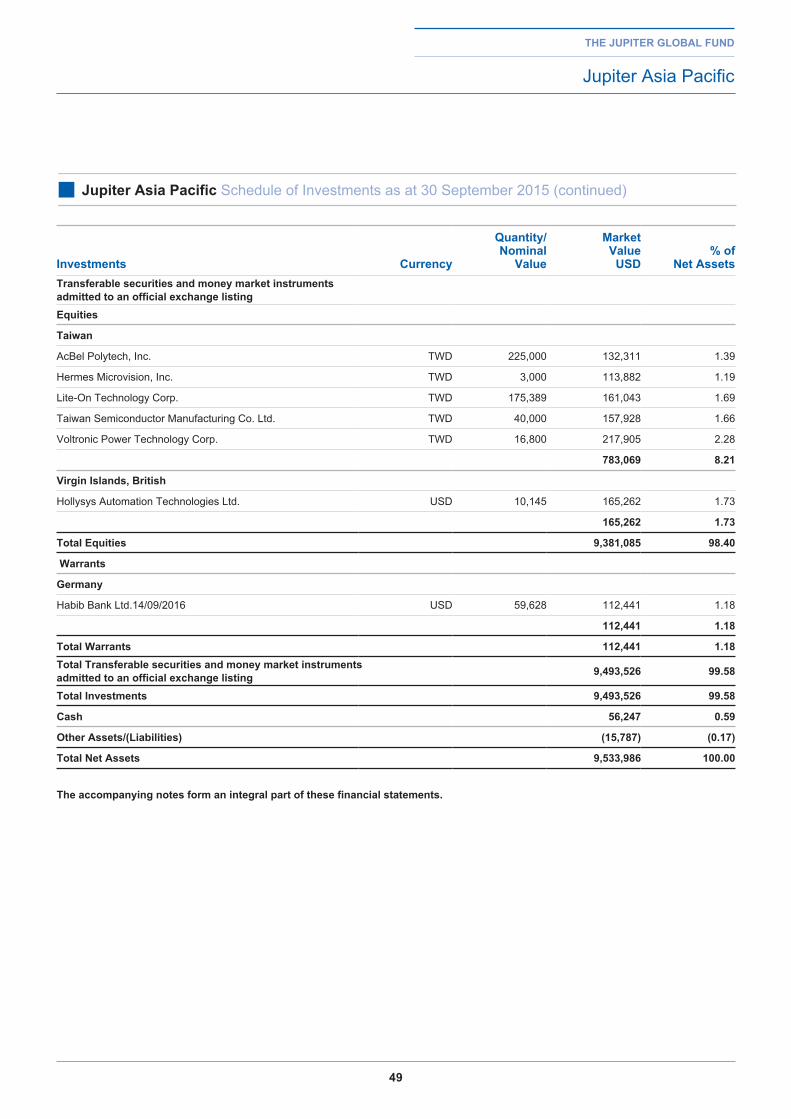
49
the jupiter global fund
Jupiter Asia Pacific
■ jupiter asia pacific Schedule of Investments as at 30 September 2015 (continued)
investments Currency
Quantity/ nominal
Value
Market Value
uSd% of
net assetstransferable securities and money market instruments admitted to an official exchange listingequities
taiwan
AcBel Polytech, Inc. TWD 225,000 132,311 1.39
Hermes Microvision, Inc. TWD 3,000 113,882 1.19
Lite-On Technology Corp. TWD 175,389 161,043 1.69
Taiwan Semiconductor Manufacturing Co. Ltd. TWD 40,000 157,928 1.66
Voltronic Power Technology Corp. TWD 16,800 217,905 2.28
783,069 8.21
Virgin islands, british
Hollysys Automation Technologies Ltd. USD 10,145 165,262 1.73
165,262 1.73
total equities 9,381,085 98.40
Warrants
germany
Habib Bank Ltd.14/09/2016 USD 59,628 112,441 1.18
112,441 1.18
total Warrants 112,441 1.18total transferable securities and money market instruments admitted to an official exchange listing 9,493,526 99.58
total investments 9,493,526 99.58
Cash 56,247 0.59
other assets/(liabilities) (15,787) (0.17)
total net assets 9,533,986 100.00
the accompanying notes form an integral part of these financial statements.
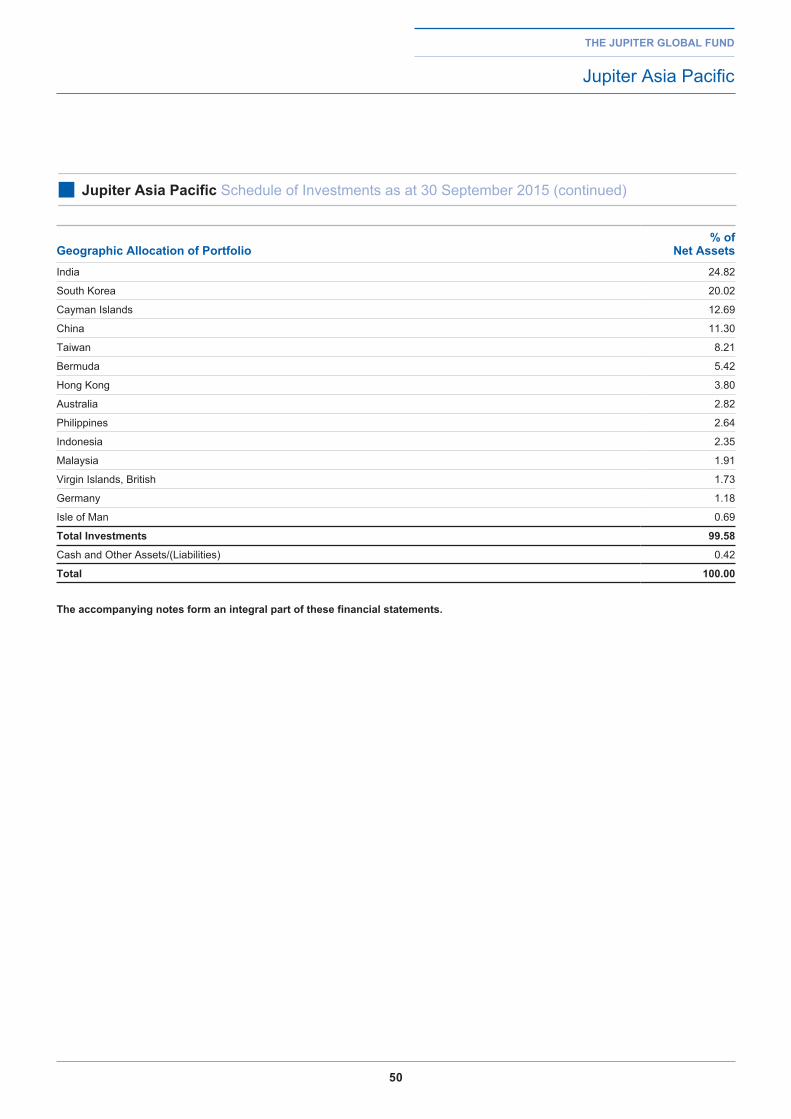
50
the jupiter global fund
Jupiter Asia Pacific
■ jupiter asia pacific Schedule of Investments as at 30 September 2015 (continued)
geographic allocation of portfolio% of
net assetsIndia 24.82
South Korea 20.02
Cayman Islands 12.69
China 11.30
Taiwan 8.21
Bermuda 5.42
Hong Kong 3.80
Australia 2.82
Philippines 2.64
Indonesia 2.35
Malaysia 1.91
Virgin Islands, British 1.73
Germany 1.18
Isle of Man 0.69
total investments 99.58
Cash and Other Assets/(Liabilities) 0.42
total 100.00
the accompanying notes form an integral part of these financial statements.
51
Market reviewThe year has been characterised by volatile markets, shifting policy and deeper reform. At the macroeconomic level, interest rate cuts and more recently, increased fiscal spending, have been pushed through to help prop up stalling growth. Key policy pushes by the leadership have included the promotion of Chinese companies abroad via the ‘one belt one road’ initiative (taking the path of ancient Silk Road as a focus for pursuing business and political goals), the reform of state-owned enterprises and the stimulation of the domestic ‘A-share’ equity market. The former two policy pushes, are healthy examples of how China still has levers that can be pulled to promote growth, even against a tough domestic macroeconomic-backdrop. However, the third of the policy initiatives – stimulating the A-share market – appears misguided. With limited alternative avenues for investment (due to a soft property market, wealth management product restrictions and lower interest rates), and a big government push to stimulate the equity market, Chinese retail investor buying during the first half of 2015 drove up domestic A-share valuations to unsustainable levels, often with the use of margin financing. At its peak, the main A-share index, the CSI 300, was up almost 150% from its mid-2014 level, and a number of smaller companies reached valuations that were multiples of Hong Kong- listed peers. Since the peak in June, the market has already corrected by almost 40% and a further correction for the smaller and more volatile businesses is still likely. The fund continues not to hold any A-shares, although we do now see some emerging opportunities in a number of businesses.
As part of the Chinese government’s ongoing structural reforms, the local government debt swap program, a gradual removal of restrictions on bank deposit rates and further liberalisation of the renminbi (RMB) have all progressed. The transition of local government debt, from the somewhat questionable ‘local government finance vehicles’ which were used to fund many public projects, into what we feel is a far better-regulated system of bonds, has improved the system of local government financing. Relaxing controls on the interest rate has also helped to reduce the risks in China’s financial system by making bank deposit rates more competitive, and consequently stemming the growth of more risky ‘wealth management products’ (often perceived by retail investors to be risk free). Government moves to allow the domestic currency (RMB) to trade gradually more freely have been a more recent initiative, and one closely monitored by the market.
policy reviewThe fund slightly underperformed its benchmark, the MSCI Zhong Hua Index, in a period of significant volatility. Our stock selection within the financials and consumer discretionary sectors was strongly positive for returns – our decision not to own several large gaming names proving beneficial. This comes despite the fund’s underweight in financials. While we believe that there continue to be individual compelling opportunities in China’s financial sector, we find fewer
stock specific opportunities within the financial sector than amongst China’s smaller, more dynamic businesses, which in our opinion can offer a better risk-reward proposition.
Among the best performing stocks in the fund was Boer Power, a business which provides electrical distribution systems in China. We took a position in the firm based on what we see as the company’s transition into higher value, higher margin product and services; a strong market opportunity, as well as an increasingly broad client mix. During the period, three of the Fund’s holdings have been or are in the process of being taken private at a premium (mostly due to management buying the business back). Even holdings such as the internet companies Baidu, JD.com and China Distance education – businesses which continued to deliver high returns on invested capital – have initiated share buyback programs because of what their management perceives to be very low valuations.
investment outlookOur investment approach is bottom-up – focusing on companies rather than taking wider economic views – and while China faces challenges in managing a shift in its economy from an industrial model, where growth is driven by government investment, towards an economy driven by domestic consumption, we remain optimistic about the outlook for many Chinese businesses. At the company level, we continue to identify significant differences between on the one hand those businesses we consider are able to embrace and benefit from the changing economy and on the other those that we think are likely to struggle. It seems likely that this split will only become increasingly apparent as Chinese leaders continue to drive reforms, and returns within the economy will more noticeably diverge between these two categories of company.
Other than changing policy, one key announcement over the coming year will be of the formal presentation of the five year plan. This will provide the blueprint for where policy makers want to focus investment over the next five years. While there are unlikely to be any big surprises, clarification will give investors better visibility into the mid-term growth prospects of certain industries.
We are still only at the beginning stage of China’s move towards letting its domestic currency (the Renminbi) trade freely. However, given China’s ambitions to gain recognition of the Renminbi by the International Monetary Fund as a major international currency, there are likely to be further exchange rate related policy moves over the next twelve months, we feel.
ross teversonfund Manager
30 September 2015
the jupiter global fund
Jupiter China Select
■ jupiter China Select Review of Portfolio as at 30 September 2015
performance
naV 30 September 2015 30 September 2014 % ChangeClass L EUR Acc €11.48 €10.97 4.65
Class L GBP A Inc £10.14 £10.22 (0.78)
Class L USD Acc $9.66 $10.35 (6.67)
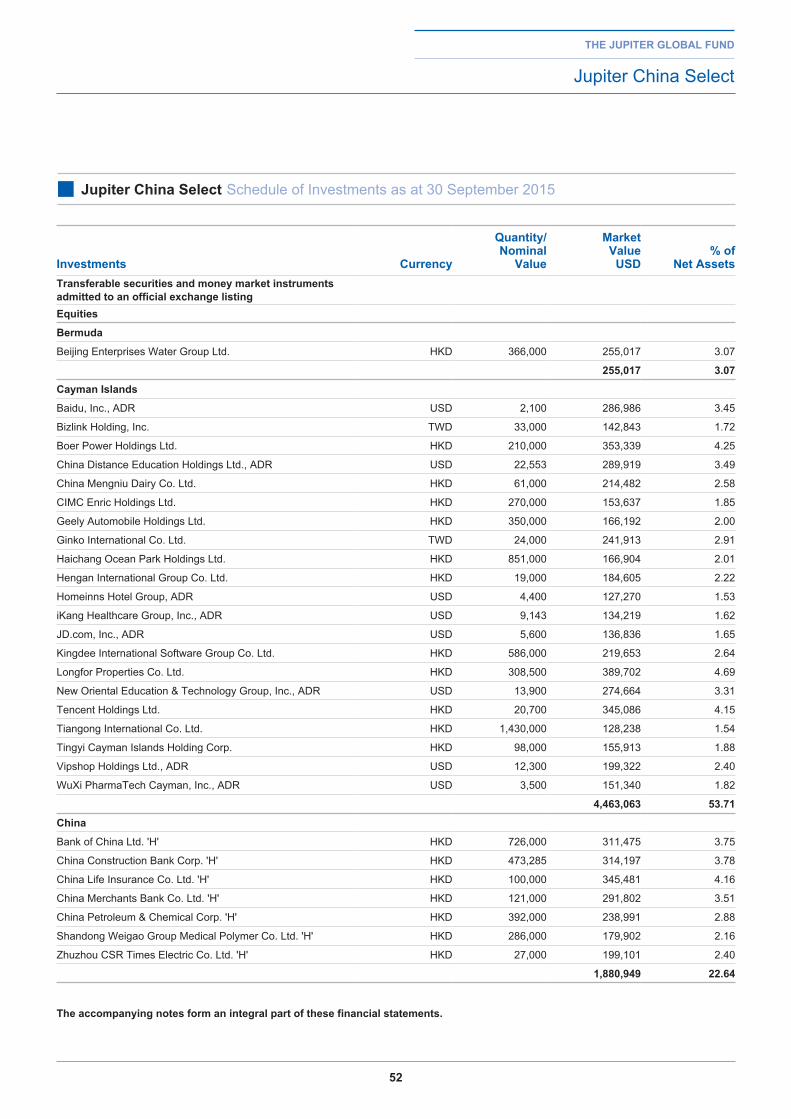
52
the jupiter global fund
Jupiter China Select
■ jupiter China Select Schedule of Investments as at 30 September 2015
investments Currency
Quantity/ nominal
Value
Market Value
uSd% of
net assetstransferable securities and money market instruments admitted to an official exchange listingequities
bermuda
Beijing Enterprises Water Group Ltd. HKD 366,000 255,017 3.07
255,017 3.07
Cayman islands
Baidu, Inc., ADR USD 2,100 286,986 3.45
Bizlink Holding, Inc. TWD 33,000 142,843 1.72
Boer Power Holdings Ltd. HKD 210,000 353,339 4.25
China Distance Education Holdings Ltd., ADR USD 22,553 289,919 3.49
China Mengniu Dairy Co. Ltd. HKD 61,000 214,482 2.58
CIMC Enric Holdings Ltd. HKD 270,000 153,637 1.85
Geely Automobile Holdings Ltd. HKD 350,000 166,192 2.00
Ginko International Co. Ltd. TWD 24,000 241,913 2.91
Haichang Ocean Park Holdings Ltd. HKD 851,000 166,904 2.01
Hengan International Group Co. Ltd. HKD 19,000 184,605 2.22
Homeinns Hotel Group, ADR USD 4,400 127,270 1.53
iKang Healthcare Group, Inc., ADR USD 9,143 134,219 1.62
JD.com, Inc., ADR USD 5,600 136,836 1.65
Kingdee International Software Group Co. Ltd. HKD 586,000 219,653 2.64
Longfor Properties Co. Ltd. HKD 308,500 389,702 4.69
New Oriental Education & Technology Group, Inc., ADR USD 13,900 274,664 3.31
Tencent Holdings Ltd. HKD 20,700 345,086 4.15
Tiangong International Co. Ltd. HKD 1,430,000 128,238 1.54
Tingyi Cayman Islands Holding Corp. HKD 98,000 155,913 1.88
Vipshop Holdings Ltd., ADR USD 12,300 199,322 2.40
WuXi PharmaTech Cayman, Inc., ADR USD 3,500 151,340 1.82
4,463,063 53.71
China
Bank of China Ltd. 'H' HKD 726,000 311,475 3.75
China Construction Bank Corp. 'H' HKD 473,285 314,197 3.78
China Life Insurance Co. Ltd. 'H' HKD 100,000 345,481 4.16
China Merchants Bank Co. Ltd. 'H' HKD 121,000 291,802 3.51
China Petroleum & Chemical Corp. 'H' HKD 392,000 238,991 2.88
Shandong Weigao Group Medical Polymer Co. Ltd. 'H' HKD 286,000 179,902 2.16
Zhuzhou CSR Times Electric Co. Ltd. 'H' HKD 27,000 199,101 2.40
1,880,949 22.64
the accompanying notes form an integral part of these financial statements.
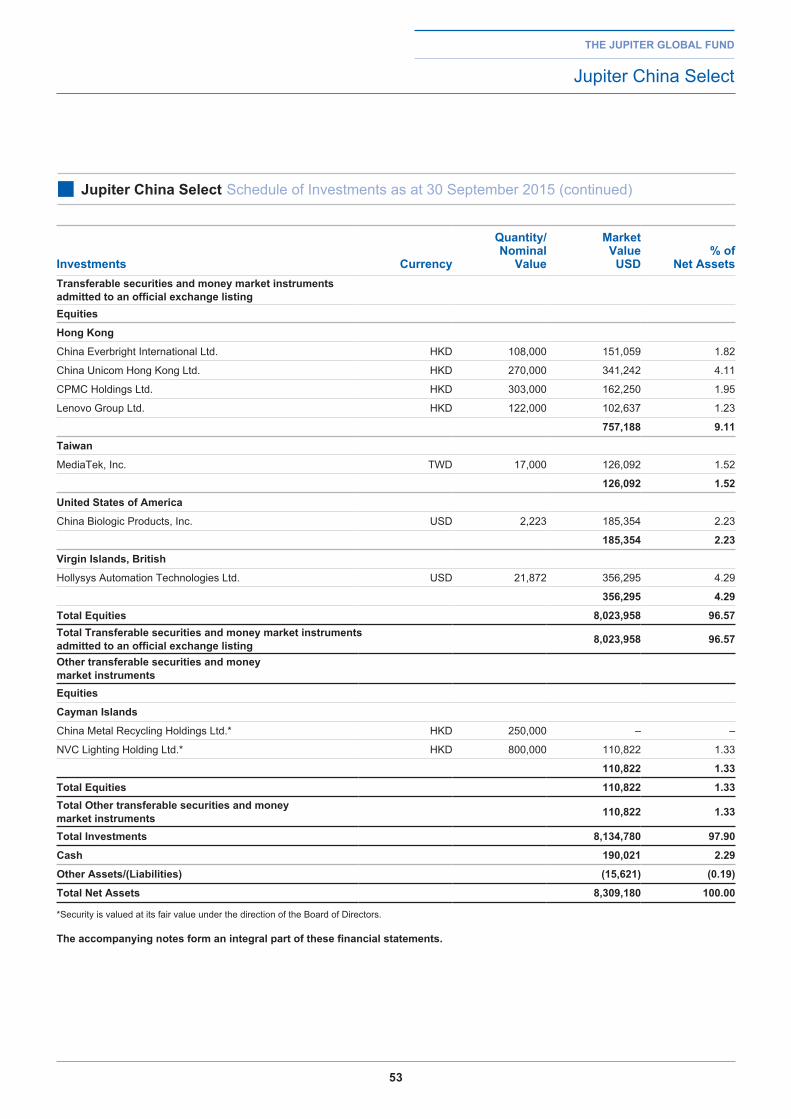
53
the jupiter global fund
Jupiter China Select
■ jupiter China Select Schedule of Investments as at 30 September 2015 (continued)
investments Currency
Quantity/ nominal
Value
Market Value
uSd% of
net assetstransferable securities and money market instruments admitted to an official exchange listingequities
hong Kong
China Everbright International Ltd. HKD 108,000 151,059 1.82
China Unicom Hong Kong Ltd. HKD 270,000 341,242 4.11
CPMC Holdings Ltd. HKD 303,000 162,250 1.95
Lenovo Group Ltd. HKD 122,000 102,637 1.23
757,188 9.11
taiwan
MediaTek, Inc. TWD 17,000 126,092 1.52
126,092 1.52
united States of america
China Biologic Products, Inc. USD 2,223 185,354 2.23
185,354 2.23
Virgin islands, british
Hollysys Automation Technologies Ltd. USD 21,872 356,295 4.29
356,295 4.29
total equities 8,023,958 96.57total transferable securities and money market instruments admitted to an official exchange listing 8,023,958 96.57
other transferable securities and money market instrumentsequities
Cayman islands
China Metal Recycling Holdings Ltd.* HKD 250,000 – –
NVC Lighting Holding Ltd.* HKD 800,000 110,822 1.33
110,822 1.33
total equities 110,822 1.33total other transferable securities and money market instruments 110,822 1.33
total investments 8,134,780 97.90
Cash 190,021 2.29
other assets/(liabilities) (15,621) (0.19)
total net assets 8,309,180 100.00
*Security is valued at its fair value under the direction of the Board of Directors.
the accompanying notes form an integral part of these financial statements.
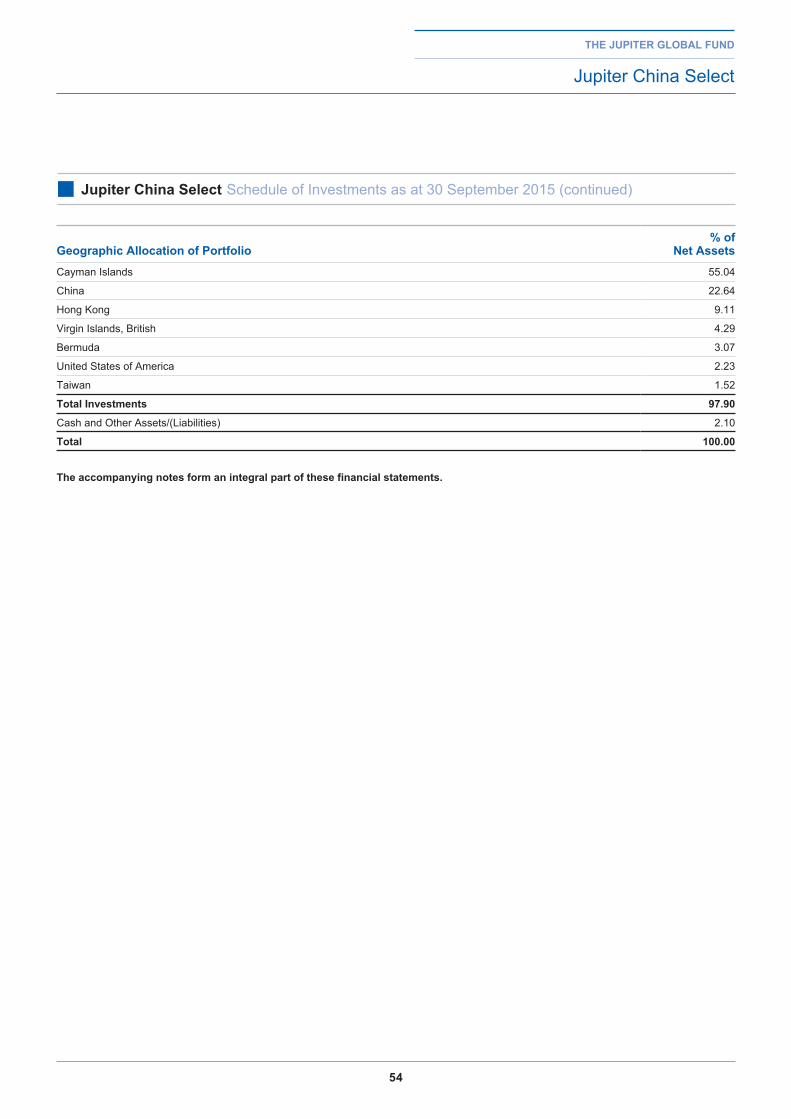
54
the jupiter global fund
Jupiter China Select
■ jupiter China Select Schedule of Investments as at 30 September 2015 (continued)
geographic allocation of portfolio% of
net assetsCayman Islands 55.04
China 22.64
Hong Kong 9.11
Virgin Islands, British 4.29
Bermuda 3.07
United States of America 2.23
Taiwan 1.52
total investments 97.90
Cash and Other Assets/(Liabilities) 2.10
total 100.00
the accompanying notes form an integral part of these financial statements.
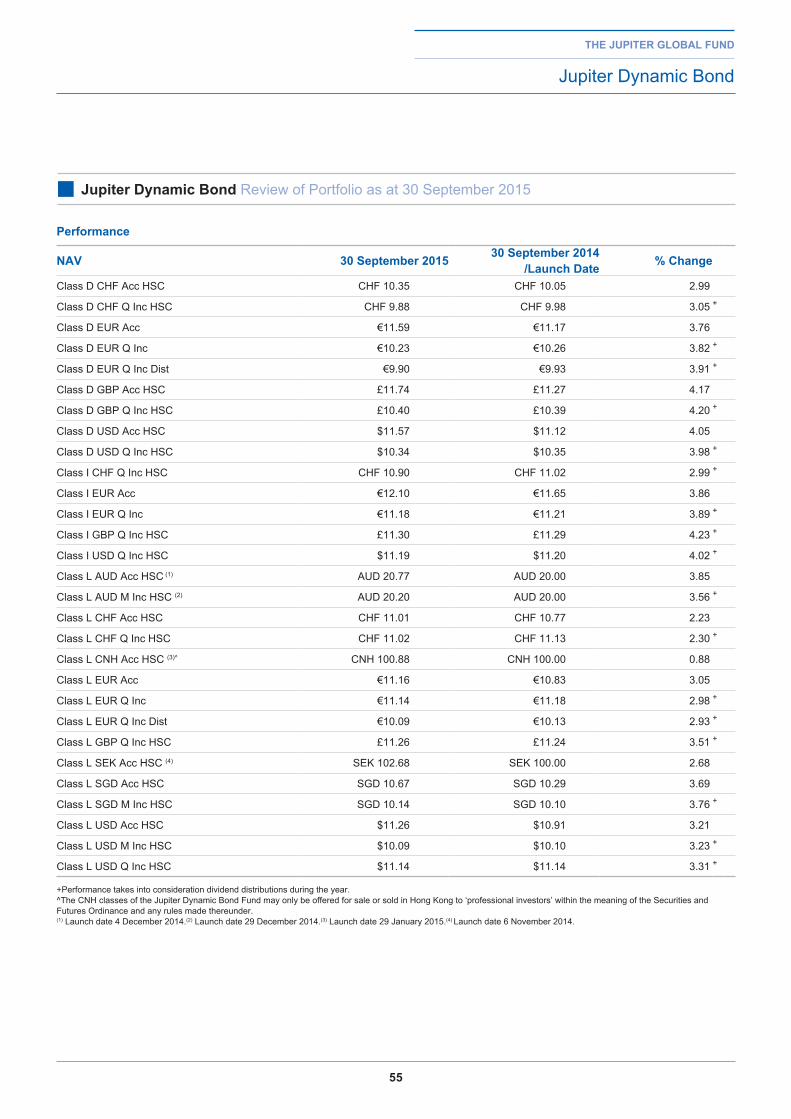
55
the jupiter global fund
Jupiter Dynamic Bond
■ jupiter dynamic bond Review of Portfolio as at 30 September 2015
performance
naV 30 September 2015 30 September 2014 /launch date % Change
Class D CHF Acc HSC CHF 10.35 CHF 10.05 2.99
Class D CHF Q Inc HSC CHF 9.88 CHF 9.98 3.05 +
Class D EUR Acc €11.59 €11.17 3.76
Class D EUR Q Inc €10.23 €10.26 3.82 +
Class D EUR Q Inc Dist €9.90 €9.93 3.91 +
Class D GBP Acc HSC £11.74 £11.27 4.17
Class D GBP Q Inc HSC £10.40 £10.39 4.20 +
Class D USD Acc HSC $11.57 $11.12 4.05
Class D USD Q Inc HSC $10.34 $10.35 3.98 +
Class I CHF Q Inc HSC CHF 10.90 CHF 11.02 2.99 +
Class I EUR Acc €12.10 €11.65 3.86
Class I EUR Q Inc €11.18 €11.21 3.89 +
Class I GBP Q Inc HSC £11.30 £11.29 4.23 +
Class I USD Q Inc HSC $11.19 $11.20 4.02 +
Class L AUD Acc HSC (1) AUD 20.77 AUD 20.00 3.85
Class L AUD M Inc HSC (2) AUD 20.20 AUD 20.00 3.56 +
Class L CHF Acc HSC CHF 11.01 CHF 10.77 2.23
Class L CHF Q Inc HSC CHF 11.02 CHF 11.13 2.30 +
Class L CNH Acc HSC (3)^ CNH 100.88 CNH 100.00 0.88
Class L EUR Acc €11.16 €10.83 3.05
Class L EUR Q Inc €11.14 €11.18 2.98 +
Class L EUR Q Inc Dist €10.09 €10.13 2.93 +
Class L GBP Q Inc HSC £11.26 £11.24 3.51 +
Class L SEK Acc HSC (4) SEK 102.68 SEK 100.00 2.68
Class L SGD Acc HSC SGD 10.67 SGD 10.29 3.69
Class L SGD M Inc HSC SGD 10.14 SGD 10.10 3.76 +
Class L USD Acc HSC $11.26 $10.91 3.21
Class L USD M Inc HSC $10.09 $10.10 3.23 +
Class L USD Q Inc HSC $11.14 $11.14 3.31 +
+Performance takes into consideration dividend distributions during the year.^The CNH classes of the Jupiter Dynamic Bond Fund may only be offered for sale or sold in Hong Kong to ‘professional investors’ within the meaning of the Securities and Futures Ordinance and any rules made thereunder. (1) Launch date 4 December 2014.(2) Launch date 29 December 2014.(3) Launch date 29 January 2015.(4) Launch date 6 November 2014.
56
the jupiter global fund
Jupiter Dynamic Bond
■ jupiter dynamic bond Review of Portfolio as at 30 September 2015 (continued)
Market reviewThere were tricky times for markets at the start of the period under review as the US Federal Reserve’s (Fed) quantitative easing programme was finally brought to a conclusion after a lengthy period of tapering. Markets started to anticipate further tightening by the Fed in 2015. However, the withdrawal of quantitative easing (QE) was akin to turning off the tap of US dollar liquidity in the global financial system. As the US dollar rallied in the final quarter of 2014, cracks started to appear both at home and abroad. US exporters became less competitive and many emerging market countries with large dollar-denominated debts looked vulnerable. China looked particularly at risk of a shock at a time when its economy was slowing fast and policy makers were grappling with an overinflated shadow banking sector. Meanwhile, the spectre of deflation haunted the eurozone, where a combination of structural weakness, the risk of a Greek exit and the impact of economic sanctions against Russia challenged policy makers. Oil and commodities slumped as a sign of falling global demand and these events forced the Fed to delay planned interest rate rises.
Deflation is notoriously difficult to combat and early 2015 saw a step up in central bank policy easing around the world. This included a weighty €1.1tn QE programme from the European Central Bank (ECB), the introduction of which had a profound impact on European government bond yields. Many shorter-dated government issued bonds dropped into negative territory, while Germany’s 10 year bund yields hit an all-time low of just above 0%. Elsewhere, Japan expanded its QE programme, while China’s central banks cut interest rates and took steps to shore up its financial sector. Each of these programmes added to the global ‘hunt for yield’ that squeezed risk premium out of bond markets. Sentiment reversed somewhat in April as inflation expectations showed nascent signs of recovering.
Fraught negotiations between the Greek government and the Troika and uncertainty over Federal Reserve policy dominated markets in the June quarter. Stock markets in China, which had been pushed to unsustainable highs in preceding months, finally collapsed at the end of July. This was followed by a sharp sell-off across global equity markets towards the end of August. The sudden deterioration of a range of leading indicators, coupled with another leg-down in prices of global commodities (such as oil and gold), appeared to be taken by the market as an indication that global economic activity was weakening further, led by China. Market sentiment, already jittery ahead of a possible September interest rate rise by the US Federal Reserve, was dampened further by China’s yuan devaluation in early August, leading to emerging market currencies and assets once again being crushed, with many already at record lows against the dollar. Volatility soared, while yields on ‘safe haven’ assets such as long-dated US treasuries and German bunds pushed lower as investors flocked out of riskier assets.
In the event, in September, the Fed was obliged to keep rates on hold almost eight years after first bringing them into the 0-0.25 per cent band. Unsurprisingly given that the decision to abstain suggests persistent problems in the economy, the stock market’s reaction has been mixed. However, bonds rallied hard, with the 2 year US Treasury posting its strongest rebound since 2009 when QE was first announced.
policy reviewIn the fourth quarter of 2014, the manager’s focus on seeking to preserve capital in difficult conditions detracted from returns for the fund. Additional pressures came from the weak returns made by the
fund’s Greek sovereign holdings (which we exited early in the period) and the negative effects of the falling oil price on our holdings in the oil-rig space. However, we benefited from exposure to the US dollar, as well as Australian and Argentinian sovereign debt.
Nonetheless, the fund had a decent start to 2015, driven by its exposure to sovereign bonds. The lion’s share of returns came from our Australian government debt exposure (hedged so as to mitigate the risk of currency depreciation), which we continued to build during the period. These bonds rallied after the Reserve Bank of Australia cut interest rates in February. However, by the summer, our Australia exposure was weighing on performance. Our case for holding these bonds is unchanged: namely, our ongoing concerns about the economic slowdown in China, which has exposed deep imbalances in the Aussie economy. Mining as a percentage of capital spending in Australia has continued to fall and there is little evidence that the recent interest rate cuts have led to a pickup in capital formation elsewhere in the economy and wage growth has continued to fall. We therefore believe the Reserve Bank of Australia will be forced to cut interest rates further in an effort to help rebalance the economy.
The fund’s exposure to the US dollar proved beneficial in the first quarter, with sterling coming under pressure ahead of the UK national election in May.
Our credit positions, on the other hand, added good value in the course of the summer. Highlights included our exposure to the Mexican oil rig sector. A number of factors led to a sharp re-rating of these bonds. These included a bottoming out of the oil price, a perception in the market that the bond sell-off in some of these higher quality names was overdone and some positive credit-specific news.
There were no major strategic changes to the fund during the second quarter of 2015, but we used the market’s weakness to add to some of our existing positions. These included additions to subordinated paper in UK banks and our tactical position in Cypriot government bonds. We cut some of our long US dollar exposure as the dollar’s strength has dampened the domestic economy and put the Fed in a predicament when it comes to interest rate policy.
The fund remained resilient during a volatile third quarter. We have been underweight emerging market corporate and government bonds for some time, a decision that has spared the fund some of the steep losses inflicted on emerging market investors in recent months. An exception is India, where our local currency bond holdings increased in value after the Reserve Bank of India decided to cut interest rates in September.
Our position in longer-dated Australian and New Zealand government bonds made gains over the quarter as the prospects for global growth weakened. We believe further interest rate cuts are likely as both economies continue to feel the impact of the China slowdown.
Within our allocation to bonds issued by corporates, our preference for Europe over the US proved beneficial as the US corporate bond index was negatively affected by its high exposure to the energy sector.
We have been reducing our high yield exposure and adding to our positions in government bonds and investment grade corporates. As well as longer-dated US treasuries, we have of late also been buying short-dated US paper as we think that the Fed will flip from being hawkish to dovish as sentiment weakens and the economic picture becomes gloomier.
57
the jupiter global fund
Jupiter Dynamic Bond
■ jupiter dynamic bond Review of Portfolio as at 30 September 2015 (continued)
investment outlookIn our view, the decision to keep interest rates on hold was the latest signal that attempts by global central banks to slay the spectre of deflation have failed. Globally, nearly 30% of countries are now gripped by deflation, while in nearly 60% of countries inflation is less than 2%1 Consensus forecasts for GDP growth have also been slashed since the start of the year, amid mounting evidence that emerging market economies are slowing at an alarming rate. As concerns about the health of the global economy have grown, we have adopted a more cautious stance, sacrificing some yield in order to preserve capital. The average duration of the Jupiter Dynamic Bond Fund is over 5 years, while the average credit rating currently stands at triple B+. We think governments with sound finances which have control of their printing press are attractive in this economic environment. With our belief that yields are unlikely to move much higher in this world, high quality sovereigns should provide an effective hedge against deflationary shocks.
ariel bezalelfund Manager
30 September 2015
1Source: Bank of America Merrill Lynch, September 2015.
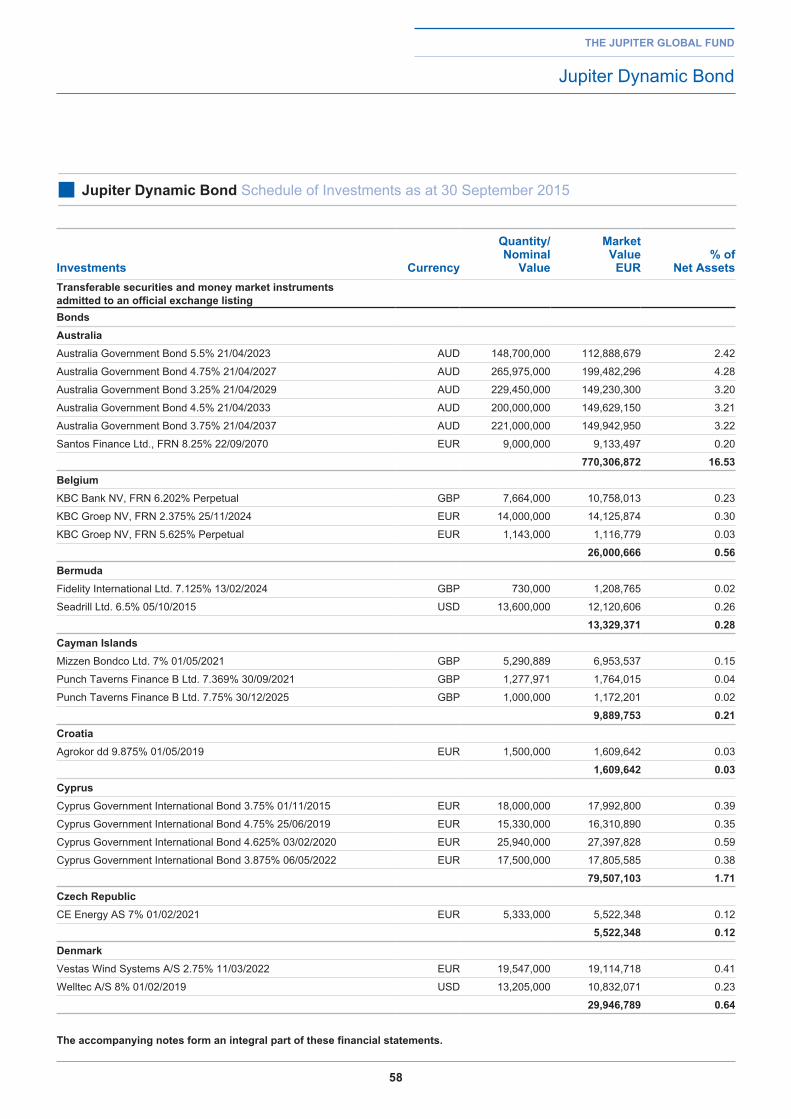
58
the jupiter global fund
Jupiter Dynamic Bond
■ jupiter dynamic bond Schedule of Investments as at 30 September 2015
investments Currency
Quantity/ nominal
Value
Market Value
eur% of
net assetstransferable securities and money market instruments admitted to an official exchange listingbondsaustraliaAustralia Government Bond 5.5% 21/04/2023 AUD 148,700,000 112,888,679 2.42
Australia Government Bond 4.75% 21/04/2027 AUD 265,975,000 199,482,296 4.28
Australia Government Bond 3.25% 21/04/2029 AUD 229,450,000 149,230,300 3.20
Australia Government Bond 4.5% 21/04/2033 AUD 200,000,000 149,629,150 3.21
Australia Government Bond 3.75% 21/04/2037 AUD 221,000,000 149,942,950 3.22
Santos Finance Ltd., FRN 8.25% 22/09/2070 EUR 9,000,000 9,133,497 0.20
770,306,872 16.53belgiumKBC Bank NV, FRN 6.202% Perpetual GBP 7,664,000 10,758,013 0.23
KBC Groep NV, FRN 2.375% 25/11/2024 EUR 14,000,000 14,125,874 0.30
KBC Groep NV, FRN 5.625% Perpetual EUR 1,143,000 1,116,779 0.03
26,000,666 0.56bermudaFidelity International Ltd. 7.125% 13/02/2024 GBP 730,000 1,208,765 0.02
Seadrill Ltd. 6.5% 05/10/2015 USD 13,600,000 12,120,606 0.26
13,329,371 0.28Cayman islandsMizzen Bondco Ltd. 7% 01/05/2021 GBP 5,290,889 6,953,537 0.15
Punch Taverns Finance B Ltd. 7.369% 30/09/2021 GBP 1,277,971 1,764,015 0.04
Punch Taverns Finance B Ltd. 7.75% 30/12/2025 GBP 1,000,000 1,172,201 0.02
9,889,753 0.21CroatiaAgrokor dd 9.875% 01/05/2019 EUR 1,500,000 1,609,642 0.03
1,609,642 0.03CyprusCyprus Government International Bond 3.75% 01/11/2015 EUR 18,000,000 17,992,800 0.39
Cyprus Government International Bond 4.75% 25/06/2019 EUR 15,330,000 16,310,890 0.35
Cyprus Government International Bond 4.625% 03/02/2020 EUR 25,940,000 27,397,828 0.59
Cyprus Government International Bond 3.875% 06/05/2022 EUR 17,500,000 17,805,585 0.38
79,507,103 1.71Czech republicCE Energy AS 7% 01/02/2021 EUR 5,333,000 5,522,348 0.12
5,522,348 0.12denmarkVestas Wind Systems A/S 2.75% 11/03/2022 EUR 19,547,000 19,114,718 0.41
Welltec A/S 8% 01/02/2019 USD 13,205,000 10,832,071 0.23
29,946,789 0.64
the accompanying notes form an integral part of these financial statements.
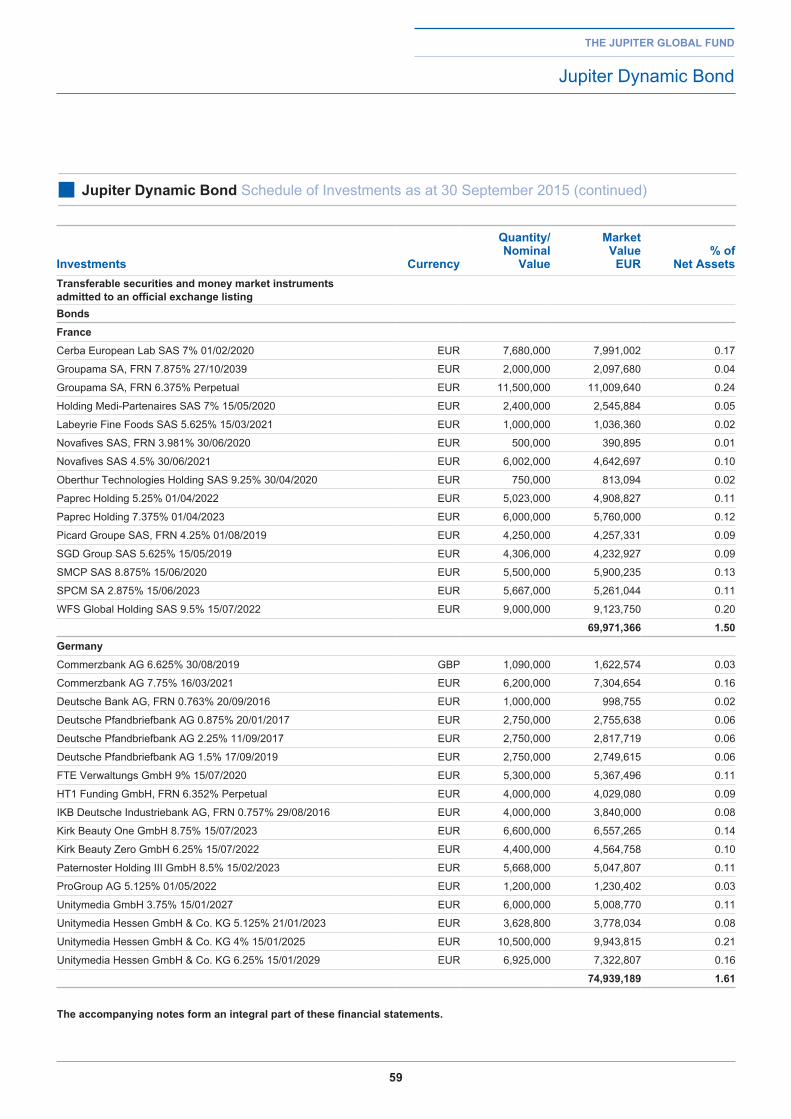
59
the jupiter global fund
Jupiter Dynamic Bond
■ jupiter dynamic bond Schedule of Investments as at 30 September 2015 (continued)
investments Currency
Quantity/ nominal
Value
Market Value
eur% of
net assetstransferable securities and money market instruments admitted to an official exchange listingbonds franceCerba European Lab SAS 7% 01/02/2020 EUR 7,680,000 7,991,002 0.17
Groupama SA, FRN 7.875% 27/10/2039 EUR 2,000,000 2,097,680 0.04
Groupama SA, FRN 6.375% Perpetual EUR 11,500,000 11,009,640 0.24
Holding Medi-Partenaires SAS 7% 15/05/2020 EUR 2,400,000 2,545,884 0.05
Labeyrie Fine Foods SAS 5.625% 15/03/2021 EUR 1,000,000 1,036,360 0.02
Novafives SAS, FRN 3.981% 30/06/2020 EUR 500,000 390,895 0.01
Novafives SAS 4.5% 30/06/2021 EUR 6,002,000 4,642,697 0.10
Oberthur Technologies Holding SAS 9.25% 30/04/2020 EUR 750,000 813,094 0.02
Paprec Holding 5.25% 01/04/2022 EUR 5,023,000 4,908,827 0.11
Paprec Holding 7.375% 01/04/2023 EUR 6,000,000 5,760,000 0.12
Picard Groupe SAS, FRN 4.25% 01/08/2019 EUR 4,250,000 4,257,331 0.09
SGD Group SAS 5.625% 15/05/2019 EUR 4,306,000 4,232,927 0.09
SMCP SAS 8.875% 15/06/2020 EUR 5,500,000 5,900,235 0.13
SPCM SA 2.875% 15/06/2023 EUR 5,667,000 5,261,044 0.11
WFS Global Holding SAS 9.5% 15/07/2022 EUR 9,000,000 9,123,750 0.20
69,971,366 1.50germanyCommerzbank AG 6.625% 30/08/2019 GBP 1,090,000 1,622,574 0.03
Commerzbank AG 7.75% 16/03/2021 EUR 6,200,000 7,304,654 0.16
Deutsche Bank AG, FRN 0.763% 20/09/2016 EUR 1,000,000 998,755 0.02
Deutsche Pfandbriefbank AG 0.875% 20/01/2017 EUR 2,750,000 2,755,638 0.06
Deutsche Pfandbriefbank AG 2.25% 11/09/2017 EUR 2,750,000 2,817,719 0.06
Deutsche Pfandbriefbank AG 1.5% 17/09/2019 EUR 2,750,000 2,749,615 0.06
FTE Verwaltungs GmbH 9% 15/07/2020 EUR 5,300,000 5,367,496 0.11
HT1 Funding GmbH, FRN 6.352% Perpetual EUR 4,000,000 4,029,080 0.09
IKB Deutsche Industriebank AG, FRN 0.757% 29/08/2016 EUR 4,000,000 3,840,000 0.08
Kirk Beauty One GmbH 8.75% 15/07/2023 EUR 6,600,000 6,557,265 0.14
Kirk Beauty Zero GmbH 6.25% 15/07/2022 EUR 4,400,000 4,564,758 0.10
Paternoster Holding III GmbH 8.5% 15/02/2023 EUR 5,668,000 5,047,807 0.11
ProGroup AG 5.125% 01/05/2022 EUR 1,200,000 1,230,402 0.03
Unitymedia GmbH 3.75% 15/01/2027 EUR 6,000,000 5,008,770 0.11
Unitymedia Hessen GmbH & Co. KG 5.125% 21/01/2023 EUR 3,628,800 3,778,034 0.08
Unitymedia Hessen GmbH & Co. KG 4% 15/01/2025 EUR 10,500,000 9,943,815 0.21
Unitymedia Hessen GmbH & Co. KG 6.25% 15/01/2029 EUR 6,925,000 7,322,807 0.16
74,939,189 1.61
the accompanying notes form an integral part of these financial statements.
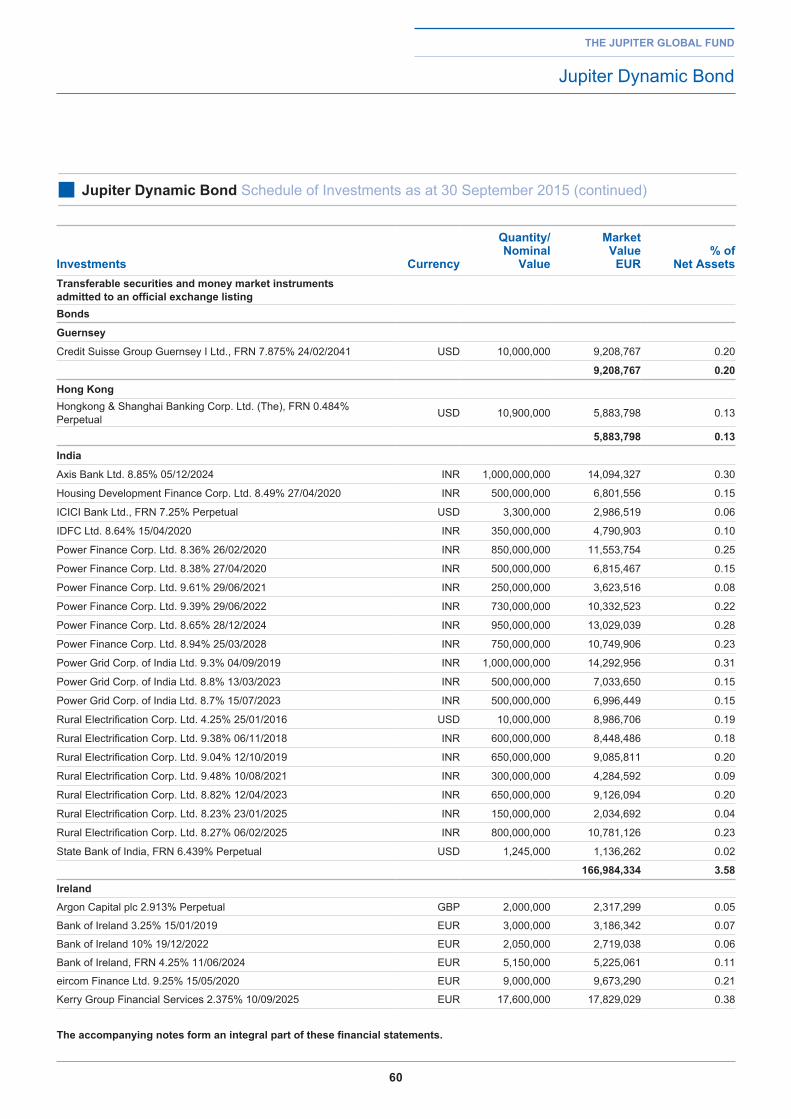
60
the jupiter global fund
Jupiter Dynamic Bond
■ jupiter dynamic bond Schedule of Investments as at 30 September 2015 (continued)
investments Currency
Quantity/ nominal
Value
Market Value
eur% of
net assetstransferable securities and money market instruments admitted to an official exchange listingbonds
guernsey
Credit Suisse Group Guernsey I Ltd., FRN 7.875% 24/02/2041 USD 10,000,000 9,208,767 0.20
9,208,767 0.20
hong KongHongkong & Shanghai Banking Corp. Ltd. (The), FRN 0.484% Perpetual USD 10,900,000 5,883,798 0.13
5,883,798 0.13
india
Axis Bank Ltd. 8.85% 05/12/2024 INR 1,000,000,000 14,094,327 0.30
Housing Development Finance Corp. Ltd. 8.49% 27/04/2020 INR 500,000,000 6,801,556 0.15
ICICI Bank Ltd., FRN 7.25% Perpetual USD 3,300,000 2,986,519 0.06
IDFC Ltd. 8.64% 15/04/2020 INR 350,000,000 4,790,903 0.10
Power Finance Corp. Ltd. 8.36% 26/02/2020 INR 850,000,000 11,553,754 0.25
Power Finance Corp. Ltd. 8.38% 27/04/2020 INR 500,000,000 6,815,467 0.15
Power Finance Corp. Ltd. 9.61% 29/06/2021 INR 250,000,000 3,623,516 0.08
Power Finance Corp. Ltd. 9.39% 29/06/2022 INR 730,000,000 10,332,523 0.22
Power Finance Corp. Ltd. 8.65% 28/12/2024 INR 950,000,000 13,029,039 0.28
Power Finance Corp. Ltd. 8.94% 25/03/2028 INR 750,000,000 10,749,906 0.23
Power Grid Corp. of India Ltd. 9.3% 04/09/2019 INR 1,000,000,000 14,292,956 0.31
Power Grid Corp. of India Ltd. 8.8% 13/03/2023 INR 500,000,000 7,033,650 0.15
Power Grid Corp. of India Ltd. 8.7% 15/07/2023 INR 500,000,000 6,996,449 0.15
Rural Electrification Corp. Ltd. 4.25% 25/01/2016 USD 10,000,000 8,986,706 0.19
Rural Electrification Corp. Ltd. 9.38% 06/11/2018 INR 600,000,000 8,448,486 0.18
Rural Electrification Corp. Ltd. 9.04% 12/10/2019 INR 650,000,000 9,085,811 0.20
Rural Electrification Corp. Ltd. 9.48% 10/08/2021 INR 300,000,000 4,284,592 0.09
Rural Electrification Corp. Ltd. 8.82% 12/04/2023 INR 650,000,000 9,126,094 0.20
Rural Electrification Corp. Ltd. 8.23% 23/01/2025 INR 150,000,000 2,034,692 0.04
Rural Electrification Corp. Ltd. 8.27% 06/02/2025 INR 800,000,000 10,781,126 0.23
State Bank of India, FRN 6.439% Perpetual USD 1,245,000 1,136,262 0.02
166,984,334 3.58irelandArgon Capital plc 2.913% Perpetual GBP 2,000,000 2,317,299 0.05
Bank of Ireland 3.25% 15/01/2019 EUR 3,000,000 3,186,342 0.07
Bank of Ireland 10% 19/12/2022 EUR 2,050,000 2,719,038 0.06
Bank of Ireland, FRN 4.25% 11/06/2024 EUR 5,150,000 5,225,061 0.11
eircom Finance Ltd. 9.25% 15/05/2020 EUR 9,000,000 9,673,290 0.21
Kerry Group Financial Services 2.375% 10/09/2025 EUR 17,600,000 17,829,029 0.38
the accompanying notes form an integral part of these financial statements.
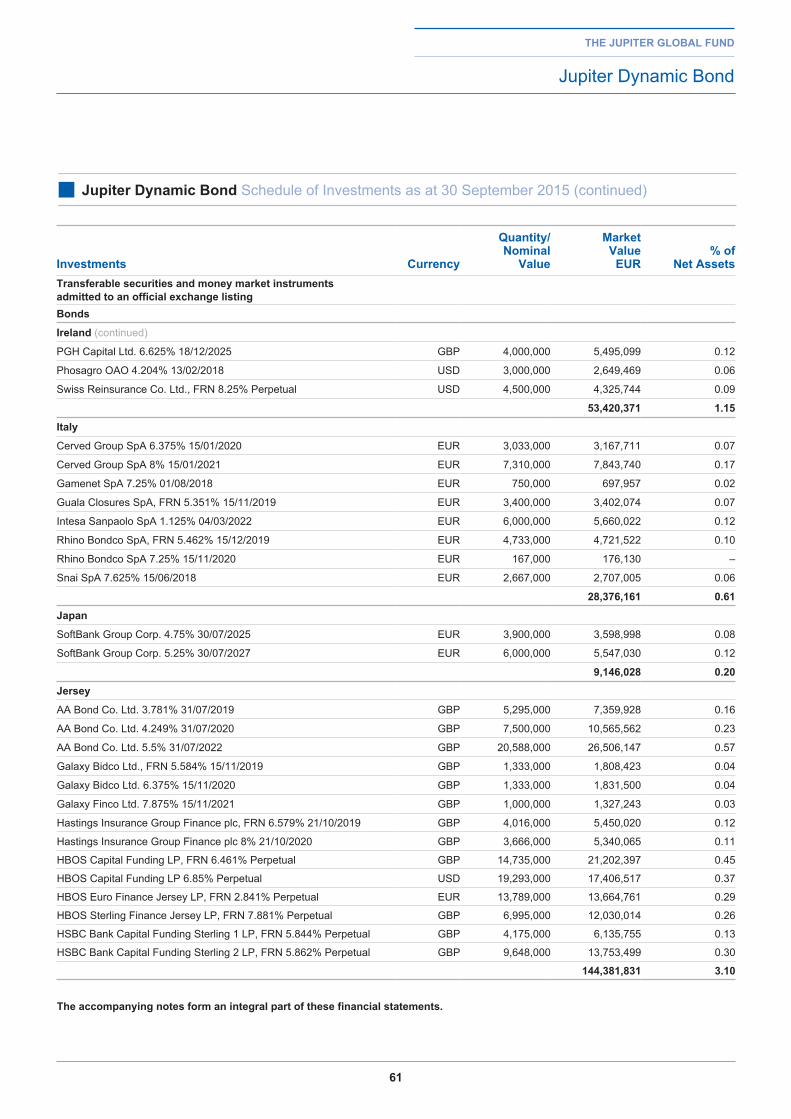
61
the jupiter global fund
Jupiter Dynamic Bond
■ jupiter dynamic bond Schedule of Investments as at 30 September 2015 (continued)
investments Currency
Quantity/ nominal
Value
Market Value
eur% of
net assetstransferable securities and money market instruments admitted to an official exchange listingbonds
ireland (continued)
PGH Capital Ltd. 6.625% 18/12/2025 GBP 4,000,000 5,495,099 0.12
Phosagro OAO 4.204% 13/02/2018 USD 3,000,000 2,649,469 0.06
Swiss Reinsurance Co. Ltd., FRN 8.25% Perpetual USD 4,500,000 4,325,744 0.09
53,420,371 1.15
italy
Cerved Group SpA 6.375% 15/01/2020 EUR 3,033,000 3,167,711 0.07
Cerved Group SpA 8% 15/01/2021 EUR 7,310,000 7,843,740 0.17
Gamenet SpA 7.25% 01/08/2018 EUR 750,000 697,957 0.02
Guala Closures SpA, FRN 5.351% 15/11/2019 EUR 3,400,000 3,402,074 0.07
Intesa Sanpaolo SpA 1.125% 04/03/2022 EUR 6,000,000 5,660,022 0.12
Rhino Bondco SpA, FRN 5.462% 15/12/2019 EUR 4,733,000 4,721,522 0.10
Rhino Bondco SpA 7.25% 15/11/2020 EUR 167,000 176,130 –
Snai SpA 7.625% 15/06/2018 EUR 2,667,000 2,707,005 0.06
28,376,161 0.61
japan
SoftBank Group Corp. 4.75% 30/07/2025 EUR 3,900,000 3,598,998 0.08
SoftBank Group Corp. 5.25% 30/07/2027 EUR 6,000,000 5,547,030 0.12
9,146,028 0.20
jersey
AA Bond Co. Ltd. 3.781% 31/07/2019 GBP 5,295,000 7,359,928 0.16
AA Bond Co. Ltd. 4.249% 31/07/2020 GBP 7,500,000 10,565,562 0.23
AA Bond Co. Ltd. 5.5% 31/07/2022 GBP 20,588,000 26,506,147 0.57
Galaxy Bidco Ltd., FRN 5.584% 15/11/2019 GBP 1,333,000 1,808,423 0.04
Galaxy Bidco Ltd. 6.375% 15/11/2020 GBP 1,333,000 1,831,500 0.04
Galaxy Finco Ltd. 7.875% 15/11/2021 GBP 1,000,000 1,327,243 0.03
Hastings Insurance Group Finance plc, FRN 6.579% 21/10/2019 GBP 4,016,000 5,450,020 0.12
Hastings Insurance Group Finance plc 8% 21/10/2020 GBP 3,666,000 5,340,065 0.11
HBOS Capital Funding LP, FRN 6.461% Perpetual GBP 14,735,000 21,202,397 0.45
HBOS Capital Funding LP 6.85% Perpetual USD 19,293,000 17,406,517 0.37
HBOS Euro Finance Jersey LP, FRN 2.841% Perpetual EUR 13,789,000 13,664,761 0.29
HBOS Sterling Finance Jersey LP, FRN 7.881% Perpetual GBP 6,995,000 12,030,014 0.26
HSBC Bank Capital Funding Sterling 1 LP, FRN 5.844% Perpetual GBP 4,175,000 6,135,755 0.13
HSBC Bank Capital Funding Sterling 2 LP, FRN 5.862% Perpetual GBP 9,648,000 13,753,499 0.30
144,381,831 3.10
the accompanying notes form an integral part of these financial statements.
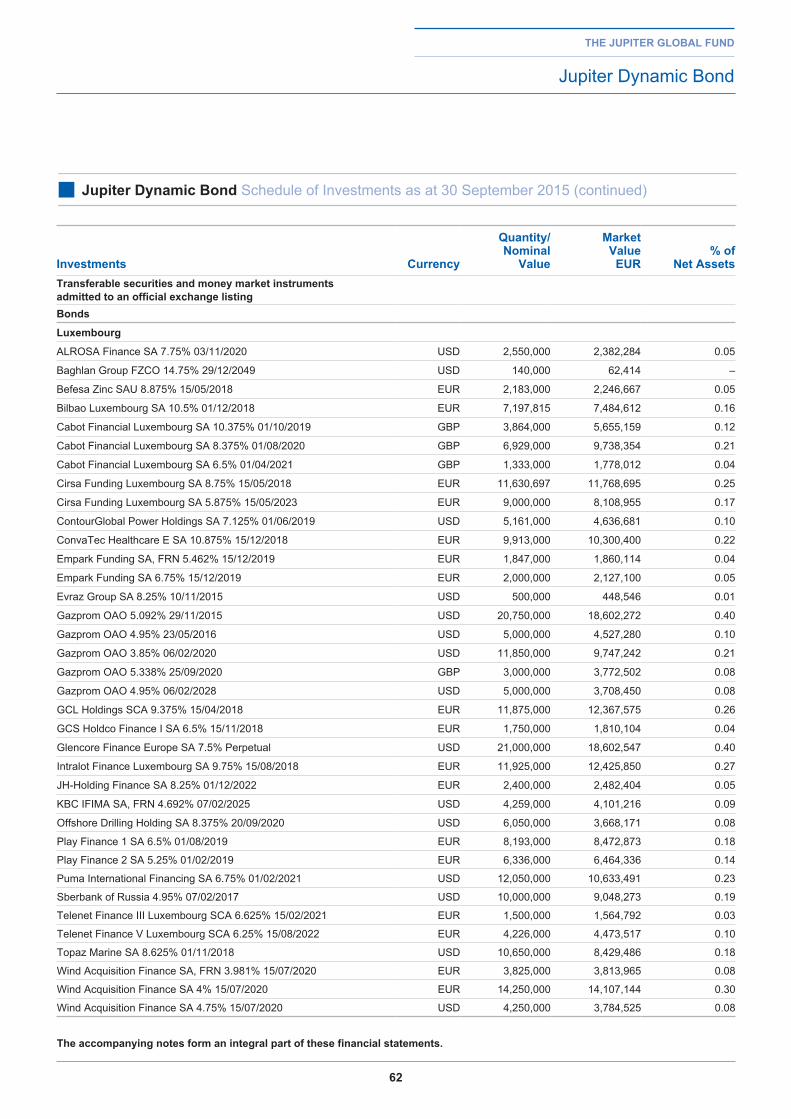
62
the jupiter global fund
Jupiter Dynamic Bond
■ jupiter dynamic bond Schedule of Investments as at 30 September 2015 (continued)
investments Currency
Quantity/ nominal
Value
Market Value
eur% of
net assetstransferable securities and money market instruments admitted to an official exchange listingbonds
luxembourg
ALROSA Finance SA 7.75% 03/11/2020 USD 2,550,000 2,382,284 0.05
Baghlan Group FZCO 14.75% 29/12/2049 USD 140,000 62,414 –
Befesa Zinc SAU 8.875% 15/05/2018 EUR 2,183,000 2,246,667 0.05
Bilbao Luxembourg SA 10.5% 01/12/2018 EUR 7,197,815 7,484,612 0.16
Cabot Financial Luxembourg SA 10.375% 01/10/2019 GBP 3,864,000 5,655,159 0.12
Cabot Financial Luxembourg SA 8.375% 01/08/2020 GBP 6,929,000 9,738,354 0.21
Cabot Financial Luxembourg SA 6.5% 01/04/2021 GBP 1,333,000 1,778,012 0.04
Cirsa Funding Luxembourg SA 8.75% 15/05/2018 EUR 11,630,697 11,768,695 0.25
Cirsa Funding Luxembourg SA 5.875% 15/05/2023 EUR 9,000,000 8,108,955 0.17
ContourGlobal Power Holdings SA 7.125% 01/06/2019 USD 5,161,000 4,636,681 0.10
ConvaTec Healthcare E SA 10.875% 15/12/2018 EUR 9,913,000 10,300,400 0.22
Empark Funding SA, FRN 5.462% 15/12/2019 EUR 1,847,000 1,860,114 0.04
Empark Funding SA 6.75% 15/12/2019 EUR 2,000,000 2,127,100 0.05
Evraz Group SA 8.25% 10/11/2015 USD 500,000 448,546 0.01
Gazprom OAO 5.092% 29/11/2015 USD 20,750,000 18,602,272 0.40
Gazprom OAO 4.95% 23/05/2016 USD 5,000,000 4,527,280 0.10
Gazprom OAO 3.85% 06/02/2020 USD 11,850,000 9,747,242 0.21
Gazprom OAO 5.338% 25/09/2020 GBP 3,000,000 3,772,502 0.08
Gazprom OAO 4.95% 06/02/2028 USD 5,000,000 3,708,450 0.08
GCL Holdings SCA 9.375% 15/04/2018 EUR 11,875,000 12,367,575 0.26
GCS Holdco Finance I SA 6.5% 15/11/2018 EUR 1,750,000 1,810,104 0.04
Glencore Finance Europe SA 7.5% Perpetual USD 21,000,000 18,602,547 0.40
Intralot Finance Luxembourg SA 9.75% 15/08/2018 EUR 11,925,000 12,425,850 0.27
JH-Holding Finance SA 8.25% 01/12/2022 EUR 2,400,000 2,482,404 0.05
KBC IFIMA SA, FRN 4.692% 07/02/2025 USD 4,259,000 4,101,216 0.09
Offshore Drilling Holding SA 8.375% 20/09/2020 USD 6,050,000 3,668,171 0.08
Play Finance 1 SA 6.5% 01/08/2019 EUR 8,193,000 8,472,873 0.18
Play Finance 2 SA 5.25% 01/02/2019 EUR 6,336,000 6,464,336 0.14
Puma International Financing SA 6.75% 01/02/2021 USD 12,050,000 10,633,491 0.23
Sberbank of Russia 4.95% 07/02/2017 USD 10,000,000 9,048,273 0.19
Telenet Finance III Luxembourg SCA 6.625% 15/02/2021 EUR 1,500,000 1,564,792 0.03
Telenet Finance V Luxembourg SCA 6.25% 15/08/2022 EUR 4,226,000 4,473,517 0.10
Topaz Marine SA 8.625% 01/11/2018 USD 10,650,000 8,429,486 0.18
Wind Acquisition Finance SA, FRN 3.981% 15/07/2020 EUR 3,825,000 3,813,965 0.08
Wind Acquisition Finance SA 4% 15/07/2020 EUR 14,250,000 14,107,144 0.30
Wind Acquisition Finance SA 4.75% 15/07/2020 USD 4,250,000 3,784,525 0.08
the accompanying notes form an integral part of these financial statements.
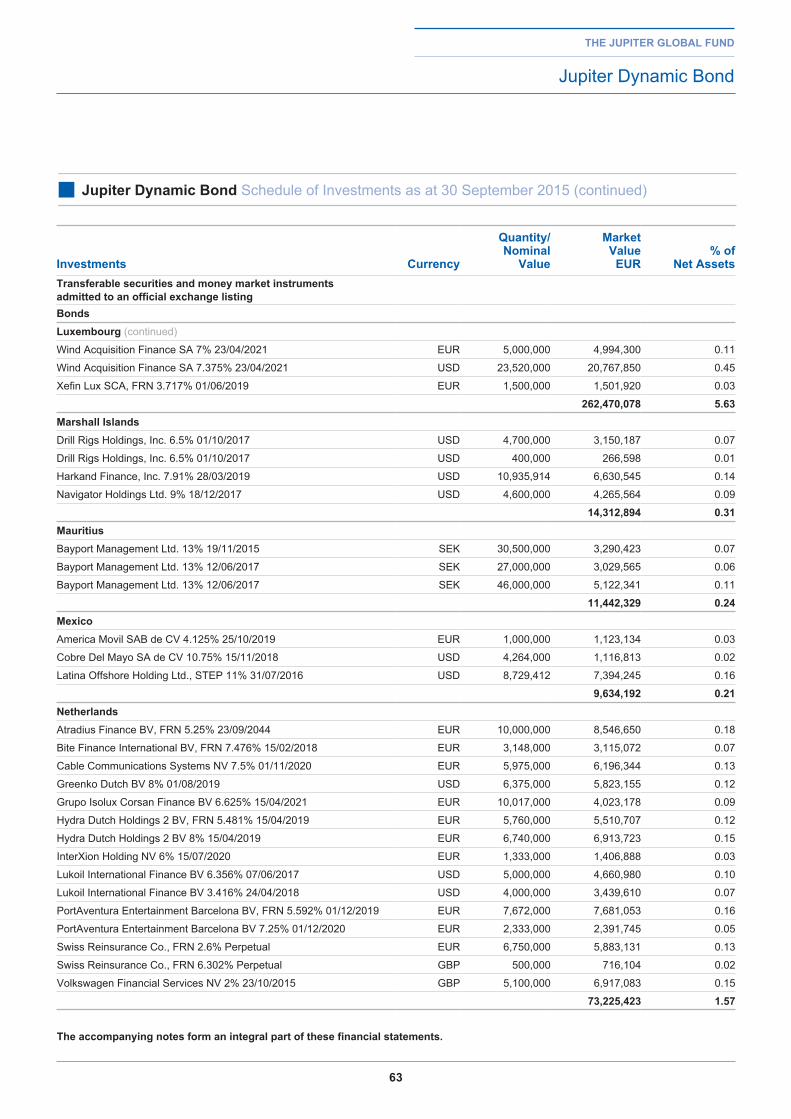
63
the jupiter global fund
Jupiter Dynamic Bond
■ jupiter dynamic bond Schedule of Investments as at 30 September 2015 (continued)
investments Currency
Quantity/ nominal
Value
Market Value
eur% of
net assetstransferable securities and money market instruments admitted to an official exchange listingbonds luxembourg (continued)
Wind Acquisition Finance SA 7% 23/04/2021 EUR 5,000,000 4,994,300 0.11
Wind Acquisition Finance SA 7.375% 23/04/2021 USD 23,520,000 20,767,850 0.45
Xefin Lux SCA, FRN 3.717% 01/06/2019 EUR 1,500,000 1,501,920 0.03
262,470,078 5.63Marshall islandsDrill Rigs Holdings, Inc. 6.5% 01/10/2017 USD 4,700,000 3,150,187 0.07
Drill Rigs Holdings, Inc. 6.5% 01/10/2017 USD 400,000 266,598 0.01
Harkand Finance, Inc. 7.91% 28/03/2019 USD 10,935,914 6,630,545 0.14
Navigator Holdings Ltd. 9% 18/12/2017 USD 4,600,000 4,265,564 0.09
14,312,894 0.31MauritiusBayport Management Ltd. 13% 19/11/2015 SEK 30,500,000 3,290,423 0.07
Bayport Management Ltd. 13% 12/06/2017 SEK 27,000,000 3,029,565 0.06
Bayport Management Ltd. 13% 12/06/2017 SEK 46,000,000 5,122,341 0.11
11,442,329 0.24MexicoAmerica Movil SAB de CV 4.125% 25/10/2019 EUR 1,000,000 1,123,134 0.03
Cobre Del Mayo SA de CV 10.75% 15/11/2018 USD 4,264,000 1,116,813 0.02
Latina Offshore Holding Ltd., STEP 11% 31/07/2016 USD 8,729,412 7,394,245 0.16
9,634,192 0.21netherlandsAtradius Finance BV, FRN 5.25% 23/09/2044 EUR 10,000,000 8,546,650 0.18
Bite Finance International BV, FRN 7.476% 15/02/2018 EUR 3,148,000 3,115,072 0.07
Cable Communications Systems NV 7.5% 01/11/2020 EUR 5,975,000 6,196,344 0.13
Greenko Dutch BV 8% 01/08/2019 USD 6,375,000 5,823,155 0.12
Grupo Isolux Corsan Finance BV 6.625% 15/04/2021 EUR 10,017,000 4,023,178 0.09
Hydra Dutch Holdings 2 BV, FRN 5.481% 15/04/2019 EUR 5,760,000 5,510,707 0.12
Hydra Dutch Holdings 2 BV 8% 15/04/2019 EUR 6,740,000 6,913,723 0.15
InterXion Holding NV 6% 15/07/2020 EUR 1,333,000 1,406,888 0.03
Lukoil International Finance BV 6.356% 07/06/2017 USD 5,000,000 4,660,980 0.10
Lukoil International Finance BV 3.416% 24/04/2018 USD 4,000,000 3,439,610 0.07
PortAventura Entertainment Barcelona BV, FRN 5.592% 01/12/2019 EUR 7,672,000 7,681,053 0.16
PortAventura Entertainment Barcelona BV 7.25% 01/12/2020 EUR 2,333,000 2,391,745 0.05
Swiss Reinsurance Co., FRN 2.6% Perpetual EUR 6,750,000 5,883,131 0.13
Swiss Reinsurance Co., FRN 6.302% Perpetual GBP 500,000 716,104 0.02
Volkswagen Financial Services NV 2% 23/10/2015 GBP 5,100,000 6,917,083 0.15
73,225,423 1.57
the accompanying notes form an integral part of these financial statements.
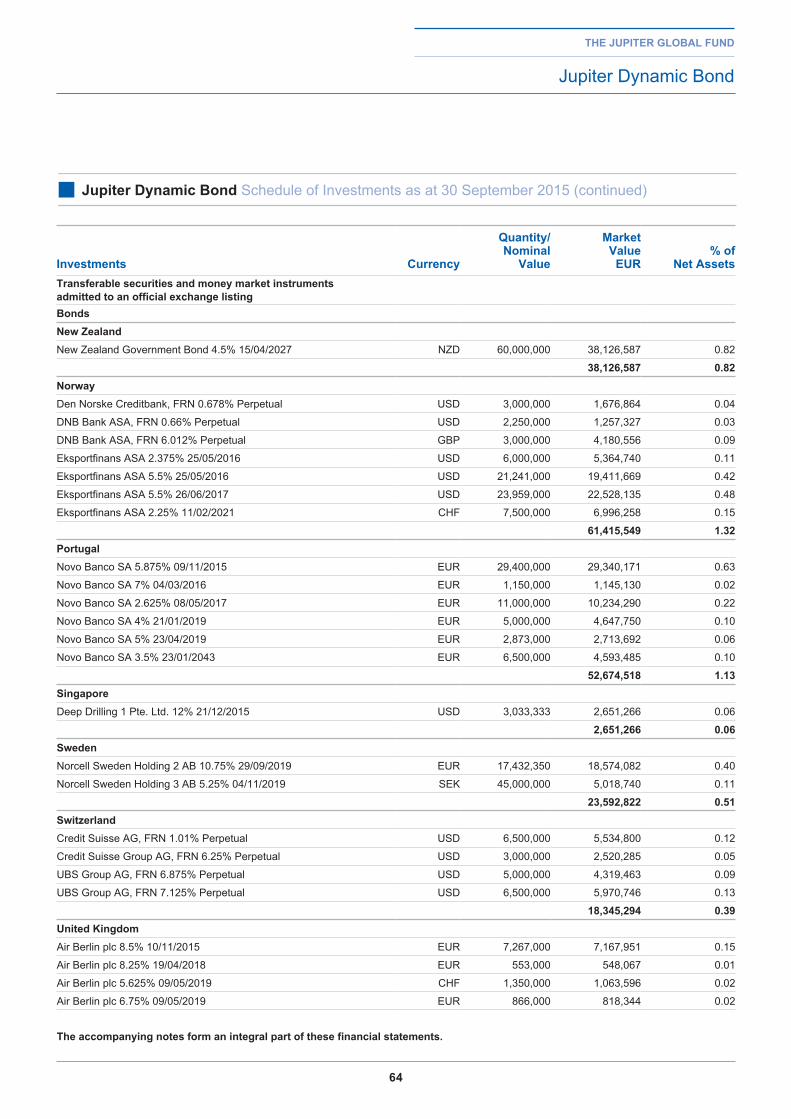
64
the jupiter global fund
Jupiter Dynamic Bond
■ jupiter dynamic bond Schedule of Investments as at 30 September 2015 (continued)
investments Currency
Quantity/ nominal
Value
Market Value
eur% of
net assetstransferable securities and money market instruments admitted to an official exchange listingbonds new ZealandNew Zealand Government Bond 4.5% 15/04/2027 NZD 60,000,000 38,126,587 0.82
38,126,587 0.82norwayDen Norske Creditbank, FRN 0.678% Perpetual USD 3,000,000 1,676,864 0.04
DNB Bank ASA, FRN 0.66% Perpetual USD 2,250,000 1,257,327 0.03
DNB Bank ASA, FRN 6.012% Perpetual GBP 3,000,000 4,180,556 0.09
Eksportfinans ASA 2.375% 25/05/2016 USD 6,000,000 5,364,740 0.11
Eksportfinans ASA 5.5% 25/05/2016 USD 21,241,000 19,411,669 0.42
Eksportfinans ASA 5.5% 26/06/2017 USD 23,959,000 22,528,135 0.48
Eksportfinans ASA 2.25% 11/02/2021 CHF 7,500,000 6,996,258 0.15
61,415,549 1.32portugalNovo Banco SA 5.875% 09/11/2015 EUR 29,400,000 29,340,171 0.63
Novo Banco SA 7% 04/03/2016 EUR 1,150,000 1,145,130 0.02
Novo Banco SA 2.625% 08/05/2017 EUR 11,000,000 10,234,290 0.22
Novo Banco SA 4% 21/01/2019 EUR 5,000,000 4,647,750 0.10
Novo Banco SA 5% 23/04/2019 EUR 2,873,000 2,713,692 0.06
Novo Banco SA 3.5% 23/01/2043 EUR 6,500,000 4,593,485 0.10
52,674,518 1.13SingaporeDeep Drilling 1 Pte. Ltd. 12% 21/12/2015 USD 3,033,333 2,651,266 0.06
2,651,266 0.06SwedenNorcell Sweden Holding 2 AB 10.75% 29/09/2019 EUR 17,432,350 18,574,082 0.40
Norcell Sweden Holding 3 AB 5.25% 04/11/2019 SEK 45,000,000 5,018,740 0.11
23,592,822 0.51SwitzerlandCredit Suisse AG, FRN 1.01% Perpetual USD 6,500,000 5,534,800 0.12
Credit Suisse Group AG, FRN 6.25% Perpetual USD 3,000,000 2,520,285 0.05
UBS Group AG, FRN 6.875% Perpetual USD 5,000,000 4,319,463 0.09
UBS Group AG, FRN 7.125% Perpetual USD 6,500,000 5,970,746 0.13
18,345,294 0.39united KingdomAir Berlin plc 8.5% 10/11/2015 EUR 7,267,000 7,167,951 0.15
Air Berlin plc 8.25% 19/04/2018 EUR 553,000 548,067 0.01
Air Berlin plc 5.625% 09/05/2019 CHF 1,350,000 1,063,596 0.02
Air Berlin plc 6.75% 09/05/2019 EUR 866,000 818,344 0.02
the accompanying notes form an integral part of these financial statements.
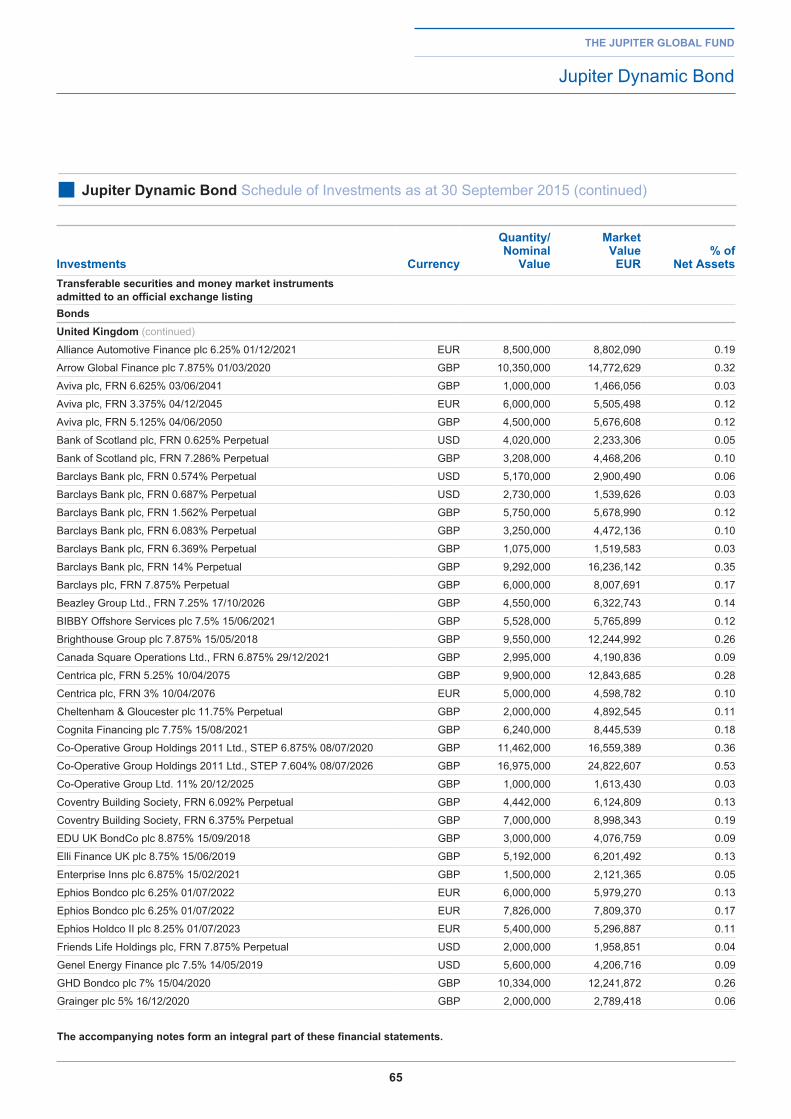
65
the jupiter global fund
Jupiter Dynamic Bond
■ jupiter dynamic bond Schedule of Investments as at 30 September 2015 (continued)
investments Currency
Quantity/ nominal
Value
Market Value
eur% of
net assetstransferable securities and money market instruments admitted to an official exchange listingbonds united Kingdom (continued)
Alliance Automotive Finance plc 6.25% 01/12/2021 EUR 8,500,000 8,802,090 0.19
Arrow Global Finance plc 7.875% 01/03/2020 GBP 10,350,000 14,772,629 0.32
Aviva plc, FRN 6.625% 03/06/2041 GBP 1,000,000 1,466,056 0.03
Aviva plc, FRN 3.375% 04/12/2045 EUR 6,000,000 5,505,498 0.12
Aviva plc, FRN 5.125% 04/06/2050 GBP 4,500,000 5,676,608 0.12
Bank of Scotland plc, FRN 0.625% Perpetual USD 4,020,000 2,233,306 0.05
Bank of Scotland plc, FRN 7.286% Perpetual GBP 3,208,000 4,468,206 0.10
Barclays Bank plc, FRN 0.574% Perpetual USD 5,170,000 2,900,490 0.06
Barclays Bank plc, FRN 0.687% Perpetual USD 2,730,000 1,539,626 0.03
Barclays Bank plc, FRN 1.562% Perpetual GBP 5,750,000 5,678,990 0.12
Barclays Bank plc, FRN 6.083% Perpetual GBP 3,250,000 4,472,136 0.10
Barclays Bank plc, FRN 6.369% Perpetual GBP 1,075,000 1,519,583 0.03
Barclays Bank plc, FRN 14% Perpetual GBP 9,292,000 16,236,142 0.35
Barclays plc, FRN 7.875% Perpetual GBP 6,000,000 8,007,691 0.17
Beazley Group Ltd., FRN 7.25% 17/10/2026 GBP 4,550,000 6,322,743 0.14
BIBBY Offshore Services plc 7.5% 15/06/2021 GBP 5,528,000 5,765,899 0.12
Brighthouse Group plc 7.875% 15/05/2018 GBP 9,550,000 12,244,992 0.26
Canada Square Operations Ltd., FRN 6.875% 29/12/2021 GBP 2,995,000 4,190,836 0.09
Centrica plc, FRN 5.25% 10/04/2075 GBP 9,900,000 12,843,685 0.28
Centrica plc, FRN 3% 10/04/2076 EUR 5,000,000 4,598,782 0.10
Cheltenham & Gloucester plc 11.75% Perpetual GBP 2,000,000 4,892,545 0.11
Cognita Financing plc 7.75% 15/08/2021 GBP 6,240,000 8,445,539 0.18
Co-Operative Group Holdings 2011 Ltd., STEP 6.875% 08/07/2020 GBP 11,462,000 16,559,389 0.36
Co-Operative Group Holdings 2011 Ltd., STEP 7.604% 08/07/2026 GBP 16,975,000 24,822,607 0.53
Co-Operative Group Ltd. 11% 20/12/2025 GBP 1,000,000 1,613,430 0.03
Coventry Building Society, FRN 6.092% Perpetual GBP 4,442,000 6,124,809 0.13
Coventry Building Society, FRN 6.375% Perpetual GBP 7,000,000 8,998,343 0.19
EDU UK BondCo plc 8.875% 15/09/2018 GBP 3,000,000 4,076,759 0.09
Elli Finance UK plc 8.75% 15/06/2019 GBP 5,192,000 6,201,492 0.13
Enterprise Inns plc 6.875% 15/02/2021 GBP 1,500,000 2,121,365 0.05
Ephios Bondco plc 6.25% 01/07/2022 EUR 6,000,000 5,979,270 0.13
Ephios Bondco plc 6.25% 01/07/2022 EUR 7,826,000 7,809,370 0.17
Ephios Holdco II plc 8.25% 01/07/2023 EUR 5,400,000 5,296,887 0.11
Friends Life Holdings plc, FRN 7.875% Perpetual USD 2,000,000 1,958,851 0.04
Genel Energy Finance plc 7.5% 14/05/2019 USD 5,600,000 4,206,716 0.09
GHD Bondco plc 7% 15/04/2020 GBP 10,334,000 12,241,872 0.26
Grainger plc 5% 16/12/2020 GBP 2,000,000 2,789,418 0.06
the accompanying notes form an integral part of these financial statements.
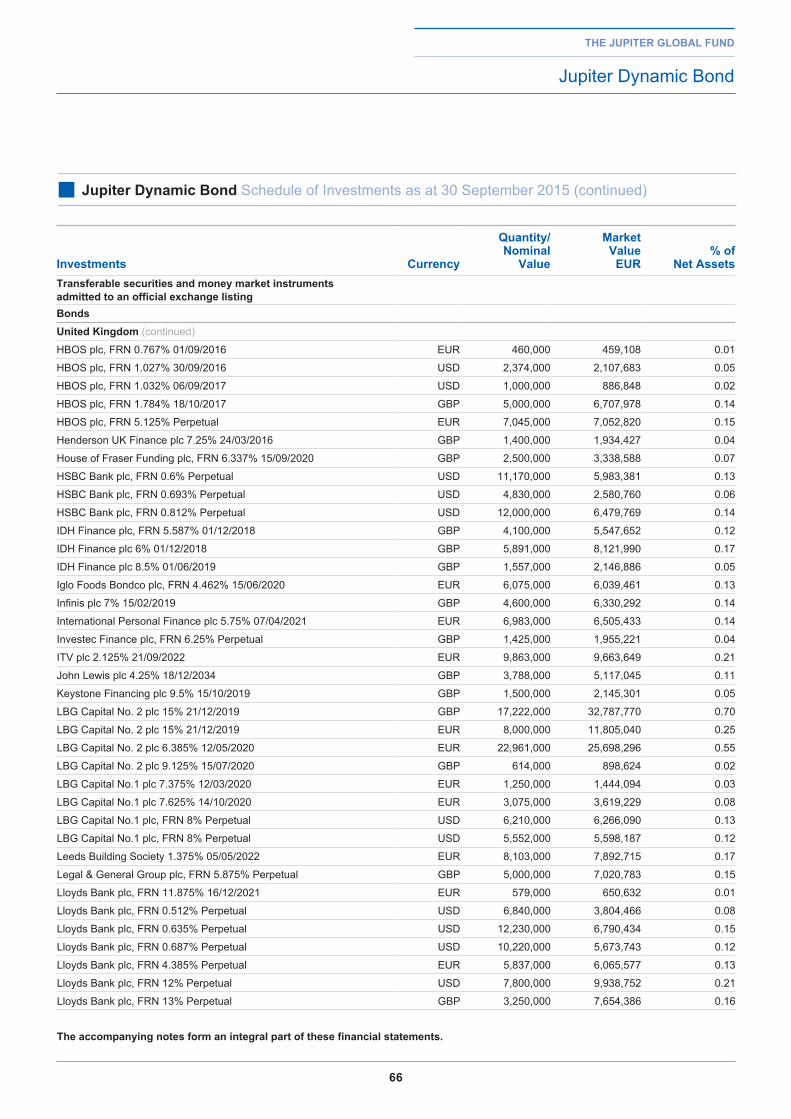
66
the jupiter global fund
Jupiter Dynamic Bond
■ jupiter dynamic bond Schedule of Investments as at 30 September 2015 (continued)
investments Currency
Quantity/ nominal
Value
Market Value
eur% of
net assetstransferable securities and money market instruments admitted to an official exchange listingbonds united Kingdom (continued)
HBOS plc, FRN 0.767% 01/09/2016 EUR 460,000 459,108 0.01
HBOS plc, FRN 1.027% 30/09/2016 USD 2,374,000 2,107,683 0.05
HBOS plc, FRN 1.032% 06/09/2017 USD 1,000,000 886,848 0.02
HBOS plc, FRN 1.784% 18/10/2017 GBP 5,000,000 6,707,978 0.14
HBOS plc, FRN 5.125% Perpetual EUR 7,045,000 7,052,820 0.15
Henderson UK Finance plc 7.25% 24/03/2016 GBP 1,400,000 1,934,427 0.04
House of Fraser Funding plc, FRN 6.337% 15/09/2020 GBP 2,500,000 3,338,588 0.07
HSBC Bank plc, FRN 0.6% Perpetual USD 11,170,000 5,983,381 0.13
HSBC Bank plc, FRN 0.693% Perpetual USD 4,830,000 2,580,760 0.06
HSBC Bank plc, FRN 0.812% Perpetual USD 12,000,000 6,479,769 0.14
IDH Finance plc, FRN 5.587% 01/12/2018 GBP 4,100,000 5,547,652 0.12
IDH Finance plc 6% 01/12/2018 GBP 5,891,000 8,121,990 0.17
IDH Finance plc 8.5% 01/06/2019 GBP 1,557,000 2,146,886 0.05
Iglo Foods Bondco plc, FRN 4.462% 15/06/2020 EUR 6,075,000 6,039,461 0.13
Infinis plc 7% 15/02/2019 GBP 4,600,000 6,330,292 0.14
International Personal Finance plc 5.75% 07/04/2021 EUR 6,983,000 6,505,433 0.14
Investec Finance plc, FRN 6.25% Perpetual GBP 1,425,000 1,955,221 0.04
ITV plc 2.125% 21/09/2022 EUR 9,863,000 9,663,649 0.21
John Lewis plc 4.25% 18/12/2034 GBP 3,788,000 5,117,045 0.11
Keystone Financing plc 9.5% 15/10/2019 GBP 1,500,000 2,145,301 0.05
LBG Capital No. 2 plc 15% 21/12/2019 GBP 17,222,000 32,787,770 0.70
LBG Capital No. 2 plc 15% 21/12/2019 EUR 8,000,000 11,805,040 0.25
LBG Capital No. 2 plc 6.385% 12/05/2020 EUR 22,961,000 25,698,296 0.55
LBG Capital No. 2 plc 9.125% 15/07/2020 GBP 614,000 898,624 0.02
LBG Capital No.1 plc 7.375% 12/03/2020 EUR 1,250,000 1,444,094 0.03
LBG Capital No.1 plc 7.625% 14/10/2020 EUR 3,075,000 3,619,229 0.08
LBG Capital No.1 plc, FRN 8% Perpetual USD 6,210,000 6,266,090 0.13
LBG Capital No.1 plc, FRN 8% Perpetual USD 5,552,000 5,598,187 0.12
Leeds Building Society 1.375% 05/05/2022 EUR 8,103,000 7,892,715 0.17
Legal & General Group plc, FRN 5.875% Perpetual GBP 5,000,000 7,020,783 0.15
Lloyds Bank plc, FRN 11.875% 16/12/2021 EUR 579,000 650,632 0.01
Lloyds Bank plc, FRN 0.512% Perpetual USD 6,840,000 3,804,466 0.08
Lloyds Bank plc, FRN 0.635% Perpetual USD 12,230,000 6,790,434 0.15
Lloyds Bank plc, FRN 0.687% Perpetual USD 10,220,000 5,673,743 0.12
Lloyds Bank plc, FRN 4.385% Perpetual EUR 5,837,000 6,065,577 0.13
Lloyds Bank plc, FRN 12% Perpetual USD 7,800,000 9,938,752 0.21
Lloyds Bank plc, FRN 13% Perpetual GBP 3,250,000 7,654,386 0.16
the accompanying notes form an integral part of these financial statements.
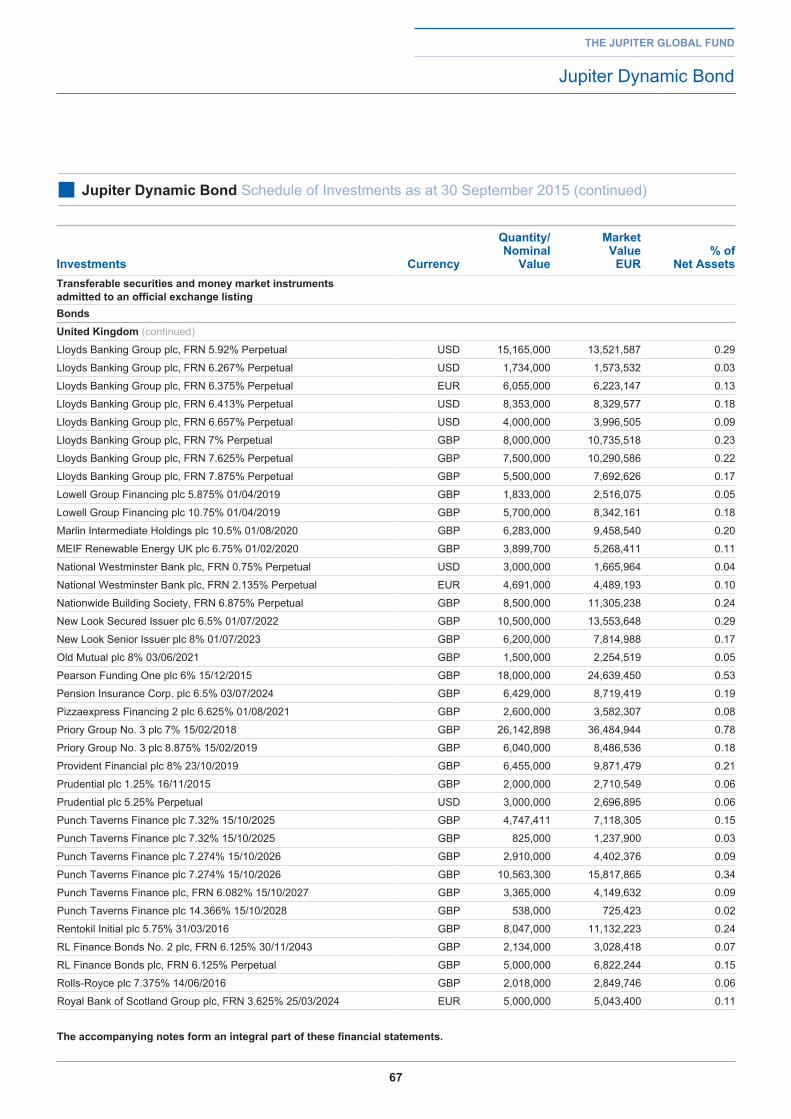
67
the jupiter global fund
Jupiter Dynamic Bond
■ jupiter dynamic bond Schedule of Investments as at 30 September 2015 (continued)
investments Currency
Quantity/ nominal
Value
Market Value
eur% of
net assetstransferable securities and money market instruments admitted to an official exchange listingbonds united Kingdom (continued)
Lloyds Banking Group plc, FRN 5.92% Perpetual USD 15,165,000 13,521,587 0.29
Lloyds Banking Group plc, FRN 6.267% Perpetual USD 1,734,000 1,573,532 0.03
Lloyds Banking Group plc, FRN 6.375% Perpetual EUR 6,055,000 6,223,147 0.13
Lloyds Banking Group plc, FRN 6.413% Perpetual USD 8,353,000 8,329,577 0.18
Lloyds Banking Group plc, FRN 6.657% Perpetual USD 4,000,000 3,996,505 0.09
Lloyds Banking Group plc, FRN 7% Perpetual GBP 8,000,000 10,735,518 0.23
Lloyds Banking Group plc, FRN 7.625% Perpetual GBP 7,500,000 10,290,586 0.22
Lloyds Banking Group plc, FRN 7.875% Perpetual GBP 5,500,000 7,692,626 0.17
Lowell Group Financing plc 5.875% 01/04/2019 GBP 1,833,000 2,516,075 0.05
Lowell Group Financing plc 10.75% 01/04/2019 GBP 5,700,000 8,342,161 0.18
Marlin Intermediate Holdings plc 10.5% 01/08/2020 GBP 6,283,000 9,458,540 0.20
MEIF Renewable Energy UK plc 6.75% 01/02/2020 GBP 3,899,700 5,268,411 0.11
National Westminster Bank plc, FRN 0.75% Perpetual USD 3,000,000 1,665,964 0.04
National Westminster Bank plc, FRN 2.135% Perpetual EUR 4,691,000 4,489,193 0.10
Nationwide Building Society, FRN 6.875% Perpetual GBP 8,500,000 11,305,238 0.24
New Look Secured Issuer plc 6.5% 01/07/2022 GBP 10,500,000 13,553,648 0.29
New Look Senior Issuer plc 8% 01/07/2023 GBP 6,200,000 7,814,988 0.17
Old Mutual plc 8% 03/06/2021 GBP 1,500,000 2,254,519 0.05
Pearson Funding One plc 6% 15/12/2015 GBP 18,000,000 24,639,450 0.53
Pension Insurance Corp. plc 6.5% 03/07/2024 GBP 6,429,000 8,719,419 0.19
Pizzaexpress Financing 2 plc 6.625% 01/08/2021 GBP 2,600,000 3,582,307 0.08
Priory Group No. 3 plc 7% 15/02/2018 GBP 26,142,898 36,484,944 0.78
Priory Group No. 3 plc 8.875% 15/02/2019 GBP 6,040,000 8,486,536 0.18
Provident Financial plc 8% 23/10/2019 GBP 6,455,000 9,871,479 0.21
Prudential plc 1.25% 16/11/2015 GBP 2,000,000 2,710,549 0.06
Prudential plc 5.25% Perpetual USD 3,000,000 2,696,895 0.06
Punch Taverns Finance plc 7.32% 15/10/2025 GBP 4,747,411 7,118,305 0.15
Punch Taverns Finance plc 7.32% 15/10/2025 GBP 825,000 1,237,900 0.03
Punch Taverns Finance plc 7.274% 15/10/2026 GBP 2,910,000 4,402,376 0.09
Punch Taverns Finance plc 7.274% 15/10/2026 GBP 10,563,300 15,817,865 0.34
Punch Taverns Finance plc, FRN 6.082% 15/10/2027 GBP 3,365,000 4,149,632 0.09
Punch Taverns Finance plc 14.366% 15/10/2028 GBP 538,000 725,423 0.02
Rentokil Initial plc 5.75% 31/03/2016 GBP 8,047,000 11,132,223 0.24
RL Finance Bonds No. 2 plc, FRN 6.125% 30/11/2043 GBP 2,134,000 3,028,418 0.07
RL Finance Bonds plc, FRN 6.125% Perpetual GBP 5,000,000 6,822,244 0.15
Rolls-Royce plc 7.375% 14/06/2016 GBP 2,018,000 2,849,746 0.06
Royal Bank of Scotland Group plc, FRN 3.625% 25/03/2024 EUR 5,000,000 5,043,400 0.11
the accompanying notes form an integral part of these financial statements.
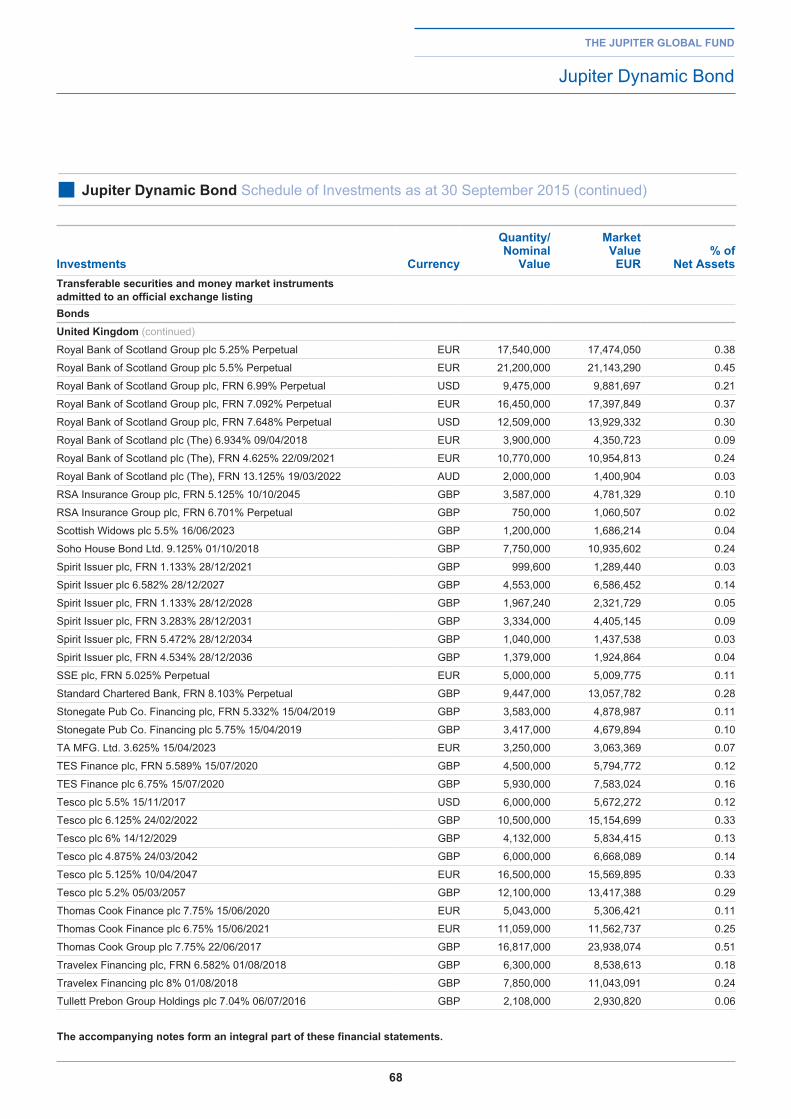
68
the jupiter global fund
Jupiter Dynamic Bond
■ jupiter dynamic bond Schedule of Investments as at 30 September 2015 (continued)
investments Currency
Quantity/ nominal
Value
Market Value
eur% of
net assetstransferable securities and money market instruments admitted to an official exchange listingbonds united Kingdom (continued)
Royal Bank of Scotland Group plc 5.25% Perpetual EUR 17,540,000 17,474,050 0.38
Royal Bank of Scotland Group plc 5.5% Perpetual EUR 21,200,000 21,143,290 0.45
Royal Bank of Scotland Group plc, FRN 6.99% Perpetual USD 9,475,000 9,881,697 0.21
Royal Bank of Scotland Group plc, FRN 7.092% Perpetual EUR 16,450,000 17,397,849 0.37
Royal Bank of Scotland Group plc, FRN 7.648% Perpetual USD 12,509,000 13,929,332 0.30
Royal Bank of Scotland plc (The) 6.934% 09/04/2018 EUR 3,900,000 4,350,723 0.09
Royal Bank of Scotland plc (The), FRN 4.625% 22/09/2021 EUR 10,770,000 10,954,813 0.24
Royal Bank of Scotland plc (The), FRN 13.125% 19/03/2022 AUD 2,000,000 1,400,904 0.03
RSA Insurance Group plc, FRN 5.125% 10/10/2045 GBP 3,587,000 4,781,329 0.10
RSA Insurance Group plc, FRN 6.701% Perpetual GBP 750,000 1,060,507 0.02
Scottish Widows plc 5.5% 16/06/2023 GBP 1,200,000 1,686,214 0.04
Soho House Bond Ltd. 9.125% 01/10/2018 GBP 7,750,000 10,935,602 0.24
Spirit Issuer plc, FRN 1.133% 28/12/2021 GBP 999,600 1,289,440 0.03
Spirit Issuer plc 6.582% 28/12/2027 GBP 4,553,000 6,586,452 0.14
Spirit Issuer plc, FRN 1.133% 28/12/2028 GBP 1,967,240 2,321,729 0.05
Spirit Issuer plc, FRN 3.283% 28/12/2031 GBP 3,334,000 4,405,145 0.09
Spirit Issuer plc, FRN 5.472% 28/12/2034 GBP 1,040,000 1,437,538 0.03
Spirit Issuer plc, FRN 4.534% 28/12/2036 GBP 1,379,000 1,924,864 0.04
SSE plc, FRN 5.025% Perpetual EUR 5,000,000 5,009,775 0.11
Standard Chartered Bank, FRN 8.103% Perpetual GBP 9,447,000 13,057,782 0.28
Stonegate Pub Co. Financing plc, FRN 5.332% 15/04/2019 GBP 3,583,000 4,878,987 0.11
Stonegate Pub Co. Financing plc 5.75% 15/04/2019 GBP 3,417,000 4,679,894 0.10
TA MFG. Ltd. 3.625% 15/04/2023 EUR 3,250,000 3,063,369 0.07
TES Finance plc, FRN 5.589% 15/07/2020 GBP 4,500,000 5,794,772 0.12
TES Finance plc 6.75% 15/07/2020 GBP 5,930,000 7,583,024 0.16
Tesco plc 5.5% 15/11/2017 USD 6,000,000 5,672,272 0.12
Tesco plc 6.125% 24/02/2022 GBP 10,500,000 15,154,699 0.33
Tesco plc 6% 14/12/2029 GBP 4,132,000 5,834,415 0.13
Tesco plc 4.875% 24/03/2042 GBP 6,000,000 6,668,089 0.14
Tesco plc 5.125% 10/04/2047 EUR 16,500,000 15,569,895 0.33
Tesco plc 5.2% 05/03/2057 GBP 12,100,000 13,417,388 0.29
Thomas Cook Finance plc 7.75% 15/06/2020 EUR 5,043,000 5,306,421 0.11
Thomas Cook Finance plc 6.75% 15/06/2021 EUR 11,059,000 11,562,737 0.25
Thomas Cook Group plc 7.75% 22/06/2017 GBP 16,817,000 23,938,074 0.51
Travelex Financing plc, FRN 6.582% 01/08/2018 GBP 6,300,000 8,538,613 0.18
Travelex Financing plc 8% 01/08/2018 GBP 7,850,000 11,043,091 0.24
Tullett Prebon Group Holdings plc 7.04% 06/07/2016 GBP 2,108,000 2,930,820 0.06
the accompanying notes form an integral part of these financial statements.
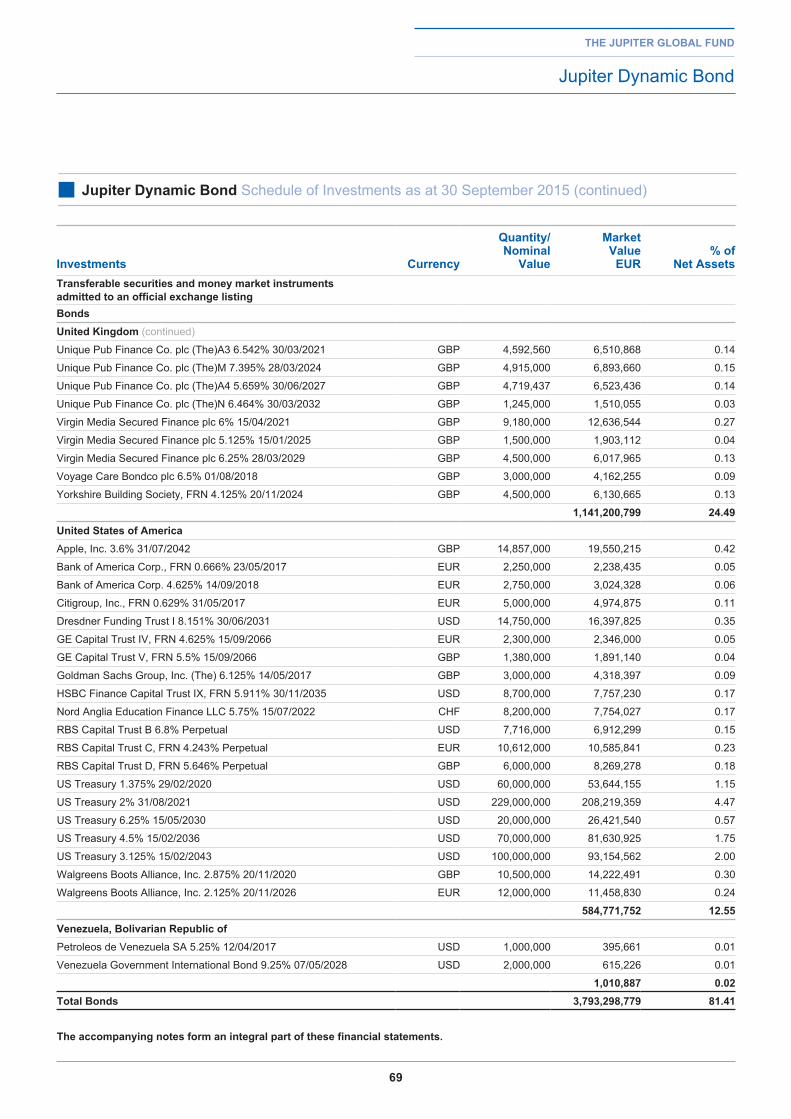
69
the jupiter global fund
Jupiter Dynamic Bond
■ jupiter dynamic bond Schedule of Investments as at 30 September 2015 (continued)
investments Currency
Quantity/ nominal
Value
Market Value
eur% of
net assetstransferable securities and money market instruments admitted to an official exchange listingbonds united Kingdom (continued)
Unique Pub Finance Co. plc (The)A3 6.542% 30/03/2021 GBP 4,592,560 6,510,868 0.14
Unique Pub Finance Co. plc (The)M 7.395% 28/03/2024 GBP 4,915,000 6,893,660 0.15
Unique Pub Finance Co. plc (The)A4 5.659% 30/06/2027 GBP 4,719,437 6,523,436 0.14
Unique Pub Finance Co. plc (The)N 6.464% 30/03/2032 GBP 1,245,000 1,510,055 0.03
Virgin Media Secured Finance plc 6% 15/04/2021 GBP 9,180,000 12,636,544 0.27
Virgin Media Secured Finance plc 5.125% 15/01/2025 GBP 1,500,000 1,903,112 0.04
Virgin Media Secured Finance plc 6.25% 28/03/2029 GBP 4,500,000 6,017,965 0.13
Voyage Care Bondco plc 6.5% 01/08/2018 GBP 3,000,000 4,162,255 0.09
Yorkshire Building Society, FRN 4.125% 20/11/2024 GBP 4,500,000 6,130,665 0.13
1,141,200,799 24.49united States of americaApple, Inc. 3.6% 31/07/2042 GBP 14,857,000 19,550,215 0.42
Bank of America Corp., FRN 0.666% 23/05/2017 EUR 2,250,000 2,238,435 0.05
Bank of America Corp. 4.625% 14/09/2018 EUR 2,750,000 3,024,328 0.06
Citigroup, Inc., FRN 0.629% 31/05/2017 EUR 5,000,000 4,974,875 0.11
Dresdner Funding Trust I 8.151% 30/06/2031 USD 14,750,000 16,397,825 0.35
GE Capital Trust IV, FRN 4.625% 15/09/2066 EUR 2,300,000 2,346,000 0.05
GE Capital Trust V, FRN 5.5% 15/09/2066 GBP 1,380,000 1,891,140 0.04
Goldman Sachs Group, Inc. (The) 6.125% 14/05/2017 GBP 3,000,000 4,318,397 0.09
HSBC Finance Capital Trust IX, FRN 5.911% 30/11/2035 USD 8,700,000 7,757,230 0.17
Nord Anglia Education Finance LLC 5.75% 15/07/2022 CHF 8,200,000 7,754,027 0.17
RBS Capital Trust B 6.8% Perpetual USD 7,716,000 6,912,299 0.15
RBS Capital Trust C, FRN 4.243% Perpetual EUR 10,612,000 10,585,841 0.23
RBS Capital Trust D, FRN 5.646% Perpetual GBP 6,000,000 8,269,278 0.18
US Treasury 1.375% 29/02/2020 USD 60,000,000 53,644,155 1.15
US Treasury 2% 31/08/2021 USD 229,000,000 208,219,359 4.47
US Treasury 6.25% 15/05/2030 USD 20,000,000 26,421,540 0.57
US Treasury 4.5% 15/02/2036 USD 70,000,000 81,630,925 1.75
US Treasury 3.125% 15/02/2043 USD 100,000,000 93,154,562 2.00
Walgreens Boots Alliance, Inc. 2.875% 20/11/2020 GBP 10,500,000 14,222,491 0.30
Walgreens Boots Alliance, Inc. 2.125% 20/11/2026 EUR 12,000,000 11,458,830 0.24
584,771,752 12.55Venezuela, bolivarian republic ofPetroleos de Venezuela SA 5.25% 12/04/2017 USD 1,000,000 395,661 0.01
Venezuela Government International Bond 9.25% 07/05/2028 USD 2,000,000 615,226 0.01
1,010,887 0.02total bonds 3,793,298,779 81.41
the accompanying notes form an integral part of these financial statements.
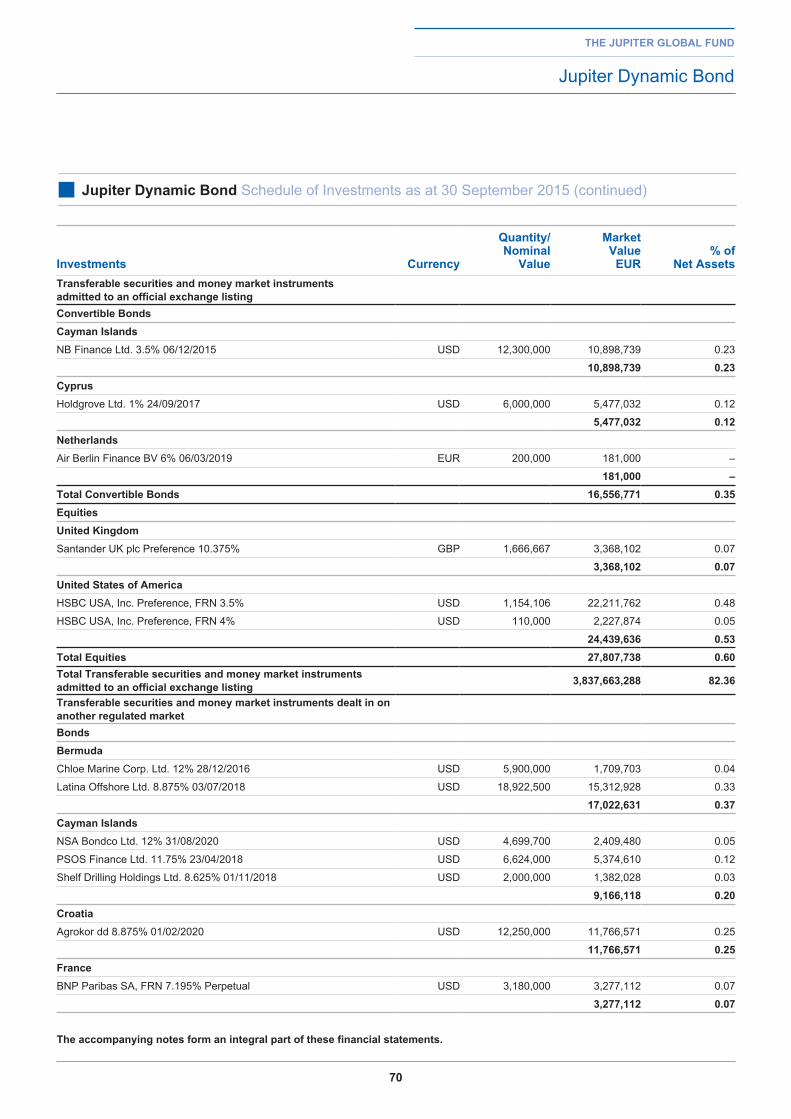
70
the jupiter global fund
Jupiter Dynamic Bond
■ jupiter dynamic bond Schedule of Investments as at 30 September 2015 (continued)
investments Currency
Quantity/ nominal
Value
Market Value
eur% of
net assetstransferable securities and money market instruments admitted to an official exchange listingConvertible bondsCayman islandsNB Finance Ltd. 3.5% 06/12/2015 USD 12,300,000 10,898,739 0.23
10,898,739 0.23CyprusHoldgrove Ltd. 1% 24/09/2017 USD 6,000,000 5,477,032 0.12
5,477,032 0.12netherlandsAir Berlin Finance BV 6% 06/03/2019 EUR 200,000 181,000 –
181,000 –total Convertible bonds 16,556,771 0.35equitiesunited KingdomSantander UK plc Preference 10.375% GBP 1,666,667 3,368,102 0.07
3,368,102 0.07united States of americaHSBC USA, Inc. Preference, FRN 3.5% USD 1,154,106 22,211,762 0.48
HSBC USA, Inc. Preference, FRN 4% USD 110,000 2,227,874 0.05
24,439,636 0.53total equities 27,807,738 0.60total transferable securities and money market instruments admitted to an official exchange listing 3,837,663,288 82.36
transferable securities and money market instruments dealt in on another regulated marketbondsbermudaChloe Marine Corp. Ltd. 12% 28/12/2016 USD 5,900,000 1,709,703 0.04
Latina Offshore Ltd. 8.875% 03/07/2018 USD 18,922,500 15,312,928 0.33
17,022,631 0.37Cayman islandsNSA Bondco Ltd. 12% 31/08/2020 USD 4,699,700 2,409,480 0.05
PSOS Finance Ltd. 11.75% 23/04/2018 USD 6,624,000 5,374,610 0.12
Shelf Drilling Holdings Ltd. 8.625% 01/11/2018 USD 2,000,000 1,382,028 0.03
9,166,118 0.20CroatiaAgrokor dd 8.875% 01/02/2020 USD 12,250,000 11,766,571 0.25
11,766,571 0.25franceBNP Paribas SA, FRN 7.195% Perpetual USD 3,180,000 3,277,112 0.07
3,277,112 0.07
the accompanying notes form an integral part of these financial statements.
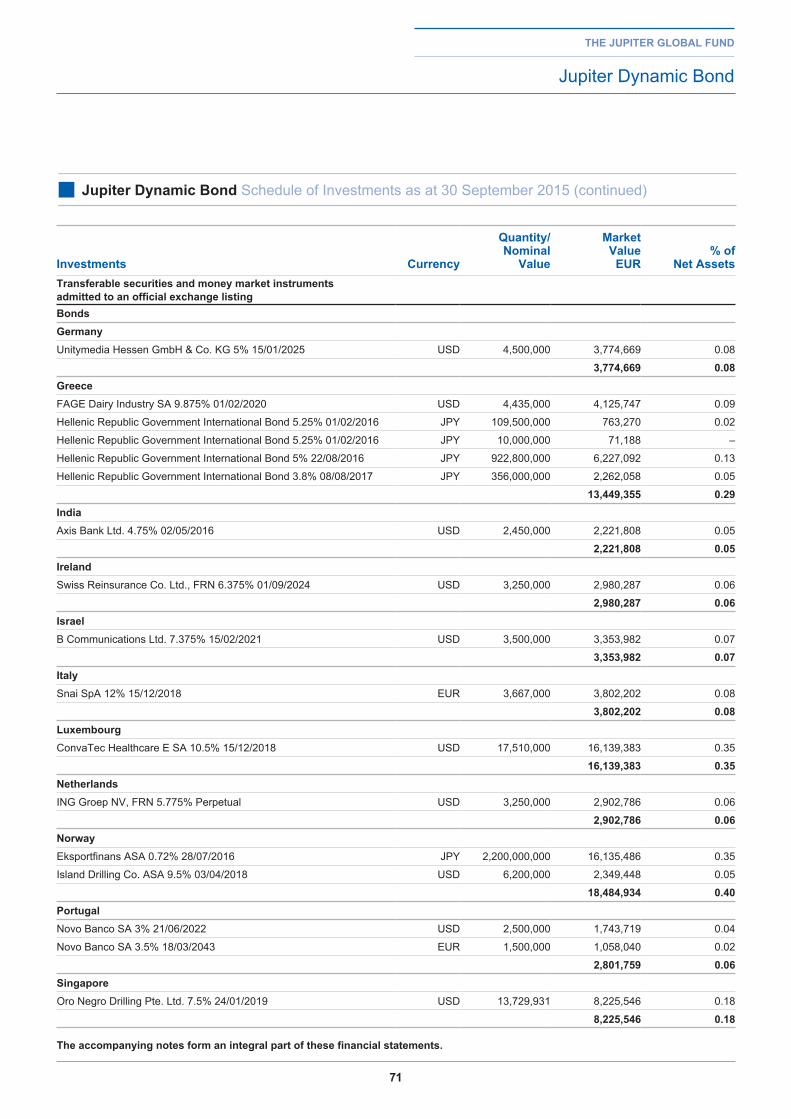
71
the jupiter global fund
Jupiter Dynamic Bond
■ jupiter dynamic bond Schedule of Investments as at 30 September 2015 (continued)
investments Currency
Quantity/ nominal
Value
Market Value
eur% of
net assetstransferable securities and money market instruments admitted to an official exchange listingbondsgermanyUnitymedia Hessen GmbH & Co. KG 5% 15/01/2025 USD 4,500,000 3,774,669 0.08
3,774,669 0.08greeceFAGE Dairy Industry SA 9.875% 01/02/2020 USD 4,435,000 4,125,747 0.09
Hellenic Republic Government International Bond 5.25% 01/02/2016 JPY 109,500,000 763,270 0.02
Hellenic Republic Government International Bond 5.25% 01/02/2016 JPY 10,000,000 71,188 –
Hellenic Republic Government International Bond 5% 22/08/2016 JPY 922,800,000 6,227,092 0.13
Hellenic Republic Government International Bond 3.8% 08/08/2017 JPY 356,000,000 2,262,058 0.05
13,449,355 0.29indiaAxis Bank Ltd. 4.75% 02/05/2016 USD 2,450,000 2,221,808 0.05
2,221,808 0.05irelandSwiss Reinsurance Co. Ltd., FRN 6.375% 01/09/2024 USD 3,250,000 2,980,287 0.06
2,980,287 0.06israelB Communications Ltd. 7.375% 15/02/2021 USD 3,500,000 3,353,982 0.07
3,353,982 0.07italySnai SpA 12% 15/12/2018 EUR 3,667,000 3,802,202 0.08
3,802,202 0.08luxembourgConvaTec Healthcare E SA 10.5% 15/12/2018 USD 17,510,000 16,139,383 0.35
16,139,383 0.35netherlandsING Groep NV, FRN 5.775% Perpetual USD 3,250,000 2,902,786 0.06
2,902,786 0.06norwayEksportfinans ASA 0.72% 28/07/2016 JPY 2,200,000,000 16,135,486 0.35
Island Drilling Co. ASA 9.5% 03/04/2018 USD 6,200,000 2,349,448 0.05
18,484,934 0.40portugalNovo Banco SA 3% 21/06/2022 USD 2,500,000 1,743,719 0.04
Novo Banco SA 3.5% 18/03/2043 EUR 1,500,000 1,058,040 0.02
2,801,759 0.06SingaporeOro Negro Drilling Pte. Ltd. 7.5% 24/01/2019 USD 13,729,931 8,225,546 0.18
8,225,546 0.18
the accompanying notes form an integral part of these financial statements.
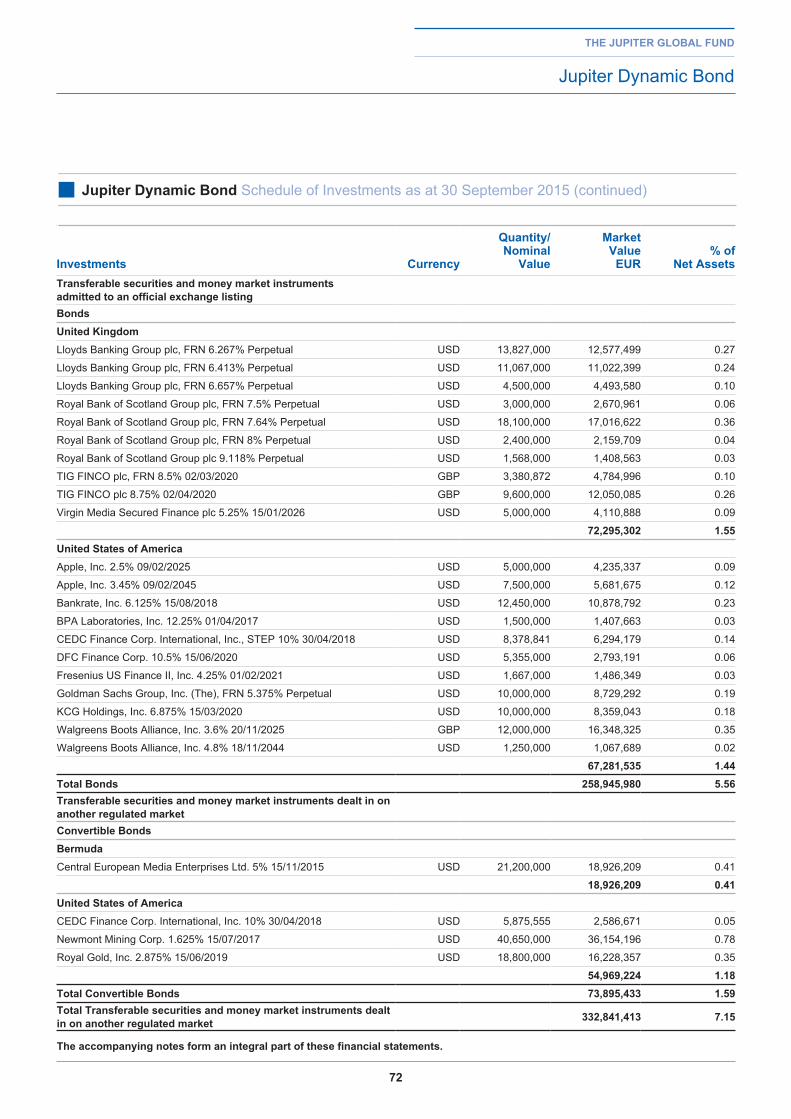
72
investments Currency
Quantity/ nominal
Value
Market Value
eur% of
net assetstransferable securities and money market instruments admitted to an official exchange listingbonds united KingdomLloyds Banking Group plc, FRN 6.267% Perpetual USD 13,827,000 12,577,499 0.27
Lloyds Banking Group plc, FRN 6.413% Perpetual USD 11,067,000 11,022,399 0.24
Lloyds Banking Group plc, FRN 6.657% Perpetual USD 4,500,000 4,493,580 0.10
Royal Bank of Scotland Group plc, FRN 7.5% Perpetual USD 3,000,000 2,670,961 0.06
Royal Bank of Scotland Group plc, FRN 7.64% Perpetual USD 18,100,000 17,016,622 0.36
Royal Bank of Scotland Group plc, FRN 8% Perpetual USD 2,400,000 2,159,709 0.04
Royal Bank of Scotland Group plc 9.118% Perpetual USD 1,568,000 1,408,563 0.03
TIG FINCO plc, FRN 8.5% 02/03/2020 GBP 3,380,872 4,784,996 0.10
TIG FINCO plc 8.75% 02/04/2020 GBP 9,600,000 12,050,085 0.26
Virgin Media Secured Finance plc 5.25% 15/01/2026 USD 5,000,000 4,110,888 0.09
72,295,302 1.55united States of americaApple, Inc. 2.5% 09/02/2025 USD 5,000,000 4,235,337 0.09
Apple, Inc. 3.45% 09/02/2045 USD 7,500,000 5,681,675 0.12
Bankrate, Inc. 6.125% 15/08/2018 USD 12,450,000 10,878,792 0.23
BPA Laboratories, Inc. 12.25% 01/04/2017 USD 1,500,000 1,407,663 0.03
CEDC Finance Corp. International, Inc., STEP 10% 30/04/2018 USD 8,378,841 6,294,179 0.14
DFC Finance Corp. 10.5% 15/06/2020 USD 5,355,000 2,793,191 0.06
Fresenius US Finance II, Inc. 4.25% 01/02/2021 USD 1,667,000 1,486,349 0.03
Goldman Sachs Group, Inc. (The), FRN 5.375% Perpetual USD 10,000,000 8,729,292 0.19
KCG Holdings, Inc. 6.875% 15/03/2020 USD 10,000,000 8,359,043 0.18
Walgreens Boots Alliance, Inc. 3.6% 20/11/2025 GBP 12,000,000 16,348,325 0.35
Walgreens Boots Alliance, Inc. 4.8% 18/11/2044 USD 1,250,000 1,067,689 0.02
67,281,535 1.44total bonds 258,945,980 5.56transferable securities and money market instruments dealt in on another regulated marketConvertible bondsbermudaCentral European Media Enterprises Ltd. 5% 15/11/2015 USD 21,200,000 18,926,209 0.41
18,926,209 0.41united States of americaCEDC Finance Corp. International, Inc. 10% 30/04/2018 USD 5,875,555 2,586,671 0.05
Newmont Mining Corp. 1.625% 15/07/2017 USD 40,650,000 36,154,196 0.78
Royal Gold, Inc. 2.875% 15/06/2019 USD 18,800,000 16,228,357 0.35
54,969,224 1.18total Convertible bonds 73,895,433 1.59total transferable securities and money market instruments dealt in on another regulated market 332,841,413 7.15
the accompanying notes form an integral part of these financial statements.
the jupiter global fund
Jupiter Dynamic Bond
■ jupiter dynamic bond Schedule of Investments as at 30 September 2015 (continued)
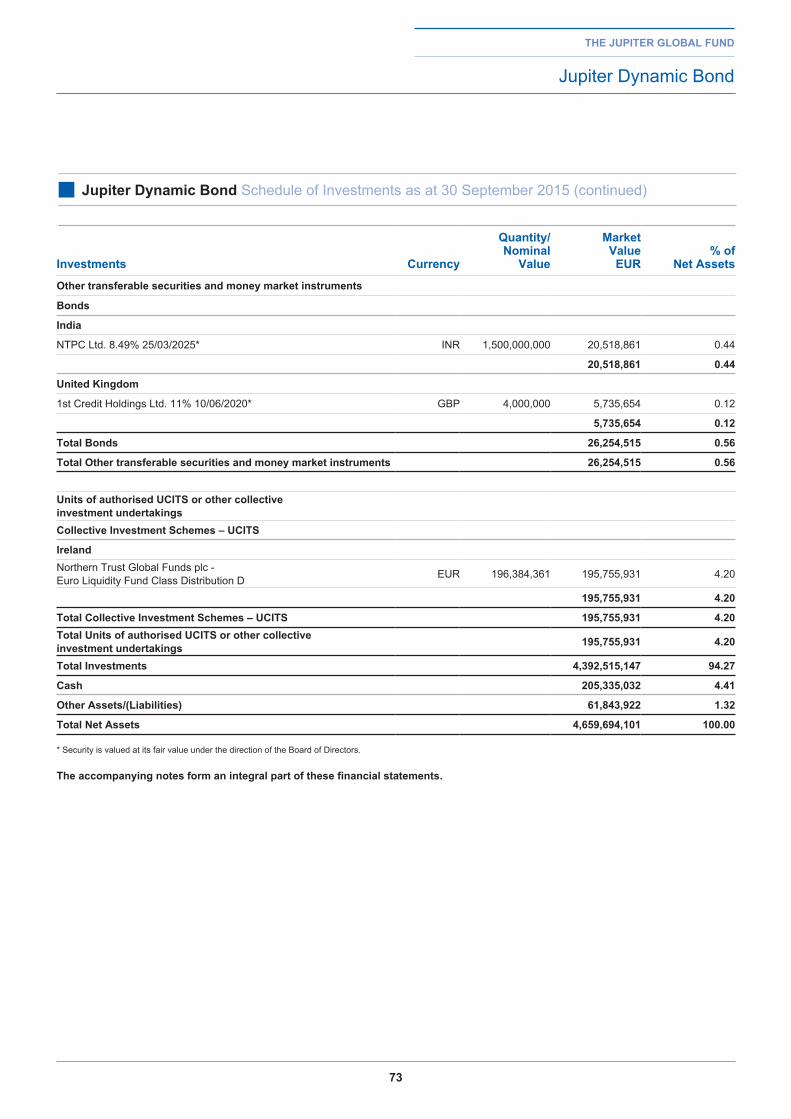
73
investments Currency
Quantity/ nominal
Value
Market Value
eur% of
net assets
other transferable securities and money market instruments
bonds
india
NTPC Ltd. 8.49% 25/03/2025* INR 1,500,000,000 20,518,861 0.44
20,518,861 0.44
united Kingdom
1st Credit Holdings Ltd. 11% 10/06/2020* GBP 4,000,000 5,735,654 0.12
5,735,654 0.12
total bonds 26,254,515 0.56
total other transferable securities and money market instruments 26,254,515 0.56
units of authorised uCitS or other collective investment undertakingsCollective investment Schemes – uCitS
irelandNorthern Trust Global Funds plc - Euro Liquidity Fund Class Distribution D EUR 196,384,361 195,755,931 4.20
195,755,931 4.20
total Collective investment Schemes – uCitS 195,755,931 4.20total units of authorised uCitS or other collective investment undertakings 195,755,931 4.20
total investments 4,392,515,147 94.27
Cash 205,335,032 4.41
other assets/(liabilities) 61,843,922 1.32
total net assets 4,659,694,101 100.00
* Security is valued at its fair value under the direction of the Board of Directors.
the accompanying notes form an integral part of these financial statements.
the jupiter global fund
Jupiter Dynamic Bond
■ jupiter dynamic bond Schedule of Investments as at 30 September 2015 (continued)
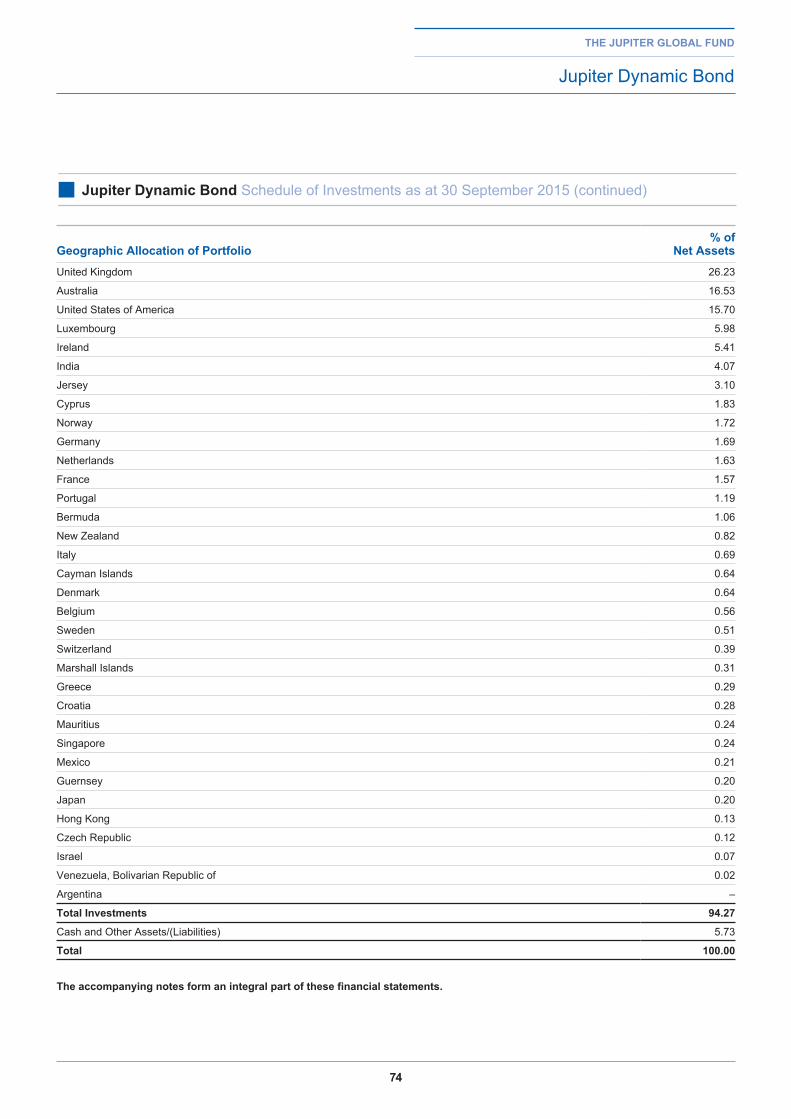
74
the jupiter global fund
Jupiter Dynamic Bond
■ jupiter dynamic bond Schedule of Investments as at 30 September 2015 (continued)
geographic allocation of portfolio% of
net assetsUnited Kingdom 26.23
Australia 16.53
United States of America 15.70
Luxembourg 5.98
Ireland 5.41
India 4.07
Jersey 3.10
Cyprus 1.83
Norway 1.72
Germany 1.69
Netherlands 1.63
France 1.57
Portugal 1.19
Bermuda 1.06
New Zealand 0.82
Italy 0.69
Cayman Islands 0.64
Denmark 0.64
Belgium 0.56
Sweden 0.51
Switzerland 0.39
Marshall Islands 0.31
Greece 0.29
Croatia 0.28
Mauritius 0.24
Singapore 0.24
Mexico 0.21
Guernsey 0.20
Japan 0.20
Hong Kong 0.13
Czech Republic 0.12
Israel 0.07
Venezuela, Bolivarian Republic of 0.02
Argentina –
total investments 94.27
Cash and Other Assets/(Liabilities) 5.73
total 100.00
the accompanying notes form an integral part of these financial statements.
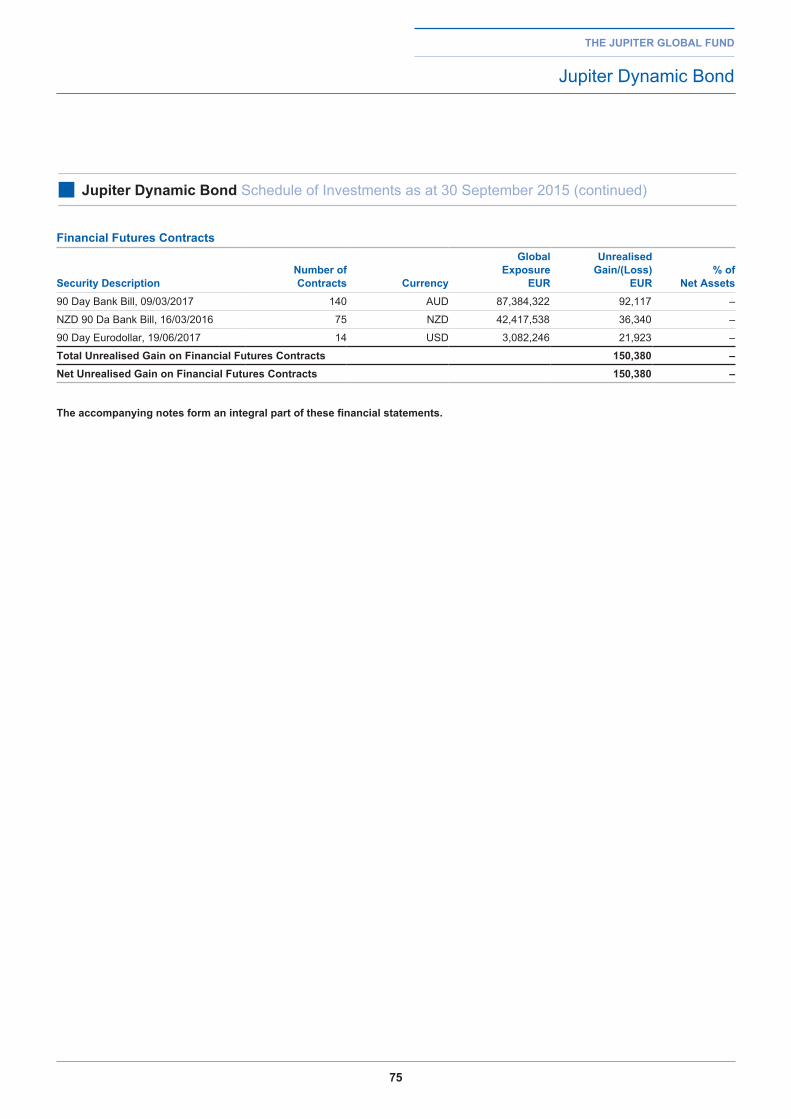
75
the jupiter global fund
Jupiter Dynamic Bond
■ jupiter dynamic bond Schedule of Investments as at 30 September 2015 (continued)
financial futures Contracts
Security descriptionnumber of Contracts Currency
global exposure
eur
unrealised gain/(loss)
eur% of
net assets90 Day Bank Bill, 09/03/2017 140 AUD 87,384,322 92,117 –
NZD 90 Da Bank Bill, 16/03/2016 75 NZD 42,417,538 36,340 –
90 Day Eurodollar, 19/06/2017 14 USD 3,082,246 21,923 –
total unrealised gain on financial futures Contracts 150,380 –net unrealised gain on financial futures Contracts 150,380 –
the accompanying notes form an integral part of these financial statements.
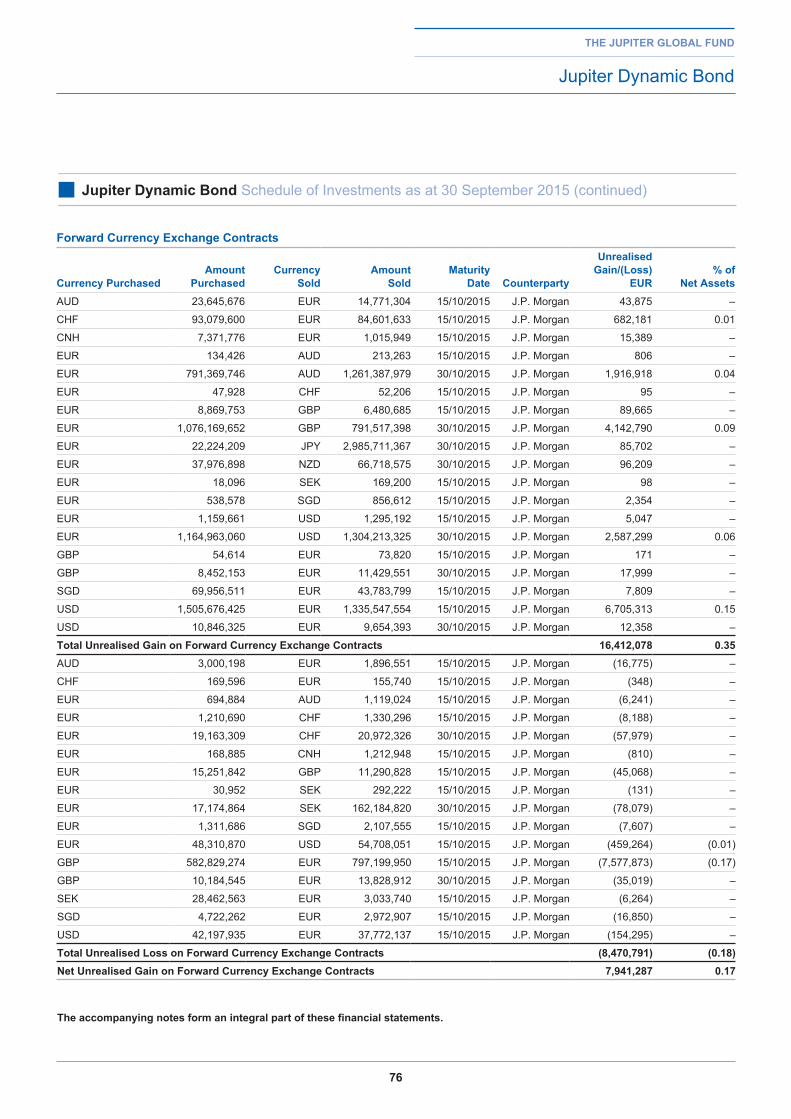
76
forward Currency exchange Contracts
Currency purchasedamount
purchasedCurrency
Soldamount
SoldMaturity
date Counterparty
unrealised gain/(loss)
eur% of
net assetsAUD 23,645,676 EUR 14,771,304 15/10/2015 J.P. Morgan 43,875 –
CHF 93,079,600 EUR 84,601,633 15/10/2015 J.P. Morgan 682,181 0.01
CNH 7,371,776 EUR 1,015,949 15/10/2015 J.P. Morgan 15,389 –
EUR 134,426 AUD 213,263 15/10/2015 J.P. Morgan 806 –
EUR 791,369,746 AUD 1,261,387,979 30/10/2015 J.P. Morgan 1,916,918 0.04
EUR 47,928 CHF 52,206 15/10/2015 J.P. Morgan 95 –
EUR 8,869,753 GBP 6,480,685 15/10/2015 J.P. Morgan 89,665 –
EUR 1,076,169,652 GBP 791,517,398 30/10/2015 J.P. Morgan 4,142,790 0.09
EUR 22,224,209 JPY 2,985,711,367 30/10/2015 J.P. Morgan 85,702 –
EUR 37,976,898 NZD 66,718,575 30/10/2015 J.P. Morgan 96,209 –
EUR 18,096 SEK 169,200 15/10/2015 J.P. Morgan 98 –
EUR 538,578 SGD 856,612 15/10/2015 J.P. Morgan 2,354 –
EUR 1,159,661 USD 1,295,192 15/10/2015 J.P. Morgan 5,047 –
EUR 1,164,963,060 USD 1,304,213,325 30/10/2015 J.P. Morgan 2,587,299 0.06
GBP 54,614 EUR 73,820 15/10/2015 J.P. Morgan 171 –
GBP 8,452,153 EUR 11,429,551 30/10/2015 J.P. Morgan 17,999 –
SGD 69,956,511 EUR 43,783,799 15/10/2015 J.P. Morgan 7,809 –
USD 1,505,676,425 EUR 1,335,547,554 15/10/2015 J.P. Morgan 6,705,313 0.15
USD 10,846,325 EUR 9,654,393 30/10/2015 J.P. Morgan 12,358 –
total unrealised gain on forward Currency exchange Contracts 16,412,078 0.35AUD 3,000,198 EUR 1,896,551 15/10/2015 J.P. Morgan (16,775) –
CHF 169,596 EUR 155,740 15/10/2015 J.P. Morgan (348) –
EUR 694,884 AUD 1,119,024 15/10/2015 J.P. Morgan (6,241) –
EUR 1,210,690 CHF 1,330,296 15/10/2015 J.P. Morgan (8,188) –
EUR 19,163,309 CHF 20,972,326 30/10/2015 J.P. Morgan (57,979) –
EUR 168,885 CNH 1,212,948 15/10/2015 J.P. Morgan (810) –
EUR 15,251,842 GBP 11,290,828 15/10/2015 J.P. Morgan (45,068) –
EUR 30,952 SEK 292,222 15/10/2015 J.P. Morgan (131) –
EUR 17,174,864 SEK 162,184,820 30/10/2015 J.P. Morgan (78,079) –
EUR 1,311,686 SGD 2,107,555 15/10/2015 J.P. Morgan (7,607) –
EUR 48,310,870 USD 54,708,051 15/10/2015 J.P. Morgan (459,264) (0.01)
GBP 582,829,274 EUR 797,199,950 15/10/2015 J.P. Morgan (7,577,873) (0.17)
GBP 10,184,545 EUR 13,828,912 30/10/2015 J.P. Morgan (35,019) –
SEK 28,462,563 EUR 3,033,740 15/10/2015 J.P. Morgan (6,264) –
SGD 4,722,262 EUR 2,972,907 15/10/2015 J.P. Morgan (16,850) –
USD 42,197,935 EUR 37,772,137 15/10/2015 J.P. Morgan (154,295) –
total unrealised loss on forward Currency exchange Contracts (8,470,791) (0.18)net unrealised gain on forward Currency exchange Contracts 7,941,287 0.17
the accompanying notes form an integral part of these financial statements.
the jupiter global fund
Jupiter Dynamic Bond
■ jupiter dynamic bond Schedule of Investments as at 30 September 2015 (continued)
77
Market reviewEuropean Equities were volatile during the recent financial year, as investors weighed the generally improved outlook for the European economy against periodic concerns over Greece and China.
The final quarter of 2014 saw European equities end the period roughly where they started. The prospect of a snap election in Greece in February was a source of anxiety, but capital markets in southern Europe remained largely resilient. However, weak economic data in Germany and France caused European financials to perform poorly, while negative sentiment around global demand impacted oil stocks and hard commodities.
A sharp decline in global oil prices prompted fears that the eurozone would enter outright deflation. The European Central Bank (ECB) responded in January by announcing an open-ended programme of quantitative easing. European equities rallied strongly in the first quarter of 2015, with the Euro Stoxx 50 (the top 50 stocks in Europe) rising almost 20% in euro terms, making for one of the best first quarters in the past 15 years. A strong first-quarter earnings season provided an additional tailwind for equities, with exporters supported by the lower euro.
In June, markets became preoccupied with the deteriorating situation in Greece. Volatility increased as the standoff between the Greek government and its creditors persisted. An agreement between Greece and its creditors was finally announced on July 13th. European equity markets rallied on the news, which also soothed the region’s fixed income markets.
Attention then switched to China, where the crashing domestic equity market intensified fears that its economy would experience a hard landing. This created volatility, resulting in setbacks for some industrial names in Europe. In the background, however, European economic data continued to improve and the second quarter earnings season in Europe was well received by the market.
policy reviewIn volatile market conditions, the fund’s stock selection in the long and short book and the careful management of net positions was reflected in its robust performance during the 12 months under review.
In the first half of the year, the fund benefited from a revival of interest in European equities as an economic recovery and the supportive monetary policy stance of the ECB spurred capital inflows. The fund participated in the equity rally which began in January 2015.
Performance was led by the portfolio’s allocation to the financial sector, which experienced tailwinds from improved credit conditions and an uptick in domestic demand, and also by the fund’s healthcare exposure, which continued to benefit from structural growth trends such as the aging global population and increased health spending by governments.
In the short book, options and futures held on the EuroStoxx 50 index (SX5E) mitigated the effects of market falls in the second half of the year. As a result, performance was robust during the steep market declines in July and August, helping the fund to outperform both the FTSE World Europe Index and its benchmark (3 month Euribor) over the year. The fund was underweight the oil and gas sector throughout the period, a decision which proved beneficial as energy stocks continued to suffer following the collapse of global oil prices in 2014. Oil and gas companies with weak balance sheets and other specific vulnerabilities also featured in the short book periodically during the year.
investment outlookThe fund is currently positioned cautiously with the aim of limiting losses in the event of further market volatility. A significant market correction took place during the third quarter and it is possible that buying opportunities may start to appear. We are also mindful that an economic recovery appears to be taking place in many parts of Europe, and the European Central Bank has indicated it stands ready to step up its interventions if required. While we believe these factors are supportive of European equities, the risk of a global economic slowdown led by China and the current fragility of market sentiment suggest to us that caution is warranted.
Michael buhl-nielsenfund Manager
30 September 2015
the jupiter global fund
Jupiter Europa
■ jupiter europa Review of Portfolio as at 30 September 2015
performance
naV 30 September 2015 30 September 2014/launch date % Change
Class D EUR B Acc (1) €11.32 €10.00 13.20
Class D USD B Acc HSC (2) $11.18 $10.00 11.80
Class L EUR A Acc €12.93 €11.43 13.12
Class L EUR B Acc €12.70 €11.41 11.31
Class L GBP B Acc HSC £12.92 £11.62 11.19
Class L USD B Acc HSC $12.85 $11.56 11.16
(1) Launch date 24 October 2014. (2) Launch date 30 October 2014.
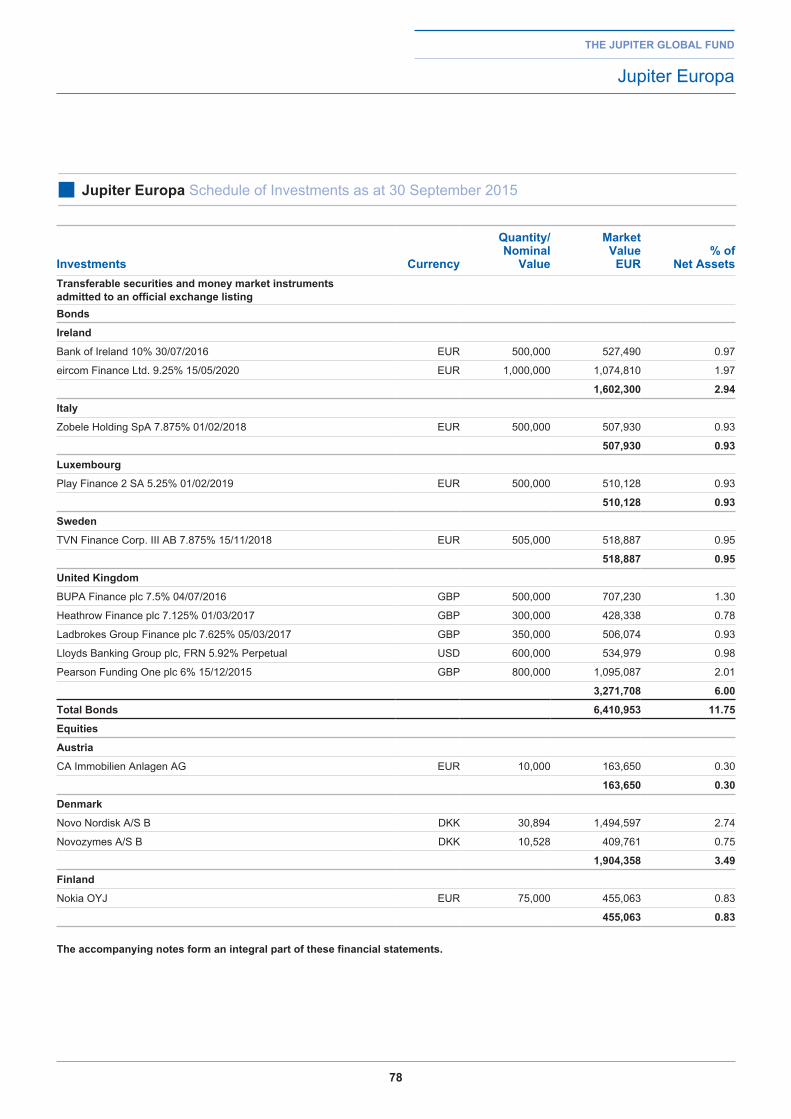
78
the jupiter global fund
Jupiter Europa
■ jupiter europa Schedule of Investments as at 30 September 2015
investments Currency
Quantity/ nominal
Value
Market Value
eur% of
net assetstransferable securities and money market instruments admitted to an official exchange listingbonds
ireland
Bank of Ireland 10% 30/07/2016 EUR 500,000 527,490 0.97
eircom Finance Ltd. 9.25% 15/05/2020 EUR 1,000,000 1,074,810 1.97
1,602,300 2.94
italy
Zobele Holding SpA 7.875% 01/02/2018 EUR 500,000 507,930 0.93
507,930 0.93
luxembourg
Play Finance 2 SA 5.25% 01/02/2019 EUR 500,000 510,128 0.93
510,128 0.93
Sweden
TVN Finance Corp. III AB 7.875% 15/11/2018 EUR 505,000 518,887 0.95
518,887 0.95
united Kingdom
BUPA Finance plc 7.5% 04/07/2016 GBP 500,000 707,230 1.30
Heathrow Finance plc 7.125% 01/03/2017 GBP 300,000 428,338 0.78
Ladbrokes Group Finance plc 7.625% 05/03/2017 GBP 350,000 506,074 0.93
Lloyds Banking Group plc, FRN 5.92% Perpetual USD 600,000 534,979 0.98
Pearson Funding One plc 6% 15/12/2015 GBP 800,000 1,095,087 2.01
3,271,708 6.00
total bonds 6,410,953 11.75
equities
austria
CA Immobilien Anlagen AG EUR 10,000 163,650 0.30
163,650 0.30
denmark
Novo Nordisk A/S B DKK 30,894 1,494,597 2.74
Novozymes A/S B DKK 10,528 409,761 0.75
1,904,358 3.49
finland
Nokia OYJ EUR 75,000 455,063 0.83
455,063 0.83
the accompanying notes form an integral part of these financial statements.
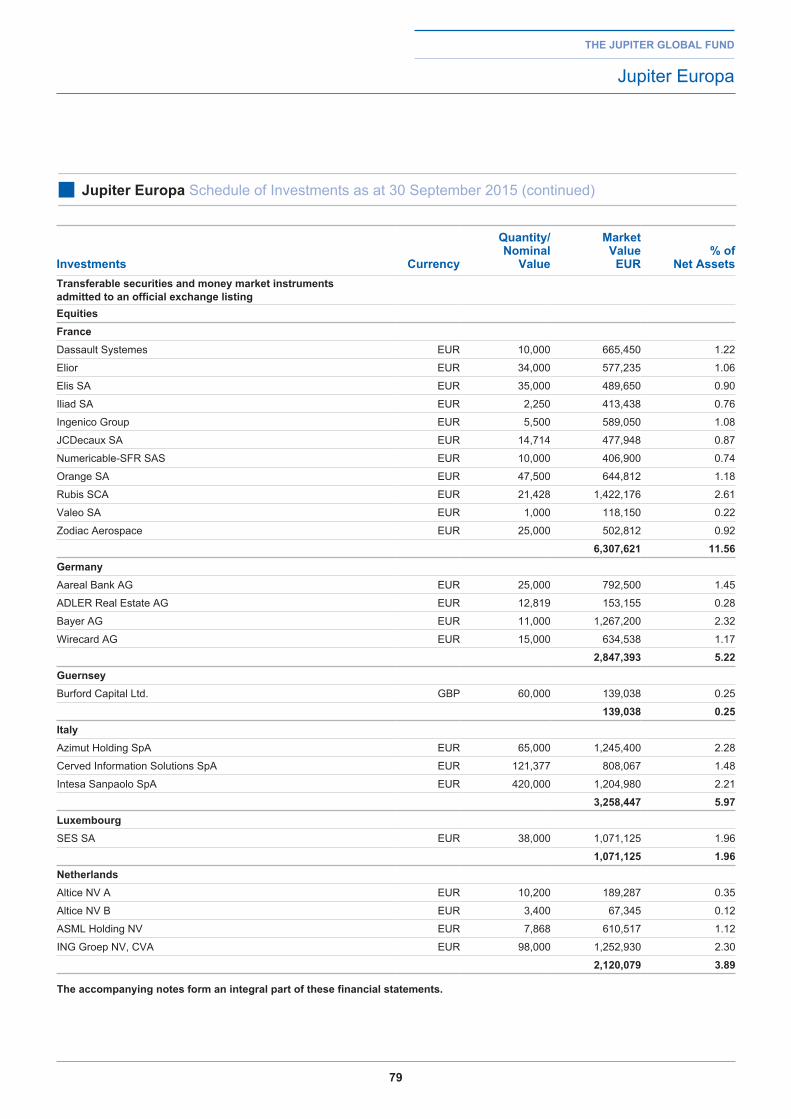
79
the jupiter global fund
Jupiter Europa
■ jupiter europa Schedule of Investments as at 30 September 2015 (continued)
investments Currency
Quantity/ nominal
Value
Market Value
eur% of
net assetstransferable securities and money market instruments admitted to an official exchange listingequitiesfranceDassault Systemes EUR 10,000 665,450 1.22
Elior EUR 34,000 577,235 1.06
Elis SA EUR 35,000 489,650 0.90
Iliad SA EUR 2,250 413,438 0.76
Ingenico Group EUR 5,500 589,050 1.08
JCDecaux SA EUR 14,714 477,948 0.87
Numericable-SFR SAS EUR 10,000 406,900 0.74
Orange SA EUR 47,500 644,812 1.18
Rubis SCA EUR 21,428 1,422,176 2.61
Valeo SA EUR 1,000 118,150 0.22
Zodiac Aerospace EUR 25,000 502,812 0.92
6,307,621 11.56germanyAareal Bank AG EUR 25,000 792,500 1.45
ADLER Real Estate AG EUR 12,819 153,155 0.28
Bayer AG EUR 11,000 1,267,200 2.32
Wirecard AG EUR 15,000 634,538 1.17
2,847,393 5.22guernseyBurford Capital Ltd. GBP 60,000 139,038 0.25
139,038 0.25italyAzimut Holding SpA EUR 65,000 1,245,400 2.28
Cerved Information Solutions SpA EUR 121,377 808,067 1.48
Intesa Sanpaolo SpA EUR 420,000 1,204,980 2.21
3,258,447 5.97luxembourgSES SA EUR 38,000 1,071,125 1.96
1,071,125 1.96netherlandsAltice NV A EUR 10,200 189,287 0.35
Altice NV B EUR 3,400 67,345 0.12
ASML Holding NV EUR 7,868 610,517 1.12
ING Groep NV, CVA EUR 98,000 1,252,930 2.30
2,120,079 3.89
the accompanying notes form an integral part of these financial statements.
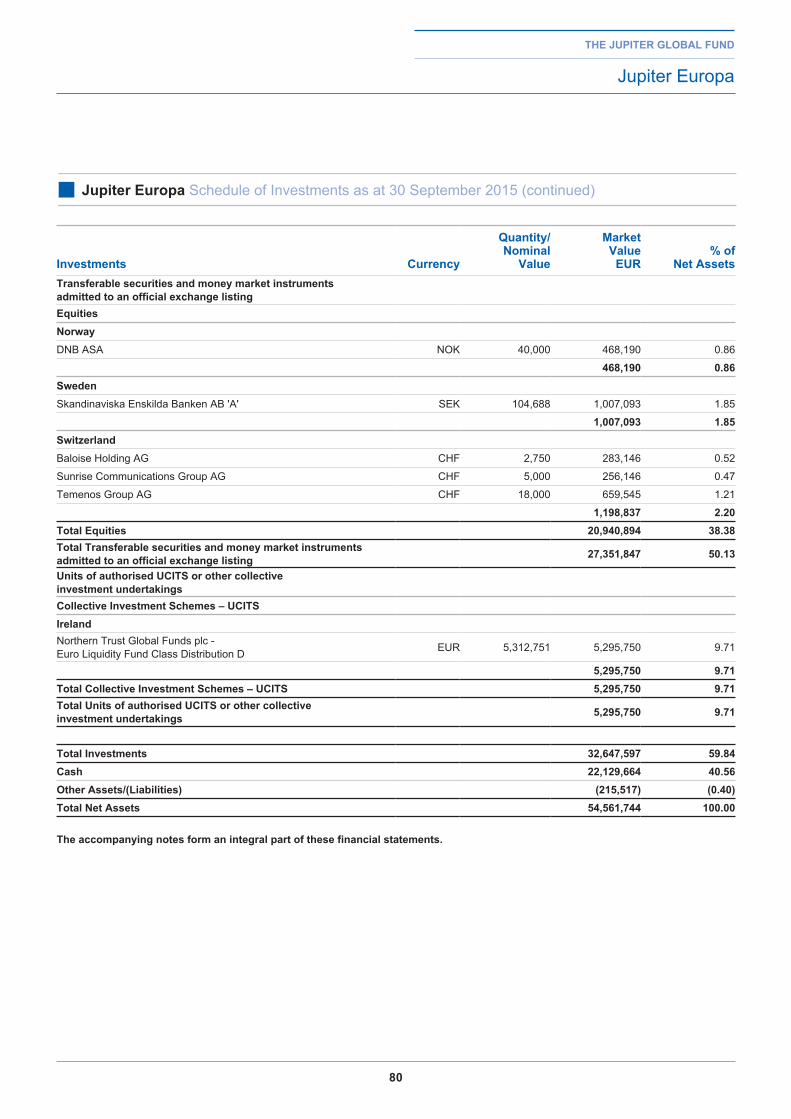
80
the jupiter global fund
Jupiter Europa
■ jupiter europa Schedule of Investments as at 30 September 2015 (continued)
investments Currency
Quantity/ nominal
Value
Market Value
eur% of
net assetstransferable securities and money market instruments admitted to an official exchange listingequitiesnorwayDNB ASA NOK 40,000 468,190 0.86
468,190 0.86SwedenSkandinaviska Enskilda Banken AB 'A' SEK 104,688 1,007,093 1.85
1,007,093 1.85SwitzerlandBaloise Holding AG CHF 2,750 283,146 0.52
Sunrise Communications Group AG CHF 5,000 256,146 0.47
Temenos Group AG CHF 18,000 659,545 1.21
1,198,837 2.20total equities 20,940,894 38.38total transferable securities and money market instruments admitted to an official exchange listing 27,351,847 50.13
units of authorised uCitS or other collective investment undertakingsCollective investment Schemes – uCitSirelandNorthern Trust Global Funds plc - Euro Liquidity Fund Class Distribution D EUR 5,312,751 5,295,750 9.71
5,295,750 9.71total Collective investment Schemes – uCitS 5,295,750 9.71total units of authorised uCitS or other collective investment undertakings 5,295,750 9.71
total investments 32,647,597 59.84Cash 22,129,664 40.56other assets/(liabilities) (215,517) (0.40)total net assets 54,561,744 100.00
the accompanying notes form an integral part of these financial statements.
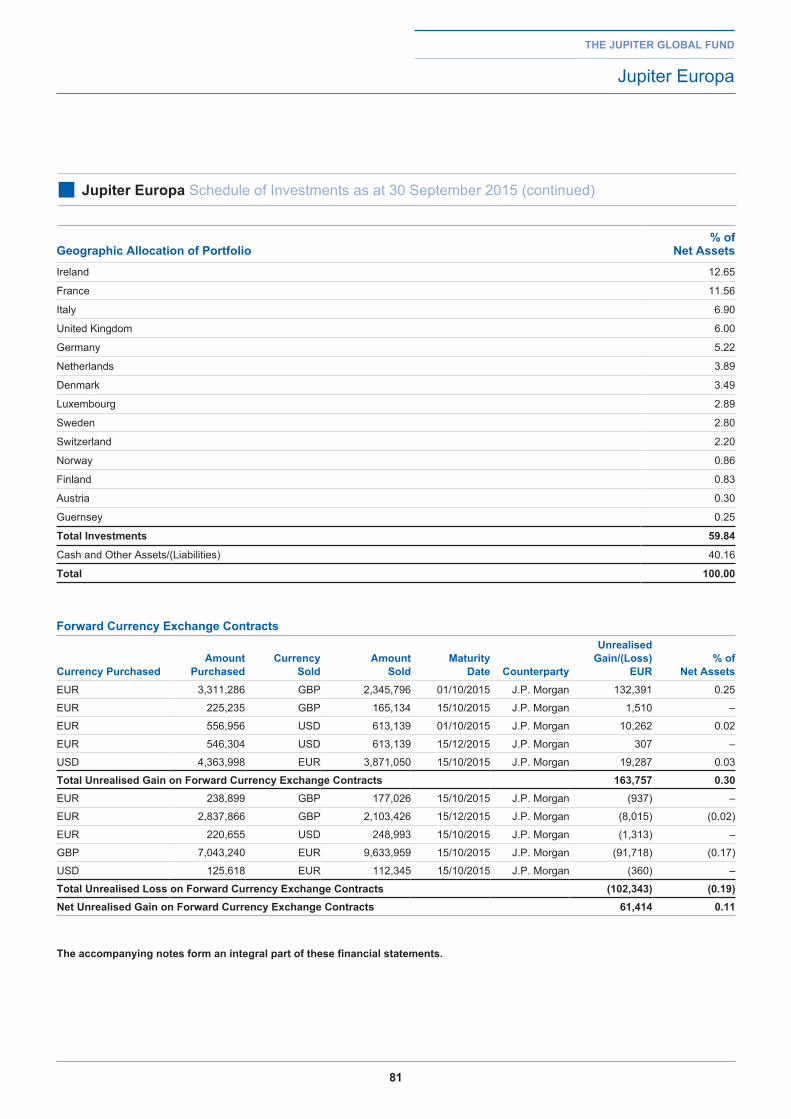
81
geographic allocation of portfolio% of
net assetsIreland 12.65
France 11.56
Italy 6.90
United Kingdom 6.00
Germany 5.22
Netherlands 3.89
Denmark 3.49
Luxembourg 2.89
Sweden 2.80
Switzerland 2.20
Norway 0.86
Finland 0.83
Austria 0.30
Guernsey 0.25
total investments 59.84
Cash and Other Assets/(Liabilities) 40.16
total 100.00
the jupiter global fund
Jupiter Europa
■ jupiter europa Schedule of Investments as at 30 September 2015 (continued)
forward Currency exchange Contracts
Currency purchasedamount
purchasedCurrency
Soldamount
SoldMaturity
date Counterparty
unrealised gain/(loss)
eur% of
net assetsEUR 3,311,286 GBP 2,345,796 01/10/2015 J.P. Morgan 132,391 0.25
EUR 225,235 GBP 165,134 15/10/2015 J.P. Morgan 1,510 –
EUR 556,956 USD 613,139 01/10/2015 J.P. Morgan 10,262 0.02
EUR 546,304 USD 613,139 15/12/2015 J.P. Morgan 307 –
USD 4,363,998 EUR 3,871,050 15/10/2015 J.P. Morgan 19,287 0.03
total unrealised gain on forward Currency exchange Contracts 163,757 0.30EUR 238,899 GBP 177,026 15/10/2015 J.P. Morgan (937) –
EUR 2,837,866 GBP 2,103,426 15/12/2015 J.P. Morgan (8,015) (0.02)
EUR 220,655 USD 248,993 15/10/2015 J.P. Morgan (1,313) –
GBP 7,043,240 EUR 9,633,959 15/10/2015 J.P. Morgan (91,718) (0.17)
USD 125,618 EUR 112,345 15/10/2015 J.P. Morgan (360) –
total unrealised loss on forward Currency exchange Contracts (102,343) (0.19)net unrealised gain on forward Currency exchange Contracts 61,414 0.11
the accompanying notes form an integral part of these financial statements.
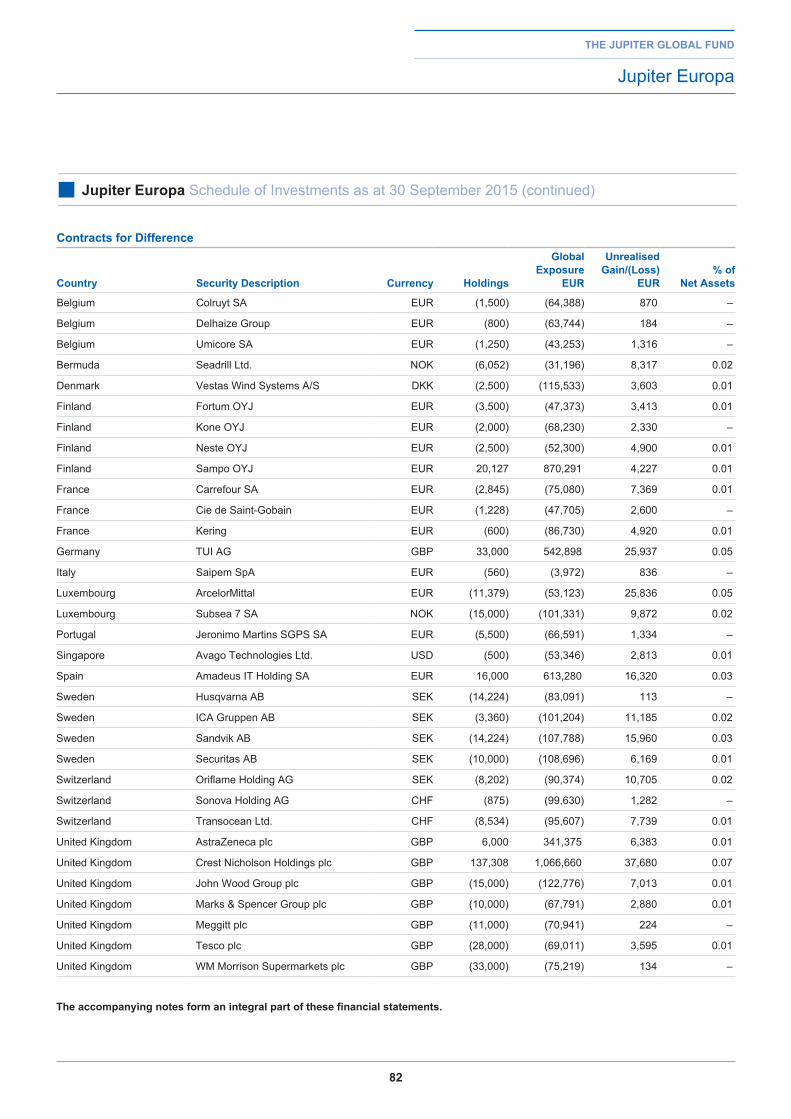
82
the jupiter global fund
Jupiter Europa
■ jupiter europa Schedule of Investments as at 30 September 2015 (continued)
Contracts for difference
Country Security description Currency holdings
global exposure
eur
unrealised gain/(loss)
eur% of
net assets
Belgium Colruyt SA EUR (1,500) (64,388) 870 –
Belgium Delhaize Group EUR (800) (63,744) 184 –
Belgium Umicore SA EUR (1,250) (43,253) 1,316 –
Bermuda Seadrill Ltd. NOK (6,052) (31,196) 8,317 0.02
Denmark Vestas Wind Systems A/S DKK (2,500) (115,533) 3,603 0.01
Finland Fortum OYJ EUR (3,500) (47,373) 3,413 0.01
Finland Kone OYJ EUR (2,000) (68,230) 2,330 –
Finland Neste OYJ EUR (2,500) (52,300) 4,900 0.01
Finland Sampo OYJ EUR 20,127 870,291 4,227 0.01
France Carrefour SA EUR (2,845) (75,080) 7,369 0.01
France Cie de Saint-Gobain EUR (1,228) (47,705) 2,600 –
France Kering EUR (600) (86,730) 4,920 0.01
Germany TUI AG GBP 33,000 542,898 25,937 0.05
Italy Saipem SpA EUR (560) (3,972) 836 –
Luxembourg ArcelorMittal EUR (11,379) (53,123) 25,836 0.05
Luxembourg Subsea 7 SA NOK (15,000) (101,331) 9,872 0.02
Portugal Jeronimo Martins SGPS SA EUR (5,500) (66,591) 1,334 –
Singapore Avago Technologies Ltd. USD (500) (53,346) 2,813 0.01
Spain Amadeus IT Holding SA EUR 16,000 613,280 16,320 0.03
Sweden Husqvarna AB SEK (14,224) (83,091) 113 –
Sweden ICA Gruppen AB SEK (3,360) (101,204) 11,185 0.02
Sweden Sandvik AB SEK (14,224) (107,788) 15,960 0.03
Sweden Securitas AB SEK (10,000) (108,696) 6,169 0.01
Switzerland Oriflame Holding AG SEK (8,202) (90,374) 10,705 0.02
Switzerland Sonova Holding AG CHF (875) (99,630) 1,282 –
Switzerland Transocean Ltd. CHF (8,534) (95,607) 7,739 0.01
United Kingdom AstraZeneca plc GBP 6,000 341,375 6,383 0.01
United Kingdom Crest Nicholson Holdings plc GBP 137,308 1,066,660 37,680 0.07
United Kingdom John Wood Group plc GBP (15,000) (122,776) 7,013 0.01
United Kingdom Marks & Spencer Group plc GBP (10,000) (67,791) 2,880 0.01
United Kingdom Meggitt plc GBP (11,000) (70,941) 224 –
United Kingdom Tesco plc GBP (28,000) (69,011) 3,595 0.01
United Kingdom WM Morrison Supermarkets plc GBP (33,000) (75,219) 134 –
the accompanying notes form an integral part of these financial statements.
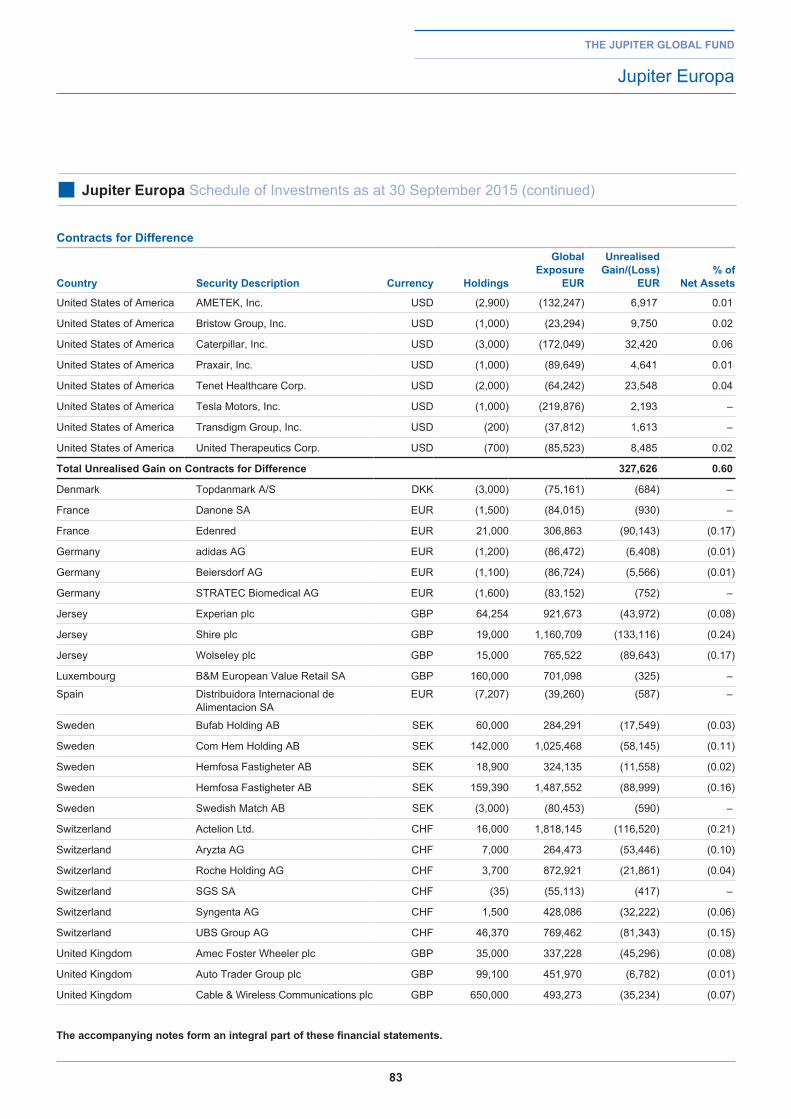
83
the jupiter global fund
Jupiter Europa
■ jupiter europa Schedule of Investments as at 30 September 2015 (continued)
Contracts for difference
Country Security description Currency holdings
global exposure
eur
unrealised gain/(loss)
eur% of
net assets
United States of America AMETEK, Inc. USD (2,900) (132,247) 6,917 0.01
United States of America Bristow Group, Inc. USD (1,000) (23,294) 9,750 0.02
United States of America Caterpillar, Inc. USD (3,000) (172,049) 32,420 0.06
United States of America Praxair, Inc. USD (1,000) (89,649) 4,641 0.01
United States of America Tenet Healthcare Corp. USD (2,000) (64,242) 23,548 0.04
United States of America Tesla Motors, Inc. USD (1,000) (219,876) 2,193 –
United States of America Transdigm Group, Inc. USD (200) (37,812) 1,613 –
United States of America United Therapeutics Corp. USD (700) (85,523) 8,485 0.02
total unrealised gain on Contracts for difference 327,626 0.60
Denmark Topdanmark A/S DKK (3,000) (75,161) (684) –
France Danone SA EUR (1,500) (84,015) (930) –
France Edenred EUR 21,000 306,863 (90,143) (0.17)
Germany adidas AG EUR (1,200) (86,472) (6,408) (0.01)
Germany Beiersdorf AG EUR (1,100) (86,724) (5,566) (0.01)
Germany STRATEC Biomedical AG EUR (1,600) (83,152) (752) –
Jersey Experian plc GBP 64,254 921,673 (43,972) (0.08)
Jersey Shire plc GBP 19,000 1,160,709 (133,116) (0.24)
Jersey Wolseley plc GBP 15,000 765,522 (89,643) (0.17)
Luxembourg B&M European Value Retail SA GBP 160,000 701,098 (325) –
Spain Distribuidora Internacional de Alimentacion SA
EUR (7,207) (39,260) (587) –
Sweden Bufab Holding AB SEK 60,000 284,291 (17,549) (0.03)
Sweden Com Hem Holding AB SEK 142,000 1,025,468 (58,145) (0.11)
Sweden Hemfosa Fastigheter AB SEK 18,900 324,135 (11,558) (0.02)
Sweden Hemfosa Fastigheter AB SEK 159,390 1,487,552 (88,999) (0.16)
Sweden Swedish Match AB SEK (3,000) (80,453) (590) –
Switzerland Actelion Ltd. CHF 16,000 1,818,145 (116,520) (0.21)
Switzerland Aryzta AG CHF 7,000 264,473 (53,446) (0.10)
Switzerland Roche Holding AG CHF 3,700 872,921 (21,861) (0.04)
Switzerland SGS SA CHF (35) (55,113) (417) –
Switzerland Syngenta AG CHF 1,500 428,086 (32,222) (0.06)
Switzerland UBS Group AG CHF 46,370 769,462 (81,343) (0.15)
United Kingdom Amec Foster Wheeler plc GBP 35,000 337,228 (45,296) (0.08)
United Kingdom Auto Trader Group plc GBP 99,100 451,970 (6,782) (0.01)
United Kingdom Cable & Wireless Communications plc GBP 650,000 493,273 (35,234) (0.07)
the accompanying notes form an integral part of these financial statements.
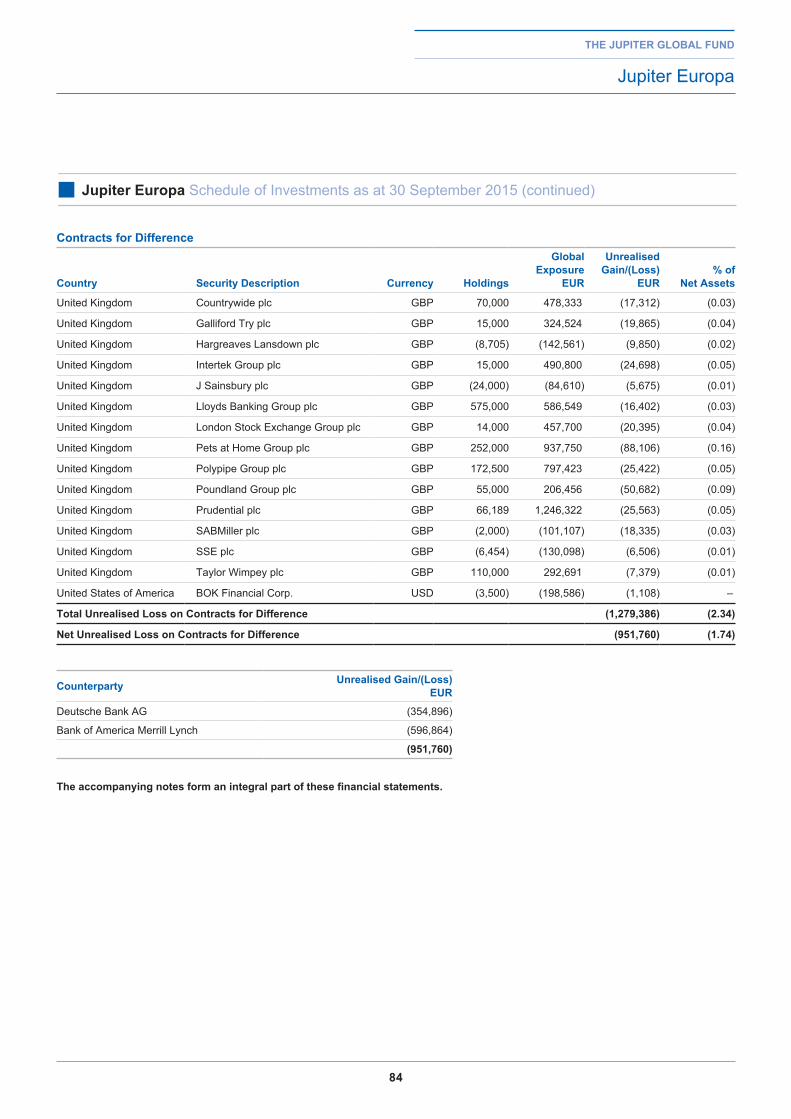
84
the jupiter global fund
Jupiter Europa
■ jupiter europa Schedule of Investments as at 30 September 2015 (continued)
Contracts for difference
Country Security description Currency holdings
global exposure
eur
unrealised gain/(loss)
eur% of
net assets
United Kingdom Countrywide plc GBP 70,000 478,333 (17,312) (0.03)
United Kingdom Galliford Try plc GBP 15,000 324,524 (19,865) (0.04)
United Kingdom Hargreaves Lansdown plc GBP (8,705) (142,561) (9,850) (0.02)
United Kingdom Intertek Group plc GBP 15,000 490,800 (24,698) (0.05)
United Kingdom J Sainsbury plc GBP (24,000) (84,610) (5,675) (0.01)
United Kingdom Lloyds Banking Group plc GBP 575,000 586,549 (16,402) (0.03)
United Kingdom London Stock Exchange Group plc GBP 14,000 457,700 (20,395) (0.04)
United Kingdom Pets at Home Group plc GBP 252,000 937,750 (88,106) (0.16)
United Kingdom Polypipe Group plc GBP 172,500 797,423 (25,422) (0.05)
United Kingdom Poundland Group plc GBP 55,000 206,456 (50,682) (0.09)
United Kingdom Prudential plc GBP 66,189 1,246,322 (25,563) (0.05)
United Kingdom SABMiller plc GBP (2,000) (101,107) (18,335) (0.03)
United Kingdom SSE plc GBP (6,454) (130,098) (6,506) (0.01)
United Kingdom Taylor Wimpey plc GBP 110,000 292,691 (7,379) (0.01)
United States of America BOK Financial Corp. USD (3,500) (198,586) (1,108) –
total unrealised loss on Contracts for difference (1,279,386) (2.34)
net unrealised loss on Contracts for difference (951,760) (1.74)
Counterparty unrealised gain/(loss) eur
Deutsche Bank AG (354,896)
Bank of America Merrill Lynch (596,864)
(951,760)
the accompanying notes form an integral part of these financial statements.
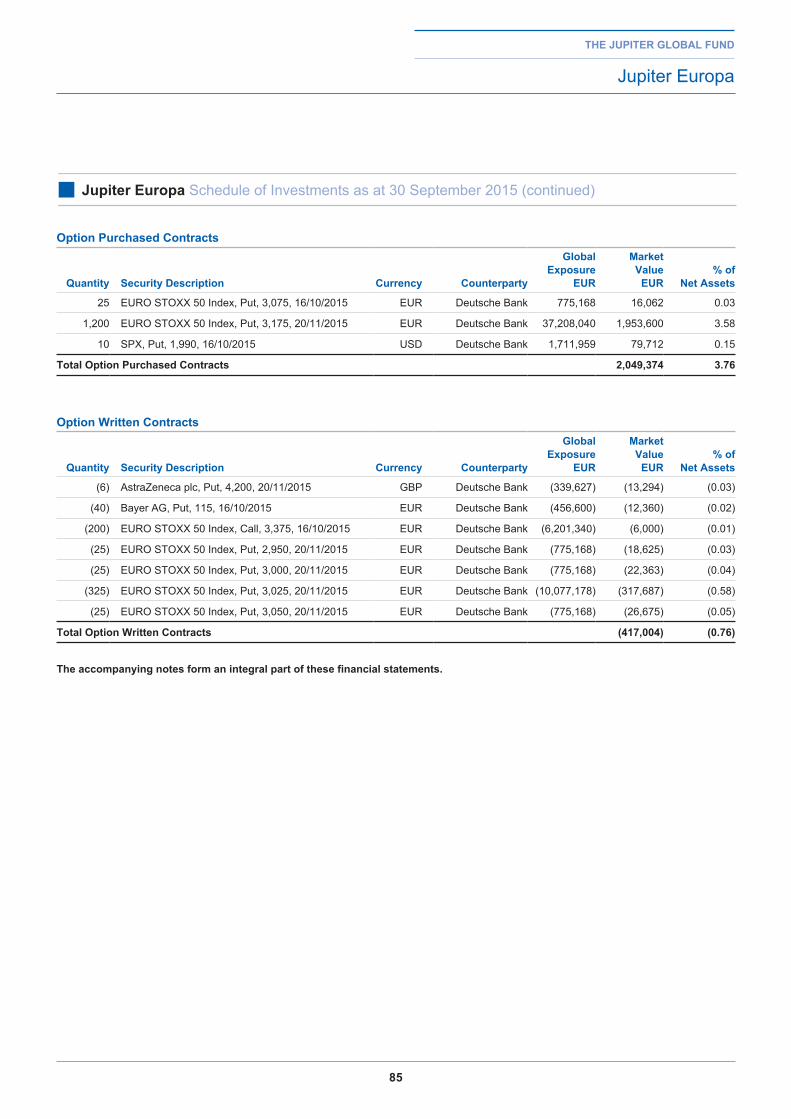
85
the jupiter global fund
Jupiter Europa
■ jupiter europa Schedule of Investments as at 30 September 2015 (continued)
option purchased Contracts
Quantity Security description Currency Counterparty
global exposure
eur
Market Value
eur% of
net assets
25 EURO STOXX 50 Index, Put, 3,075, 16/10/2015 EUR Deutsche Bank 775,168 16,062 0.03
1,200 EURO STOXX 50 Index, Put, 3,175, 20/11/2015 EUR Deutsche Bank 37,208,040 1,953,600 3.58
10 SPX, Put, 1,990, 16/10/2015 USD Deutsche Bank 1,711,959 79,712 0.15
total option purchased Contracts 2,049,374 3.76
option Written Contracts
Quantity Security description Currency Counterparty
global exposure
eur
Market Value
eur% of
net assets
(6) AstraZeneca plc, Put, 4,200, 20/11/2015 GBP Deutsche Bank (339,627) (13,294) (0.03)
(40) Bayer AG, Put, 115, 16/10/2015 EUR Deutsche Bank (456,600) (12,360) (0.02)
(200) EURO STOXX 50 Index, Call, 3,375, 16/10/2015 EUR Deutsche Bank (6,201,340) (6,000) (0.01)
(25) EURO STOXX 50 Index, Put, 2,950, 20/11/2015 EUR Deutsche Bank (775,168) (18,625) (0.03)
(25) EURO STOXX 50 Index, Put, 3,000, 20/11/2015 EUR Deutsche Bank (775,168) (22,363) (0.04)
(325) EURO STOXX 50 Index, Put, 3,025, 20/11/2015 EUR Deutsche Bank (10,077,178) (317,687) (0.58)
(25) EURO STOXX 50 Index, Put, 3,050, 20/11/2015 EUR Deutsche Bank (775,168) (26,675) (0.05)
total option Written Contracts (417,004) (0.76)
the accompanying notes form an integral part of these financial statements.
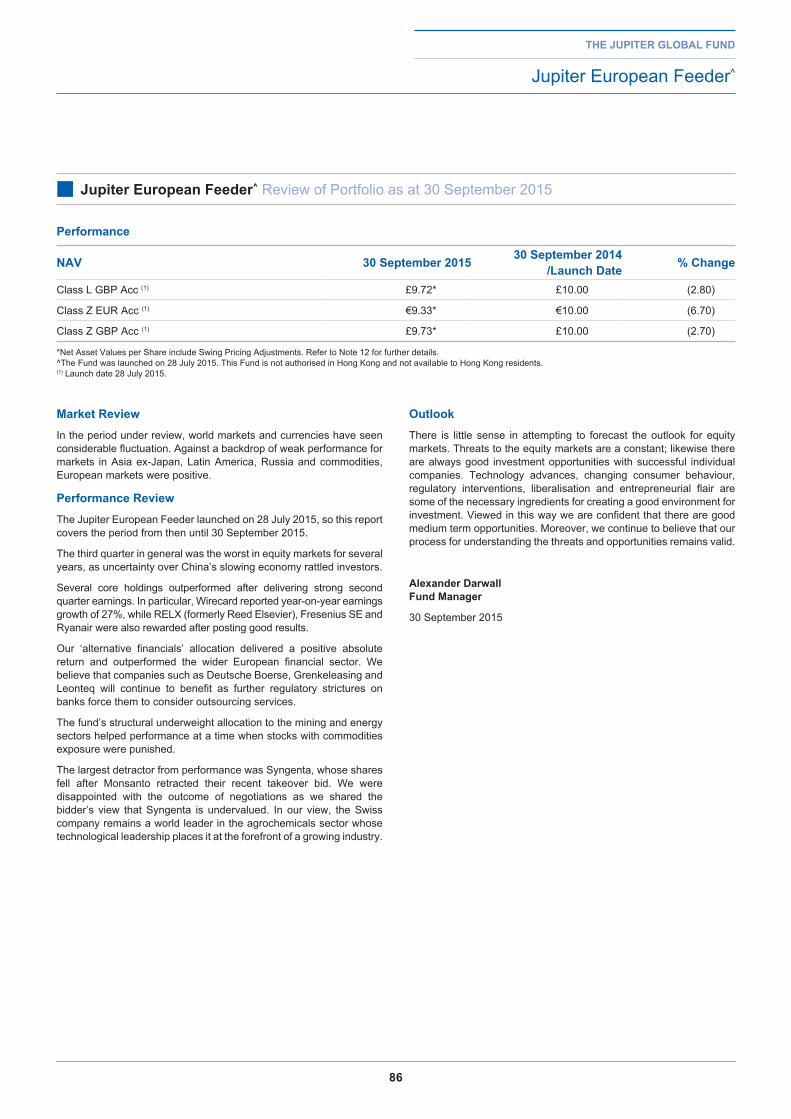
86
Market reviewIn the period under review, world markets and currencies have seen considerable fluctuation. Against a backdrop of weak performance for markets in Asia ex-Japan, Latin America, Russia and commodities, European markets were positive.
performance reviewThe Jupiter European Feeder launched on 28 July 2015, so this report covers the period from then until 30 September 2015.
The third quarter in general was the worst in equity markets for several years, as uncertainty over China’s slowing economy rattled investors.
Several core holdings outperformed after delivering strong second quarter earnings. In particular, Wirecard reported year-on-year earnings growth of 27%, while RELX (formerly Reed Elsevier), Fresenius SE and Ryanair were also rewarded after posting good results.
Our ‘alternative financials’ allocation delivered a positive absolute return and outperformed the wider European financial sector. We believe that companies such as Deutsche Boerse, Grenkeleasing and Leonteq will continue to benefit as further regulatory strictures on banks force them to consider outsourcing services.
The fund’s structural underweight allocation to the mining and energy sectors helped performance at a time when stocks with commodities exposure were punished.
The largest detractor from performance was Syngenta, whose shares fell after Monsanto retracted their recent takeover bid. We were disappointed with the outcome of negotiations as we shared the bidder’s view that Syngenta is undervalued. In our view, the Swiss company remains a world leader in the agrochemicals sector whose technological leadership places it at the forefront of a growing industry.
outlookThere is little sense in attempting to forecast the outlook for equity markets. Threats to the equity markets are a constant; likewise there are always good investment opportunities with successful individual companies. Technology advances, changing consumer behaviour, regulatory interventions, liberalisation and entrepreneurial flair are some of the necessary ingredients for creating a good environment for investment. Viewed in this way we are confident that there are good medium term opportunities. Moreover, we continue to believe that our process for understanding the threats and opportunities remains valid.
alexander darwallfund Manager
30 September 2015
the jupiter global fund
Jupiter European Feeder^
■ jupiter european feeder^ Review of Portfolio as at 30 September 2015
performance
naV 30 September 2015 30 September 2014 /launch date % Change
Class L GBP Acc (1) £9.72* £10.00 (2.80)
Class Z EUR Acc (1) €9.33* €10.00 (6.70)
Class Z GBP Acc (1) £9.73* £10.00 (2.70)
*Net Asset Values per Share include Swing Pricing Adjustments. Refer to Note 12 for further details. ^The Fund was launched on 28 July 2015. This Fund is not authorised in Hong Kong and not available to Hong Kong residents.(1) Launch date 28 July 2015.
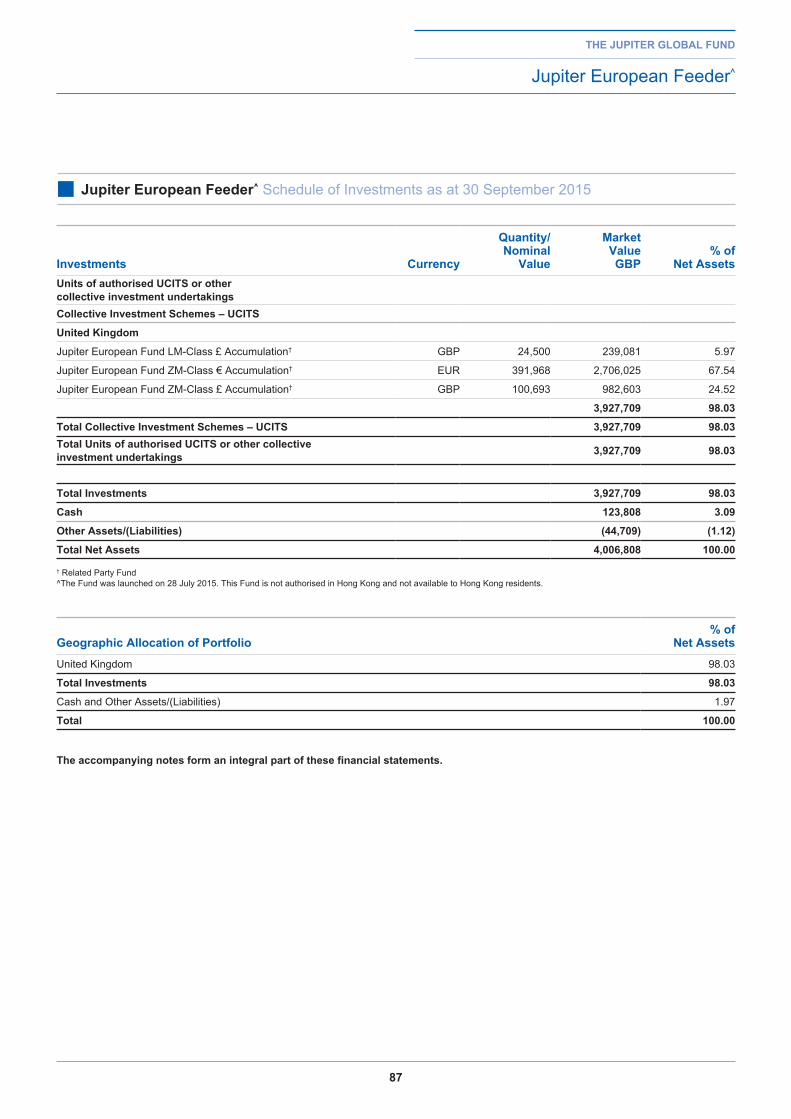
87
the jupiter global fund
Jupiter European Feeder^
■ jupiter european feeder^ Schedule of Investments as at 30 September 2015
investments Currency
Quantity/ nominal
Value
Market Value gbp
% of net assets
units of authorised uCitS or other collective investment undertakingsCollective investment Schemes – uCitS
united Kingdom
Jupiter European Fund LM-Class £ Accumulation† GBP 24,500 239,081 5.97
Jupiter European Fund ZM-Class € Accumulation† EUR 391,968 2,706,025 67.54
Jupiter European Fund ZM-Class £ Accumulation† GBP 100,693 982,603 24.52
3,927,709 98.03
total Collective investment Schemes – uCitS 3,927,709 98.03total units of authorised uCitS or other collective investment undertakings 3,927,709 98.03
total investments 3,927,709 98.03
Cash 123,808 3.09
other assets/(liabilities) (44,709) (1.12)
total net assets 4,006,808 100.00
† Related Party Fund^The Fund was launched on 28 July 2015. This Fund is not authorised in Hong Kong and not available to Hong Kong residents.
geographic allocation of portfolio% of
net assetsUnited Kingdom 98.03
total investments 98.03
Cash and Other Assets/(Liabilities) 1.97
total 100.00
the accompanying notes form an integral part of these financial statements.
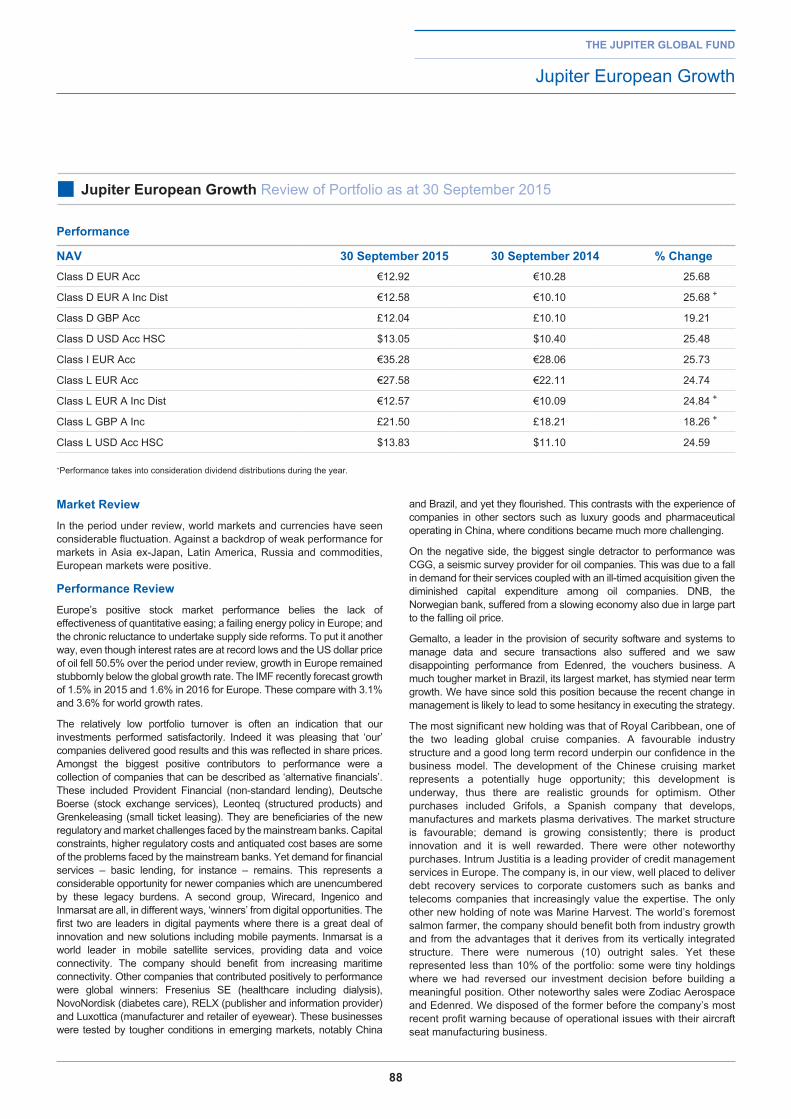
88
Market reviewIn the period under review, world markets and currencies have seen considerable fluctuation. Against a backdrop of weak performance for markets in Asia ex-Japan, Latin America, Russia and commodities, European markets were positive.
performance reviewEurope’s positive stock market performance belies the lack of effectiveness of quantitative easing; a failing energy policy in Europe; and the chronic reluctance to undertake supply side reforms. To put it another way, even though interest rates are at record lows and the US dollar price of oil fell 50.5% over the period under review, growth in Europe remained stubbornly below the global growth rate. The IMF recently forecast growth of 1.5% in 2015 and 1.6% in 2016 for Europe. These compare with 3.1% and 3.6% for world growth rates.
The relatively low portfolio turnover is often an indication that our investments performed satisfactorily. Indeed it was pleasing that ‘our’ companies delivered good results and this was reflected in share prices. Amongst the biggest positive contributors to performance were a collection of companies that can be described as ‘alternative financials’. These included Provident Financial (non-standard lending), Deutsche Boerse (stock exchange services), Leonteq (structured products) and Grenkeleasing (small ticket leasing). They are beneficiaries of the new regulatory and market challenges faced by the mainstream banks. Capital constraints, higher regulatory costs and antiquated cost bases are some of the problems faced by the mainstream banks. Yet demand for financial services – basic lending, for instance – remains. This represents a considerable opportunity for newer companies which are unencumbered by these legacy burdens. A second group, Wirecard, Ingenico and Inmarsat are all, in different ways, ‘winners’ from digital opportunities. The first two are leaders in digital payments where there is a great deal of innovation and new solutions including mobile payments. Inmarsat is a world leader in mobile satellite services, providing data and voice connectivity. The company should benefit from increasing maritime connectivity. Other companies that contributed positively to performance were global winners: Fresenius SE (healthcare including dialysis), NovoNordisk (diabetes care), RELX (publisher and information provider) and Luxottica (manufacturer and retailer of eyewear). These businesses were tested by tougher conditions in emerging markets, notably China
and Brazil, and yet they flourished. This contrasts with the experience of companies in other sectors such as luxury goods and pharmaceutical operating in China, where conditions became much more challenging.
On the negative side, the biggest single detractor to performance was CGG, a seismic survey provider for oil companies. This was due to a fall in demand for their services coupled with an ill-timed acquisition given the diminished capital expenditure among oil companies. DNB, the Norwegian bank, suffered from a slowing economy also due in large part to the falling oil price.
Gemalto, a leader in the provision of security software and systems to manage data and secure transactions also suffered and we saw disappointing performance from Edenred, the vouchers business. A much tougher market in Brazil, its largest market, has stymied near term growth. We have since sold this position because the recent change in management is likely to lead to some hesitancy in executing the strategy.
The most significant new holding was that of Royal Caribbean, one of the two leading global cruise companies. A favourable industry structure and a good long term record underpin our confidence in the business model. The development of the Chinese cruising market represents a potentially huge opportunity; this development is underway, thus there are realistic grounds for optimism. Other purchases included Grifols, a Spanish company that develops, manufactures and markets plasma derivatives. The market structure is favourable; demand is growing consistently; there is product innovation and it is well rewarded. There were other noteworthy purchases. Intrum Justitia is a leading provider of credit management services in Europe. The company is, in our view, well placed to deliver debt recovery services to corporate customers such as banks and telecoms companies that increasingly value the expertise. The only other new holding of note was Marine Harvest. The world’s foremost salmon farmer, the company should benefit both from industry growth and from the advantages that it derives from its vertically integrated structure. There were numerous (10) outright sales. Yet these represented less than 10% of the portfolio: some were tiny holdings where we had reversed our investment decision before building a meaningful position. Other noteworthy sales were Zodiac Aerospace and Edenred. We disposed of the former before the company’s most recent profit warning because of operational issues with their aircraft seat manufacturing business.
the jupiter global fund
Jupiter European Growth
■ jupiter european growth Review of Portfolio as at 30 September 2015
performance
naV 30 September 2015 30 September 2014 % ChangeClass D EUR Acc €12.92 €10.28 25.68
Class D EUR A Inc Dist €12.58 €10.10 25.68 +
Class D GBP Acc £12.04 £10.10 19.21
Class D USD Acc HSC $13.05 $10.40 25.48
Class I EUR Acc €35.28 €28.06 25.73
Class L EUR Acc €27.58 €22.11 24.74
Class L EUR A Inc Dist €12.57 €10.09 24.84 +
Class L GBP A Inc £21.50 £18.21 18.26 +
Class L USD Acc HSC $13.83 $11.10 24.59
+Performance takes into consideration dividend distributions during the year.
89
outlookThere is little sense in attempting to forecast the outlook for equity markets. Threats to the equity markets are a constant; likewise there are always good investment opportunities with successful individual companies. Technology advances, changing consumer behaviour, regulatory interventions, liberalisation and entrepreneurial flair are some of the necessary ingredients for creating a good environment for investment. Viewed in this way we are confident that there are good medium term opportunities. Moreover, we continue to believe that our process for understanding the threats and opportunities remains valid.
alexander darwallfund Manager
30 September 2015
the jupiter global fund
Jupiter European Growth
■ jupiter european growth Review of Portfolio as at 30 September 2015 (continued)
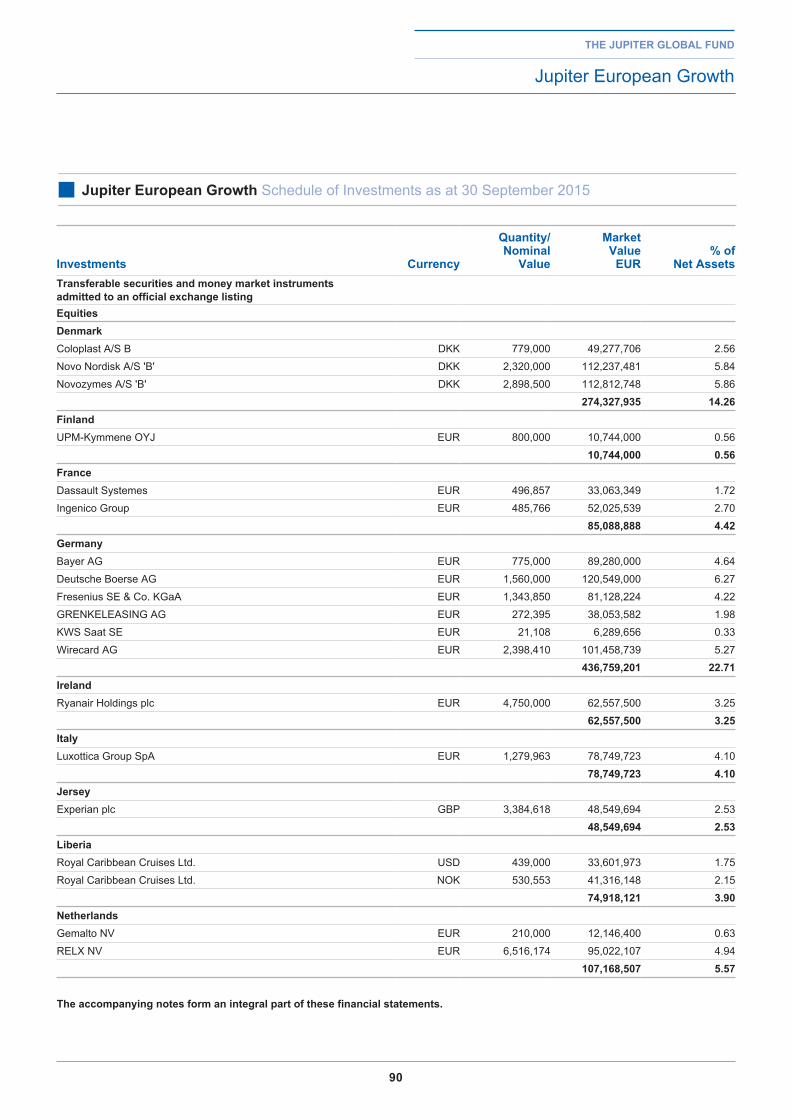
90
the jupiter global fund
Jupiter European Growth
■ jupiter european growth Schedule of Investments as at 30 September 2015
investments Currency
Quantity/ nominal
Value
Market Value
eur% of
net assetstransferable securities and money market instruments admitted to an official exchange listingequitiesdenmarkColoplast A/S B DKK 779,000 49,277,706 2.56
Novo Nordisk A/S 'B' DKK 2,320,000 112,237,481 5.84
Novozymes A/S 'B' DKK 2,898,500 112,812,748 5.86
274,327,935 14.26finlandUPM-Kymmene OYJ EUR 800,000 10,744,000 0.56
10,744,000 0.56franceDassault Systemes EUR 496,857 33,063,349 1.72
Ingenico Group EUR 485,766 52,025,539 2.70
85,088,888 4.42germanyBayer AG EUR 775,000 89,280,000 4.64
Deutsche Boerse AG EUR 1,560,000 120,549,000 6.27
Fresenius SE & Co. KGaA EUR 1,343,850 81,128,224 4.22
GRENKELEASING AG EUR 272,395 38,053,582 1.98
KWS Saat SE EUR 21,108 6,289,656 0.33
Wirecard AG EUR 2,398,410 101,458,739 5.27
436,759,201 22.71irelandRyanair Holdings plc EUR 4,750,000 62,557,500 3.25
62,557,500 3.25italyLuxottica Group SpA EUR 1,279,963 78,749,723 4.10
78,749,723 4.10jerseyExperian plc GBP 3,384,618 48,549,694 2.53
48,549,694 2.53liberiaRoyal Caribbean Cruises Ltd. USD 439,000 33,601,973 1.75
Royal Caribbean Cruises Ltd. NOK 530,553 41,316,148 2.15
74,918,121 3.90netherlandsGemalto NV EUR 210,000 12,146,400 0.63
RELX NV EUR 6,516,174 95,022,107 4.94
107,168,507 5.57
the accompanying notes form an integral part of these financial statements.
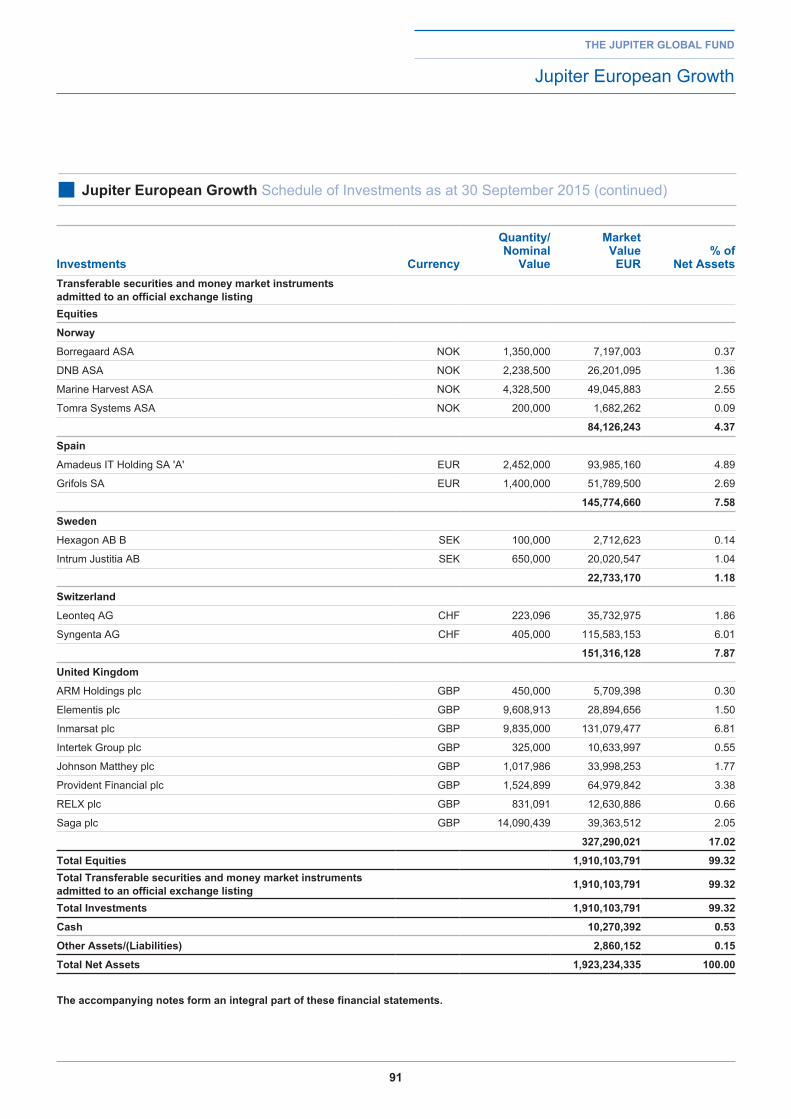
91
the jupiter global fund
Jupiter European Growth
■ jupiter european growth Schedule of Investments as at 30 September 2015 (continued)
investments Currency
Quantity/ nominal
Value
Market Value
eur% of
net assetstransferable securities and money market instruments admitted to an official exchange listingequities
norway
Borregaard ASA NOK 1,350,000 7,197,003 0.37
DNB ASA NOK 2,238,500 26,201,095 1.36
Marine Harvest ASA NOK 4,328,500 49,045,883 2.55
Tomra Systems ASA NOK 200,000 1,682,262 0.09
84,126,243 4.37
Spain
Amadeus IT Holding SA 'A' EUR 2,452,000 93,985,160 4.89
Grifols SA EUR 1,400,000 51,789,500 2.69
145,774,660 7.58
Sweden
Hexagon AB B SEK 100,000 2,712,623 0.14
Intrum Justitia AB SEK 650,000 20,020,547 1.04
22,733,170 1.18
Switzerland
Leonteq AG CHF 223,096 35,732,975 1.86
Syngenta AG CHF 405,000 115,583,153 6.01
151,316,128 7.87
united Kingdom
ARM Holdings plc GBP 450,000 5,709,398 0.30
Elementis plc GBP 9,608,913 28,894,656 1.50
Inmarsat plc GBP 9,835,000 131,079,477 6.81
Intertek Group plc GBP 325,000 10,633,997 0.55
Johnson Matthey plc GBP 1,017,986 33,998,253 1.77
Provident Financial plc GBP 1,524,899 64,979,842 3.38
RELX plc GBP 831,091 12,630,886 0.66
Saga plc GBP 14,090,439 39,363,512 2.05
327,290,021 17.02
total equities 1,910,103,791 99.32total transferable securities and money market instruments admitted to an official exchange listing 1,910,103,791 99.32
total investments 1,910,103,791 99.32
Cash 10,270,392 0.53
other assets/(liabilities) 2,860,152 0.15
total net assets 1,923,234,335 100.00
the accompanying notes form an integral part of these financial statements.
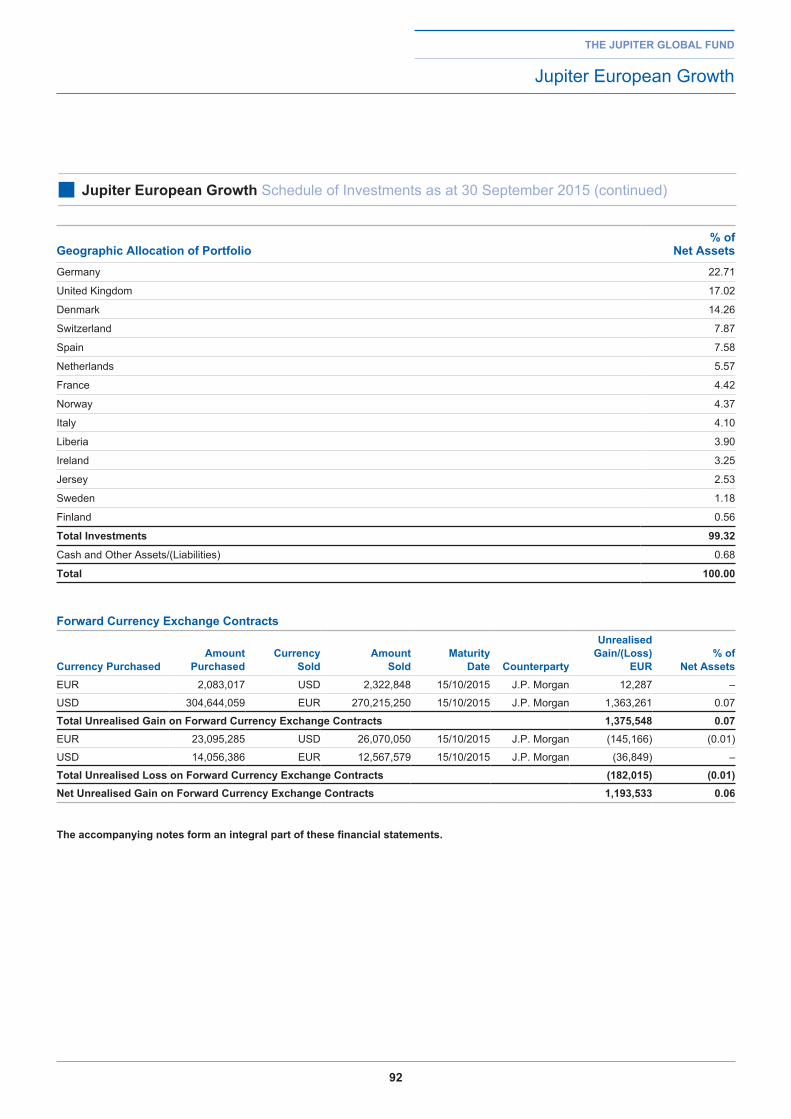
92
the jupiter global fund
Jupiter European Growth
■ jupiter european growth Schedule of Investments as at 30 September 2015 (continued)
geographic allocation of portfolio% of
net assetsGermany 22.71
United Kingdom 17.02
Denmark 14.26
Switzerland 7.87
Spain 7.58
Netherlands 5.57
France 4.42
Norway 4.37
Italy 4.10
Liberia 3.90
Ireland 3.25
Jersey 2.53
Sweden 1.18
Finland 0.56
total investments 99.32
Cash and Other Assets/(Liabilities) 0.68
total 100.00
forward Currency exchange Contracts
Currency purchasedamount
purchasedCurrency
Soldamount
SoldMaturity
date Counterparty
unrealised gain/(loss)
eur% of
net assetsEUR 2,083,017 USD 2,322,848 15/10/2015 J.P. Morgan 12,287 –
USD 304,644,059 EUR 270,215,250 15/10/2015 J.P. Morgan 1,363,261 0.07
total unrealised gain on forward Currency exchange Contracts 1,375,548 0.07EUR 23,095,285 USD 26,070,050 15/10/2015 J.P. Morgan (145,166) (0.01)
USD 14,056,386 EUR 12,567,579 15/10/2015 J.P. Morgan (36,849) –
total unrealised loss on forward Currency exchange Contracts (182,015) (0.01)net unrealised gain on forward Currency exchange Contracts 1,193,533 0.06
the accompanying notes form an integral part of these financial statements.
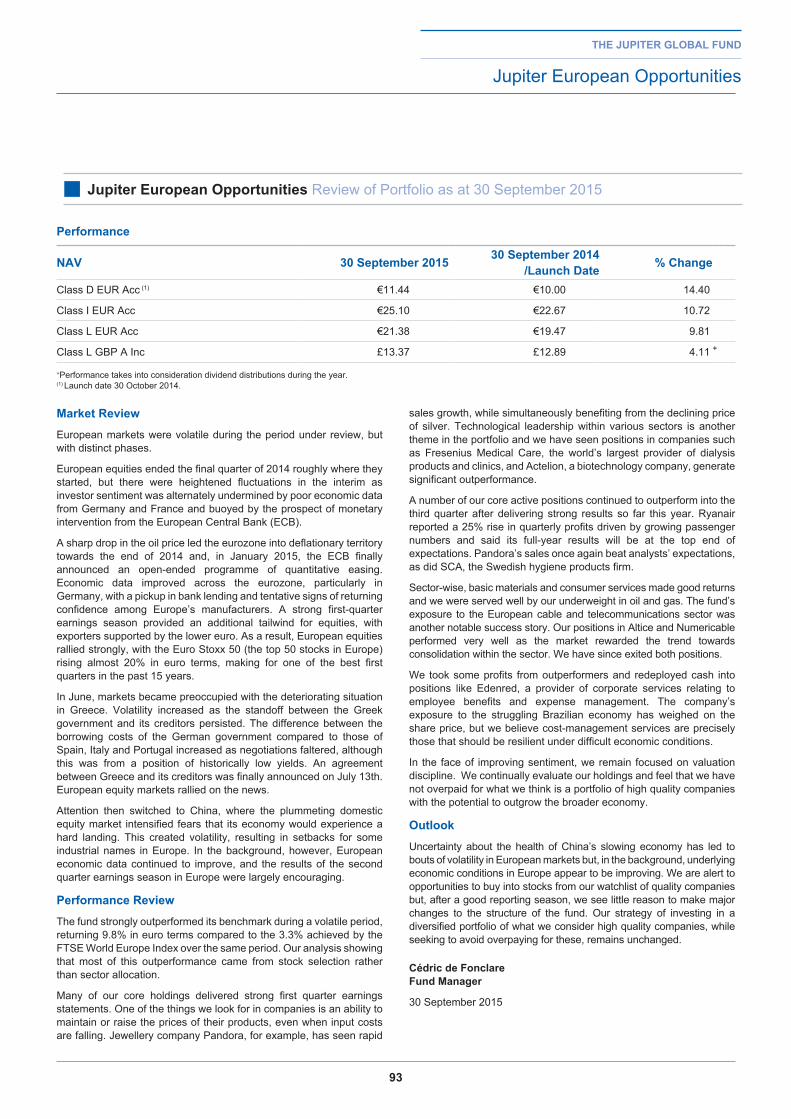
93
Market reviewEuropean markets were volatile during the period under review, but with distinct phases.
European equities ended the final quarter of 2014 roughly where they started, but there were heightened fluctuations in the interim as investor sentiment was alternately undermined by poor economic data from Germany and France and buoyed by the prospect of monetary intervention from the European Central Bank (ECB).
A sharp drop in the oil price led the eurozone into deflationary territory towards the end of 2014 and, in January 2015, the ECB finally announced an open-ended programme of quantitative easing. Economic data improved across the eurozone, particularly in Germany, with a pickup in bank lending and tentative signs of returning confidence among Europe’s manufacturers. A strong first-quarter earnings season provided an additional tailwind for equities, with exporters supported by the lower euro. As a result, European equities rallied strongly, with the Euro Stoxx 50 (the top 50 stocks in Europe) rising almost 20% in euro terms, making for one of the best first quarters in the past 15 years.
In June, markets became preoccupied with the deteriorating situation in Greece. Volatility increased as the standoff between the Greek government and its creditors persisted. The difference between the borrowing costs of the German government compared to those of Spain, Italy and Portugal increased as negotiations faltered, although this was from a position of historically low yields. An agreement between Greece and its creditors was finally announced on July 13th. European equity markets rallied on the news.
Attention then switched to China, where the plummeting domestic equity market intensified fears that its economy would experience a hard landing. This created volatility, resulting in setbacks for some industrial names in Europe. In the background, however, European economic data continued to improve, and the results of the second quarter earnings season in Europe were largely encouraging.
performance reviewThe fund strongly outperformed its benchmark during a volatile period, returning 9.8% in euro terms compared to the 3.3% achieved by the FTSE World Europe Index over the same period. Our analysis showing that most of this outperformance came from stock selection rather than sector allocation.
Many of our core holdings delivered strong first quarter earnings statements. One of the things we look for in companies is an ability to maintain or raise the prices of their products, even when input costs are falling. Jewellery company Pandora, for example, has seen rapid
sales growth, while simultaneously benefiting from the declining price of silver. Technological leadership within various sectors is another theme in the portfolio and we have seen positions in companies such as Fresenius Medical Care, the world’s largest provider of dialysis products and clinics, and Actelion, a biotechnology company, generate significant outperformance.
A number of our core active positions continued to outperform into the third quarter after delivering strong results so far this year. Ryanair reported a 25% rise in quarterly profits driven by growing passenger numbers and said its full-year results will be at the top end of expectations. Pandora’s sales once again beat analysts’ expectations, as did SCA, the Swedish hygiene products firm.
Sector-wise, basic materials and consumer services made good returns and we were served well by our underweight in oil and gas. The fund’s exposure to the European cable and telecommunications sector was another notable success story. Our positions in Altice and Numericable performed very well as the market rewarded the trend towards consolidation within the sector. We have since exited both positions.
We took some profits from outperformers and redeployed cash into positions like Edenred, a provider of corporate services relating to employee benefits and expense management. The company’s exposure to the struggling Brazilian economy has weighed on the share price, but we believe cost-management services are precisely those that should be resilient under difficult economic conditions.
In the face of improving sentiment, we remain focused on valuation discipline. We continually evaluate our holdings and feel that we have not overpaid for what we think is a portfolio of high quality companies with the potential to outgrow the broader economy.
outlookUncertainty about the health of China’s slowing economy has led to bouts of volatility in European markets but, in the background, underlying economic conditions in Europe appear to be improving. We are alert to opportunities to buy into stocks from our watchlist of quality companies but, after a good reporting season, we see little reason to make major changes to the structure of the fund. Our strategy of investing in a diversified portfolio of what we consider high quality companies, while seeking to avoid overpaying for these, remains unchanged.
Cédric de fonclarefund Manager
30 September 2015
the jupiter global fund
Jupiter European Opportunities
■ jupiter european opportunities Review of Portfolio as at 30 September 2015
performance
naV 30 September 2015 30 September 2014 /launch date % Change
Class D EUR Acc (1) €11.44 €10.00 14.40
Class I EUR Acc €25.10 €22.67 10.72
Class L EUR Acc €21.38 €19.47 9.81
Class L GBP A Inc £13.37 £12.89 4.11 +
+Performance takes into consideration dividend distributions during the year.(1) Launch date 30 October 2014.
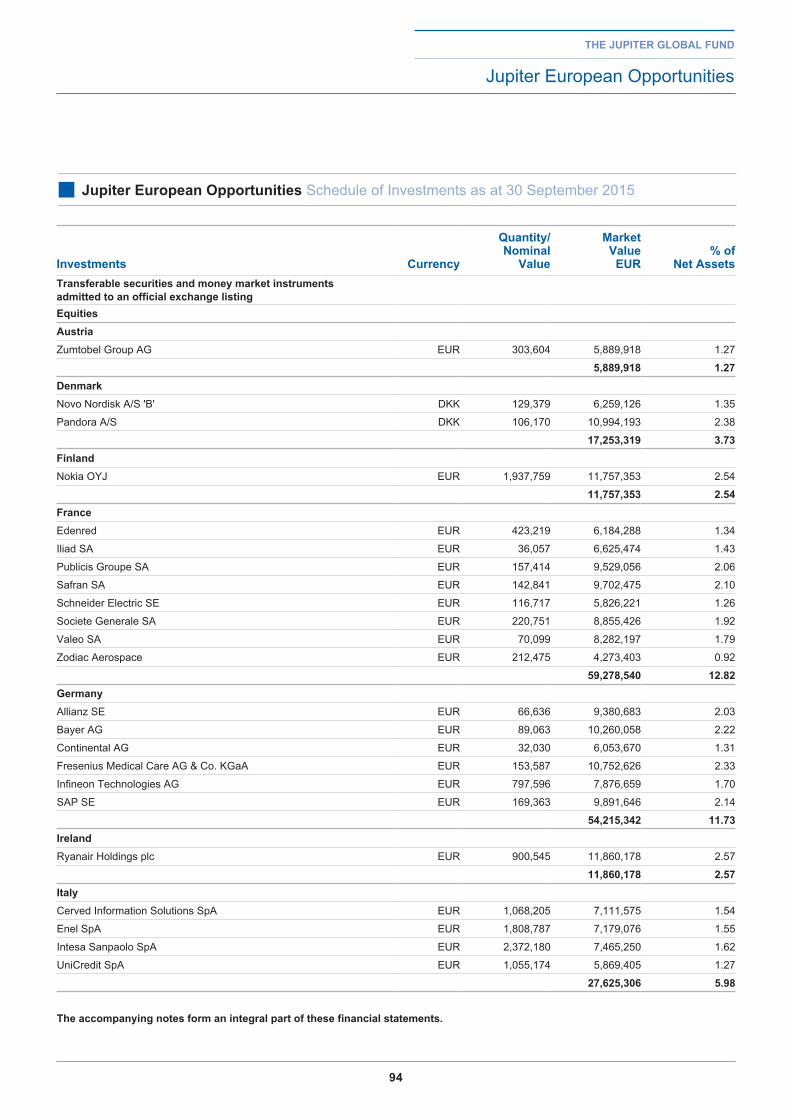
94
the jupiter global fund
Jupiter European Opportunities
■ jupiter european opportunities Schedule of Investments as at 30 September 2015
investments Currency
Quantity/ nominal
Value
Market Value
eur% of
net assetstransferable securities and money market instruments admitted to an official exchange listingequitiesaustriaZumtobel Group AG EUR 303,604 5,889,918 1.27
5,889,918 1.27denmarkNovo Nordisk A/S 'B' DKK 129,379 6,259,126 1.35
Pandora A/S DKK 106,170 10,994,193 2.38
17,253,319 3.73finlandNokia OYJ EUR 1,937,759 11,757,353 2.54
11,757,353 2.54franceEdenred EUR 423,219 6,184,288 1.34
Iliad SA EUR 36,057 6,625,474 1.43
Publicis Groupe SA EUR 157,414 9,529,056 2.06
Safran SA EUR 142,841 9,702,475 2.10
Schneider Electric SE EUR 116,717 5,826,221 1.26
Societe Generale SA EUR 220,751 8,855,426 1.92
Valeo SA EUR 70,099 8,282,197 1.79
Zodiac Aerospace EUR 212,475 4,273,403 0.92
59,278,540 12.82germanyAllianz SE EUR 66,636 9,380,683 2.03
Bayer AG EUR 89,063 10,260,058 2.22
Continental AG EUR 32,030 6,053,670 1.31
Fresenius Medical Care AG & Co. KGaA EUR 153,587 10,752,626 2.33
Infineon Technologies AG EUR 797,596 7,876,659 1.70
SAP SE EUR 169,363 9,891,646 2.14
54,215,342 11.73irelandRyanair Holdings plc EUR 900,545 11,860,178 2.57
11,860,178 2.57italyCerved Information Solutions SpA EUR 1,068,205 7,111,575 1.54
Enel SpA EUR 1,808,787 7,179,076 1.55
Intesa Sanpaolo SpA EUR 2,372,180 7,465,250 1.62
UniCredit SpA EUR 1,055,174 5,869,405 1.27
27,625,306 5.98
the accompanying notes form an integral part of these financial statements.
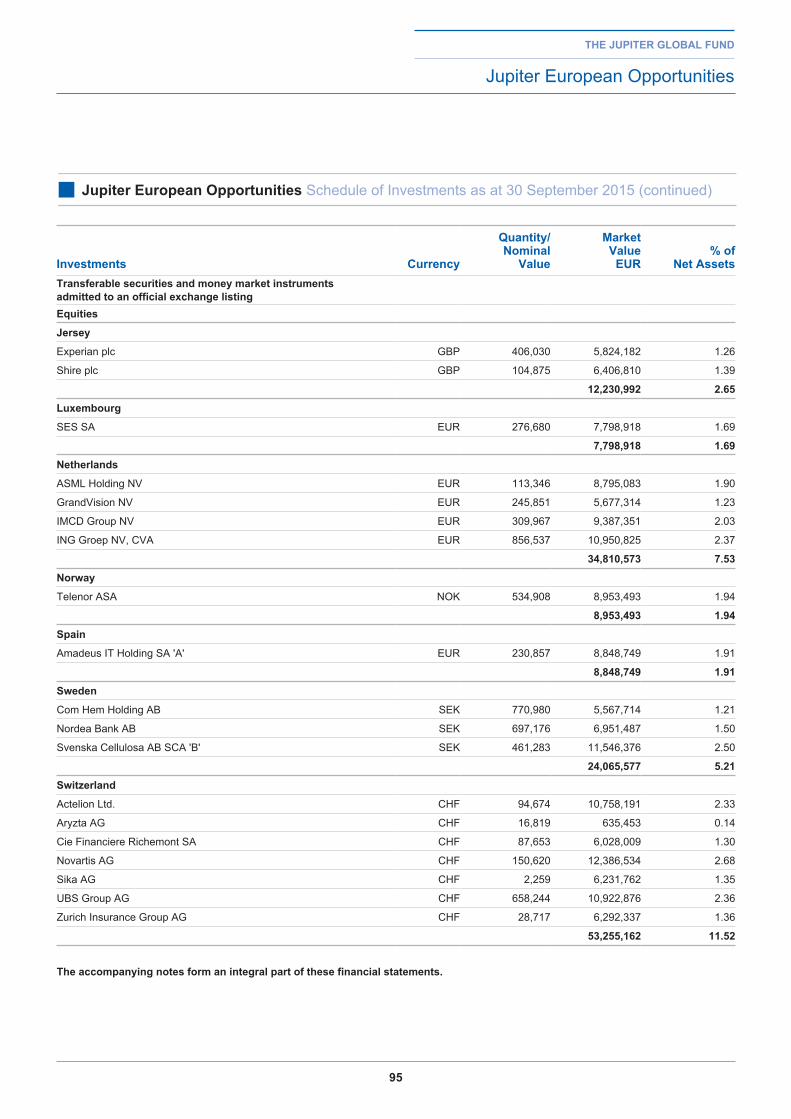
95
the jupiter global fund
Jupiter European Opportunities
■ jupiter european opportunities Schedule of Investments as at 30 September 2015 (continued)
investments Currency
Quantity/ nominal
Value
Market Value
eur% of
net assetstransferable securities and money market instruments admitted to an official exchange listingequities
jersey
Experian plc GBP 406,030 5,824,182 1.26
Shire plc GBP 104,875 6,406,810 1.39
12,230,992 2.65
luxembourg
SES SA EUR 276,680 7,798,918 1.69
7,798,918 1.69
netherlands
ASML Holding NV EUR 113,346 8,795,083 1.90
GrandVision NV EUR 245,851 5,677,314 1.23
IMCD Group NV EUR 309,967 9,387,351 2.03
ING Groep NV, CVA EUR 856,537 10,950,825 2.37
34,810,573 7.53
norway
Telenor ASA NOK 534,908 8,953,493 1.94
8,953,493 1.94
Spain
Amadeus IT Holding SA 'A' EUR 230,857 8,848,749 1.91
8,848,749 1.91
Sweden
Com Hem Holding AB SEK 770,980 5,567,714 1.21
Nordea Bank AB SEK 697,176 6,951,487 1.50
Svenska Cellulosa AB SCA 'B' SEK 461,283 11,546,376 2.50
24,065,577 5.21
Switzerland
Actelion Ltd. CHF 94,674 10,758,191 2.33
Aryzta AG CHF 16,819 635,453 0.14
Cie Financiere Richemont SA CHF 87,653 6,028,009 1.30
Novartis AG CHF 150,620 12,386,534 2.68
Sika AG CHF 2,259 6,231,762 1.35
UBS Group AG CHF 658,244 10,922,876 2.36
Zurich Insurance Group AG CHF 28,717 6,292,337 1.36
53,255,162 11.52
the accompanying notes form an integral part of these financial statements.
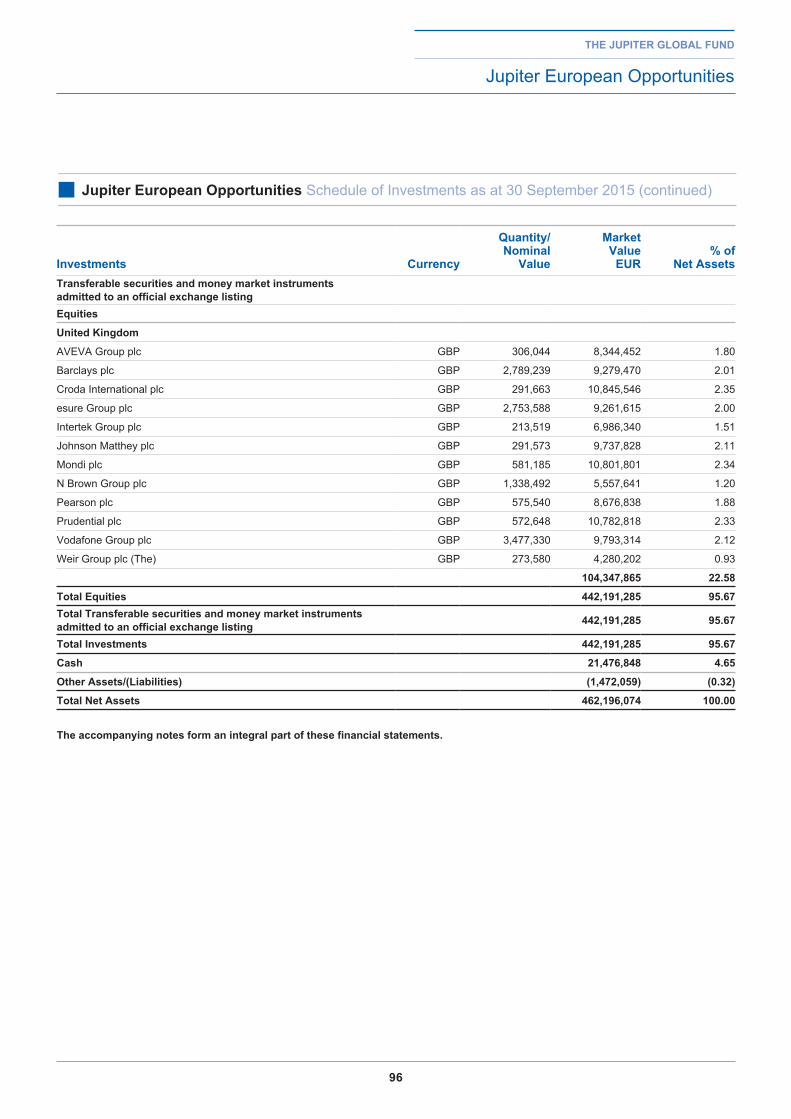
96
the jupiter global fund
Jupiter European Opportunities
■ jupiter european opportunities Schedule of Investments as at 30 September 2015 (continued)
investments Currency
Quantity/ nominal
Value
Market Value
eur% of
net assetstransferable securities and money market instruments admitted to an official exchange listingequities
united Kingdom
AVEVA Group plc GBP 306,044 8,344,452 1.80
Barclays plc GBP 2,789,239 9,279,470 2.01
Croda International plc GBP 291,663 10,845,546 2.35
esure Group plc GBP 2,753,588 9,261,615 2.00
Intertek Group plc GBP 213,519 6,986,340 1.51
Johnson Matthey plc GBP 291,573 9,737,828 2.11
Mondi plc GBP 581,185 10,801,801 2.34
N Brown Group plc GBP 1,338,492 5,557,641 1.20
Pearson plc GBP 575,540 8,676,838 1.88
Prudential plc GBP 572,648 10,782,818 2.33
Vodafone Group plc GBP 3,477,330 9,793,314 2.12
Weir Group plc (The) GBP 273,580 4,280,202 0.93
104,347,865 22.58
total equities 442,191,285 95.67total transferable securities and money market instruments admitted to an official exchange listing 442,191,285 95.67
total investments 442,191,285 95.67
Cash 21,476,848 4.65
other assets/(liabilities) (1,472,059) (0.32)
total net assets 462,196,074 100.00
the accompanying notes form an integral part of these financial statements.
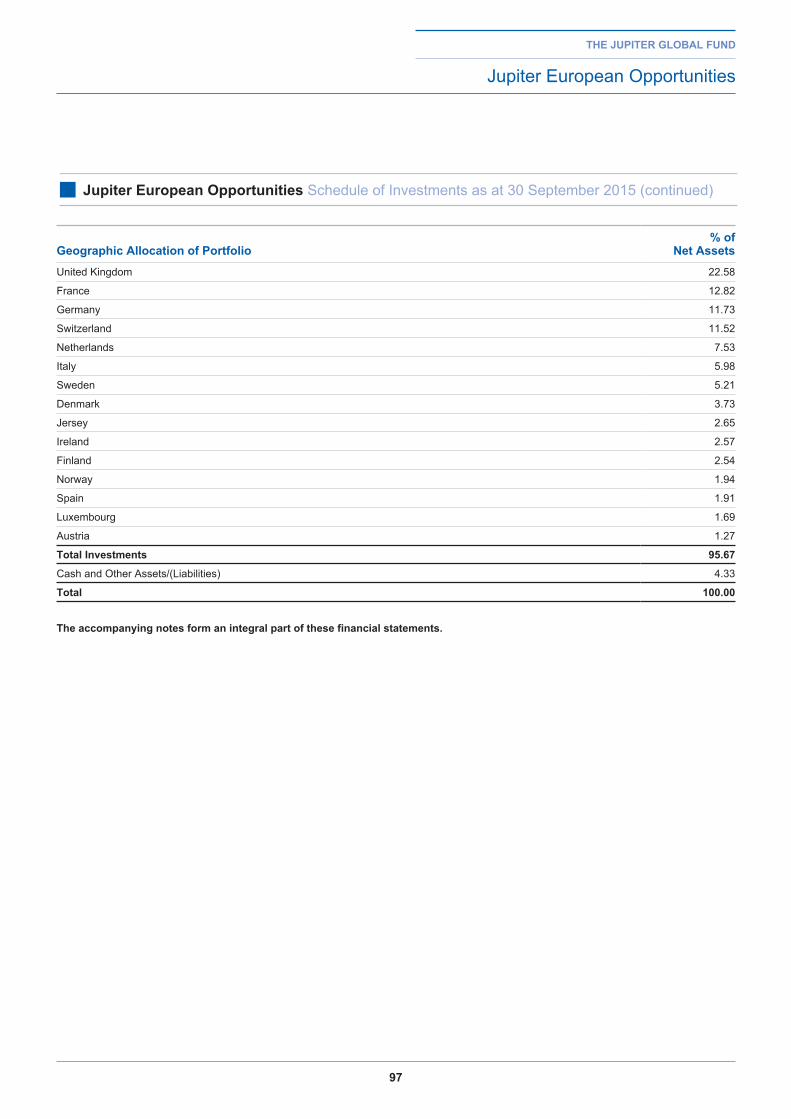
97
the jupiter global fund
Jupiter European Opportunities
■ jupiter european opportunities Schedule of Investments as at 30 September 2015 (continued)
geographic allocation of portfolio% of
net assetsUnited Kingdom 22.58
France 12.82
Germany 11.73
Switzerland 11.52
Netherlands 7.53
Italy 5.98
Sweden 5.21
Denmark 3.73
Jersey 2.65
Ireland 2.57
Finland 2.54
Norway 1.94
Spain 1.91
Luxembourg 1.69
Austria 1.27
total investments 95.67
Cash and Other Assets/(Liabilities) 4.33
total 100.00
the accompanying notes form an integral part of these financial statements.
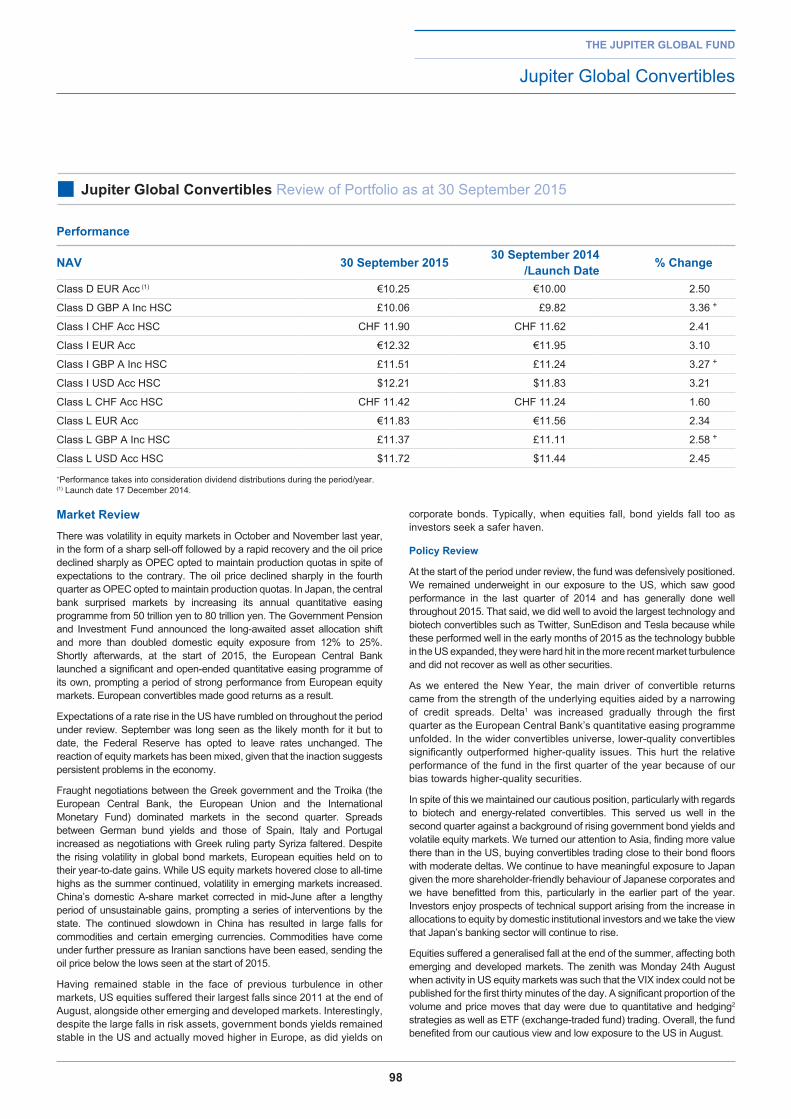
98
Market reviewThere was volatility in equity markets in October and November last year, in the form of a sharp sell-off followed by a rapid recovery and the oil price declined sharply as OPEC opted to maintain production quotas in spite of expectations to the contrary. The oil price declined sharply in the fourth quarter as OPEC opted to maintain production quotas. In Japan, the central bank surprised markets by increasing its annual quantitative easing programme from 50 trillion yen to 80 trillion yen. The Government Pension and Investment Fund announced the long-awaited asset allocation shift and more than doubled domestic equity exposure from 12% to 25%. Shortly afterwards, at the start of 2015, the European Central Bank launched a significant and open-ended quantitative easing programme of its own, prompting a period of strong performance from European equity markets. European convertibles made good returns as a result.
Expectations of a rate rise in the US have rumbled on throughout the period under review. September was long seen as the likely month for it but to date, the Federal Reserve has opted to leave rates unchanged. The reaction of equity markets has been mixed, given that the inaction suggests persistent problems in the economy.
Fraught negotiations between the Greek government and the Troika (the European Central Bank, the European Union and the International Monetary Fund) dominated markets in the second quarter. Spreads between German bund yields and those of Spain, Italy and Portugal increased as negotiations with Greek ruling party Syriza faltered. Despite the rising volatility in global bond markets, European equities held on to their year-to-date gains. While US equity markets hovered close to all-time highs as the summer continued, volatility in emerging markets increased. China’s domestic A-share market corrected in mid-June after a lengthy period of unsustainable gains, prompting a series of interventions by the state. The continued slowdown in China has resulted in large falls for commodities and certain emerging currencies. Commodities have come under further pressure as Iranian sanctions have been eased, sending the oil price below the lows seen at the start of 2015.
Having remained stable in the face of previous turbulence in other markets, US equities suffered their largest falls since 2011 at the end of August, alongside other emerging and developed markets. Interestingly, despite the large falls in risk assets, government bonds yields remained stable in the US and actually moved higher in Europe, as did yields on
corporate bonds. Typically, when equities fall, bond yields fall too as investors seek a safer haven.
policy review
At the start of the period under review, the fund was defensively positioned. We remained underweight in our exposure to the US, which saw good performance in the last quarter of 2014 and has generally done well throughout 2015. That said, we did well to avoid the largest technology and biotech convertibles such as Twitter, SunEdison and Tesla because while these performed well in the early months of 2015 as the technology bubble in the US expanded, they were hard hit in the more recent market turbulence and did not recover as well as other securities.
As we entered the New Year, the main driver of convertible returns came from the strength of the underlying equities aided by a narrowing of credit spreads. Delta1 was increased gradually through the first quarter as the European Central Bank’s quantitative easing programme unfolded. In the wider convertibles universe, lower-quality convertibles significantly outperformed higher-quality issues. This hurt the relative performance of the fund in the first quarter of the year because of our bias towards higher-quality securities.
In spite of this we maintained our cautious position, particularly with regards to biotech and energy-related convertibles. This served us well in the second quarter against a background of rising government bond yields and volatile equity markets. We turned our attention to Asia, finding more value there than in the US, buying convertibles trading close to their bond floors with moderate deltas. We continue to have meaningful exposure to Japan given the more shareholder-friendly behaviour of Japanese corporates and we have benefitted from this, particularly in the earlier part of the year. Investors enjoy prospects of technical support arising from the increase in allocations to equity by domestic institutional investors and we take the view that Japan’s banking sector will continue to rise.
Equities suffered a generalised fall at the end of the summer, affecting both emerging and developed markets. The zenith was Monday 24th August when activity in US equity markets was such that the VIX index could not be published for the first thirty minutes of the day. A significant proportion of the volume and price moves that day were due to quantitative and hedging2 strategies as well as ETF (exchange-traded fund) trading. Overall, the fund benefited from our cautious view and low exposure to the US in August.
the jupiter global fund
Jupiter Global Convertibles
■ jupiter global Convertibles Review of Portfolio as at 30 September 2015
performance
naV 30 September 2015 30 September 2014 /launch date % Change
Class D EUR Acc (1) €10.25 €10.00 2.50
Class D GBP A Inc HSC £10.06 £9.82 3.36 +
Class I CHF Acc HSC CHF 11.90 CHF 11.62 2.41
Class I EUR Acc €12.32 €11.95 3.10
Class I GBP A Inc HSC £11.51 £11.24 3.27 +
Class I USD Acc HSC $12.21 $11.83 3.21
Class L CHF Acc HSC CHF 11.42 CHF 11.24 1.60
Class L EUR Acc €11.83 €11.56 2.34
Class L GBP A Inc HSC £11.37 £11.11 2.58 +
Class L USD Acc HSC $11.72 $11.44 2.45+Performance takes into consideration dividend distributions during the period/year.(1) Launch date 17 December 2014.
99
outlookSince 2009, investors have generally been rewarded for investing on the assumption that central banks will back stop them. However, going forward we believe investors should expect a more challenging environment. Our concern is that a prolonged build up of debt within the system has contributed to uncertainty about the capacity to cope with any future disturbances. China’s disruption of markets by a surprise devaluation of the yuan in August alongside potentially destabilising withdrawals of Western capital from emerging markets, concerns about currency volatility and slowing growth across the region led us to adopt a more cautious positioning.
We believe we can find more value in Asian convertible bonds than in the US. In view of the more shareholder-friendly behaviour of Japanese corporations and the continued favouring of Japanese shares by domestic institutional investors we continue to have a meaningful exposure to that country. Convertible bonds have tended to move more in line with equities than with bonds. Relative to the currently exceptional low government bond yields, we think that equities offer good value. However for now we are keeping the fund’s equity-sensitivity near the low end of our range in anticipation of further emerging market weaknesses transmitting to developed markets.
Miles geldard and lee Manzifund Managers
30 September 2015
1 Delta is the measure of the sensitivity of the convertible price to the underlying share price.
2 Hedging: a form of short-term insurance. E.g. if an investor expects a share to rise over the long-term yet thinks it is prone to a possible short-term fall, the investor can, for a cost, be partner to an option contract that mitigates some of this potential downside risk. The VIX index reflects many such option contracts in the S&P 500 index; heavy trading of these options made it temporarily difficult to price the VIX index.
the jupiter global fund
Jupiter Global Convertibles
■ jupiter global Convertibles Review of Portfolio as at 30 September 2015 (continued)
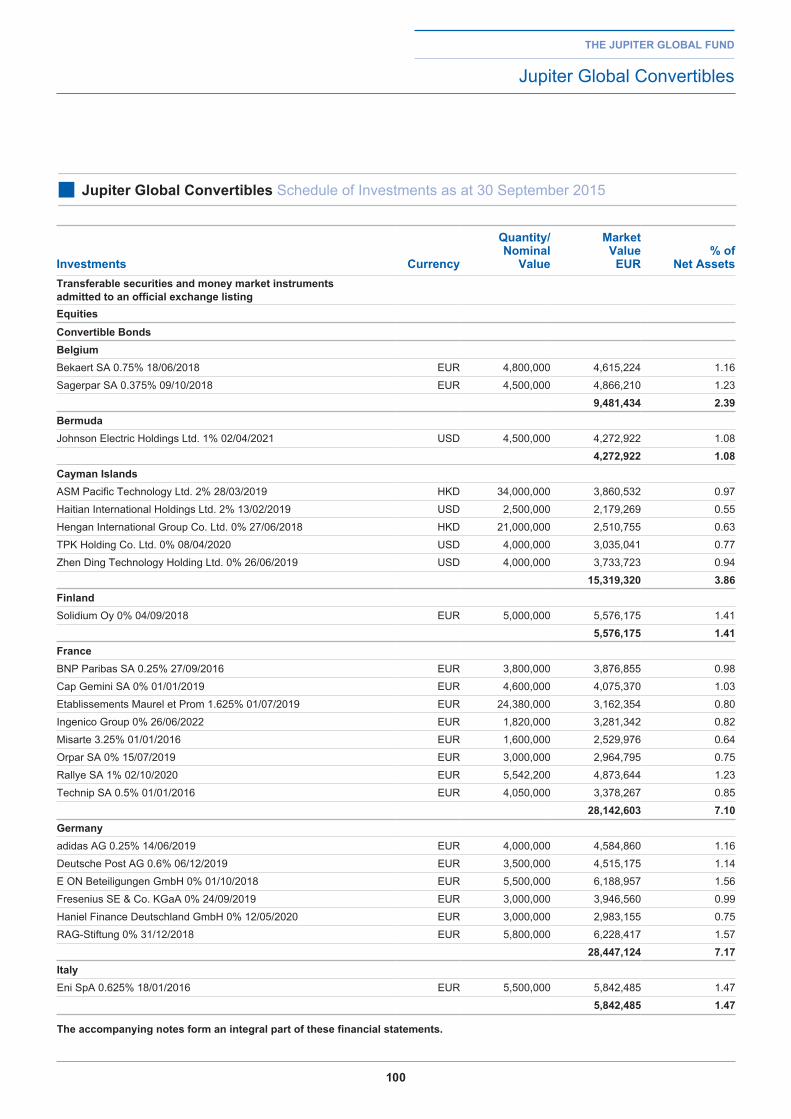
100
the jupiter global fund
Jupiter Global Convertibles
■ jupiter global Convertibles Schedule of Investments as at 30 September 2015
investments Currency
Quantity/ nominal
Value
Market Value
eur% of
net assetstransferable securities and money market instruments admitted to an official exchange listingequitiesConvertible bondsbelgiumBekaert SA 0.75% 18/06/2018 EUR 4,800,000 4,615,224 1.16
Sagerpar SA 0.375% 09/10/2018 EUR 4,500,000 4,866,210 1.23
9,481,434 2.39bermudaJohnson Electric Holdings Ltd. 1% 02/04/2021 USD 4,500,000 4,272,922 1.08
4,272,922 1.08Cayman islandsASM Pacific Technology Ltd. 2% 28/03/2019 HKD 34,000,000 3,860,532 0.97
Haitian International Holdings Ltd. 2% 13/02/2019 USD 2,500,000 2,179,269 0.55
Hengan International Group Co. Ltd. 0% 27/06/2018 HKD 21,000,000 2,510,755 0.63
TPK Holding Co. Ltd. 0% 08/04/2020 USD 4,000,000 3,035,041 0.77
Zhen Ding Technology Holding Ltd. 0% 26/06/2019 USD 4,000,000 3,733,723 0.94
15,319,320 3.86finlandSolidium Oy 0% 04/09/2018 EUR 5,000,000 5,576,175 1.41
5,576,175 1.41franceBNP Paribas SA 0.25% 27/09/2016 EUR 3,800,000 3,876,855 0.98
Cap Gemini SA 0% 01/01/2019 EUR 4,600,000 4,075,370 1.03
Etablissements Maurel et Prom 1.625% 01/07/2019 EUR 24,380,000 3,162,354 0.80
Ingenico Group 0% 26/06/2022 EUR 1,820,000 3,281,342 0.82
Misarte 3.25% 01/01/2016 EUR 1,600,000 2,529,976 0.64
Orpar SA 0% 15/07/2019 EUR 3,000,000 2,964,795 0.75
Rallye SA 1% 02/10/2020 EUR 5,542,200 4,873,644 1.23
Technip SA 0.5% 01/01/2016 EUR 4,050,000 3,378,267 0.85
28,142,603 7.10germanyadidas AG 0.25% 14/06/2019 EUR 4,000,000 4,584,860 1.16
Deutsche Post AG 0.6% 06/12/2019 EUR 3,500,000 4,515,175 1.14
E ON Beteiligungen GmbH 0% 01/10/2018 EUR 5,500,000 6,188,957 1.56
Fresenius SE & Co. KGaA 0% 24/09/2019 EUR 3,000,000 3,946,560 0.99
Haniel Finance Deutschland GmbH 0% 12/05/2020 EUR 3,000,000 2,983,155 0.75
RAG-Stiftung 0% 31/12/2018 EUR 5,800,000 6,228,417 1.57
28,447,124 7.17italyEni SpA 0.625% 18/01/2016 EUR 5,500,000 5,842,485 1.47
5,842,485 1.47
the accompanying notes form an integral part of these financial statements.
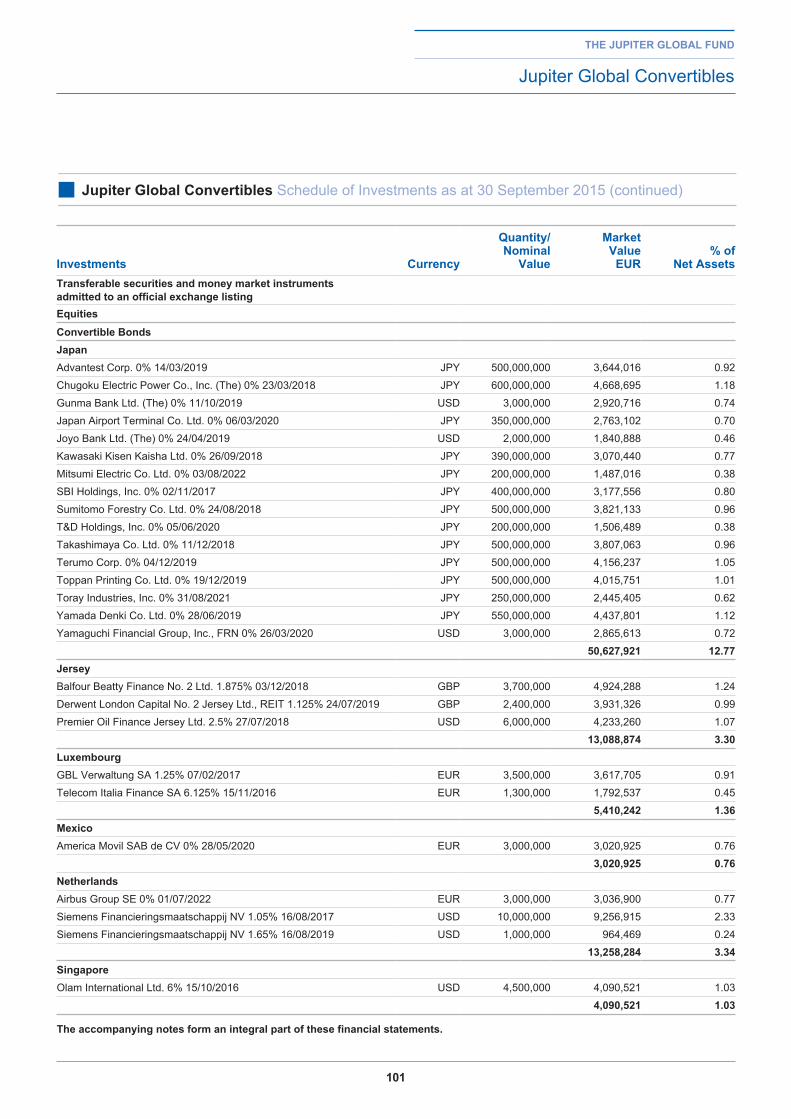
101
the jupiter global fund
Jupiter Global Convertibles
■ jupiter global Convertibles Schedule of Investments as at 30 September 2015 (continued)
investments Currency
Quantity/ nominal
Value
Market Value
eur% of
net assetstransferable securities and money market instruments admitted to an official exchange listingequitiesConvertible bondsjapanAdvantest Corp. 0% 14/03/2019 JPY 500,000,000 3,644,016 0.92
Chugoku Electric Power Co., Inc. (The) 0% 23/03/2018 JPY 600,000,000 4,668,695 1.18
Gunma Bank Ltd. (The) 0% 11/10/2019 USD 3,000,000 2,920,716 0.74
Japan Airport Terminal Co. Ltd. 0% 06/03/2020 JPY 350,000,000 2,763,102 0.70
Joyo Bank Ltd. (The) 0% 24/04/2019 USD 2,000,000 1,840,888 0.46
Kawasaki Kisen Kaisha Ltd. 0% 26/09/2018 JPY 390,000,000 3,070,440 0.77
Mitsumi Electric Co. Ltd. 0% 03/08/2022 JPY 200,000,000 1,487,016 0.38
SBI Holdings, Inc. 0% 02/11/2017 JPY 400,000,000 3,177,556 0.80
Sumitomo Forestry Co. Ltd. 0% 24/08/2018 JPY 500,000,000 3,821,133 0.96
T&D Holdings, Inc. 0% 05/06/2020 JPY 200,000,000 1,506,489 0.38
Takashimaya Co. Ltd. 0% 11/12/2018 JPY 500,000,000 3,807,063 0.96
Terumo Corp. 0% 04/12/2019 JPY 500,000,000 4,156,237 1.05
Toppan Printing Co. Ltd. 0% 19/12/2019 JPY 500,000,000 4,015,751 1.01
Toray Industries, Inc. 0% 31/08/2021 JPY 250,000,000 2,445,405 0.62
Yamada Denki Co. Ltd. 0% 28/06/2019 JPY 550,000,000 4,437,801 1.12
Yamaguchi Financial Group, Inc., FRN 0% 26/03/2020 USD 3,000,000 2,865,613 0.72
50,627,921 12.77jerseyBalfour Beatty Finance No. 2 Ltd. 1.875% 03/12/2018 GBP 3,700,000 4,924,288 1.24
Derwent London Capital No. 2 Jersey Ltd., REIT 1.125% 24/07/2019 GBP 2,400,000 3,931,326 0.99
Premier Oil Finance Jersey Ltd. 2.5% 27/07/2018 USD 6,000,000 4,233,260 1.07
13,088,874 3.30luxembourgGBL Verwaltung SA 1.25% 07/02/2017 EUR 3,500,000 3,617,705 0.91
Telecom Italia Finance SA 6.125% 15/11/2016 EUR 1,300,000 1,792,537 0.45
5,410,242 1.36MexicoAmerica Movil SAB de CV 0% 28/05/2020 EUR 3,000,000 3,020,925 0.76
3,020,925 0.76netherlandsAirbus Group SE 0% 01/07/2022 EUR 3,000,000 3,036,900 0.77
Siemens Financieringsmaatschappij NV 1.05% 16/08/2017 USD 10,000,000 9,256,915 2.33
Siemens Financieringsmaatschappij NV 1.65% 16/08/2019 USD 1,000,000 964,469 0.24
13,258,284 3.34SingaporeOlam International Ltd. 6% 15/10/2016 USD 4,500,000 4,090,521 1.03
4,090,521 1.03
the accompanying notes form an integral part of these financial statements.
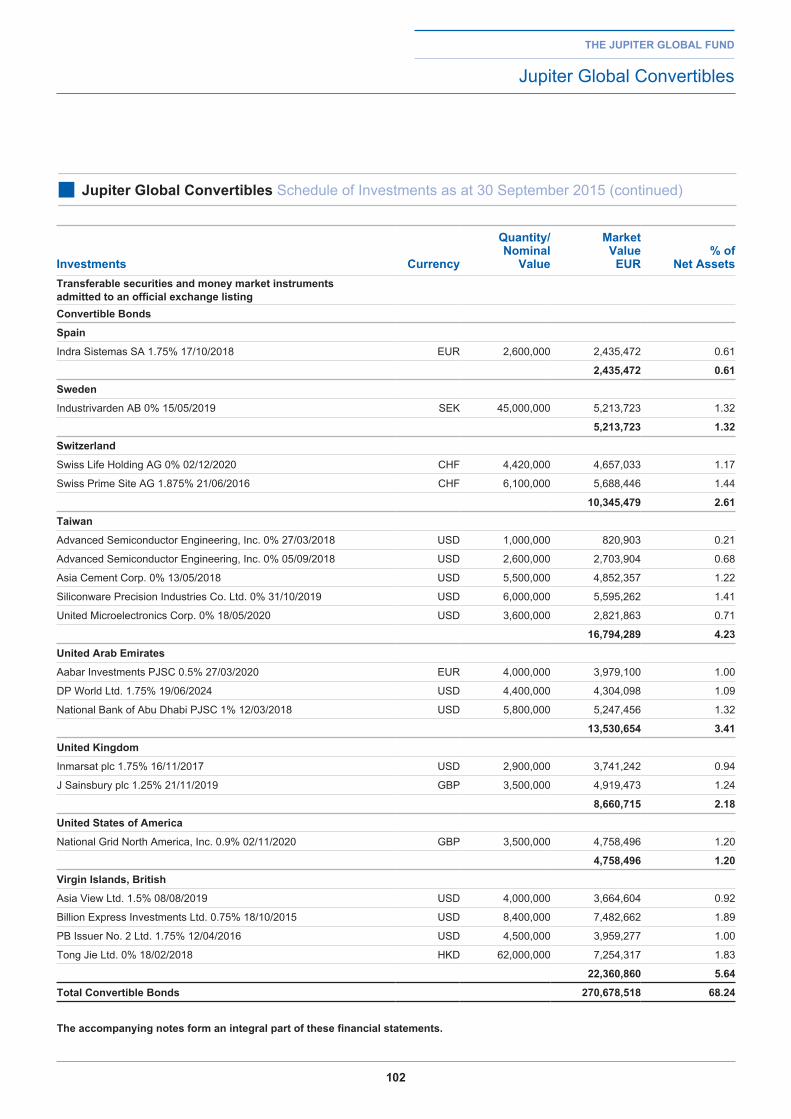
102
the jupiter global fund
Jupiter Global Convertibles
■ jupiter global Convertibles Schedule of Investments as at 30 September 2015 (continued)
investments Currency
Quantity/ nominal
Value
Market Value
eur% of
net assetstransferable securities and money market instruments admitted to an official exchange listingConvertible bonds
Spain
Indra Sistemas SA 1.75% 17/10/2018 EUR 2,600,000 2,435,472 0.61
2,435,472 0.61
Sweden
Industrivarden AB 0% 15/05/2019 SEK 45,000,000 5,213,723 1.32
5,213,723 1.32
Switzerland
Swiss Life Holding AG 0% 02/12/2020 CHF 4,420,000 4,657,033 1.17
Swiss Prime Site AG 1.875% 21/06/2016 CHF 6,100,000 5,688,446 1.44
10,345,479 2.61
taiwan
Advanced Semiconductor Engineering, Inc. 0% 27/03/2018 USD 1,000,000 820,903 0.21
Advanced Semiconductor Engineering, Inc. 0% 05/09/2018 USD 2,600,000 2,703,904 0.68
Asia Cement Corp. 0% 13/05/2018 USD 5,500,000 4,852,357 1.22
Siliconware Precision Industries Co. Ltd. 0% 31/10/2019 USD 6,000,000 5,595,262 1.41
United Microelectronics Corp. 0% 18/05/2020 USD 3,600,000 2,821,863 0.71
16,794,289 4.23
united arab emirates
Aabar Investments PJSC 0.5% 27/03/2020 EUR 4,000,000 3,979,100 1.00
DP World Ltd. 1.75% 19/06/2024 USD 4,400,000 4,304,098 1.09
National Bank of Abu Dhabi PJSC 1% 12/03/2018 USD 5,800,000 5,247,456 1.32
13,530,654 3.41
united Kingdom
Inmarsat plc 1.75% 16/11/2017 USD 2,900,000 3,741,242 0.94
J Sainsbury plc 1.25% 21/11/2019 GBP 3,500,000 4,919,473 1.24
8,660,715 2.18
united States of america
National Grid North America, Inc. 0.9% 02/11/2020 GBP 3,500,000 4,758,496 1.20
4,758,496 1.20
Virgin islands, british
Asia View Ltd. 1.5% 08/08/2019 USD 4,000,000 3,664,604 0.92
Billion Express Investments Ltd. 0.75% 18/10/2015 USD 8,400,000 7,482,662 1.89
PB Issuer No. 2 Ltd. 1.75% 12/04/2016 USD 4,500,000 3,959,277 1.00
Tong Jie Ltd. 0% 18/02/2018 HKD 62,000,000 7,254,317 1.83
22,360,860 5.64
total Convertible bonds 270,678,518 68.24
the accompanying notes form an integral part of these financial statements.
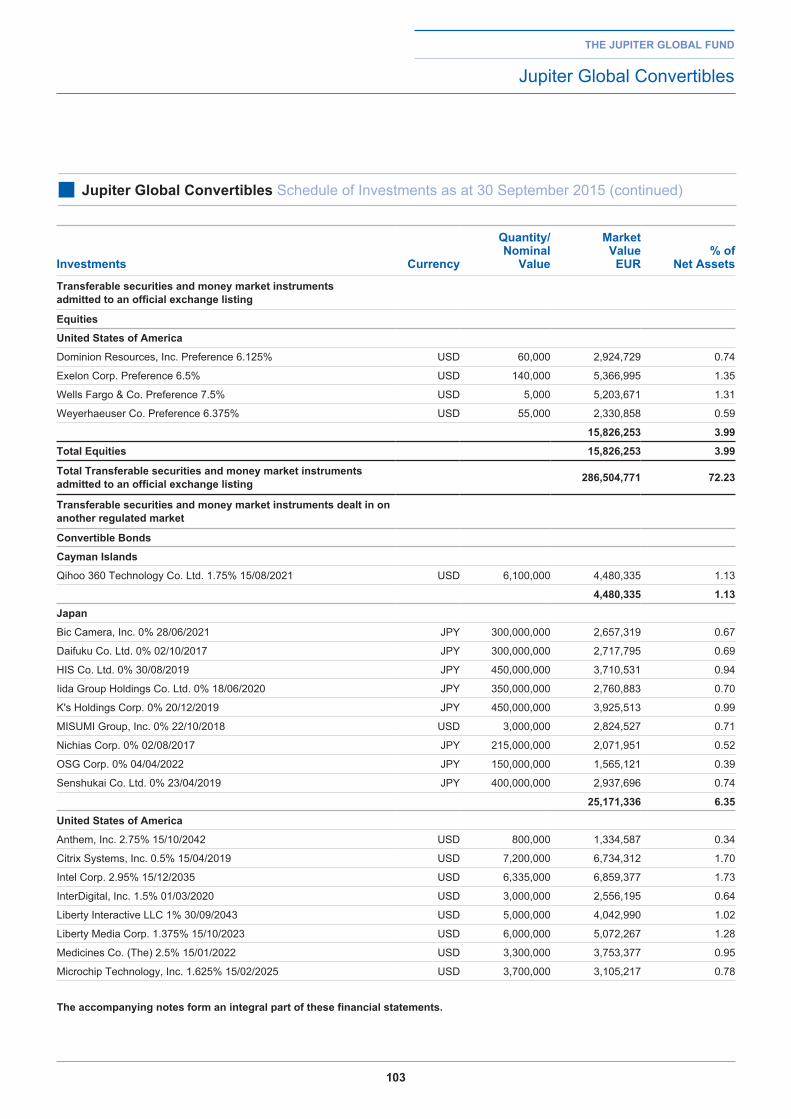
103
the jupiter global fund
Jupiter Global Convertibles
■ jupiter global Convertibles Schedule of Investments as at 30 September 2015 (continued)
investments Currency
Quantity/ nominal
Value
Market Value
eur% of
net assets
transferable securities and money market instruments admitted to an official exchange listing
equities
united States of america
Dominion Resources, Inc. Preference 6.125% USD 60,000 2,924,729 0.74
Exelon Corp. Preference 6.5% USD 140,000 5,366,995 1.35
Wells Fargo & Co. Preference 7.5% USD 5,000 5,203,671 1.31
Weyerhaeuser Co. Preference 6.375% USD 55,000 2,330,858 0.59
15,826,253 3.99
total equities 15,826,253 3.99
total transferable securities and money market instruments admitted to an official exchange listing 286,504,771 72.23
transferable securities and money market instruments dealt in on another regulated market
Convertible bonds
Cayman islands
Qihoo 360 Technology Co. Ltd. 1.75% 15/08/2021 USD 6,100,000 4,480,335 1.13
4,480,335 1.13
japan
Bic Camera, Inc. 0% 28/06/2021 JPY 300,000,000 2,657,319 0.67
Daifuku Co. Ltd. 0% 02/10/2017 JPY 300,000,000 2,717,795 0.69
HIS Co. Ltd. 0% 30/08/2019 JPY 450,000,000 3,710,531 0.94
Iida Group Holdings Co. Ltd. 0% 18/06/2020 JPY 350,000,000 2,760,883 0.70
K's Holdings Corp. 0% 20/12/2019 JPY 450,000,000 3,925,513 0.99
MISUMI Group, Inc. 0% 22/10/2018 USD 3,000,000 2,824,527 0.71
Nichias Corp. 0% 02/08/2017 JPY 215,000,000 2,071,951 0.52
OSG Corp. 0% 04/04/2022 JPY 150,000,000 1,565,121 0.39
Senshukai Co. Ltd. 0% 23/04/2019 JPY 400,000,000 2,937,696 0.74
25,171,336 6.35
united States of america
Anthem, Inc. 2.75% 15/10/2042 USD 800,000 1,334,587 0.34
Citrix Systems, Inc. 0.5% 15/04/2019 USD 7,200,000 6,734,312 1.70
Intel Corp. 2.95% 15/12/2035 USD 6,335,000 6,859,377 1.73
InterDigital, Inc. 1.5% 01/03/2020 USD 3,000,000 2,556,195 0.64
Liberty Interactive LLC 1% 30/09/2043 USD 5,000,000 4,042,990 1.02
Liberty Media Corp. 1.375% 15/10/2023 USD 6,000,000 5,072,267 1.28
Medicines Co. (The) 2.5% 15/01/2022 USD 3,300,000 3,753,377 0.95
Microchip Technology, Inc. 1.625% 15/02/2025 USD 3,700,000 3,105,217 0.78
the accompanying notes form an integral part of these financial statements.
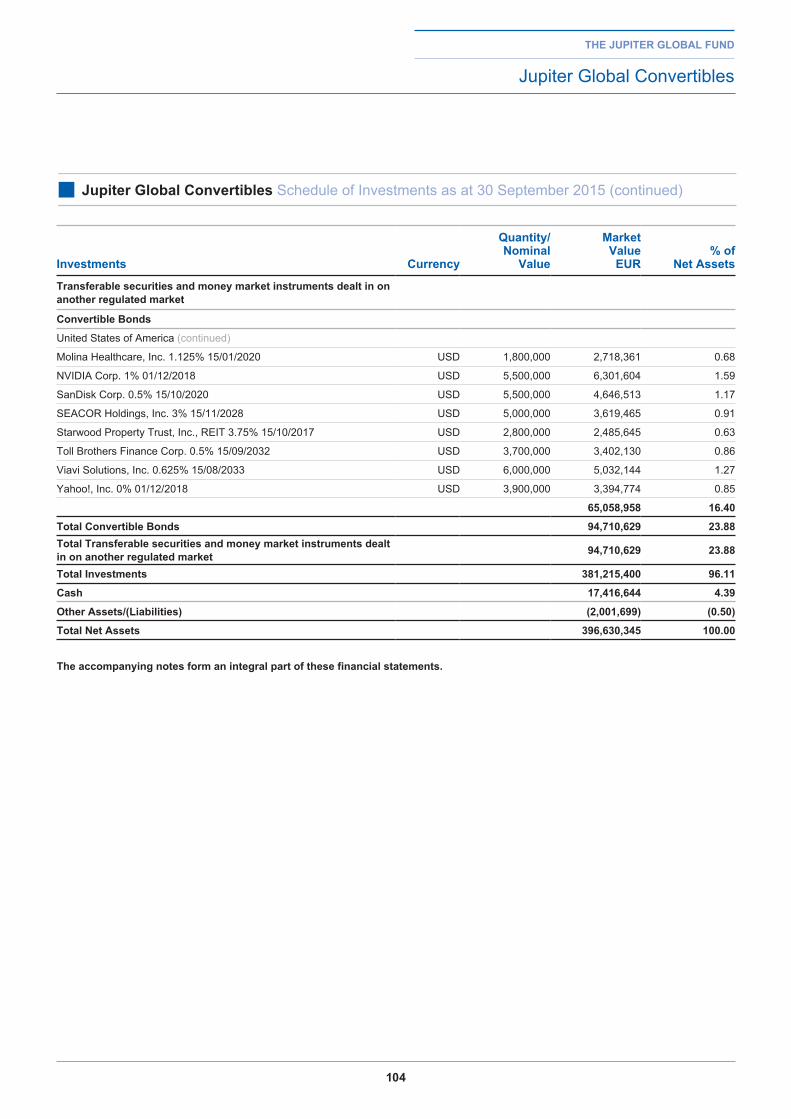
104
the jupiter global fund
Jupiter Global Convertibles
■ jupiter global Convertibles Schedule of Investments as at 30 September 2015 (continued)
investments Currency
Quantity/ nominal
Value
Market Value
eur% of
net assets
transferable securities and money market instruments dealt in on another regulated market
Convertible bonds
United States of America (continued)
Molina Healthcare, Inc. 1.125% 15/01/2020 USD 1,800,000 2,718,361 0.68
NVIDIA Corp. 1% 01/12/2018 USD 5,500,000 6,301,604 1.59
SanDisk Corp. 0.5% 15/10/2020 USD 5,500,000 4,646,513 1.17
SEACOR Holdings, Inc. 3% 15/11/2028 USD 5,000,000 3,619,465 0.91
Starwood Property Trust, Inc., REIT 3.75% 15/10/2017 USD 2,800,000 2,485,645 0.63
Toll Brothers Finance Corp. 0.5% 15/09/2032 USD 3,700,000 3,402,130 0.86
Viavi Solutions, Inc. 0.625% 15/08/2033 USD 6,000,000 5,032,144 1.27
Yahoo!, Inc. 0% 01/12/2018 USD 3,900,000 3,394,774 0.85
65,058,958 16.40
total Convertible bonds 94,710,629 23.88total transferable securities and money market instruments dealt in on another regulated market 94,710,629 23.88
total investments 381,215,400 96.11
Cash 17,416,644 4.39
other assets/(liabilities) (2,001,699) (0.50)
total net assets 396,630,345 100.00
the accompanying notes form an integral part of these financial statements.
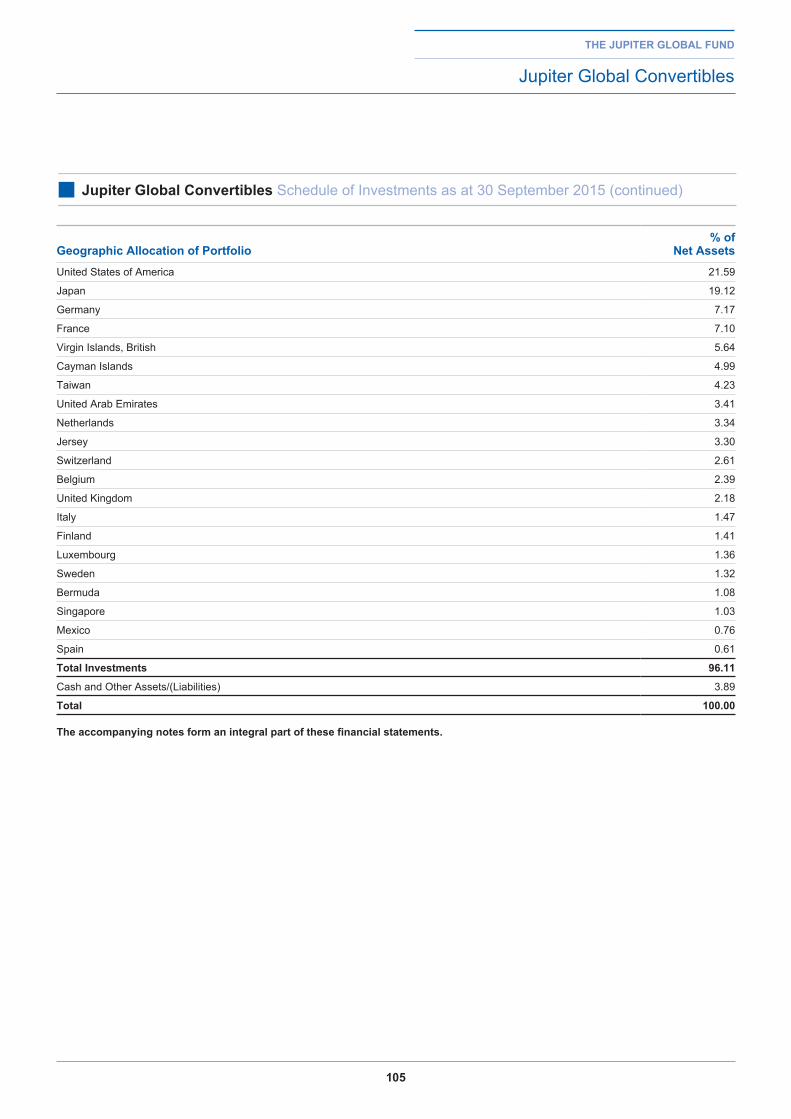
105
the jupiter global fund
Jupiter Global Convertibles
■ jupiter global Convertibles Schedule of Investments as at 30 September 2015 (continued)
geographic allocation of portfolio% of
net assetsUnited States of America 21.59
Japan 19.12
Germany 7.17
France 7.10
Virgin Islands, British 5.64
Cayman Islands 4.99
Taiwan 4.23
United Arab Emirates 3.41
Netherlands 3.34
Jersey 3.30
Switzerland 2.61
Belgium 2.39
United Kingdom 2.18
Italy 1.47
Finland 1.41
Luxembourg 1.36
Sweden 1.32
Bermuda 1.08
Singapore 1.03
Mexico 0.76
Spain 0.61
total investments 96.11
Cash and Other Assets/(Liabilities) 3.89
total 100.00
the accompanying notes form an integral part of these financial statements.
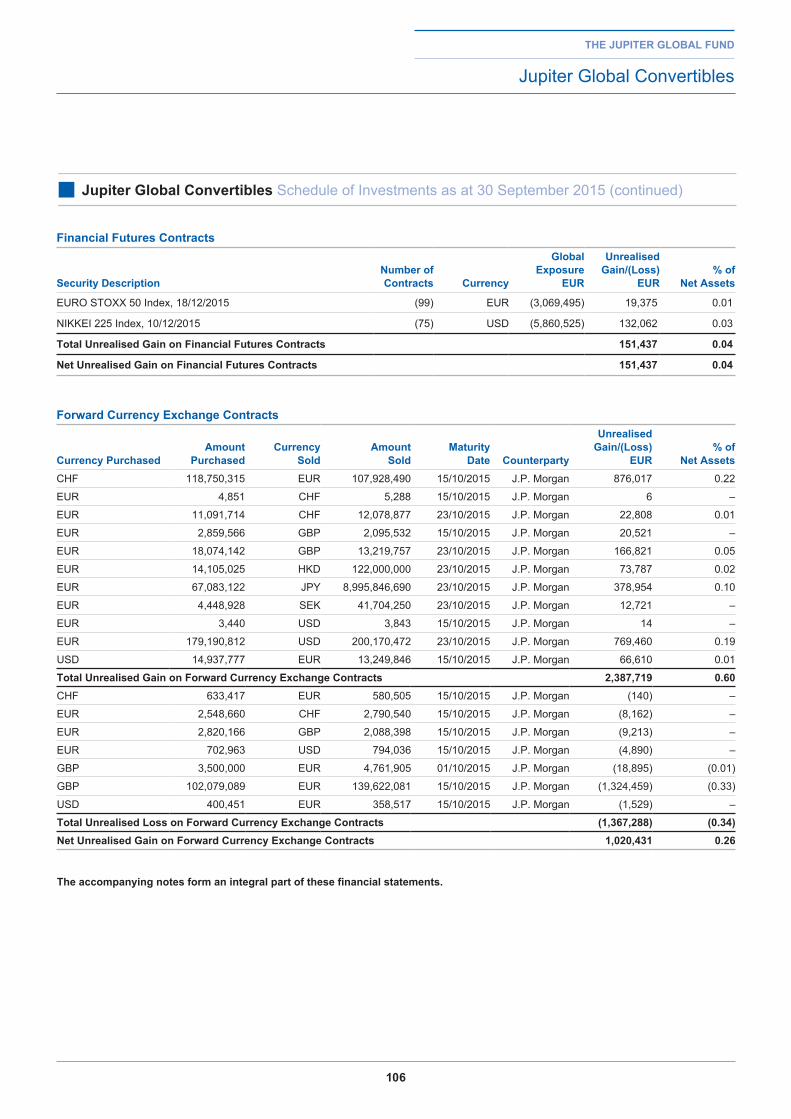
106
the jupiter global fund
Jupiter Global Convertibles
■ jupiter global Convertibles Schedule of Investments as at 30 September 2015 (continued)
financial futures Contracts
Security descriptionnumber of Contracts Currency
global exposure
eur
unrealised gain/(loss)
eur% of
net assets
EURO STOXX 50 Index, 18/12/2015 (99) EUR (3,069,495) 19,375 0.01
NIKKEI 225 Index, 10/12/2015 (75) USD (5,860,525) 132,062 0.03
total unrealised gain on financial futures Contracts 151,437 0.04
net unrealised gain on financial futures Contracts 151,437 0.04
forward Currency exchange Contracts
Currency purchasedamount
purchasedCurrency
Soldamount
SoldMaturity
date Counterparty
unrealised gain/(loss)
eur% of
net assetsCHF 118,750,315 EUR 107,928,490 15/10/2015 J.P. Morgan 876,017 0.22
EUR 4,851 CHF 5,288 15/10/2015 J.P. Morgan 6 –
EUR 11,091,714 CHF 12,078,877 23/10/2015 J.P. Morgan 22,808 0.01
EUR 2,859,566 GBP 2,095,532 15/10/2015 J.P. Morgan 20,521 –
EUR 18,074,142 GBP 13,219,757 23/10/2015 J.P. Morgan 166,821 0.05
EUR 14,105,025 HKD 122,000,000 23/10/2015 J.P. Morgan 73,787 0.02
EUR 67,083,122 JPY 8,995,846,690 23/10/2015 J.P. Morgan 378,954 0.10
EUR 4,448,928 SEK 41,704,250 23/10/2015 J.P. Morgan 12,721 –
EUR 3,440 USD 3,843 15/10/2015 J.P. Morgan 14 –
EUR 179,190,812 USD 200,170,472 23/10/2015 J.P. Morgan 769,460 0.19
USD 14,937,777 EUR 13,249,846 15/10/2015 J.P. Morgan 66,610 0.01
total unrealised gain on forward Currency exchange Contracts 2,387,719 0.60CHF 633,417 EUR 580,505 15/10/2015 J.P. Morgan (140) –
EUR 2,548,660 CHF 2,790,540 15/10/2015 J.P. Morgan (8,162) –
EUR 2,820,166 GBP 2,088,398 15/10/2015 J.P. Morgan (9,213) –
EUR 702,963 USD 794,036 15/10/2015 J.P. Morgan (4,890) –
GBP 3,500,000 EUR 4,761,905 01/10/2015 J.P. Morgan (18,895) (0.01)
GBP 102,079,089 EUR 139,622,081 15/10/2015 J.P. Morgan (1,324,459) (0.33)
USD 400,451 EUR 358,517 15/10/2015 J.P. Morgan (1,529) –
total unrealised loss on forward Currency exchange Contracts (1,367,288) (0.34)net unrealised gain on forward Currency exchange Contracts 1,020,431 0.26
the accompanying notes form an integral part of these financial statements.
107
Market reviewThe start of the period under review was a volatile one for global equity markets but in general they made solid progress as they headed into 2015, despite nerves over the conclusion of the US quantitative easing (QE) programme. The Bank of Japan took markets by surprise by announcing further monetary stimulus. In terms of economic conditions, the US continued to outshine the rest of the world while deflationary pressures besieged the eurozone, exacerbated by a sharp drop in the oil price. After months of speculation, the European Central Bank announced the launch of a sizeable QE programme in early 2015, marking the start of a period of buoyancy for European equities that has persisted through the course of the year.
Meanwhile the Federal Reserve, which had been expected to raise interest rates at some point in 2015, has been obliged to maintain the status quo thanks to continuing lack of robustness in the US economy (in spite of frothy equity prices). The second quarter of 2015 began well for Europe and the UK, where an unexpected Conservative Party victory in the general election buoyed domestic shares, but this was all fast overshadowed by Greece’s failure to meet the terms of its creditors and its seeming inability to bring the crisis to a point of resolution. Compounding negative sentiment was the sharp downturn in China’s domestic equity market which began in June following a period of unsustainable gains. After a torrid July, the Chinese government opted to devalue the yuan by 4% in early August, a deflationary move which we consider to be generally negative for equities when tied in with the lack of clarity with regard to China’s growth outlook and policy plans.
There was a pull-back in equity markets in the late summer. It is our opinion that markets appear vulnerable to further volatility. Unemployment has ticked down to 5.1% in the US, keeping the pressure on the Fed to normalise interest rates sooner rather than later, a move that – in turn – could dampen global growth.
policy reviewThe fund underperformed its benchmark in the 12 months to September 2015. It is heavily overweight the industrial sector which lagged the market as a result of lacklustre economic growth in both developed and emerging markets. Our natural bias towards mid-cap companies served the fund better, as did our cash position, given the volatility equities have seen in latter months.
The sharp fall in the oil price at the end of last year had a negative impact on our holdings that either provide remediation and pollution management services to the oil sector, or provide substitute products, namely Newalta and Novozymes respectively. Stantec was also a poor performer in the period under review. The company lost ground at the end of the summer due to a one-off severance charge. Although
this has dampened expectations in the short term, we believe longer-term fundamentals remain intact.
Our solar positions were also affected, despite oil not being used in the generation of conventional electric power. Markets were lifted by the launch of QE in the eurozone and our holdings performed strongly in the first quarter. We opened a new position in Boer Power, a Chinese electrical distribution company. The company has good exposure to emerging markets and has a particular focus on industrial energy efficiency which in our view will serve it well as China moves closer to setting a national emissions cap. Boer has since gone on to make good returns for the fund during the period under review.
Stock-wise, Pall Corporation was our top performer. It was boosted by a bid received in the second quarter by life sciences company Danaher. The takeover was completed at the end of August. Cranswick also made solid progress. The company’s acquisition of Benson Park helped lift revenues and left it in a position whereby it could pay down some of its debt.
There was disappointing news from one of our long-term holdings, United Natural Foods, towards the end of the summer. The company announced that it had lost a contract that would account for approximately 5% of its projected sales this year.
investment outlookThe policy backdrop for environmental solutions businesses has improved markedly ahead of the UN Climate Change conference in Paris later this year. Individual country pledges for emission cuts have generally gone further than had been widely expected and estimates suggest these combined could keep the rise in global temperatures to about 3°C. While this is greater than the maximum of 2°C now acknowledged by the UN as required to prevent catastrophic climate change, the draft negotiating agreement proposes that these pledges are reviewed every five years. We believe that this arrangement may put even greater emphasis on the development of disruptive technologies that can compete on price with mainstream counterparts, in turn helping politicians strive for deeper cuts while at the same time potentially opening up new opportunities for the businesses in which we invest. We have also been encouraged in recent weeks by the agreement of the UN Sustainable Development Goals, which will supersede the eight Millennium Development Goals that expire this year. This is comprised of 17 goals which fall under five key categories ‘people, planet, prosperity, peace and partnership’; climate-related issues are a key component of these 15 year goals.
Charlie thomasfund Manager
30 September 2015
the jupiter global fund
Jupiter Global Ecology Growth
■ jupiter global ecology growth Review of Portfolio as at 30 September 2015
performance
naV 30 September 2015 30 September 2014 % ChangeClass D EUR A Inc Dist €10.20 €9.88 3.49+
Class L EUR Acc €12.11 €11.79 2.71Class L EUR A Inc Dist €10.13 €9.88 2.53Class L GBP A Inc £9.76 £10.02 (2.59)Class L USD Acc $8.82 $9.65 (8.60)+Performance takes into consideration dividend distributions during the year.
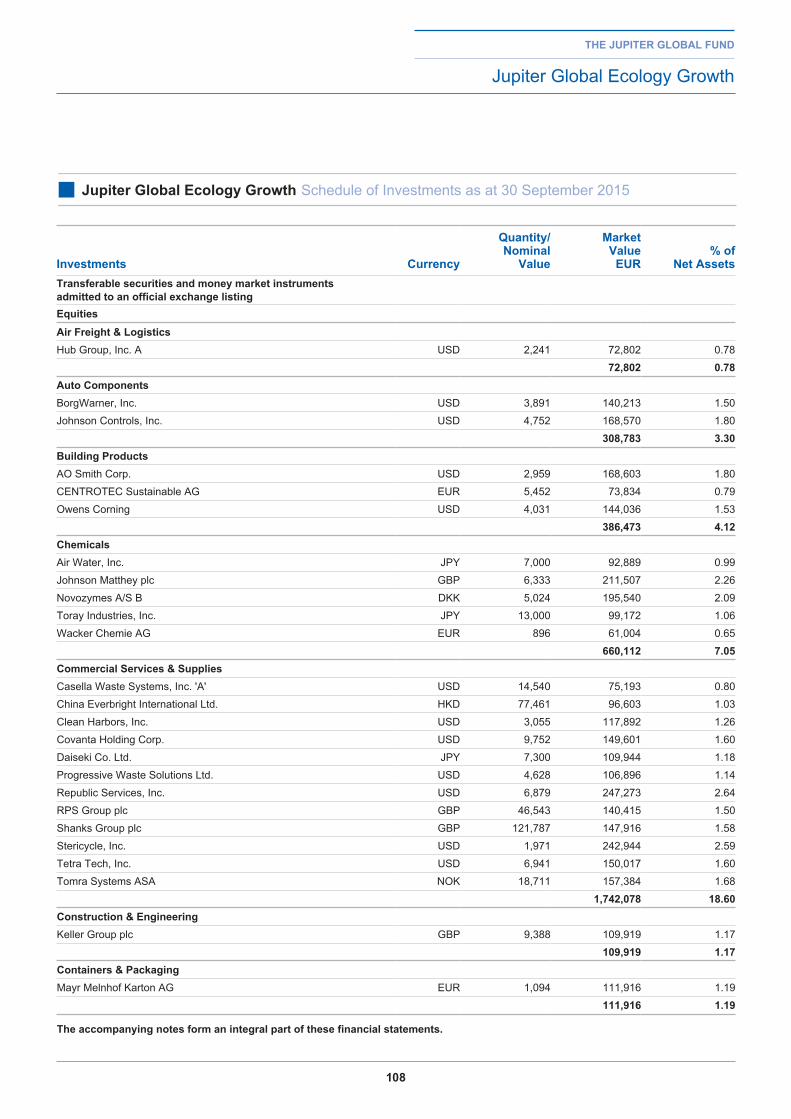
108
the jupiter global fund
Jupiter Global Ecology Growth
■ jupiter global ecology growth Schedule of Investments as at 30 September 2015
investments Currency
Quantity/ nominal
Value
Market Value
eur% of
net assetstransferable securities and money market instruments admitted to an official exchange listingequitiesair freight & logisticsHub Group, Inc. A USD 2,241 72,802 0.78
72,802 0.78auto ComponentsBorgWarner, Inc. USD 3,891 140,213 1.50
Johnson Controls, Inc. USD 4,752 168,570 1.80
308,783 3.30building productsAO Smith Corp. USD 2,959 168,603 1.80
CENTROTEC Sustainable AG EUR 5,452 73,834 0.79
Owens Corning USD 4,031 144,036 1.53
386,473 4.12ChemicalsAir Water, Inc. JPY 7,000 92,889 0.99
Johnson Matthey plc GBP 6,333 211,507 2.26
Novozymes A/S B DKK 5,024 195,540 2.09
Toray Industries, Inc. JPY 13,000 99,172 1.06
Wacker Chemie AG EUR 896 61,004 0.65
660,112 7.05Commercial Services & SuppliesCasella Waste Systems, Inc. 'A' USD 14,540 75,193 0.80
China Everbright International Ltd. HKD 77,461 96,603 1.03
Clean Harbors, Inc. USD 3,055 117,892 1.26
Covanta Holding Corp. USD 9,752 149,601 1.60
Daiseki Co. Ltd. JPY 7,300 109,944 1.18
Progressive Waste Solutions Ltd. USD 4,628 106,896 1.14
Republic Services, Inc. USD 6,879 247,273 2.64
RPS Group plc GBP 46,543 140,415 1.50
Shanks Group plc GBP 121,787 147,916 1.58
Stericycle, Inc. USD 1,971 242,944 2.59
Tetra Tech, Inc. USD 6,941 150,017 1.60
Tomra Systems ASA NOK 18,711 157,384 1.68
1,742,078 18.60Construction & engineeringKeller Group plc GBP 9,388 109,919 1.17
109,919 1.17Containers & packagingMayr Melnhof Karton AG EUR 1,094 111,916 1.19
111,916 1.19
the accompanying notes form an integral part of these financial statements.
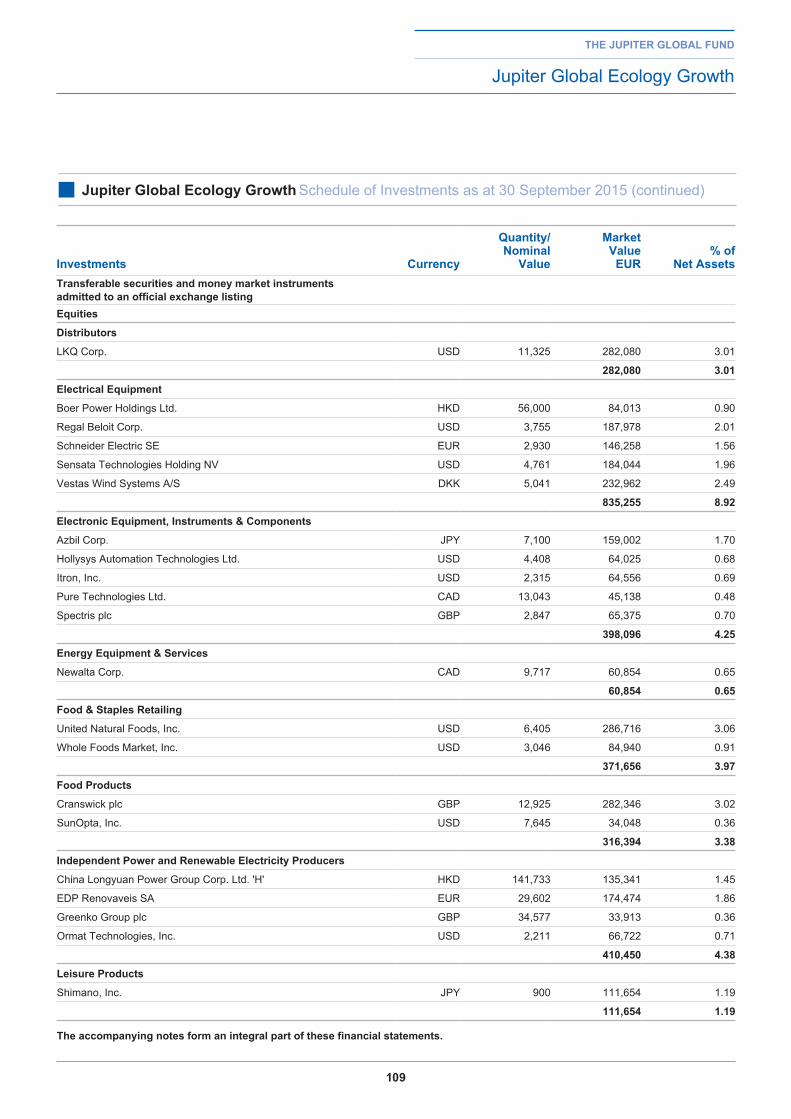
109
the jupiter global fund
Jupiter Global Ecology Growth
■ jupiter global ecology growth Schedule of Investments as at 30 September 2015 (continued)
investments Currency
Quantity/ nominal
Value
Market Value
eur% of
net assetstransferable securities and money market instruments admitted to an official exchange listingequities
distributors
LKQ Corp. USD 11,325 282,080 3.01
282,080 3.01
electrical equipment
Boer Power Holdings Ltd. HKD 56,000 84,013 0.90
Regal Beloit Corp. USD 3,755 187,978 2.01
Schneider Electric SE EUR 2,930 146,258 1.56
Sensata Technologies Holding NV USD 4,761 184,044 1.96
Vestas Wind Systems A/S DKK 5,041 232,962 2.49
835,255 8.92
electronic equipment, instruments & Components
Azbil Corp. JPY 7,100 159,002 1.70
Hollysys Automation Technologies Ltd. USD 4,408 64,025 0.68
Itron, Inc. USD 2,315 64,556 0.69
Pure Technologies Ltd. CAD 13,043 45,138 0.48
Spectris plc GBP 2,847 65,375 0.70
398,096 4.25
energy equipment & Services
Newalta Corp. CAD 9,717 60,854 0.65
60,854 0.65
food & Staples retailing
United Natural Foods, Inc. USD 6,405 286,716 3.06
Whole Foods Market, Inc. USD 3,046 84,940 0.91
371,656 3.97
food products
Cranswick plc GBP 12,925 282,346 3.02
SunOpta, Inc. USD 7,645 34,048 0.36
316,394 3.38
independent power and renewable electricity producers
China Longyuan Power Group Corp. Ltd. 'H' HKD 141,733 135,341 1.45
EDP Renovaveis SA EUR 29,602 174,474 1.86
Greenko Group plc GBP 34,577 33,913 0.36
Ormat Technologies, Inc. USD 2,211 66,722 0.71
410,450 4.38
leisure products
Shimano, Inc. JPY 900 111,654 1.19
111,654 1.19
the accompanying notes form an integral part of these financial statements.
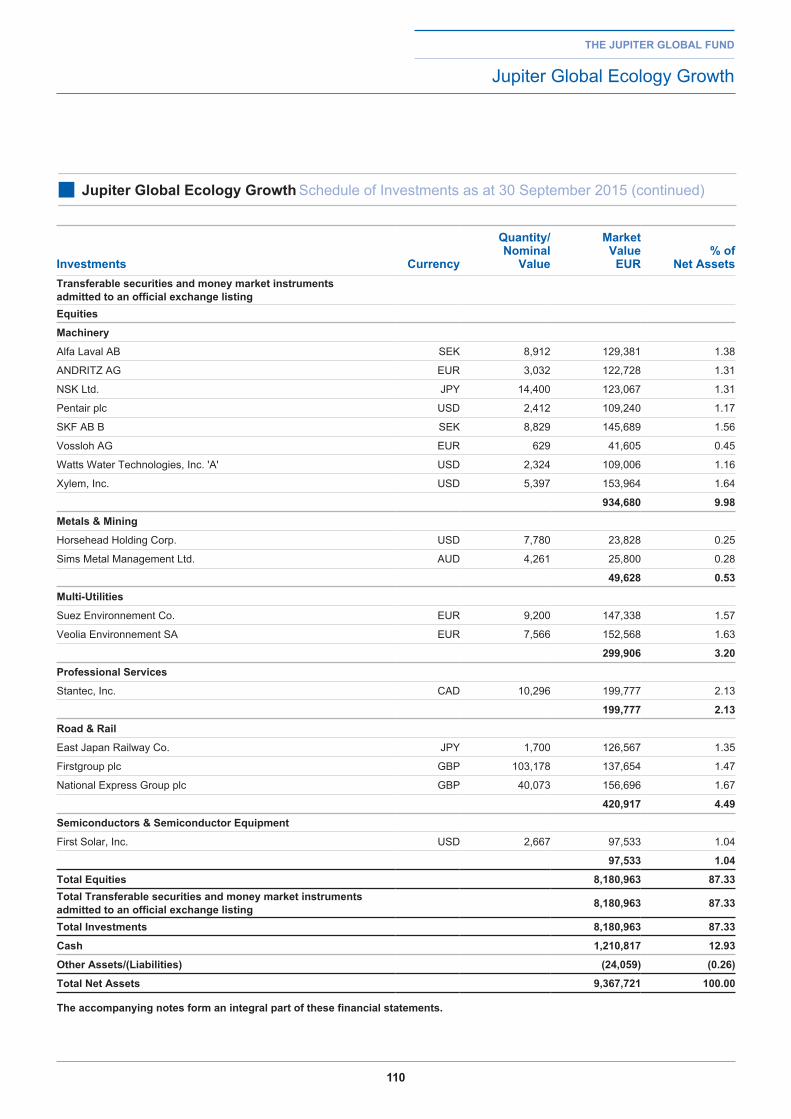
110
the jupiter global fund
Jupiter Global Ecology Growth
■ jupiter global ecology growth Schedule of Investments as at 30 September 2015 (continued)
investments Currency
Quantity/ nominal
Value
Market Value
eur% of
net assetstransferable securities and money market instruments admitted to an official exchange listingequities
Machinery
Alfa Laval AB SEK 8,912 129,381 1.38
ANDRITZ AG EUR 3,032 122,728 1.31
NSK Ltd. JPY 14,400 123,067 1.31
Pentair plc USD 2,412 109,240 1.17
SKF AB B SEK 8,829 145,689 1.56
Vossloh AG EUR 629 41,605 0.45
Watts Water Technologies, Inc. 'A' USD 2,324 109,006 1.16
Xylem, Inc. USD 5,397 153,964 1.64
934,680 9.98
Metals & Mining
Horsehead Holding Corp. USD 7,780 23,828 0.25
Sims Metal Management Ltd. AUD 4,261 25,800 0.28
49,628 0.53
Multi-utilities
Suez Environnement Co. EUR 9,200 147,338 1.57
Veolia Environnement SA EUR 7,566 152,568 1.63
299,906 3.20
professional Services
Stantec, Inc. CAD 10,296 199,777 2.13
199,777 2.13
road & rail
East Japan Railway Co. JPY 1,700 126,567 1.35
Firstgroup plc GBP 103,178 137,654 1.47
National Express Group plc GBP 40,073 156,696 1.67
420,917 4.49
Semiconductors & Semiconductor equipment
First Solar, Inc. USD 2,667 97,533 1.04
97,533 1.04
total equities 8,180,963 87.33total transferable securities and money market instruments admitted to an official exchange listing 8,180,963 87.33
total investments 8,180,963 87.33
Cash 1,210,817 12.93
other assets/(liabilities) (24,059) (0.26)
total net assets 9,367,721 100.00
the accompanying notes form an integral part of these financial statements.
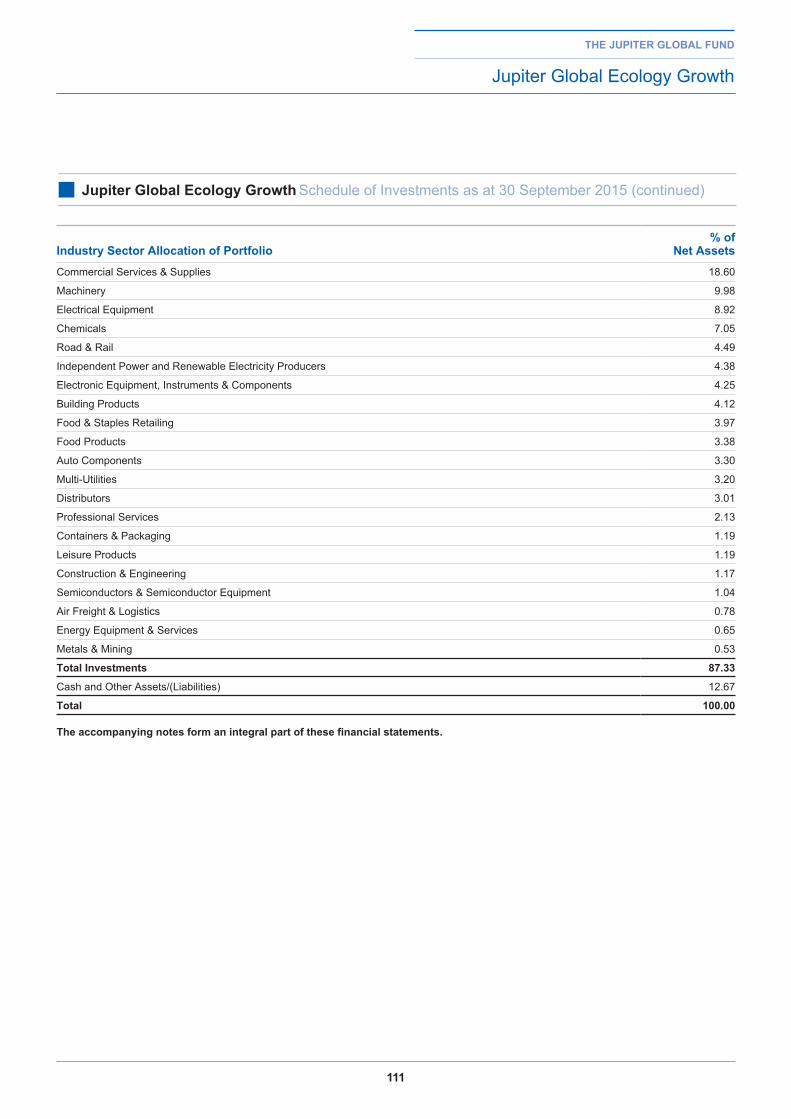
111
the jupiter global fund
Jupiter Global Ecology Growth
■ jupiter global ecology growth Schedule of Investments as at 30 September 2015 (continued)
industry Sector allocation of portfolio% of
net assetsCommercial Services & Supplies 18.60
Machinery 9.98
Electrical Equipment 8.92
Chemicals 7.05
Road & Rail 4.49
Independent Power and Renewable Electricity Producers 4.38
Electronic Equipment, Instruments & Components 4.25
Building Products 4.12
Food & Staples Retailing 3.97
Food Products 3.38
Auto Components 3.30
Multi-Utilities 3.20
Distributors 3.01
Professional Services 2.13
Containers & Packaging 1.19
Leisure Products 1.19
Construction & Engineering 1.17
Semiconductors & Semiconductor Equipment 1.04
Air Freight & Logistics 0.78
Energy Equipment & Services 0.65
Metals & Mining 0.53
total investments 87.33
Cash and Other Assets/(Liabilities) 12.67
total 100.00
the accompanying notes form an integral part of these financial statements.
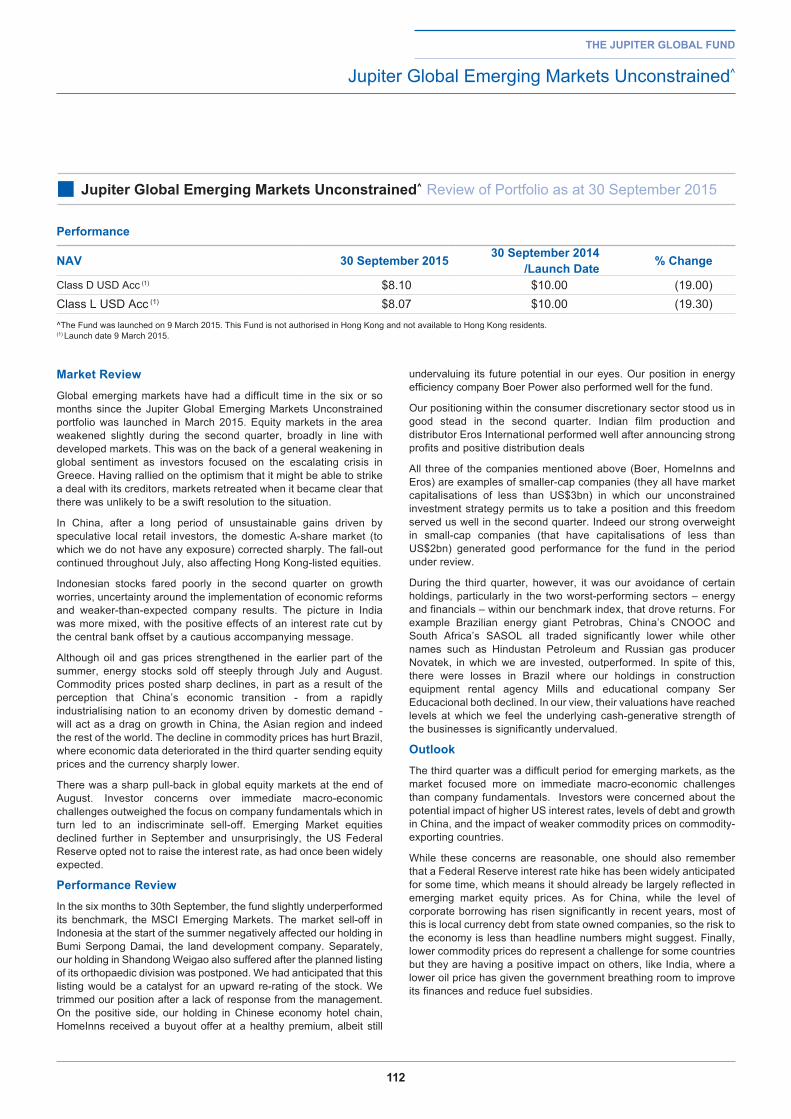
112
Market reviewGlobal emerging markets have had a difficult time in the six or so months since the Jupiter Global Emerging Markets Unconstrained portfolio was launched in March 2015. Equity markets in the area weakened slightly during the second quarter, broadly in line with developed markets. This was on the back of a general weakening in global sentiment as investors focused on the escalating crisis in Greece. Having rallied on the optimism that it might be able to strike a deal with its creditors, markets retreated when it became clear that there was unlikely to be a swift resolution to the situation.
In China, after a long period of unsustainable gains driven by speculative local retail investors, the domestic A-share market (to which we do not have any exposure) corrected sharply. The fall-out continued throughout July, also affecting Hong Kong-listed equities.
Indonesian stocks fared poorly in the second quarter on growth worries, uncertainty around the implementation of economic reforms and weaker-than-expected company results. The picture in India was more mixed, with the positive effects of an interest rate cut by the central bank offset by a cautious accompanying message.
Although oil and gas prices strengthened in the earlier part of the summer, energy stocks sold off steeply through July and August. Commodity prices posted sharp declines, in part as a result of the perception that China’s economic transition - from a rapidly industrialising nation to an economy driven by domestic demand - will act as a drag on growth in China, the Asian region and indeed the rest of the world. The decline in commodity prices has hurt Brazil, where economic data deteriorated in the third quarter sending equity prices and the currency sharply lower.
There was a sharp pull-back in global equity markets at the end of August. Investor concerns over immediate macro-economic challenges outweighed the focus on company fundamentals which in turn led to an indiscriminate sell-off. Emerging Market equities declined further in September and unsurprisingly, the US Federal Reserve opted not to raise the interest rate, as had once been widely expected.
performance reviewIn the six months to 30th September, the fund slightly underperformed its benchmark, the MSCI Emerging Markets. The market sell-off in Indonesia at the start of the summer negatively affected our holding in Bumi Serpong Damai, the land development company. Separately, our holding in Shandong Weigao also suffered after the planned listing of its orthopaedic division was postponed. We had anticipated that this listing would be a catalyst for an upward re-rating of the stock. We trimmed our position after a lack of response from the management. On the positive side, our holding in Chinese economy hotel chain, HomeInns received a buyout offer at a healthy premium, albeit still
undervaluing its future potential in our eyes. Our position in energy efficiency company Boer Power also performed well for the fund.
Our positioning within the consumer discretionary sector stood us in good stead in the second quarter. Indian film production and distributor Eros International performed well after announcing strong profits and positive distribution deals
All three of the companies mentioned above (Boer, HomeInns and Eros) are examples of smaller-cap companies (they all have market capitalisations of less than US$3bn) in which our unconstrained investment strategy permits us to take a position and this freedom served us well in the second quarter. Indeed our strong overweight in small-cap companies (that have capitalisations of less than US$2bn) generated good performance for the fund in the period under review.
During the third quarter, however, it was our avoidance of certain holdings, particularly in the two worst-performing sectors – energy and financials – within our benchmark index, that drove returns. For example Brazilian energy giant Petrobras, China’s CNOOC and South Africa’s SASOL all traded significantly lower while other names such as Hindustan Petroleum and Russian gas producer Novatek, in which we are invested, outperformed. In spite of this, there were losses in Brazil where our holdings in construction equipment rental agency Mills and educational company Ser Educacional both declined. In our view, their valuations have reached levels at which we feel the underlying cash-generative strength of the businesses is significantly undervalued.
outlookThe third quarter was a difficult period for emerging markets, as the market focused more on immediate macro-economic challenges than company fundamentals. Investors were concerned about the potential impact of higher US interest rates, levels of debt and growth in China, and the impact of weaker commodity prices on commodity-exporting countries.
While these concerns are reasonable, one should also remember that a Federal Reserve interest rate hike has been widely anticipated for some time, which means it should already be largely reflected in emerging market equity prices. As for China, while the level of corporate borrowing has risen significantly in recent years, most of this is local currency debt from state owned companies, so the risk to the economy is less than headline numbers might suggest. Finally, lower commodity prices do represent a challenge for some countries but they are having a positive impact on others, like India, where a lower oil price has given the government breathing room to improve its finances and reduce fuel subsidies.
the jupiter global fund
Jupiter Global Emerging Markets Unconstrained^
■ jupiter global emerging Markets unconstrained^ Review of Portfolio as at 30 September 2015
performance
naV 30 September 2015 30 September 2014 /launch date % Change
Class D USD Acc (1) $8.10 $10.00 (19.00)Class L USD Acc (1) $8.07 $10.00 (19.30)
^The Fund was launched on 9 March 2015. This Fund is not authorised in Hong Kong and not available to Hong Kong residents.(1) Launch date 9 March 2015.
113
outlook (continued)
At times like this, when valuations are depressed, strong long term returns are often available to investors willing to look beyond short term headwinds. In many cases, we believe recent declines have created opportunities to add to stocks which we believe have been oversold. We continue to find and invest in a number of businesses that are experiencing positive change that doesn’t appear to be reflected in the share price. And with Emerging Market stocks having lagged developed markets, we also find businesses with potentially better growth prospects than their developed market peers but which are significantly cheaper on standard metrics.
ross teversonfund Manager
30 September 2015
^The Fund was launched on 9 March 2015. This Fund is not authorised in Hong Kong and not available to Hong Kong residents.
the jupiter global fund
Jupiter Global Emerging Markets Unconstrained^
■ jupiter global emerging Markets unconstrained^ Review of Portfolio as at 30 September 2015
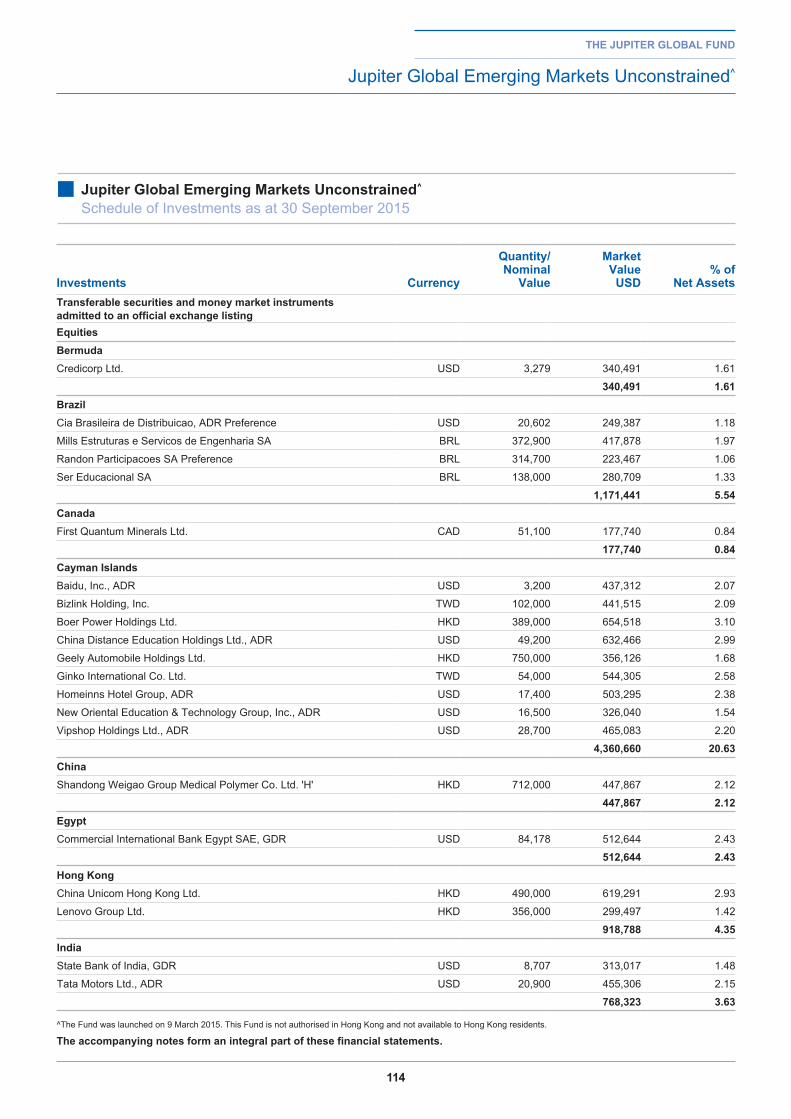
114
the jupiter global fund
Jupiter Global Emerging Markets Unconstrained^
■ jupiter global emerging Markets unconstrained^
Schedule of Investments as at 30 September 2015
investments Currency
Quantity/ nominal
Value
Market Value
uSd% of
net assetstransferable securities and money market instruments admitted to an official exchange listingequitiesbermudaCredicorp Ltd. USD 3,279 340,491 1.61
340,491 1.61brazilCia Brasileira de Distribuicao, ADR Preference USD 20,602 249,387 1.18
Mills Estruturas e Servicos de Engenharia SA BRL 372,900 417,878 1.97
Randon Participacoes SA Preference BRL 314,700 223,467 1.06
Ser Educacional SA BRL 138,000 280,709 1.33
1,171,441 5.54CanadaFirst Quantum Minerals Ltd. CAD 51,100 177,740 0.84
177,740 0.84Cayman islandsBaidu, Inc., ADR USD 3,200 437,312 2.07
Bizlink Holding, Inc. TWD 102,000 441,515 2.09
Boer Power Holdings Ltd. HKD 389,000 654,518 3.10
China Distance Education Holdings Ltd., ADR USD 49,200 632,466 2.99
Geely Automobile Holdings Ltd. HKD 750,000 356,126 1.68
Ginko International Co. Ltd. TWD 54,000 544,305 2.58
Homeinns Hotel Group, ADR USD 17,400 503,295 2.38
New Oriental Education & Technology Group, Inc., ADR USD 16,500 326,040 1.54
Vipshop Holdings Ltd., ADR USD 28,700 465,083 2.20
4,360,660 20.63ChinaShandong Weigao Group Medical Polymer Co. Ltd. 'H' HKD 712,000 447,867 2.12
447,867 2.12egyptCommercial International Bank Egypt SAE, GDR USD 84,178 512,644 2.43
512,644 2.43hong KongChina Unicom Hong Kong Ltd. HKD 490,000 619,291 2.93
Lenovo Group Ltd. HKD 356,000 299,497 1.42
918,788 4.35indiaState Bank of India, GDR USD 8,707 313,017 1.48
Tata Motors Ltd., ADR USD 20,900 455,306 2.15
768,323 3.63
^The Fund was launched on 9 March 2015. This Fund is not authorised in Hong Kong and not available to Hong Kong residents.
the accompanying notes form an integral part of these financial statements.
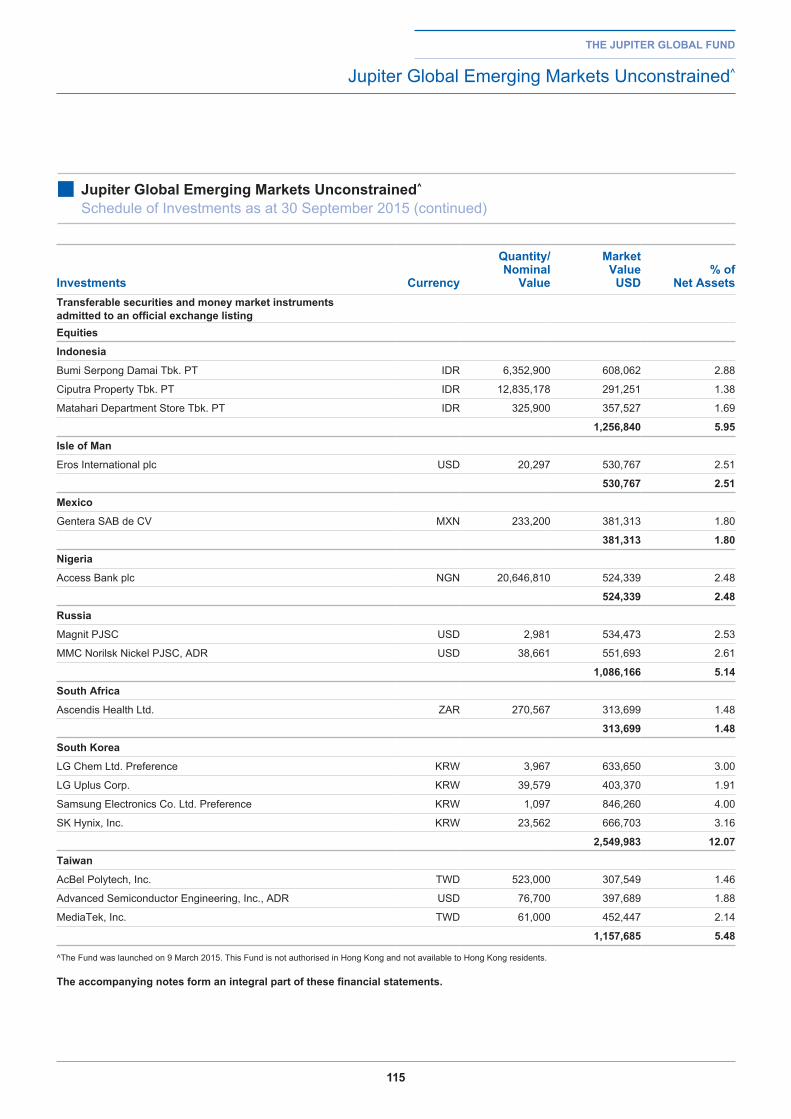
115
the jupiter global fund
Jupiter Global Emerging Markets Unconstrained^
■ jupiter global emerging Markets unconstrained^
Schedule of Investments as at 30 September 2015 (continued)
investments Currency
Quantity/ nominal
Value
Market Value
uSd% of
net assetstransferable securities and money market instruments admitted to an official exchange listingequities
indonesia
Bumi Serpong Damai Tbk. PT IDR 6,352,900 608,062 2.88
Ciputra Property Tbk. PT IDR 12,835,178 291,251 1.38
Matahari Department Store Tbk. PT IDR 325,900 357,527 1.69
1,256,840 5.95
isle of Man
Eros International plc USD 20,297 530,767 2.51
530,767 2.51
Mexico
Gentera SAB de CV MXN 233,200 381,313 1.80
381,313 1.80
nigeria
Access Bank plc NGN 20,646,810 524,339 2.48
524,339 2.48
russia
Magnit PJSC USD 2,981 534,473 2.53
MMC Norilsk Nickel PJSC, ADR USD 38,661 551,693 2.61
1,086,166 5.14
South africa
Ascendis Health Ltd. ZAR 270,567 313,699 1.48
313,699 1.48
South Korea
LG Chem Ltd. Preference KRW 3,967 633,650 3.00
LG Uplus Corp. KRW 39,579 403,370 1.91
Samsung Electronics Co. Ltd. Preference KRW 1,097 846,260 4.00
SK Hynix, Inc. KRW 23,562 666,703 3.16
2,549,983 12.07
taiwan
AcBel Polytech, Inc. TWD 523,000 307,549 1.46
Advanced Semiconductor Engineering, Inc., ADR USD 76,700 397,689 1.88
MediaTek, Inc. TWD 61,000 452,447 2.14
1,157,685 5.48
^The Fund was launched on 9 March 2015. This Fund is not authorised in Hong Kong and not available to Hong Kong residents.
the accompanying notes form an integral part of these financial statements.
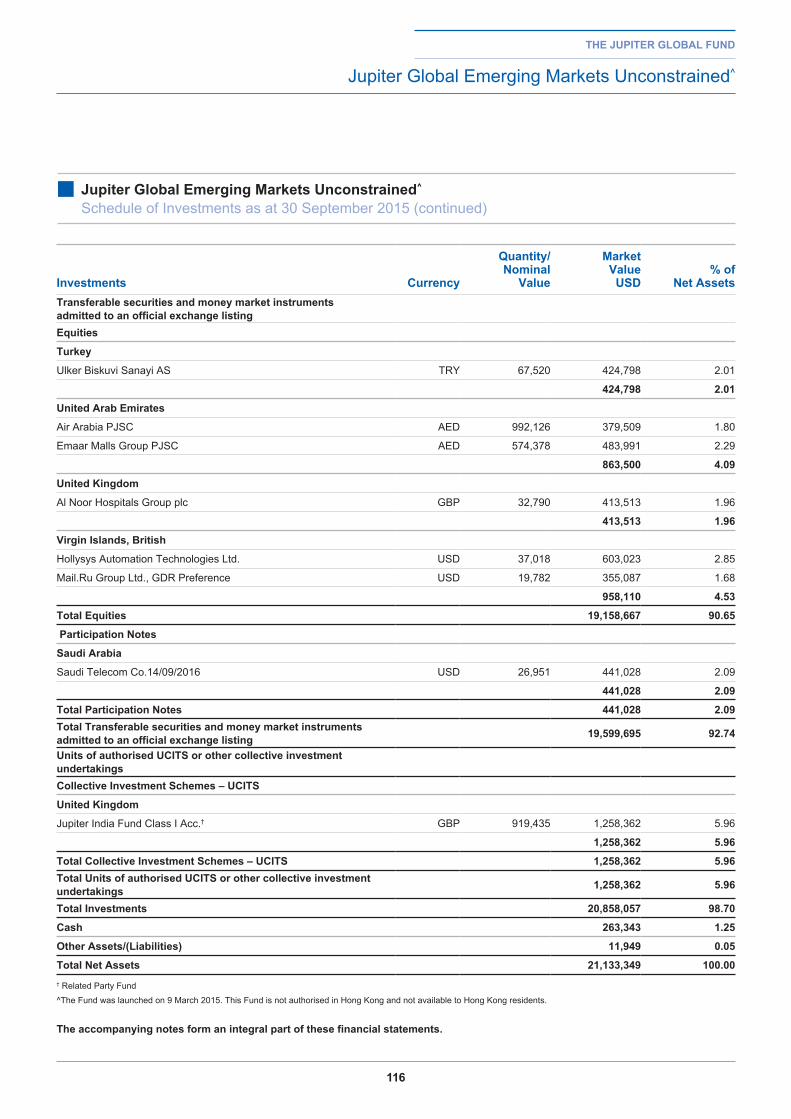
116
the jupiter global fund
Jupiter Global Emerging Markets Unconstrained^
■ jupiter global emerging Markets unconstrained^
Schedule of Investments as at 30 September 2015 (continued)
investments Currency
Quantity/ nominal
Value
Market Value
uSd% of
net assetstransferable securities and money market instruments admitted to an official exchange listingequities
turkey
Ulker Biskuvi Sanayi AS TRY 67,520 424,798 2.01
424,798 2.01
united arab emirates
Air Arabia PJSC AED 992,126 379,509 1.80
Emaar Malls Group PJSC AED 574,378 483,991 2.29
863,500 4.09
united Kingdom
Al Noor Hospitals Group plc GBP 32,790 413,513 1.96
413,513 1.96
Virgin islands, british
Hollysys Automation Technologies Ltd. USD 37,018 603,023 2.85
Mail.Ru Group Ltd., GDR Preference USD 19,782 355,087 1.68
958,110 4.53
total equities 19,158,667 90.65
participation notes
Saudi arabia
Saudi Telecom Co.14/09/2016 USD 26,951 441,028 2.09
441,028 2.09
total participation notes 441,028 2.09total transferable securities and money market instruments admitted to an official exchange listing 19,599,695 92.74
units of authorised uCitS or other collective investment undertakingsCollective investment Schemes – uCitS
united Kingdom
Jupiter India Fund Class I Acc.† GBP 919,435 1,258,362 5.96
1,258,362 5.96
total Collective investment Schemes – uCitS 1,258,362 5.96total units of authorised uCitS or other collective investment undertakings 1,258,362 5.96
total investments 20,858,057 98.70
Cash 263,343 1.25
other assets/(liabilities) 11,949 0.05
total net assets 21,133,349 100.00† Related Party Fund
^The Fund was launched on 9 March 2015. This Fund is not authorised in Hong Kong and not available to Hong Kong residents.
the accompanying notes form an integral part of these financial statements.
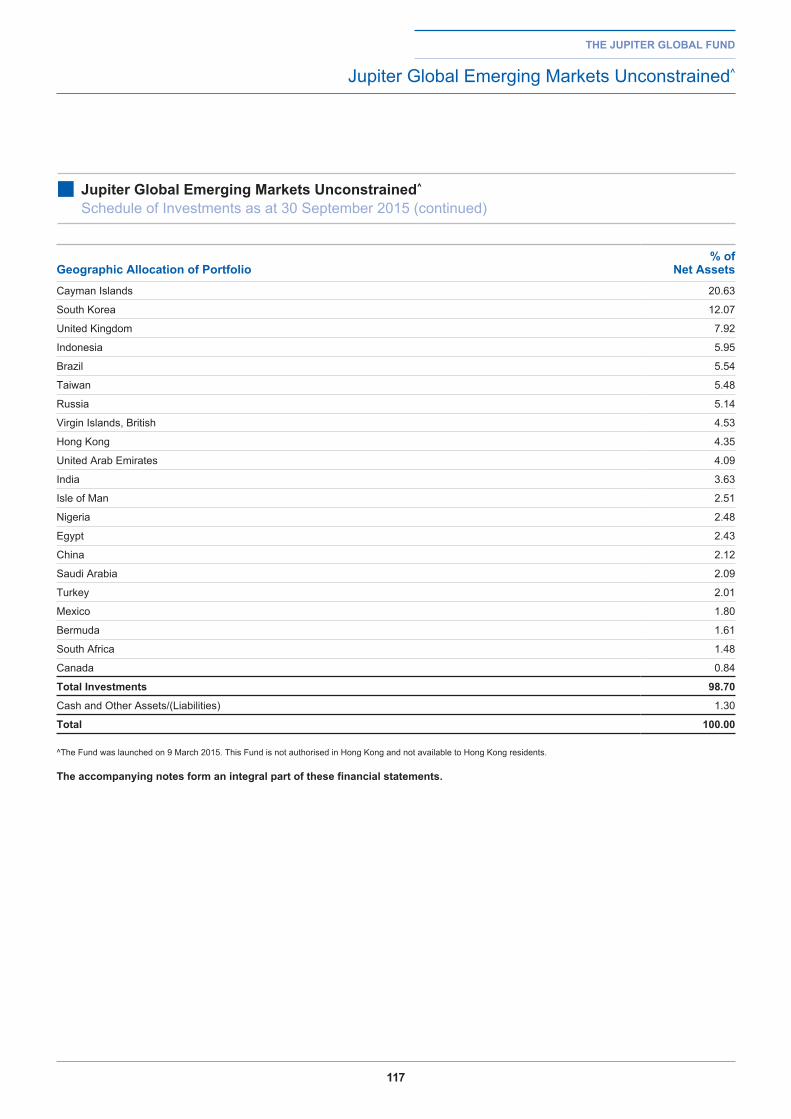
117
the jupiter global fund
Jupiter Global Emerging Markets Unconstrained^
■ jupiter global emerging Markets unconstrained^
Schedule of Investments as at 30 September 2015 (continued)
geographic allocation of portfolio% of
net assetsCayman Islands 20.63
South Korea 12.07
United Kingdom 7.92
Indonesia 5.95
Brazil 5.54
Taiwan 5.48
Russia 5.14
Virgin Islands, British 4.53
Hong Kong 4.35
United Arab Emirates 4.09
India 3.63
Isle of Man 2.51
Nigeria 2.48
Egypt 2.43
China 2.12
Saudi Arabia 2.09
Turkey 2.01
Mexico 1.80
Bermuda 1.61
South Africa 1.48
Canada 0.84
total investments 98.70
Cash and Other Assets/(Liabilities) 1.30
total 100.00
^The Fund was launched on 9 March 2015. This Fund is not authorised in Hong Kong and not available to Hong Kong residents.
the accompanying notes form an integral part of these financial statements.
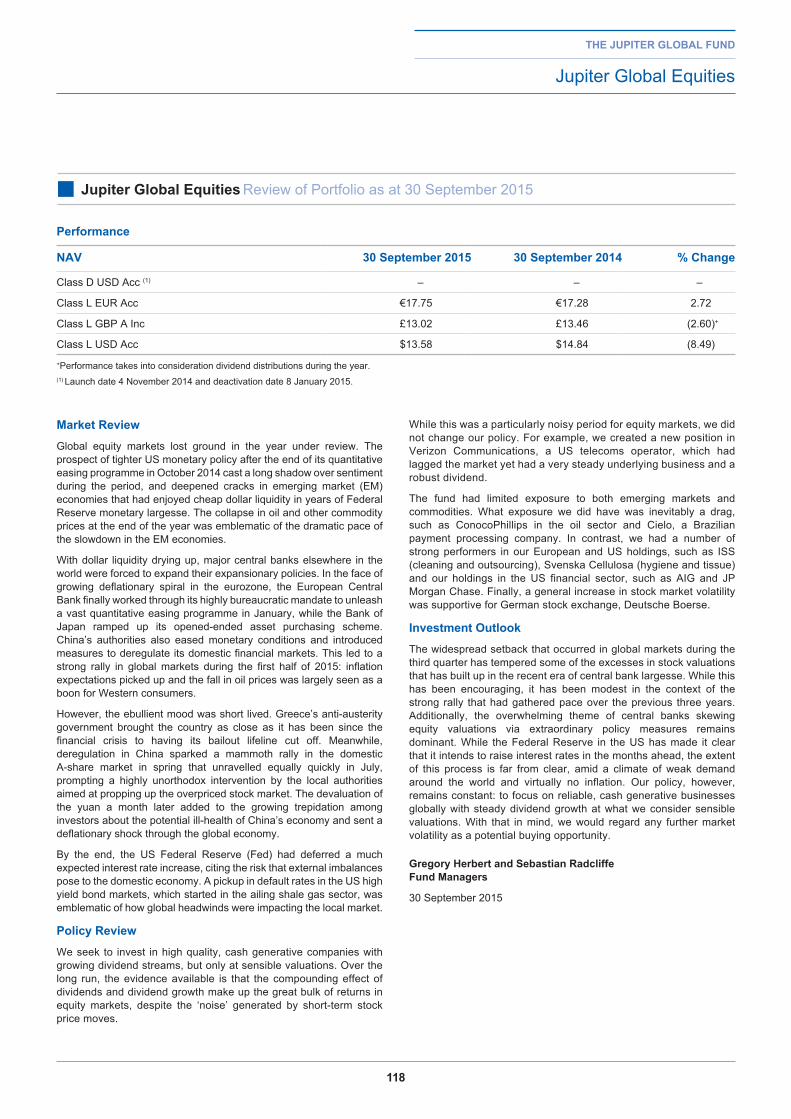
118
Market reviewGlobal equity markets lost ground in the year under review. The prospect of tighter US monetary policy after the end of its quantitative easing programme in October 2014 cast a long shadow over sentiment during the period, and deepened cracks in emerging market (EM) economies that had enjoyed cheap dollar liquidity in years of Federal Reserve monetary largesse. The collapse in oil and other commodity prices at the end of the year was emblematic of the dramatic pace of the slowdown in the EM economies.
With dollar liquidity drying up, major central banks elsewhere in the world were forced to expand their expansionary policies. In the face of growing deflationary spiral in the eurozone, the European Central Bank finally worked through its highly bureaucratic mandate to unleash a vast quantitative easing programme in January, while the Bank of Japan ramped up its opened-ended asset purchasing scheme. China’s authorities also eased monetary conditions and introduced measures to deregulate its domestic financial markets. This led to a strong rally in global markets during the first half of 2015: inflation expectations picked up and the fall in oil prices was largely seen as a boon for Western consumers.
However, the ebullient mood was short lived. Greece’s anti-austerity government brought the country as close as it has been since the financial crisis to having its bailout lifeline cut off. Meanwhile, deregulation in China sparked a mammoth rally in the domestic A-share market in spring that unravelled equally quickly in July, prompting a highly unorthodox intervention by the local authorities aimed at propping up the overpriced stock market. The devaluation of the yuan a month later added to the growing trepidation among investors about the potential ill-health of China’s economy and sent a deflationary shock through the global economy.
By the end, the US Federal Reserve (Fed) had deferred a much expected interest rate increase, citing the risk that external imbalances pose to the domestic economy. A pickup in default rates in the US high yield bond markets, which started in the ailing shale gas sector, was emblematic of how global headwinds were impacting the local market.
policy reviewWe seek to invest in high quality, cash generative companies with growing dividend streams, but only at sensible valuations. Over the long run, the evidence available is that the compounding effect of dividends and dividend growth make up the great bulk of returns in equity markets, despite the ‘noise’ generated by short-term stock price moves.
While this was a particularly noisy period for equity markets, we did not change our policy. For example, we created a new position in Verizon Communications, a US telecoms operator, which had lagged the market yet had a very steady underlying business and a robust dividend.
The fund had limited exposure to both emerging markets and commodities. What exposure we did have was inevitably a drag, such as ConocoPhillips in the oil sector and Cielo, a Brazilian payment processing company. In contrast, we had a number of strong performers in our European and US holdings, such as ISS (cleaning and outsourcing), Svenska Cellulosa (hygiene and tissue) and our holdings in the US financial sector, such as AIG and JP Morgan Chase. Finally, a general increase in stock market volatility was supportive for German stock exchange, Deutsche Boerse.
investment outlookThe widespread setback that occurred in global markets during the third quarter has tempered some of the excesses in stock valuations that has built up in the recent era of central bank largesse. While this has been encouraging, it has been modest in the context of the strong rally that had gathered pace over the previous three years. Additionally, the overwhelming theme of central banks skewing equity valuations via extraordinary policy measures remains dominant. While the Federal Reserve in the US has made it clear that it intends to raise interest rates in the months ahead, the extent of this process is far from clear, amid a climate of weak demand around the world and virtually no inflation. Our policy, however, remains constant: to focus on reliable, cash generative businesses globally with steady dividend growth at what we consider sensible valuations. With that in mind, we would regard any further market volatility as a potential buying opportunity.
gregory herbert and Sebastian radcliffefund Managers
30 September 2015
the jupiter global fund
Jupiter Global Equities
■ jupiter global equities Review of Portfolio as at 30 September 2015
performance
naV 30 September 2015 30 September 2014 % Change
Class D USD Acc (1) – – –
Class L EUR Acc €17.75 €17.28 2.72
Class L GBP A Inc £13.02 £13.46 (2.60)+
Class L USD Acc $13.58 $14.84 (8.49)
+Performance takes into consideration dividend distributions during the year.(1) Launch date 4 November 2014 and deactivation date 8 January 2015.
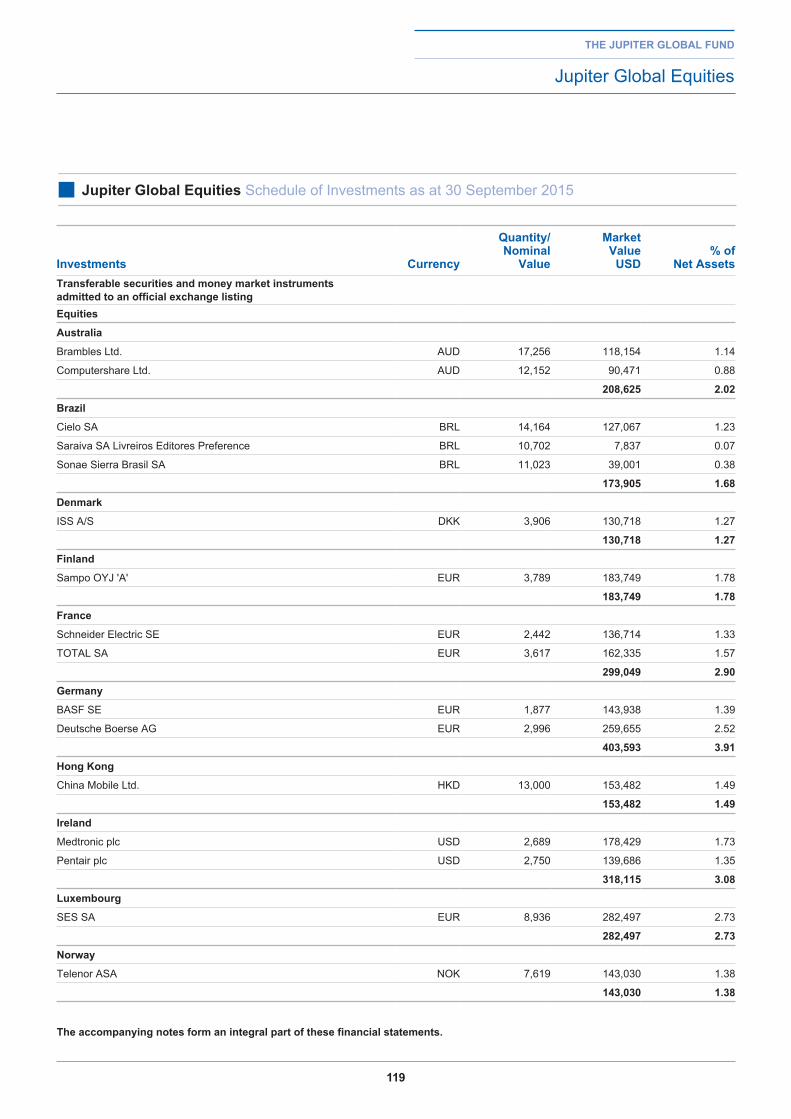
119
the jupiter global fund
Jupiter Global Equities
■ jupiter global equities Schedule of Investments as at 30 September 2015
investments Currency
Quantity/ nominal
Value
Market Value
uSd% of
net assetstransferable securities and money market instruments admitted to an official exchange listingequities
australia
Brambles Ltd. AUD 17,256 118,154 1.14
Computershare Ltd. AUD 12,152 90,471 0.88
208,625 2.02
brazil
Cielo SA BRL 14,164 127,067 1.23
Saraiva SA Livreiros Editores Preference BRL 10,702 7,837 0.07
Sonae Sierra Brasil SA BRL 11,023 39,001 0.38
173,905 1.68
denmark
ISS A/S DKK 3,906 130,718 1.27
130,718 1.27
finland
Sampo OYJ 'A' EUR 3,789 183,749 1.78
183,749 1.78
france
Schneider Electric SE EUR 2,442 136,714 1.33
TOTAL SA EUR 3,617 162,335 1.57
299,049 2.90
germany
BASF SE EUR 1,877 143,938 1.39
Deutsche Boerse AG EUR 2,996 259,655 2.52
403,593 3.91
hong Kong
China Mobile Ltd. HKD 13,000 153,482 1.49
153,482 1.49
ireland
Medtronic plc USD 2,689 178,429 1.73
Pentair plc USD 2,750 139,686 1.35
318,115 3.08
luxembourg
SES SA EUR 8,936 282,497 2.73
282,497 2.73
norway
Telenor ASA NOK 7,619 143,030 1.38
143,030 1.38
the accompanying notes form an integral part of these financial statements.
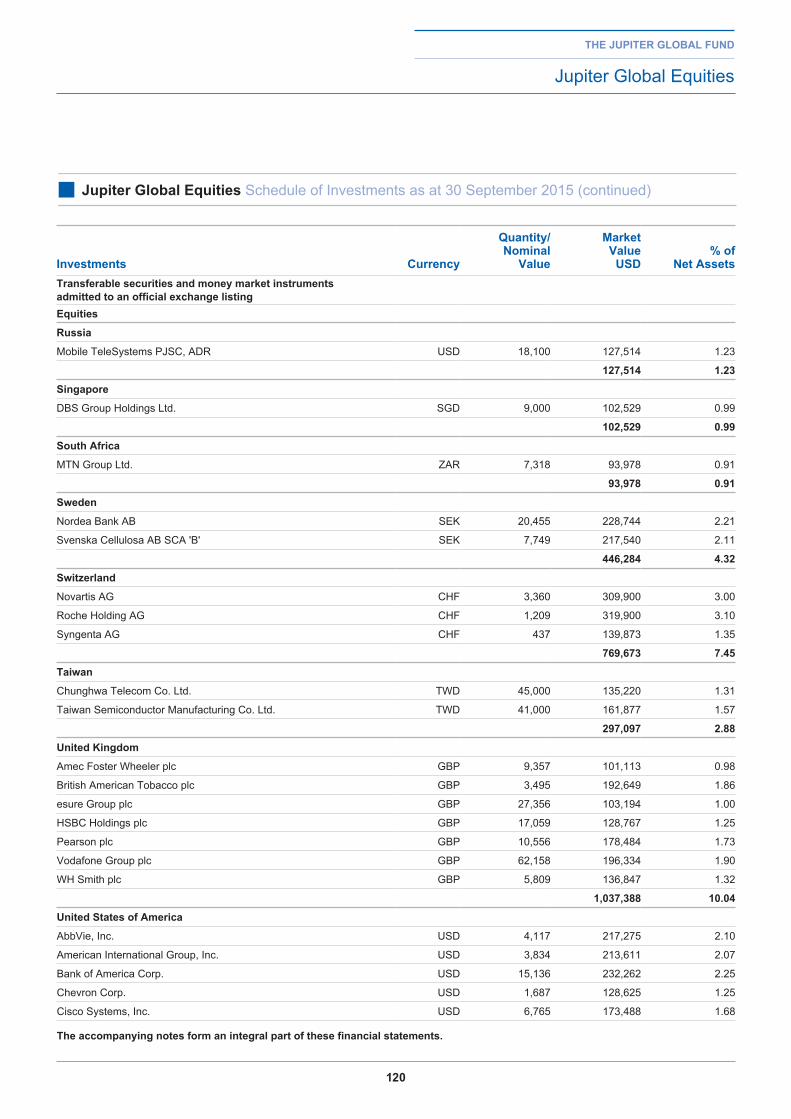
120
the jupiter global fund
Jupiter Global Equities
■ jupiter global equities Schedule of Investments as at 30 September 2015 (continued)
investments Currency
Quantity/ nominal
Value
Market Value
uSd% of
net assetstransferable securities and money market instruments admitted to an official exchange listingequities
russia
Mobile TeleSystems PJSC, ADR USD 18,100 127,514 1.23
127,514 1.23
Singapore
DBS Group Holdings Ltd. SGD 9,000 102,529 0.99
102,529 0.99
South africa
MTN Group Ltd. ZAR 7,318 93,978 0.91
93,978 0.91
Sweden
Nordea Bank AB SEK 20,455 228,744 2.21
Svenska Cellulosa AB SCA 'B' SEK 7,749 217,540 2.11
446,284 4.32
Switzerland
Novartis AG CHF 3,360 309,900 3.00
Roche Holding AG CHF 1,209 319,900 3.10
Syngenta AG CHF 437 139,873 1.35
769,673 7.45
taiwan
Chunghwa Telecom Co. Ltd. TWD 45,000 135,220 1.31
Taiwan Semiconductor Manufacturing Co. Ltd. TWD 41,000 161,877 1.57
297,097 2.88
united Kingdom
Amec Foster Wheeler plc GBP 9,357 101,113 0.98
British American Tobacco plc GBP 3,495 192,649 1.86
esure Group plc GBP 27,356 103,194 1.00
HSBC Holdings plc GBP 17,059 128,767 1.25
Pearson plc GBP 10,556 178,484 1.73
Vodafone Group plc GBP 62,158 196,334 1.90
WH Smith plc GBP 5,809 136,847 1.32
1,037,388 10.04
united States of america
AbbVie, Inc. USD 4,117 217,275 2.10
American International Group, Inc. USD 3,834 213,611 2.07
Bank of America Corp. USD 15,136 232,262 2.25
Chevron Corp. USD 1,687 128,625 1.25
Cisco Systems, Inc. USD 6,765 173,488 1.68
the accompanying notes form an integral part of these financial statements.
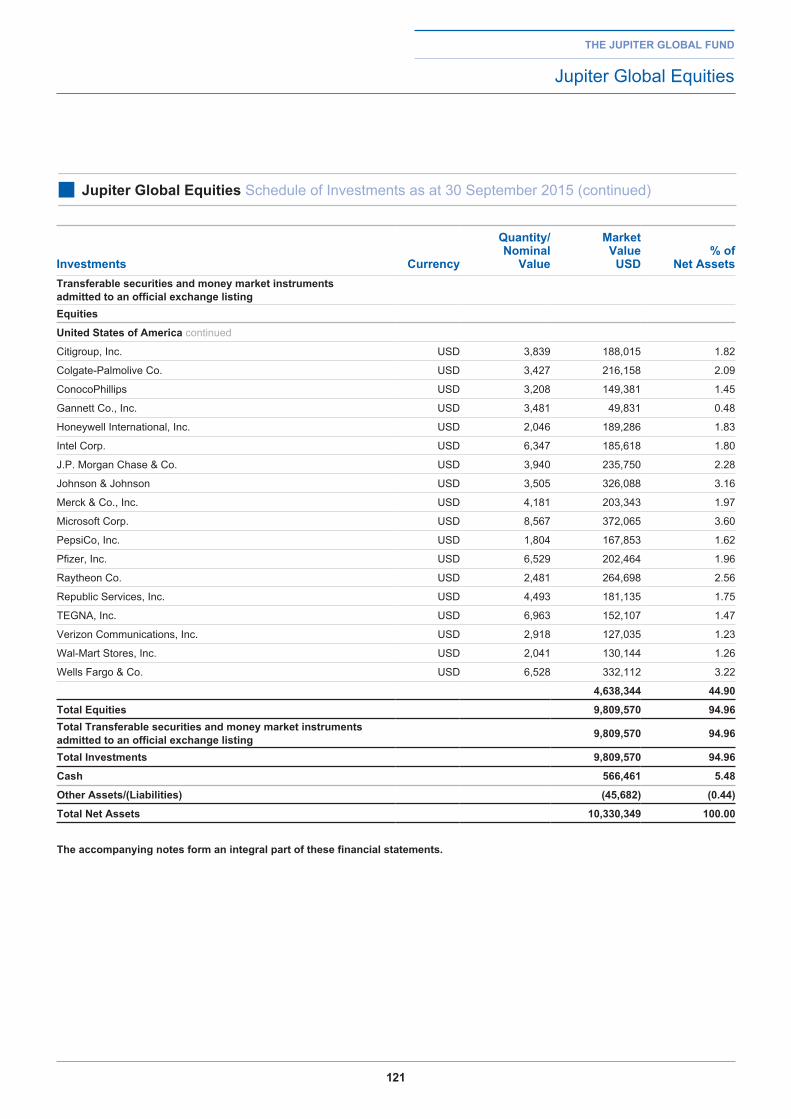
121
the jupiter global fund
Jupiter Global Equities
■ jupiter global equities Schedule of Investments as at 30 September 2015 (continued)
investments Currency
Quantity/ nominal
Value
Market Value
uSd% of
net assetstransferable securities and money market instruments admitted to an official exchange listingequities
united States of america continued
Citigroup, Inc. USD 3,839 188,015 1.82
Colgate-Palmolive Co. USD 3,427 216,158 2.09
ConocoPhillips USD 3,208 149,381 1.45
Gannett Co., Inc. USD 3,481 49,831 0.48
Honeywell International, Inc. USD 2,046 189,286 1.83
Intel Corp. USD 6,347 185,618 1.80
J.P. Morgan Chase & Co. USD 3,940 235,750 2.28
Johnson & Johnson USD 3,505 326,088 3.16
Merck & Co., Inc. USD 4,181 203,343 1.97
Microsoft Corp. USD 8,567 372,065 3.60
PepsiCo, Inc. USD 1,804 167,853 1.62
Pfizer, Inc. USD 6,529 202,464 1.96
Raytheon Co. USD 2,481 264,698 2.56
Republic Services, Inc. USD 4,493 181,135 1.75
TEGNA, Inc. USD 6,963 152,107 1.47
Verizon Communications, Inc. USD 2,918 127,035 1.23
Wal-Mart Stores, Inc. USD 2,041 130,144 1.26
Wells Fargo & Co. USD 6,528 332,112 3.22
4,638,344 44.90
total equities 9,809,570 94.96total transferable securities and money market instruments admitted to an official exchange listing 9,809,570 94.96
total investments 9,809,570 94.96
Cash 566,461 5.48
other assets/(liabilities) (45,682) (0.44)
total net assets 10,330,349 100.00
the accompanying notes form an integral part of these financial statements.
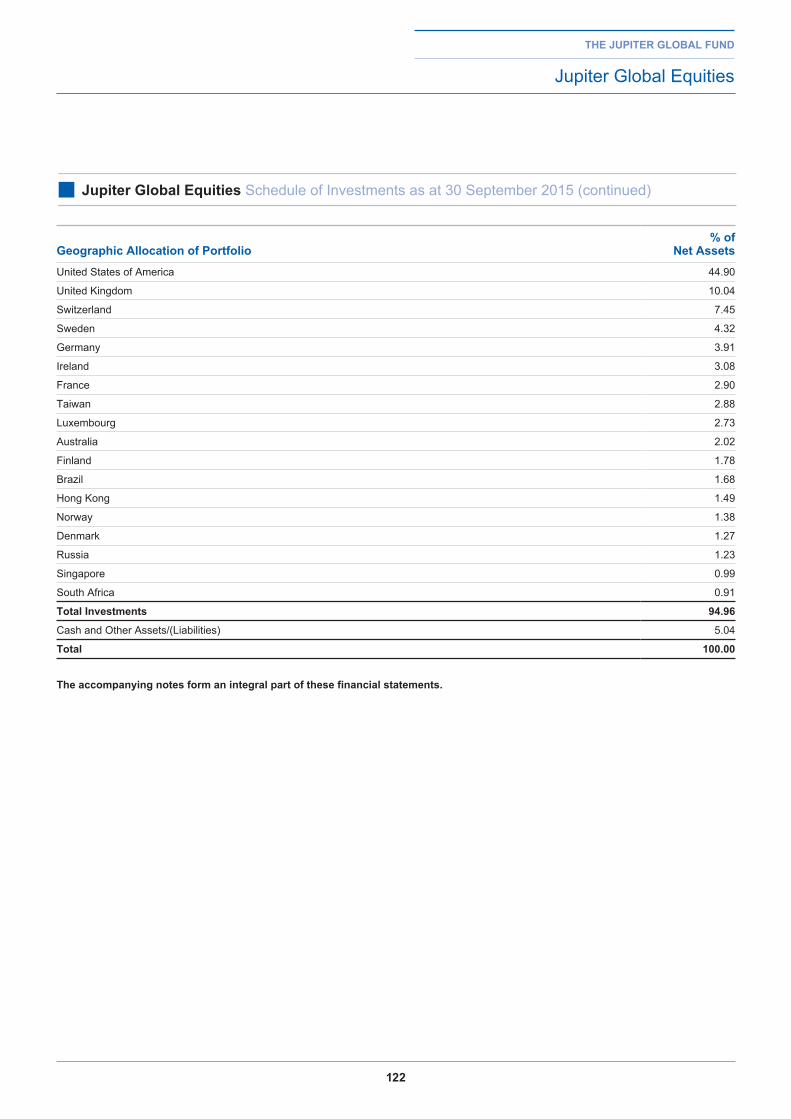
122
the jupiter global fund
Jupiter Global Equities
■ jupiter global equities Schedule of Investments as at 30 September 2015 (continued)
geographic allocation of portfolio% of
net assetsUnited States of America 44.90
United Kingdom 10.04
Switzerland 7.45
Sweden 4.32
Germany 3.91
Ireland 3.08
France 2.90
Taiwan 2.88
Luxembourg 2.73
Australia 2.02
Finland 1.78
Brazil 1.68
Hong Kong 1.49
Norway 1.38
Denmark 1.27
Russia 1.23
Singapore 0.99
South Africa 0.91
total investments 94.96
Cash and Other Assets/(Liabilities) 5.04
total 100.00
the accompanying notes form an integral part of these financial statements.
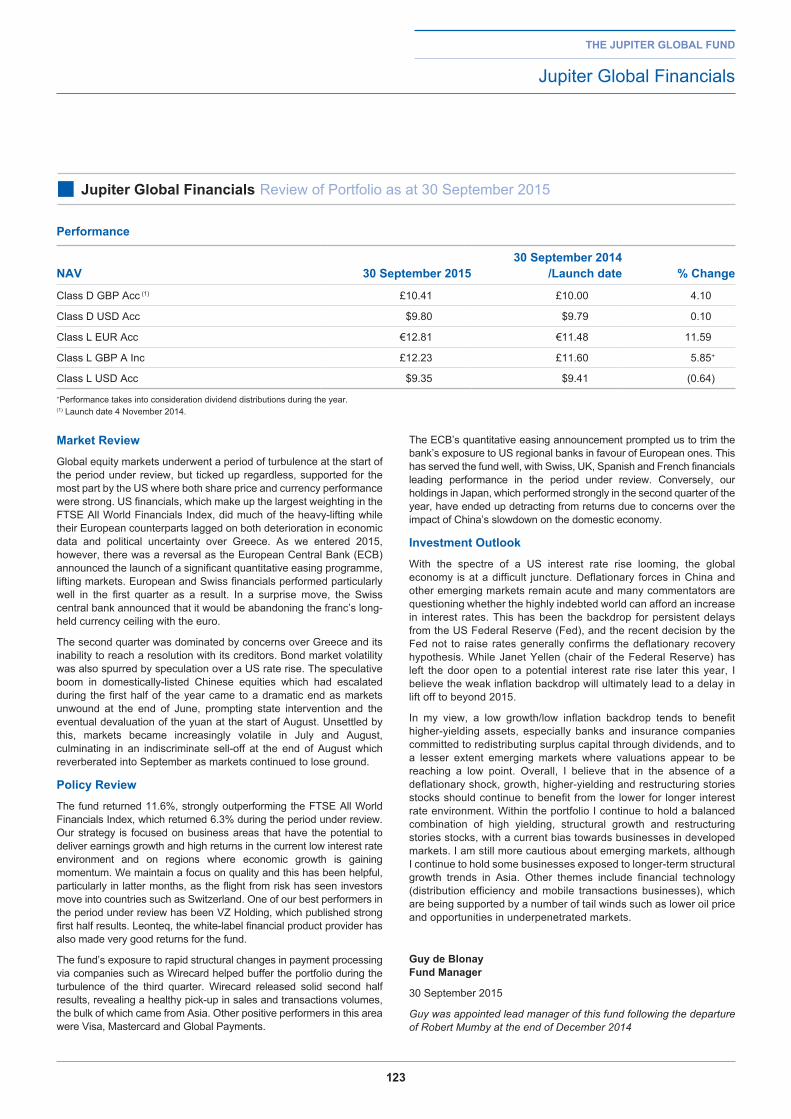
123
Market reviewGlobal equity markets underwent a period of turbulence at the start of the period under review, but ticked up regardless, supported for the most part by the US where both share price and currency performance were strong. US financials, which make up the largest weighting in the FTSE All World Financials Index, did much of the heavy-lifting while their European counterparts lagged on both deterioration in economic data and political uncertainty over Greece. As we entered 2015, however, there was a reversal as the European Central Bank (ECB) announced the launch of a significant quantitative easing programme, lifting markets. European and Swiss financials performed particularly well in the first quarter as a result. In a surprise move, the Swiss central bank announced that it would be abandoning the franc’s long-held currency ceiling with the euro.
The second quarter was dominated by concerns over Greece and its inability to reach a resolution with its creditors. Bond market volatility was also spurred by speculation over a US rate rise. The speculative boom in domestically-listed Chinese equities which had escalated during the first half of the year came to a dramatic end as markets unwound at the end of June, prompting state intervention and the eventual devaluation of the yuan at the start of August. Unsettled by this, markets became increasingly volatile in July and August, culminating in an indiscriminate sell-off at the end of August which reverberated into September as markets continued to lose ground.
policy reviewThe fund returned 11.6%, strongly outperforming the FTSE All World Financials Index, which returned 6.3% during the period under review. Our strategy is focused on business areas that have the potential to deliver earnings growth and high returns in the current low interest rate environment and on regions where economic growth is gaining momentum. We maintain a focus on quality and this has been helpful, particularly in latter months, as the flight from risk has seen investors move into countries such as Switzerland. One of our best performers in the period under review has been VZ Holding, which published strong first half results. Leonteq, the white-label financial product provider has also made very good returns for the fund.
The fund’s exposure to rapid structural changes in payment processing via companies such as Wirecard helped buffer the portfolio during the turbulence of the third quarter. Wirecard released solid second half results, revealing a healthy pick-up in sales and transactions volumes, the bulk of which came from Asia. Other positive performers in this area were Visa, Mastercard and Global Payments.
The ECB’s quantitative easing announcement prompted us to trim the bank’s exposure to US regional banks in favour of European ones. This has served the fund well, with Swiss, UK, Spanish and French financials leading performance in the period under review. Conversely, our holdings in Japan, which performed strongly in the second quarter of the year, have ended up detracting from returns due to concerns over the impact of China’s slowdown on the domestic economy.
investment outlookWith the spectre of a US interest rate rise looming, the global economy is at a difficult juncture. Deflationary forces in China and other emerging markets remain acute and many commentators are questioning whether the highly indebted world can afford an increase in interest rates. This has been the backdrop for persistent delays from the US Federal Reserve (Fed), and the recent decision by the Fed not to raise rates generally confirms the deflationary recovery hypothesis. While Janet Yellen (chair of the Federal Reserve) has left the door open to a potential interest rate rise later this year, I believe the weak inflation backdrop will ultimately lead to a delay in lift off to beyond 2015.
In my view, a low growth/low inflation backdrop tends to benefit higher-yielding assets, especially banks and insurance companies committed to redistributing surplus capital through dividends, and to a lesser extent emerging markets where valuations appear to be reaching a low point. Overall, I believe that in the absence of a deflationary shock, growth, higher-yielding and restructuring stories stocks should continue to benefit from the lower for longer interest rate environment. Within the portfolio I continue to hold a balanced combination of high yielding, structural growth and restructuring stories stocks, with a current bias towards businesses in developed markets. I am still more cautious about emerging markets, although I continue to hold some businesses exposed to longer-term structural growth trends in Asia. Other themes include financial technology (distribution efficiency and mobile transactions businesses), which are being supported by a number of tail winds such as lower oil price and opportunities in underpenetrated markets.
guy de blonayfund Manager
30 September 2015
Guy was appointed lead manager of this fund following the departure of Robert Mumby at the end of December 2014
the jupiter global fund
Jupiter Global Financials
■ jupiter global financials Review of Portfolio as at 30 September 2015
performance
naV 30 September 201530 September 2014
/launch date % Change
Class D GBP Acc (1) £10.41 £10.00 4.10
Class D USD Acc $9.80 $9.79 0.10
Class L EUR Acc €12.81 €11.48 11.59
Class L GBP A Inc £12.23 £11.60 5.85+
Class L USD Acc $9.35 $9.41 (0.64)+Performance takes into consideration dividend distributions during the year.(1) Launch date 4 November 2014.
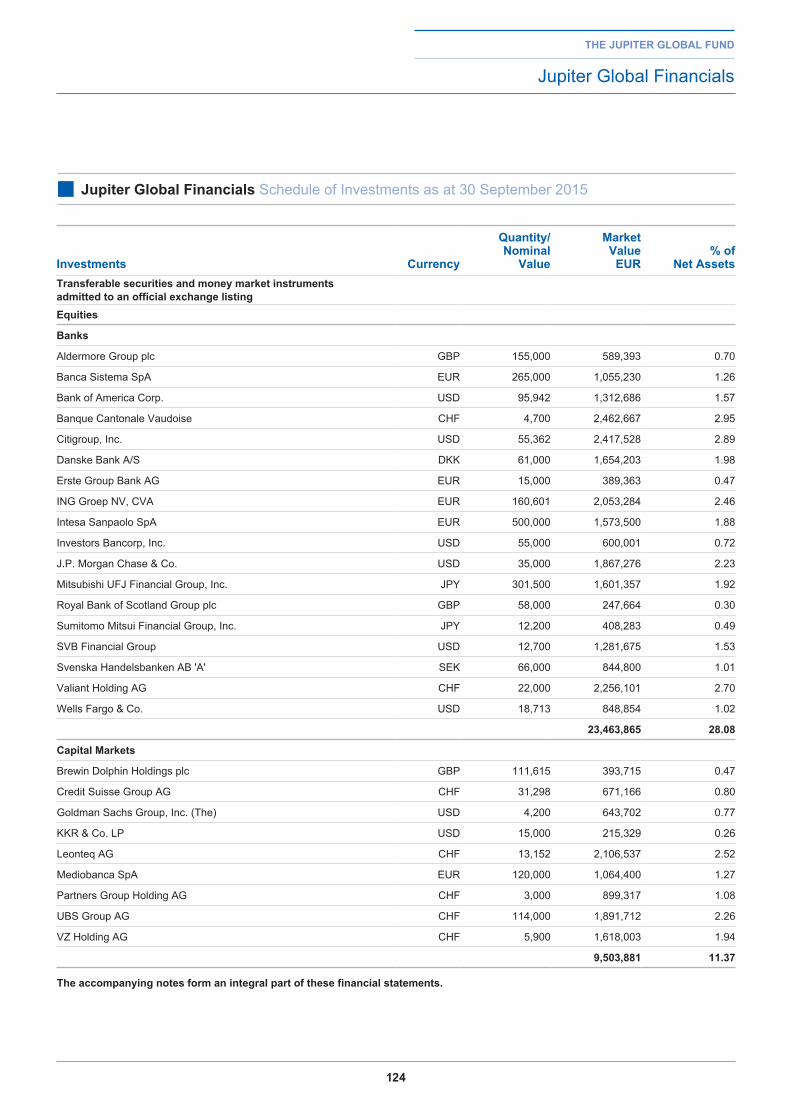
124
the jupiter global fund
Jupiter Global Financials
■ jupiter global financials Schedule of Investments as at 30 September 2015
investments Currency
Quantity/ nominal
Value
Market Value
eur% of
net assetstransferable securities and money market instruments admitted to an official exchange listingequities
banks
Aldermore Group plc GBP 155,000 589,393 0.70
Banca Sistema SpA EUR 265,000 1,055,230 1.26
Bank of America Corp. USD 95,942 1,312,686 1.57
Banque Cantonale Vaudoise CHF 4,700 2,462,667 2.95
Citigroup, Inc. USD 55,362 2,417,528 2.89
Danske Bank A/S DKK 61,000 1,654,203 1.98
Erste Group Bank AG EUR 15,000 389,363 0.47
ING Groep NV, CVA EUR 160,601 2,053,284 2.46
Intesa Sanpaolo SpA EUR 500,000 1,573,500 1.88
Investors Bancorp, Inc. USD 55,000 600,001 0.72
J.P. Morgan Chase & Co. USD 35,000 1,867,276 2.23
Mitsubishi UFJ Financial Group, Inc. JPY 301,500 1,601,357 1.92
Royal Bank of Scotland Group plc GBP 58,000 247,664 0.30
Sumitomo Mitsui Financial Group, Inc. JPY 12,200 408,283 0.49
SVB Financial Group USD 12,700 1,281,675 1.53
Svenska Handelsbanken AB 'A' SEK 66,000 844,800 1.01
Valiant Holding AG CHF 22,000 2,256,101 2.70
Wells Fargo & Co. USD 18,713 848,854 1.02
23,463,865 28.08
Capital Markets
Brewin Dolphin Holdings plc GBP 111,615 393,715 0.47
Credit Suisse Group AG CHF 31,298 671,166 0.80
Goldman Sachs Group, Inc. (The) USD 4,200 643,702 0.77
KKR & Co. LP USD 15,000 215,329 0.26
Leonteq AG CHF 13,152 2,106,537 2.52
Mediobanca SpA EUR 120,000 1,064,400 1.27
Partners Group Holding AG CHF 3,000 899,317 1.08
UBS Group AG CHF 114,000 1,891,712 2.26
VZ Holding AG CHF 5,900 1,618,003 1.94
9,503,881 11.37
the accompanying notes form an integral part of these financial statements.
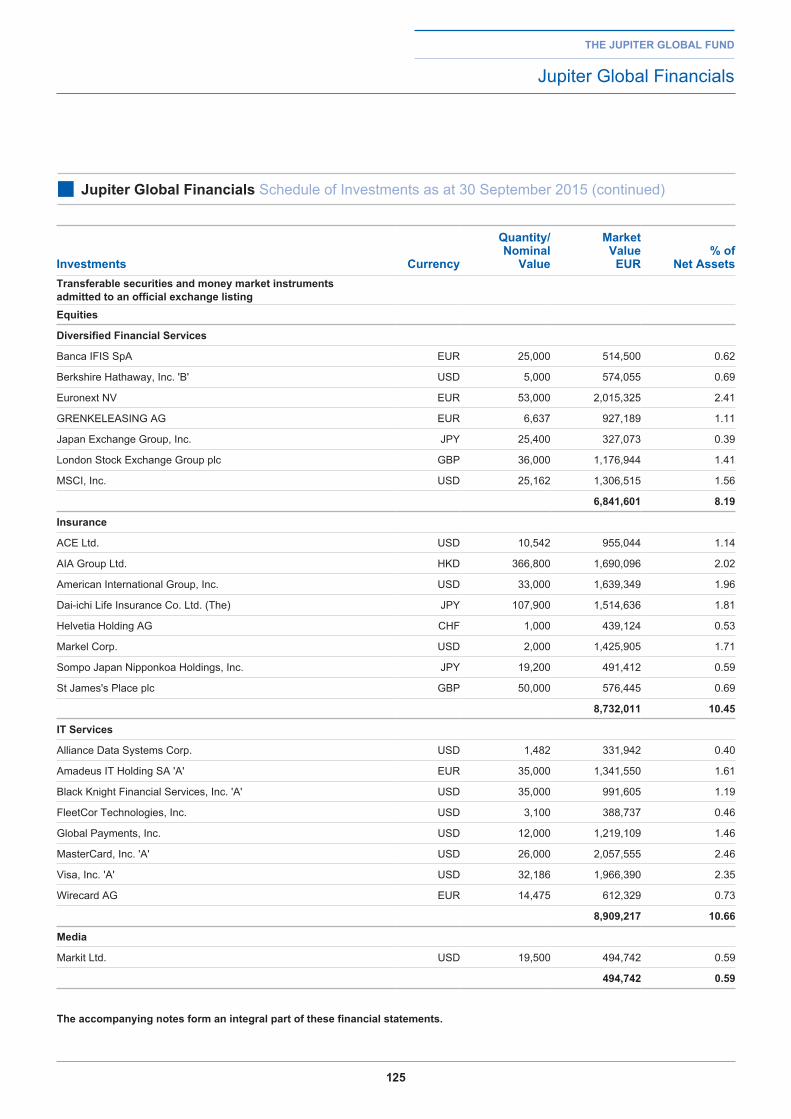
125
the jupiter global fund
Jupiter Global Financials
■ jupiter global financials Schedule of Investments as at 30 September 2015 (continued)
investments Currency
Quantity/ nominal
Value
Market Value
eur% of
net assetstransferable securities and money market instruments admitted to an official exchange listingequities
diversified financial Services
Banca IFIS SpA EUR 25,000 514,500 0.62
Berkshire Hathaway, Inc. 'B' USD 5,000 574,055 0.69
Euronext NV EUR 53,000 2,015,325 2.41
GRENKELEASING AG EUR 6,637 927,189 1.11
Japan Exchange Group, Inc. JPY 25,400 327,073 0.39
London Stock Exchange Group plc GBP 36,000 1,176,944 1.41
MSCI, Inc. USD 25,162 1,306,515 1.56
6,841,601 8.19
insurance
ACE Ltd. USD 10,542 955,044 1.14
AIA Group Ltd. HKD 366,800 1,690,096 2.02
American International Group, Inc. USD 33,000 1,639,349 1.96
Dai-ichi Life Insurance Co. Ltd. (The) JPY 107,900 1,514,636 1.81
Helvetia Holding AG CHF 1,000 439,124 0.53
Markel Corp. USD 2,000 1,425,905 1.71
Sompo Japan Nipponkoa Holdings, Inc. JPY 19,200 491,412 0.59
St James's Place plc GBP 50,000 576,445 0.69
8,732,011 10.45
it Services
Alliance Data Systems Corp. USD 1,482 331,942 0.40
Amadeus IT Holding SA 'A' EUR 35,000 1,341,550 1.61
Black Knight Financial Services, Inc. 'A' USD 35,000 991,605 1.19
FleetCor Technologies, Inc. USD 3,100 388,737 0.46
Global Payments, Inc. USD 12,000 1,219,109 1.46
MasterCard, Inc. 'A' USD 26,000 2,057,555 2.46
Visa, Inc. 'A' USD 32,186 1,966,390 2.35
Wirecard AG EUR 14,475 612,329 0.73
8,909,217 10.66
Media
Markit Ltd. USD 19,500 494,742 0.59
494,742 0.59
the accompanying notes form an integral part of these financial statements.
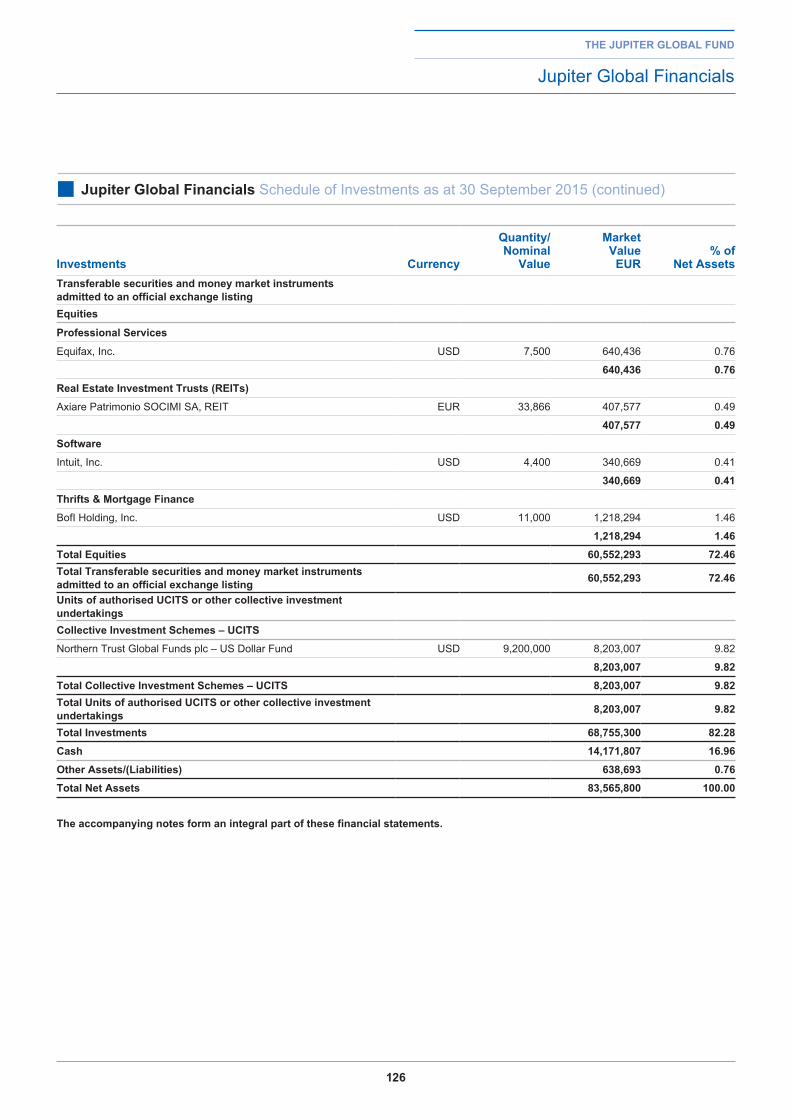
126
the jupiter global fund
Jupiter Global Financials
■ jupiter global financials Schedule of Investments as at 30 September 2015 (continued)
investments Currency
Quantity/ nominal
Value
Market Value
eur% of
net assetstransferable securities and money market instruments admitted to an official exchange listingequities
professional Services
Equifax, Inc. USD 7,500 640,436 0.76
640,436 0.76real estate investment trusts (reits)Axiare Patrimonio SOCIMI SA, REIT EUR 33,866 407,577 0.49
407,577 0.49SoftwareIntuit, Inc. USD 4,400 340,669 0.41
340,669 0.41thrifts & Mortgage financeBofI Holding, Inc. USD 11,000 1,218,294 1.46
1,218,294 1.46total equities 60,552,293 72.46total transferable securities and money market instruments admitted to an official exchange listing 60,552,293 72.46
units of authorised uCitS or other collective investment undertakingsCollective investment Schemes – uCitSNorthern Trust Global Funds plc – US Dollar Fund USD 9,200,000 8,203,007 9.82
8,203,007 9.82total Collective investment Schemes – uCitS 8,203,007 9.82total units of authorised uCitS or other collective investment undertakings 8,203,007 9.82
total investments 68,755,300 82.28Cash 14,171,807 16.96other assets/(liabilities) 638,693 0.76total net assets 83,565,800 100.00
the accompanying notes form an integral part of these financial statements.
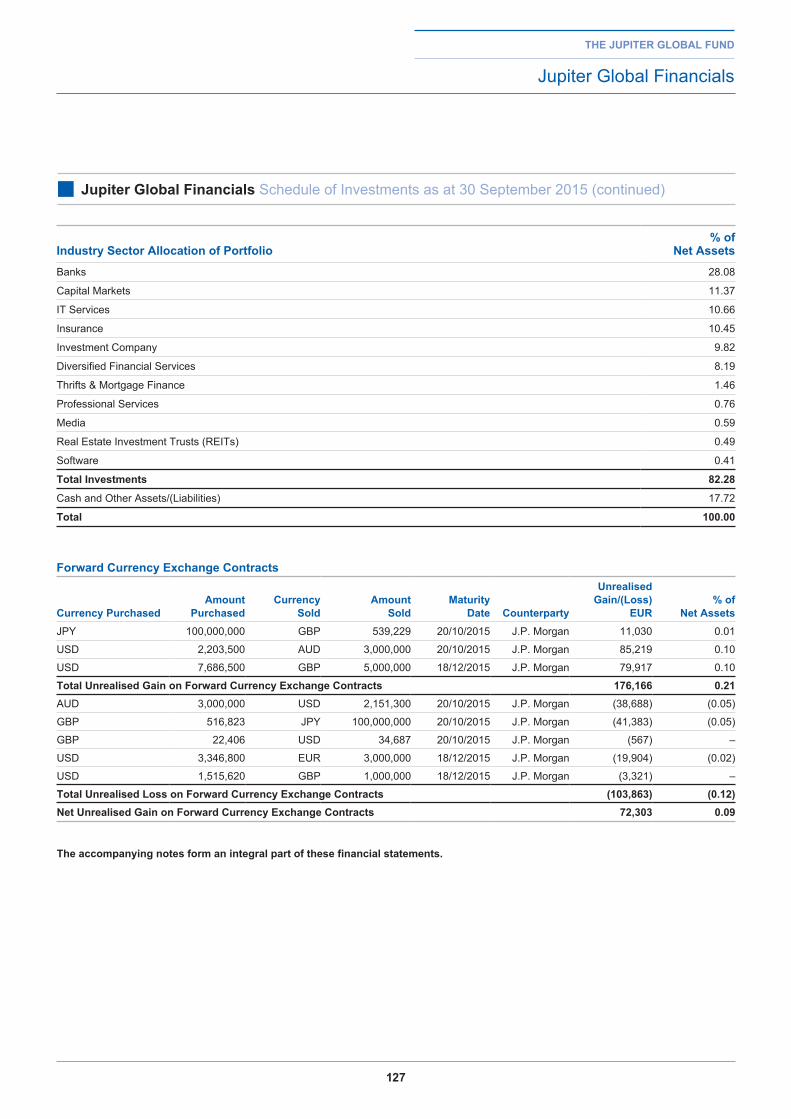
127
the jupiter global fund
Jupiter Global Financials
■ jupiter global financials Schedule of Investments as at 30 September 2015 (continued)
industry Sector allocation of portfolio% of
net assetsBanks 28.08
Capital Markets 11.37
IT Services 10.66
Insurance 10.45
Investment Company 9.82
Diversified Financial Services 8.19
Thrifts & Mortgage Finance 1.46
Professional Services 0.76
Media 0.59
Real Estate Investment Trusts (REITs) 0.49
Software 0.41
total investments 82.28
Cash and Other Assets/(Liabilities) 17.72
total 100.00
forward Currency exchange Contracts
Currency purchasedamount
purchasedCurrency
Soldamount
SoldMaturity
date Counterparty
unrealised gain/(loss)
eur% of
net assetsJPY 100,000,000 GBP 539,229 20/10/2015 J.P. Morgan 11,030 0.01
USD 2,203,500 AUD 3,000,000 20/10/2015 J.P. Morgan 85,219 0.10
USD 7,686,500 GBP 5,000,000 18/12/2015 J.P. Morgan 79,917 0.10
total unrealised gain on forward Currency exchange Contracts 176,166 0.21AUD 3,000,000 USD 2,151,300 20/10/2015 J.P. Morgan (38,688) (0.05)
GBP 516,823 JPY 100,000,000 20/10/2015 J.P. Morgan (41,383) (0.05)
GBP 22,406 USD 34,687 20/10/2015 J.P. Morgan (567) –
USD 3,346,800 EUR 3,000,000 18/12/2015 J.P. Morgan (19,904) (0.02)
USD 1,515,620 GBP 1,000,000 18/12/2015 J.P. Morgan (3,321) –
total unrealised loss on forward Currency exchange Contracts (103,863) (0.12)net unrealised gain on forward Currency exchange Contracts 72,303 0.09
the accompanying notes form an integral part of these financial statements.
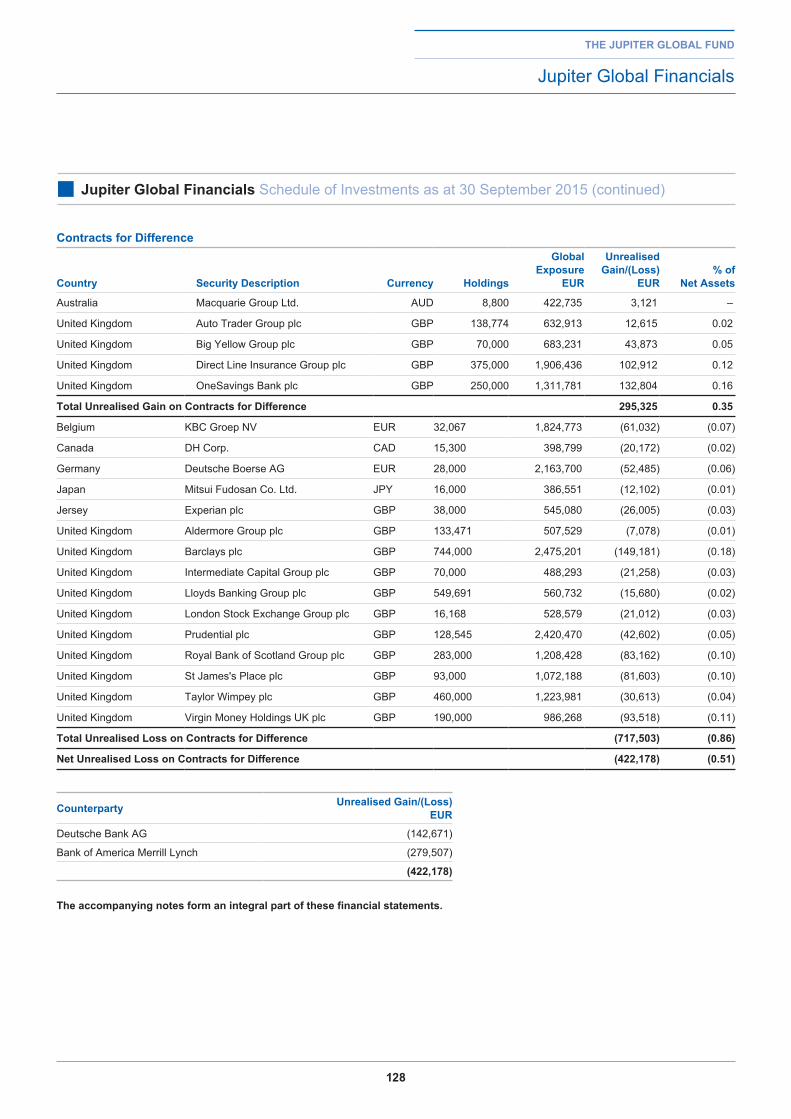
128
the jupiter global fund
Jupiter Global Financials
■ jupiter global financials Schedule of Investments as at 30 September 2015 (continued)
Contracts for difference
Country Security description Currency holdings
global exposure
eur
unrealised gain/(loss)
eur% of
net assets
Australia Macquarie Group Ltd. AUD 8,800 422,735 3,121 –
United Kingdom Auto Trader Group plc GBP 138,774 632,913 12,615 0.02
United Kingdom Big Yellow Group plc GBP 70,000 683,231 43,873 0.05
United Kingdom Direct Line Insurance Group plc GBP 375,000 1,906,436 102,912 0.12
United Kingdom OneSavings Bank plc GBP 250,000 1,311,781 132,804 0.16
total unrealised gain on Contracts for difference 295,325 0.35
Belgium KBC Groep NV EUR 32,067 1,824,773 (61,032) (0.07)
Canada DH Corp. CAD 15,300 398,799 (20,172) (0.02)
Germany Deutsche Boerse AG EUR 28,000 2,163,700 (52,485) (0.06)
Japan Mitsui Fudosan Co. Ltd. JPY 16,000 386,551 (12,102) (0.01)
Jersey Experian plc GBP 38,000 545,080 (26,005) (0.03)
United Kingdom Aldermore Group plc GBP 133,471 507,529 (7,078) (0.01)
United Kingdom Barclays plc GBP 744,000 2,475,201 (149,181) (0.18)
United Kingdom Intermediate Capital Group plc GBP 70,000 488,293 (21,258) (0.03)
United Kingdom Lloyds Banking Group plc GBP 549,691 560,732 (15,680) (0.02)
United Kingdom London Stock Exchange Group plc GBP 16,168 528,579 (21,012) (0.03)
United Kingdom Prudential plc GBP 128,545 2,420,470 (42,602) (0.05)
United Kingdom Royal Bank of Scotland Group plc GBP 283,000 1,208,428 (83,162) (0.10)
United Kingdom St James's Place plc GBP 93,000 1,072,188 (81,603) (0.10)
United Kingdom Taylor Wimpey plc GBP 460,000 1,223,981 (30,613) (0.04)
United Kingdom Virgin Money Holdings UK plc GBP 190,000 986,268 (93,518) (0.11)
total unrealised loss on Contracts for difference (717,503) (0.86)
net unrealised loss on Contracts for difference (422,178) (0.51)
Counterparty unrealised gain/(loss) eur
Deutsche Bank AG (142,671)
Bank of America Merrill Lynch (279,507)
(422,178)
the accompanying notes form an integral part of these financial statements.
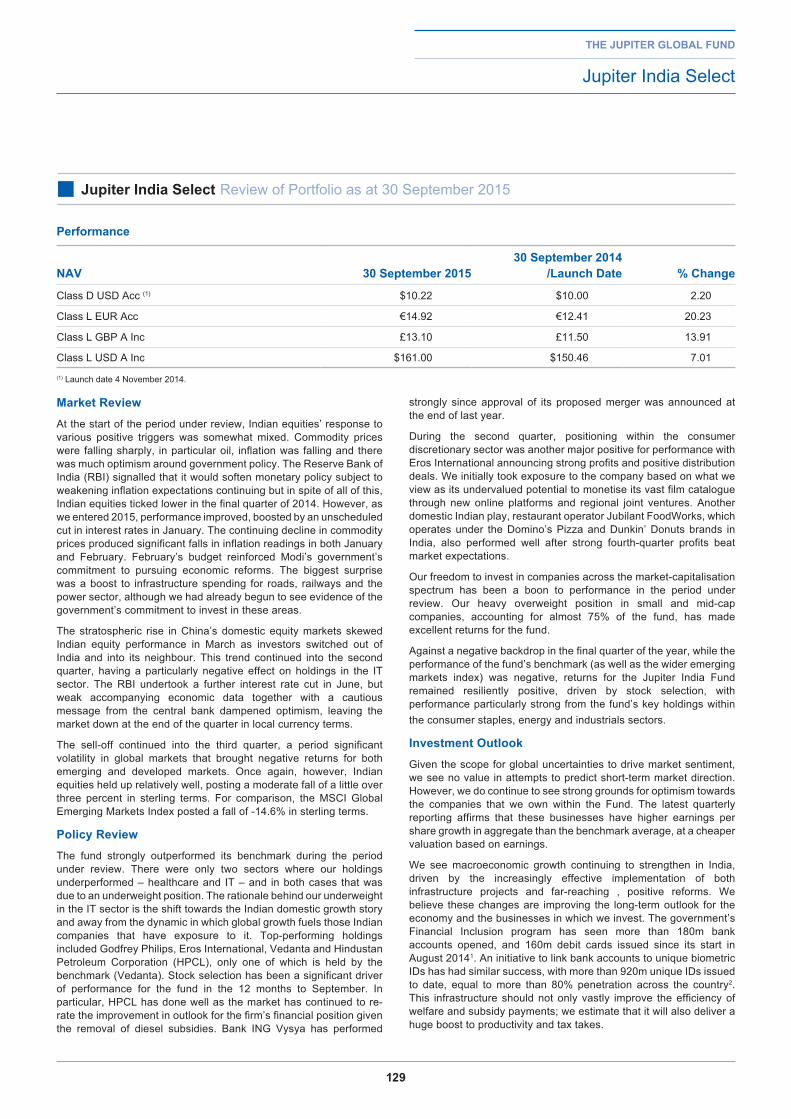
129
Market reviewAt the start of the period under review, Indian equities’ response to various positive triggers was somewhat mixed. Commodity prices were falling sharply, in particular oil, inflation was falling and there was much optimism around government policy. The Reserve Bank of India (RBI) signalled that it would soften monetary policy subject to weakening inflation expectations continuing but in spite of all of this, Indian equities ticked lower in the final quarter of 2014. However, as we entered 2015, performance improved, boosted by an unscheduled cut in interest rates in January. The continuing decline in commodity prices produced significant falls in inflation readings in both January and February. February’s budget reinforced Modi’s government’s commitment to pursuing economic reforms. The biggest surprise was a boost to infrastructure spending for roads, railways and the power sector, although we had already begun to see evidence of the government’s commitment to invest in these areas.
The stratospheric rise in China’s domestic equity markets skewed Indian equity performance in March as investors switched out of India and into its neighbour. This trend continued into the second quarter, having a particularly negative effect on holdings in the IT sector. The RBI undertook a further interest rate cut in June, but weak accompanying economic data together with a cautious message from the central bank dampened optimism, leaving the market down at the end of the quarter in local currency terms.
The sell-off continued into the third quarter, a period significant volatility in global markets that brought negative returns for both emerging and developed markets. Once again, however, Indian equities held up relatively well, posting a moderate fall of a little over three percent in sterling terms. For comparison, the MSCI Global Emerging Markets Index posted a fall of -14.6% in sterling terms.
policy reviewThe fund strongly outperformed its benchmark during the period under review. There were only two sectors where our holdings underperformed – healthcare and IT – and in both cases that was due to an underweight position. The rationale behind our underweight in the IT sector is the shift towards the Indian domestic growth story and away from the dynamic in which global growth fuels those Indian companies that have exposure to it. Top-performing holdings included Godfrey Philips, Eros International, Vedanta and Hindustan Petroleum Corporation (HPCL), only one of which is held by the benchmark (Vedanta). Stock selection has been a significant driver of performance for the fund in the 12 months to September. In particular, HPCL has done well as the market has continued to re-rate the improvement in outlook for the firm’s financial position given the removal of diesel subsidies. Bank ING Vysya has performed
strongly since approval of its proposed merger was announced at the end of last year.
During the second quarter, positioning within the consumer discretionary sector was another major positive for performance with Eros International announcing strong profits and positive distribution deals. We initially took exposure to the company based on what we view as its undervalued potential to monetise its vast film catalogue through new online platforms and regional joint ventures. Another domestic Indian play, restaurant operator Jubilant FoodWorks, which operates under the Domino’s Pizza and Dunkin’ Donuts brands in India, also performed well after strong fourth-quarter profits beat market expectations.
Our freedom to invest in companies across the market-capitalisation spectrum has been a boon to performance in the period under review. Our heavy overweight position in small and mid-cap companies, accounting for almost 75% of the fund, has made excellent returns for the fund.
Against a negative backdrop in the final quarter of the year, while the performance of the fund’s benchmark (as well as the wider emerging markets index) was negative, returns for the Jupiter India Fund remained resiliently positive, driven by stock selection, with performance particularly strong from the fund’s key holdings within the consumer staples, energy and industrials sectors.
investment outlookGiven the scope for global uncertainties to drive market sentiment, we see no value in attempts to predict short-term market direction. However, we do continue to see strong grounds for optimism towards the companies that we own within the Fund. The latest quarterly reporting affirms that these businesses have higher earnings per share growth in aggregate than the benchmark average, at a cheaper valuation based on earnings.
We see macroeconomic growth continuing to strengthen in India, driven by the increasingly effective implementation of both infrastructure projects and far-reaching , positive reforms. We believe these changes are improving the long-term outlook for the economy and the businesses in which we invest. The government’s Financial Inclusion program has seen more than 180m bank accounts opened, and 160m debit cards issued since its start in August 20141. An initiative to link bank accounts to unique biometric IDs has had similar success, with more than 920m unique IDs issued to date, equal to more than 80% penetration across the country2. This infrastructure should not only vastly improve the efficiency of welfare and subsidy payments; we estimate that it will also deliver a huge boost to productivity and tax takes.
the jupiter global fund
Jupiter India Select
■ jupiter india Select Review of Portfolio as at 30 September 2015
performance
naV 30 September 201530 September 2014
/launch date % Change
Class D USD Acc (1) $10.22 $10.00 2.20
Class L EUR Acc €14.92 €12.41 20.23
Class L GBP A Inc £13.10 £11.50 13.91
Class L USD A Inc $161.00 $150.46 7.01
(1) Launch date 4 November 2014.
130
investment outlook (continued)
The latest 0.5% cut in interest rates in September was in line with our expectations of continuing cuts during this business cycle. We believe lower inflation, helped by recent falls in oil and other commodity prices, will benefit the companies we invest in.
We see risks to the positive outlook, both internal and external. In spite of recent volatility on global equity markets, India has been among the best performing emerging markets, driven in no small part by domestic investors. There is no guarantee that changing global sentiment or a perceived setback for Narendra Modi’s pro-business government may not produce a sell-off on Indian bourses.
avinash Vaziranifund Manager
30 September 2015
1Source: Indian Ministry of Finance as at 30 September 2015.
2 Source: Kotak Securities Limited
the jupiter global fund
Jupiter India Select
■ jupiter india Select Review of Portfolio as at 30 September 2015 (continiued)
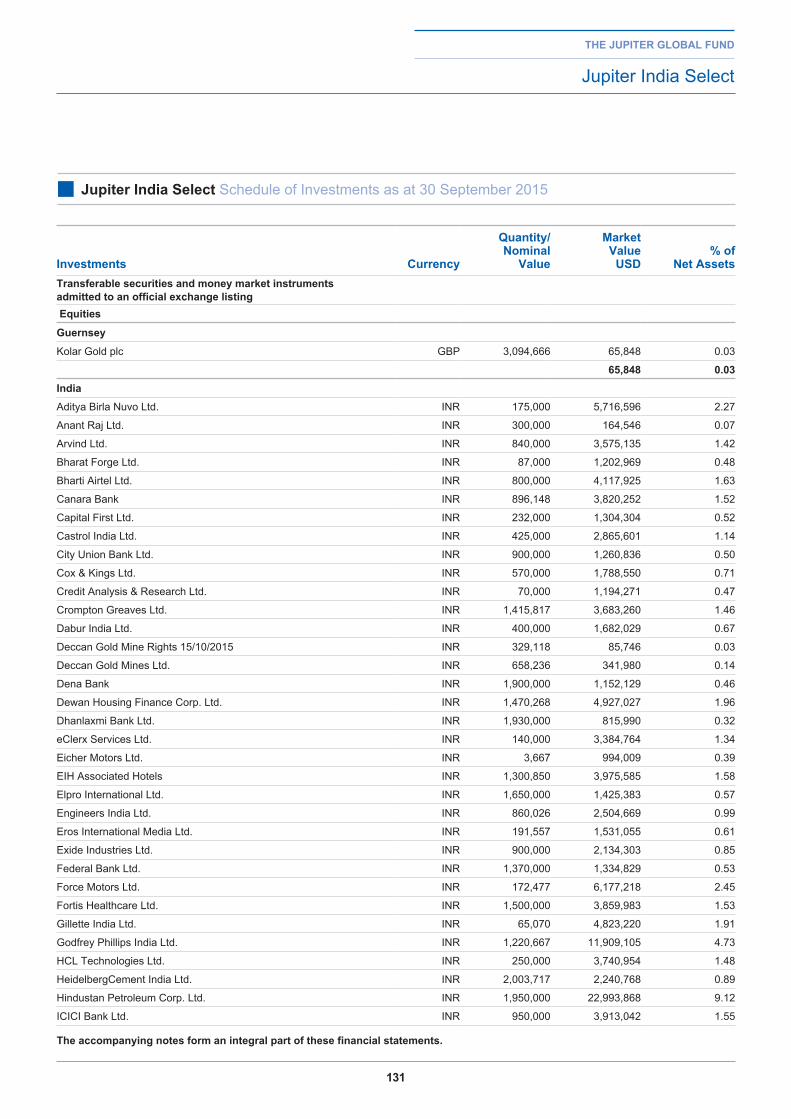
131
the jupiter global fund
Jupiter India Select
■ jupiter india Select Schedule of Investments as at 30 September 2015
investments Currency
Quantity/ nominal
Value
Market Value
uSd% of
net assetstransferable securities and money market instruments admitted to an official exchange listing equities
guernsey
Kolar Gold plc GBP 3,094,666 65,848 0.03
65,848 0.03indiaAditya Birla Nuvo Ltd. INR 175,000 5,716,596 2.27
Anant Raj Ltd. INR 300,000 164,546 0.07
Arvind Ltd. INR 840,000 3,575,135 1.42
Bharat Forge Ltd. INR 87,000 1,202,969 0.48
Bharti Airtel Ltd. INR 800,000 4,117,925 1.63
Canara Bank INR 896,148 3,820,252 1.52
Capital First Ltd. INR 232,000 1,304,304 0.52
Castrol India Ltd. INR 425,000 2,865,601 1.14
City Union Bank Ltd. INR 900,000 1,260,836 0.50
Cox & Kings Ltd. INR 570,000 1,788,550 0.71
Credit Analysis & Research Ltd. INR 70,000 1,194,271 0.47
Crompton Greaves Ltd. INR 1,415,817 3,683,260 1.46
Dabur India Ltd. INR 400,000 1,682,029 0.67
Deccan Gold Mine Rights 15/10/2015 INR 329,118 85,746 0.03
Deccan Gold Mines Ltd. INR 658,236 341,980 0.14
Dena Bank INR 1,900,000 1,152,129 0.46
Dewan Housing Finance Corp. Ltd. INR 1,470,268 4,927,027 1.96
Dhanlaxmi Bank Ltd. INR 1,930,000 815,990 0.32
eClerx Services Ltd. INR 140,000 3,384,764 1.34
Eicher Motors Ltd. INR 3,667 994,009 0.39
EIH Associated Hotels INR 1,300,850 3,975,585 1.58
Elpro International Ltd. INR 1,650,000 1,425,383 0.57
Engineers India Ltd. INR 860,026 2,504,669 0.99
Eros International Media Ltd. INR 191,557 1,531,055 0.61
Exide Industries Ltd. INR 900,000 2,134,303 0.85
Federal Bank Ltd. INR 1,370,000 1,334,829 0.53
Force Motors Ltd. INR 172,477 6,177,218 2.45
Fortis Healthcare Ltd. INR 1,500,000 3,859,983 1.53
Gillette India Ltd. INR 65,070 4,823,220 1.91
Godfrey Phillips India Ltd. INR 1,220,667 11,909,105 4.73
HCL Technologies Ltd. INR 250,000 3,740,954 1.48
HeidelbergCement India Ltd. INR 2,003,717 2,240,768 0.89
Hindustan Petroleum Corp. Ltd. INR 1,950,000 22,993,868 9.12
ICICI Bank Ltd. INR 950,000 3,913,042 1.55
the accompanying notes form an integral part of these financial statements.
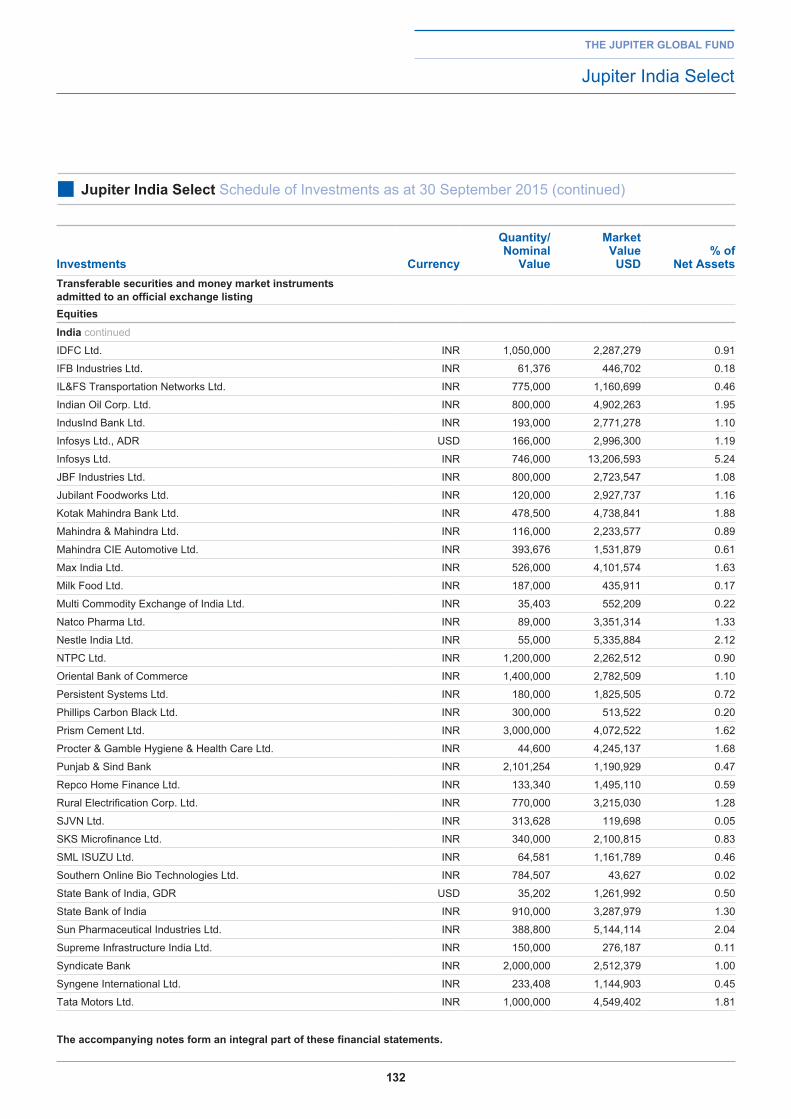
132
the jupiter global fund
Jupiter India Select
■ jupiter india Select Schedule of Investments as at 30 September 2015 (continued)
investments Currency
Quantity/ nominal
Value
Market Value
uSd% of
net assetstransferable securities and money market instruments admitted to an official exchange listingequitiesindia continued
IDFC Ltd. INR 1,050,000 2,287,279 0.91
IFB Industries Ltd. INR 61,376 446,702 0.18
IL&FS Transportation Networks Ltd. INR 775,000 1,160,699 0.46
Indian Oil Corp. Ltd. INR 800,000 4,902,263 1.95
IndusInd Bank Ltd. INR 193,000 2,771,278 1.10
Infosys Ltd., ADR USD 166,000 2,996,300 1.19
Infosys Ltd. INR 746,000 13,206,593 5.24
JBF Industries Ltd. INR 800,000 2,723,547 1.08
Jubilant Foodworks Ltd. INR 120,000 2,927,737 1.16
Kotak Mahindra Bank Ltd. INR 478,500 4,738,841 1.88
Mahindra & Mahindra Ltd. INR 116,000 2,233,577 0.89
Mahindra CIE Automotive Ltd. INR 393,676 1,531,879 0.61
Max India Ltd. INR 526,000 4,101,574 1.63
Milk Food Ltd. INR 187,000 435,911 0.17
Multi Commodity Exchange of India Ltd. INR 35,403 552,209 0.22
Natco Pharma Ltd. INR 89,000 3,351,314 1.33
Nestle India Ltd. INR 55,000 5,335,884 2.12
NTPC Ltd. INR 1,200,000 2,262,512 0.90
Oriental Bank of Commerce INR 1,400,000 2,782,509 1.10
Persistent Systems Ltd. INR 180,000 1,825,505 0.72
Phillips Carbon Black Ltd. INR 300,000 513,522 0.20
Prism Cement Ltd. INR 3,000,000 4,072,522 1.62
Procter & Gamble Hygiene & Health Care Ltd. INR 44,600 4,245,137 1.68
Punjab & Sind Bank INR 2,101,254 1,190,929 0.47
Repco Home Finance Ltd. INR 133,340 1,495,110 0.59
Rural Electrification Corp. Ltd. INR 770,000 3,215,030 1.28
SJVN Ltd. INR 313,628 119,698 0.05
SKS Microfinance Ltd. INR 340,000 2,100,815 0.83
SML ISUZU Ltd. INR 64,581 1,161,789 0.46
Southern Online Bio Technologies Ltd. INR 784,507 43,627 0.02
State Bank of India, GDR USD 35,202 1,261,992 0.50
State Bank of India INR 910,000 3,287,979 1.30
Sun Pharmaceutical Industries Ltd. INR 388,800 5,144,114 2.04
Supreme Infrastructure India Ltd. INR 150,000 276,187 0.11
Syndicate Bank INR 2,000,000 2,512,379 1.00
Syngene International Ltd. INR 233,408 1,144,903 0.45
Tata Motors Ltd. INR 1,000,000 4,549,402 1.81
the accompanying notes form an integral part of these financial statements.
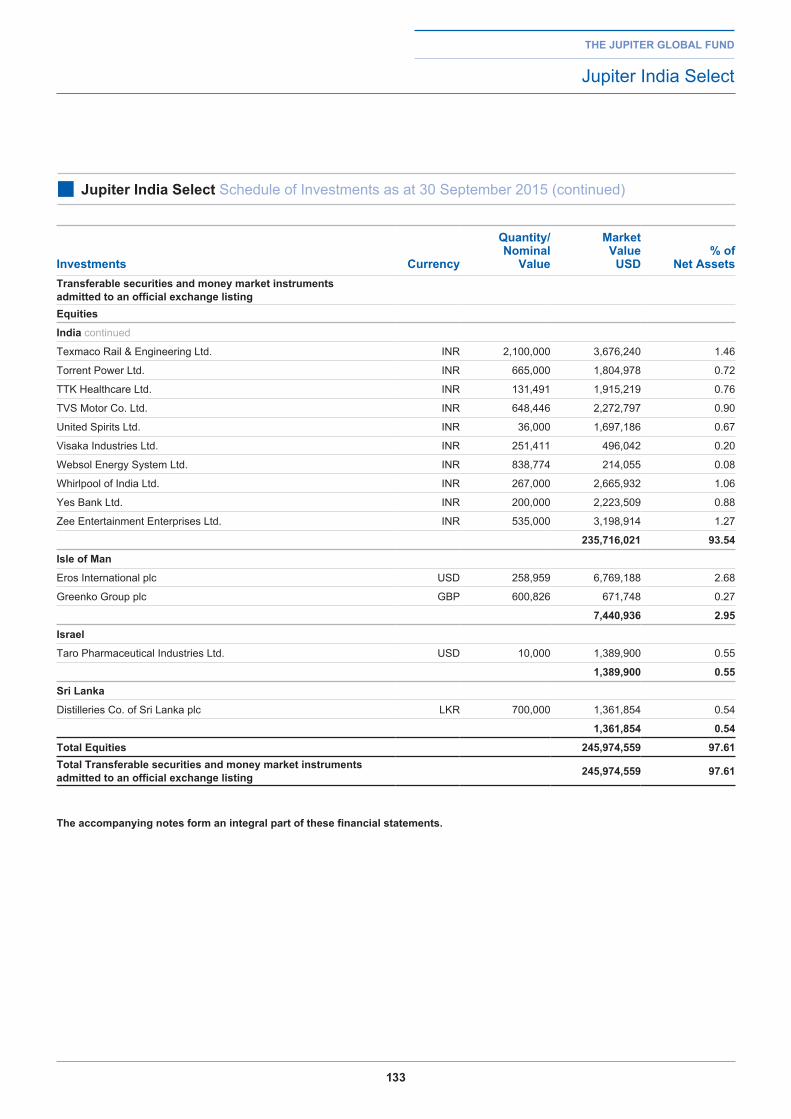
133
the jupiter global fund
Jupiter India Select
■ jupiter india Select Schedule of Investments as at 30 September 2015 (continued)
investments Currency
Quantity/ nominal
Value
Market Value
uSd% of
net assetstransferable securities and money market instruments admitted to an official exchange listingequities
india continued
Texmaco Rail & Engineering Ltd. INR 2,100,000 3,676,240 1.46
Torrent Power Ltd. INR 665,000 1,804,978 0.72
TTK Healthcare Ltd. INR 131,491 1,915,219 0.76
TVS Motor Co. Ltd. INR 648,446 2,272,797 0.90
United Spirits Ltd. INR 36,000 1,697,186 0.67
Visaka Industries Ltd. INR 251,411 496,042 0.20
Websol Energy System Ltd. INR 838,774 214,055 0.08
Whirlpool of India Ltd. INR 267,000 2,665,932 1.06
Yes Bank Ltd. INR 200,000 2,223,509 0.88
Zee Entertainment Enterprises Ltd. INR 535,000 3,198,914 1.27
235,716,021 93.54
isle of Man
Eros International plc USD 258,959 6,769,188 2.68
Greenko Group plc GBP 600,826 671,748 0.27
7,440,936 2.95
israel
Taro Pharmaceutical Industries Ltd. USD 10,000 1,389,900 0.55
1,389,900 0.55
Sri lanka
Distilleries Co. of Sri Lanka plc LKR 700,000 1,361,854 0.54
1,361,854 0.54
total equities 245,974,559 97.61total transferable securities and money market instruments admitted to an official exchange listing 245,974,559 97.61
the accompanying notes form an integral part of these financial statements.
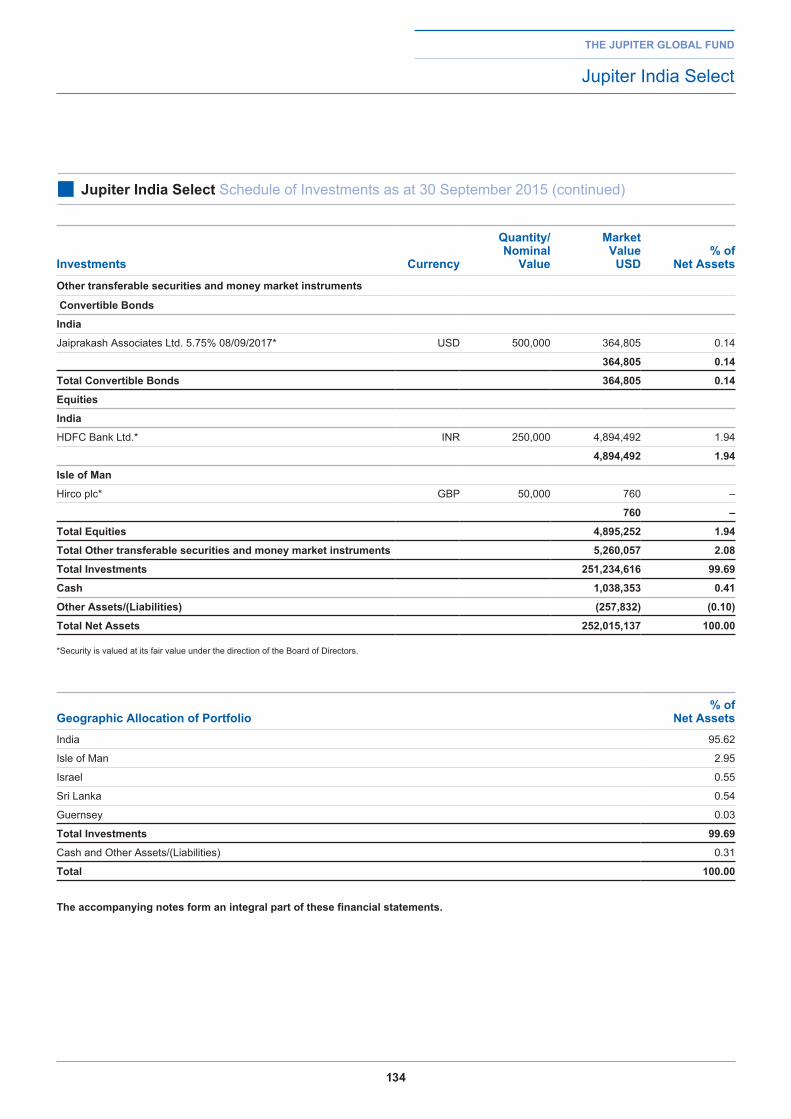
134
the jupiter global fund
Jupiter India Select
■ jupiter india Select Schedule of Investments as at 30 September 2015 (continued)
investments Currency
Quantity/ nominal
Value
Market Value
uSd% of
net assets
other transferable securities and money market instruments
Convertible bonds
india
Jaiprakash Associates Ltd. 5.75% 08/09/2017* USD 500,000 364,805 0.14
364,805 0.14
total Convertible bonds 364,805 0.14
equities
india
HDFC Bank Ltd.* INR 250,000 4,894,492 1.94
4,894,492 1.94
isle of Man
Hirco plc* GBP 50,000 760 –
760 –
total equities 4,895,252 1.94
total other transferable securities and money market instruments 5,260,057 2.08
total investments 251,234,616 99.69
Cash 1,038,353 0.41
other assets/(liabilities) (257,832) (0.10)
total net assets 252,015,137 100.00
*Security is valued at its fair value under the direction of the Board of Directors.
geographic allocation of portfolio% of
net assetsIndia 95.62
Isle of Man 2.95
Israel 0.55
Sri Lanka 0.54
Guernsey 0.03
total investments 99.69
Cash and Other Assets/(Liabilities) 0.31
total 100.00
the accompanying notes form an integral part of these financial statements.
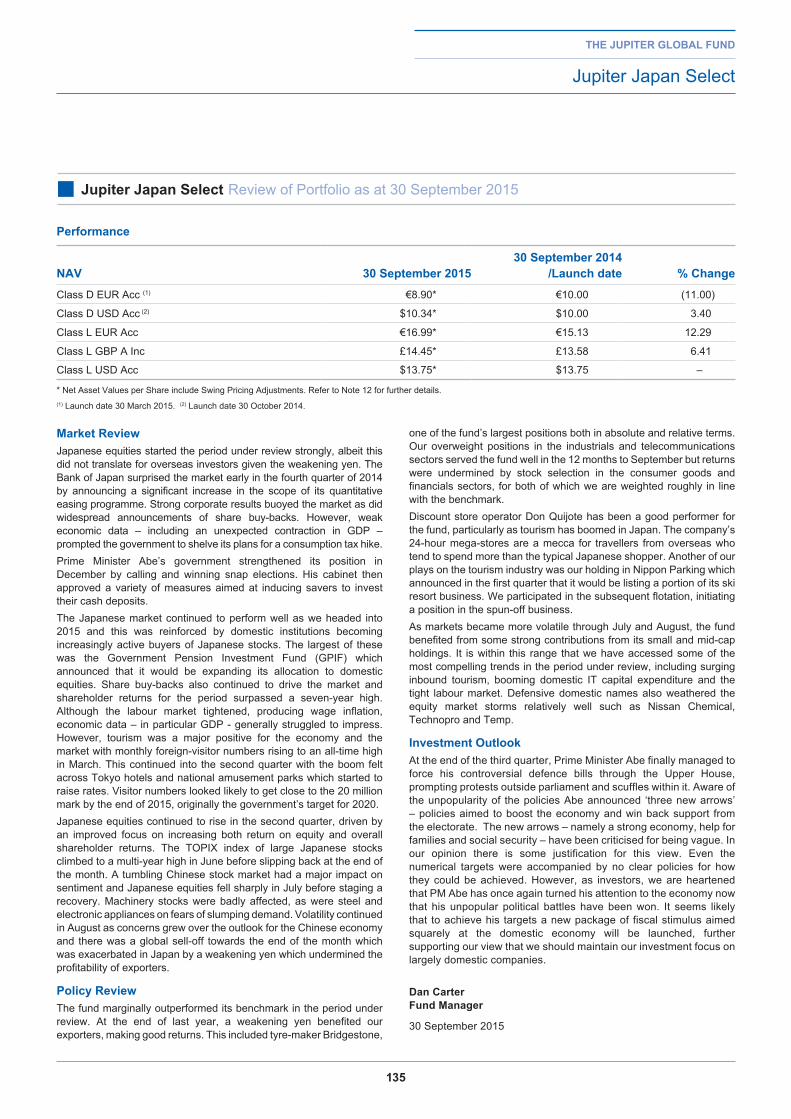
135
Market reviewJapanese equities started the period under review strongly, albeit this did not translate for overseas investors given the weakening yen. The Bank of Japan surprised the market early in the fourth quarter of 2014 by announcing a significant increase in the scope of its quantitative easing programme. Strong corporate results buoyed the market as did widespread announcements of share buy-backs. However, weak economic data – including an unexpected contraction in GDP – prompted the government to shelve its plans for a consumption tax hike. Prime Minister Abe’s government strengthened its position in December by calling and winning snap elections. His cabinet then approved a variety of measures aimed at inducing savers to invest their cash deposits. The Japanese market continued to perform well as we headed into 2015 and this was reinforced by domestic institutions becoming increasingly active buyers of Japanese stocks. The largest of these was the Government Pension Investment Fund (GPIF) which announced that it would be expanding its allocation to domestic equities. Share buy-backs also continued to drive the market and shareholder returns for the period surpassed a seven-year high. Although the labour market tightened, producing wage inflation, economic data – in particular GDP - generally struggled to impress. However, tourism was a major positive for the economy and the market with monthly foreign-visitor numbers rising to an all-time high in March. This continued into the second quarter with the boom felt across Tokyo hotels and national amusement parks which started to raise rates. Visitor numbers looked likely to get close to the 20 million mark by the end of 2015, originally the government’s target for 2020. Japanese equities continued to rise in the second quarter, driven by an improved focus on increasing both return on equity and overall shareholder returns. The TOPIX index of large Japanese stocks climbed to a multi-year high in June before slipping back at the end of the month. A tumbling Chinese stock market had a major impact on sentiment and Japanese equities fell sharply in July before staging a recovery. Machinery stocks were badly affected, as were steel and electronic appliances on fears of slumping demand. Volatility continued in August as concerns grew over the outlook for the Chinese economy and there was a global sell-off towards the end of the month which was exacerbated in Japan by a weakening yen which undermined the profitability of exporters.
policy reviewThe fund marginally outperformed its benchmark in the period under review. At the end of last year, a weakening yen benefited our exporters, making good returns. This included tyre-maker Bridgestone,
one of the fund’s largest positions both in absolute and relative terms. Our overweight positions in the industrials and telecommunications sectors served the fund well in the 12 months to September but returns were undermined by stock selection in the consumer goods and financials sectors, for both of which we are weighted roughly in line with the benchmark.Discount store operator Don Quijote has been a good performer for the fund, particularly as tourism has boomed in Japan. The company’s 24-hour mega-stores are a mecca for travellers from overseas who tend to spend more than the typical Japanese shopper. Another of our plays on the tourism industry was our holding in Nippon Parking which announced in the first quarter that it would be listing a portion of its ski resort business. We participated in the subsequent flotation, initiating a position in the spun-off business. As markets became more volatile through July and August, the fund benefited from some strong contributions from its small and mid-cap holdings. It is within this range that we have accessed some of the most compelling trends in the period under review, including surging inbound tourism, booming domestic IT capital expenditure and the tight labour market. Defensive domestic names also weathered the equity market storms relatively well such as Nissan Chemical, Technopro and Temp.
investment outlookAt the end of the third quarter, Prime Minister Abe finally managed to force his controversial defence bills through the Upper House, prompting protests outside parliament and scuffles within it. Aware of the unpopularity of the policies Abe announced ‘three new arrows’ – policies aimed to boost the economy and win back support from the electorate. The new arrows – namely a strong economy, help for families and social security – have been criticised for being vague. In our opinion there is some justification for this view. Even the numerical targets were accompanied by no clear policies for how they could be achieved. However, as investors, we are heartened that PM Abe has once again turned his attention to the economy now that his unpopular political battles have been won. It seems likely that to achieve his targets a new package of fiscal stimulus aimed squarely at the domestic economy will be launched, further supporting our view that we should maintain our investment focus on largely domestic companies.
dan Carterfund Manager
30 September 2015
the jupiter global fund
Jupiter Japan Select
■ jupiter japan Select Review of Portfolio as at 30 September 2015
performance
naV 30 September 201530 September 2014
/launch date % ChangeClass D EUR Acc (1) €8.90* €10.00 (11.00)
Class D USD Acc (2) $10.34* $10.00 3.40
Class L EUR Acc €16.99* €15.13 12.29
Class L GBP A Inc £14.45* £13.58 6.41
Class L USD Acc $13.75* $13.75 –
* Net Asset Values per Share include Swing Pricing Adjustments. Refer to Note 12 for further details.(1) Launch date 30 March 2015. (2) Launch date 30 October 2014.
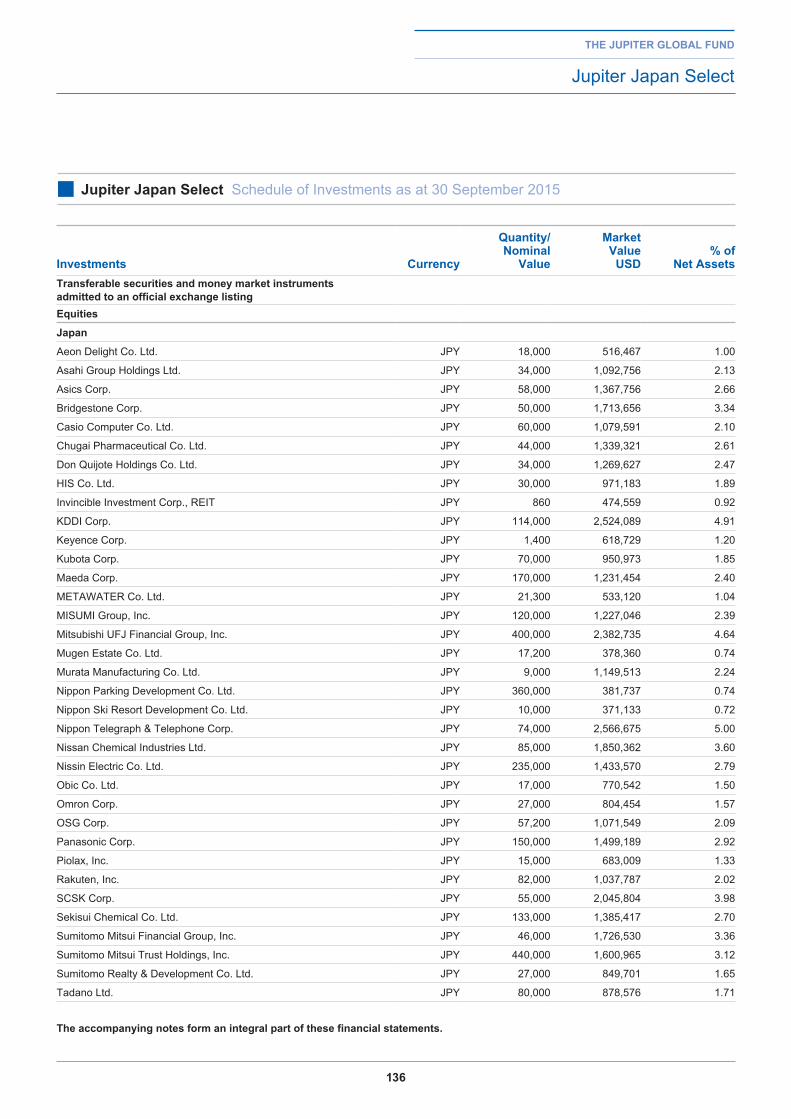
136
the jupiter global fund
Jupiter Japan Select
■ jupiter japan Select Schedule of Investments as at 30 September 2015
investments Currency
Quantity/ nominal
Value
Market Value
uSd% of
net assetstransferable securities and money market instruments admitted to an official exchange listingequities
japan
Aeon Delight Co. Ltd. JPY 18,000 516,467 1.00
Asahi Group Holdings Ltd. JPY 34,000 1,092,756 2.13
Asics Corp. JPY 58,000 1,367,756 2.66
Bridgestone Corp. JPY 50,000 1,713,656 3.34
Casio Computer Co. Ltd. JPY 60,000 1,079,591 2.10
Chugai Pharmaceutical Co. Ltd. JPY 44,000 1,339,321 2.61
Don Quijote Holdings Co. Ltd. JPY 34,000 1,269,627 2.47
HIS Co. Ltd. JPY 30,000 971,183 1.89
Invincible Investment Corp., REIT JPY 860 474,559 0.92
KDDI Corp. JPY 114,000 2,524,089 4.91
Keyence Corp. JPY 1,400 618,729 1.20
Kubota Corp. JPY 70,000 950,973 1.85
Maeda Corp. JPY 170,000 1,231,454 2.40
METAWATER Co. Ltd. JPY 21,300 533,120 1.04
MISUMI Group, Inc. JPY 120,000 1,227,046 2.39
Mitsubishi UFJ Financial Group, Inc. JPY 400,000 2,382,735 4.64
Mugen Estate Co. Ltd. JPY 17,200 378,360 0.74
Murata Manufacturing Co. Ltd. JPY 9,000 1,149,513 2.24
Nippon Parking Development Co. Ltd. JPY 360,000 381,737 0.74
Nippon Ski Resort Development Co. Ltd. JPY 10,000 371,133 0.72
Nippon Telegraph & Telephone Corp. JPY 74,000 2,566,675 5.00
Nissan Chemical Industries Ltd. JPY 85,000 1,850,362 3.60
Nissin Electric Co. Ltd. JPY 235,000 1,433,570 2.79
Obic Co. Ltd. JPY 17,000 770,542 1.50
Omron Corp. JPY 27,000 804,454 1.57
OSG Corp. JPY 57,200 1,071,549 2.09
Panasonic Corp. JPY 150,000 1,499,189 2.92
Piolax, Inc. JPY 15,000 683,009 1.33
Rakuten, Inc. JPY 82,000 1,037,787 2.02
SCSK Corp. JPY 55,000 2,045,804 3.98
Sekisui Chemical Co. Ltd. JPY 133,000 1,385,417 2.70
Sumitomo Mitsui Financial Group, Inc. JPY 46,000 1,726,530 3.36
Sumitomo Mitsui Trust Holdings, Inc. JPY 440,000 1,600,965 3.12
Sumitomo Realty & Development Co. Ltd. JPY 27,000 849,701 1.65
Tadano Ltd. JPY 80,000 878,576 1.71
the accompanying notes form an integral part of these financial statements.
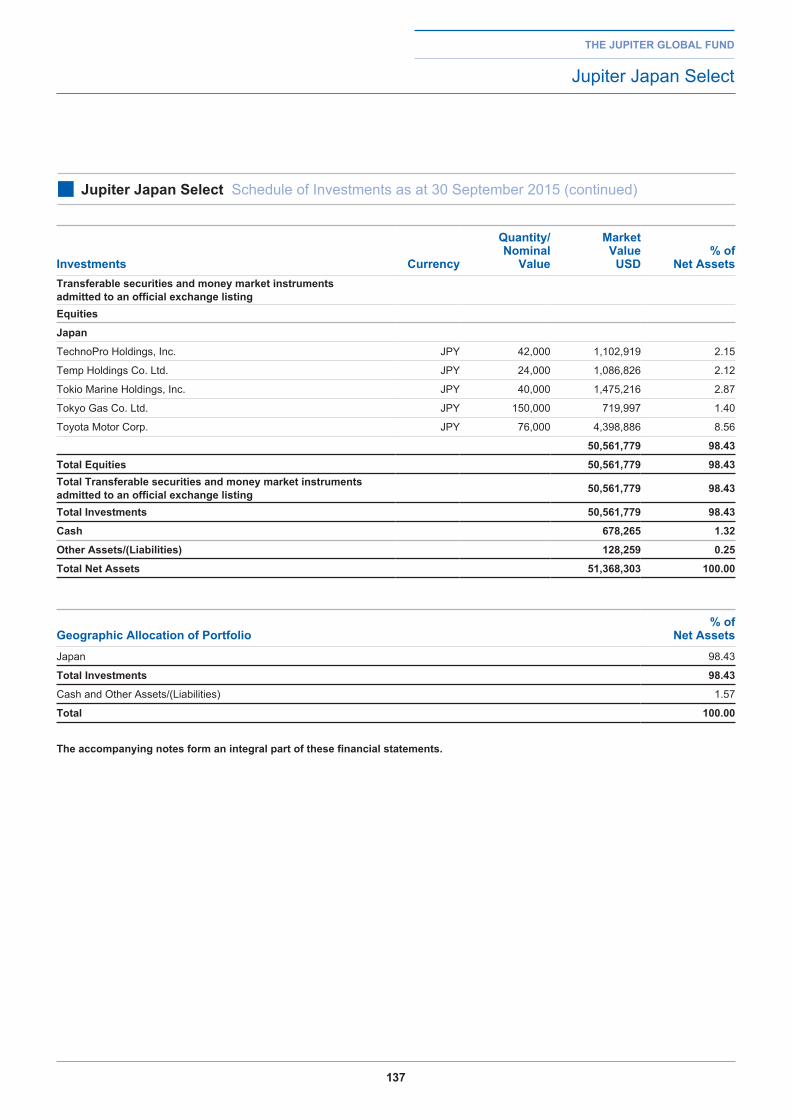
137
the jupiter global fund
Jupiter Japan Select
■ jupiter japan Select Schedule of Investments as at 30 September 2015 (continued)
investments Currency
Quantity/ nominal
Value
Market Value
uSd% of
net assetstransferable securities and money market instruments admitted to an official exchange listingequities
japan
TechnoPro Holdings, Inc. JPY 42,000 1,102,919 2.15
Temp Holdings Co. Ltd. JPY 24,000 1,086,826 2.12
Tokio Marine Holdings, Inc. JPY 40,000 1,475,216 2.87
Tokyo Gas Co. Ltd. JPY 150,000 719,997 1.40
Toyota Motor Corp. JPY 76,000 4,398,886 8.56
50,561,779 98.43
total equities 50,561,779 98.43total transferable securities and money market instruments admitted to an official exchange listing 50,561,779 98.43
total investments 50,561,779 98.43
Cash 678,265 1.32
other assets/(liabilities) 128,259 0.25
total net assets 51,368,303 100.00
geographic allocation of portfolio% of
net assetsJapan 98.43
total investments 98.43
Cash and Other Assets/(Liabilities) 1.57
total 100.00
the accompanying notes form an integral part of these financial statements.
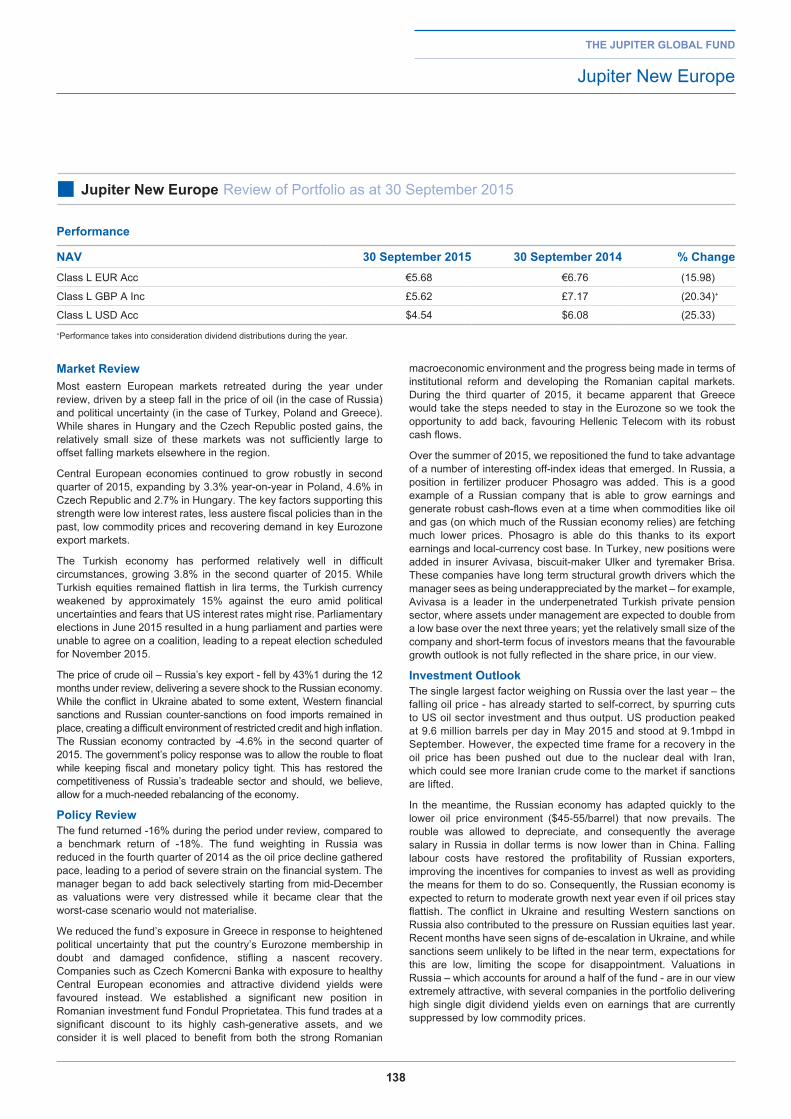
138
Market reviewMost eastern European markets retreated during the year under review, driven by a steep fall in the price of oil (in the case of Russia) and political uncertainty (in the case of Turkey, Poland and Greece). While shares in Hungary and the Czech Republic posted gains, the relatively small size of these markets was not sufficiently large to offset falling markets elsewhere in the region.
Central European economies continued to grow robustly in second quarter of 2015, expanding by 3.3% year-on-year in Poland, 4.6% in Czech Republic and 2.7% in Hungary. The key factors supporting this strength were low interest rates, less austere fiscal policies than in the past, low commodity prices and recovering demand in key Eurozone export markets.
The Turkish economy has performed relatively well in difficult circumstances, growing 3.8% in the second quarter of 2015. While Turkish equities remained flattish in lira terms, the Turkish currency weakened by approximately 15% against the euro amid political uncertainties and fears that US interest rates might rise. Parliamentary elections in June 2015 resulted in a hung parliament and parties were unable to agree on a coalition, leading to a repeat election scheduled for November 2015.
The price of crude oil – Russia’s key export - fell by 43%1 during the 12 months under review, delivering a severe shock to the Russian economy. While the conflict in Ukraine abated to some extent, Western financial sanctions and Russian counter-sanctions on food imports remained in place, creating a difficult environment of restricted credit and high inflation. The Russian economy contracted by -4.6% in the second quarter of 2015. The government’s policy response was to allow the rouble to float while keeping fiscal and monetary policy tight. This has restored the competitiveness of Russia’s tradeable sector and should, we believe, allow for a much-needed rebalancing of the economy.
policy reviewThe fund returned -16% during the period under review, compared to a benchmark return of -18%. The fund weighting in Russia was reduced in the fourth quarter of 2014 as the oil price decline gathered pace, leading to a period of severe strain on the financial system. The manager began to add back selectively starting from mid-December as valuations were very distressed while it became clear that the worst-case scenario would not materialise.
We reduced the fund’s exposure in Greece in response to heightened political uncertainty that put the country’s Eurozone membership in doubt and damaged confidence, stifling a nascent recovery. Companies such as Czech Komercni Banka with exposure to healthy Central European economies and attractive dividend yields were favoured instead. We established a significant new position in Romanian investment fund Fondul Proprietatea. This fund trades at a significant discount to its highly cash-generative assets, and we consider it is well placed to benefit from both the strong Romanian
macroeconomic environment and the progress being made in terms of institutional reform and developing the Romanian capital markets. During the third quarter of 2015, it became apparent that Greece would take the steps needed to stay in the Eurozone so we took the opportunity to add back, favouring Hellenic Telecom with its robust cash flows.
Over the summer of 2015, we repositioned the fund to take advantage of a number of interesting off-index ideas that emerged. In Russia, a position in fertilizer producer Phosagro was added. This is a good example of a Russian company that is able to grow earnings and generate robust cash-flows even at a time when commodities like oil and gas (on which much of the Russian economy relies) are fetching much lower prices. Phosagro is able do this thanks to its export earnings and local-currency cost base. In Turkey, new positions were added in insurer Avivasa, biscuit-maker Ulker and tyremaker Brisa. These companies have long term structural growth drivers which the manager sees as being underappreciated by the market – for example, Avivasa is a leader in the underpenetrated Turkish private pension sector, where assets under management are expected to double from a low base over the next three years; yet the relatively small size of the company and short-term focus of investors means that the favourable growth outlook is not fully reflected in the share price, in our view.
investment outlookThe single largest factor weighing on Russia over the last year – the falling oil price - has already started to self-correct, by spurring cuts to US oil sector investment and thus output. US production peaked at 9.6 million barrels per day in May 2015 and stood at 9.1mbpd in September. However, the expected time frame for a recovery in the oil price has been pushed out due to the nuclear deal with Iran, which could see more Iranian crude come to the market if sanctions are lifted.
In the meantime, the Russian economy has adapted quickly to the lower oil price environment ($45-55/barrel) that now prevails. The rouble was allowed to depreciate, and consequently the average salary in Russia in dollar terms is now lower than in China. Falling labour costs have restored the profitability of Russian exporters, improving the incentives for companies to invest as well as providing the means for them to do so. Consequently, the Russian economy is expected to return to moderate growth next year even if oil prices stay flattish. The conflict in Ukraine and resulting Western sanctions on Russia also contributed to the pressure on Russian equities last year. Recent months have seen signs of de-escalation in Ukraine, and while sanctions seem unlikely to be lifted in the near term, expectations for this are low, limiting the scope for disappointment. Valuations in Russia – which accounts for around a half of the fund - are in our view extremely attractive, with several companies in the portfolio delivering high single digit dividend yields even on earnings that are currently suppressed by low commodity prices.
the jupiter global fund
Jupiter New Europe
■ jupiter new europe Review of Portfolio as at 30 September 2015
performance
naV 30 September 2015 30 September 2014 % ChangeClass L EUR Acc €5.68 €6.76 (15.98)
Class L GBP A Inc £5.62 £7.17 (20.34)+
Class L USD Acc $4.54 $6.08 (25.33)+Performance takes into consideration dividend distributions during the year.
139
investment outlook (continued)
Elsewhere in the region, elections could lead to progress in resolving some of the political uncertainty that has weighed on equity markets over the past year. In Poland for example, we may see greater clarity on the taxation of banks in coming months, while in Turkey, November’s repeat election may represent a step towards breaking the current political impasse; even in the event of another inconclusive result, it seems unlikely any of the parties will be keen to call a third election. We have identified a number of companies across Central Europe and Turkey whose valuations we feel do not fully reflect the ongoing changes in their earnings outlook, which in our opinion creates the potential to deliver above average returns.
Colin Croftfund Manager
30 September 2015
the jupiter global fund
Jupiter New Europe
■ jupiter new europe Review of Portfolio as at 30 September 2015
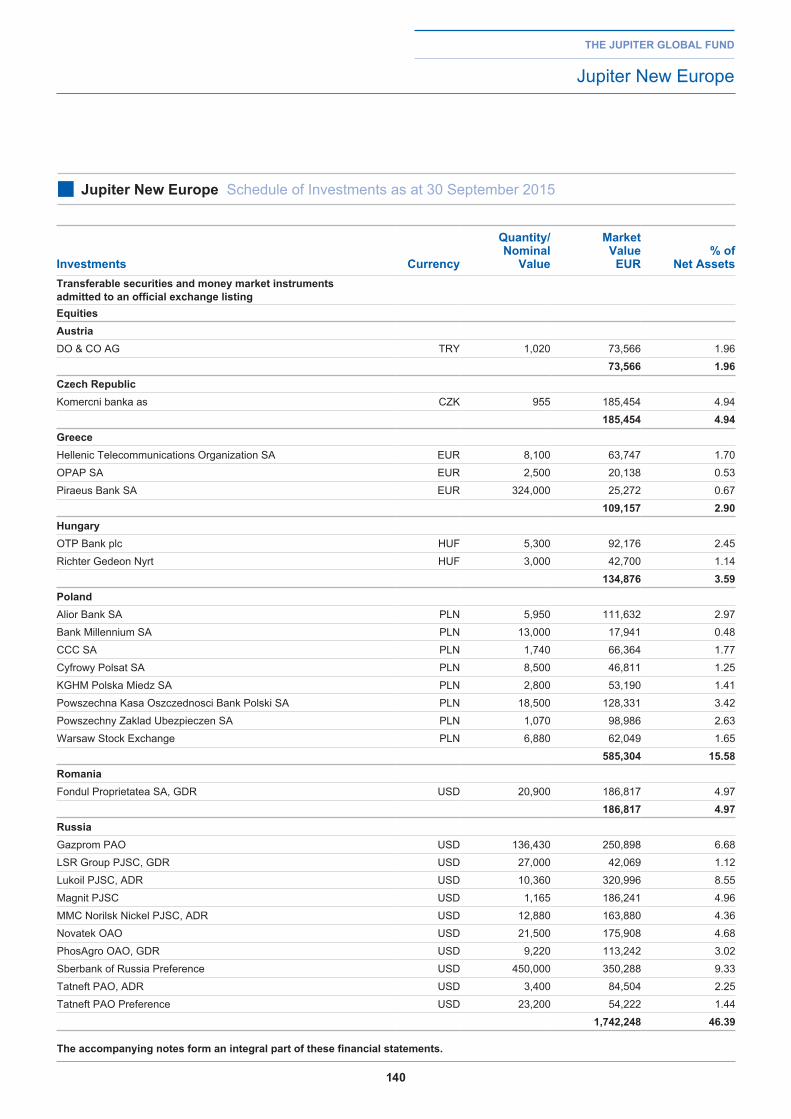
140
the jupiter global fund
Jupiter New Europe
■ jupiter new europe Schedule of Investments as at 30 September 2015
investments Currency
Quantity/ nominal
Value
Market Value
eur% of
net assetstransferable securities and money market instruments admitted to an official exchange listingequitiesaustriaDO & CO AG TRY 1,020 73,566 1.96
73,566 1.96Czech republicKomercni banka as CZK 955 185,454 4.94
185,454 4.94greeceHellenic Telecommunications Organization SA EUR 8,100 63,747 1.70
OPAP SA EUR 2,500 20,138 0.53
Piraeus Bank SA EUR 324,000 25,272 0.67
109,157 2.90hungaryOTP Bank plc HUF 5,300 92,176 2.45
Richter Gedeon Nyrt HUF 3,000 42,700 1.14
134,876 3.59polandAlior Bank SA PLN 5,950 111,632 2.97
Bank Millennium SA PLN 13,000 17,941 0.48
CCC SA PLN 1,740 66,364 1.77
Cyfrowy Polsat SA PLN 8,500 46,811 1.25
KGHM Polska Miedz SA PLN 2,800 53,190 1.41
Powszechna Kasa Oszczednosci Bank Polski SA PLN 18,500 128,331 3.42
Powszechny Zaklad Ubezpieczen SA PLN 1,070 98,986 2.63
Warsaw Stock Exchange PLN 6,880 62,049 1.65
585,304 15.58romaniaFondul Proprietatea SA, GDR USD 20,900 186,817 4.97
186,817 4.97russiaGazprom PAO USD 136,430 250,898 6.68
LSR Group PJSC, GDR USD 27,000 42,069 1.12
Lukoil PJSC, ADR USD 10,360 320,996 8.55
Magnit PJSC USD 1,165 186,241 4.96
MMC Norilsk Nickel PJSC, ADR USD 12,880 163,880 4.36
Novatek OAO USD 21,500 175,908 4.68
PhosAgro OAO, GDR USD 9,220 113,242 3.02
Sberbank of Russia Preference USD 450,000 350,288 9.33
Tatneft PAO, ADR USD 3,400 84,504 2.25
Tatneft PAO Preference USD 23,200 54,222 1.44
1,742,248 46.39
the accompanying notes form an integral part of these financial statements.
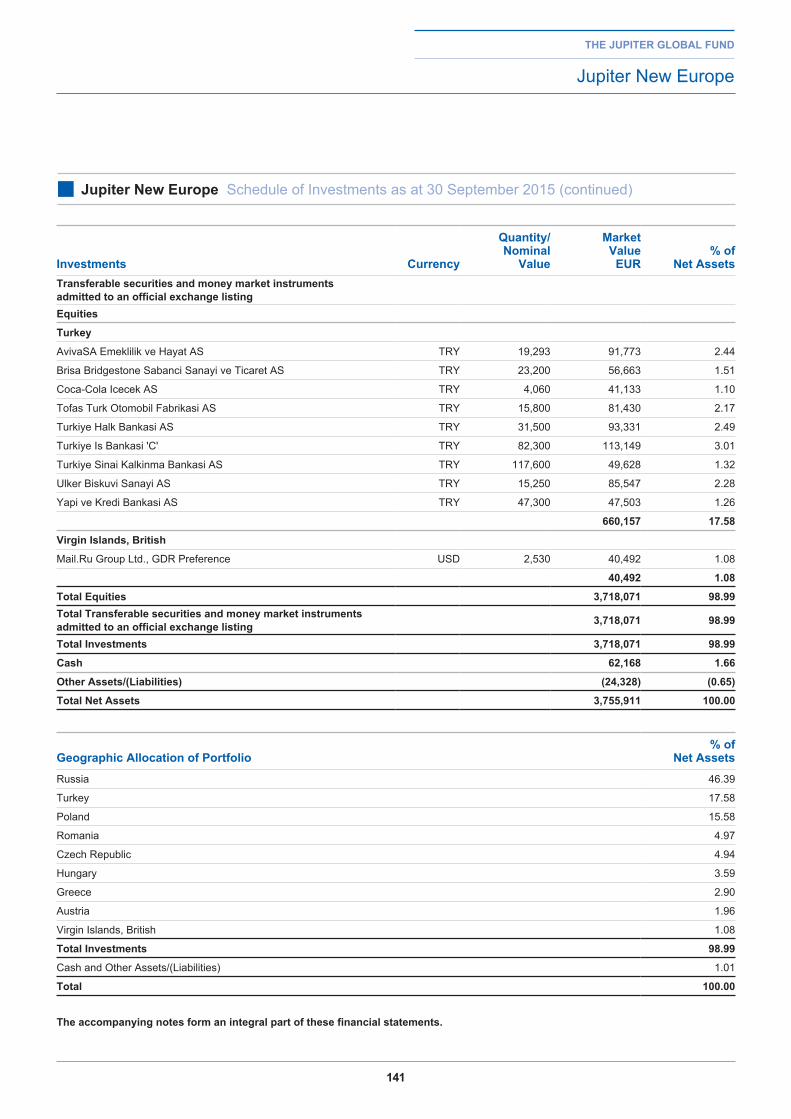
141
the jupiter global fund
Jupiter New Europe
■ jupiter new europe Schedule of Investments as at 30 September 2015 (continued)
investments Currency
Quantity/ nominal
Value
Market Value
eur% of
net assetstransferable securities and money market instruments admitted to an official exchange listingequities
turkey
AvivaSA Emeklilik ve Hayat AS TRY 19,293 91,773 2.44
Brisa Bridgestone Sabanci Sanayi ve Ticaret AS TRY 23,200 56,663 1.51
Coca-Cola Icecek AS TRY 4,060 41,133 1.10
Tofas Turk Otomobil Fabrikasi AS TRY 15,800 81,430 2.17
Turkiye Halk Bankasi AS TRY 31,500 93,331 2.49
Turkiye Is Bankasi 'C' TRY 82,300 113,149 3.01
Turkiye Sinai Kalkinma Bankasi AS TRY 117,600 49,628 1.32
Ulker Biskuvi Sanayi AS TRY 15,250 85,547 2.28
Yapi ve Kredi Bankasi AS TRY 47,300 47,503 1.26
660,157 17.58
Virgin islands, british
Mail.Ru Group Ltd., GDR Preference USD 2,530 40,492 1.08
40,492 1.08
total equities 3,718,071 98.99total transferable securities and money market instruments admitted to an official exchange listing 3,718,071 98.99
total investments 3,718,071 98.99
Cash 62,168 1.66
other assets/(liabilities) (24,328) (0.65)
total net assets 3,755,911 100.00
geographic allocation of portfolio% of
net assetsRussia 46.39
Turkey 17.58
Poland 15.58
Romania 4.97
Czech Republic 4.94
Hungary 3.59
Greece 2.90
Austria 1.96
Virgin Islands, British 1.08
total investments 98.99
Cash and Other Assets/(Liabilities) 1.01
total 100.00
the accompanying notes form an integral part of these financial statements.
142
Market reviewAt the start of the period under review, the Bureau of Economic Analysis announced that the US economy had grown at the annualised amount of 5% in the third quarter of 2014, beating previous estimates and market expectations. It was the fastest pace of growth since the third quarter of 2003. Equities continued to rally into the end of the year, despite the conclusion of quantitative easing, and the dollar continued to strengthen. The implications of a strong dollar are that goods exported to the US become cheaper thereby giving consumers more ‘bang for their buck’, or US importers a bigger profit margin. While some oil producers were hit by the sharp fall in the oil price, overall, the effective ‘tax cut’ was beneficial for the US consumer.
There was more of a disconnect between economic performance and that of the equity markets as we headed into 2015. While supportive economic data emerged, equity performance was lacklustre in January and February. A dove-ish statement from the Federal Reserve (Fed) in March that pushed back the likelihood of an interest rate rise prompted a pick-up towards the end of the quarter. The Fed identified two areas of focus when considering an interest rate rise: a further pick-up in the labour market and inflation approaching its 2% target. US equities were relatively stable for much of the second quarter but the escalating crisis in Greece in June pulled global stock markets lower. Meanwhile the US unemployment rate fell to 5.3% in June, a seven-year low. At its policy meeting the Fed sought to draw attention to the contrast between the expansion of the US economy and the increasingly fraught situation in the Eurozone. While official forecasts kept the possibility of increases in 2015 open, sentiment began to judge it less likely.
The final months in the period under review were turbulent and the US equity market lost ground. Weighing on sentiment were the devaluation of the Chinese currency, the economic slowdown in emerging markets and the negative connotations of the continued absence of a rate rise.
performance reviewWith central bank policies generally continuing to encourage risk taking, our value approach to investing underperformed. At its core the fund looks for a margin of safety in the valuations it pays for its investments. The extraordinary monetary stimulus of the last few years has led to some parts of the market becoming expensive by historical standards. These are areas we are staying clear of even if it costs us short term performance as we are unwilling to risk losing capital where we do not have the support of favourable valuations.
Growth and momentum strategies were very much in favour this year. As a result, a relatively narrow range of fickle consumer stocks (Amazon, Apple, Walk Disney, Google, Facebook and Netflix) led the performance of the index. These stocks, which were not held in the fund, tend to be popular among some investors who seemingly had a boundless tolerance for high valuations.
In sector terms, the market’s preference for aggressive growth areas such as biotech continued to be a relative headwind, as did our cautious stance towards technology where we maintained an underweight exposure. Contrasting this was the relative success of our overweight in the financial sector (e.g. JPMorgan and AIG); in our view, this is an area that offers good value for businesses exposed to an eventual pickup in interest rates, are at the lower end of their earnings cycles (and therefore have scope to improve when the cycle turns) and are trading at valuations that appear low compared to their historical averages.
Our stock selection was generally positive for relative performance. Healthcare stock CVS made the greatest contribution to relative performance, but other stocks in other sectors performed well even in cases where those sectors were temporarily out of favour. Thanks to the sharp drop in oil prices, our holdings in Halliburton and Chevron were among the biggest detractors from performance during the period. Our holding in cash also held back performance in a rising market.
outlookRecent stock market volatility has once again highlighted the difficulty faced by the US Federal Reserve as it attempts to normalise interest rate policy and wean financial markets and the global economy off its accommodative policies. The prospect of a relatively small nominal increase of 0.25% has contributed to a sharp sell-off in global equities at a time when China’s economy appears to be slowing sharply. At the time of writing, the jury was out about whether an interest rate rise would in fact occur in late 2015 given mounting fears that the economic problems facing emerging markets may start to hamper growth in the West. In this complex environment of inflated valuations, we remain disciplined in our approach, aiming not to overpay for holdings and seeking out pockets of value where we believe they remain in areas such as large financial companies.
Sebastian radcliffefund Manager
30 September 2015
the jupiter global fund
Jupiter North American Equities
■ jupiter north american equities Review of Portfolio as at 30 September 2015
performance
naV 30 September 201530 September 2014
/launch date % Change
Class D EUR Acc (1) €10.21* €10.00 2.10
Class D USD Acc (2) $9.27* $10.00 (7.30)
Class L EUR Acc €18.25* €18.08* 0.94
Class L GBP A Inc £17.10* £17.87* (4.31)
Class L USD Acc $16.88* $18.78* (10.12)
* Net Asset Values per Share include Swing Pricing Adjustments. Refer to Note 12 for further details.(1) Launch date 30 October 2014. (2) Launch date 24 October 2014.
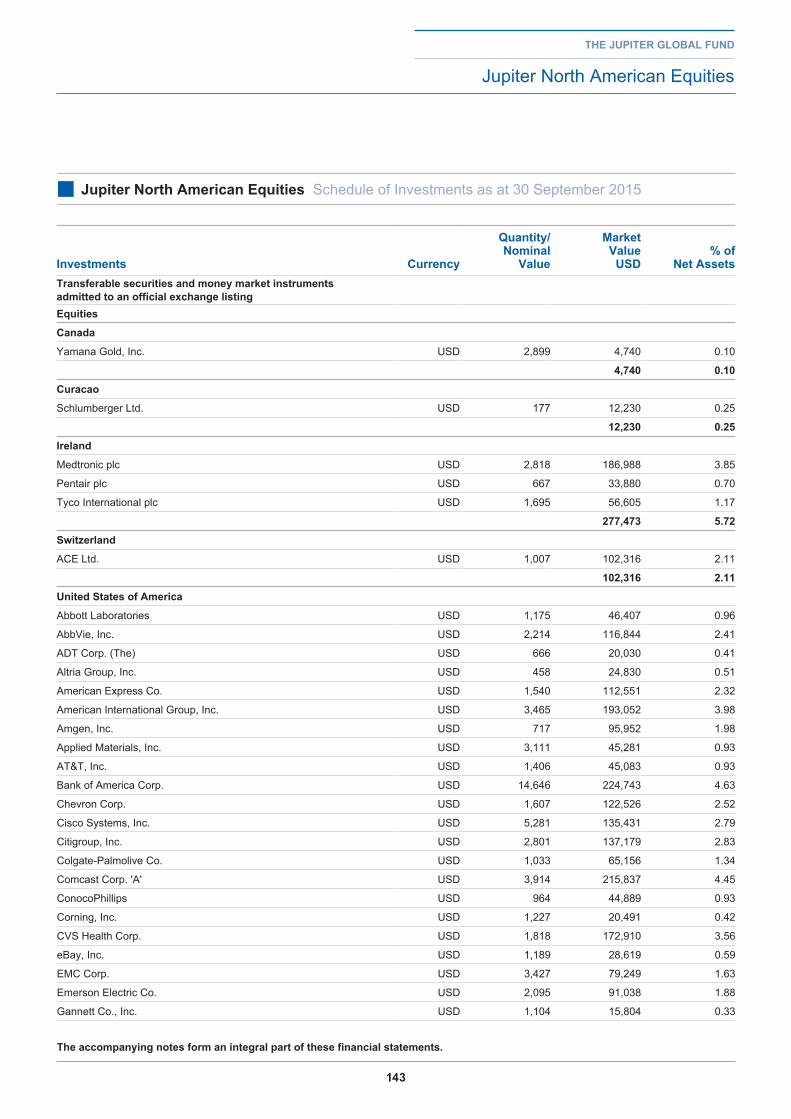
143
the jupiter global fund
Jupiter North American Equities
■ jupiter north american equities Schedule of Investments as at 30 September 2015
investments Currency
Quantity/ nominal
Value
Market Value
uSd% of
net assetstransferable securities and money market instruments admitted to an official exchange listingequities
Canada
Yamana Gold, Inc. USD 2,899 4,740 0.10
4,740 0.10
Curacao
Schlumberger Ltd. USD 177 12,230 0.25
12,230 0.25
ireland
Medtronic plc USD 2,818 186,988 3.85
Pentair plc USD 667 33,880 0.70
Tyco International plc USD 1,695 56,605 1.17
277,473 5.72
Switzerland
ACE Ltd. USD 1,007 102,316 2.11
102,316 2.11
united States of america
Abbott Laboratories USD 1,175 46,407 0.96
AbbVie, Inc. USD 2,214 116,844 2.41
ADT Corp. (The) USD 666 20,030 0.41
Altria Group, Inc. USD 458 24,830 0.51
American Express Co. USD 1,540 112,551 2.32
American International Group, Inc. USD 3,465 193,052 3.98
Amgen, Inc. USD 717 95,952 1.98
Applied Materials, Inc. USD 3,111 45,281 0.93
AT&T, Inc. USD 1,406 45,083 0.93
Bank of America Corp. USD 14,646 224,743 4.63
Chevron Corp. USD 1,607 122,526 2.52
Cisco Systems, Inc. USD 5,281 135,431 2.79
Citigroup, Inc. USD 2,801 137,179 2.83
Colgate-Palmolive Co. USD 1,033 65,156 1.34
Comcast Corp. 'A' USD 3,914 215,837 4.45
ConocoPhillips USD 964 44,889 0.93
Corning, Inc. USD 1,227 20,491 0.42
CVS Health Corp. USD 1,818 172,910 3.56
eBay, Inc. USD 1,189 28,619 0.59
EMC Corp. USD 3,427 79,249 1.63
Emerson Electric Co. USD 2,095 91,038 1.88
Gannett Co., Inc. USD 1,104 15,804 0.33
the accompanying notes form an integral part of these financial statements.
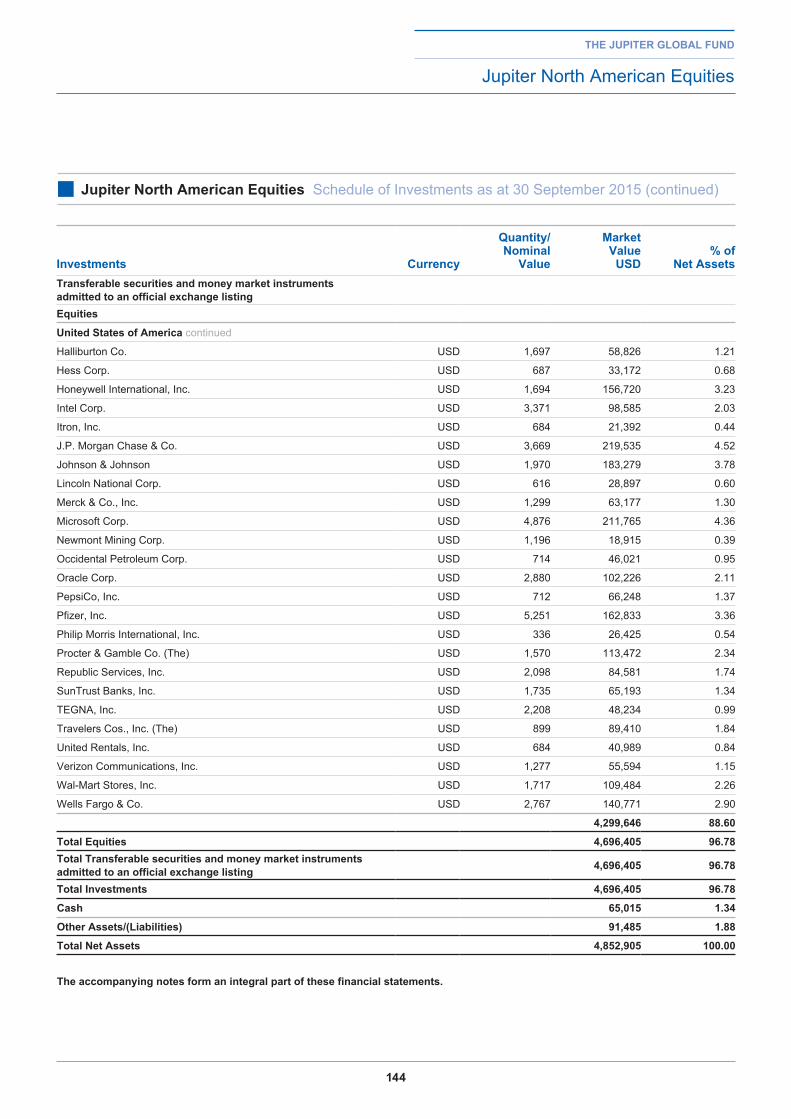
144
the jupiter global fund
Jupiter North American Equities
■ jupiter north american equities Schedule of Investments as at 30 September 2015 (continued)
investments Currency
Quantity/ nominal
Value
Market Value
uSd% of
net assetstransferable securities and money market instruments admitted to an official exchange listingequities
united States of america continued
Halliburton Co. USD 1,697 58,826 1.21
Hess Corp. USD 687 33,172 0.68
Honeywell International, Inc. USD 1,694 156,720 3.23
Intel Corp. USD 3,371 98,585 2.03
Itron, Inc. USD 684 21,392 0.44
J.P. Morgan Chase & Co. USD 3,669 219,535 4.52
Johnson & Johnson USD 1,970 183,279 3.78
Lincoln National Corp. USD 616 28,897 0.60
Merck & Co., Inc. USD 1,299 63,177 1.30
Microsoft Corp. USD 4,876 211,765 4.36
Newmont Mining Corp. USD 1,196 18,915 0.39
Occidental Petroleum Corp. USD 714 46,021 0.95
Oracle Corp. USD 2,880 102,226 2.11
PepsiCo, Inc. USD 712 66,248 1.37
Pfizer, Inc. USD 5,251 162,833 3.36
Philip Morris International, Inc. USD 336 26,425 0.54
Procter & Gamble Co. (The) USD 1,570 113,472 2.34
Republic Services, Inc. USD 2,098 84,581 1.74
SunTrust Banks, Inc. USD 1,735 65,193 1.34
TEGNA, Inc. USD 2,208 48,234 0.99
Travelers Cos., Inc. (The) USD 899 89,410 1.84
United Rentals, Inc. USD 684 40,989 0.84
Verizon Communications, Inc. USD 1,277 55,594 1.15
Wal-Mart Stores, Inc. USD 1,717 109,484 2.26
Wells Fargo & Co. USD 2,767 140,771 2.90
4,299,646 88.60
total equities 4,696,405 96.78total transferable securities and money market instruments admitted to an official exchange listing 4,696,405 96.78
total investments 4,696,405 96.78
Cash 65,015 1.34
other assets/(liabilities) 91,485 1.88
total net assets 4,852,905 100.00
the accompanying notes form an integral part of these financial statements.
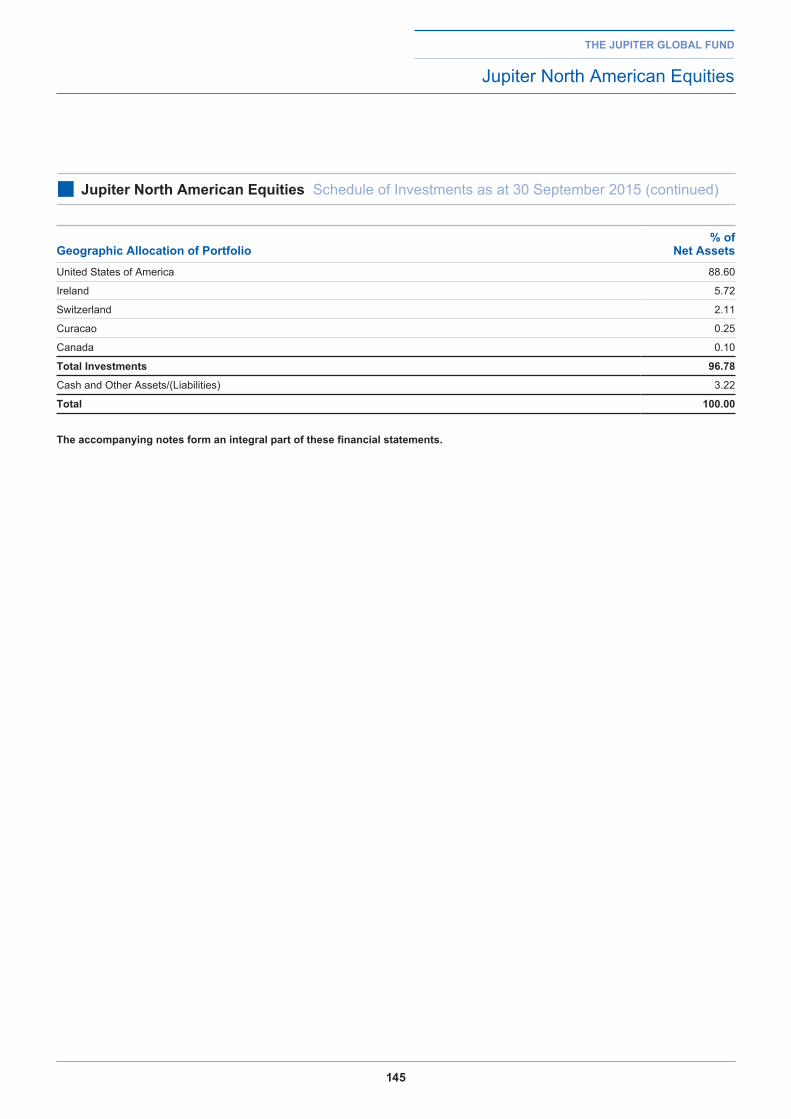
145
the jupiter global fund
Jupiter North American Equities
■ jupiter north american equities Schedule of Investments as at 30 September 2015 (continued)
geographic allocation of portfolio% of
net assetsUnited States of America 88.60
Ireland 5.72
Switzerland 2.11
Curacao 0.25
Canada 0.10
total investments 96.78
Cash and Other Assets/(Liabilities) 3.22
total 100.00
the accompanying notes form an integral part of these financial statements.
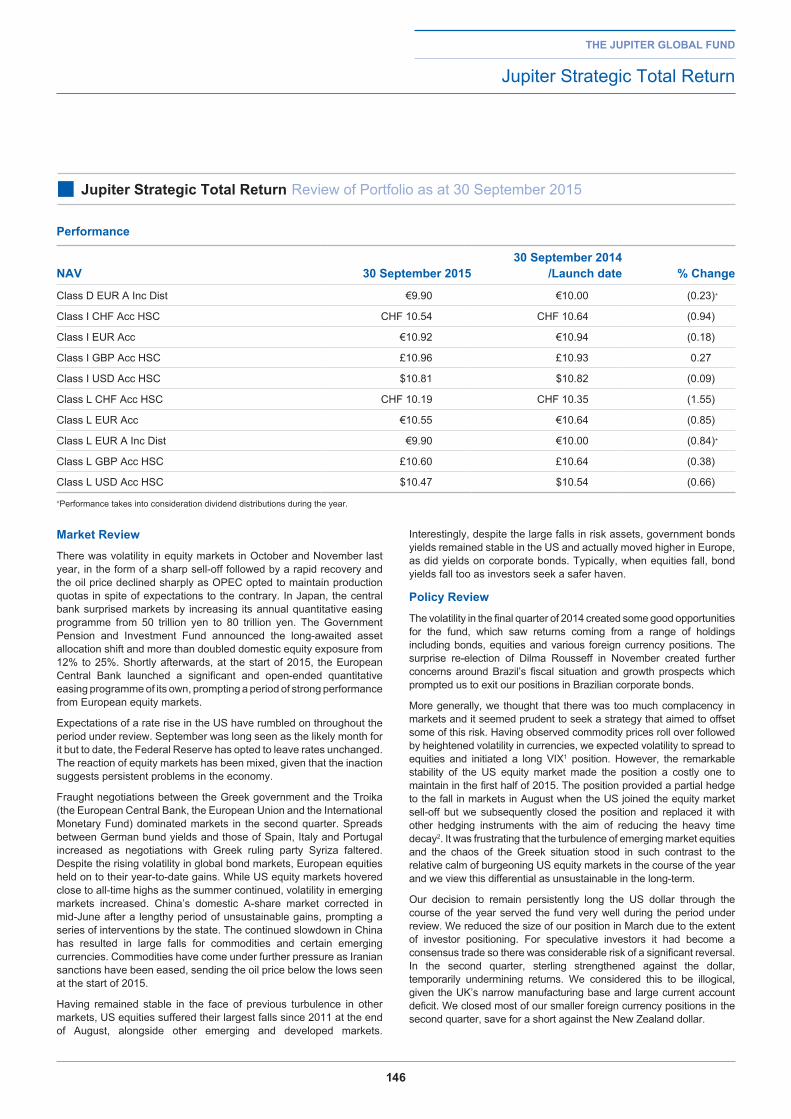
146
Market reviewThere was volatility in equity markets in October and November last year, in the form of a sharp sell-off followed by a rapid recovery and the oil price declined sharply as OPEC opted to maintain production quotas in spite of expectations to the contrary. In Japan, the central bank surprised markets by increasing its annual quantitative easing programme from 50 trillion yen to 80 trillion yen. The Government Pension and Investment Fund announced the long-awaited asset allocation shift and more than doubled domestic equity exposure from 12% to 25%. Shortly afterwards, at the start of 2015, the European Central Bank launched a significant and open-ended quantitative easing programme of its own, prompting a period of strong performance from European equity markets.
Expectations of a rate rise in the US have rumbled on throughout the period under review. September was long seen as the likely month for it but to date, the Federal Reserve has opted to leave rates unchanged. The reaction of equity markets has been mixed, given that the inaction suggests persistent problems in the economy.
Fraught negotiations between the Greek government and the Troika (the European Central Bank, the European Union and the International Monetary Fund) dominated markets in the second quarter. Spreads between German bund yields and those of Spain, Italy and Portugal increased as negotiations with Greek ruling party Syriza faltered. Despite the rising volatility in global bond markets, European equities held on to their year-to-date gains. While US equity markets hovered close to all-time highs as the summer continued, volatility in emerging markets increased. China’s domestic A-share market corrected in mid-June after a lengthy period of unsustainable gains, prompting a series of interventions by the state. The continued slowdown in China has resulted in large falls for commodities and certain emerging currencies. Commodities have come under further pressure as Iranian sanctions have been eased, sending the oil price below the lows seen at the start of 2015.
Having remained stable in the face of previous turbulence in other markets, US equities suffered their largest falls since 2011 at the end of August, alongside other emerging and developed markets.
Interestingly, despite the large falls in risk assets, government bonds yields remained stable in the US and actually moved higher in Europe, as did yields on corporate bonds. Typically, when equities fall, bond yields fall too as investors seek a safer haven.
policy reviewThe volatility in the final quarter of 2014 created some good opportunities for the fund, which saw returns coming from a range of holdings including bonds, equities and various foreign currency positions. The surprise re-election of Dilma Rousseff in November created further concerns around Brazil’s fiscal situation and growth prospects which prompted us to exit our positions in Brazilian corporate bonds.
More generally, we thought that there was too much complacency in markets and it seemed prudent to seek a strategy that aimed to offset some of this risk. Having observed commodity prices roll over followed by heightened volatility in currencies, we expected volatility to spread to equities and initiated a long VIX1 position. However, the remarkable stability of the US equity market made the position a costly one to maintain in the first half of 2015. The position provided a partial hedge to the fall in markets in August when the US joined the equity market sell-off but we subsequently closed the position and replaced it with other hedging instruments with the aim of reducing the heavy time decay2. It was frustrating that the turbulence of emerging market equities and the chaos of the Greek situation stood in such contrast to the relative calm of burgeoning US equity markets in the course of the year and we view this differential as unsustainable in the long-term.
Our decision to remain persistently long the US dollar through the course of the year served the fund very well during the period under review. We reduced the size of our position in March due to the extent of investor positioning. For speculative investors it had become a consensus trade so there was considerable risk of a significant reversal. In the second quarter, sterling strengthened against the dollar, temporarily undermining returns. We considered this to be illogical, given the UK’s narrow manufacturing base and large current account deficit. We closed most of our smaller foreign currency positions in the second quarter, save for a short against the New Zealand dollar.
the jupiter global fund
Jupiter Strategic Total Return
■ jupiter Strategic total return Review of Portfolio as at 30 September 2015
performance
naV 30 September 201530 September 2014
/launch date % Change
Class D EUR A Inc Dist €9.90 €10.00 (0.23)+
Class I CHF Acc HSC CHF 10.54 CHF 10.64 (0.94)
Class I EUR Acc €10.92 €10.94 (0.18)
Class I GBP Acc HSC £10.96 £10.93 0.27
Class I USD Acc HSC $10.81 $10.82 (0.09)
Class L CHF Acc HSC CHF 10.19 CHF 10.35 (1.55)
Class L EUR Acc €10.55 €10.64 (0.85)
Class L EUR A Inc Dist €9.90 €10.00 (0.84)+
Class L GBP Acc HSC £10.60 £10.64 (0.38)
Class L USD Acc HSC $10.47 $10.54 (0.66)
+Performance takes into consideration dividend distributions during the year.
147
policy review (continued)
Equity holdings were a detractor from performance at the end of the summer due to the generalised large fall in equities. The zenith was Monday 24th August when activity in US equity markets was such that the VIX index could not be published for the first thirty minutes of the day. A significant proportion of the volume and price moves that day were due to quantitative and hedging strategies as well as ETF (exchange-traded fund) trading.
outlookOur strategic view is driven by the fact that several years of extreme monetary intervention by global central banks have inflated bond and share prices. We think the prolonged intervention has engendered a false sense of confidence in market stability.
Since 2009, investors have generally been rewarded for investing on the assumption that central banks will back stop them. However, going forward we believe investors should expect a more challenging environment.
Our concern is that a prolonged build up of debt within the system has contributed to uncertainty about the capacity to cope with any future disturbances. For example, in August China disrupted markets by a surprise devaluation of the yuan.
Capital outflows from emerging markets, concerns about currency volatility and growth have brought the valuations of certain Asian equities down to the low end of their historical ranges. We expect further declines in developed and emerging markets, so patience is warranted but we think the sell-off has begun to provide certain interesting opportunities. We think that Japan can offer attractive investment opportunities in equities as it progressively becomes more shareholder friendly.
Miles geldard and lee Manzifund Managers
30 September 2015
1 The VIX, or volatility index, is based on the S&P 500 index. Colloquially known as the Fear Index, it is a forward-looking representation of the degree of equity market volatility investors expect in the short term (30 days).2 An option is a fixed term tradable contact offering the right but not the obligation to buy or sell at a predetermined price. As the expiry date approaches, the value of the option can (in some circumstances) decrease or decay. If it looks like the option is unlikely to be profitably exercised its time value will decay rapidly.
the jupiter global fund
Jupiter Strategic Total Return
■ jupiter Strategic total return Review of Portfolio as at 30 September 2015 (continued)
148
the jupiter global fund
Jupiter Strategic Total Return
■ jupiter Strategic total return Schedule of Investments as at 30 September 2015
investments Currency
Quantity/ nominal
Value
Market Value
eur% of
net assetstransferable securities and money market instruments admitted to an official exchange listing bonds
australia
Australia & New Zealand Banking Group Ltd., FRN 0.381% 28/10/2019 EUR 2,500,000 2,492,000 1.49
2,492,000 1.49
brazil
Itau Unibanco Holding SA 2.85% 26/05/2018 USD 900,000 744,895 0.45
744,895 0.45
Canada
Bank of Nova Scotia (The), FRN 0.345% 10/09/2018 EUR 2,500,000 2,497,225 1.50
2,497,225 1.50
Cayman islands
QNB Finance Ltd., FRN 1.547% 31/10/2016 USD 1,051,000 941,111 0.56
QNB Finance Ltd. 2.125% 14/02/2018 USD 2,625,000 2,351,450 1.41
Thames Water Utilities Cayman Finance Ltd. 3.25% 09/11/2016 EUR 2,000,000 2,065,220 1.24
5,357,781 3.21
Cyprus
Cyprus Government International Bond 4.75% 25/06/2019 EUR 800,000 851,188 0.51
851,188 0.51
denmark
Danske Bank A/S 4% 09/12/2015 GBP 1,800,000 2,453,056 1.47
2,453,056 1.47
finland
UPM-Kymmene OYJ 6.625% 23/01/2017 GBP 700,000 1,004,195 0.60
1,004,195 0.60
france
Banque Federative du Credit Mutuel SA, FRN 0.683% 20/03/2019 EUR 2,300,000 2,319,331 1.39
BPCE SA, FRN 0.462% 13/01/2016 EUR 1,900,000 1,902,118 1.14
Caisse d'Amortissement de la Dette Sociale 1% 07/03/2018 GBP 1,900,000 2,570,644 1.54
Carrefour Banque SA, FRN 0.687% 21/03/2018 EUR 2,533,000 2,550,782 1.53
Cie de Saint-Gobain 5.625% 15/12/2016 GBP 1,600,000 2,268,784 1.36
Societe Generale SA, FRN 0.251% 16/01/2017 EUR 900,000 900,995 0.54
Total Capital International SA 1% 12/08/2016 USD 2,657,000 2,375,058 1.42
Total Capital International SA, FRN 0.879% 01/07/2019 GBP 1,600,000 2,159,235 1.30
17,046,947 10.22
the accompanying notes form an integral part of these financial statements.
149
the jupiter global fund
Jupiter Strategic Total Return
■ jupiter Strategic total return Schedule of Investments as at 30 September 2015 (continued)
investments Currency
Quantity/ nominal
Value
Market Value
eur% of
net assetstransferable securities and money market instruments admitted to an official exchange listingbonds
germany
BASF SE 1.375% 15/12/2017 GBP 1,600,000 2,175,486 1.30
Bayer AG 1.125% 24/01/2018 EUR 1,500,000 1,527,532 0.92
Bayer AG 5.625% 23/05/2018 GBP 1,500,000 2,253,316 1.35
Unitymedia Hessen GmbH & Co. KG 4% 15/01/2025 EUR 1,650,000 1,562,599 0.94
7,518,933 4.51
india
Power Finance Corp. Ltd. 8.36% 26/02/2020 INR 100,000,000 1,359,265 0.81
Power Grid Corp. of India Ltd. 8.7% 15/07/2023 INR 50,000,000 699,645 0.42
Rural Electrification Corp. Ltd. 9.02% 18/06/2019 INR 50,000,000 697,552 0.42
2,756,462 1.65
ireland
Caterpillar International Finance Ltd., FRN 0.27% 23/05/2016 EUR 1,900,000 1,901,833 1.14
1,901,833 1.14
italy
Enel SpA 3.5% 26/02/2016 EUR 2,000,000 2,026,640 1.21
2,026,640 1.21
jersey
AA Bond Co. Ltd. 3.781% 31/07/2019 GBP 592,000 822,866 0.49
AA Bond Co. Ltd. 5.5% 31/07/2022 GBP 578,000 744,150 0.45
1,567,016 0.94
luxembourg
Gazprom OAO 3.85% 06/02/2020 USD 1,300,000 1,069,318 0.64
Play Finance 2 SA 5.25% 01/02/2019 EUR 800,000 816,204 0.49
Wind Acquisition Finance SA 4% 15/07/2020 EUR 800,000 791,980 0.47
2,677,502 1.60
netherlands
BMW Finance NV, FRN 0.335% 04/04/2017 EUR 2,000,000 1,995,730 1.20
ING Bank NV 3.875% 23/12/2016 GBP 1,000,000 1,393,583 0.83
Shell International Finance BV, FRN 0.362% 15/09/2019 EUR 2,500,000 2,495,325 1.50
5,884,638 3.53
new Zealand
Westpac Securities NZ Ltd., FRN 0.365% 10/03/2017 EUR 2,300,000 2,306,360 1.38
2,306,360 1.38
norway
Eksportfinans ASA 5.5% 25/05/2016 USD 2,000,000 1,827,755 1.10
1,827,755 1.10
the accompanying notes form an integral part of these financial statements.
150
the jupiter global fund
Jupiter Strategic Total Return
■ jupiter Strategic total return Schedule of Investments as at 30 September 2015 (continued)
investments Currency
Quantity/ nominal
Value
Market Value
eur% of
net assetstransferable securities and money market instruments admitted to an official exchange listingbonds
Spain
Santander Consumer Finance SA 1.15% 02/10/2015 EUR 2,100,000 2,100,063 1.26
2,100,063 1.26
Sweden
Swedbank AB, FRN 0.475% 18/08/2020 EUR 2,000,000 2,005,570 1.20
2,005,570 1.20
Switzerland
Credit Suisse AG, FRN 0.431% 16/10/2019 EUR 2,747,000 2,741,781 1.64
UBS AG 6.375% 20/07/2016 GBP 1,500,000 2,114,210 1.27
4,855,991 2.91
united Kingdom
Abbey National Treasury Services plc, FRN 0.595% 22/05/2019 EUR 2,000,000 2,000,000 1.20
Admiral Group plc 5.5% 25/07/2024 GBP 600,000 808,896 0.48
British Telecommunications plc 8.5% 07/12/2016 GBP 1,400,000 2,047,216 1.23
FCE Bank plc 5.125% 16/11/2015 GBP 1,500,000 2,043,451 1.22
Henderson UK Finance plc 7.25% 24/03/2016 GBP 700,000 967,214 0.58
Hutchison Ports UK Finance plc 6.75% 07/12/2015 GBP 1,400,000 1,917,504 1.15
Imperial Tobacco Finance plc 5.5% 22/11/2016 GBP 1,450,000 2,045,139 1.23
London Stock Exchange Group plc 6.125% 07/07/2016 GBP 1,400,000 1,957,924 1.17
Northumbrian Water Finance plc 6% 11/10/2017 GBP 1,250,000 1,836,915 1.10
Reed Elsevier Investments plc 5.625% 20/10/2016 GBP 1,550,000 2,189,759 1.31
Royal Bank of Scotland plc (The), FRN 4.625% 22/09/2021 EUR 1,550,000 1,576,598 0.94
Stagecoach Group plc 5.75% 16/12/2016 GBP 1,350,000 1,914,570 1.15
Tesco plc 5.5% 13/12/2019 GBP 1,100,000 1,598,204 0.96
Unilever plc 2% 19/12/2018 GBP 1,752,000 2,413,064 1.45
United Utilities Water Ltd. 6.125% 29/12/2015 GBP 1,300,000 1,780,539 1.07
Virgin Media Secured Finance plc 6.25% 28/03/2029 GBP 600,000 802,395 0.48
Vodafone Group plc 5.375% 05/12/2017 GBP 1,500,000 2,174,431 1.30
William Hill plc 7.125% 11/11/2016 GBP 1,300,000 1,854,980 1.11
31,928,799 19.13
the accompanying notes form an integral part of these financial statements.
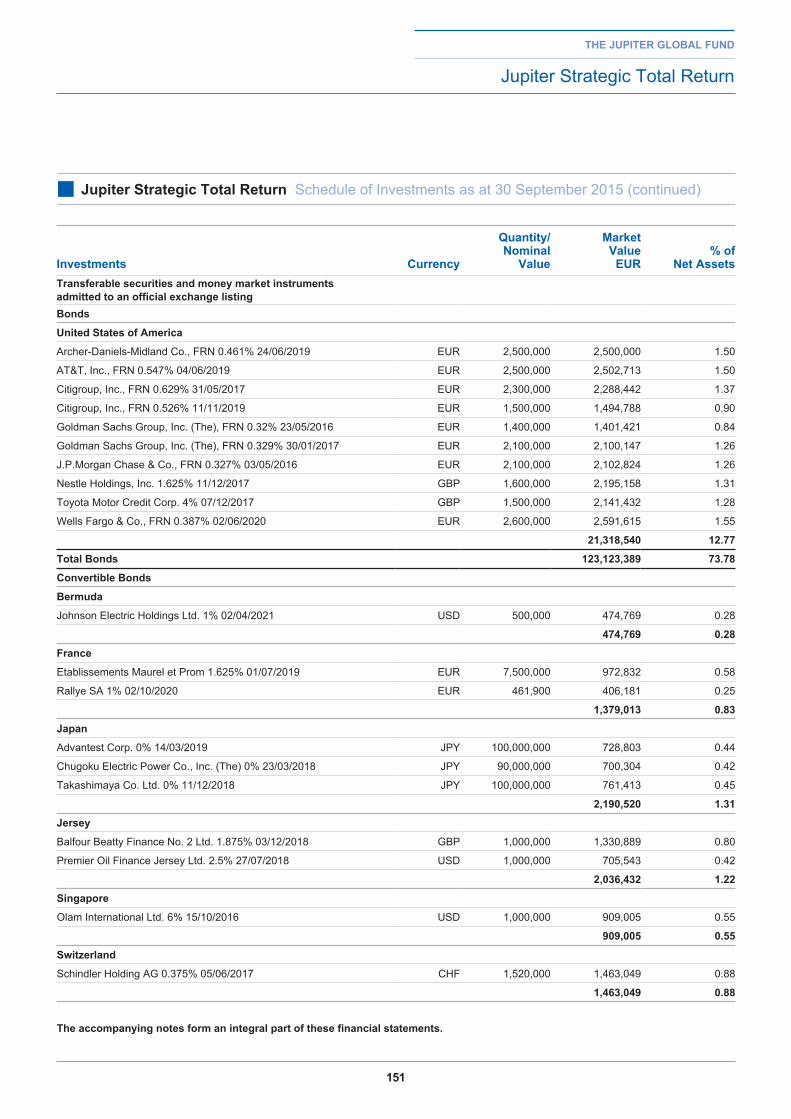
151
the jupiter global fund
Jupiter Strategic Total Return
■ jupiter Strategic total return Schedule of Investments as at 30 September 2015 (continued)
investments Currency
Quantity/ nominal
Value
Market Value
eur% of
net assetstransferable securities and money market instruments admitted to an official exchange listingbonds
united States of america
Archer-Daniels-Midland Co., FRN 0.461% 24/06/2019 EUR 2,500,000 2,500,000 1.50
AT&T, Inc., FRN 0.547% 04/06/2019 EUR 2,500,000 2,502,713 1.50
Citigroup, Inc., FRN 0.629% 31/05/2017 EUR 2,300,000 2,288,442 1.37
Citigroup, Inc., FRN 0.526% 11/11/2019 EUR 1,500,000 1,494,788 0.90
Goldman Sachs Group, Inc. (The), FRN 0.32% 23/05/2016 EUR 1,400,000 1,401,421 0.84
Goldman Sachs Group, Inc. (The), FRN 0.329% 30/01/2017 EUR 2,100,000 2,100,147 1.26
J.P.Morgan Chase & Co., FRN 0.327% 03/05/2016 EUR 2,100,000 2,102,824 1.26
Nestle Holdings, Inc. 1.625% 11/12/2017 GBP 1,600,000 2,195,158 1.31
Toyota Motor Credit Corp. 4% 07/12/2017 GBP 1,500,000 2,141,432 1.28
Wells Fargo & Co., FRN 0.387% 02/06/2020 EUR 2,600,000 2,591,615 1.55
21,318,540 12.77
total bonds 123,123,389 73.78
Convertible bonds
bermuda
Johnson Electric Holdings Ltd. 1% 02/04/2021 USD 500,000 474,769 0.28
474,769 0.28
france
Etablissements Maurel et Prom 1.625% 01/07/2019 EUR 7,500,000 972,832 0.58
Rallye SA 1% 02/10/2020 EUR 461,900 406,181 0.25
1,379,013 0.83
japan
Advantest Corp. 0% 14/03/2019 JPY 100,000,000 728,803 0.44
Chugoku Electric Power Co., Inc. (The) 0% 23/03/2018 JPY 90,000,000 700,304 0.42
Takashimaya Co. Ltd. 0% 11/12/2018 JPY 100,000,000 761,413 0.45
2,190,520 1.31
jersey
Balfour Beatty Finance No. 2 Ltd. 1.875% 03/12/2018 GBP 1,000,000 1,330,889 0.80
Premier Oil Finance Jersey Ltd. 2.5% 27/07/2018 USD 1,000,000 705,543 0.42
2,036,432 1.22
Singapore
Olam International Ltd. 6% 15/10/2016 USD 1,000,000 909,005 0.55
909,005 0.55
Switzerland
Schindler Holding AG 0.375% 05/06/2017 CHF 1,520,000 1,463,049 0.88
1,463,049 0.88
the accompanying notes form an integral part of these financial statements.
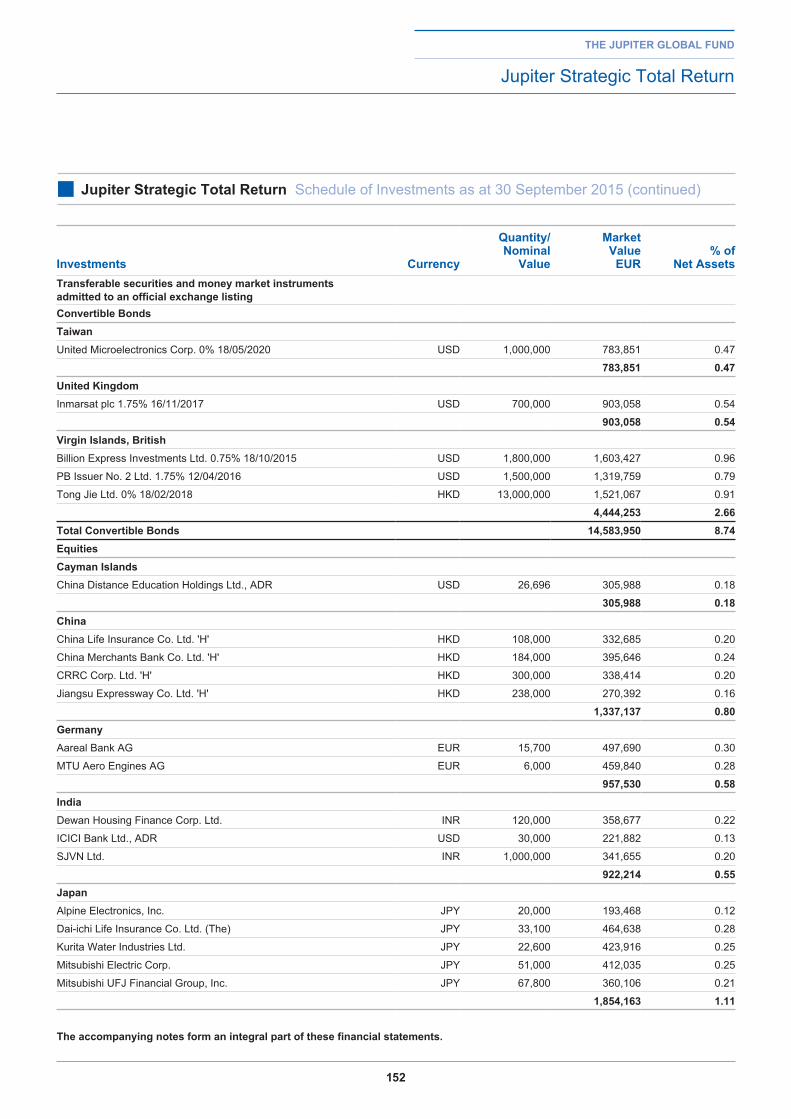
152
the jupiter global fund
Jupiter Strategic Total Return
■ jupiter Strategic total return Schedule of Investments as at 30 September 2015 (continued)
investments Currency
Quantity/ nominal
Value
Market Value
eur% of
net assetstransferable securities and money market instruments admitted to an official exchange listingConvertible bondstaiwanUnited Microelectronics Corp. 0% 18/05/2020 USD 1,000,000 783,851 0.47
783,851 0.47united KingdomInmarsat plc 1.75% 16/11/2017 USD 700,000 903,058 0.54
903,058 0.54Virgin islands, britishBillion Express Investments Ltd. 0.75% 18/10/2015 USD 1,800,000 1,603,427 0.96
PB Issuer No. 2 Ltd. 1.75% 12/04/2016 USD 1,500,000 1,319,759 0.79
Tong Jie Ltd. 0% 18/02/2018 HKD 13,000,000 1,521,067 0.91
4,444,253 2.66total Convertible bonds 14,583,950 8.74equitiesCayman islandsChina Distance Education Holdings Ltd., ADR USD 26,696 305,988 0.18
305,988 0.18ChinaChina Life Insurance Co. Ltd. 'H' HKD 108,000 332,685 0.20
China Merchants Bank Co. Ltd. 'H' HKD 184,000 395,646 0.24
CRRC Corp. Ltd. 'H' HKD 300,000 338,414 0.20
Jiangsu Expressway Co. Ltd. 'H' HKD 238,000 270,392 0.16
1,337,137 0.80germanyAareal Bank AG EUR 15,700 497,690 0.30
MTU Aero Engines AG EUR 6,000 459,840 0.28
957,530 0.58indiaDewan Housing Finance Corp. Ltd. INR 120,000 358,677 0.22
ICICI Bank Ltd., ADR USD 30,000 221,882 0.13
SJVN Ltd. INR 1,000,000 341,655 0.20
922,214 0.55japanAlpine Electronics, Inc. JPY 20,000 193,468 0.12
Dai-ichi Life Insurance Co. Ltd. (The) JPY 33,100 464,638 0.28
Kurita Water Industries Ltd. JPY 22,600 423,916 0.25
Mitsubishi Electric Corp. JPY 51,000 412,035 0.25
Mitsubishi UFJ Financial Group, Inc. JPY 67,800 360,106 0.21
1,854,163 1.11
the accompanying notes form an integral part of these financial statements.
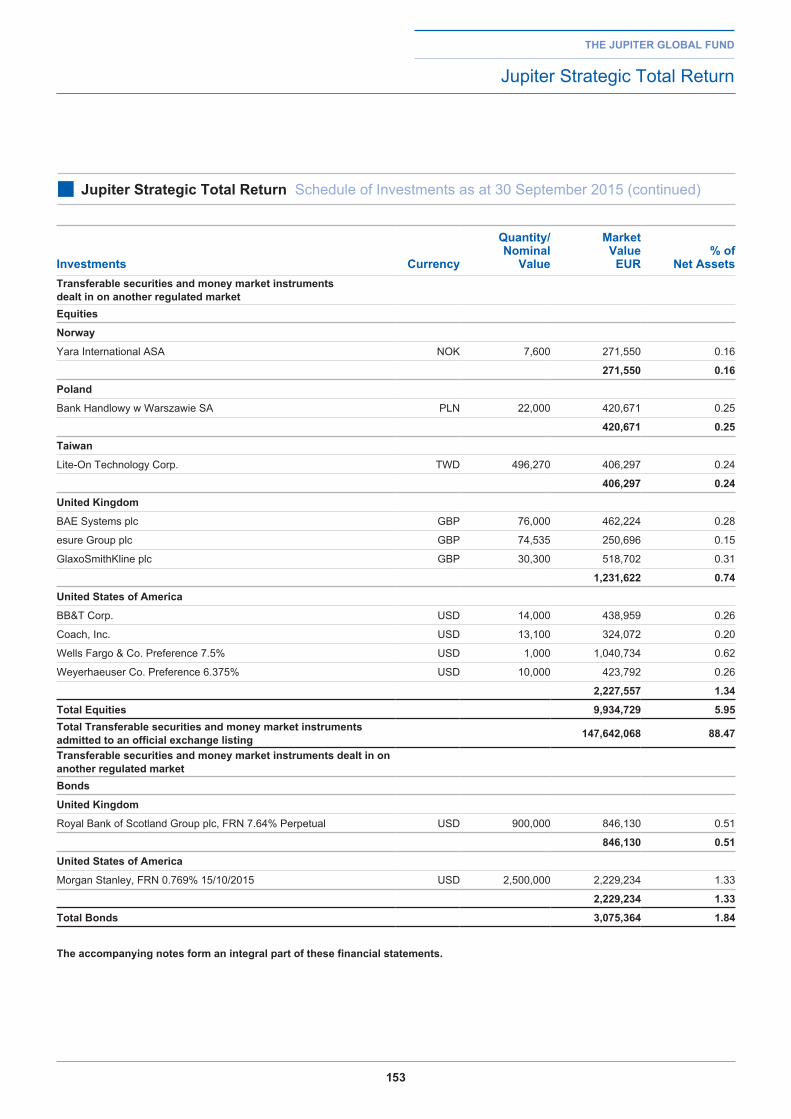
153
investments Currency
Quantity/ nominal
Value
Market Value
eur% of
net assetstransferable securities and money market instruments dealt in on another regulated marketequities
norway
Yara International ASA NOK 7,600 271,550 0.16
271,550 0.16
poland
Bank Handlowy w Warszawie SA PLN 22,000 420,671 0.25
420,671 0.25
taiwan
Lite-On Technology Corp. TWD 496,270 406,297 0.24
406,297 0.24
united Kingdom
BAE Systems plc GBP 76,000 462,224 0.28
esure Group plc GBP 74,535 250,696 0.15
GlaxoSmithKline plc GBP 30,300 518,702 0.31
1,231,622 0.74
united States of america
BB&T Corp. USD 14,000 438,959 0.26
Coach, Inc. USD 13,100 324,072 0.20
Wells Fargo & Co. Preference 7.5% USD 1,000 1,040,734 0.62
Weyerhaeuser Co. Preference 6.375% USD 10,000 423,792 0.26
2,227,557 1.34
total equities 9,934,729 5.95total transferable securities and money market instruments admitted to an official exchange listing 147,642,068 88.47
transferable securities and money market instruments dealt in on another regulated marketbonds
united Kingdom
Royal Bank of Scotland Group plc, FRN 7.64% Perpetual USD 900,000 846,130 0.51
846,130 0.51
united States of america
Morgan Stanley, FRN 0.769% 15/10/2015 USD 2,500,000 2,229,234 1.33
2,229,234 1.33
total bonds 3,075,364 1.84
the accompanying notes form an integral part of these financial statements.
the jupiter global fund
Jupiter Strategic Total Return
■ jupiter Strategic total return Schedule of Investments as at 30 September 2015 (continued)
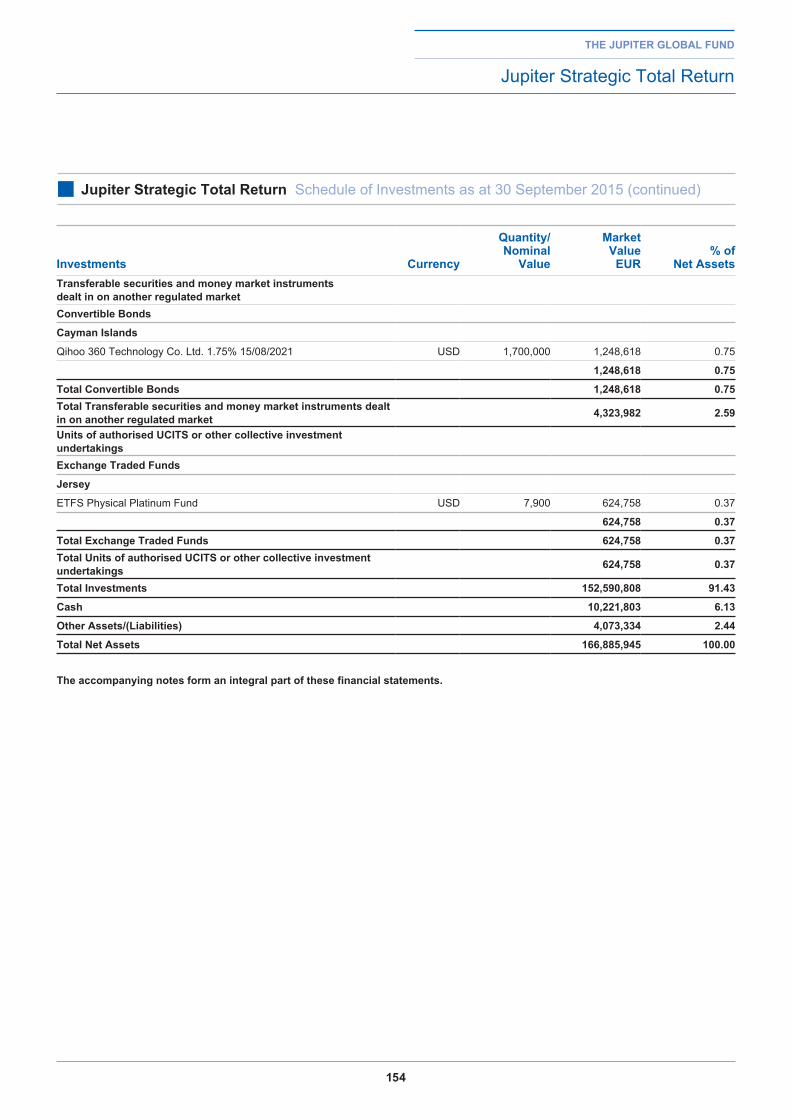
154
investments Currency
Quantity/ nominal
Value
Market Value
eur% of
net assetstransferable securities and money market instruments dealt in on another regulated marketConvertible bonds
Cayman islands
Qihoo 360 Technology Co. Ltd. 1.75% 15/08/2021 USD 1,700,000 1,248,618 0.75
1,248,618 0.75
total Convertible bonds 1,248,618 0.75total transferable securities and money market instruments dealt in on another regulated market 4,323,982 2.59
units of authorised uCitS or other collective investment undertakingsexchange traded funds
jersey
ETFS Physical Platinum Fund USD 7,900 624,758 0.37
624,758 0.37
total exchange traded funds 624,758 0.37total units of authorised uCitS or other collective investment undertakings 624,758 0.37
total investments 152,590,808 91.43
Cash 10,221,803 6.13
other assets/(liabilities) 4,073,334 2.44
total net assets 166,885,945 100.00
the accompanying notes form an integral part of these financial statements.
the jupiter global fund
Jupiter Strategic Total Return
■ jupiter Strategic total return Schedule of Investments as at 30 September 2015 (continued)
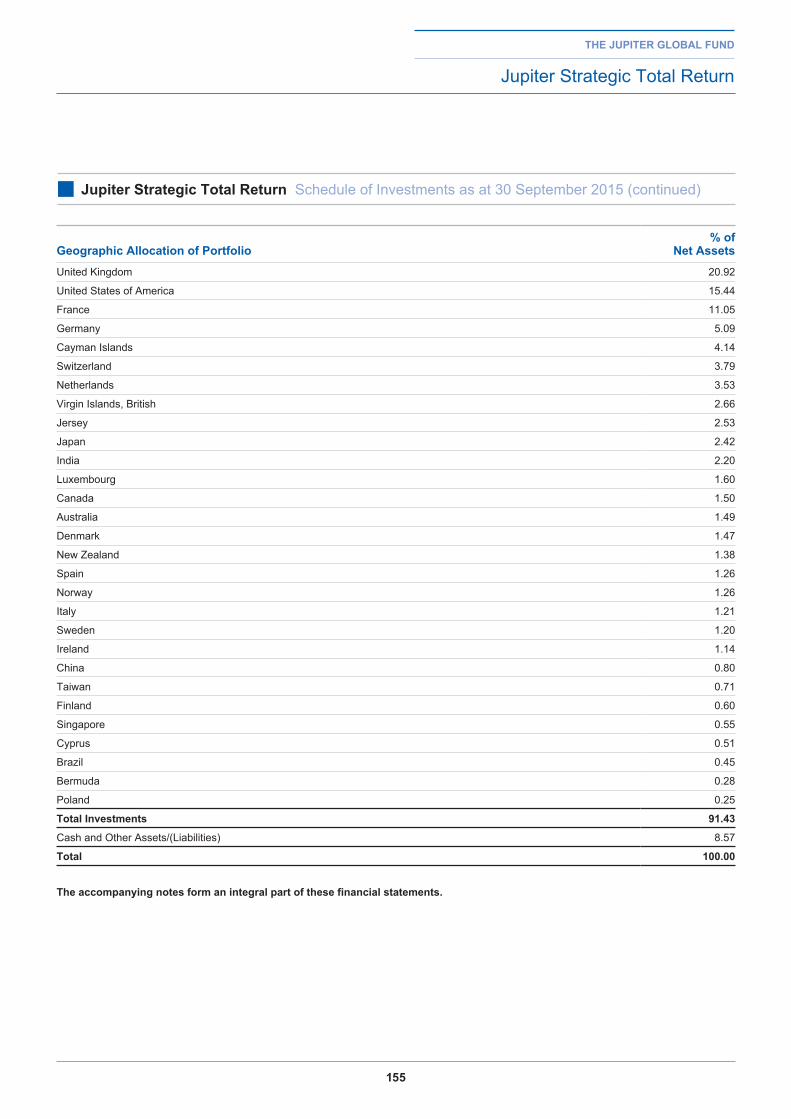
155
the jupiter global fund
Jupiter Strategic Total Return
■ jupiter Strategic total return Schedule of Investments as at 30 September 2015 (continued)
geographic allocation of portfolio% of
net assetsUnited Kingdom 20.92
United States of America 15.44
France 11.05
Germany 5.09
Cayman Islands 4.14
Switzerland 3.79
Netherlands 3.53
Virgin Islands, British 2.66
Jersey 2.53
Japan 2.42
India 2.20
Luxembourg 1.60
Canada 1.50
Australia 1.49
Denmark 1.47
New Zealand 1.38
Spain 1.26
Norway 1.26
Italy 1.21
Sweden 1.20
Ireland 1.14
China 0.80
Taiwan 0.71
Finland 0.60
Singapore 0.55
Cyprus 0.51
Brazil 0.45
Bermuda 0.28
Poland 0.25
total investments 91.43
Cash and Other Assets/(Liabilities) 8.57
total 100.00
the accompanying notes form an integral part of these financial statements.
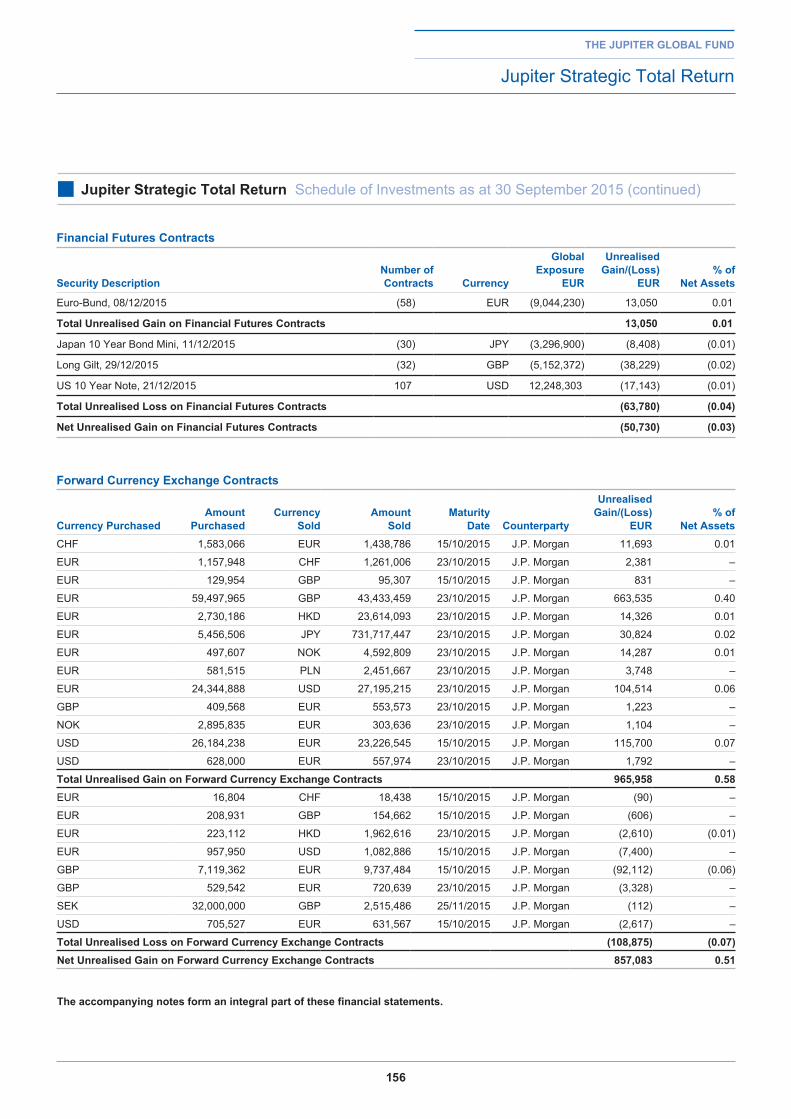
156
the jupiter global fund
Jupiter Strategic Total Return
■ jupiter Strategic total return Schedule of Investments as at 30 September 2015 (continued)
financial futures Contracts
Security descriptionnumber of Contracts Currency
global exposure
eur
unrealised gain/(loss)
eur% of
net assets
Euro-Bund, 08/12/2015 (58) EUR (9,044,230) 13,050 0.01
total unrealised gain on financial futures Contracts 13,050 0.01
Japan 10 Year Bond Mini, 11/12/2015 (30) JPY (3,296,900) (8,408) (0.01)
Long Gilt, 29/12/2015 (32) GBP (5,152,372) (38,229) (0.02)
US 10 Year Note, 21/12/2015 107 USD 12,248,303 (17,143) (0.01)
total unrealised loss on financial futures Contracts (63,780) (0.04)
net unrealised gain on financial futures Contracts (50,730) (0.03)
forward Currency exchange Contracts
Currency purchasedamount
purchasedCurrency
Soldamount
SoldMaturity
date Counterparty
unrealised gain/(loss)
eur% of
net assetsCHF 1,583,066 EUR 1,438,786 15/10/2015 J.P. Morgan 11,693 0.01
EUR 1,157,948 CHF 1,261,006 23/10/2015 J.P. Morgan 2,381 –
EUR 129,954 GBP 95,307 15/10/2015 J.P. Morgan 831 –
EUR 59,497,965 GBP 43,433,459 23/10/2015 J.P. Morgan 663,535 0.40
EUR 2,730,186 HKD 23,614,093 23/10/2015 J.P. Morgan 14,326 0.01
EUR 5,456,506 JPY 731,717,447 23/10/2015 J.P. Morgan 30,824 0.02
EUR 497,607 NOK 4,592,809 23/10/2015 J.P. Morgan 14,287 0.01
EUR 581,515 PLN 2,451,667 23/10/2015 J.P. Morgan 3,748 –
EUR 24,344,888 USD 27,195,215 23/10/2015 J.P. Morgan 104,514 0.06
GBP 409,568 EUR 553,573 23/10/2015 J.P. Morgan 1,223 –
NOK 2,895,835 EUR 303,636 23/10/2015 J.P. Morgan 1,104 –
USD 26,184,238 EUR 23,226,545 15/10/2015 J.P. Morgan 115,700 0.07
USD 628,000 EUR 557,974 23/10/2015 J.P. Morgan 1,792 –
total unrealised gain on forward Currency exchange Contracts 965,958 0.58EUR 16,804 CHF 18,438 15/10/2015 J.P. Morgan (90) –
EUR 208,931 GBP 154,662 15/10/2015 J.P. Morgan (606) –
EUR 223,112 HKD 1,962,616 23/10/2015 J.P. Morgan (2,610) (0.01)
EUR 957,950 USD 1,082,886 15/10/2015 J.P. Morgan (7,400) –
GBP 7,119,362 EUR 9,737,484 15/10/2015 J.P. Morgan (92,112) (0.06)
GBP 529,542 EUR 720,639 23/10/2015 J.P. Morgan (3,328) –
SEK 32,000,000 GBP 2,515,486 25/11/2015 J.P. Morgan (112) –
USD 705,527 EUR 631,567 15/10/2015 J.P. Morgan (2,617) –
total unrealised loss on forward Currency exchange Contracts (108,875) (0.07)net unrealised gain on forward Currency exchange Contracts 857,083 0.51
the accompanying notes form an integral part of these financial statements.
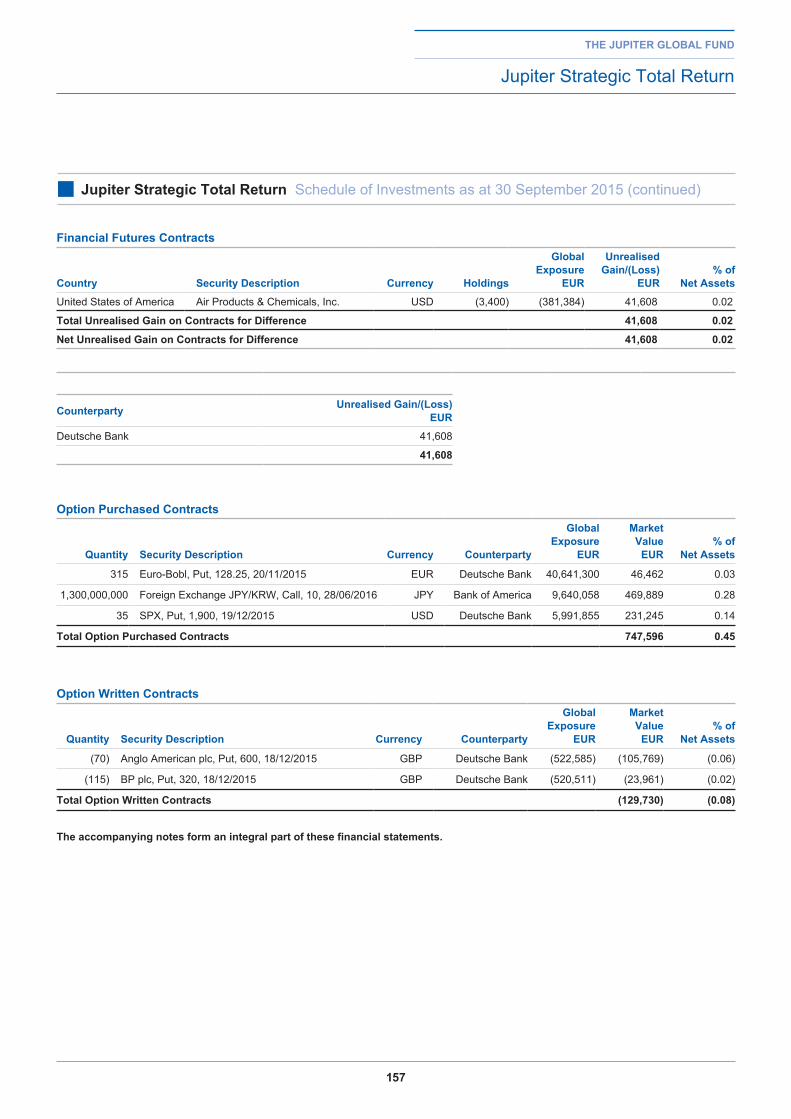
157
Counterparty unrealised gain/(loss) eur
Deutsche Bank 41,608
41,608
financial futures Contracts
Country Security description Currency holdings
global exposure
eur
unrealised gain/(loss)
eur% of
net assets
United States of America Air Products & Chemicals, Inc. USD (3,400) (381,384) 41,608 0.02
total unrealised gain on Contracts for difference 41,608 0.02
net unrealised gain on Contracts for difference 41,608 0.02
the jupiter global fund
Jupiter Strategic Total Return
■ jupiter Strategic total return Schedule of Investments as at 30 September 2015 (continued)
option purchased Contracts
Quantity Security description Currency Counterparty
global exposure
eur
Market Value
eur% of
net assets
315 Euro-Bobl, Put, 128.25, 20/11/2015 EUR Deutsche Bank 40,641,300 46,462 0.03
1,300,000,000 Foreign Exchange JPY/KRW, Call, 10, 28/06/2016 JPY Bank of America 9,640,058 469,889 0.28
35 SPX, Put, 1,900, 19/12/2015 USD Deutsche Bank 5,991,855 231,245 0.14
total option purchased Contracts 747,596 0.45
option Written Contracts
Quantity Security description Currency Counterparty
global exposure
eur
Market Value
eur% of
net assets
(70) Anglo American plc, Put, 600, 18/12/2015 GBP Deutsche Bank (522,585) (105,769) (0.06)
(115) BP plc, Put, 320, 18/12/2015 GBP Deutsche Bank (520,511) (23,961) (0.02)
total option Written Contracts (129,730) (0.08)
the accompanying notes form an integral part of these financial statements.
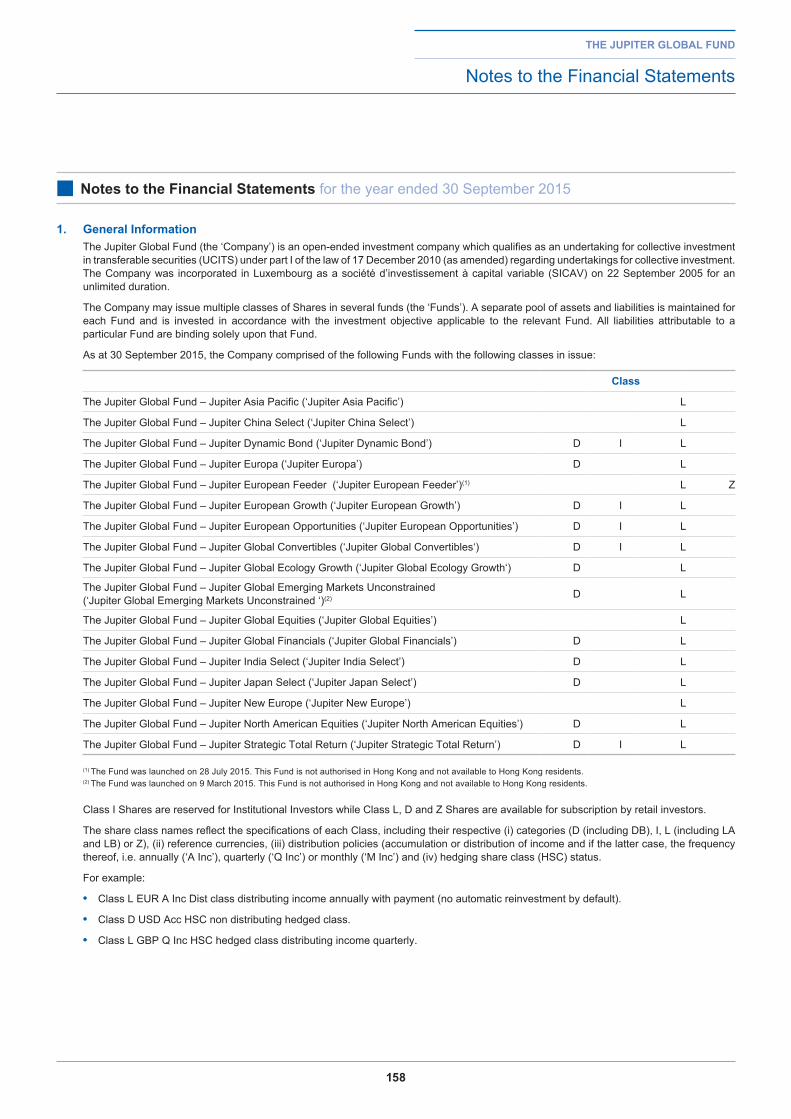
158
the jupiter global fund
Notes to the Financial Statements
■ notes to the financial Statements for the year ended 30 September 2015
1. general information The Jupiter Global Fund (the ‘Company’) is an open-ended investment company which qualifies as an undertaking for collective investment
in transferable securities (UCITS) under part I of the law of 17 December 2010 (as amended) regarding undertakings for collective investment. The Company was incorporated in Luxembourg as a société d’investissement à capital variable (SICAV) on 22 September 2005 for an unlimited duration.
The Company may issue multiple classes of Shares in several funds (the ‘Funds’). A separate pool of assets and liabilities is maintained for each Fund and is invested in accordance with the investment objective applicable to the relevant Fund. All liabilities attributable to a particular Fund are binding solely upon that Fund.
As at 30 September 2015, the Company comprised of the following Funds with the following classes in issue:
Class
The Jupiter Global Fund – Jupiter Asia Pacific (‘Jupiter Asia Pacific’) L
The Jupiter Global Fund – Jupiter China Select (‘Jupiter China Select’) L
The Jupiter Global Fund – Jupiter Dynamic Bond (‘Jupiter Dynamic Bond’) D I L
The Jupiter Global Fund – Jupiter Europa (‘Jupiter Europa’) D L
The Jupiter Global Fund – Jupiter European Feeder (‘Jupiter European Feeder’)(1) L Z
The Jupiter Global Fund – Jupiter European Growth (‘Jupiter European Growth’) D I L
The Jupiter Global Fund – Jupiter European Opportunities (‘Jupiter European Opportunities’) D I L
The Jupiter Global Fund – Jupiter Global Convertibles (‘Jupiter Global Convertibles‘) D I L
The Jupiter Global Fund – Jupiter Global Ecology Growth (‘Jupiter Global Ecology Growth‘) D L
The Jupiter Global Fund – Jupiter Global Emerging Markets Unconstrained (‘Jupiter Global Emerging Markets Unconstrained ‘)(2) D L
The Jupiter Global Fund – Jupiter Global Equities (‘Jupiter Global Equities’) L
The Jupiter Global Fund – Jupiter Global Financials (‘Jupiter Global Financials’) D L
The Jupiter Global Fund – Jupiter India Select (‘Jupiter India Select’) D L
The Jupiter Global Fund – Jupiter Japan Select (‘Jupiter Japan Select’) D L
The Jupiter Global Fund – Jupiter New Europe (‘Jupiter New Europe’) L
The Jupiter Global Fund – Jupiter North American Equities (‘Jupiter North American Equities’) D L
The Jupiter Global Fund – Jupiter Strategic Total Return (‘Jupiter Strategic Total Return’) D I L
(1) The Fund was launched on 28 July 2015. This Fund is not authorised in Hong Kong and not available to Hong Kong residents.(2) The Fund was launched on 9 March 2015. This Fund is not authorised in Hong Kong and not available to Hong Kong residents.
Class I Shares are reserved for Institutional Investors while Class L, D and Z Shares are available for subscription by retail investors.
The share class names reflect the specifications of each Class, including their respective (i) categories (D (including DB), I, L (including LA and LB) or Z), (ii) reference currencies, (iii) distribution policies (accumulation or distribution of income and if the latter case, the frequency thereof, i.e. annually (‘A Inc’), quarterly (‘Q Inc’) or monthly (‘M Inc’) and (iv) hedging share class (HSC) status.
For example:
• Class L EUR A Inc Dist class distributing income annually with payment (no automatic reinvestment by default).
• Class D USD Acc HSC non distributing hedged class.
• Class L GBP Q Inc HSC hedged class distributing income quarterly.
159
the jupiter global fund
Notes to the Financial Statements
■ notes to the financial Statements for the year ended 30 September 2015 (continued)
2. Summary of Significant accounting policies a) basis of preparation The financial statements have been prepared in conformity with
Luxembourg generally accepted accounting principles applicable to investment funds.
b) financial Statements Financial statements are presented for each Fund in the base
currency of the Fund and the combined Statement of Net Assets, Statement of Operations and Changes in Net Assets of the Company are presented in Euro (€), based on the exchange rate ruling at the date of these financial statements.
The difference between opening Net Assets stated at exchange rates ruling at the beginning of the year and their value at the end of the year is shown as a ‘Currency translation adjustment’ in the Statement of Operations and Changes in Net Assets.
c) foreign currency translation Assets and liabilities denominated in currencies other than a
Fund’s base currency are translated into that base currency at exchange rates ruling at the date of these financial statements. Transactions occurring during the year in currencies other than the base currency are translated at rates of exchange ruling on the transaction dates. Differences arising on translation are included in the Statement of Operations and Changes in Net Assets. The exchange rates used for the financial statements as at 30 September 2015 are as follows:
EUR/GBP: 0.73793 EUR/USD: 1.12154
d) investments Securities are initially recognised at cost, being the fair value of
the consideration given. Securities listed on an official stock exchange or dealt in on any
regulated market are valued at the last available price. Closed-ended funds are valued at their last available price.
Wherever practicable, the last available Net Asset Value is deemed to include the Net Asset Value calculated on the same Valuation day for any underlying fund which itself has a valuation point at or before the Company’s Valuation Point being 1pm Luxembourg time.
In the event that any of the securities held by a Fund on the relevant day are not listed on any stock exchange or dealt in on any regulated market or if, with respect to securities listed on any stock exchange or dealt in on any other regulated market, the basis of the price as determined above is not representative of the fair market value of the relevant securities, the value of such securities will be determined based on the reasonably foreseeable sales price determined prudently and in good faith by the Board of Directors of the Company (the ‘Board of Directors’).
Gains or losses arising on the disposal of investments are calculated by reference to the net sales proceeds and the average cost attributable to those investments.
All purchases and sales of securities are recognised on the trade date, i.e. the date the Fund commits to purchase or sell the security.
e) Contracts for difference Contracts for difference are valued using the local daily price of the
underlying listed equity, converted into the currency of the unlisted
Net asset as appropriate. The unrealised gain/(loss) on contracts for difference is included in the Statement of Net Assets as ‘Net unrealised gain/(loss) on Contracts for difference’. Contracts for difference are reset at month end after the Valuation Point.
f) options Options are contractual agreements that convey the right, but
not the obligation, for the purchaser either to buy or sell a specific amount of a financial instrument at a fixed price, either at a fixed future date or at any time before maturity.
OTC options are valued using the Black-Scholes model. Options are valued by reference to the expected future cash flow based on the market implied performance, spot level and the volatility of the underlying asset(s).
The Company may purchase and sell put and call options through regulated exchanges and OTC markets. Options purchased by the Company provide the Company with the opportunity to purchase (call options) or sell (put options) the underlying asset at an agreed-upon value either on or before the expiration of the option. The Company is exposed to credit risk on purchased options only to the extent of their carrying amount, which is their fair value.
g) forward foreign exchange contracts The Company may enter into forward currency exchange contracts
to hedge against exposures to foreign currency fluctuations. The carrying value of these contracts is the gain or loss that would be realised if the position was closed out on the valuation date, and is included in the Statement of Net Assets as ‘Net unrealised gain on forward currency exchange contracts’ and ‘Net unrealised loss on forward currency exchange contracts’. Upon the closing of the contract, the gain or loss is recorded in the ‘Net realised gains/(losses) on forward currency exchange contracts’.
h) financial futures contracts on securities and indices Regulated financial futures contracts are valued at the exchange
quoted settlement price. Initial margin deposits are made upon entering into the contracts and can be either in cash or securities. During the year the contracts are open, changes in the value of the contracts are recognised as unrealised gains and losses by ‘marking-to-market’ on a daily basis to reflect the market value of the contracts at the end of each business day’s trading. The unrealised gain/(loss) on financial futures contracts is included in the Statement of Net Assets as ‘Net unrealised gain/(loss) on financial futures contracts’. Variation margin payments are made or received, depending upon whether losses or gains are incurred. When a contract is closed, the Company records a realised gain or loss equal to the difference between the proceeds from, or cost of, the closing transaction and the initial cost of the contract.
i) income recognition Bonds may be purchased at a discount or at a premium. Such
discount or premium is amortised over the life of the bond using straight line amortisation. Amortisation is recorded as part of interest income included in ‘Income from investments, net’ in the Statement of Operations and Changes in Net Assets.
Interest income is recognised as the interest accrues unless collectability is in doubt.
Dividend income is recognised when the right to receive the dividend is established, on the ex-date.
Income is presented net of withholding taxes in the Statement of Operations and Changes in Net Assets.
160
the jupiter global fund
Notes to the Financial Statements
■ notes to the financial Statements for the year ended 30 September 2015 (continued)
2. Summary of Significant accounting policies continued
j) expense recognition
Expenses are accounted for on an accrual basis. Expenses are charged to the Statement of Operations and Changes in Net Assets except for expenses incurred on the acquisition of an investment which are included within the cost of that investment and expenses arising on the disposal of investments, which are deducted from the disposal proceeds.
k) dividend distributions payable
Dividend distributions payable by the Company are recorded on the ex-date. Refer to Note 18 for details of dividends declared during the year ended 30 September 2015.
l) net asset Value per Share
The Net Asset Value per Share is calculated by dividing the Net Assets of the relevant Class of Shares in a Fund included in the Statement of Net Assets by the number of Shares of the relevant Class in that Fund in issue at the year end.
m) use of estimates
The preparation of financial statements in conformity with accounting principles generally accepted in Luxembourg requires management to make estimates and assumptions that affect the reported amounts of assets and liabilities and disclosure of contingent assets and liabilities at the date of the financial statements and the reported amounts of revenues and expenses during the reporting year. Actual results could differ from those estimates.
161
the jupiter global fund
Notes to the Financial Statements
■ notes to the financial Statements for the year ended 30 September 2015 (continued)
3. Collateral As at 30 September 2015, the collateral received or paid which is composed of cash collateral granted to or received from brokers and
counterparties for the purpose of transactions in OTC derivatives is as follows:
fund namefund
currencyCounterparty/
brokertype of
collateraltype of
derivatives
Collateral amount
received (in fund
currency)
Collateral amount
paid (in fund
currency)Jupiter Europa EUR Deutsche Bank Cash CFD – €415,000
Jupiter Europa EUR Bank of America Cash CFD – €867,666
Jupiter Global Financials EUR Deutsche Bank Cash CFD – €550,000
Jupiter India Select USD Deutsche Bank Cash – – $220,025
Jupiter Strategic Total Return EUR Deutsche Bank Cash CFD – €11,151
As at 30 September 2015, there is no collateral received from or paid to brokers and counterparties for the purpose of transactions in forward currency exchange contracts and options contracts.
4. investment Management and performance fees The Management Company appointed Jupiter Asset Management Limited (‘JAML’) as Investment Manager to provide certain administrative
and management services. The Investment Management Fee is calculated and accrued per Fund on the basis of the daily Net Asset Value of each Fund and is payable
monthly in arrears. The fee rates per annum charged and applicable to each Class of Shares during the year ended 30 September 2015 are as follows:
d i l db la lb Z
Jupiter Asia Pacific – – 1.50% – – – –
Jupiter China Select – – 1.50% – – – –
Jupiter Dynamic Bond 0.50% 0.50% 1.25% – – – –
Jupiter Europa – – – 0.75% 1.75% 1.50% –
Jupiter European Feeder (1) – – 1.50% – – – 0.65%
Jupiter European Growth 0.75% 0.75% 1.50% – – – –
Jupiter European Opportunities 0.75% 0.75% 1.50% – – – –
Jupiter Global Convertibles 0.75% 0.75% 1.50% – – – –
Jupiter Global Ecology Growth^ 0.50% – 1.50% – – – –
Jupiter Global Emerging Markets Unconstrained (2) 0.75% – 1.50% – – – –
Jupiter Global Equities 0.75% – 1.50% – – – –
Jupiter Global Financials 0.75% – 1.50% – – – –
Jupiter India Select 0.75% – 1.75% – – – –
Jupiter Japan Select 0.75% – 1.50% – – – –
Jupiter New Europe – – 1.50% – – – –
Jupiter North American Equities 0.75% – 1.50% – – – –
Jupiter Strategic Total Return 0.65% 0.65% 1.25% – – – –
(1) The Fund was launched on 28 July 2015. This Fund is not authorised in Hong Kong and not available to Hong Kong residents. (2) The Fund was launched on 9 March 2015. This Fund is not authorised in Hong Kong and not available to Hong Kong residents. ^The investment management fee for Jupiter Ecology Growth Class D shares was reduced from 0.75% to 0.50% with effect from 1 January 2015.
162
the jupiter global fund
Notes to the Financial Statements
■ notes to the financial Statements for the year ended 30 September 2015 (continued)
4. investment Management and performance fees continued
Where a Fund invests in other funds managed by the same Investment Manager, the Fund will not be subject to additional management fees. These related management fee reimbursements are included in ‘Management fee rebates’ in the Statement of Operations and Changes in Net Assets and amounted to €4,807 for the year ended 30 September 2015.
Where a Feeder Fund invests in a Master Fund managed by the same Investment Manager, the management fees are charged at the Feeder Fund level only.
In addition, the Investment Manager may become entitled to receive a Performance Fee from Jupiter Europa (with the exception of the Class L, Shares A) and Jupiter Strategic Total Return (with the exception of Class I shares), calculated by reference to the out-performance of the Net Asset Value per Share in any given Class over the total return of the relevant benchmark for that Class over the course of a Performance Period. The Performance Fee accrued is based on the Fund specific performance fee rate stated below. Any Performance Fee earned by the Investment Manager is accumulated by the Fund and is payable to the Investment Manager in arrears on the last day of each accounting year. No performance fee is payable by any of the other Funds other than those mentioned above.• Jupiter Europa: Class L Shares B, Class D Shares B 15% • Jupiter Strategic Total Return: Class L Shares 10%
The Performance Fees are calculated on the basis of the out-performance of the Net Asset Value per Share of a Fund over the Benchmark Index for that Fund, being:
(i) the 3 months EURIBOR, 3 months US Dollar LIBOR and 3 months Sterling LIBOR for the respective Class L Shares and Class D Shares of Jupiter Europa;
(ii) the 1 month EURIBOR, 1 month US Dollar LIBOR, 1 month CHF LIBOR and 1 month Sterling LIBOR for the respective Class L Shares of Jupiter Strategic Total Return.
With effect from 15 October 2014, the performance fee was removed from Jupiter Strategic Total Return.
The Performance Fees charged for the year ended 30 September 2015 amounted to €1,110,031 for Jupiter Europa.
5. Management Company fee On 1 October 2005, RBS (Luxembourg) S.A. was appointed as the Management Company. The list of the funds managed by the Management
Company may be obtained, on request, at the registered office of the Management Company.
The Management Company is responsible on a day-to-day basis, under the supervision of the Board of Directors, for providing administration, marketing and investment management services in respect of all Funds.
The Management Company has delegated its investment management functions to the Investment Manager.
In the context of its marketing function, the Management Company may enter into agreements with Distributors pursuant to which the Distributors agree to act as intermediaries or nominees for investors subscribing for Shares through their facilities.
In the context of its administration functions, the Management Company has delegated its administration functions to J.P. Morgan Bank Luxembourg S.A., the Administrator.
The Management Company will monitor on a continual basis the activities of the third parties to which it has delegated functions. The agreements entered into between the Management Company and the relevant third parties provide that the Management Company can give at any time further instructions to such third parties, and that it can withdraw their mandate with immediate effect if this is in the interest of the Shareholders. The Management Company’s liability towards the Company is not affected by the fact that it has delegated certain functions to third parties.
RBS (Luxembourg) S.A. is entitled, for the provision of the management company services rendered to the Company, to receive the following fee per annum based on the Net Asset Value attributable to each Fund with an overall minimum annual fee for the Company of €170,000.
net asset Value
funds under Var approach
fee rates
funds under Commitment
approach fee rates
€0 – €100,000,000 0.07% 0.06%
€100,000,000 – €200,000,000 0.06% 0.05%
€200,000,000 and above 0.05% 0.04%
All the Funds are using the commitment approach to measure and monitor the global exposure except for Jupiter Europa, Jupiter Global Financials and Jupiter Strategic Total Return which are using the Value-at-Risk (‘VaR’) approach.
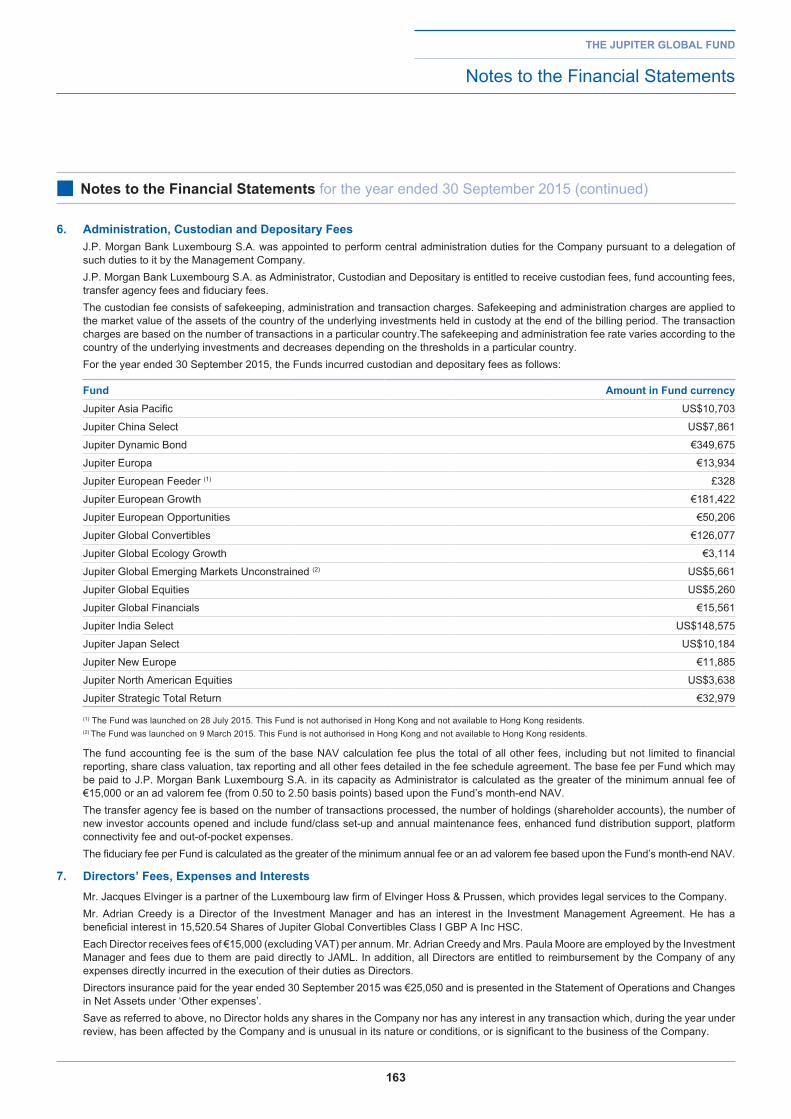
163
the jupiter global fund
Notes to the Financial Statements
■ notes to the financial Statements for the year ended 30 September 2015 (continued)
6. administration, Custodian and depositary fees J.P. Morgan Bank Luxembourg S.A. was appointed to perform central administration duties for the Company pursuant to a delegation of
such duties to it by the Management Company. J.P. Morgan Bank Luxembourg S.A. as Administrator, Custodian and Depositary is entitled to receive custodian fees, fund accounting fees,
transfer agency fees and fiduciary fees. The custodian fee consists of safekeeping, administration and transaction charges. Safekeeping and administration charges are applied to
the market value of the assets of the country of the underlying investments held in custody at the end of the billing period. The transaction charges are based on the number of transactions in a particular country.The safekeeping and administration fee rate varies according to the country of the underlying investments and decreases depending on the thresholds in a particular country.
For the year ended 30 September 2015, the Funds incurred custodian and depositary fees as follows:
fund amount in fund currencyJupiter Asia Pacific US$10,703
Jupiter China Select US$7,861
Jupiter Dynamic Bond €349,675
Jupiter Europa €13,934
Jupiter European Feeder (1) £328
Jupiter European Growth €181,422
Jupiter European Opportunities €50,206
Jupiter Global Convertibles €126,077
Jupiter Global Ecology Growth €3,114
Jupiter Global Emerging Markets Unconstrained (2) US$5,661
Jupiter Global Equities US$5,260
Jupiter Global Financials €15,561
Jupiter India Select US$148,575
Jupiter Japan Select US$10,184
Jupiter New Europe €11,885
Jupiter North American Equities US$3,638
Jupiter Strategic Total Return €32,979
(1) The Fund was launched on 28 July 2015. This Fund is not authorised in Hong Kong and not available to Hong Kong residents. (2) The Fund was launched on 9 March 2015. This Fund is not authorised in Hong Kong and not available to Hong Kong residents.
The fund accounting fee is the sum of the base NAV calculation fee plus the total of all other fees, including but not limited to financial reporting, share class valuation, tax reporting and all other fees detailed in the fee schedule agreement. The base fee per Fund which may be paid to J.P. Morgan Bank Luxembourg S.A. in its capacity as Administrator is calculated as the greater of the minimum annual fee of €15,000 or an ad valorem fee (from 0.50 to 2.50 basis points) based upon the Fund’s month-end NAV.
The transfer agency fee is based on the number of transactions processed, the number of holdings (shareholder accounts), the number of new investor accounts opened and include fund/class set-up and annual maintenance fees, enhanced fund distribution support, platform connectivity fee and out-of-pocket expenses.
The fiduciary fee per Fund is calculated as the greater of the minimum annual fee or an ad valorem fee based upon the Fund’s month-end NAV.
7. directors’ fees, expenses and interests Mr. Jacques Elvinger is a partner of the Luxembourg law firm of Elvinger Hoss & Prussen, which provides legal services to the Company. Mr. Adrian Creedy is a Director of the Investment Manager and has an interest in the Investment Management Agreement. He has a
beneficial interest in 15,520.54 Shares of Jupiter Global Convertibles Class I GBP A Inc HSC. Each Director receives fees of €15,000 (excluding VAT) per annum. Mr. Adrian Creedy and Mrs. Paula Moore are employed by the Investment
Manager and fees due to them are paid directly to JAML. In addition, all Directors are entitled to reimbursement by the Company of any expenses directly incurred in the execution of their duties as Directors.
Directors insurance paid for the year ended 30 September 2015 was €25,050 and is presented in the Statement of Operations and Changes in Net Assets under ‘Other expenses’.
Save as referred to above, no Director holds any shares in the Company nor has any interest in any transaction which, during the year under review, has been affected by the Company and is unusual in its nature or conditions, or is significant to the business of the Company.
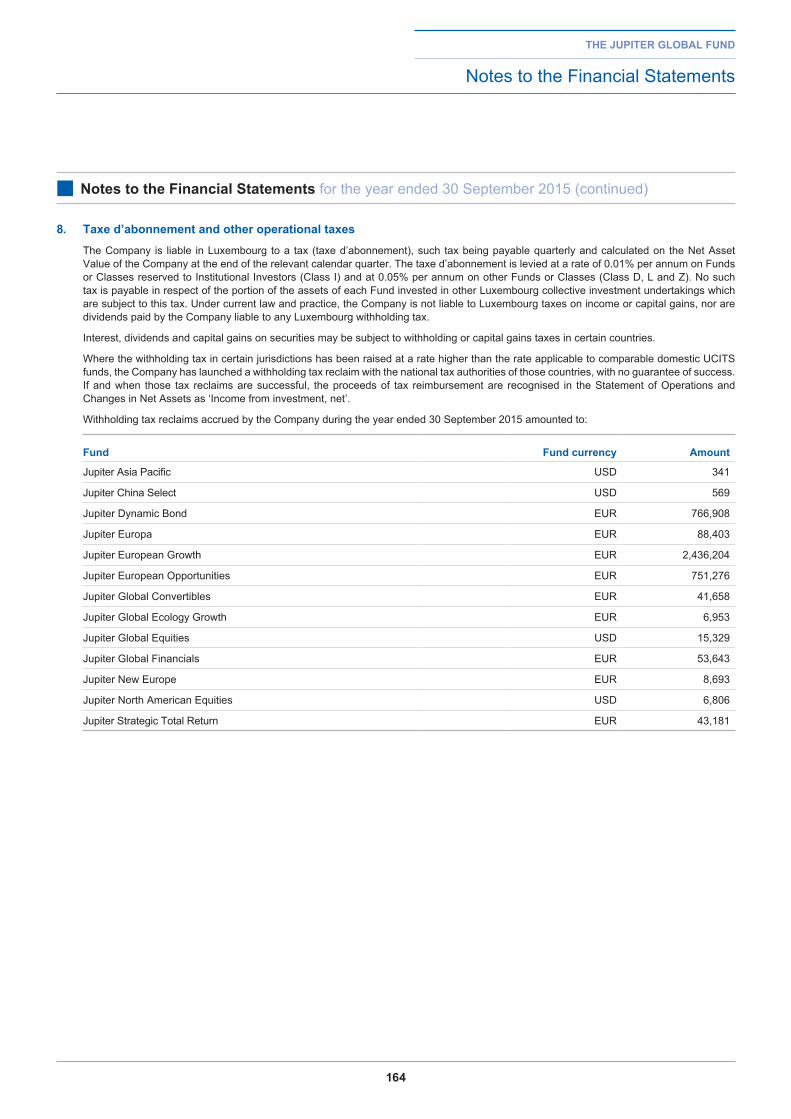
164
the jupiter global fund
Notes to the Financial Statements
■ notes to the financial Statements for the year ended 30 September 2015 (continued)
8. taxe d’abonnement and other operational taxes The Company is liable in Luxembourg to a tax (taxe d’abonnement), such tax being payable quarterly and calculated on the Net Asset
Value of the Company at the end of the relevant calendar quarter. The taxe d’abonnement is levied at a rate of 0.01% per annum on Funds or Classes reserved to Institutional Investors (Class I) and at 0.05% per annum on other Funds or Classes (Class D, L and Z). No such tax is payable in respect of the portion of the assets of each Fund invested in other Luxembourg collective investment undertakings which are subject to this tax. Under current law and practice, the Company is not liable to Luxembourg taxes on income or capital gains, nor are dividends paid by the Company liable to any Luxembourg withholding tax.
Interest, dividends and capital gains on securities may be subject to withholding or capital gains taxes in certain countries.
Where the withholding tax in certain jurisdictions has been raised at a rate higher than the rate applicable to comparable domestic UCITS funds, the Company has launched a withholding tax reclaim with the national tax authorities of those countries, with no guarantee of success. If and when those tax reclaims are successful, the proceeds of tax reimbursement are recognised in the Statement of Operations and Changes in Net Assets as ‘Income from investment, net’.
Withholding tax reclaims accrued by the Company during the year ended 30 September 2015 amounted to:
fund fund currency amount
Jupiter Asia Pacific USD 341
Jupiter China Select USD 569
Jupiter Dynamic Bond EUR 766,908
Jupiter Europa EUR 88,403
Jupiter European Growth EUR 2,436,204
Jupiter European Opportunities EUR 751,276
Jupiter Global Convertibles EUR 41,658
Jupiter Global Ecology Growth EUR 6,953
Jupiter Global Equities USD 15,329
Jupiter Global Financials EUR 53,643
Jupiter New Europe EUR 8,693
Jupiter North American Equities USD 6,806
Jupiter Strategic Total Return EUR 43,181
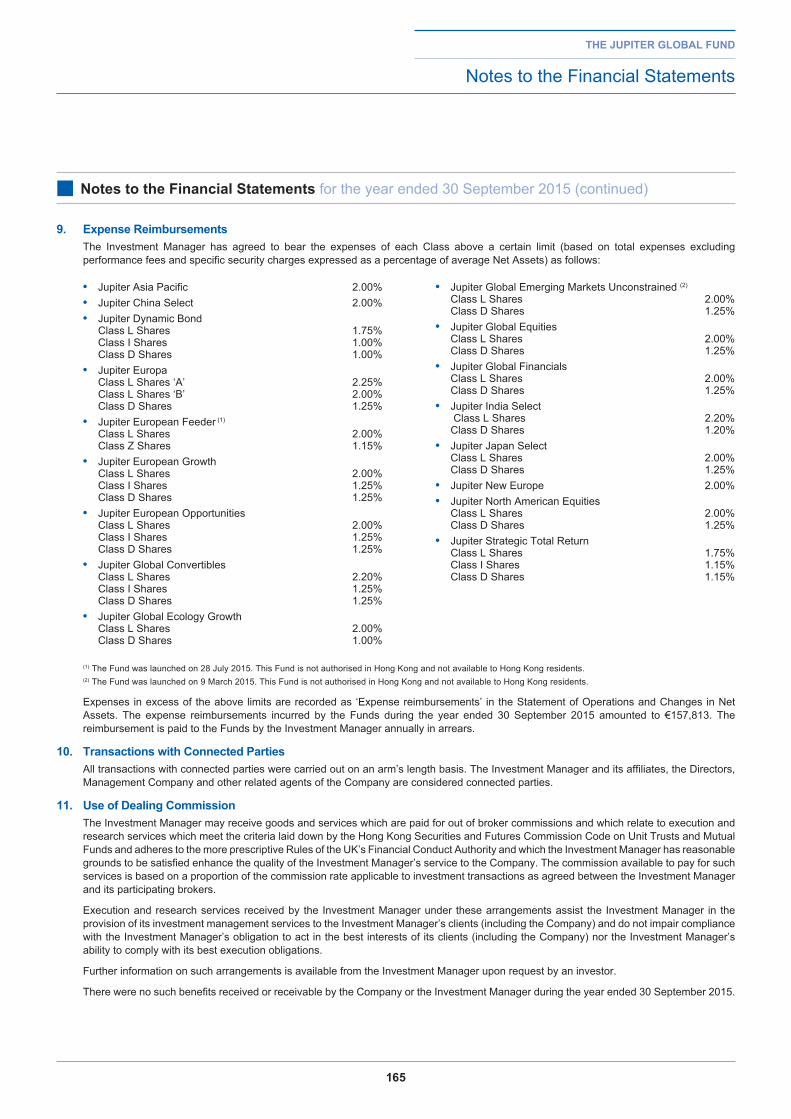
165
9. expense reimbursements The Investment Manager has agreed to bear the expenses of each Class above a certain limit (based on total expenses excluding
performance fees and specific security charges expressed as a percentage of average Net Assets) as follows:
(1) The Fund was launched on 28 July 2015. This Fund is not authorised in Hong Kong and not available to Hong Kong residents. (2) The Fund was launched on 9 March 2015. This Fund is not authorised in Hong Kong and not available to Hong Kong residents.
Expenses in excess of the above limits are recorded as ‘Expense reimbursements’ in the Statement of Operations and Changes in Net Assets. The expense reimbursements incurred by the Funds during the year ended 30 September 2015 amounted to €157,813. The reimbursement is paid to the Funds by the Investment Manager annually in arrears.
10. transactions with Connected parties All transactions with connected parties were carried out on an arm’s length basis. The Investment Manager and its affiliates, the Directors,
Management Company and other related agents of the Company are considered connected parties.
11. use of dealing Commission The Investment Manager may receive goods and services which are paid for out of broker commissions and which relate to execution and
research services which meet the criteria laid down by the Hong Kong Securities and Futures Commission Code on Unit Trusts and Mutual Funds and adheres to the more prescriptive Rules of the UK’s Financial Conduct Authority and which the Investment Manager has reasonable grounds to be satisfied enhance the quality of the Investment Manager’s service to the Company. The commission available to pay for such services is based on a proportion of the commission rate applicable to investment transactions as agreed between the Investment Manager and its participating brokers.
Execution and research services received by the Investment Manager under these arrangements assist the Investment Manager in the provision of its investment management services to the Investment Manager’s clients (including the Company) and do not impair compliance with the Investment Manager’s obligation to act in the best interests of its clients (including the Company) nor the Investment Manager’s ability to comply with its best execution obligations.
Further information on such arrangements is available from the Investment Manager upon request by an investor.
There were no such benefits received or receivable by the Company or the Investment Manager during the year ended 30 September 2015.
the jupiter global fund
Notes to the Financial Statements
■ notes to the financial Statements for the year ended 30 September 2015 (continued)
• Jupiter Asia Pacific 2.00%• Jupiter China Select 2.00%• Jupiter Dynamic Bond
Class L Shares 1.75% Class I Shares 1.00% Class D Shares 1.00%
• Jupiter Europa Class L Shares ‘A’ 2.25% Class L Shares ‘B’ 2.00% Class D Shares 1.25%
• Jupiter European Feeder (1) Class L Shares 2.00% Class Z Shares 1.15%
• Jupiter European Growth Class L Shares 2.00% Class I Shares 1.25% Class D Shares 1.25%
• Jupiter European Opportunities Class L Shares 2.00% Class I Shares 1.25% Class D Shares 1.25%
• Jupiter Global Convertibles Class L Shares 2.20% Class I Shares 1.25% Class D Shares 1.25%
• Jupiter Global Ecology Growth Class L Shares 2.00% Class D Shares 1.00%
• Jupiter Global Emerging Markets Unconstrained (2) Class L Shares 2.00% Class D Shares 1.25%
• Jupiter Global Equities Class L Shares 2.00% Class D Shares 1.25%
• Jupiter Global Financials Class L Shares 2.00% Class D Shares 1.25%
• Jupiter India Select Class L Shares 2.20% Class D Shares 1.20%
• Jupiter Japan Select Class L Shares 2.00% Class D Shares 1.25%
• Jupiter New Europe 2.00%• Jupiter North American Equities
Class L Shares 2.00% Class D Shares 1.25%
• Jupiter Strategic Total Return Class L Shares 1.75% Class I Shares 1.15% Class D Shares 1.15%
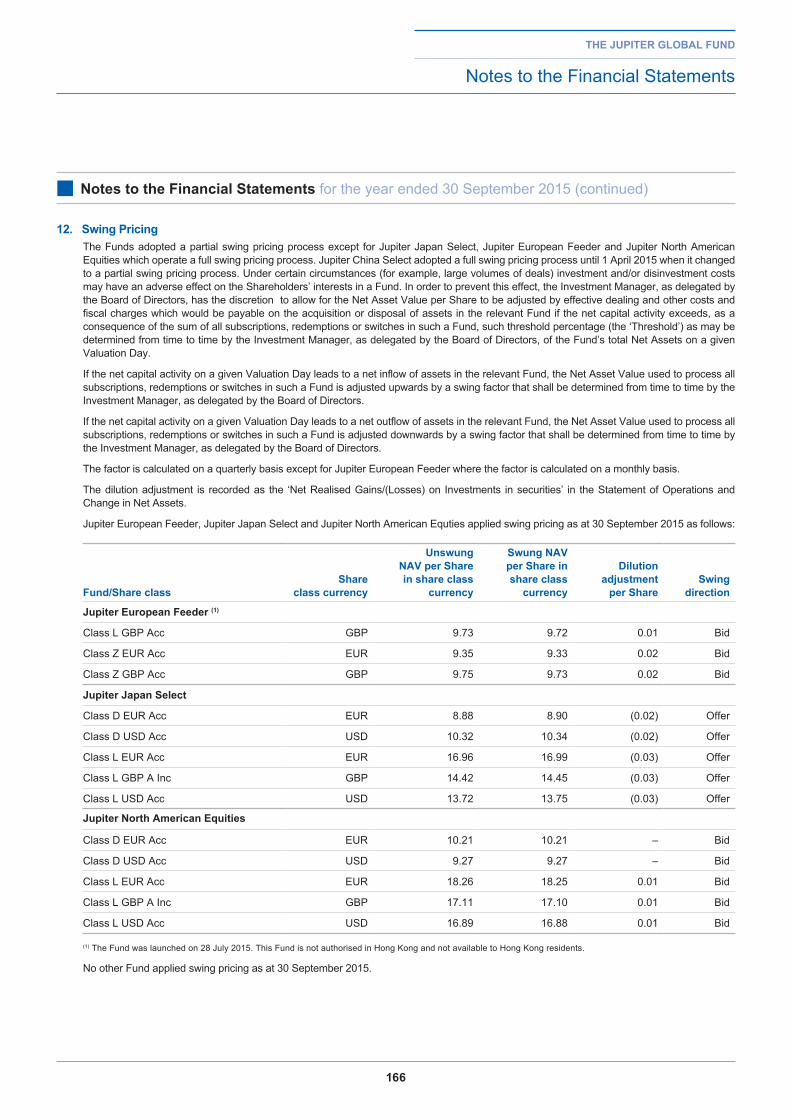
166
the jupiter global fund
Notes to the Financial Statements
■ notes to the financial Statements for the year ended 30 September 2015 (continued)
12. Swing pricing The Funds adopted a partial swing pricing process except for Jupiter Japan Select, Jupiter European Feeder and Jupiter North American
Equities which operate a full swing pricing process. Jupiter China Select adopted a full swing pricing process until 1 April 2015 when it changed to a partial swing pricing process. Under certain circumstances (for example, large volumes of deals) investment and/or disinvestment costs may have an adverse effect on the Shareholders’ interests in a Fund. In order to prevent this effect, the Investment Manager, as delegated by the Board of Directors, has the discretion to allow for the Net Asset Value per Share to be adjusted by effective dealing and other costs and fiscal charges which would be payable on the acquisition or disposal of assets in the relevant Fund if the net capital activity exceeds, as a consequence of the sum of all subscriptions, redemptions or switches in such a Fund, such threshold percentage (the ‘Threshold’) as may be determined from time to time by the Investment Manager, as delegated by the Board of Directors, of the Fund’s total Net Assets on a given Valuation Day.
If the net capital activity on a given Valuation Day leads to a net inflow of assets in the relevant Fund, the Net Asset Value used to process all subscriptions, redemptions or switches in such a Fund is adjusted upwards by a swing factor that shall be determined from time to time by the Investment Manager, as delegated by the Board of Directors.
If the net capital activity on a given Valuation Day leads to a net outflow of assets in the relevant Fund, the Net Asset Value used to process all subscriptions, redemptions or switches in such a Fund is adjusted downwards by a swing factor that shall be determined from time to time by the Investment Manager, as delegated by the Board of Directors.
The factor is calculated on a quarterly basis except for Jupiter European Feeder where the factor is calculated on a monthly basis.
The dilution adjustment is recorded as the ‘Net Realised Gains/(Losses) on Investments in securities’ in the Statement of Operations and Change in Net Assets.
Jupiter European Feeder, Jupiter Japan Select and Jupiter North American Equties applied swing pricing as at 30 September 2015 as follows:
fund/Share classShare
class currency
unswung naV per Share
in share class currency
Swung naV per Share in share class
currency
dilution adjustment
per ShareSwing
direction
jupiter european feeder (1)
Class L GBP Acc GBP 9.73 9.72 0.01 Bid
Class Z EUR Acc EUR 9.35 9.33 0.02 Bid
Class Z GBP Acc GBP 9.75 9.73 0.02 Bid
jupiter japan Select
Class D EUR Acc EUR 8.88 8.90 (0.02) Offer
Class D USD Acc USD 10.32 10.34 (0.02) Offer
Class L EUR Acc EUR 16.96 16.99 (0.03) Offer
Class L GBP A Inc GBP 14.42 14.45 (0.03) Offer
Class L USD Acc USD 13.72 13.75 (0.03) Offer
jupiter north american equities
Class D EUR Acc EUR 10.21 10.21 – Bid
Class D USD Acc USD 9.27 9.27 – Bid
Class L EUR Acc EUR 18.26 18.25 0.01 Bid
Class L GBP A Inc GBP 17.11 17.10 0.01 Bid
Class L USD Acc USD 16.89 16.88 0.01 Bid
(1) The Fund was launched on 28 July 2015. This Fund is not authorised in Hong Kong and not available to Hong Kong residents.
No other Fund applied swing pricing as at 30 September 2015.
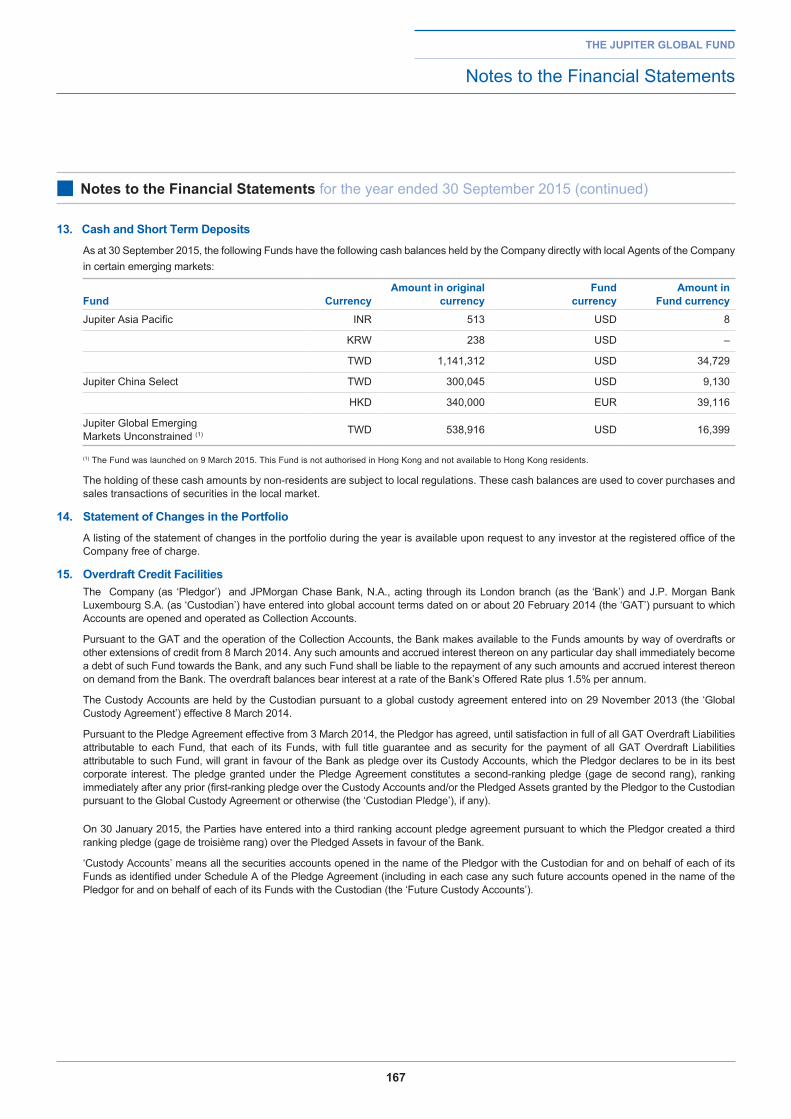
167
the jupiter global fund
Notes to the Financial Statements
■ notes to the financial Statements for the year ended 30 September 2015 (continued)
13. Cash and Short term deposits As at 30 September 2015, the following Funds have the following cash balances held by the Company directly with local Agents of the Company
in certain emerging markets:
fund Currencyamount in original
currencyfund
currencyamount in
fund currencyJupiter Asia Pacific INR 513 USD 8
KRW 238 USD –
TWD 1,141,312 USD 34,729
Jupiter China Select TWD 300,045 USD 9,130
HKD 340,000 EUR 39,116
Jupiter Global Emerging Markets Unconstrained (1) TWD 538,916 USD 16,399
(1) The Fund was launched on 9 March 2015. This Fund is not authorised in Hong Kong and not available to Hong Kong residents.
The holding of these cash amounts by non-residents are subject to local regulations. These cash balances are used to cover purchases and sales transactions of securities in the local market.
14. Statement of Changes in the portfolio A listing of the statement of changes in the portfolio during the year is available upon request to any investor at the registered office of the
Company free of charge.
15. overdraft Credit facilities The Company (as ‘Pledgor’) and JPMorgan Chase Bank, N.A., acting through its London branch (as the ‘Bank’) and J.P. Morgan Bank
Luxembourg S.A. (as ‘Custodian’) have entered into global account terms dated on or about 20 February 2014 (the ‘GAT’) pursuant to which Accounts are opened and operated as Collection Accounts.
Pursuant to the GAT and the operation of the Collection Accounts, the Bank makes available to the Funds amounts by way of overdrafts or other extensions of credit from 8 March 2014. Any such amounts and accrued interest thereon on any particular day shall immediately become a debt of such Fund towards the Bank, and any such Fund shall be liable to the repayment of any such amounts and accrued interest thereon on demand from the Bank. The overdraft balances bear interest at a rate of the Bank’s Offered Rate plus 1.5% per annum.
The Custody Accounts are held by the Custodian pursuant to a global custody agreement entered into on 29 November 2013 (the ‘Global Custody Agreement’) effective 8 March 2014.
Pursuant to the Pledge Agreement effective from 3 March 2014, the Pledgor has agreed, until satisfaction in full of all GAT Overdraft Liabilities attributable to each Fund, that each of its Funds, with full title guarantee and as security for the payment of all GAT Overdraft Liabilities attributable to such Fund, will grant in favour of the Bank as pledge over its Custody Accounts, which the Pledgor declares to be in its best corporate interest. The pledge granted under the Pledge Agreement constitutes a second-ranking pledge (gage de second rang), ranking immediately after any prior (first-ranking pledge over the Custody Accounts and/or the Pledged Assets granted by the Pledgor to the Custodian pursuant to the Global Custody Agreement or otherwise (the ‘Custodian Pledge’), if any).
On 30 January 2015, the Parties have entered into a third ranking account pledge agreement pursuant to which the Pledgor created a third ranking pledge (gage de troisième rang) over the Pledged Assets in favour of the Bank.
‘Custody Accounts’ means all the securities accounts opened in the name of the Pledgor with the Custodian for and on behalf of each of its Funds as identified under Schedule A of the Pledge Agreement (including in each case any such future accounts opened in the name of the Pledgor for and on behalf of each of its Funds with the Custodian (the ‘Future Custody Accounts’).
168
the jupiter global fund
Notes to the Financial Statements
■ notes to the financial Statements for the year ended 30 September 2015 (continued)
16. jupiter european fund (the ‘Master fund’)+ and the jupiter global fund – jupiter european feeder (the ‘feeder fund’)^
Jupiter European Feeder (the ‘Feeder Fund’) was launched on 28 July 2015 and is a feeder fund of Jupiter European Fund (the ‘Master Fund’), under the provisions of UCITS IV. The Master Fund is a unit trust organised under Section 237 of the UK Financial Services and Markets Act 2000 (as amended) and is authorised and supervised by the Financial Conduct Authority.
The investment objective of the Feeder Fund is to achieve long term capital growth. The Feeder Fund seeks to achieve its investment objective by investing substantially all of its assets in units of the Master Fund (LM-Class £ Accumulation, ZM-Class € Accumulation and ZM-Class £ Accumulation).
The Feeder Fund will invest at least 85% of its net assets in units of the Master Fund (LM-Class £ Accumulation, ZM-Class € Accumulation and ZM-Class £ Accumulation ) whilst it may hold up to 15% of its assets in cash, money market securities, short term debt securities and other cash equivalents.
The Master Fund’s investment objective is to achieve long term capital growth by investing in companies quoted on a European Stock Exchange. The Manager of the Master Fund has the power to use derivatives but it is intended that these will only be used for efficient portfolio management and not for investment purposes.
The audited annual report and the unaudited semi-annual report of the Master Fund are available to the Shareholders on request from the Investment Manager electronically or in hard copies. The registered office of the Master Fund is 1 Grosvenor Place, London SW1X 7JJ, United Kingdom. The Master Fund’s accounting year begins on 1 July and ends on 30 June of each year.
As of 30 September 2015, the Feeder Fund holds 0.11% of the net asset value of the Master Fund, and each 100.00% respectively of LM-Class £ Accumulation, ZM-Class € Accumulation and ZM-Class £ Accumulation of the Master Fund.
For the period to 30 September 2015, the total expenses of the Feeder Fund and the related unit classes of the Master Fund are respectively £3,444 and £406.
The annualised expense ratio of Class L GBP Acc, Class Z EUR Acc and Class Z GBP Acc of the Feeder Fund is respectively 1.65%, 0.78% and 0.78%.
The anualised total expense ratio of LM-Class £ Accumulation, ZM-Class € Accumulation and ZM-Class £ Accumulation of the Master Fund is respectively 0.02%, 0.02% and 0.02%.
The annualised aggregate total expense ratios of both the Master Fund and the Feeder Fund for the LM Class £ Accumulation, ZM Class € Accumulation and ZM Class £ Accumulation are respectively 1.67%, 0.80% and 0.80%.
+Related Party Fund ^The Fund was launched on 28 July 2015. This Fund is not authorised in Hong Kong and not available to Hong Kong residents.
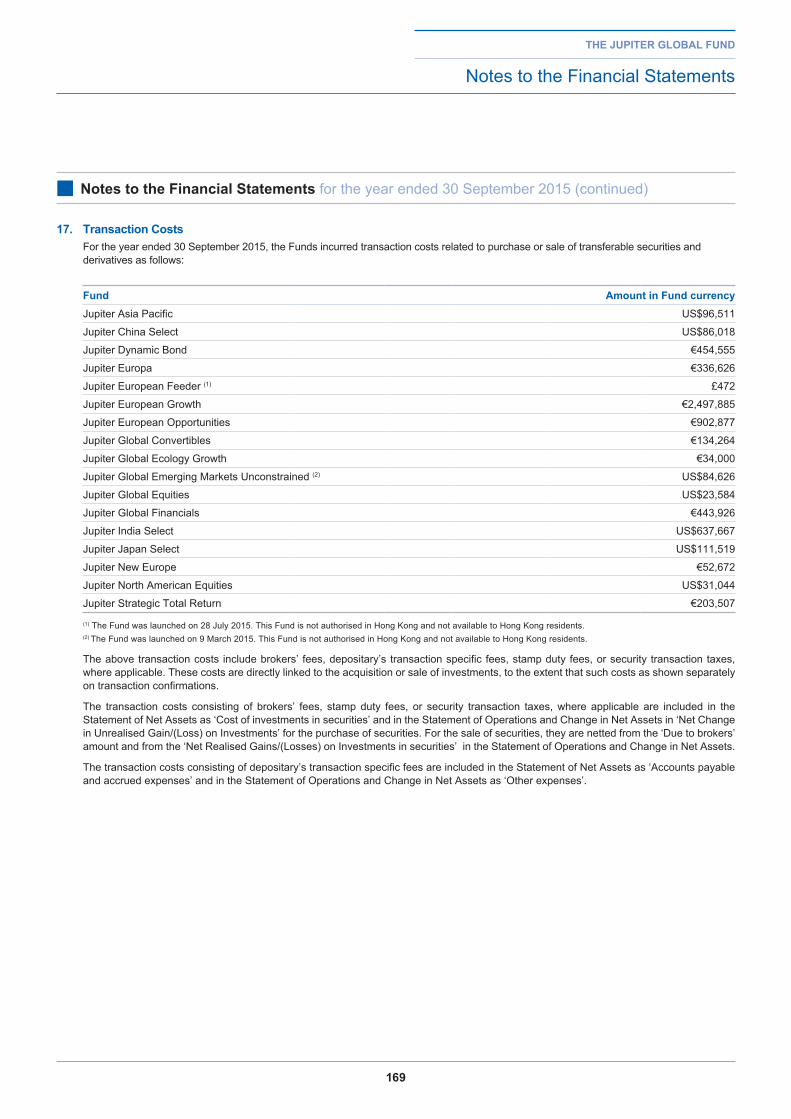
169
the jupiter global fund
Notes to the Financial Statements
■ notes to the financial Statements for the year ended 30 September 2015 (continued)
17. transaction Costs For the year ended 30 September 2015, the Funds incurred transaction costs related to purchase or sale of transferable securities and
derivatives as follows:
fund amount in fund currencyJupiter Asia Pacific US$96,511
Jupiter China Select US$86,018
Jupiter Dynamic Bond €454,555
Jupiter Europa €336,626
Jupiter European Feeder (1) £472
Jupiter European Growth €2,497,885
Jupiter European Opportunities €902,877
Jupiter Global Convertibles €134,264
Jupiter Global Ecology Growth €34,000
Jupiter Global Emerging Markets Unconstrained (2) US$84,626
Jupiter Global Equities US$23,584
Jupiter Global Financials €443,926
Jupiter India Select US$637,667
Jupiter Japan Select US$111,519
Jupiter New Europe €52,672
Jupiter North American Equities US$31,044
Jupiter Strategic Total Return €203,507
(1) The Fund was launched on 28 July 2015. This Fund is not authorised in Hong Kong and not available to Hong Kong residents. (2) The Fund was launched on 9 March 2015. This Fund is not authorised in Hong Kong and not available to Hong Kong residents.
The above transaction costs include brokers’ fees, depositary’s transaction specific fees, stamp duty fees, or security transaction taxes, where applicable. These costs are directly linked to the acquisition or sale of investments, to the extent that such costs as shown separately on transaction confirmations.
The transaction costs consisting of brokers’ fees, stamp duty fees, or security transaction taxes, where applicable are included in the Statement of Net Assets as ‘Cost of investments in securities’ and in the Statement of Operations and Change in Net Assets in ‘Net Change in Unrealised Gain/(Loss) on Investments’ for the purchase of securities. For the sale of securities, they are netted from the ‘Due to brokers’ amount and from the ‘Net Realised Gains/(Losses) on Investments in securities’ in the Statement of Operations and Change in Net Assets.
The transaction costs consisting of depositary’s transaction specific fees are included in the Statement of Net Assets as ‘Accounts payable and accrued expenses’ and in the Statement of Operations and Change in Net Assets as ‘Other expenses’.
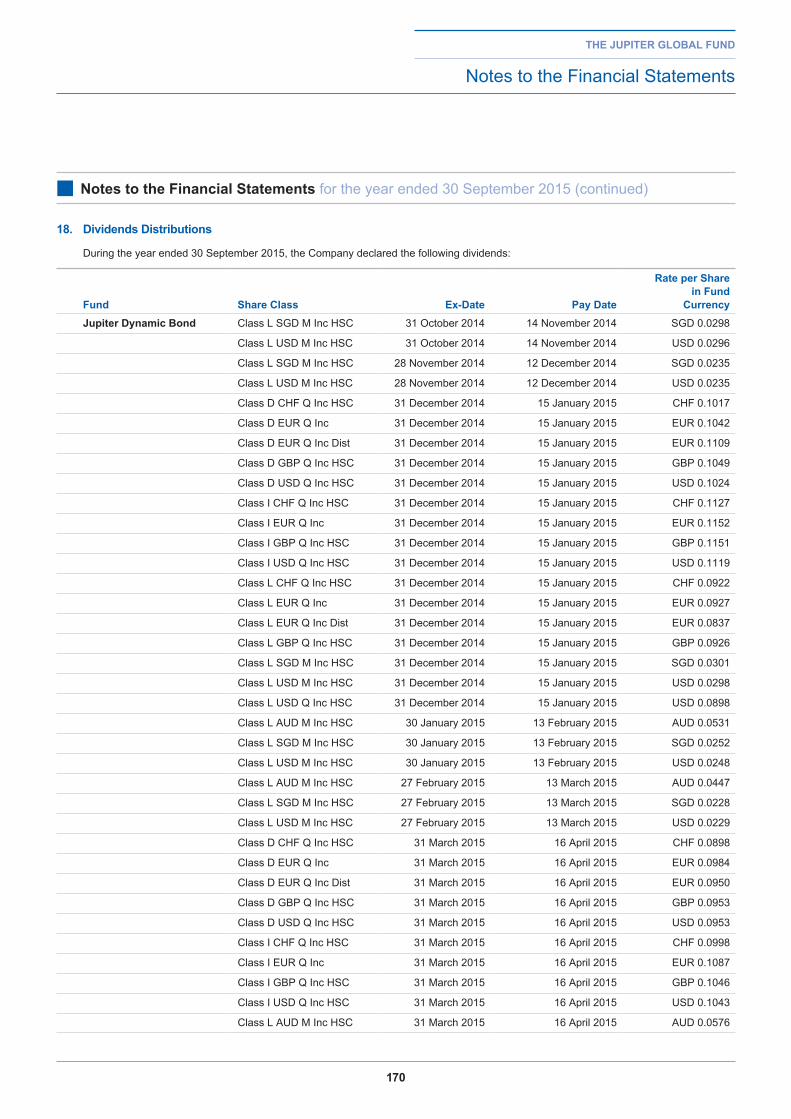
170
the jupiter global fund
Notes to the Financial Statements
■ notes to the financial Statements for the year ended 30 September 2015 (continued)
18. dividends distributions
During the year ended 30 September 2015, the Company declared the following dividends:
fund Share Class ex-date pay date
rate per Sharein fund
Currencyjupiter dynamic bond Class L SGD M Inc HSC 31 October 2014 14 November 2014 SGD 0.0298
Class L USD M Inc HSC 31 October 2014 14 November 2014 USD 0.0296
Class L SGD M Inc HSC 28 November 2014 12 December 2014 SGD 0.0235
Class L USD M Inc HSC 28 November 2014 12 December 2014 USD 0.0235
Class D CHF Q Inc HSC 31 December 2014 15 January 2015 CHF 0.1017
Class D EUR Q Inc 31 December 2014 15 January 2015 EUR 0.1042
Class D EUR Q Inc Dist 31 December 2014 15 January 2015 EUR 0.1109
Class D GBP Q Inc HSC 31 December 2014 15 January 2015 GBP 0.1049
Class D USD Q Inc HSC 31 December 2014 15 January 2015 USD 0.1024
Class I CHF Q Inc HSC 31 December 2014 15 January 2015 CHF 0.1127
Class I EUR Q Inc 31 December 2014 15 January 2015 EUR 0.1152
Class I GBP Q Inc HSC 31 December 2014 15 January 2015 GBP 0.1151
Class I USD Q Inc HSC 31 December 2014 15 January 2015 USD 0.1119
Class L CHF Q Inc HSC 31 December 2014 15 January 2015 CHF 0.0922
Class L EUR Q Inc 31 December 2014 15 January 2015 EUR 0.0927
Class L EUR Q Inc Dist 31 December 2014 15 January 2015 EUR 0.0837
Class L GBP Q Inc HSC 31 December 2014 15 January 2015 GBP 0.0926
Class L SGD M Inc HSC 31 December 2014 15 January 2015 SGD 0.0301
Class L USD M Inc HSC 31 December 2014 15 January 2015 USD 0.0298
Class L USD Q Inc HSC 31 December 2014 15 January 2015 USD 0.0898
Class L AUD M Inc HSC 30 January 2015 13 February 2015 AUD 0.0531
Class L SGD M Inc HSC 30 January 2015 13 February 2015 SGD 0.0252
Class L USD M Inc HSC 30 January 2015 13 February 2015 USD 0.0248
Class L AUD M Inc HSC 27 February 2015 13 March 2015 AUD 0.0447
Class L SGD M Inc HSC 27 February 2015 13 March 2015 SGD 0.0228
Class L USD M Inc HSC 27 February 2015 13 March 2015 USD 0.0229
Class D CHF Q Inc HSC 31 March 2015 16 April 2015 CHF 0.0898
Class D EUR Q Inc 31 March 2015 16 April 2015 EUR 0.0984
Class D EUR Q Inc Dist 31 March 2015 16 April 2015 EUR 0.0950
Class D GBP Q Inc HSC 31 March 2015 16 April 2015 GBP 0.0953
Class D USD Q Inc HSC 31 March 2015 16 April 2015 USD 0.0953
Class I CHF Q Inc HSC 31 March 2015 16 April 2015 CHF 0.0998
Class I EUR Q Inc 31 March 2015 16 April 2015 EUR 0.1087
Class I GBP Q Inc HSC 31 March 2015 16 April 2015 GBP 0.1046
Class I USD Q Inc HSC 31 March 2015 16 April 2015 USD 0.1043
Class L AUD M Inc HSC 31 March 2015 16 April 2015 AUD 0.0576
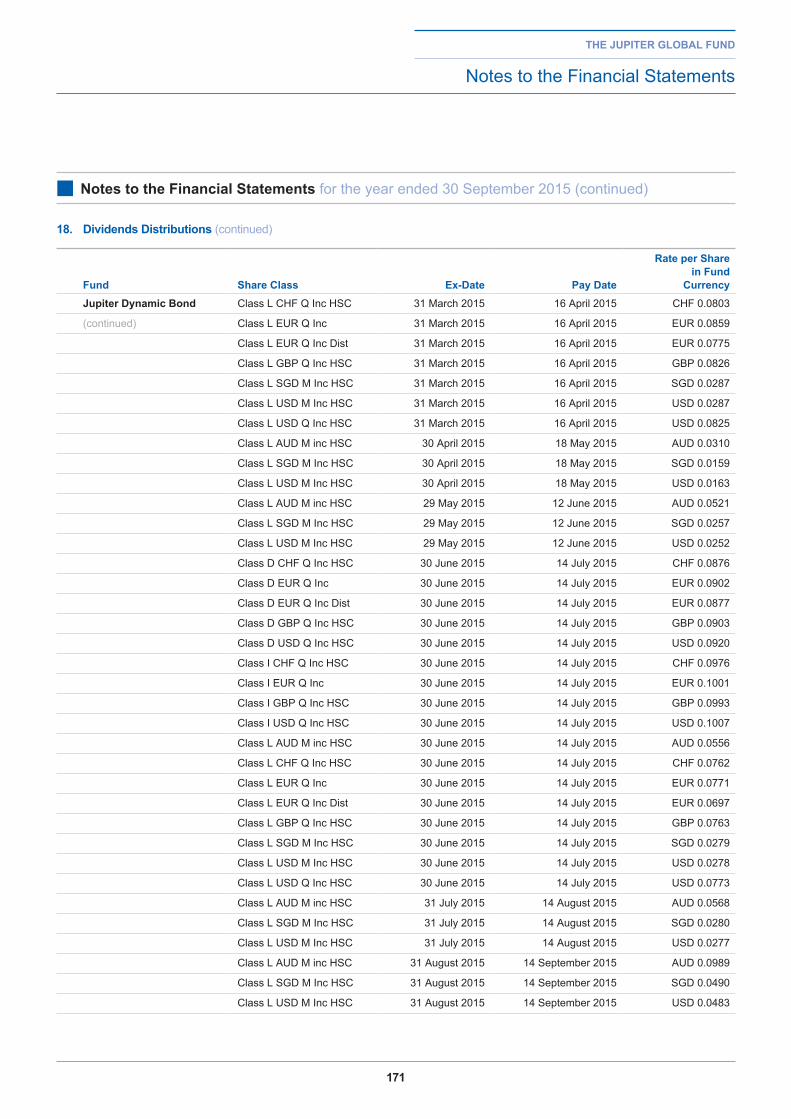
171
the jupiter global fund
Notes to the Financial Statements
■ notes to the financial Statements for the year ended 30 September 2015 (continued)
18. dividends distributions (continued)
fund Share Class ex-date pay date
rate per Sharein fund
Currencyjupiter dynamic bond Class L CHF Q Inc HSC 31 March 2015 16 April 2015 CHF 0.0803
(continued) Class L EUR Q Inc 31 March 2015 16 April 2015 EUR 0.0859
Class L EUR Q Inc Dist 31 March 2015 16 April 2015 EUR 0.0775
Class L GBP Q Inc HSC 31 March 2015 16 April 2015 GBP 0.0826
Class L SGD M Inc HSC 31 March 2015 16 April 2015 SGD 0.0287
Class L USD M Inc HSC 31 March 2015 16 April 2015 USD 0.0287
Class L USD Q Inc HSC 31 March 2015 16 April 2015 USD 0.0825
Class L AUD M inc HSC 30 April 2015 18 May 2015 AUD 0.0310
Class L SGD M Inc HSC 30 April 2015 18 May 2015 SGD 0.0159
Class L USD M Inc HSC 30 April 2015 18 May 2015 USD 0.0163
Class L AUD M inc HSC 29 May 2015 12 June 2015 AUD 0.0521
Class L SGD M Inc HSC 29 May 2015 12 June 2015 SGD 0.0257
Class L USD M Inc HSC 29 May 2015 12 June 2015 USD 0.0252
Class D CHF Q Inc HSC 30 June 2015 14 July 2015 CHF 0.0876
Class D EUR Q Inc 30 June 2015 14 July 2015 EUR 0.0902
Class D EUR Q Inc Dist 30 June 2015 14 July 2015 EUR 0.0877
Class D GBP Q Inc HSC 30 June 2015 14 July 2015 GBP 0.0903
Class D USD Q Inc HSC 30 June 2015 14 July 2015 USD 0.0920
Class I CHF Q Inc HSC 30 June 2015 14 July 2015 CHF 0.0976
Class I EUR Q Inc 30 June 2015 14 July 2015 EUR 0.1001
Class I GBP Q Inc HSC 30 June 2015 14 July 2015 GBP 0.0993
Class I USD Q Inc HSC 30 June 2015 14 July 2015 USD 0.1007
Class L AUD M inc HSC 30 June 2015 14 July 2015 AUD 0.0556
Class L CHF Q Inc HSC 30 June 2015 14 July 2015 CHF 0.0762
Class L EUR Q Inc 30 June 2015 14 July 2015 EUR 0.0771
Class L EUR Q Inc Dist 30 June 2015 14 July 2015 EUR 0.0697
Class L GBP Q Inc HSC 30 June 2015 14 July 2015 GBP 0.0763
Class L SGD M Inc HSC 30 June 2015 14 July 2015 SGD 0.0279
Class L USD M Inc HSC 30 June 2015 14 July 2015 USD 0.0278
Class L USD Q Inc HSC 30 June 2015 14 July 2015 USD 0.0773
Class L AUD M inc HSC 31 July 2015 14 August 2015 AUD 0.0568
Class L SGD M Inc HSC 31 July 2015 14 August 2015 SGD 0.0280
Class L USD M Inc HSC 31 July 2015 14 August 2015 USD 0.0277
Class L AUD M inc HSC 31 August 2015 14 September 2015 AUD 0.0989
Class L SGD M Inc HSC 31 August 2015 14 September 2015 SGD 0.0490
Class L USD M Inc HSC 31 August 2015 14 September 2015 USD 0.0483
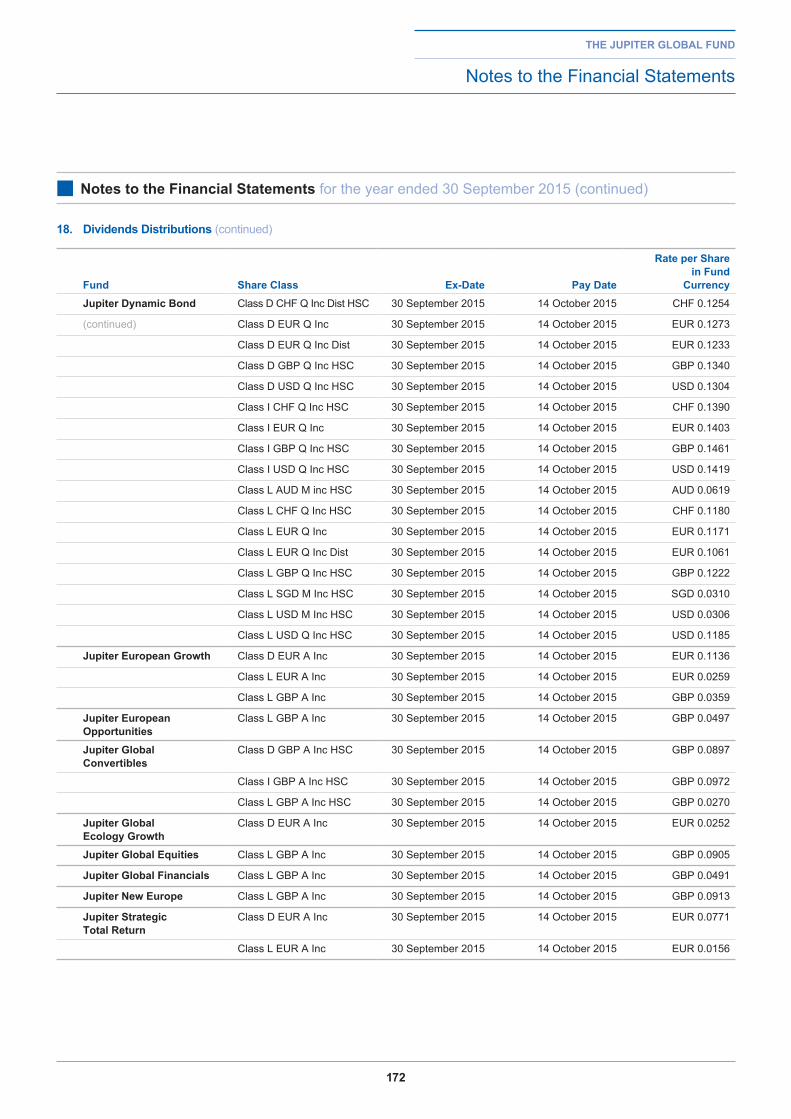
172
the jupiter global fund
Notes to the Financial Statements
■ notes to the financial Statements for the year ended 30 September 2015 (continued)
18. dividends distributions (continued)
fund Share Class ex-date pay date
rate per Sharein fund
Currencyjupiter dynamic bond Class D CHF Q Inc Dist HSC 30 September 2015 14 October 2015 CHF 0.1254
(continued) Class D EUR Q Inc 30 September 2015 14 October 2015 EUR 0.1273
Class D EUR Q Inc Dist 30 September 2015 14 October 2015 EUR 0.1233
Class D GBP Q Inc HSC 30 September 2015 14 October 2015 GBP 0.1340
Class D USD Q Inc HSC 30 September 2015 14 October 2015 USD 0.1304
Class I CHF Q Inc HSC 30 September 2015 14 October 2015 CHF 0.1390
Class I EUR Q Inc 30 September 2015 14 October 2015 EUR 0.1403
Class I GBP Q Inc HSC 30 September 2015 14 October 2015 GBP 0.1461
Class I USD Q Inc HSC 30 September 2015 14 October 2015 USD 0.1419
Class L AUD M inc HSC 30 September 2015 14 October 2015 AUD 0.0619
Class L CHF Q Inc HSC 30 September 2015 14 October 2015 CHF 0.1180
Class L EUR Q Inc 30 September 2015 14 October 2015 EUR 0.1171
Class L EUR Q Inc Dist 30 September 2015 14 October 2015 EUR 0.1061
Class L GBP Q Inc HSC 30 September 2015 14 October 2015 GBP 0.1222
Class L SGD M Inc HSC 30 September 2015 14 October 2015 SGD 0.0310
Class L USD M Inc HSC 30 September 2015 14 October 2015 USD 0.0306
Class L USD Q Inc HSC 30 September 2015 14 October 2015 USD 0.1185
jupiter european growth Class D EUR A Inc 30 September 2015 14 October 2015 EUR 0.1136
Class L EUR A Inc 30 September 2015 14 October 2015 EUR 0.0259
Class L GBP A Inc 30 September 2015 14 October 2015 GBP 0.0359
jupiter european opportunities
Class L GBP A Inc 30 September 2015 14 October 2015 GBP 0.0497
jupiter global Convertibles
Class D GBP A Inc HSC 30 September 2015 14 October 2015 GBP 0.0897
Class I GBP A Inc HSC 30 September 2015 14 October 2015 GBP 0.0972
Class L GBP A Inc HSC 30 September 2015 14 October 2015 GBP 0.0270
jupiter global ecology growth
Class D EUR A Inc 30 September 2015 14 October 2015 EUR 0.0252
jupiter global equities Class L GBP A Inc 30 September 2015 14 October 2015 GBP 0.0905
jupiter global financials Class L GBP A Inc 30 September 2015 14 October 2015 GBP 0.0491
jupiter new europe Class L GBP A Inc 30 September 2015 14 October 2015 GBP 0.0913
jupiter Strategic total return
Class D EUR A Inc 30 September 2015 14 October 2015 EUR 0.0771
Class L EUR A Inc 30 September 2015 14 October 2015 EUR 0.0156
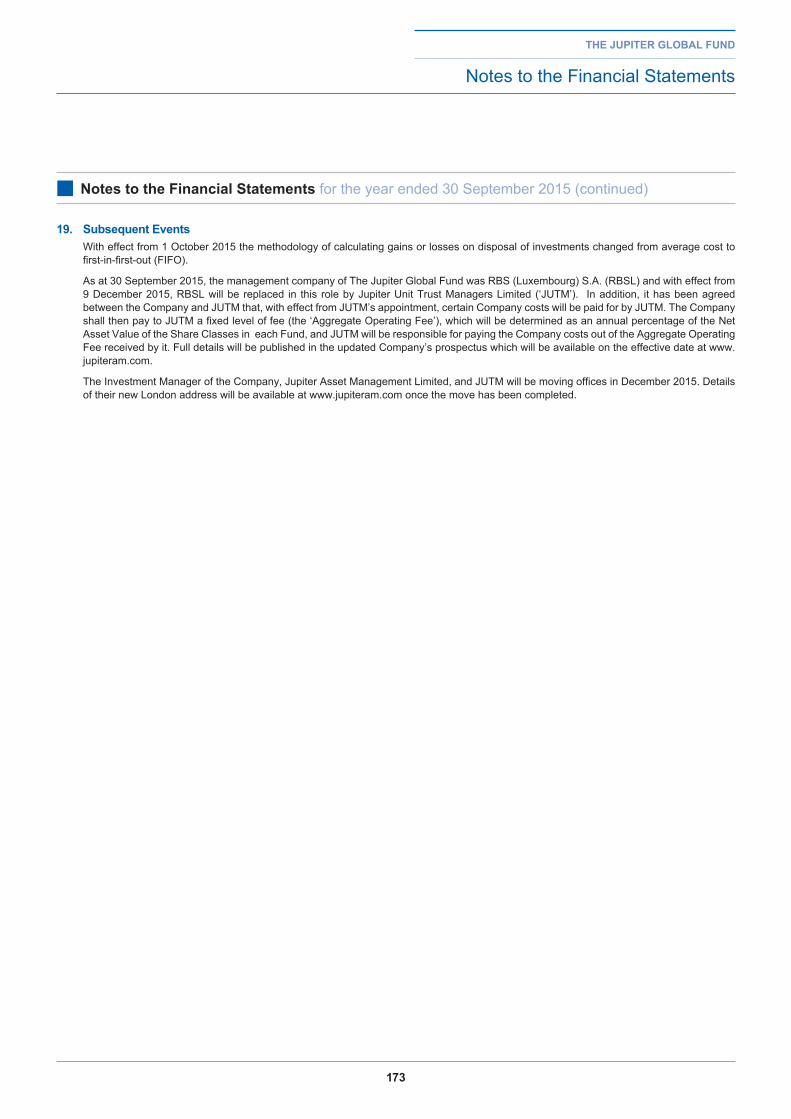
173
the jupiter global fund
Notes to the Financial Statements
■ notes to the financial Statements for the year ended 30 September 2015 (continued)
19. Subsequent events With effect from 1 October 2015 the methodology of calculating gains or losses on disposal of investments changed from average cost to
first-in-first-out (FIFO).
As at 30 September 2015, the management company of The Jupiter Global Fund was RBS (Luxembourg) S.A. (RBSL) and with effect from 9 December 2015, RBSL will be replaced in this role by Jupiter Unit Trust Managers Limited (‘JUTM’). In addition, it has been agreed between the Company and JUTM that, with effect from JUTM’s appointment, certain Company costs will be paid for by JUTM. The Company shall then pay to JUTM a fixed level of fee (the ‘Aggregate Operating Fee’), which will be determined as an annual percentage of the Net Asset Value of the Share Classes in each Fund, and JUTM will be responsible for paying the Company costs out of the Aggregate Operating Fee received by it. Full details will be published in the updated Company’s prospectus which will be available on the effective date at www.jupiteram.com.
The Investment Manager of the Company, Jupiter Asset Management Limited, and JUTM will be moving offices in December 2015. Details of their new London address will be available at www.jupiteram.com once the move has been completed.
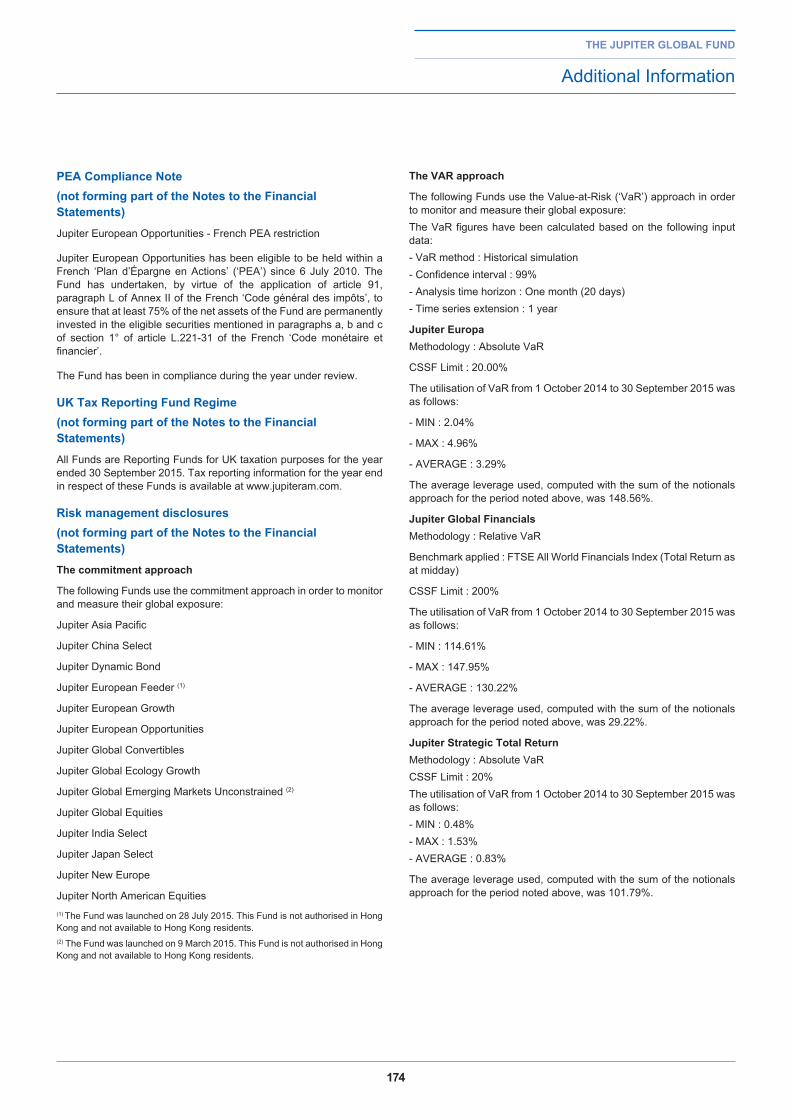
174
the jupiter global fund
Additional Information
■ notes to the financial Statements for the six months endedpea Compliance note (not forming part of the notes to the financial Statements)Jupiter European Opportunities - French PEA restriction
Jupiter European Opportunities has been eligible to be held within a French ‘Plan d’Épargne en Actions’ (‘PEA’) since 6 July 2010. The Fund has undertaken, by virtue of the application of article 91, paragraph L of Annex II of the French ‘Code général des impôts’, to ensure that at least 75% of the net assets of the Fund are permanently invested in the eligible securities mentioned in paragraphs a, b and c of section 1° of article L.221-31 of the French ‘Code monétaire et financier’.
The Fund has been in compliance during the year under review.
uK tax reporting fund regime(not forming part of the notes to the financial Statements)All Funds are Reporting Funds for UK taxation purposes for the year ended 30 September 2015. Tax reporting information for the year end in respect of these Funds is available at www.jupiteram.com.
risk management disclosures (not forming part of the notes to the financial Statements)the commitment approach
The following Funds use the commitment approach in order to monitor and measure their global exposure:
Jupiter Asia Pacific
Jupiter China Select
Jupiter Dynamic Bond
Jupiter European Feeder (1)
Jupiter European Growth
Jupiter European Opportunities
Jupiter Global Convertibles
Jupiter Global Ecology Growth
Jupiter Global Emerging Markets Unconstrained (2)
Jupiter Global Equities
Jupiter India Select
Jupiter Japan Select
Jupiter New Europe
Jupiter North American Equities (1) The Fund was launched on 28 July 2015. This Fund is not authorised in Hong Kong and not available to Hong Kong residents.(2) The Fund was launched on 9 March 2015. This Fund is not authorised in Hong Kong and not available to Hong Kong residents.
the Var approach
The following Funds use the Value-at-Risk (‘VaR’) approach in order to monitor and measure their global exposure:The VaR figures have been calculated based on the following input data:- VaR method : Historical simulation- Confidence interval : 99%- Analysis time horizon : One month (20 days)- Time series extension : 1 year
jupiter europa Methodology : Absolute VaR
CSSF Limit : 20.00%
The utilisation of VaR from 1 October 2014 to 30 September 2015 was as follows:
- MIN : 2.04%
- MAX : 4.96%
- AVERAGE : 3.29%
The average leverage used, computed with the sum of the notionals approach for the period noted above, was 148.56%.
jupiter global financialsMethodology : Relative VaR
Benchmark applied : FTSE All World Financials Index (Total Return as at midday)
CSSF Limit : 200%
The utilisation of VaR from 1 October 2014 to 30 September 2015 was as follows:
- MIN : 114.61%
- MAX : 147.95%
- AVERAGE : 130.22%
The average leverage used, computed with the sum of the notionals approach for the period noted above, was 29.22%.
jupiter Strategic total return Methodology : Absolute VaRCSSF Limit : 20%The utilisation of VaR from 1 October 2014 to 30 September 2015 was as follows:- MIN : 0.48%- MAX : 1.53%- AVERAGE : 0.83%
The average leverage used, computed with the sum of the notionals approach for the period noted above, was 101.79%.
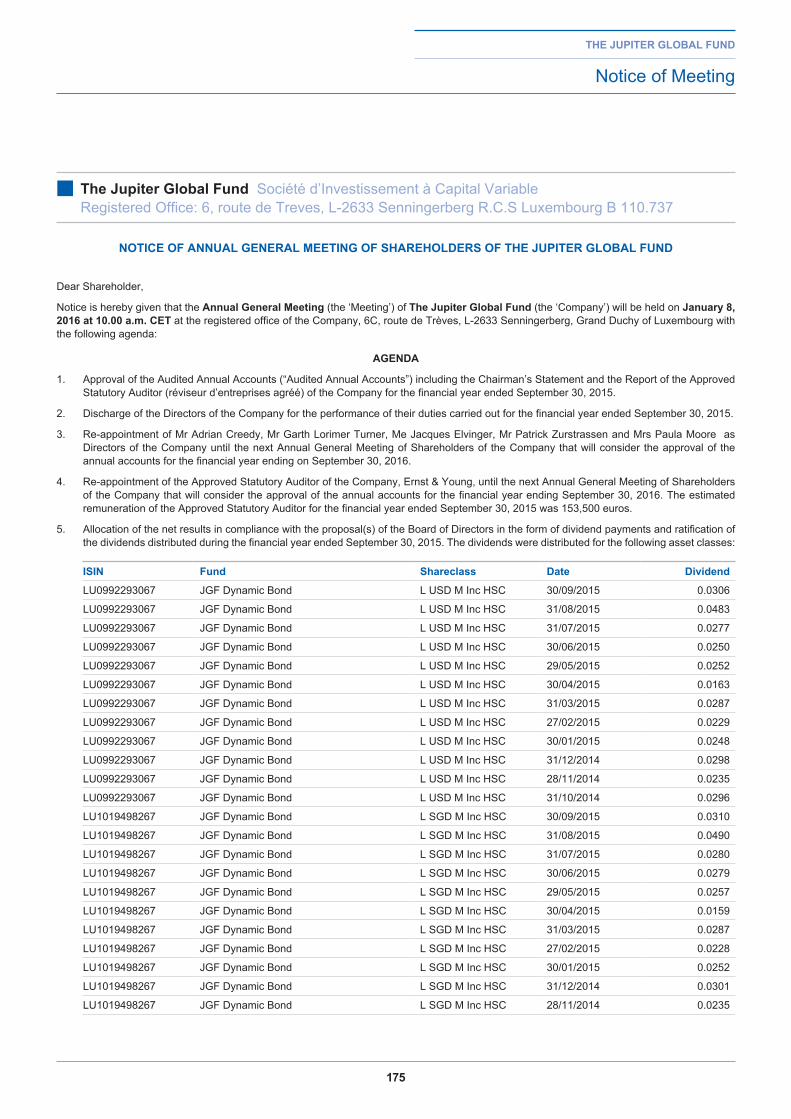
175
the jupiter global fund
Notice of Meeting
notiCe of annual general Meeting of ShareholderS of the jupiter global fund
Dear Shareholder,
Notice is hereby given that the annual general Meeting (the ‘Meeting’) of the jupiter global fund (the ‘Company’) will be held on january 8, 2016 at 10.00 a.m. Cet at the registered office of the Company, 6C, route de Trèves, L-2633 Senningerberg, Grand Duchy of Luxembourg with the following agenda:
agenda
1. Approval of the Audited Annual Accounts (“Audited Annual Accounts”) including the Chairman’s Statement and the Report of the Approved Statutory Auditor (réviseur d’entreprises agréé) of the Company for the financial year ended September 30, 2015.
2. Discharge of the Directors of the Company for the performance of their duties carried out for the financial year ended September 30, 2015.
3. Re-appointment of Mr Adrian Creedy, Mr Garth Lorimer Turner, Me Jacques Elvinger, Mr Patrick Zurstrassen and Mrs Paula Moore as Directors of the Company until the next Annual General Meeting of Shareholders of the Company that will consider the approval of the annual accounts for the financial year ending on September 30, 2016.
4. Re-appointment of the Approved Statutory Auditor of the Company, Ernst & Young, until the next Annual General Meeting of Shareholders of the Company that will consider the approval of the annual accounts for the financial year ending September 30, 2016. The estimated remuneration of the Approved Statutory Auditor for the financial year ended September 30, 2015 was 153,500 euros.
5. Allocation of the net results in compliance with the proposal(s) of the Board of Directors in the form of dividend payments and ratification of the dividends distributed during the financial year ended September 30, 2015. The dividends were distributed for the following asset classes:
iSin fund Shareclass date dividend
LU0992293067 JGF Dynamic Bond L USD M Inc HSC 30/09/2015 0.0306
LU0992293067 JGF Dynamic Bond L USD M Inc HSC 31/08/2015 0.0483
LU0992293067 JGF Dynamic Bond L USD M Inc HSC 31/07/2015 0.0277
LU0992293067 JGF Dynamic Bond L USD M Inc HSC 30/06/2015 0.0250
LU0992293067 JGF Dynamic Bond L USD M Inc HSC 29/05/2015 0.0252
LU0992293067 JGF Dynamic Bond L USD M Inc HSC 30/04/2015 0.0163
LU0992293067 JGF Dynamic Bond L USD M Inc HSC 31/03/2015 0.0287
LU0992293067 JGF Dynamic Bond L USD M Inc HSC 27/02/2015 0.0229
LU0992293067 JGF Dynamic Bond L USD M Inc HSC 30/01/2015 0.0248
LU0992293067 JGF Dynamic Bond L USD M Inc HSC 31/12/2014 0.0298
LU0992293067 JGF Dynamic Bond L USD M Inc HSC 28/11/2014 0.0235
LU0992293067 JGF Dynamic Bond L USD M Inc HSC 31/10/2014 0.0296
LU1019498267 JGF Dynamic Bond L SGD M Inc HSC 30/09/2015 0.0310
LU1019498267 JGF Dynamic Bond L SGD M Inc HSC 31/08/2015 0.0490
LU1019498267 JGF Dynamic Bond L SGD M Inc HSC 31/07/2015 0.0280
LU1019498267 JGF Dynamic Bond L SGD M Inc HSC 30/06/2015 0.0279
LU1019498267 JGF Dynamic Bond L SGD M Inc HSC 29/05/2015 0.0257
LU1019498267 JGF Dynamic Bond L SGD M Inc HSC 30/04/2015 0.0159
LU1019498267 JGF Dynamic Bond L SGD M Inc HSC 31/03/2015 0.0287
LU1019498267 JGF Dynamic Bond L SGD M Inc HSC 27/02/2015 0.0228
LU1019498267 JGF Dynamic Bond L SGD M Inc HSC 30/01/2015 0.0252
LU1019498267 JGF Dynamic Bond L SGD M Inc HSC 31/12/2014 0.0301
LU1019498267 JGF Dynamic Bond L SGD M Inc HSC 28/11/2014 0.0235
■ the jupiter global fund Société d’Investissement à Capital Variable Registered Office: 6, route de Treves, L-2633 Senningerberg R.C.S Luxembourg B 110.737
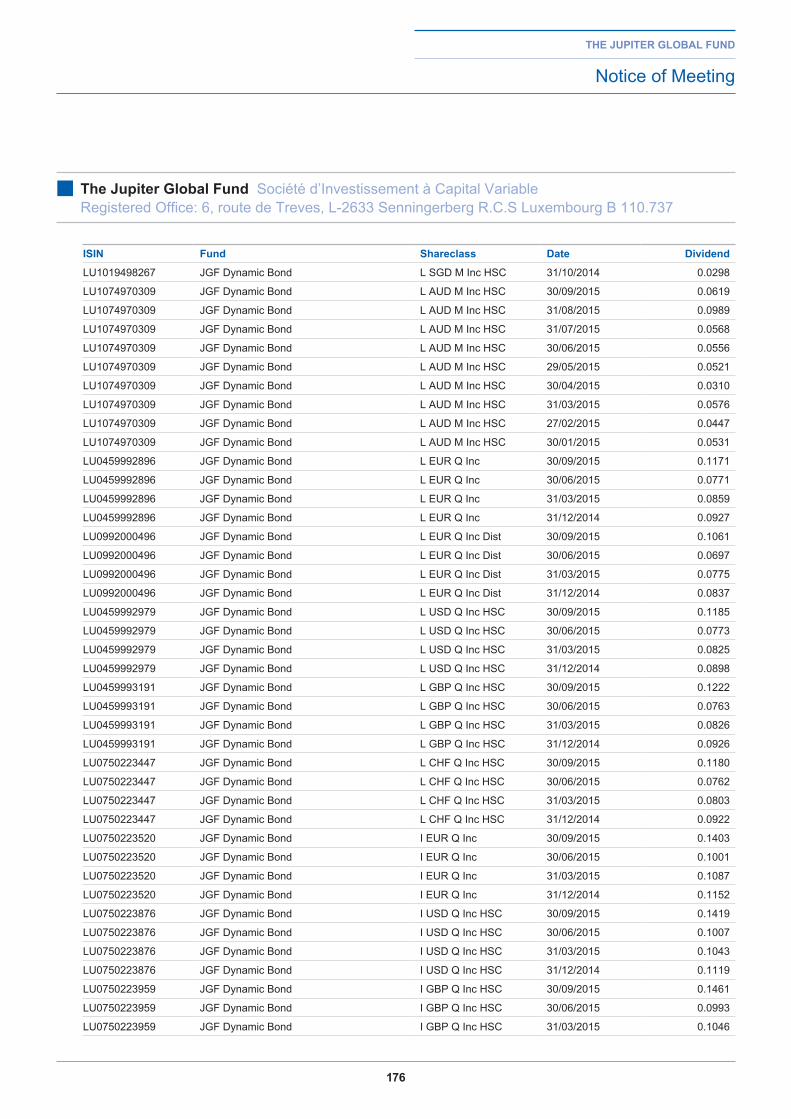
176
the jupiter global fund
Notice of Meeting
iSin fund Shareclass date dividend
LU1019498267 JGF Dynamic Bond L SGD M Inc HSC 31/10/2014 0.0298
LU1074970309 JGF Dynamic Bond L AUD M Inc HSC 30/09/2015 0.0619
LU1074970309 JGF Dynamic Bond L AUD M Inc HSC 31/08/2015 0.0989
LU1074970309 JGF Dynamic Bond L AUD M Inc HSC 31/07/2015 0.0568
LU1074970309 JGF Dynamic Bond L AUD M Inc HSC 30/06/2015 0.0556
LU1074970309 JGF Dynamic Bond L AUD M Inc HSC 29/05/2015 0.0521
LU1074970309 JGF Dynamic Bond L AUD M Inc HSC 30/04/2015 0.0310
LU1074970309 JGF Dynamic Bond L AUD M Inc HSC 31/03/2015 0.0576
LU1074970309 JGF Dynamic Bond L AUD M Inc HSC 27/02/2015 0.0447
LU1074970309 JGF Dynamic Bond L AUD M Inc HSC 30/01/2015 0.0531
LU0459992896 JGF Dynamic Bond L EUR Q Inc 30/09/2015 0.1171
LU0459992896 JGF Dynamic Bond L EUR Q Inc 30/06/2015 0.0771
LU0459992896 JGF Dynamic Bond L EUR Q Inc 31/03/2015 0.0859
LU0459992896 JGF Dynamic Bond L EUR Q Inc 31/12/2014 0.0927
LU0992000496 JGF Dynamic Bond L EUR Q Inc Dist 30/09/2015 0.1061
LU0992000496 JGF Dynamic Bond L EUR Q Inc Dist 30/06/2015 0.0697
LU0992000496 JGF Dynamic Bond L EUR Q Inc Dist 31/03/2015 0.0775
LU0992000496 JGF Dynamic Bond L EUR Q Inc Dist 31/12/2014 0.0837
LU0459992979 JGF Dynamic Bond L USD Q Inc HSC 30/09/2015 0.1185
LU0459992979 JGF Dynamic Bond L USD Q Inc HSC 30/06/2015 0.0773
LU0459992979 JGF Dynamic Bond L USD Q Inc HSC 31/03/2015 0.0825
LU0459992979 JGF Dynamic Bond L USD Q Inc HSC 31/12/2014 0.0898
LU0459993191 JGF Dynamic Bond L GBP Q Inc HSC 30/09/2015 0.1222
LU0459993191 JGF Dynamic Bond L GBP Q Inc HSC 30/06/2015 0.0763
LU0459993191 JGF Dynamic Bond L GBP Q Inc HSC 31/03/2015 0.0826
LU0459993191 JGF Dynamic Bond L GBP Q Inc HSC 31/12/2014 0.0926
LU0750223447 JGF Dynamic Bond L CHF Q Inc HSC 30/09/2015 0.1180
LU0750223447 JGF Dynamic Bond L CHF Q Inc HSC 30/06/2015 0.0762
LU0750223447 JGF Dynamic Bond L CHF Q Inc HSC 31/03/2015 0.0803
LU0750223447 JGF Dynamic Bond L CHF Q Inc HSC 31/12/2014 0.0922
LU0750223520 JGF Dynamic Bond I EUR Q Inc 30/09/2015 0.1403
LU0750223520 JGF Dynamic Bond I EUR Q Inc 30/06/2015 0.1001
LU0750223520 JGF Dynamic Bond I EUR Q Inc 31/03/2015 0.1087
LU0750223520 JGF Dynamic Bond I EUR Q Inc 31/12/2014 0.1152
LU0750223876 JGF Dynamic Bond I USD Q Inc HSC 30/09/2015 0.1419
LU0750223876 JGF Dynamic Bond I USD Q Inc HSC 30/06/2015 0.1007
LU0750223876 JGF Dynamic Bond I USD Q Inc HSC 31/03/2015 0.1043
LU0750223876 JGF Dynamic Bond I USD Q Inc HSC 31/12/2014 0.1119
LU0750223959 JGF Dynamic Bond I GBP Q Inc HSC 30/09/2015 0.1461
LU0750223959 JGF Dynamic Bond I GBP Q Inc HSC 30/06/2015 0.0993
LU0750223959 JGF Dynamic Bond I GBP Q Inc HSC 31/03/2015 0.1046
■ the jupiter global fund Société d’Investissement à Capital Variable Registered Office: 6, route de Treves, L-2633 Senningerberg R.C.S Luxembourg B 110.737
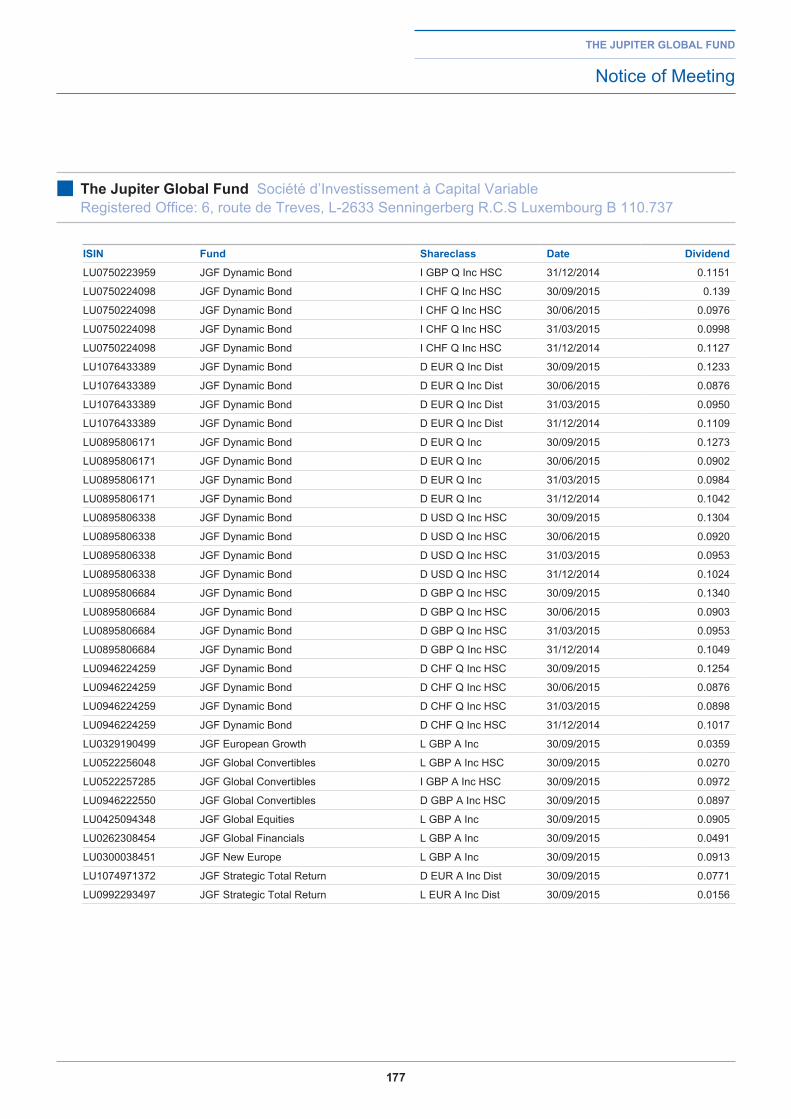
177
the jupiter global fund
Notice of Meeting
iSin fund Shareclass date dividend
LU0750223959 JGF Dynamic Bond I GBP Q Inc HSC 31/12/2014 0.1151
LU0750224098 JGF Dynamic Bond I CHF Q Inc HSC 30/09/2015 0.139
LU0750224098 JGF Dynamic Bond I CHF Q Inc HSC 30/06/2015 0.0976
LU0750224098 JGF Dynamic Bond I CHF Q Inc HSC 31/03/2015 0.0998
LU0750224098 JGF Dynamic Bond I CHF Q Inc HSC 31/12/2014 0.1127
LU1076433389 JGF Dynamic Bond D EUR Q Inc Dist 30/09/2015 0.1233
LU1076433389 JGF Dynamic Bond D EUR Q Inc Dist 30/06/2015 0.0876
LU1076433389 JGF Dynamic Bond D EUR Q Inc Dist 31/03/2015 0.0950
LU1076433389 JGF Dynamic Bond D EUR Q Inc Dist 31/12/2014 0.1109
LU0895806171 JGF Dynamic Bond D EUR Q Inc 30/09/2015 0.1273
LU0895806171 JGF Dynamic Bond D EUR Q Inc 30/06/2015 0.0902
LU0895806171 JGF Dynamic Bond D EUR Q Inc 31/03/2015 0.0984
LU0895806171 JGF Dynamic Bond D EUR Q Inc 31/12/2014 0.1042
LU0895806338 JGF Dynamic Bond D USD Q Inc HSC 30/09/2015 0.1304
LU0895806338 JGF Dynamic Bond D USD Q Inc HSC 30/06/2015 0.0920
LU0895806338 JGF Dynamic Bond D USD Q Inc HSC 31/03/2015 0.0953
LU0895806338 JGF Dynamic Bond D USD Q Inc HSC 31/12/2014 0.1024
LU0895806684 JGF Dynamic Bond D GBP Q Inc HSC 30/09/2015 0.1340
LU0895806684 JGF Dynamic Bond D GBP Q Inc HSC 30/06/2015 0.0903
LU0895806684 JGF Dynamic Bond D GBP Q Inc HSC 31/03/2015 0.0953
LU0895806684 JGF Dynamic Bond D GBP Q Inc HSC 31/12/2014 0.1049
LU0946224259 JGF Dynamic Bond D CHF Q Inc HSC 30/09/2015 0.1254
LU0946224259 JGF Dynamic Bond D CHF Q Inc HSC 30/06/2015 0.0876
LU0946224259 JGF Dynamic Bond D CHF Q Inc HSC 31/03/2015 0.0898
LU0946224259 JGF Dynamic Bond D CHF Q Inc HSC 31/12/2014 0.1017
LU0329190499 JGF European Growth L GBP A Inc 30/09/2015 0.0359
LU0522256048 JGF Global Convertibles L GBP A Inc HSC 30/09/2015 0.0270
LU0522257285 JGF Global Convertibles I GBP A Inc HSC 30/09/2015 0.0972
LU0946222550 JGF Global Convertibles D GBP A Inc HSC 30/09/2015 0.0897
LU0425094348 JGF Global Equities L GBP A Inc 30/09/2015 0.0905
LU0262308454 JGF Global Financials L GBP A Inc 30/09/2015 0.0491
LU0300038451 JGF New Europe L GBP A Inc 30/09/2015 0.0913
LU1074971372 JGF Strategic Total Return D EUR A Inc Dist 30/09/2015 0.0771
LU0992293497 JGF Strategic Total Return L EUR A Inc Dist 30/09/2015 0.0156
■ the jupiter global fund Société d’Investissement à Capital Variable Registered Office: 6, route de Treves, L-2633 Senningerberg R.C.S Luxembourg B 110.737
178
the jupiter global fund
Notice of Meeting
6. Approval of aggregate Directors Fees of 75,000 Euro net for the period January 1 to December 31, 2016.
Voting
Resolutions on the agenda of the Annual General Meeting will require no quorum and the resolutions will be passed by simple majority of the votes cast at the Meeting.
Voting arrangeMentS
Should you be unable to be personally present at the Meeting and wish to be represented, you are entitled to appoint a proxy to vote instead of you and in this regard we have enclosed a proxy form for your attention. In such instance, we would be grateful if you could sign the proxy form where indicated, return a copy by fax or email to arrive no later than 5.00 p.m. CET on Thursday January 7th, 2016 marked for the attention of Mr Grigore Bobina (fax + 352 46 26 85 825, email: [email protected]) and send the signed original by post marked for the attention of:
Mr Grigore Bobina,J.P. Morgan Bank Luxembourg S.A.,LXC6-6004, European Bank and Business Center, 6C, route de Trèves,L-2633 Senningerberg,Grand-Duchy of Luxembourg.
The proxy will remain in force if the Meeting, for whatever reason, is postponed.
Should you have any questions regarding the above, please do not hesitate to contact Mr Grigore Bobina on +352 46 26 85 280.
by order of the board of directors
■ the jupiter global fund Société d’Investissement à Capital Variable Registered Office: 6, route de Treves, L-2633 Senningerberg R.C.S Luxembourg B 110.737
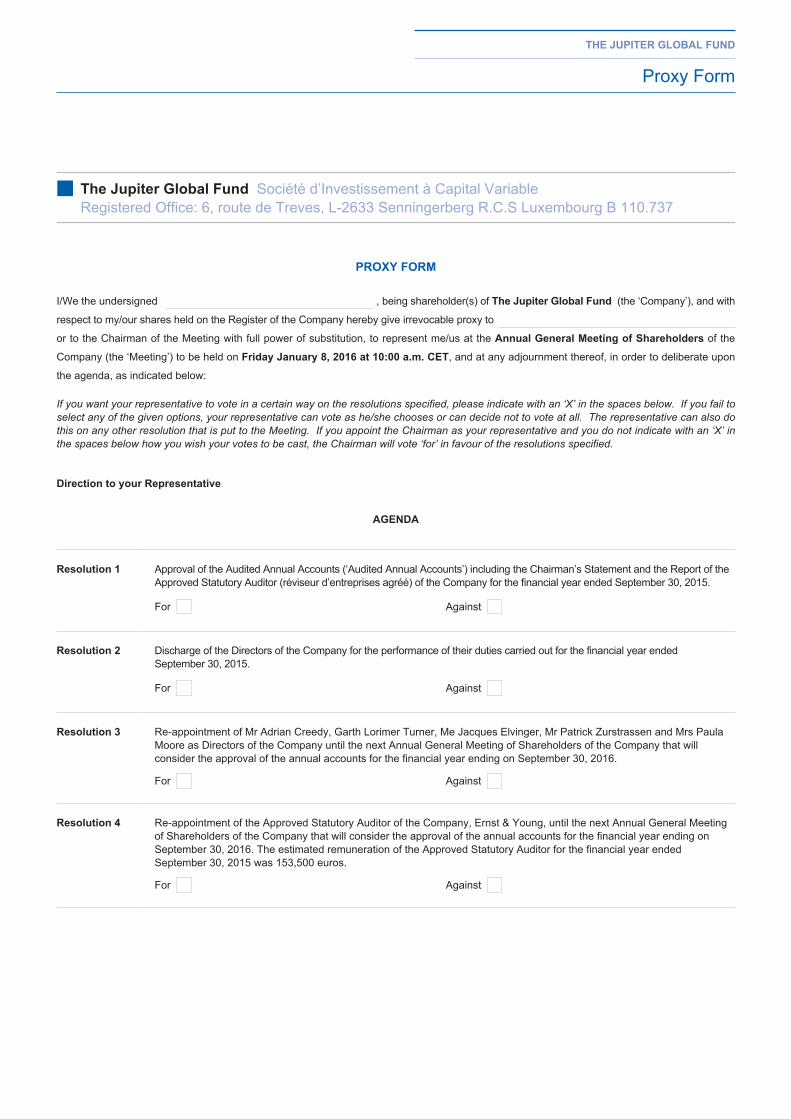
the jupiter global fund
Proxy Form
proXY forM
I/We the undersigned , being shareholder(s) of the jupiter global fund (the ‘Company’), and with
respect to my/our shares held on the Register of the Company hereby give irrevocable proxy to
or to the Chairman of the Meeting with full power of substitution, to represent me/us at the annual general Meeting of Shareholders of the
Company (the ‘Meeting’) to be held on friday january 8, 2016 at 10:00 a.m. Cet, and at any adjournment thereof, in order to deliberate upon
the agenda, as indicated below:
If you want your representative to vote in a certain way on the resolutions specified, please indicate with an ‘X’ in the spaces below. If you fail to select any of the given options, your representative can vote as he/she chooses or can decide not to vote at all. The representative can also do this on any other resolution that is put to the Meeting. If you appoint the Chairman as your representative and you do not indicate with an ‘X’ in the spaces below how you wish your votes to be cast, the Chairman will vote ‘for’ in favour of the resolutions specified.
direction to your representative
agenda
resolution 1 Approval of the Audited Annual Accounts (‘Audited Annual Accounts’) including the Chairman’s Statement and the Report of the Approved Statutory Auditor (réviseur d’entreprises agréé) of the Company for the financial year ended September 30, 2015.
For Against
resolution 2 Discharge of the Directors of the Company for the performance of their duties carried out for the financial year ended September 30, 2015.
For Against
resolution 3 Re-appointment of Mr Adrian Creedy, Garth Lorimer Turner, Me Jacques Elvinger, Mr Patrick Zurstrassen and Mrs Paula Moore as Directors of the Company until the next Annual General Meeting of Shareholders of the Company that will consider the approval of the annual accounts for the financial year ending on September 30, 2016.
For Against
resolution 4 Re-appointment of the Approved Statutory Auditor of the Company, Ernst & Young, until the next Annual General Meeting of Shareholders of the Company that will consider the approval of the annual accounts for the financial year ending on September 30, 2016. The estimated remuneration of the Approved Statutory Auditor for the financial year ended September 30, 2015 was 153,500 euros.
For Against
■ the jupiter global fund Société d’Investissement à Capital Variable Registered Office: 6, route de Treves, L-2633 Senningerberg R.C.S Luxembourg B 110.737
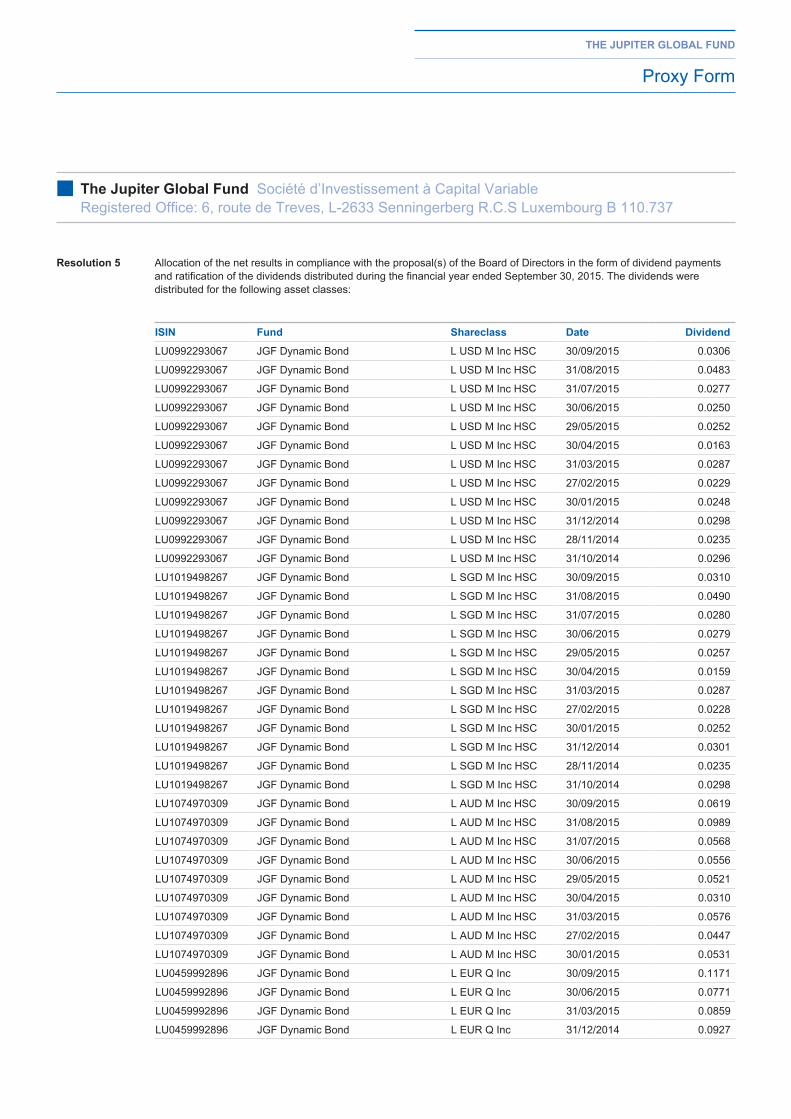
resolution 5 Allocation of the net results in compliance with the proposal(s) of the Board of Directors in the form of dividend payments
and ratification of the dividends distributed during the financial year ended September 30, 2015. The dividends were distributed for the following asset classes:
the jupiter global fund
Proxy Form
iSin fund Shareclass date dividend
LU0992293067 JGF Dynamic Bond L USD M Inc HSC 30/09/2015 0.0306
LU0992293067 JGF Dynamic Bond L USD M Inc HSC 31/08/2015 0.0483
LU0992293067 JGF Dynamic Bond L USD M Inc HSC 31/07/2015 0.0277
LU0992293067 JGF Dynamic Bond L USD M Inc HSC 30/06/2015 0.0250
LU0992293067 JGF Dynamic Bond L USD M Inc HSC 29/05/2015 0.0252
LU0992293067 JGF Dynamic Bond L USD M Inc HSC 30/04/2015 0.0163
LU0992293067 JGF Dynamic Bond L USD M Inc HSC 31/03/2015 0.0287
LU0992293067 JGF Dynamic Bond L USD M Inc HSC 27/02/2015 0.0229
LU0992293067 JGF Dynamic Bond L USD M Inc HSC 30/01/2015 0.0248
LU0992293067 JGF Dynamic Bond L USD M Inc HSC 31/12/2014 0.0298
LU0992293067 JGF Dynamic Bond L USD M Inc HSC 28/11/2014 0.0235
LU0992293067 JGF Dynamic Bond L USD M Inc HSC 31/10/2014 0.0296
LU1019498267 JGF Dynamic Bond L SGD M Inc HSC 30/09/2015 0.0310
LU1019498267 JGF Dynamic Bond L SGD M Inc HSC 31/08/2015 0.0490
LU1019498267 JGF Dynamic Bond L SGD M Inc HSC 31/07/2015 0.0280
LU1019498267 JGF Dynamic Bond L SGD M Inc HSC 30/06/2015 0.0279
LU1019498267 JGF Dynamic Bond L SGD M Inc HSC 29/05/2015 0.0257
LU1019498267 JGF Dynamic Bond L SGD M Inc HSC 30/04/2015 0.0159
LU1019498267 JGF Dynamic Bond L SGD M Inc HSC 31/03/2015 0.0287
LU1019498267 JGF Dynamic Bond L SGD M Inc HSC 27/02/2015 0.0228
LU1019498267 JGF Dynamic Bond L SGD M Inc HSC 30/01/2015 0.0252
LU1019498267 JGF Dynamic Bond L SGD M Inc HSC 31/12/2014 0.0301
LU1019498267 JGF Dynamic Bond L SGD M Inc HSC 28/11/2014 0.0235
LU1019498267 JGF Dynamic Bond L SGD M Inc HSC 31/10/2014 0.0298
LU1074970309 JGF Dynamic Bond L AUD M Inc HSC 30/09/2015 0.0619
LU1074970309 JGF Dynamic Bond L AUD M Inc HSC 31/08/2015 0.0989
LU1074970309 JGF Dynamic Bond L AUD M Inc HSC 31/07/2015 0.0568
LU1074970309 JGF Dynamic Bond L AUD M Inc HSC 30/06/2015 0.0556
LU1074970309 JGF Dynamic Bond L AUD M Inc HSC 29/05/2015 0.0521
LU1074970309 JGF Dynamic Bond L AUD M Inc HSC 30/04/2015 0.0310
LU1074970309 JGF Dynamic Bond L AUD M Inc HSC 31/03/2015 0.0576
LU1074970309 JGF Dynamic Bond L AUD M Inc HSC 27/02/2015 0.0447
LU1074970309 JGF Dynamic Bond L AUD M Inc HSC 30/01/2015 0.0531
LU0459992896 JGF Dynamic Bond L EUR Q Inc 30/09/2015 0.1171
LU0459992896 JGF Dynamic Bond L EUR Q Inc 30/06/2015 0.0771
LU0459992896 JGF Dynamic Bond L EUR Q Inc 31/03/2015 0.0859
LU0459992896 JGF Dynamic Bond L EUR Q Inc 31/12/2014 0.0927
■ the jupiter global fund Société d’Investissement à Capital Variable Registered Office: 6, route de Treves, L-2633 Senningerberg R.C.S Luxembourg B 110.737
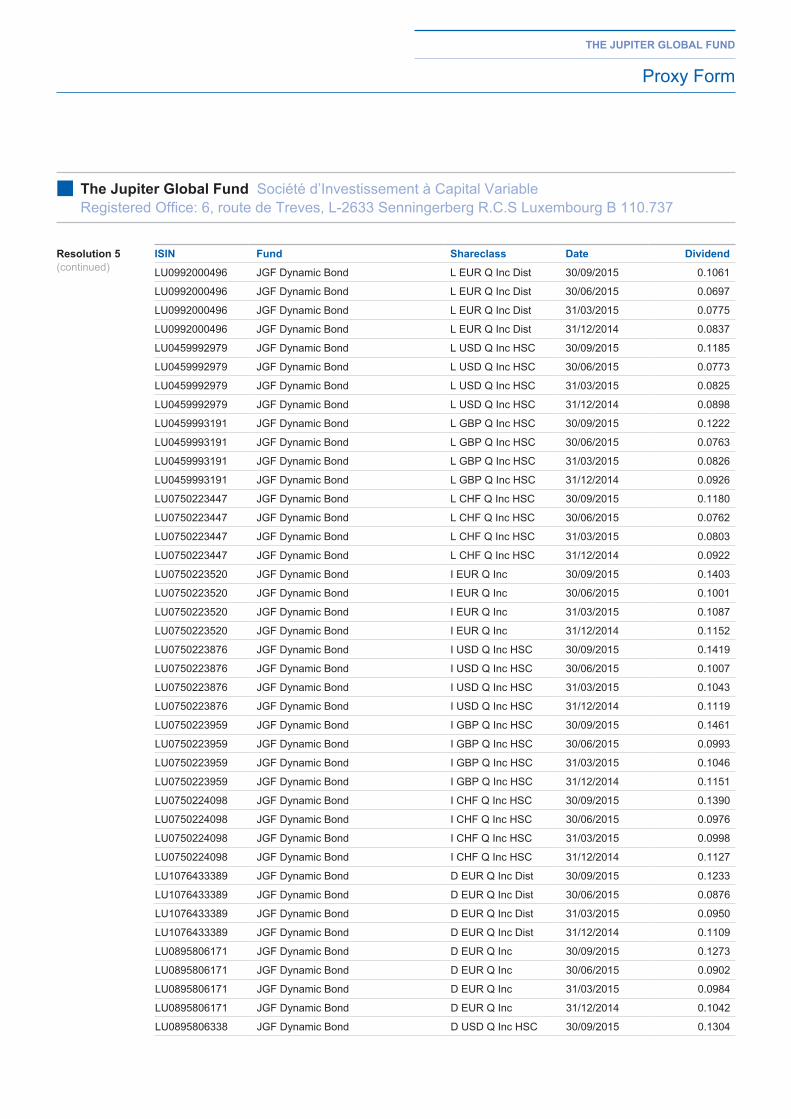
the jupiter global fund
Proxy Form
iSin fund Shareclass date dividend
LU0992000496 JGF Dynamic Bond L EUR Q Inc Dist 30/09/2015 0.1061
LU0992000496 JGF Dynamic Bond L EUR Q Inc Dist 30/06/2015 0.0697
LU0992000496 JGF Dynamic Bond L EUR Q Inc Dist 31/03/2015 0.0775
LU0992000496 JGF Dynamic Bond L EUR Q Inc Dist 31/12/2014 0.0837
LU0459992979 JGF Dynamic Bond L USD Q Inc HSC 30/09/2015 0.1185
LU0459992979 JGF Dynamic Bond L USD Q Inc HSC 30/06/2015 0.0773
LU0459992979 JGF Dynamic Bond L USD Q Inc HSC 31/03/2015 0.0825
LU0459992979 JGF Dynamic Bond L USD Q Inc HSC 31/12/2014 0.0898
LU0459993191 JGF Dynamic Bond L GBP Q Inc HSC 30/09/2015 0.1222
LU0459993191 JGF Dynamic Bond L GBP Q Inc HSC 30/06/2015 0.0763
LU0459993191 JGF Dynamic Bond L GBP Q Inc HSC 31/03/2015 0.0826
LU0459993191 JGF Dynamic Bond L GBP Q Inc HSC 31/12/2014 0.0926
LU0750223447 JGF Dynamic Bond L CHF Q Inc HSC 30/09/2015 0.1180
LU0750223447 JGF Dynamic Bond L CHF Q Inc HSC 30/06/2015 0.0762
LU0750223447 JGF Dynamic Bond L CHF Q Inc HSC 31/03/2015 0.0803
LU0750223447 JGF Dynamic Bond L CHF Q Inc HSC 31/12/2014 0.0922
LU0750223520 JGF Dynamic Bond I EUR Q Inc 30/09/2015 0.1403
LU0750223520 JGF Dynamic Bond I EUR Q Inc 30/06/2015 0.1001
LU0750223520 JGF Dynamic Bond I EUR Q Inc 31/03/2015 0.1087
LU0750223520 JGF Dynamic Bond I EUR Q Inc 31/12/2014 0.1152
LU0750223876 JGF Dynamic Bond I USD Q Inc HSC 30/09/2015 0.1419
LU0750223876 JGF Dynamic Bond I USD Q Inc HSC 30/06/2015 0.1007
LU0750223876 JGF Dynamic Bond I USD Q Inc HSC 31/03/2015 0.1043
LU0750223876 JGF Dynamic Bond I USD Q Inc HSC 31/12/2014 0.1119
LU0750223959 JGF Dynamic Bond I GBP Q Inc HSC 30/09/2015 0.1461
LU0750223959 JGF Dynamic Bond I GBP Q Inc HSC 30/06/2015 0.0993
LU0750223959 JGF Dynamic Bond I GBP Q Inc HSC 31/03/2015 0.1046
LU0750223959 JGF Dynamic Bond I GBP Q Inc HSC 31/12/2014 0.1151
LU0750224098 JGF Dynamic Bond I CHF Q Inc HSC 30/09/2015 0.1390
LU0750224098 JGF Dynamic Bond I CHF Q Inc HSC 30/06/2015 0.0976
LU0750224098 JGF Dynamic Bond I CHF Q Inc HSC 31/03/2015 0.0998
LU0750224098 JGF Dynamic Bond I CHF Q Inc HSC 31/12/2014 0.1127
LU1076433389 JGF Dynamic Bond D EUR Q Inc Dist 30/09/2015 0.1233
LU1076433389 JGF Dynamic Bond D EUR Q Inc Dist 30/06/2015 0.0876
LU1076433389 JGF Dynamic Bond D EUR Q Inc Dist 31/03/2015 0.0950
LU1076433389 JGF Dynamic Bond D EUR Q Inc Dist 31/12/2014 0.1109
LU0895806171 JGF Dynamic Bond D EUR Q Inc 30/09/2015 0.1273
LU0895806171 JGF Dynamic Bond D EUR Q Inc 30/06/2015 0.0902
LU0895806171 JGF Dynamic Bond D EUR Q Inc 31/03/2015 0.0984
LU0895806171 JGF Dynamic Bond D EUR Q Inc 31/12/2014 0.1042
LU0895806338 JGF Dynamic Bond D USD Q Inc HSC 30/09/2015 0.1304
■ the jupiter global fund Société d’Investissement à Capital Variable Registered Office: 6, route de Treves, L-2633 Senningerberg R.C.S Luxembourg B 110.737
resolution 5(continued)
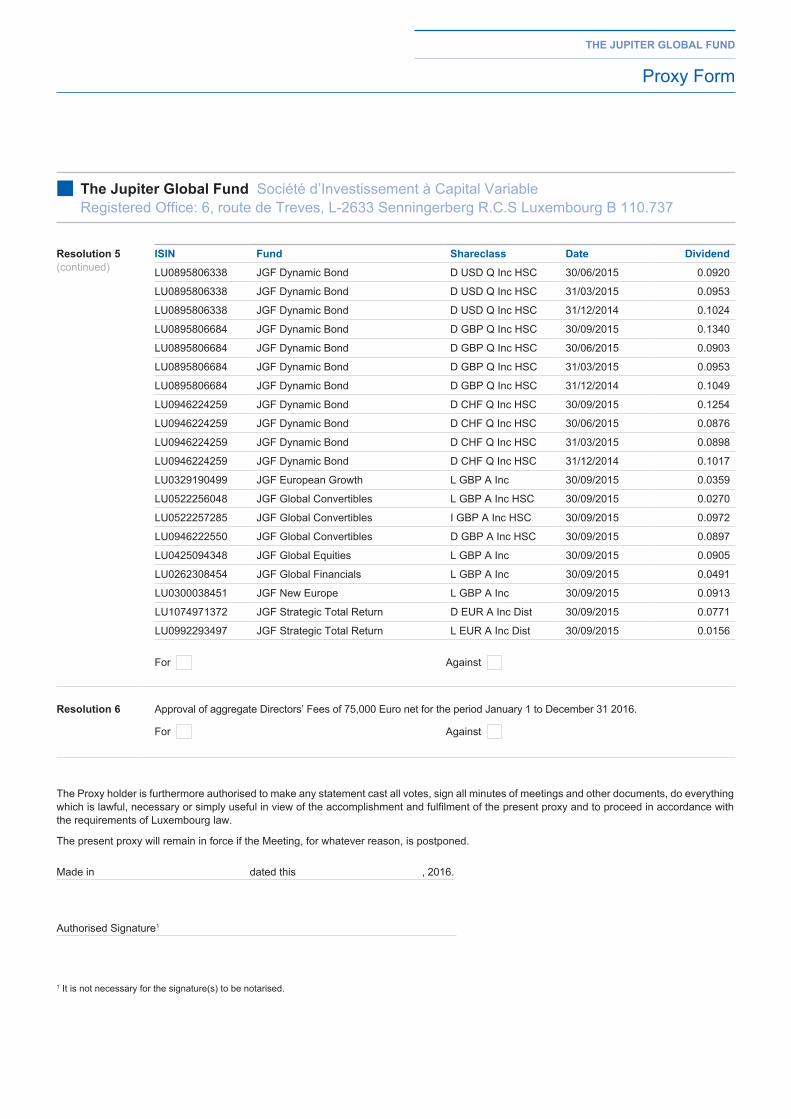
the jupiter global fund
Proxy Form
iSin fund Shareclass date dividend
LU0895806338 JGF Dynamic Bond D USD Q Inc HSC 30/06/2015 0.0920
LU0895806338 JGF Dynamic Bond D USD Q Inc HSC 31/03/2015 0.0953
LU0895806338 JGF Dynamic Bond D USD Q Inc HSC 31/12/2014 0.1024
LU0895806684 JGF Dynamic Bond D GBP Q Inc HSC 30/09/2015 0.1340
LU0895806684 JGF Dynamic Bond D GBP Q Inc HSC 30/06/2015 0.0903
LU0895806684 JGF Dynamic Bond D GBP Q Inc HSC 31/03/2015 0.0953
LU0895806684 JGF Dynamic Bond D GBP Q Inc HSC 31/12/2014 0.1049
LU0946224259 JGF Dynamic Bond D CHF Q Inc HSC 30/09/2015 0.1254
LU0946224259 JGF Dynamic Bond D CHF Q Inc HSC 30/06/2015 0.0876
LU0946224259 JGF Dynamic Bond D CHF Q Inc HSC 31/03/2015 0.0898
LU0946224259 JGF Dynamic Bond D CHF Q Inc HSC 31/12/2014 0.1017
LU0329190499 JGF European Growth L GBP A Inc 30/09/2015 0.0359
LU0522256048 JGF Global Convertibles L GBP A Inc HSC 30/09/2015 0.0270
LU0522257285 JGF Global Convertibles I GBP A Inc HSC 30/09/2015 0.0972
LU0946222550 JGF Global Convertibles D GBP A Inc HSC 30/09/2015 0.0897
LU0425094348 JGF Global Equities L GBP A Inc 30/09/2015 0.0905
LU0262308454 JGF Global Financials L GBP A Inc 30/09/2015 0.0491
LU0300038451 JGF New Europe L GBP A Inc 30/09/2015 0.0913
LU1074971372 JGF Strategic Total Return D EUR A Inc Dist 30/09/2015 0.0771
LU0992293497 JGF Strategic Total Return L EUR A Inc Dist 30/09/2015 0.0156
resolution 6 Approval of aggregate Directors’ Fees of 75,000 Euro net for the period January 1 to December 31 2016.
For Against
Made in dated this , 2016.
Authorised Signature1
1 It is not necessary for the signature(s) to be notarised.
The Proxy holder is furthermore authorised to make any statement cast all votes, sign all minutes of meetings and other documents, do everything which is lawful, necessary or simply useful in view of the accomplishment and fulfilment of the present proxy and to proceed in accordance with the requirements of Luxembourg law.
The present proxy will remain in force if the Meeting, for whatever reason, is postponed.
For Against
■ the jupiter global fund Société d’Investissement à Capital Variable Registered Office: 6, route de Treves, L-2633 Senningerberg R.C.S Luxembourg B 110.737
resolution 5(continued)


1399-12-15