Embed Size (px)
Citation preview
research papers
IUCrJ (2014). 1, 361–379 doi:10.1107/S2052252514014845 361
IUCrJISSN 2052-2525
CHEMISTRYjCRYSTENG
Received 2 April 2014
Accepted 24 June 2014
Edited by A. Fitch, ESRF, France
†
Keywords: aspherical atom partitioning;
quantum mechanical molecular electron densi-
ties; X-ray structure refinement; hydrogen atom
modelling; anisotropic displacement parameters
CCDC references: 995876; 995877; 995878;
995879; 995880; 995881
Supporting information: this article has
supporting information at www.iucrj.org
Hirshfeld atom refinement
Silvia C. Capelli,a Hans-Beat Burgi,b,c Birger Dittrich,d,e Simon Grabowskyf and
Dylan Jayatilakaf*
aDepartment of Chemistry, University of Milan, Via Golgi 19, 20133 Milan, Italy, bDepartment of Chemistry and
Biochemistry, Universitat Bern, Freiestrasse 3, 3012 Bern, Switzerland, cDepartment of Chemistry, Universitat Zurich,
Winterthurstrasse 190, 8057 Zurich, Switzerland, dInstitut fur Anorganische und Angewandte Chemie, Universitat
Hamburg, Martin-Luther-King-Platz 6, 20146 Hamburg, Germany, eInstitut fur Anorganische Chemie, Georg-August-
Universitat Gottingen, Tammannstr. 4, 37077 Gottingen, Germany, and fSchool of Chemistry and Biochemistry, The
University of Western Australia, 35 Stirling Highway, Crawley WA 6009, Australia. *Correspondence e-mail:
Hirshfeld atom refinement (HAR) is a method which determines structural
parameters from single-crystal X-ray diffraction data by using an aspherical
atom partitioning of tailor-made ab initio quantum mechanical molecular
electron densities without any further approximation. Here the original HAR
method is extended by implementing an iterative procedure of successive cycles
of electron density calculations, Hirshfeld atom scattering factor calculations
and structural least-squares refinements, repeated until convergence. The
importance of this iterative procedure is illustrated via the example of crystalline
ammonia. The new HAR method is then applied to X-ray diffraction data of the
dipeptide Gly–l-Ala measured at 12, 50, 100, 150, 220 and 295 K, using Hartree–
Fock and BLYP density functional theory electron densities and three different
basis sets. All positions and anisotropic displacement parameters (ADPs) are
freely refined without constraints or restraints – even those for hydrogen atoms.
The results are systematically compared with those from neutron diffraction
experiments at the temperatures 12, 50, 150 and 295 K. Although non-hydrogen-
atom ADPs differ by up to three combined standard uncertainties (csu’s), all
other structural parameters agree within less than 2 csu’s. Using our best
calculations (BLYP/cc-pVTZ, recommended for organic molecules), the
accuracy of determining bond lengths involving hydrogen atoms from HAR is
better than 0.009 A for temperatures of 150 K or below; for hydrogen-atom
ADPs it is better than 0.006 A2 as judged from the mean absolute X-ray minus
neutron differences. These results are among the best ever obtained.
Remarkably, the precision of determining bond lengths and ADPs for the
hydrogen atoms from the HAR procedure is comparable with that from the
neutron measurements – an outcome which is obtained with a routinely
achievable resolution of the X-ray data of 0.65 A.
1. Introduction
Structure and reactivity are the essence of chemistry, and
X-ray diffraction is the work-horse for structure determina-
tion (Giacovazzo, 2002; Dunitz, 1995). For crystals, the
structure is described by unit-cell dimensions, time- and space-
averaged atomic positions in the unit cell and the
corresponding mean-squared displacements, represented by
the so-called atomic displacement tensors (Trueblood et al.,
1996). Cell parameters, coordinates and displacement tensors
are gleaned from the signal generated when X-rays diffract
from the electronic and nuclear charge density in the mole-
cule. The overwhelming part of the signal is due to the elec-
tron density (ED), the maxima of which serve as proxies for
the nuclear positions.

The structural data pertaining to H atoms, which form the
skin of most organic and organometallic molecules, are
particularly important in many fields such as enzymology
(Halliwell & Gutteridge, 1999), organic reaction mechanisms
(Hynes et al., 2007), supramolecular chemistry and crystal
engineering (Desiraju, 1989; Desiraju & Steiner, 1999). From
the point of view of X-rays, the H atom is just a small hump in
the landscape of the total electron density. Neutrons ‘see’ H
atoms more clearly than X-rays; diffraction of neutrons has
the advantage of providing atomic positions and anisotropic
displacement parameters (ADPs) for H atoms as accurately as
for other atom types. Therefore, considerable technical and
financial effort has been made to construct beamlines at
neutron facilities, e.g. new spallation sources, in order to
secure H-atom parameters (Langan et al., 2004, 2008; Myles,
2006; Bunick & Hanson, 2003). However, X-ray diffraction is
the much more widespread technique to study crystalline
materials. The enormous progress in the development and
availability of in-house and synchrotron sources, detectors and
software has transformed X-ray analysis into a standard
investigation tool that can be easily accessed by an increasing
number of users. In addition, the ability of X-rays to probe the
electronic distribution in a solid, a property directly related to
chemical bonding and macroscopic behaviour, has made X-ray
electron density analysis an important tool for studying
crystals.
Our interest here is in high-quality X-ray structural data,
those related to H atoms in particular. Apart from the usual
intrinsic interest in advancing any experimental technique, the
ability to obtain accurate and precise structural data is a
critical prerequisite for several types of secondary analyses:
(i) The first is the analysis of the electron density obtained
from accurate X-ray diffraction data (Tsirelon & Ozerov,
1996; Coppens, 1997; Gatti & Macchi, 2012; Stalke, 2012). The
importance of the positions and ADPs in this field is discussed
in more detail in x2. Electron density analysis addresses the
fundamentals of chemical bonding, which gives rise to the
potential surfaces on which nuclear dynamics and chemical
reactions occur.
(ii) The second example is ‘normal coordinate analysis’,
whereby ADPs are analyzed at several temperatures in order
to obtain the low-frequency normal modes of a molecule
(Burgi & Capelli, 2000; Capelli et al., 2000; Burgi et al., 2000).
This kind of analysis goes some way toward understanding the
nuclear dynamics of molecular systems in real space and
complements spectroscopy, which works in the energy
regime.
Given the basic importance of the X-ray structural data in
itself, and for further analyses, and given that the X-ray
technique is now a century old, it seems timely to ask: how
accurately and precisely can we obtain these data now? The
IUCr project on �-oxalic acid was an important milestone
which established that quantitative agreement can be obtained
for non-H-atom positions between different measurements
provided high-angle reflection data are used. The positions
were determined to a precision of 0.001 A (Coppens et al.,
1983). However, H-atom positions were not compared in this
study. A later study of syn-1,6:8,13-biscarbonyl[14]annulene at
19 K by Destro & Merati (1995) reported a precision in the
positions of better than 0.0004 A for non-H atoms and of
�0.007 A for H atoms. The average of the ten aromatic C—H
bond lengths was found to be 1.087 (7) A, indistinguishable
from the average of neutron determined Car—H distances of
1.083 (11) A (Allen et al., 2004). This result was achieved by
assuming generalized structure factors from ‘polarized’ H
atoms, taken from the hydrogen molecule and including
monopole and dipole terms (Stewart et al., 1975; Coppens et
al., 1971). Two similar studies by Zhurov et al. (2011) modelled
the electron density on the H atoms with a monopole, three
dipoles and one quadrupole (Q0). For hexahydro-1,3,5-
trinitro-1,3,5-triazine, the average of six methylene C—H
bond distances was found to be 1.073 (12) A at 20 K and
1.082 (15) A at 298 K, to be compared with the corresponding
room-temperature neutron result of 1.082 (12) A (Choi &
Prince, 1972) and the average methylene C—H neutron
distances of 1.097 (10) A at T � 60 K and 1.087 (16) A at
T � 240 K (Allen & Bruno, 2010). For the ferroelectric
croconic acid (Zhurov & Pinkerton, 2013) the average of the
two O—H distances is 0.941 A, to be compared with an
average neutron value for CarO—H groups of
0.992 (17) A (Allen & Bruno, 2010). In the above studies,
there seems to be a tendency for the bonds involving an H
atom (D—H) to be shorter if determined from X-ray
diffraction than the distances from neutron diffraction by up
to 0.05 A. However, in all cases the difference is clearly less
than the bond shortening of 0.1 A usually found after spherical
atom refinements.
As a result of many years of electron density analysis,
several libraries of experimental and theoretical generalized
X-ray scattering factors have been established using non-
spherical pseudo-atoms (Dittrich et al., 2013; Volkov et al.,
2004; Jarzembska & Dominiak, 2012; Domagała et al., 2012;
Hathwar et al., 2011). This idea was pioneered by Stewart et al.
(1975) to obtain improved time-averaged proton positions. A
few systematic comparisons between results from applications
of databases to X-ray data and results from neutron diffrac-
tion have been published (Dittrich et al., 2005, 2009; Bendeif &
Jelsch, 2007; Bak et al., 2011; Dadda et al., 2012). Agreement of
D—H distances with values from neutron diffraction is
improved relative to that obtained from spherical atom
refinements. Depending on the database, D—H distances
generally differ by a few hundredths of an Angstrom compared
with (tabulated) bond distances derived from neutron
experiments.
It has been known for a long time that refinement against
high-angle X-ray data improves the description of atomic
displacements (Hirshfeld, 1976). Subsequently, Blessing
(1995) had noticed that the differences between non-H ADPs
determined by X-ray and neutron diffraction can be mini-
mized by using high-angle data together with multipoles in
X-ray refinements. Where significant differences persisted, he
proposed empirical corrections to adjust X-ray ADPs to those
obtained from neutron diffraction. To our knowledge, Iversen
et al. (1996) were the first to demonstrate explicitly that, if low
research papers
362 Silvia C. Capelli et al. � Hirshfeld atom refinement IUCrJ (2014). 1, 361–379

temperatures are used and if one is careful with the data
analysis, then quantitative agreement between X-ray and
neutron diffraction ADPs can be achieved for non-H atoms. In
a recent update of this work similar conclusions were reached
(Morgenroth et al., 2008).
It has been recognized that not only H-atom positions but
also the corresponding ADPs are critical prerequisites for
obtaining accurate electron densities and derived properties
(Spackman et al., 2007; Madsen et al., 2004; Hoser et al., 2009).
In the case of the [14]annulene mentioned above, H-atom
ADPs were estimated from a TLS (translation/libration/screw
coupling) analysis of the C atoms, supplemented with values
estimated from spectroscopy for the C—H stretch and bend
motions (Destro & Merati, 1995). Subsequently, several
different and increasingly sophisticated methods for approx-
imating H-atom ADPs have been proposed. These methods
are well reviewed in the articles by Munshi et al. (2008) and
Madsen (2012). The former propose using a modification of
Madsen’s database method (Madsen, 2006) to construct
H-atom ADPs from neutron data, whereas Madsen et al.
currently explore pure ab initio techniques for the determi-
nation of H-atom ADPs (Madsen et al., 2013).
The philosophy behind the methods for approximating
H-atom ADPs is based on a statement by Hirshfeld: ‘ . . . there
is no possibility of deriving hydrogen vibration parameters
from the X-ray intensities’ (Hirshfeld, 1976; italics in the
original text). Hirshfeld’s verdict voices the unfortunate fact
that, in a least-squares determination, the ADPs are highly
correlated with the model used to represent the electron
density (O’Connell et al., 1966; El Haouzi et al., 1996). At
ambient or higher temperatures the ADPs often inappropri-
ately ameliorate agreement factors by absorbing other
physical effects, such as vibrational anharmonicity and effects
related to thermal diffuse scattering (Willis & Pryor, 1975). In
this context the results found for the above-mentioned hexa-
hydro-1,3,5-trinitro-1,3,5-triazine at 298 K are remarkable
(Zhurov et al., 2011). The average difference between the
H-atom ADPs from the room-temperature X-ray data and
from the neutron data is 2.3 su’s. The corresponding numbers
for O, N and C are 1.5, 1.2 and 1.1 su’s, respectively.
Jayatilaka & Dittrich (2008) have demonstrated that it is
possible to obtain H-atom positions that are in quantitative
agreement with positions from neutron diffraction, and
H-atom ADPs that are nearly so, using high-resolution X-ray
data sets of urea and benzene. This was achieved using
Hirshfeld’s stockholder partitioning scheme (Hirshfeld, 1977)
to obtain aspherical atomic electron densities and their scat-
tering factors from ab initio self-consistent charge-embedded
molecular electron density calculations. With these scattering
factors, atomic coordinates and ADPs were refined against the
structure-factor amplitudes in the usual way. This method is
colloquially known as ‘Hirshfeld atom refinement’ (HAR).
Despite this success there are a number of issues with the
earlier version of HAR proposed by Jayatilaka & Dittrich
(2008):
(i) For efficiency reasons, Jayatilaka & Dittrich (2008) used
a ‘rigid atom approximation’, whereby the Hirshfeld atoms
were determined once and then held fixed during the X-ray
refinement procedure.1 The effect of this approximation was
not properly explored. It can be removed by repeated cycles of
electron density and non-spherical atomic scattering factor
calculations followed by coordinate and ADP refinements. In
the previous work only one such cycle was calculated and the
refinements were not checked for convergence. Furthermore,
it is important to quantify and minimize the effort involved in
the ab initio calculation of the electron density because this
step is much more time-consuming compared with the X-ray
structure refinements. The dangers inherent in an incomplete
HAR-like refinement will be illustrated in x2.
(ii) Urea and benzene are rather small and symmetrical
molecules. This leads to two questions. Firstly, are the results
for such molecules representative of those expected for larger
molecules without inherent symmetry? Secondly, which type
of quantum mechanical calculation and which basis set are
necessary and adequate for dealing with larger molecules?
(iii) The data sets of urea (Birkedal et al., 2004) and benzene
(Burgi et al., 2002), as well as all other data sets of compounds
that have been subjected to HAR in different studies for
different purposes (Dittrich et al., 2012; Dittrich & Jayatilaka,
2012; Checinska et al., 2013; Grabowsky et al., 2012), are high-
resolution data sets (d < 0.5 A) originally collected for
experimental electron density studies. It is unclear to what
extent the use of lower-resolution data affects the accuracy of
hydrogen and non-hydrogen parameters within the frame-
work of HAR.
(iv) The X-ray HAR ADPs of benzene C6H6 were
compared with ADPs obtained indirectly from neutron ADPs
of deuterobenzene C6D6 by taking isotope effects into account
and interpolating between different experimental tempera-
tures via a normal coordinate analysis (Burgi et al., 2002).
There are lingering doubts about the validity of this compar-
ison, and direct comparison between X-ray HAR and neutron
ADPs at the same temperature for the same compound would
be necessary to dispel those doubts.
To address these concerns we have done the following:
(i) We have removed the rigid atom approximation by
implementing an automated procedure where molecular
calculations and structure refinements alternate and are iter-
ated to convergence. This new version of HAR is described in
x3.3.
(ii) We have measured X-ray diffraction data of the
dipeptide Gly–l-Ala at six different temperatures (12, 50, 100,
150, 220 and 295 K) with synchrotron radiation. At four of
these temperatures (12, 50, 150 and 295 K) neutron diffraction
data are available (Capelli et al., 2014). In its crystalline form
this molecule, the structure of which was first determined by
Wang & Paul (1979), has no symmetry; it has 20 atoms and is
thus larger than either urea or benzene studied previously;
half of the atoms are H atoms.
research papers
IUCrJ (2014). 1, 361–379 Silvia C. Capelli et al. � Hirshfeld atom refinement 363
1 The term ‘rigid atom approximation’ is proposed in the present context todistinguish between the original HAR and the iterative HAR versions. It iscompletely unrelated to the term ‘rigid pseudo-atom’ which means that atomicelectron densities used in multipole modelling are not a function of atomicdisplacements.
(iii) We have performed the new HAR procedure for Gly–
l-Ala at all temperatures with different quantum-mechanical
methods and basis sets. This permitted a direct comparison
between the atomic coordinates, ADPs and molecular
geometries from the X-ray and neutron diffraction studies. In
order to permit a more rigorous statistical analysis, uncer-
tainties in these quantities were obtained from the full
variance–covariance matrix, whereas in earlier versions of
HAR they had to be estimated.
2. An example concerning the importance of accurategeometries and ADPs
Bytheway et al. (2002) have published a study on the ammonia
molecule. They modified an isolated molecule Hartree–Fock
wavefunction and thus the molecular electron density to
reproduce observed X-ray structure factors to a �2 value of 1
(starting from an unconstrained value of 10.5) and with the
minimum possible electronic energy penalty [so-called X-ray
constrained wavefunction (XCW) fitting (Jayatilaka, 1998;
Jayatilaka & Grimwood, 2001)]. This study used the unmodi-
fied atomic coordinates and ADPs determined by Boese et al.
(1997) from a multipole refinement using 160 K X-ray data.
H-atom coordinates were corrected to match approximately
the N—H distance obtained from neutron powder data at 2 K
[1.012 (2) A; Hewat & Riekel, 1979] and an isotropic
hydrogen displacement parameter was fixed at the value from
an independent atom refinement (Table 1).
Given the uncertainties related to the interdependence of
electron densities, accurate geometries and ADPs (see x1),
Boese’s diffraction data and starting geometry have now been
used for an iterative HAR (see x3.3) using the same level of
theory as in the preceding study by Bytheway et al. (2002)
[HF/6-311++G(2d,2p)]. This calculation reveals significant
changes in the H-atom coordinates and ADPs (Table 1).
Crystallographic data for this refinement are given as
supporting information, also available from Fachinforma-
tionszentrum Karlsruhe as CIF via www.fiz-karlsruhe.de/
request_for_deposited_data.html.
After six iterations of alternating between electron density
calculations and crystallographic least-squares refinements,
the parameter shifts divided by the su’s of the parameters were
smaller than 0.01 and the �2 statistic became 0.6. This is much
less than the starting value �2 = 10.5 and less than the target
value �2 = 1 assumed in the constrained wavefunction fit using
the structural parameters from Boese et al. (1997). This
decrease is due only to the changes in atomic coordinates and
ADPs; and because Hirshfeld atoms are used to perform the
thermal smearing. The H-atom parameters change more than
those of the N atom, and the changes seem reasonable. The
refined N—H bond length at 160 K [0.987 (5) A] exactly
matches the average neutron value of 0.989 (5) A at 180 K.
This is, however, incidental to the main point: refinement of
the structural parameters produces a goodness of fit less than 1
by adjusting atomic coordinates and ADPs, but without having
to tamper with the electronic wavefunction. In fact, if the
experimental errors are to be believed, there is nothing to
constrain after refining the structural parameters!
This finding presents a striking example of the importance
of the positions and ADPs for the electron density. As a result
of this new analysis, it is possible that the reconstructed
electron densities in the 2002 paper – although reproducible –
contain artefacts due to the use of sub-optimal geometric
parameters. Analogous iterative HARs for urea and benzene
did not change the single-cycle results significantly.
Rather than pursuing the case of crystalline ammonia,
another small and symmetric molecule, we now turn to
analysing the results from the larger and unsymmetric Gly–
l-Ala molecule.
3. Methodology
3.1. Neutron data collection
Details of data collection, data processing and structure
refinement for the neutron diffraction experiments on Gly–
l-Ala at 12, 50, 150 and 295 K are given elsewhere (Capelli et
al., 2014). For the sake of easy direct comparison with the
X-ray data, we reproduce some relevant details of the
experiments in Table 2.
3.2. Synchrotron X-ray data collection and preliminary dataanalysis
Colourless prismatic crystals of Gly–l-Ala were grown by
slow evaporation from aqueous solution. Intensities of X-ray
reflections were collected at 12, 50, 100, 150, 220 and 295 K
with a Bruker SMART CCD detector on the ID11 beamline of
the European Synchrotron Radiation Facility (ESRF),
Grenoble, using a wavelength of 0.5259 (2) A. The 12 and
50 K data were collected using an Oxford Diffraction Helijet
open-cycle helium Cryostream, while the data from 100 to
295 K were obtained using an Oxford Cryosystem open-cycle
research papers
364 Silvia C. Capelli et al. � Hirshfeld atom refinement IUCrJ (2014). 1, 361–379
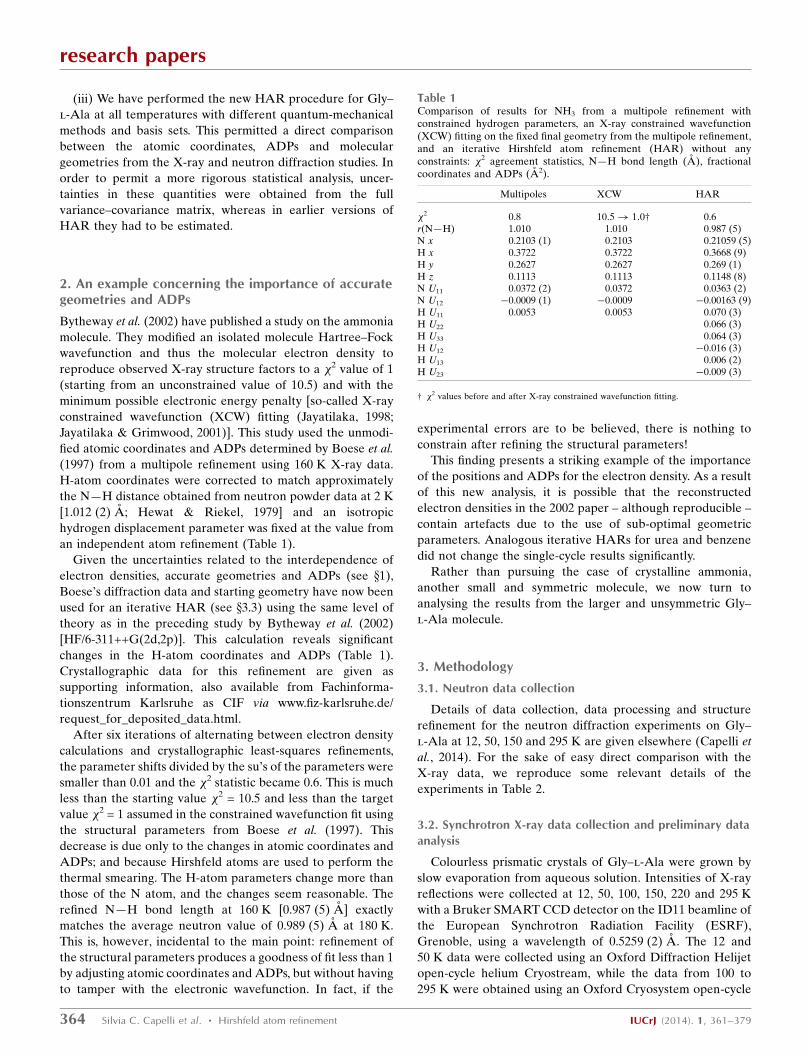
Table 1Comparison of results for NH3 from a multipole refinement withconstrained hydrogen parameters, an X-ray constrained wavefunction(XCW) fitting on the fixed final geometry from the multipole refinement,and an iterative Hirshfeld atom refinement (HAR) without anyconstraints: �2 agreement statistics, N—H bond length (A), fractionalcoordinates and ADPs (A2).
Multipoles XCW HAR
�2 0.8 10:5! 1:0† 0.6r(N—H) 1.010 1.010 0.987 (5)N x 0.2103 (1) 0.2103 0.21059 (5)H x 0.3722 0.3722 0.3668 (9)H y 0.2627 0.2627 0.269 (1)H z 0.1113 0.1113 0.1148 (8)N U11 0.0372 (2) 0.0372 0.0363 (2)N U12 �0.0009 (1) �0.0009 �0.00163 (9)H U11 0.0053 0.0053 0.070 (3)H U22 0.066 (3)H U33 0.064 (3)H U12 �0.016 (3)H U13 0.006 (2)H U23 �0.009 (3)
† �2 values before and after X-ray constrained wavefunction fitting.
nitrogen Cryostream. A sample-to-detector distance of
5.82 cm gave a resolution at the edge of the CCD detector of
0.657 A.
Two series of 600 frames were collected with a ’-scan
rotation width of 0.3 � and with an exposure time of 1 s at fixed
! and � positions (! = �155, �115�; � = 54.7�; 4.5 h total
collection time per temperature). For the two helium-
temperature data sets, the sampling of reciprocal space had to
be reduced due to the steric limitation imposed by the Helijet
equipment: series of 600 and 400 frames were collected at ! =
�125 and �110�, respectively, with the same � position,
exposure time and ’ rotation width as for the higher-
temperature data sets. In all experiments, the detector was
positioned at � = 0�. For further experimental details see
Table 2.
Cell dimensions and the space group were determined with
the Bruker SMART software from all reflections with I/�(I) �
50 in the first 400 images of each data collection. Reflections
were integrated with the program SAINT, resulting in �2500
unique reflections for each temperature. Because of the short
wavelength used in the experiment, no absorption correction
was made. The data were also not corrected for oblique inci-
dence effects because at the time of the measurement (2005)
the necessary software was not generally available and the
characteristics of the phosphorescent layer for the detector are
not resurrectable. Estimates of such a correction are described
in x4.4.1.
Initial structure models were obtained by direct methods
and refined by full-matrix least-squares on F 2 using SHELX97
(Sheldrick, 2008). All non-H atoms were refined aniso-
tropically. H atoms were located in the difference Fourier map
and refined freely with an isotropic displacement parameter.
3.3. Hirshfeld atom refinement (HAR) of X-ray data
This section describes the basic idea behind the new auto-
mated iterative Hirshfeld atom refinement, gives some general
technical details of the procedure and the specific details for
the Gly–l-Ala refinements.
HAR requires a provisional set of atomic coordinates,
either obtained from a spherical or an aspherical atom
refinement. With these coordinates, a first electron density
(ED) of a molecule representing at least the asymmetric unit is
calculated from a quantum mechanical wavefunction. This ED
is divided up into Hirshfeld atoms. The charges and moments
of these atoms are calculated and used to simulate the electric
field surrounding the molecule of interest. A new ED is then
calculated in the presence of the simulated crystal field. We
call this an ED cycle. ED cycles are repeated to convergence in
the molecular energy. Together they are called an ED step.
Subsequently, the Fourier transforms of the Hirshfeld atoms
are used as non-spherical atomic scattering factors in a
conventional crystallographic least-squares refinement of the
coordinates and ADPs. This step, called a structural refine-
ment step, usually consists of several least-squares cycles. The
sequence of an ED step followed by a structural refinement
step is called an ‘HAR iteration’. These iterations are
research papers
IUCrJ (2014). 1, 361–379 Silvia C. Capelli et al. � Hirshfeld atom refinement 365
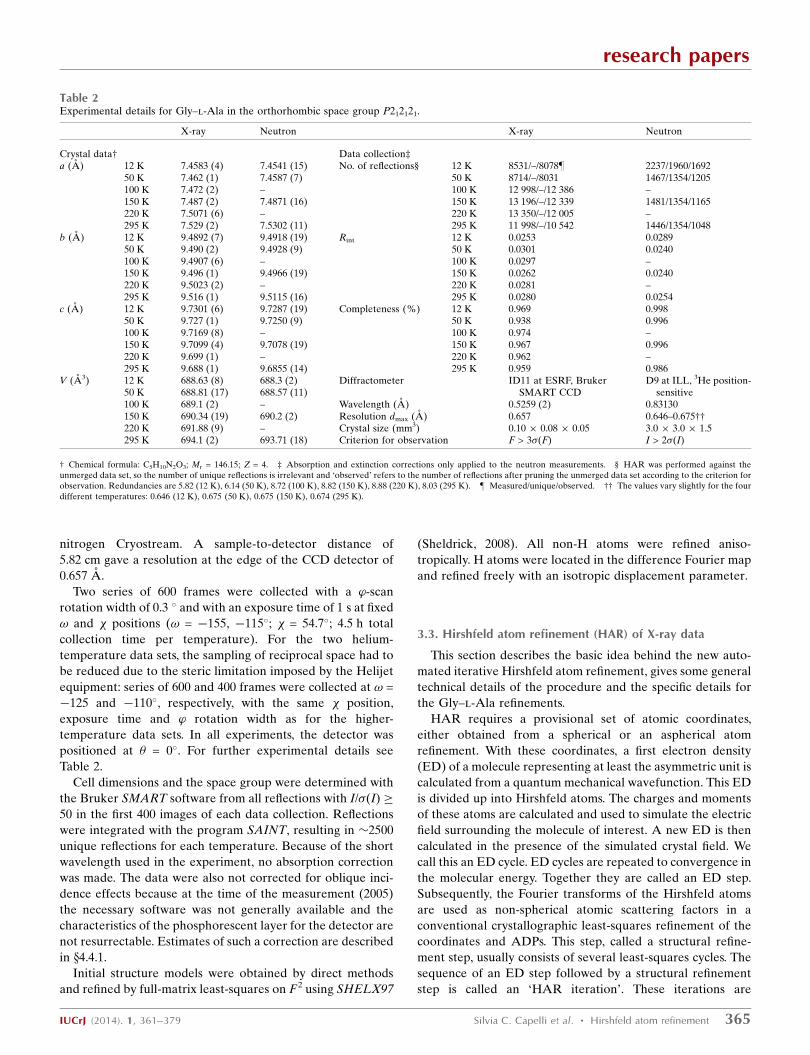
Table 2Experimental details for Gly–l-Ala in the orthorhombic space group P212121.
X-ray Neutron X-ray Neutron
Crystal data† Data collection‡a (A) 12 K 7.4583 (4) 7.4541 (15) No. of reflections§ 12 K 8531/–/8078} 2237/1960/1692
50 K 7.462 (1) 7.4587 (7) 50 K 8714/–/8031 1467/1354/1205100 K 7.472 (2) – 100 K 12 998/–/12 386 –150 K 7.487 (2) 7.4871 (16) 150 K 13 196/–/12 339 1481/1354/1165220 K 7.5071 (6) – 220 K 13 350/–/12 005 –295 K 7.529 (2) 7.5302 (11) 295 K 11 998/–/10 542 1446/1354/1048
b (A) 12 K 9.4892 (7) 9.4918 (19) Rint 12 K 0.0253 0.028950 K 9.490 (2) 9.4928 (9) 50 K 0.0301 0.0240100 K 9.4907 (6) – 100 K 0.0297 –150 K 9.496 (1) 9.4966 (19) 150 K 0.0262 0.0240220 K 9.5023 (2) – 220 K 0.0281 –295 K 9.516 (1) 9.5115 (16) 295 K 0.0280 0.0254
c (A) 12 K 9.7301 (6) 9.7287 (19) Completeness (%) 12 K 0.969 0.99850 K 9.727 (1) 9.7250 (9) 50 K 0.938 0.996100 K 9.7169 (8) – 100 K 0.974 –150 K 9.7099 (4) 9.7078 (19) 150 K 0.967 0.996220 K 9.699 (1) – 220 K 0.962 –295 K 9.688 (1) 9.6855 (14) 295 K 0.959 0.986
V (A3) 12 K 688.63 (8) 688.3 (2) Diffractometer ID11 at ESRF, BrukerSMART CCD
D9 at ILL, 3He position-sensitive50 K 688.81 (17) 688.57 (11)
100 K 689.1 (2) – Wavelength (A) 0.5259 (2) 0.83130150 K 690.34 (19) 690.2 (2) Resolution dmax (A) 0.657 0.646–0.675††220 K 691.88 (9) – Crystal size (mm3) 0.10 � 0.08 � 0.05 3.0 � 3.0 � 1.5295 K 694.1 (2) 693.71 (18) Criterion for observation F > 3�(F) I > 2�(I)
† Chemical formula: C5H10N2O3; Mr = 146.15; Z = 4. ‡ Absorption and extinction corrections only applied to the neutron measurements. § HAR was performed against theunmerged data set, so the number of unique reflections is irrelevant and ‘observed’ refers to the number of reflections after pruning the unmerged data set according to the criterion forobservation. Redundancies are 5.82 (12 K), 6.14 (50 K), 8.72 (100 K), 8.82 (150 K), 8.88 (220 K), 8.03 (295 K). } Measured/unique/observed. †† The values vary slightly for the fourdifferent temperatures: 0.646 (12 K), 0.675 (50 K), 0.675 (150 K), 0.674 (295 K).
repeated until both ED cycles and refinement cycles show no
further changes.
Quantum mechanical electron density calculations. In this
paper and all others to date, the EDs are calculated using the
Hartree–Fock (HF) and BLYP density functional theory
methods (DFT). DFT calculations employ the Becke numer-
ical integration technique (Becke, 1988) modified by the effi-
cient scheme suggested by Stratmann et al. (1996). The Mura
radial integration grids (Mura & Knowles, 1996) are used with
30 points plus five for every principle quantum number above
one. For the angular part, the Lebedev procedure is used
(Lebedev & Laikov, 1999). It is capable of integrating up to an
angular momentum of L = 29 (35) for H (non-H) atoms.
For both HF and BLYP, the wavefunction is obtained using
the standard self-consistent field (SCF) method. Convergence
is assumed when changes in the electronic energy (and its
gradient) are less than 0.0005 (0.001) a.u. Considerable
savings in computation are obtained by initiating the wave-
function calculations with the ED from the previous cycle, and
similarly if refinements for larger basis sets are initiated from
structural parameters obtained from HAR refinements using a
basis set slightly smaller in size.
Atomic partitioning. The method of Hirshfeld (1977) is used
to partition the molecular electron density into atomic
contributions. The Hirshfeld or stockholder weight function
for an atom is the spherically averaged atomic ED divided by
the sum of spherical EDs of all atoms in the molecule chosen
for the wavefunction calculation – not the ED in the whole
crystal. There are two main reasons for not using the sum of
electron densities of all the atoms in the crystal. First, the
underlying wavefunction is essentially molecular. Second,
moving beyond a molecular partitioning is computationally
more demanding. Resources permitting, one could choose an
ED model where the ‘molecule’ is a cluster of several mol-
ecules.
The spherically averaged atomic EDs are not taken from
tables but calculated as needed with the unrestricted method
(different spatial orbitals for different spins) and the same
wavefunction method (HF or BLYP) and basis set as used for
the corresponding molecular calculation. This only takes a few
seconds; in fact, less than reading in stored tables.
Calculation and placement of charges simulating the crystal
field. The Hirshfeld charges and dipole moments of each atom
are calculated numerically via the Becke (1988) method with
the Hirshfeld atomic weight function, i.e. without using the
Stratmann et al. (1996) extension. Charges are placed on
atomic sites surrounding the central molecule for which the
wavefunction is calculated. The distance between positive and
negative charges used to simulate the atomic dipoles on each
site is 0.001 a.u. Charges are placed on all complete molecules
which have at least one atom within a specified distance of the
central molecule. Complete molecules are used, to avoid
charged species and therefore minimize errors in slowly
converging potential sums.
Structural refinement step. Structural least-squares refine-
ment uses the Fourier-transformed Hirshfeld atoms from the
ED step as atomic scattering factors. The atomic positions and
ADPs are optimized under the assumption that the Hirshfeld
atoms move ‘rigidly’, i.e. they are only translated, but not
rotated nor deformed. The least-squares matrix is pseudo-
inverted, so that symmetry-redundant and numerically ill-
defined parameter combinations can be eliminated, and the
covariance matrix and errors properly calculated. The details
of how this is done when symmetry is present, and taking into
account the nonlinear relations between model parameters
and derived quantities (such as bond lengths, angles and
torsion angles), are described by Sands (1966). Least-squares
cycles are repeated until the parameter shifts divided by the
su’s of the parameters are less than 0.01.
Since EDs are obtained from wavefunctions calculated in
the Cartesian coordinate system, HAR is performed in the
same system. Consequently, errors associated with cell-para-
meter determination on derived properties such as bond
lengths and angles do not arise. (Note that, in an aspherical
atomic scattering formalism, there is no benefit in using frac-
tional coordinates at all.)
Application to Gly–l-Ala. The ED calculations were carried
out with three increasingly better Gaussian basis sets: cc-
pVDZ, cc-pVTZ and cc-pVQZ (Dunning, 1989). All cc-pVDZ
calculations were initiated with atomic positions from
invariom refinements (Dittrich et al., 2013). The initial
displacement parameters on the H atoms were isotropic, but
were refined anisotropically in the HARs. The crystal field was
simulated by placing atomic charges and dipole moments on
55 complete molecules which had at least one atom within
8 A of the central molecule. The eigenvalues of the least-
squares matrix were always clearly non-zero, so there were
never any undetermined coordinates or ADPs. There could be
as many as 15 rigid-atom fit cycles in the first coordinate and
ADP refinement step. Typically, only four of the HAR itera-
tions were required for complete optimization, the penulti-
mate cycle being converged in �2 (��2� 0.001). We did not
observe any problems starting the wavefunction calculations
from EDs obtained from a previous iteration.
Software. All calculations were performed using revision
4009 of the open-source Tonto program (http://sourceforge.
net/projects/tonto-chem, later versions and bug fixes may be
obtained from https://github.com/dylan-jayatilaka/tonto)
which includes the option to perform ED steps and structural
refinement steps, i.e. HAR iterations, to convergence auto-
matically. The wavefunction calculations were performed in
parallel using the MPICH2 library compiled with the gfortran
compiler and executed on a Linux platform. Indicative wall
clock time for the 12 K data set refinement at the cc-pVTZ
level was 3 (6) h for the HF (BLYP) calculations on 16
processors. These timings varied for different temperatures
and basis sets depending on the number of SCF cycles, and – to
a much smaller extent – the number of refinement cycles
needed in a particular case.
3.4. Statistical analysis
Several statistics are used for comparing the X-ray and
neutron measurements in x4 and in the supporting informa-
research papers
366 Silvia C. Capelli et al. � Hirshfeld atom refinement IUCrJ (2014). 1, 361–379

tion. The formulae and names for these statistics are collected
here, and discussed.
Suppose that we have a set of N values V = {Vi}. Then the
mean value and its population standard deviation are defined
in the usual way by, respectively
Vh i ¼1
N
XN
i¼1
Vi; ð1Þ
�popðVÞ ¼1
N
XN
i¼1
V2i
!� Vh i2
" #1=2
: ð2Þ
The population standard deviation �pop is also called the root
mean-square deviation (RMSD). It gives an indication of the
spread of the values around the mean. It is not an estimate of
the error in the mean; that is given by
�meanðVÞ ¼ �popðVÞ=ðN � 1Þ1=2: ð3Þ
It is this quantity which should be used when judging whether
trends in mean values are significant. This elementary fact is
pointed out here only because on this subject in the literature
there is a confusing but accepted notation for indicating errors
in, and distribution widths of, a particular quantity: namely
that an individual quantity written as 0.123 (4) indicates a
standard uncertainty (su) of 0.004 associated with the value
0.123 (obtained by propagation of errors), whereas when the
same refers to an averaged quantity, the bracketed term refers
to a population standard deviation of 0.004 [see e.g. Iversen et
al. (1996) and Morgenroth et al. (2008)].
In this paper we compare several pairs of data sets
comprised of values derived from the X-ray and neutron
measurements, respectively, denoted {Xi} and {Ni} below.
These two sets are combined into measures of similarity/
difference in several ways. The neutron value is always
subtracted from the X-ray value or divides it. This is purely
conventional and should not be taken to imply that the
neutron experimental values are more accurate. The mean
value and its population standard deviation for the combined
set V are then reported, with the following nomenclature:
(i) The mean absolute difference (MAD), denoted h|�P|i, is
associated with the set V = |�P| = {|Xi � Ni|}.
(ii) The mean difference (MD), denoted h�Pi, is associated
with the set V = �P = {(Xi � Ni)}. This quantity is also known
as the signed difference. Unlike the MAD, the MD can be
positive or negative, meaning that on average the parameters
derived from the X-ray measurements are larger or smaller,
respectively, than those derived from the neutron measure-
ments.
(iii) The mean of the square of the weighted difference –
weighted by the combined standard uncertainties from both
measurements – is denoted h[�P/csu(P)]2i. It is associated
with the set V = {[(Xi � Ni)/csu(Xi,Ni)]2}. The combined
standard uncertainty (csu), which appears in this expression, is
given by (Schwarzenbach et al., 1995)
csuðXi;NiÞ ¼ suðXiÞ2þ suðNiÞ
2� �1=2
: ð4Þ
Combining these equations, the mean of the square of the
weighted difference is
Xi � Ni
½suðXiÞ2þ suðNiÞ
21=2
� �2* +
: ð5Þ
For reasons of convention, we report the square root of this
property and refer to it as the csu-weighted root mean-square
difference (wRMSD). It is meaningless to report a population
standard deviation. The wRMSD values should be equal to 1 if
the two sets of data are statistically in agreement, although in
practice values of 1.5–2 are often found when comparing
multiple determinations of the same crystal structure (Taylor
& Kennard, 1983a,b; Martin & Orpen, 1996).
(iv) The mean ratio (MR), denoted hri, is associated with
the set V = r = {(Xi/Ni)}. This statistic only makes sense when
the parameter values to be compared may not be zero. Thus, it
is not reported for coordinates, and is only reported for the
research papers
IUCrJ (2014). 1, 361–379 Silvia C. Capelli et al. � Hirshfeld atom refinement 367
Figure 1Projections of the Gly–l-Ala molecule as obtained from X-ray data afterHAR at the BLYP/cc-pVTZ level (left column) and from neutron data(right column). ADPs are shown at the 50% probability level. The atom-numbering scheme at the top left is used throughout.
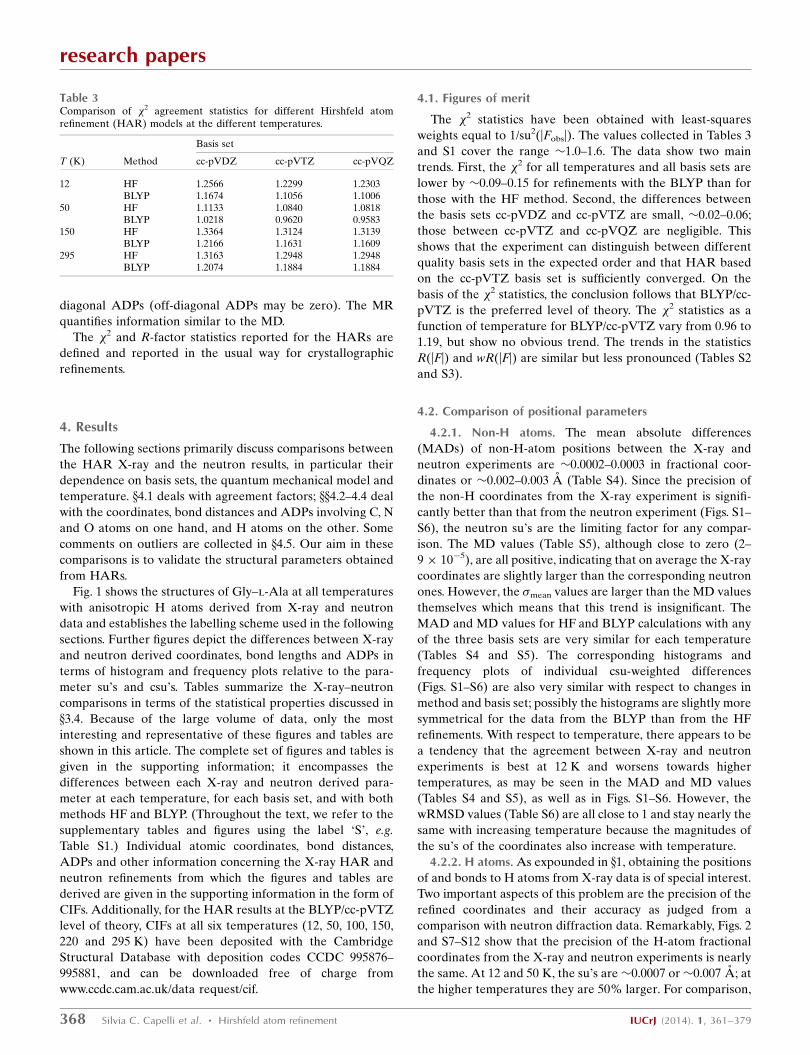
diagonal ADPs (off-diagonal ADPs may be zero). The MR
quantifies information similar to the MD.
The �2 and R-factor statistics reported for the HARs are
defined and reported in the usual way for crystallographic
refinements.
4. Results
The following sections primarily discuss comparisons between
the HAR X-ray and the neutron results, in particular their
dependence on basis sets, the quantum mechanical model and
temperature. x4.1 deals with agreement factors; xx4.2–4.4 deal
with the coordinates, bond distances and ADPs involving C, N
and O atoms on one hand, and H atoms on the other. Some
comments on outliers are collected in x4.5. Our aim in these
comparisons is to validate the structural parameters obtained
from HARs.
Fig. 1 shows the structures of Gly–l-Ala at all temperatures
with anisotropic H atoms derived from X-ray and neutron
data and establishes the labelling scheme used in the following
sections. Further figures depict the differences between X-ray
and neutron derived coordinates, bond lengths and ADPs in
terms of histogram and frequency plots relative to the para-
meter su’s and csu’s. Tables summarize the X-ray–neutron
comparisons in terms of the statistical properties discussed in
x3.4. Because of the large volume of data, only the most
interesting and representative of these figures and tables are
shown in this article. The complete set of figures and tables is
given in the supporting information; it encompasses the
differences between each X-ray and neutron derived para-
meter at each temperature, for each basis set, and with both
methods HF and BLYP. (Throughout the text, we refer to the
supplementary tables and figures using the label ‘S’, e.g.
Table S1.) Individual atomic coordinates, bond distances,
ADPs and other information concerning the X-ray HAR and
neutron refinements from which the figures and tables are
derived are given in the supporting information in the form of
CIFs. Additionally, for the HAR results at the BLYP/cc-pVTZ
level of theory, CIFs at all six temperatures (12, 50, 100, 150,
220 and 295 K) have been deposited with the Cambridge
Structural Database with deposition codes CCDC 995876–
995881, and can be downloaded free of charge from
www.ccdc.cam.ac.uk/data request/cif.
4.1. Figures of merit
The �2 statistics have been obtained with least-squares
weights equal to 1/su2(|Fobs|). The values collected in Tables 3
and S1 cover the range �1.0–1.6. The data show two main
trends. First, the �2 for all temperatures and all basis sets are
lower by �0.09–0.15 for refinements with the BLYP than for
those with the HF method. Second, the differences between
the basis sets cc-pVDZ and cc-pVTZ are small, �0.02–0.06;
those between cc-pVTZ and cc-pVQZ are negligible. This
shows that the experiment can distinguish between different
quality basis sets in the expected order and that HAR based
on the cc-pVTZ basis set is sufficiently converged. On the
basis of the �2 statistics, the conclusion follows that BLYP/cc-
pVTZ is the preferred level of theory. The �2 statistics as a
function of temperature for BLYP/cc-pVTZ vary from 0.96 to
1.19, but show no obvious trend. The trends in the statistics
R(|F|) and wR(|F|) are similar but less pronounced (Tables S2
and S3).
4.2. Comparison of positional parameters
4.2.1. Non-H atoms. The mean absolute differences
(MADs) of non-H-atom positions between the X-ray and
neutron experiments are �0.0002–0.0003 in fractional coor-
dinates or �0.002–0.003 A (Table S4). Since the precision of
the non-H coordinates from the X-ray experiment is signifi-
cantly better than that from the neutron experiment (Figs. S1–
S6), the neutron su’s are the limiting factor for any compar-
ison. The MD values (Table S5), although close to zero (2–
9 � 10�5), are all positive, indicating that on average the X-ray
coordinates are slightly larger than the corresponding neutron
ones. However, the �mean values are larger than the MD values
themselves which means that this trend is insignificant. The
MAD and MD values for HF and BLYP calculations with any
of the three basis sets are very similar for each temperature
(Tables S4 and S5). The corresponding histograms and
frequency plots of individual csu-weighted differences
(Figs. S1–S6) are also very similar with respect to changes in
method and basis set; possibly the histograms are slightly more
symmetrical for the data from the BLYP than from the HF
refinements. With respect to temperature, there appears to be
a tendency that the agreement between X-ray and neutron
experiments is best at 12 K and worsens towards higher
temperatures, as may be seen in the MAD and MD values
(Tables S4 and S5), as well as in Figs. S1–S6. However, the
wRMSD values (Table S6) are all close to 1 and stay nearly the
same with increasing temperature because the magnitudes of
the su’s of the coordinates also increase with temperature.
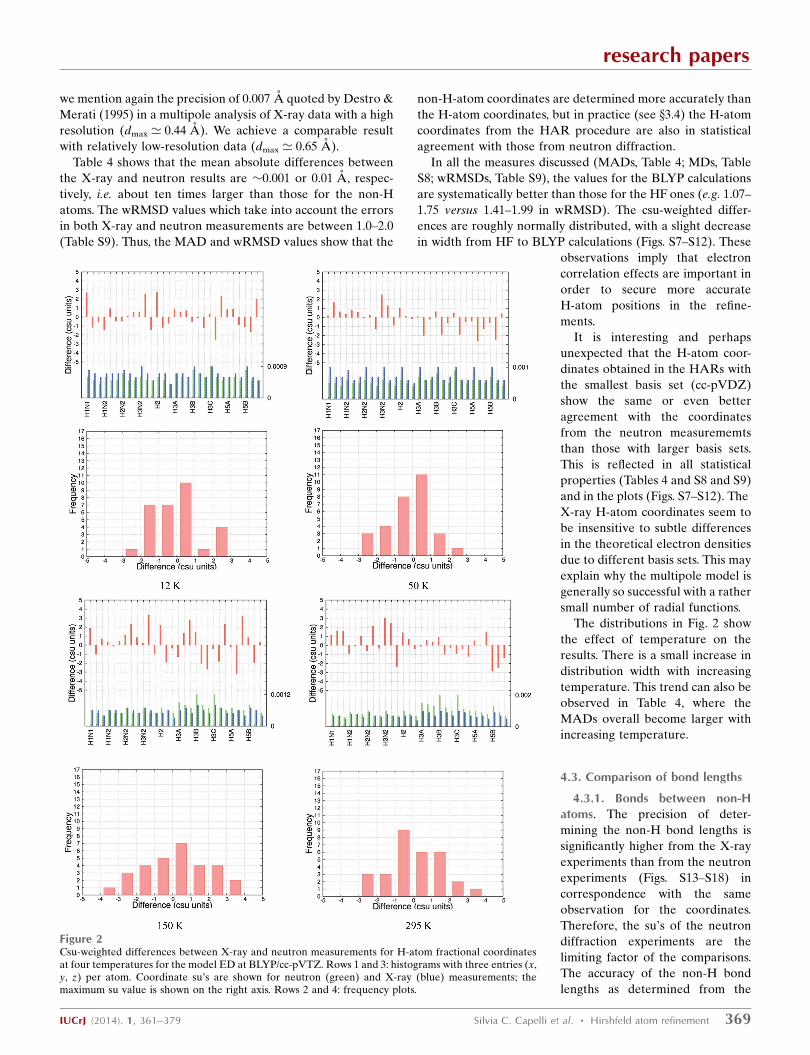
4.2.2. H atoms. As expounded in x1, obtaining the positions
of and bonds to H atoms from X-ray data is of special interest.
Two important aspects of this problem are the precision of the
refined coordinates and their accuracy as judged from a
comparison with neutron diffraction data. Remarkably, Figs. 2
and S7–S12 show that the precision of the H-atom fractional
coordinates from the X-ray and neutron experiments is nearly
the same. At 12 and 50 K, the su’s are�0.0007 or�0.007 A; at
the higher temperatures they are 50% larger. For comparison,
research papers
368 Silvia C. Capelli et al. � Hirshfeld atom refinement IUCrJ (2014). 1, 361–379
Table 3Comparison of �2 agreement statistics for different Hirshfeld atomrefinement (HAR) models at the different temperatures.
Basis set
T (K) Method cc-pVDZ cc-pVTZ cc-pVQZ
12 HF 1.2566 1.2299 1.2303BLYP 1.1674 1.1056 1.1006
50 HF 1.1133 1.0840 1.0818BLYP 1.0218 0.9620 0.9583
150 HF 1.3364 1.3124 1.3139BLYP 1.2166 1.1631 1.1609
295 HF 1.3163 1.2948 1.2948BLYP 1.2074 1.1884 1.1884
we mention again the precision of 0.007 A quoted by Destro &
Merati (1995) in a multipole analysis of X-ray data with a high
resolution (dmax ’ 0.44 A). We achieve a comparable result
with relatively low-resolution data (dmax ’ 0.65 A).
Table 4 shows that the mean absolute differences between
the X-ray and neutron results are �0.001 or 0.01 A, respec-
tively, i.e. about ten times larger than those for the non-H
atoms. The wRMSD values which take into account the errors
in both X-ray and neutron measurements are between 1.0–2.0
(Table S9). Thus, the MAD and wRMSD values show that the
non-H-atom coordinates are determined more accurately than
the H-atom coordinates, but in practice (see x3.4) the H-atom
coordinates from the HAR procedure are also in statistical
agreement with those from neutron diffraction.
In all the measures discussed (MADs, Table 4; MDs, Table
S8; wRMSDs, Table S9), the values for the BLYP calculations
are systematically better than those for the HF ones (e.g. 1.07–
1.75 versus 1.41–1.99 in wRMSD). The csu-weighted differ-
ences are roughly normally distributed, with a slight decrease
in width from HF to BLYP calculations (Figs. S7–S12). These
observations imply that electron
correlation effects are important in
order to secure more accurate
H-atom positions in the refine-
ments.
It is interesting and perhaps
unexpected that the H-atom coor-
dinates obtained in the HARs with
the smallest basis set (cc-pVDZ)
show the same or even better
agreement with the coordinates
from the neutron measurememts
than those with larger basis sets.
This is reflected in all statistical
properties (Tables 4 and S8 and S9)
and in the plots (Figs. S7–S12). The
X-ray H-atom coordinates seem to
be insensitive to subtle differences
in the theoretical electron densities
due to different basis sets. This may
explain why the multipole model is
generally so successful with a rather
small number of radial functions.
The distributions in Fig. 2 show
the effect of temperature on the
results. There is a small increase in
distribution width with increasing
temperature. This trend can also be
observed in Table 4, where the
MADs overall become larger with
increasing temperature.
4.3. Comparison of bond lengths
4.3.1. Bonds between non-Hatoms. The precision of deter-
mining the non-H bond lengths is
significantly higher from the X-ray
experiments than from the neutron
experiments (Figs. S13–S18) in
correspondence with the same
observation for the coordinates.
Therefore, the su’s of the neutron
diffraction experiments are the
limiting factor of the comparisons.
The accuracy of the non-H bond
lengths as determined from the
research papers
IUCrJ (2014). 1, 361–379 Silvia C. Capelli et al. � Hirshfeld atom refinement 369
Figure 2Csu-weighted differences between X-ray and neutron measurements for H-atom fractional coordinatesat four temperatures for the model ED at BLYP/cc-pVTZ. Rows 1 and 3: histograms with three entries (x,y, z) per atom. Coordinate su’s are shown for neutron (green) and X-ray (blue) measurements; themaximum su value is shown on the right axis. Rows 2 and 4: frequency plots.

comparison of X-ray and neutron experiments is about 0.001–
0.003 A if measured in terms of mean absolute differences
(MADs, Table S10).
The signed mean differences (MDs, Table S11) show that, in
the low-temperature experiments (12, 50 K), the distances
derived from the X-ray experiments are slightly longer by
�0.0002–0.0009 A than those derived from the neutron
experiments. In contrast, in the higher-temperature experi-
ments (150, 295 K) the bonds from the neutron experiments
are slightly longer by up to 0.0005 A. The origin of this
seemingly systematic trend is unclear, but we recall that the 12
and 50 K measurements were conducted using an open-flow
helium device, whereas the setup was changed for the 150 and
295 K measurements to open-flow nitrogen cooling.
There is no dependency of the various quantities with
respect to the method used (HF versus BLYP). The smallest
basis set cc-pVDZ is sufficient, as the normality of the distri-
butions (Figs. S12–S18) and the MDs (Table S11) do not
improve with higher basis sets. The
agreement between X-ray and
neutron experiments is clearly best at
12 K and worsens noticeably towards
higher temperature, as visible in terms
of MAD trends (Table S10) and the
csu-weighted differences (Figs. S13–
S18).
4.3.2. Bonds involving an H atom(D—H). The N—H and C—H
distances from both X-ray (BLYP/cc-
pVTZ) and neutron experiments are
summarized as a function of
temperature in Table 5. The N—H amide distances from both
experiments are shorter by �0.02–0.03 A than the N—H
ammonium distances at all temperatures. This is in agreement
with the average neutron reference values (Allen & Bruno,
2010). The distinction of the C—H distances is a bit less clear,
but in most cases d(C—H) > d(C—H2) > d(C—H3). Although
the comparisons for individual experiments at a single
temperature may not look significant, the overall trend found
from eight independent experiments certainly is (Table 5). It
shows that trends in D—H distances obtained from HAR are
accurate enough to distinguish between different functional
groups.
The mean absolute differences between D—H distances
from X-ray and neutron experiments are 0.007–0.013 A
(Tables 6 and S14). From Table 5 it can be deduced that the
average differences are somewhat larger for the N—H bonds
(0.009 A) than for the C—H bonds (0.004 A). The reason for
this is likely that all of the N—H bonds are involved in rela-
research papers
370 Silvia C. Capelli et al. � Hirshfeld atom refinement IUCrJ (2014). 1, 361–379
Table 4Mean absolute differences (MADs) for H-atom fractional coordinates h|�X|i and correspondingpopulation standard deviations �pop; No. of data averaged = 30.
cc-pVDZ cc-pVTZ cc-pVQZ
T (K) Method h|�X|i �pop h|�X|i �pop h|�X|i �pop
12 HF 0.001107 0.000800 0.001153 0.000763 0.001160 0.000777BLYP 0.000923 0.000760 0.000990 0.000683 0.001023 0.000648
50 HF 0.001353 0.000977 0.001377 0.000999 0.001270 0.000888BLYP 0.000903 0.000775 0.000833 0.000692 0.000760 0.000555
150 HF 0.001283 0.000952 0.001360 0.000935 0.001390 0.000894BLYP 0.001187 0.000891 0.001270 0.000826 0.001227 0.000797
295 HF 0.001427 0.001038 0.001403 0.001004 0.001370 0.001049BLYP 0.001353 0.001039 0.001350 0.001052 0.001350 0.001052
Table 5Bond lengths dD—H (A) involving an H atom from HAR using the BLYP/cc-pVTZ model, compared with neutron measurements.
The last entry for every bond type refers to average values from neutron diffraction given by Allen & Bruno (2010). These authors use temperature intervals of T� 60 K, 60 � T � 140 K, and T � 240 K. We use the value from the middle range for comparison with our 150 K values. The errors in brackets refer to su’s forneutron and X-ray entries, but to �pop values for neutron reference values (Allen & Bruno, 2010).
12 K 50 K 150 K 295 K
Bond Neutron X-ray Neutron X-ray Neutron X-ray Neutron X-ray
N1—H1N1 1.023 (4) 1.012 (3) 1.018 (4) 1.016 (4) 1.025 (4) 1.017 (2) 1.024 (6) 1.011 (3)Z2N—H 1.020 (10) – 1.020 (10) – 1.019 (13) – 1.011 (20) –
N2—H1N2 1.044 (4) 1.038 (3) 1.045 (4) 1.051 (4) 1.041 (5) 1.042 (2) 1.042 (8) 1.031 (3)N2—H2N2 1.045 (5) 1.042 (3) 1.042 (4) 1.046 (3) 1.052 (5) 1.037 (3) 1.043 (7) 1.034 (3)N2—H3N2 1.044 (5) 1.027 (3) 1.042 (4) 1.029 (3) 1.040 (5) 1.022 (2) 1.049 (7) 1.014 (3)hdN2—Hi 1.044 1.036 1.043 1.042 1.044 1.034 1.045 1.026N+—H – – – – 1.040 (10) – 1.034 (16) –
C2—H2 1.095 (5) 1.102 (3) 1.096 (5) 1.106 (4) 1.102 (6) 1.106 (2) 1.098 (8) 1.110 (3)Z3C—H 1.101 (6) – 1.101 (6) – 1.099 (7) – 1.099 (10) –
C5—H5A 1.109 (5) 1.101 (3) 1.090 (5) 1.104 (4) 1.088 (6) 1.097 (2) 1.089 (8) 1.083 (3)C5—H5B 1.102 (5) 1.084 (3) 1.106 (5) 1.090 (3) 1.101 (5) 1.089 (2) 1.093 (8) 1.076 (3)hdC5—Hi 1.106 1.093 1.098 1.097 1.095 1.093 1.091 1.080Z2C—H2 1.097 (10) – 1.097 (10) – 1.097 (6) – 1.087 (16) –
C3—H3A 1.097 (6) 1.091 (3) 1.081 (6) 1.092 (4) 1.088 (8) 1.085 (3) 1.076 (5) 1.072 (5)C3—H3B 1.093 (6) 1.099 (3) 1.093 (6) 1.092 (3) 1.075 (7) 1.092 (3) 1.072 (1) 1.077 (5)C3—H3C 1.082 (6) 1.079 (3) 1.092 (5) 1.077 (3) 1.090 (6) 1.090 (3) 1.084 (9) 1.072 (4)hdC3—Hi 1.091 1.090 1.089 1.087 1.084 1.089 1.077 1.074ZC—H3 1.088 (9) – 1.088 (9) – 1.084 (13) – 1.055 (36) –
tively short intermolecular contacts (Table 7). HAR does not
have basis functions at the acceptor atoms and might therefore
introduce a small bias when describing D—H bonds involved
in hydrogen-bonding interactions (see further discussion in
x5). For C—H bonds this problem is much less severe because
the acceptor atoms of intermolecular interactions are usually
at larger distances (Table 7). An approach analogous to the
supramolecular synthon-based fragments database of
Hathwar et al. (2011) might be needed here.
The su’s of the X-ray D—H distances from HAR at 12 and
50 K are no larger than 0.006 A (Figs. 3 and S19–S24), about
the same as the neutron su’s or up to 50% higher. The
precision becomes much worse relative to neutron measure-
ments at higher temperatures.
Assuming that these measurement
errors are realistic, agreement
between the X-ray and neutron D—H
bond lengths measured in terms of the
wRMSDs (1.2–3.0) is rather poor
(Tables 6 and S16). This is in contrast
with the MADs discussed above,
which are excellent and probably
overall the best reported so far in the
literature.
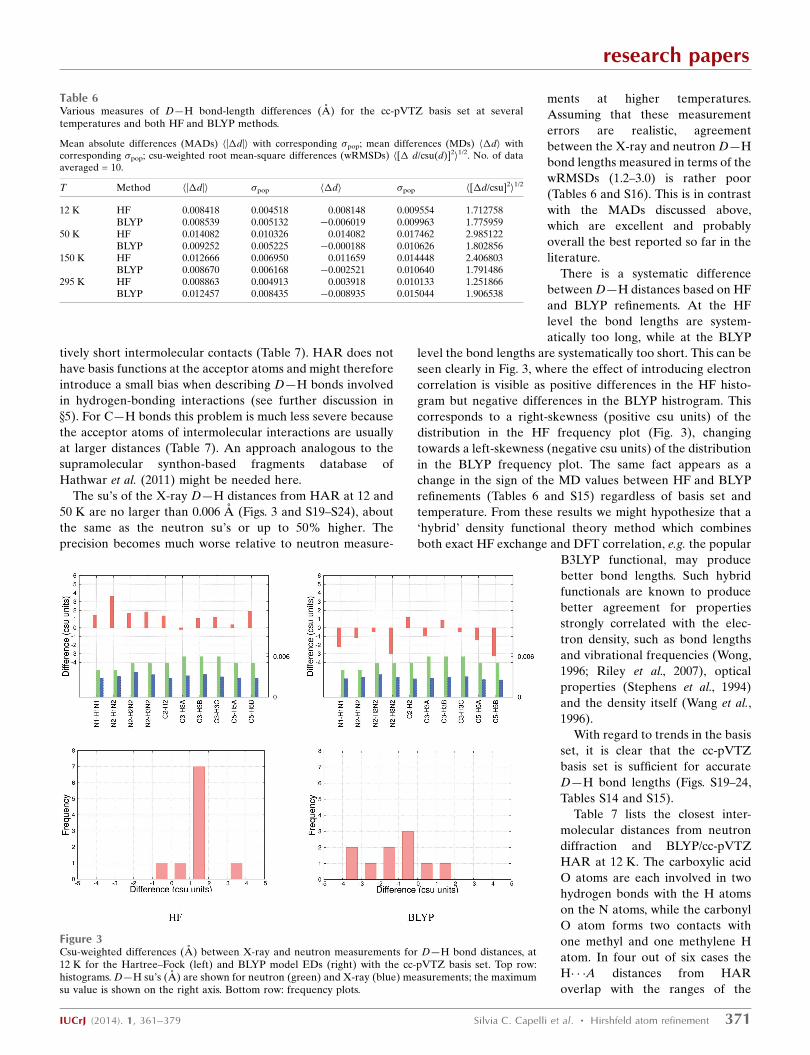
There is a systematic difference
between D—H distances based on HF
and BLYP refinements. At the HF
level the bond lengths are system-
atically too long, while at the BLYP
level the bond lengths are systematically too short. This can be
seen clearly in Fig. 3, where the effect of introducing electron
correlation is visible as positive differences in the HF histo-
gram but negative differences in the BLYP histrogram. This
corresponds to a right-skewness (positive csu units) of the
distribution in the HF frequency plot (Fig. 3), changing
towards a left-skewness (negative csu units) of the distribution
in the BLYP frequency plot. The same fact appears as a
change in the sign of the MD values between HF and BLYP
refinements (Tables 6 and S15) regardless of basis set and
temperature. From these results we might hypothesize that a
‘hybrid’ density functional theory method which combines
both exact HF exchange and DFT correlation, e.g. the popular
B3LYP functional, may produce
better bond lengths. Such hybrid
functionals are known to produce
better agreement for properties
strongly correlated with the elec-
tron density, such as bond lengths
and vibrational frequencies (Wong,
1996; Riley et al., 2007), optical
properties (Stephens et al., 1994)
and the density itself (Wang et al.,
1996).
With regard to trends in the basis
set, it is clear that the cc-pVTZ
basis set is sufficient for accurate
D—H bond lengths (Figs. S19–24,
Tables S14 and S15).
Table 7 lists the closest inter-
molecular distances from neutron
diffraction and BLYP/cc-pVTZ
HAR at 12 K. The carboxylic acid
O atoms are each involved in two
hydrogen bonds with the H atoms
on the N atoms, while the carbonyl
O atom forms two contacts with
one methyl and one methylene H
atom. In four out of six cases the
H A distances from HAR
overlap with the ranges of the
research papers
IUCrJ (2014). 1, 361–379 Silvia C. Capelli et al. � Hirshfeld atom refinement 371
Table 6Various measures of D—H bond-length differences (A) for the cc-pVTZ basis set at severaltemperatures and both HF and BLYP methods.
Mean absolute differences (MADs) h|�d|i with corresponding �pop; mean differences (MDs) h�di withcorresponding �pop; csu-weighted root mean-square differences (wRMSDs) h[� d/csu(d)]2
i1/2. No. of data
averaged = 10.
T Method h|�d|i �pop h�di �pop h[�d/csu]2i
1/2
12 K HF 0.008418 0.004518 0.008148 0.009554 1.712758BLYP 0.008539 0.005132 �0.006019 0.009963 1.775959
50 K HF 0.014082 0.010326 0.014082 0.017462 2.985122BLYP 0.009252 0.005225 �0.000188 0.010626 1.802856
150 K HF 0.012666 0.006950 0.011659 0.014448 2.406803BLYP 0.008670 0.006168 �0.002521 0.010640 1.791486
295 K HF 0.008863 0.004913 0.003918 0.010133 1.251866BLYP 0.012457 0.008435 �0.008935 0.015044 1.906538
Figure 3Csu-weighted differences (A) between X-ray and neutron measurements for D—H bond distances, at12 K for the Hartree–Fock (left) and BLYP model EDs (right) with the cc-pVTZ basis set. Top row:histograms. D—H su’s (A) are shown for neutron (green) and X-ray (blue) measurements; the maximumsu value is shown on the right axis. Bottom row: frequency plots.
values from the neutron diffraction experiment, while for the
D—H A angles only N1—H1N1 O2 is out of range. This
reflects the excellent agreement of D—H bond distances
between neutron and HAR results discussed above.
4.4. Comparison of ADPs
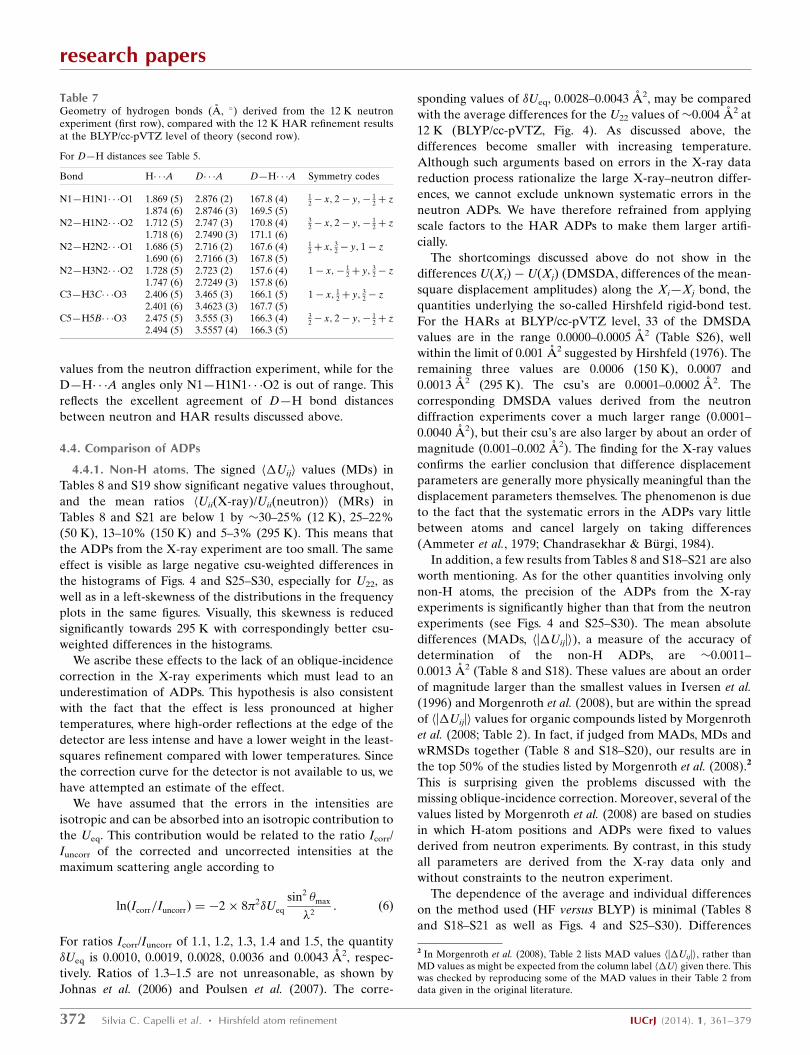
4.4.1. Non-H atoms. The signed h�Uiji values (MDs) in
Tables 8 and S19 show significant negative values throughout,
and the mean ratios hUii(X-ray)/Uii(neutron)i (MRs) in
Tables 8 and S21 are below 1 by �30–25% (12 K), 25–22%
(50 K), 13–10% (150 K) and 5–3% (295 K). This means that
the ADPs from the X-ray experiment are too small. The same
effect is visible as large negative csu-weighted differences in
the histograms of Figs. 4 and S25–S30, especially for U22, as
well as in a left-skewness of the distributions in the frequency
plots in the same figures. Visually, this skewness is reduced
significantly towards 295 K with correspondingly better csu-
weighted differences in the histograms.
We ascribe these effects to the lack of an oblique-incidence
correction in the X-ray experiments which must lead to an
underestimation of ADPs. This hypothesis is also consistent
with the fact that the effect is less pronounced at higher
temperatures, where high-order reflections at the edge of the
detector are less intense and have a lower weight in the least-
squares refinement compared with lower temperatures. Since
the correction curve for the detector is not available to us, we
have attempted an estimate of the effect.
We have assumed that the errors in the intensities are
isotropic and can be absorbed into an isotropic contribution to
the Ueq. This contribution would be related to the ratio Icorr/
Iuncorr of the corrected and uncorrected intensities at the
maximum scattering angle according to
lnðIcorr=IuncorrÞ ¼ �2� 8�2�Ueq
sin2 �max
�2: ð6Þ
For ratios Icorr/Iuncorr of 1.1, 1.2, 1.3, 1.4 and 1.5, the quantity
�Ueq is 0.0010, 0.0019, 0.0028, 0.0036 and 0.0043 A2, respec-
tively. Ratios of 1.3–1.5 are not unreasonable, as shown by
Johnas et al. (2006) and Poulsen et al. (2007). The corre-
sponding values of �Ueq, 0.0028–0.0043 A2, may be compared
with the average differences for the U22 values of�0.004 A2 at
12 K (BLYP/cc-pVTZ, Fig. 4). As discussed above, the
differences become smaller with increasing temperature.
Although such arguments based on errors in the X-ray data
reduction process rationalize the large X-ray–neutron differ-
ences, we cannot exclude unknown systematic errors in the
neutron ADPs. We have therefore refrained from applying
scale factors to the HAR ADPs to make them larger artifi-
cially.
The shortcomings discussed above do not show in the
differences U(Xi)� U(Xj) (DMSDA, differences of the mean-
square displacement amplitudes) along the Xi—Xj bond, the
quantities underlying the so-called Hirshfeld rigid-bond test.
For the HARs at BLYP/cc-pVTZ level, 33 of the DMSDA
values are in the range 0.0000–0.0005 A2 (Table S26), well
within the limit of 0.001 A2 suggested by Hirshfeld (1976). The
remaining three values are 0.0006 (150 K), 0.0007 and
0.0013 A2 (295 K). The csu’s are 0.0001–0.0002 A2. The
corresponding DMSDA values derived from the neutron
diffraction experiments cover a much larger range (0.0001–
0.0040 A2), but their csu’s are also larger by about an order of
magnitude (0.001–0.002 A2). The finding for the X-ray values
confirms the earlier conclusion that difference displacement
parameters are generally more physically meaningful than the
displacement parameters themselves. The phenomenon is due
to the fact that the systematic errors in the ADPs vary little
between atoms and cancel largely on taking differences
(Ammeter et al., 1979; Chandrasekhar & Burgi, 1984).
In addition, a few results from Tables 8 and S18–S21 are also
worth mentioning. As for the other quantities involving only
non-H atoms, the precision of the ADPs from the X-ray
experiments is significantly higher than that from the neutron
experiments (see Figs. 4 and S25–S30). The mean absolute
differences (MADs, h|�Uij|i), a measure of the accuracy of
determination of the non-H ADPs, are �0.0011–
0.0013 A2 (Table 8 and S18). These values are about an order
of magnitude larger than the smallest values in Iversen et al.
(1996) and Morgenroth et al. (2008), but are within the spread
of h|�Uij|i values for organic compounds listed by Morgenroth
et al. (2008; Table 2). In fact, if judged from MADs, MDs and
wRMSDs together (Table 8 and S18–S20), our results are in
the top 50% of the studies listed by Morgenroth et al. (2008).2
This is surprising given the problems discussed with the
missing oblique-incidence correction. Moreover, several of the
values listed by Morgenroth et al. (2008) are based on studies
in which H-atom positions and ADPs were fixed to values
derived from neutron experiments. By contrast, in this study
all parameters are derived from the X-ray data only and
without constraints to the neutron experiment.
The dependence of the average and individual differences
on the method used (HF versus BLYP) is minimal (Tables 8
and S18–S21 as well as Figs. 4 and S25–S30). Differences
research papers
372 Silvia C. Capelli et al. � Hirshfeld atom refinement IUCrJ (2014). 1, 361–379
Table 7Geometry of hydrogen bonds (A, �) derived from the 12 K neutronexperiment (first row), compared with the 12 K HAR refinement resultsat the BLYP/cc-pVTZ level of theory (second row).
For D—H distances see Table 5.
Bond H A D A D—H A Symmetry codes
N1—H1N1 O1 1.869 (5) 2.876 (2) 167.8 (4) 12� x; 2� y;� 1
2þ z1.874 (6) 2.8746 (3) 169.5 (5)
N2—H1N2 O2 1.712 (5) 2.747 (3) 170.8 (4) 32� x; 2� y;� 1
2þ z1.718 (6) 2.7490 (3) 171.1 (6)
N2—H2N2 O1 1.686 (5) 2.716 (2) 167.6 (4) 12þ x; 3
2� y; 1� z1.690 (6) 2.7166 (3) 167.8 (5)
N2—H3N2 O2 1.728 (5) 2.723 (2) 157.6 (4) 1� x;� 12þ y; 3
2� z1.747 (6) 2.7249 (3) 157.8 (6)
C3—H3C O3 2.406 (5) 3.465 (3) 166.1 (5) 1� x; 12þ y; 3
2� z2.401 (6) 3.4623 (3) 167.7 (5)
C5—H5B O3 2.475 (5) 3.555 (3) 166.3 (4) 32� x; 2� y;� 1
2þ z2.494 (5) 3.5557 (4) 166.3 (5)
2 In Morgenroth et al. (2008), Table 2 lists MAD values h|�Uij|i, rather thanMD values as might be expected from the column label h�Ui given there. Thiswas checked by reproducing some of the MAD values in their Table 2 fromdata given in the original literature.
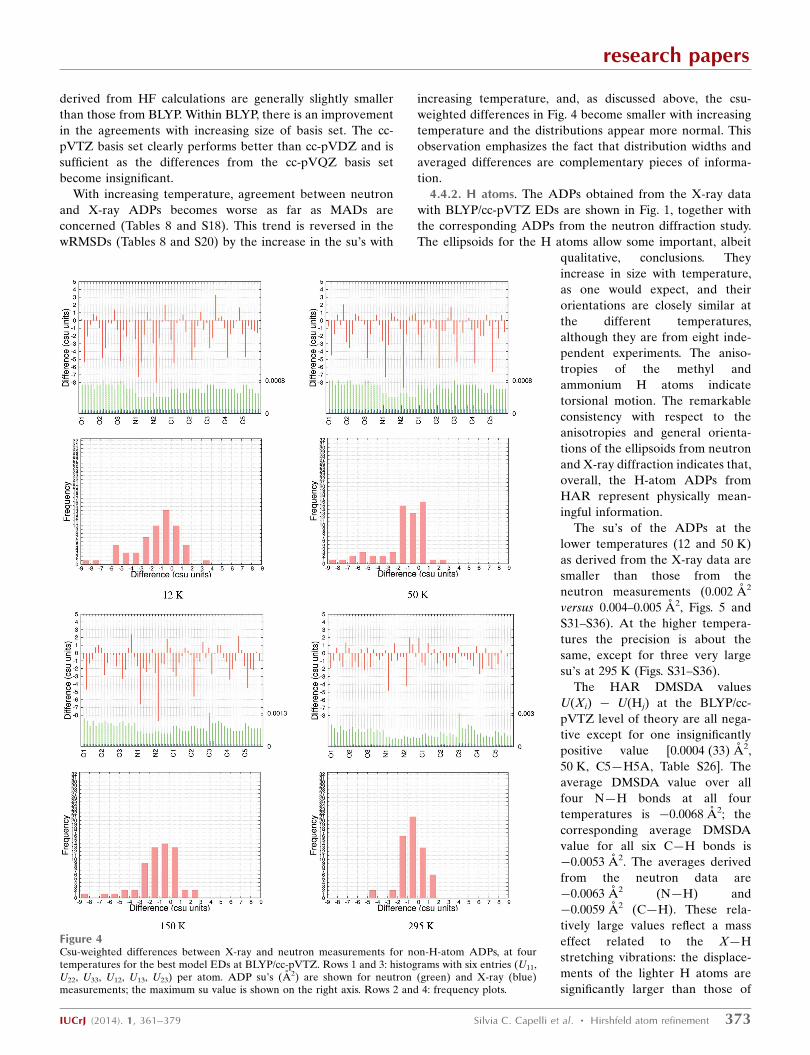
derived from HF calculations are generally slightly smaller
than those from BLYP. Within BLYP, there is an improvement
in the agreements with increasing size of basis set. The cc-
pVTZ basis set clearly performs better than cc-pVDZ and is
sufficient as the differences from the cc-pVQZ basis set
become insignificant.
With increasing temperature, agreement between neutron
and X-ray ADPs becomes worse as far as MADs are
concerned (Tables 8 and S18). This trend is reversed in the
wRMSDs (Tables 8 and S20) by the increase in the su’s with
increasing temperature, and, as discussed above, the csu-
weighted differences in Fig. 4 become smaller with increasing
temperature and the distributions appear more normal. This
observation emphasizes the fact that distribution widths and
averaged differences are complementary pieces of informa-
tion.
4.4.2. H atoms. The ADPs obtained from the X-ray data
with BLYP/cc-pVTZ EDs are shown in Fig. 1, together with
the corresponding ADPs from the neutron diffraction study.
The ellipsoids for the H atoms allow some important, albeit
qualitative, conclusions. They
increase in size with temperature,
as one would expect, and their
orientations are closely similar at
the different temperatures,
although they are from eight inde-
pendent experiments. The aniso-
tropies of the methyl and
ammonium H atoms indicate
torsional motion. The remarkable
consistency with respect to the
anisotropies and general orienta-
tions of the ellipsoids from neutron
and X-ray diffraction indicates that,
overall, the H-atom ADPs from
HAR represent physically mean-
ingful information.
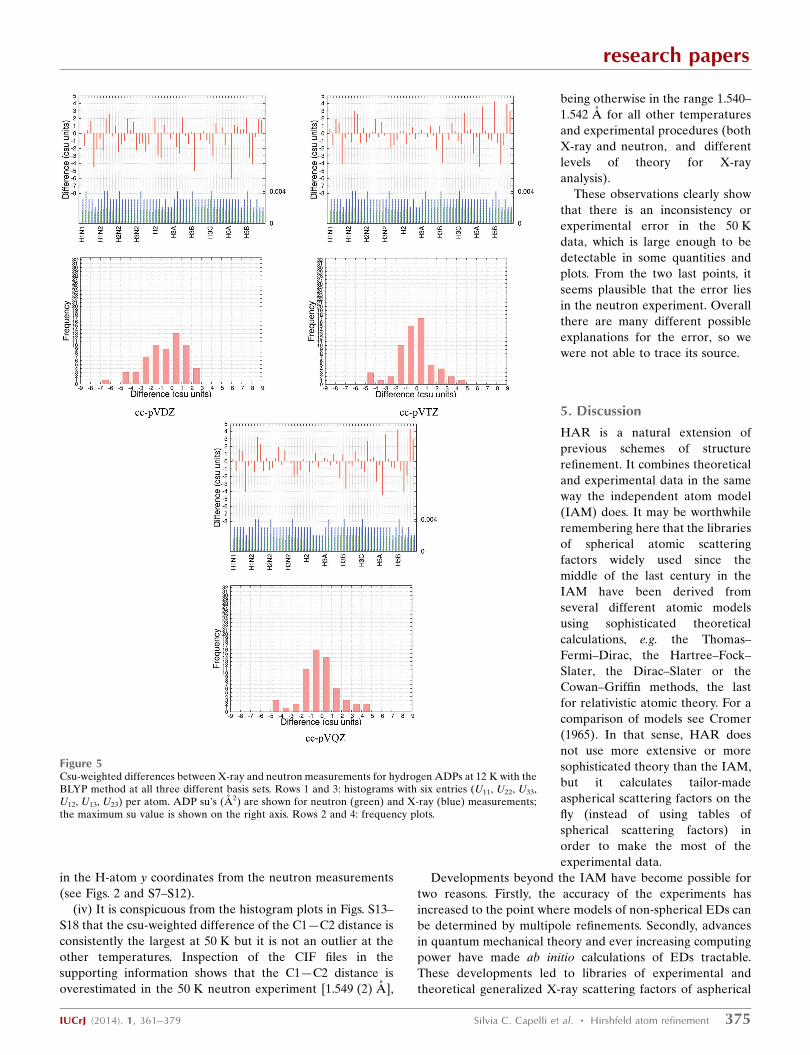
The su’s of the ADPs at the
lower temperatures (12 and 50 K)
as derived from the X-ray data are
smaller than those from the
neutron measurements (0.002 A2
versus 0.004–0.005 A2, Figs. 5 and
S31–S36). At the higher tempera-
tures the precision is about the
same, except for three very large
su’s at 295 K (Figs. S31–S36).
The HAR DMSDA values
U(Xi) � U(Hj) at the BLYP/cc-
pVTZ level of theory are all nega-
tive except for one insignificantly
positive value [0.0004 (33) A2,
50 K, C5—H5A, Table S26]. The
average DMSDA value over all
four N—H bonds at all four
temperatures is �0.0068 A2; the
corresponding average DMSDA
value for all six C—H bonds is
�0.0053 A2. The averages derived
from the neutron data are
�0.0063 A2 (N—H) and
�0.0059 A2 (C—H). These rela-
tively large values reflect a mass
effect related to the X—H
stretching vibrations: the displace-
ments of the lighter H atoms are
significantly larger than those of
research papers
IUCrJ (2014). 1, 361–379 Silvia C. Capelli et al. � Hirshfeld atom refinement 373
Figure 4Csu-weighted differences between X-ray and neutron measurements for non-H-atom ADPs, at fourtemperatures for the best model EDs at BLYP/cc-pVTZ. Rows 1 and 3: histograms with six entries (U11,U22, U33, U12, U13, U23) per atom. ADP su’s (A2) are shown for neutron (green) and X-ray (blue)measurements; the maximum su value is shown on the right axis. Rows 2 and 4: frequency plots.

the heavier X atoms. All values are in the expected ranges.
The mean absolute differences between the X-ray and
neutron measurements are �0.004–0.006 A2, the values at
295 K being larger (Tables 9 and S22). These MAD values are
of the order of about a quarter to a tenth of the individual Uii
values, which is a remarkable result for H-atom ADPs. The
wRMSD values range between 1.5 and 2.0 (Tables 9 and S24),
similar to the values observed for the H-atom coordinates.
The distributions of the csu-weighted differences are suffi-
ciently normal with only some slight indications of skewness
(Figs. 5 and S31–S36), in contrast with the same plots for the
non-H ADPs (Fig. 4). In line with this finding, the systematic
underestimate of X-ray ADPs that was striking for the non-H
ADPs in MD and MR statistics (Table 8) and which was
ascribed to a missing oblique-incidence correction is also not
visible here, neither in the mean differences for the H-atom
ADPs (Tables 9 and S24S23) nor in the mean ratios for the H-
atom ADPs (Tables 9 and S25). In all probability, the infor-
mation on the H-atom ADPs derives primarily from the low-
angle reflections, which are less affected by oblique-incidence
errors.
The MDs (Tables 9 and S23) are smaller at the HF than at
the BLYP level (for all temperatures except 295 K). The same
effect is visible in the MRs (Tables 9 and S25), where the
values are closer to 1 for HF than for BLYP calculations
(except for 295 K). On the other hand, for both MD and MR
the �pop values are consistently larger for the HF than the
BLYP results. Judging from the MADs and wRMSDs (Tables
9, S22 and S24), the BLYP calculations produce clearly better
H-atom ADPs than the HF method. In summary, although the
HF results have a larger spread around the neutron
measurements, they are more accurate as judged from MD
and MR; BLYP is more accurate as judged from MAD and
wRMSD. Therefore, further experiments will be required to
decide the best functional to use. In fact, such ADP
measurements could be used to test different functionals for
accuracy (cf. similar comments for D—H bond lengths in
x4.3.2).
There is a significant improvement in the HAR ADPs with
the basis set change from cc-pVDZ to cc-pVTZ. This is
evident from the decrease in the mean differences in terms of
MADs, MDs and wRMSDs (Tables S22, S23 and S24). The
MRs are significantly closer to 1 if going from cc-pVDZ to cc-
pVTZ (Table S25). In all of these quantities a further step
from cc-pVTZ to cc-pVQZ brings no further improvement.
This is depicted strikingly in Fig. 5, where from BLYP/cc-
pVDZ to BLYP/cc-pVTZ the distribution becomes more
normal and narrower with less severe csu-weighted differ-
ences in the histogram plot, whereas from BLYP/cc-pVTZ to
BLYP/cc-pVQZ both histogram and frequency plots look
virtually identical. This shows that the basis set cc-pVTZ is
both necessary and sufficient. An improvement in the ADPs
from cc-pVDZ to cc-pVTZ means an increase in X-ray ADP
size seen in both MD and MR (Tables S23 and S25) because
the reference values from the neutron experiment remain the
same. The increase in ADPs may be rationalized by the fact
that, when larger basis sets are used, there are generally a
higher number of Gaussian functions employed to model the
hydrogen 1s electrons, leading to a ‘sharper’ and ‘larger’
nuclear cusp. To compensate for this, it seems plausible that
larger ADPs are required.
4.5. Outliers
The data collected in the various tables and figures show
some outliers which have not been discussed above.
(i) All indicators measuring X-ray–neutron differences of
the non-H coordinates and bond lengths in the 50 K results
are larger than those at 12 and 150 K which, together with the
values for 295 K, increase smoothly (Tables S4–S6 and S10–
S13).
(ii) The wRMSDs of the H-atom coordinates at 50 K are
somewhat anomalous (Table S9): whereas the worst agree-
ment is found at the HF/cc-pVTZ level (1.82), the BLYP/cc-
pVTZ model shows the best agreement (1.19). The worst
agreement in the wRMSDs of the D—H distances (2.99) is
again found at 50 K, namely for the HF/cc-pVTZ model,
whereas the best agreement (1.25) is for HF/cc-pVTZ at 295 K
(Table 6).
(iii) At 50 K, the su’s for the H atom x coordinates from the
HAR determinations are about half those for the corre-
sponding H-atom x coordinates from the neutron measure-
ments. Additionally, there seems to be a small systematic error
research papers
374 Silvia C. Capelli et al. � Hirshfeld atom refinement IUCrJ (2014). 1, 361–379
Table 8Various measures of non-H-atom ADP differences for the cc-pVTZ basis set at several temperatures and both HF and BLYP methods.
Mean absolute differences (MADs) h|�Uij|i with corresponding �pop, both in A2; mean differences (MDs) h�Uijiwith corresponding �pop, both in A2; csu-weightedroot-mean-square differences (wRMSDs) h[�Uij/csu(Uij)]2
i1/2; mean ratios (MRs) for diagonal ADPs hri = hUii(X-ray)/Uii(neutron)i with corresponding �pop. No.
of data averaged = 60.
T (K) Method h|�Uij|i �pop h�Uiji �pop h[�Uij/csu]2i
1/2hri �pop
12 HF 0.001056 0.001045 �0.000815 0.001485 2.525565 0.750579 0.166088BLYP 0.001153 0.001136 �0.000905 0.001619 2.734121 0.711751 0.177196
50 HF 0.001152 0.001213 �0.000880 0.001673 2.589051 0.788322 0.163865BLYP 0.001194 0.001290 �0.000951 0.001758 2.686887 0.763786 0.164968
150 HF 0.001137 0.001163 �0.000768 0.001627 2.211385 0.895412 0.092325BLYP 0.001249 0.001194 �0.000853 0.001727 2.326422 0.879288 0.095122
295 HF 0.001336 0.001072 �0.000784 0.001713 1.486372 0.966640 0.062434BLYP 0.001357 0.001008 �0.000759 0.001691 1.415492 0.967150 0.065682
in the H-atom y coordinates from the neutron measurements
(see Figs. 2 and S7–S12).
(iv) It is conspicuous from the histogram plots in Figs. S13–
S18 that the csu-weighted difference of the C1—C2 distance is
consistently the largest at 50 K but it is not an outlier at the
other temperatures. Inspection of the CIF files in the
supporting information shows that the C1—C2 distance is
overestimated in the 50 K neutron experiment [1.549 (2) A],
being otherwise in the range 1.540–
1.542 A for all other temperatures
and experimental procedures (both
X-ray and neutron, and different
levels of theory for X-ray
analysis).
These observations clearly show
that there is an inconsistency or
experimental error in the 50 K
data, which is large enough to be
detectable in some quantities and
plots. From the two last points, it
seems plausible that the error lies
in the neutron experiment. Overall
there are many different possible
explanations for the error, so we
were not able to trace its source.
5. Discussion
HAR is a natural extension of
previous schemes of structure
refinement. It combines theoretical
and experimental data in the same
way the independent atom model
(IAM) does. It may be worthwhile
remembering here that the libraries
of spherical atomic scattering
factors widely used since the
middle of the last century in the
IAM have been derived from
several different atomic models
using sophisticated theoretical
calculations, e.g. the Thomas–
Fermi–Dirac, the Hartree–Fock–
Slater, the Dirac–Slater or the
Cowan–Griffin methods, the last
for relativistic atomic theory. For a
comparison of models see Cromer
(1965). In that sense, HAR does
not use more extensive or more
sophisticated theory than the IAM,
but it calculates tailor-made
aspherical scattering factors on the
fly (instead of using tables of
spherical scattering factors) in
order to make the most of the
experimental data.
Developments beyond the IAM have become possible for
two reasons. Firstly, the accuracy of the experiments has
increased to the point where models of non-spherical EDs can
be determined by multipole refinements. Secondly, advances
in quantum mechanical theory and ever increasing computing
power have made ab initio calculations of EDs tractable.
These developments led to libraries of experimental and
theoretical generalized X-ray scattering factors of aspherical
research papers
IUCrJ (2014). 1, 361–379 Silvia C. Capelli et al. � Hirshfeld atom refinement 375
Figure 5Csu-weighted differences between X-ray and neutron measurements for hydrogen ADPs at 12 K with theBLYP method at all three different basis sets. Rows 1 and 3: histograms with six entries (U11, U22, U33,U12, U13, U23) per atom. ADP su’s (A2) are shown for neutron (green) and X-ray (blue) measurements;the maximum su value is shown on the right axis. Rows 2 and 4: frequency plots.
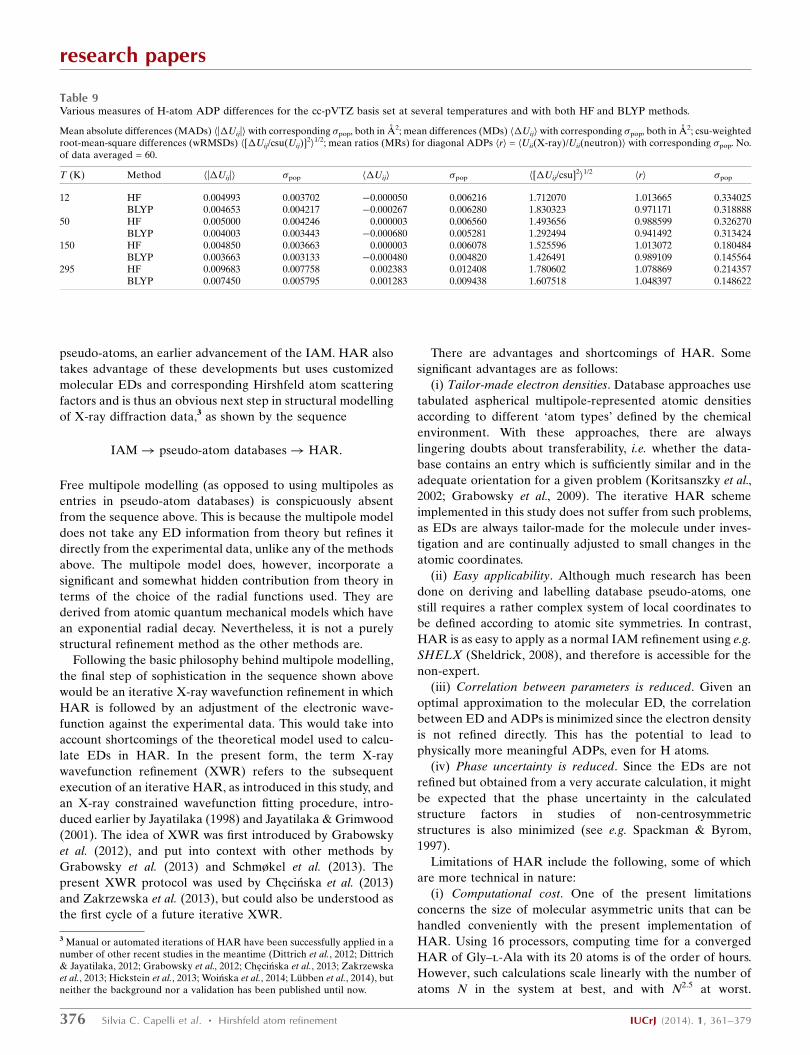
pseudo-atoms, an earlier advancement of the IAM. HAR also
takes advantage of these developments but uses customized
molecular EDs and corresponding Hirshfeld atom scattering
factors and is thus an obvious next step in structural modelling
of X-ray diffraction data,3 as shown by the sequence
IAM! pseudo-atom databases! HAR:
Free multipole modelling (as opposed to using multipoles as
entries in pseudo-atom databases) is conspicuously absent
from the sequence above. This is because the multipole model
does not take any ED information from theory but refines it
directly from the experimental data, unlike any of the methods
above. The multipole model does, however, incorporate a
significant and somewhat hidden contribution from theory in
terms of the choice of the radial functions used. They are
derived from atomic quantum mechanical models which have
an exponential radial decay. Nevertheless, it is not a purely
structural refinement method as the other methods are.
Following the basic philosophy behind multipole modelling,
the final step of sophistication in the sequence shown above
would be an iterative X-ray wavefunction refinement in which
HAR is followed by an adjustment of the electronic wave-
function against the experimental data. This would take into
account shortcomings of the theoretical model used to calcu-
late EDs in HAR. In the present form, the term X-ray
wavefunction refinement (XWR) refers to the subsequent
execution of an iterative HAR, as introduced in this study, and
an X-ray constrained wavefunction fitting procedure, intro-
duced earlier by Jayatilaka (1998) and Jayatilaka & Grimwood
(2001). The idea of XWR was first introduced by Grabowsky
et al. (2012), and put into context with other methods by
Grabowsky et al. (2013) and Schmøkel et al. (2013). The
present XWR protocol was used by Checinska et al. (2013)
and Zakrzewska et al. (2013), but could also be understood as
the first cycle of a future iterative XWR.
There are advantages and shortcomings of HAR. Some
significant advantages are as follows:
(i) Tailor-made electron densities. Database approaches use
tabulated aspherical multipole-represented atomic densities
according to different ‘atom types’ defined by the chemical
environment. With these approaches, there are always
lingering doubts about transferability, i.e. whether the data-
base contains an entry which is sufficiently similar and in the
adequate orientation for a given problem (Koritsanszky et al.,
2002; Grabowsky et al., 2009). The iterative HAR scheme
implemented in this study does not suffer from such problems,
as EDs are always tailor-made for the molecule under inves-
tigation and are continually adjusted to small changes in the
atomic coordinates.
(ii) Easy applicability. Although much research has been
done on deriving and labelling database pseudo-atoms, one
still requires a rather complex system of local coordinates to
be defined according to atomic site symmetries. In contrast,
HAR is as easy to apply as a normal IAM refinement using e.g.
SHELX (Sheldrick, 2008), and therefore is accessible for the
non-expert.
(iii) Correlation between parameters is reduced. Given an
optimal approximation to the molecular ED, the correlation
between ED and ADPs is minimized since the electron density
is not refined directly. This has the potential to lead to
physically more meaningful ADPs, even for H atoms.
(iv) Phase uncertainty is reduced. Since the EDs are not
refined but obtained from a very accurate calculation, it might
be expected that the phase uncertainty in the calculated
structure factors in studies of non-centrosymmetric
structures is also minimized (see e.g. Spackman & Byrom,
1997).
Limitations of HAR include the following, some of which
are more technical in nature:
(i) Computational cost. One of the present limitations
concerns the size of molecular asymmetric units that can be
handled conveniently with the present implementation of
HAR. Using 16 processors, computing time for a converged
HAR of Gly–l-Ala with its 20 atoms is of the order of hours.
However, such calculations scale linearly with the number of
atoms N in the system at best, and with N2.5 at worst.
research papers
376 Silvia C. Capelli et al. � Hirshfeld atom refinement IUCrJ (2014). 1, 361–379
Table 9Various measures of H-atom ADP differences for the cc-pVTZ basis set at several temperatures and with both HF and BLYP methods.
Mean absolute differences (MADs) h|�Uij|i with corresponding �pop, both in A2; mean differences (MDs) h�Uijiwith corresponding �pop, both in A2; csu-weightedroot-mean-square differences (wRMSDs) h[�Uij/csu(Uij)]2
i1/2; mean ratios (MRs) for diagonal ADPs hri = hUii(X-ray)/Uii(neutron)i with corresponding �pop. No.
of data averaged = 60.
T (K) Method h|�Uij|i �pop h�Uiji �pop h[�Uij/csu]2i
1/2hri �pop
12 HF 0.004993 0.003702 �0.000050 0.006216 1.712070 1.013665 0.334025BLYP 0.004653 0.004217 �0.000267 0.006280 1.830323 0.971171 0.318888
50 HF 0.005000 0.004246 0.000003 0.006560 1.493656 0.988599 0.326270BLYP 0.004003 0.003443 �0.000680 0.005281 1.292494 0.941492 0.313424
150 HF 0.004850 0.003663 0.000003 0.006078 1.525596 1.013072 0.180484BLYP 0.003663 0.003133 �0.000480 0.004820 1.426491 0.989109 0.145564
295 HF 0.009683 0.007758 0.002383 0.012408 1.780602 1.078869 0.214357BLYP 0.007450 0.005795 0.001283 0.009438 1.607518 1.048397 0.148622
3 Manual or automated iterations of HAR have been successfully applied in anumber of other recent studies in the meantime (Dittrich et al., 2012; Dittrich& Jayatilaka, 2012; Grabowsky et al., 2012; Checinska et al., 2013; Zakrzewskaet al., 2013; Hickstein et al., 2013; Woinska et al., 2014; Lubben et al., 2014), butneither the background nor a validation has been published until now.
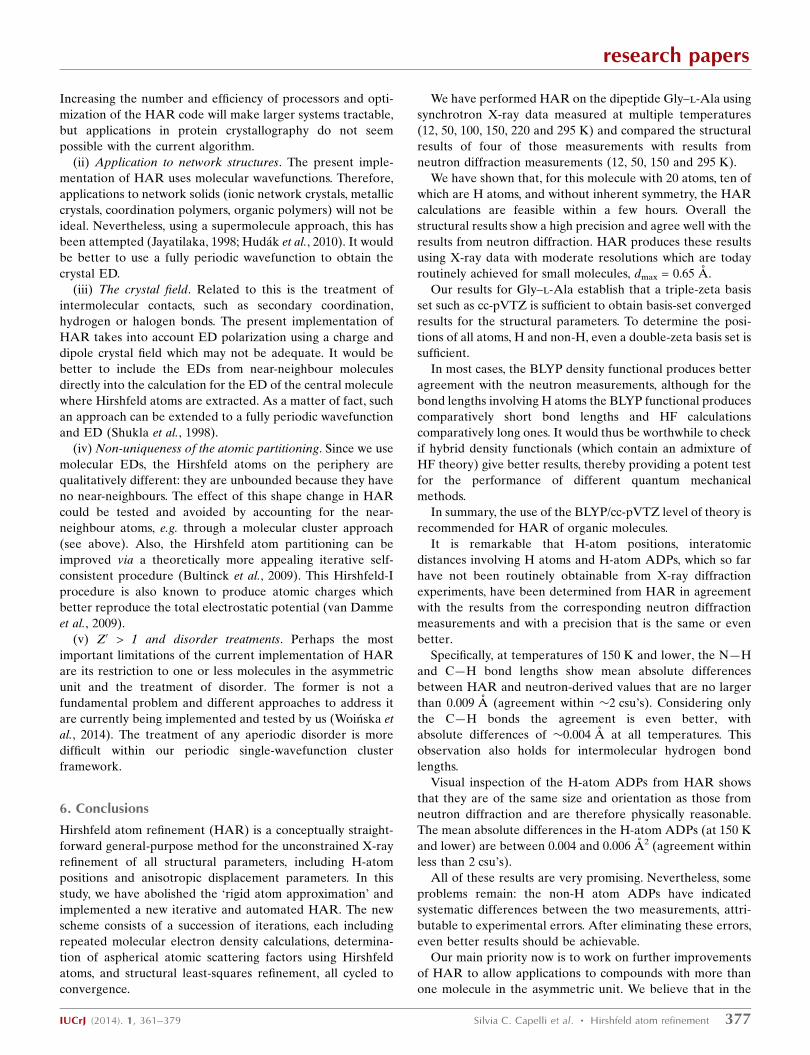
Increasing the number and efficiency of processors and opti-
mization of the HAR code will make larger systems tractable,
but applications in protein crystallography do not seem
possible with the current algorithm.
(ii) Application to network structures. The present imple-
mentation of HAR uses molecular wavefunctions. Therefore,
applications to network solids (ionic network crystals, metallic
crystals, coordination polymers, organic polymers) will not be
ideal. Nevertheless, using a supermolecule approach, this has
been attempted (Jayatilaka, 1998; Hudak et al., 2010). It would
be better to use a fully periodic wavefunction to obtain the
crystal ED.
(iii) The crystal field. Related to this is the treatment of
intermolecular contacts, such as secondary coordination,
hydrogen or halogen bonds. The present implementation of
HAR takes into account ED polarization using a charge and
dipole crystal field which may not be adequate. It would be
better to include the EDs from near-neighbour molecules
directly into the calculation for the ED of the central molecule
where Hirshfeld atoms are extracted. As a matter of fact, such
an approach can be extended to a fully periodic wavefunction
and ED (Shukla et al., 1998).
(iv) Non-uniqueness of the atomic partitioning. Since we use
molecular EDs, the Hirshfeld atoms on the periphery are
qualitatively different: they are unbounded because they have
no near-neighbours. The effect of this shape change in HAR
could be tested and avoided by accounting for the near-
neighbour atoms, e.g. through a molecular cluster approach
(see above). Also, the Hirshfeld atom partitioning can be
improved via a theoretically more appealing iterative self-
consistent procedure (Bultinck et al., 2009). This Hirshfeld-I
procedure is also known to produce atomic charges which
better reproduce the total electrostatic potential (van Damme
et al., 2009).
(v) Z0 > 1 and disorder treatments. Perhaps the most
important limitations of the current implementation of HAR
are its restriction to one or less molecules in the asymmetric
unit and the treatment of disorder. The former is not a
fundamental problem and different approaches to address it
are currently being implemented and tested by us (Woinska et
al., 2014). The treatment of any aperiodic disorder is more
difficult within our periodic single-wavefunction cluster
framework.
6. Conclusions
Hirshfeld atom refinement (HAR) is a conceptually straight-
forward general-purpose method for the unconstrained X-ray
refinement of all structural parameters, including H-atom
positions and anisotropic displacement parameters. In this
study, we have abolished the ‘rigid atom approximation’ and
implemented a new iterative and automated HAR. The new
scheme consists of a succession of iterations, each including
repeated molecular electron density calculations, determina-
tion of aspherical atomic scattering factors using Hirshfeld
atoms, and structural least-squares refinement, all cycled to
convergence.
We have performed HAR on the dipeptide Gly–l-Ala using
synchrotron X-ray data measured at multiple temperatures
(12, 50, 100, 150, 220 and 295 K) and compared the structural
results of four of those measurements with results from
neutron diffraction measurements (12, 50, 150 and 295 K).
We have shown that, for this molecule with 20 atoms, ten of
which are H atoms, and without inherent symmetry, the HAR
calculations are feasible within a few hours. Overall the
structural results show a high precision and agree well with the
results from neutron diffraction. HAR produces these results
using X-ray data with moderate resolutions which are today
routinely achieved for small molecules, dmax = 0.65 A.
Our results for Gly–l-Ala establish that a triple-zeta basis
set such as cc-pVTZ is sufficient to obtain basis-set converged
results for the structural parameters. To determine the posi-
tions of all atoms, H and non-H, even a double-zeta basis set is
sufficient.
In most cases, the BLYP density functional produces better
agreement with the neutron measurements, although for the
bond lengths involving H atoms the BLYP functional produces
comparatively short bond lengths and HF calculations
comparatively long ones. It would thus be worthwhile to check
if hybrid density functionals (which contain an admixture of
HF theory) give better results, thereby providing a potent test
for the performance of different quantum mechanical
methods.
In summary, the use of the BLYP/cc-pVTZ level of theory is
recommended for HAR of organic molecules.
It is remarkable that H-atom positions, interatomic
distances involving H atoms and H-atom ADPs, which so far
have not been routinely obtainable from X-ray diffraction
experiments, have been determined from HAR in agreement
with the results from the corresponding neutron diffraction
measurements and with a precision that is the same or even
better.
Specifically, at temperatures of 150 K and lower, the N—H
and C—H bond lengths show mean absolute differences
between HAR and neutron-derived values that are no larger
than 0.009 A (agreement within �2 csu’s). Considering only
the C—H bonds the agreement is even better, with
absolute differences of �0.004 A at all temperatures. This
observation also holds for intermolecular hydrogen bond
lengths.
Visual inspection of the H-atom ADPs from HAR shows
that they are of the same size and orientation as those from
neutron diffraction and are therefore physically reasonable.
The mean absolute differences in the H-atom ADPs (at 150 K
and lower) are between 0.004 and 0.006 A2 (agreement within
less than 2 csu’s).
All of these results are very promising. Nevertheless, some
problems remain: the non-H atom ADPs have indicated
systematic differences between the two measurements, attri-
butable to experimental errors. After eliminating these errors,
even better results should be achievable.
Our main priority now is to work on further improvements
of HAR to allow applications to compounds with more than
one molecule in the asymmetric unit. We believe that in the
research papers
IUCrJ (2014). 1, 361–379 Silvia C. Capelli et al. � Hirshfeld atom refinement 377
future, with more computational power and improvements in
the algorithms and software, HAR has the potential to replace
the IAM or pseudo-atom database approaches and to
become the default standard for chemical crystallo-
graphy.
Acknowledgements
DJ and HBB acknowledge the Australian Research Council
(ARC) for funding for this study within the Linkage Project
LX0882476. DJ also acknowledges the French Centre National
de la Recherche Scientifique (CNRS) for providing funding in
2005 when part of this work was done. SG acknowledges the
ARC for funding within the Discovery Project DP110105347
and the Discovery Early Career Researcher Award
DE140101330. The ESRF is acknowledged for providing
beamtime.
References
Allen, F. H. & Bruno, I. J. (2010). Acta Cryst. B66, 380–386.Allen, F. H., Watson, D. G., Brammer, L., Orpen, A. G. & Taylor, R.
(2004). International Tables for Crystallography. Vol. C, ch. 9.5, pp.790–811. Dordrecht: Kluwer Academic Publishers.
Ammeter, J. H., Burgi, H.-B., Gamp, E., Meyer-Sandrin, V. & Jensen,W. P. (1979). Inorg. Chem. 18, 733–750.
Bak, J. M., Domagała, S., Hubschle, C., Jelsch, C., Dittrich, B. &Dominiak, P. M. (2011). Acta Cryst. A67, 141–153.
Becke, A. D. (1988). J. Chem. Phys. 88, 2547–2553.Bendeif, E. & Jelsch, C. (2007). Acta Cryst. C63, o361–o364.Birkedal, H., Madsen, D., Mathiesen, R. H., Knudsen, K., Weber,
H.-P., Pattison, P. & Schwarzenbach, D. (2004). Acta Cryst. A60,371–381.
Blessing, R. H. (1995). Acta Cryst. B51, 816–823.Boese, R., Niederprum, N., Blaser, D., Maulitz, A., Antipin, M. Y. &
Mallinson, P. R. (1997). J. Phys. Chem. B, 101, 5794–5799.Bultinck, P., Cooper, D. L. & Van Neck, D. (2009). Phys. Chem. Chem.
Phys. 11, 3424–3429.Bunick, G. & Hanson, L. (2003). Biological Neutron Diffraction.
Transactions of the American Crystallographic Association, Vol. 38.Buffalo, New York: American Crystallographic Association.
Burgi, H.-B. & Capelli, S. C. (2000). Acta Cryst. A56, 403–412.Burgi, H.-B., Capelli, S. C. & Birkedal, H. (2000). Acta Cryst. A56,
425–435.Burgi, H.-B., Capelli, S. C., Goeta, A. E., Howard, J. A., Spackman,
M. A. & Yufit, D. S. (2002). Chem. Eur. J. 8, 3512–3521.Bytheway, I., Grimwood, D. J., Figgis, B. N., Chandler, G. S. &
Jayatilaka, D. (2002). Acta Cryst. A58, 244–251.Capelli, S. C., Burgi, H.-B., Mason, S. A. & Jayatilaka, D. (2014). Acta
Cryst. C70. Submitted.Capelli, S. C., Fortsch, M. & Burgi, H.-B. (2000). Acta Cryst. A56, 413–
424.Chandrasekhar, K. & Burgi, H.-B. (1984). Acta Cryst. B40, 387–
397.Checinska, L., Morgenroth, W., Paulmann, P., Jayatilaka, D. &
Dittrich, B. (2013). CrystEngComm, 15, 2084–2090.Choi, C. S. & Prince, E. (1972). Acta Cryst. B28, 2857–2862.Coppens, P. (1997). X-ray Charge Densities and Chemical Bonding.
New York: Oxford University Press.Coppens, P., Dam, J., Harkema, S., Feil, D., Feld, R., Lehmann, M. S.,
Goddard, R., Kruger, C., Hellner, E., Johansen, H., Larsen, F. K.,Koetzle, T. F., McMullan, R. K., Maslen, E. N. & Stevens, E. D.(1983). Acta Cryst. B39, 760–768.
Coppens, P., Pautler, D. & Griffin, J. F. (1971). J. Am. Chem. Soc. 93,1051–1058.
Cromer, D. T. (1965). Acta Cryst. 19, 224–227.Dadda, N., Nassour, A., Guillot, B., Benali-Cherif, N. & Jelsch, C.
(2012). Acta Cryst. A68, 452–463.Damme, S. van, Bultinck, P. & Fias, S. (2009). J. Chem. Theory
Comput. 5, 334–340.Desiraju, G. (1989). Crystal Engineering – The Design of Organic
Solids. Amsterdam: Elsevier.Desiraju, G. R. & Steiner, T. (1999). The Weak Hydrogen Bond in
Structural Chemistry and Biology. Oxford University Press.Destro, R. & Merati, F. (1995). Acta Cryst. B51, 559–570.Dittrich, B., Hubschle, C. B., Messerschmidt, M., Kalinowski, R.,
Girnt, D. & Luger, P. (2005). Acta Cryst. A61, 314–320.Dittrich, B., Hubschle, C. B., Propper, K., Dietrich, F., Stolper, T. &
Holstein, J. J. (2013). Acta Cryst. B69, 91–104.Dittrich, B. & Jayatilaka, D. (2012). Struct. Bond. 147, 27–46.Dittrich, B., Sze, E., Holstein, J. J., Hubschle, C. B. & Jayatilaka, D.
(2012). Acta Cryst. A68, 435–442.Dittrich, B., Weber, M., Kalinowski, R., Grabowsky, S., Hubschle, C. B.
& Luger, P. (2009). Acta Cryst. B65, 749–756.Domagała, S., Fournier, B., Liebschner, D., Guillot, B. & Jelsch, C.
(2012). Acta Cryst. A68, 337–351.Dunitz, J. (1995). X-ray Analysis and the Structure of Organic
Molecules, 2nd ed. Zurich: Verlag Helvetica Chimica Acta.Dunning, T. H. (1989). J. Chem. Phys. 90, 1007–1023.El Haouzi, A., Hansen, N. K., Le Henaff, C. & Protas, J. (1996). Acta
Cryst. A52, 291–301.Gatti, C. & Macchi, P. (2012). Modern Charge Density Analysis. New
York: Springer.Giacovazzo, C. (2002). Fundamentals of Crystallography, 2nd ed.
Oxford University Press.Grabowsky, S., Jayatilaka, D., Fink, R. F., Schirmeister, T. & Engels, B.
(2013). Z. Anorg. Allg. Chem. 639, 1905–1921.Grabowsky, S., Kalinowski, R., Weber, M., Forster, D., Paulmann, C.
& Luger, P. (2009). Acta Cryst. B65, 488–501.Grabowsky, S., Luger, P., Buschmann, J., Schneider, T., Schirmeister,
T., Sobolev, A. N. & Jayatilaka, D. (2012). Angew. Chem. Int. Ed.51, 6776–6779.
Halliwell, B. & Gutteridge, J. (1999). Free Radicals in Biology andMedicine, 3rd ed. Oxford University Press.
Hathwar, V. R., Thakur, T. S., Guru Row, T. N. & Desiraju, G. R.(2011). Cryst. Growth Des. 11, 616–623.
Hewat, A. W. & Riekel, C. (1979). Acta Cryst. A35, 569–571.Hickstein, D. D., Cole, J. M., Turner, M. J. & Jayatilaka, D. (2013). J.
Chem. Phys. 139, 064108.Hirshfeld, F. L. (1976). Acta Cryst. A32, 239–244.Hirshfeld, F. L. (1977). Isr. J. Chem. 16, 198–201.Hoser, A. A., Dominiak, P. M. & Wozniak, K. (2009). Acta Cryst. A65,
300–311.Hudak, M., Jayatilaka, D., Perasınova, L., Biskupic, S., Kozısek, J. &
Bucinsky, L. (2010). Acta Cryst. A66, 78–92.Hynes, J. T., Klinman, J., Limbach, H.-H. & Schowen, R. (2007).
Editors. Hydrogen Transfer Reactions, Vols. 1–4. Weinheim: WileyVCH.
Iversen, B. B., Larsen, F. K., Figgis, B. N., Reynolds, P. A. & Schultz,A. J. (1996). Acta Cryst. B52, 923–931.
Jarzembska, K. N. & Dominiak, P. M. (2012). Acta Cryst. A68, 139–147.
Jayatilaka, D. (1998). Phys. Rev. Lett. 80, 798–801.Jayatilaka, D. & Dittrich, B. (2008). Acta Cryst. A64, 383–393.Jayatilaka, D. & Grimwood, D. J. (2001). Acta Cryst. A57, 76–86.Johnas, S. K. J., Morgenroth, W. & Weckert, E. (2006). HASYLAB
Annual Report, pp. 325–328. Hamburg: HASYLAB.Koritsanszky, T., Volkov, A. & Coppens, P. (2002). Acta Cryst. A58,
464–472.Langan, P., Fisher, Z., Kovalevsky, A., Mustyakimov, M., Sutcliffe
Valone, A., Unkefer, C., Waltman, M. J., Coates, L., Adams, P. D.,Afonine, P. V., Bennett, B., Dealwis, C. & Schoenborn, B. P. (2008).J. Synchrotron Rad. 15, 215–218.
research papers
378 Silvia C. Capelli et al. � Hirshfeld atom refinement IUCrJ (2014). 1, 361–379
Langan, P., Greene, G. & Schoenborn, B. P. (2004). J. Appl. Cryst. 37,24–31.
Lebedev, V. I. & Laikov, D. N. (1999). Dokl. Math. 59, 477–481.Lubben, J., Volkmann, C., Grabowsky, S., Edwards, A., Morgenroth,
W., Fabbiani, F. P. A., Sheldrick, G. M. & Dittrich, B. (2014). ActaCryst. A70, 309–316.
Madsen, A. Ø. (2006). J. Appl. Cryst. 39, 757–758.Madsen, A. Ø. (2012). Struct. Bond. 146, 21–52.Madsen, A. Ø., Civalleri, B., Ferrabone, M., Pascale, F. & Erba, A.
(2013). Acta Cryst. A69, 309–321.Madsen, A. Ø., Sørensen, H. O., Flensburg, C., Stewart, R. F. &
Larsen, S. (2004). Acta Cryst. A60, 550–561.Martin, A. & Orpen, A. G. (1996). J. Am. Chem. Soc. 118, 1464–
1470.Morgenroth, W., Overgaard, J., Clausen, F. H., Svendsen, H.,
Jørgensen, M. R. V., Larsen, F. K. & Iversen, B. B. (2008). J. Appl.Cryst. 41, 846–853.
Munshi, P., Madsen, A. Ø., Spackman, M. A., Larsen, S. & Destro, R.(2008). Acta Cryst. A64, 164–171.
Mura, M. E. & Knowles, P. J. (1996). J. Chem. Phys. 104, 9848–9858.
Myles, D. A. (2006). Curr. Opin. Struct. Biol. 16, 630–637.O’Connell, A. M., Rae, A. I. M. & Maslen, E. N. (1966). Acta Cryst.
21, 208–219.Poulsen, R. D., Jørgensen, M. R., Overgaard, J., Larsen, F. K.,
Morgenroth, W., Graber, T., Chen, Y. S. & Iversen, B. B. (2007).Chem. Eur. J. 13, 9775–9790.
Riley, K. E., Op’t Holt, B. T. & Merz, K. M. (2007). J. Chem. TheoryComput. 3, 407–433.
Sands, D. E. (1966). Acta Cryst. 21, 868–872.Schmøkel, M. S., Overgaard, J. & Iversen, B. B. (2013). Z. Anorg. Allg.
Chem. 639, 1922–1932.Schwarzenbach, D., Abrahams, S. C., Flack, H. D., Prince, E. &
Wilson, A. J. C. (1995). Acta Cryst. A51, 565–569.Sheldrick, G. M. (2008). Acta Cryst. A64, 112–122.Shukla, A., Dolg, M., Fulde, P. & Stoll, H. (1998). Phys. Rev. B, 57,
1471–1483.Spackman, M. A. & Byrom, P. G. (1997). Acta Cryst. B53, 553–564.
Spackman, M. A., Munshi, P. & Dittrich, B. (2007). Chem. Phys.Chem. 8, 2051–2063.
Stalke, D. (2012). Electron Density and Chemical Bonding I,Experimental Charge Density Studies. Structure and Bonding, Vol.146. New York: Springer.
Stephens, P. J., Devlin, F. J., Chabalowski, C. F. & Frisch, M. J. (1994).J. Phys. Chem. 98, 11624–11627.
Stewart, R. F., Bentley, J. J. & Goodman, B. (1975). J. Chem. Phys. 63,3786–3793.
Stratmann, R. E., Scuseria, G. E. & Frisch, M. J. (1996). Chem. Phys.Lett. 257, 213–223.
Taylor, R. & Kennard, O. (1983a). Acta Cryst. B39, 133–138.Taylor, R. & Kennard, O. (1983b). Acta Cryst. B39, 517–525.Trueblood, K. N., Burgi, H.-B., Burzlaff, H., Dunitz, J. D.,
Gramaccioli, C. M., Schulz, H. H., Shmueli, U. & Abrahams, S. C.(1996). Acta Cryst. A52, 770–781.
Tsirelon, V. G. & Ozerov, R. P. (1996). Electron Density and Bondingin Crystals: Principles, Theory, and X-ray Diffraction Experimentsin Solid State Physics and Chemistry. London: IoP Publishing.
Volkov, A., Li, X., Koritsanszky, T. & Coppens, P. (2004). J. Phys.Chem. A, 108, 4283–4300.
Wang, J., Johnson, B. G., Boyd, R. J. & Eriksson, L. A. (1996). J. Phys.Chem. 100, 6317–6324.
Wang, A. H. J. & Paul, I. C. (1979). Cryst. Struct. Commun. 8, 269–273.Willis, B. T. M. & Pryor, A. W. (1975). Thermal Vibrations in
Crystallography. Cambridge University Press.Woinska, M., Jayatilaka, D., Spackman, M. A., Edwards, A. J.,
Dominiak, P. M., Wozniak, K., Nishibori, E., Sugimoto, K. &Grabowsky, S. (2014). Acta Cryst. A70, doi:10.1107/S2053273314012443.
Wong, M. W. (1996). Chem. Phys. Lett. 256, 391–399.Zakrzewska, A., Kolehmainen, E., Valkonen, A., Haapaniemi, E.,
Rissanen, K., Checinska, L. & Osmiałowski, B. (2013). J. Phys.Chem. A, 117, 252–256.
Zhurov, V. V. & Pinkerton, A. A. (2013). Z. Anorg. Allg. Chem. 639,1969–1978.
Zhurov, V. V., Zhurova, E. A., Stash, A. I. & Pinkerton, A. A. (2011).Acta Cryst. A67, 160–173.
research papers
IUCrJ (2014). 1, 361–379 Silvia C. Capelli et al. � Hirshfeld atom refinement 379


![Synthesis, crystal structure and Hirshfeld surface ...chemetal-journal.org/ejournal18/CMA0318.pdf · Synthesis, crystal structure and Hirshfeld surface analysis of the ... [3] . 3,5-Dimethylpyrazole](https://img.pdfslide.us/doc/110x75/5b77b6d97f8b9a8f698d7fe1/synthesis-crystal-structure-and-hirshfeld-surface-chemetal-synthesis-crystal.jpg)

![research communications Crystal structure, Hirshfeld ... · Crystal structure, Hirshfeld surface analysis and interaction energy, DFT and antibacterial activity studies of (Z)-4-hexyl-2-(4-methylbenzylidene)-2H-benzo[b][1,4]thiazin-3(4H)-one](https://img.pdfslide.us/doc/110x75/5f08e3947e708231d4243670/research-communications-crystal-structure-hirshfeld-crystal-structure-hirshfeld.jpg)