Embed Size (px)
Citation preview
research papers
Acta Cryst. (2012). D68, 391–403 doi:10.1107/S090744491104978X 391
Acta Crystallographica Section D
BiologicalCrystallography
ISSN 0907-4449
Application of DEN refinement and automatedmodel building to a difficult case of molecular-replacement phasing: the structure of a putativesuccinyl-diaminopimelate desuccinylase fromCorynebacterium glutamicum
Axel T. Brunger,a,b* Debanu
Das,c,d Ashley M. Deacon,c,d
Joanna Grant,c,e Thomas C.
Terwilliger,f Randy J. Read,g
Paul D. Adams,h Michael Levitti
and Gunnar F. Schroderj
aDepartments of Molecular and Cellular
Physiology, Neurology and Neurological
Sciences, and Photon Science, Stanford
University, USA, bHoward Hughes Medical
Institute, USA, cJoint Center for Structural
Genomics, USA, dStanford Synchrotron
Radiation Lightsource, SLAC National
Accelerator Laboratory, USA, eProtein Sciences
Department, Genomics Institute of the Novartis
Research Foundation, USA, fLos Alamos
National Laboratory, USA, gDepartment of
Haematology, University of Cambridge,
Cambridge Institute for Medical Research,
England, hDepartment of Bioengineering,
University of California at Berkeley and
Lawrence Berkeley National Laboratory,
Berkeley, USA, iDepartment of Structural
Biology, Stanford University School of
Medicine, USA, and jInstitute of Complex
Systems (ICS-6), Forschungszentrum Julich,
Germany
Correspondence e-mail: [email protected]
Phasing by molecular replacement remains difficult for targets
that are far from the search model or in situations where the
crystal diffracts only weakly or to low resolution. Here, the
process of determining and refining the structure of Cgl1109,
a putative succinyl-diaminopimelate desuccinylase from
Corynebacterium glutamicum, at �3 A resolution is
described using a combination of homology modeling with
MODELLER, molecular-replacement phasing with Phaser,
deformable elastic network (DEN) refinement and automated
model building using AutoBuild in a semi-automated fashion,
followed by final refinement cycles with phenix.refine and
Coot. This difficult molecular-replacement case illustrates the
power of including DEN restraints derived from a starting
model to guide the movements of the model during refinement.
The resulting improved model phases provide better starting
points for automated model building and produce more
significant difference peaks in anomalous difference Fourier
maps to locate anomalous scatterers than does standard
refinement. This example also illustrates a current limitation
of automated procedures that require manual adjustment of
local sequence misalignments between the homology model
and the target sequence.
Received 27 September 2011
Accepted 21 November 2011
PDB Reference:
succinyl-diaminopimelate
desuccinylase, 3tx8.
1. Introduction
Successful molecular-replacement phasing depends on a
number of factors such as the proximity of the search model
to the true structure, the quality and completeness of the
diffraction data (especially at lower resolution), the solvent
content, the presence of noncrystallographic symmetry and
the limiting resolution (dmin) of the crystals. Although recent
advances in reciprocal-space refinement such as deformable
elastic network (DEN) refinement (Schroder et al., 2010),
jelly-body refinement (Murshudov et al., 2011) and real-space
refinement (DiMaio et al., 2011) enable structure determina-
tion from more distant models, the ultimate success of mole-
cular replacement phasing depends on whether previously
unknown parts of the model become visible in the electron-
density maps or whether conformational changes in the
structure are uniquely determined.
DEN refinement consists of torsion-angle refinement
interspersed with B-factor refinement in the presence of a

sparse set of distance restraints (typically one per atom,
randomly selected) which are initially obtained from a
reference model (Schroder et al., 2010). The reference model
can simply be the starting model for refinement or it can be a
homology or predicted model that provides external infor-
mation. During the process of torsion-angle refinement with a
slow-cooling simulated-annealing schema, the DEN distance
restraints are adjusted in order to fit the diffraction data. The
degree of this adjustment or deformation of the initial distance
restraints is controlled by a parameter �. The method of
jelly-body refinement (Murshudov et al., 2011) bears some
resemblance to the special case of DEN refinement with � = 1.
The weight of the DEN distance restraints is controlled by
another parameter, wDEN. A two-dimensional grid search for
(�, wDEN) is performed in which multiple refinements for each
parameter pair are performed with different initial random-
number seeds for the velocity assignments of the torsion-angle
molecular-dynamics method and different randomly selected
DEN distance restraints. The globally optimal model (in terms
of minimal Rfree, possibly assisted by geometric validation
criteria) is then used for further refinement and model
building. By default, the last two macrocycles of the DEN
refinement protocol are performed without any DEN
restraints, so the resulting model is not strained or biased by
the reference model (although such restraints can be useful at
very low resolution). In other words, the DEN restraints guide
the refinement path, increasing the chances of obtaining a
better model than with standard refinement. In addition, the
deformability of the DEN restraints makes this method more
general than rigid-body or normal-mode refinement. Thus,
DEN refinement is a general refinement method that can be
applied to any starting model and reference model. In
practice, the reference model is likely to be identical to the
starting model. However, there are situations in which the
reference model can be different from the starting model. For
example, re-refinements of existing structures can be
performed using structures of homologous proteins that were
not available at the time the original structure was
determined.
A number of highly automated procedures for model
building and model rebuilding have recently been developed
(Levitt, 2001; Oldfield, 2002, 2003; Ioerger & Sacchettini,
2003; DePristo et al., 2005; Cowtan, 2006; Langer et al., 2008;
Terwilliger et al., 2008). A key feature of several of these
procedures is alternation between model building and calcu-
lation of electron-density maps. Each local improvement in
the model leads to an overall improvement in the map, which
in turn makes additional improvements in the model possible.
In this work, we use one of these procedures, the AutoBuild
method (Terwilliger et al., 2008) as implemented in PHENIX
(Adams et al., 2010), as a core tool for model improvement.
In one cycle of model rebuilding with AutoBuild, a density-
modified electron-density map is calculated beginning with
phases from the working model and including any available
experimental phase information. A new model is then built
and refined with phenix.refine (Afonine et al., 2005). Two
methods for rebuilding the working model are used here. In
the first method, several new models (or segments) are built
without reference to the working model. The parts of the new
models and the working model that best fit the electron-
density map are then merged together to form a composite
model. Using this procedure, the model can change in any way
during rebuilding. In the second method, termed ‘rebuilding
in place’, segments of the working model are rebuilt one at a
time, maintaining connectivity and sequence alignment. This
‘rebuilding-in-place’ procedure therefore adjusts the position
of existing atoms in the structure and can be thought of as an
extension of refinement.
In this paper, we describe the process of determining the
crystal structure of Cgl1109 (Joint Center for Structural
Genomics target 376512 listed in TargetDB; http://
targetdb.sbkb.org/TargetDB/), a putative succinyl-diamino-
pimelate desuccinylase from Corynebacterium glutamicum,
using a combination of molecular-replacement phasing,
refinement and semi-automated model building. At the later
stages, experimental phase information from SeMet MAD
phasing was included in the refinement. It should be noted
that these MAD phases were of insufficient quality to allow
automated model building, and manual building would have
been exceedingly difficult and time-consuming even for a
highly skilled crystallographer (see x3.6). Thus, molecular-
replacement phasing was attempted. However, manual inter-
pretation of the initial electron-density map again proved
difficult. Indeed, Cgl1109 was one of the cases used to test
the performance of real-space refinement of the molecular-
replacement solution in conjunction with the Rosetta empirical
energy function (DiMaio et al., 2011; case 10 in Table 1 in this
reference), but the refinement was not completed owing to
poor or disordered density in numerous regions and low
resolution (Rfree = 0.39; Table 1 in DiMaio et al., 2011).
Here, we present an independent structure determination
of Cgl1109 at �3 A resolution without use of the previous
Rosetta model and molecular-replacement solution. A
homology model of Cgl1109 was created using sequence
alignment with PROMALS3D (Pei et al., 2008) and modeling
with MODELLER (Sali & Blundell, 1993) starting from the
structure of succinyl-diaminopimelate desuccinylase from the
�-proteobacterium Neisseria meningitidis (PDB entry 1vgy;
Badger et al., 2005). The structure was determined by mole-
cular replacement with Phaser (McCoy et al., 2007) using a
model edited with Sculptor (Bunkoczi & Read, 2011),
followed by DEN refinement with a full (�, wDEN) grid search
(Schroder et al., 2010), automated model building with Auto-
Build, determination of the selenium sites by anomalous
difference Fourier maps, calculation of MAD phase prob-
ability distributions using a maximum-likelihood method
(Burling et al., 1996) and completion of the refinement in a
semi-automated fashion using AutoBuild and phenix.refine
(Adams et al., 2010) with the MLHL target function (Pannu et
al., 1998). The final model has excellent geometry and Rcryst
and Rfree values of 0.238 and 0.257, respectively, at 2.97 A
resolution.
This example shows that DEN refinement with a full
(�, wDEN) grid search generally produces models that are
research papers
392 Brunger et al. � Succinyl-diaminopimelate desuccinylase Acta Cryst. (2012). D68, 391–403
closer to the true structure than standard (gradient-descent)
or simulated-annealing refinement methods, resulting in
improved model phases and better R values. The improved
model phases in turn provide better starting points for auto-
mated model building with AutoBuild. This approach ulti-
mately produced a well refined structure that would have been
very difficult to achieve with manual model building and
standard refinement. Moreover, the improved model phases
produce more significant difference peaks that better locate
the anomalous diffraction selenium sites. Compared with the
Rosetta refinement method (DiMaio et al., 2011), DEN
refinement has the advantage that it does not require exten-
sive empirical energy-function simulations and that it has been
shown to also work well for structures determined at low
resolution (worse than 3.5 A). The successful application to
Cgl1109 demonstrates that DEN refinement also has signifi-
cant utility for structures determined at �3 A resolution,
especially for cases of anisotropic diffraction and/or high B
factors. The research performed in this paper also serves as a
tutorial for the combined use of various methods and
computer software systems to tackle difficult molecular-
replacement cases. The corresponding data files have been
made available on the CNS website in the tutorial section for
DEN refinement.
2. Materials and methods
2.1. Crystallization
Cgl1109 was expressed, purified and crystallized using the
JCSG high-throughput structural biology pipeline (Elsliger et
al., 2010) and standard JCSG protocols with crystallization
modifications. Briefly, clones were generated using the Poly-
merase Incomplete Primer Extension (PIPE) cloning method
(Klock et al., 2008). The gene encoding Cgl1109 (GenBank
NP_600337, gi|19552335; UniProt Q59284) was PCR-amplified
from C. glutamicum 534 genomic DNA using PfuTurbo DNA
polymerase (Stratagene) and I-PIPE primers (forward primer,
50-ctgtacttccagggcCTGTACTTCCAGGGCATGAACTCTG-
AACTCAAACCAGGATTAG-30; reverse primer, 50-aattaa-
gtcgcgttaAATTAAGTCGCGTTACTCGCTCAGGTACTG-
CTTCAAAATTGC-30; target sequence in upper case) that
included sequences for the predicted 50 and 30 ends. The
genomic DNA used here and obtained from the American
Type Culture Collection (ATCC) contained two amino-acid
substitutions (Glu4Asn and Lys6Gln) and one amino-acid
deletion (Leu5), as confirmed by DNA sequencing, when
compared with the available GenBank sequence from
C. glutamicum 534; these mutations are unlikely to affect the
biochemical properties of the enzyme based on their locations.
Expression was performed in selenomethionine-containing
medium at 298 K. Selenomethionine was incorporated via
inhibition of methionine biosynthesis (Van Duyne et al., 1993),
which does not require a methionine-auxotrophic strain. The
protein was purified by two steps of nickel-chelating chro-
matography (GE Healthcare) with an intermediate step
involving TEV protease cleavage of the purification tag and
was concentrated to 18.5 mg ml�1 by centrifugal ultrafiltration
(Millipore) for crystallization trials. Crystals used for structure
determination were grown using Microseed Matrix Screening
(MMS; Ireton & Stoddard, 2004; D’Arcy et al., 2007) as
implemented with an Oryx8 crystallization robot (Douglas
Instruments). Initial seed crystals used for MMS were grown
using the nanodroplet vapor-diffusion method from sitting
drops composed of 200 nl protein solution mixed with 200 nl
crystallization solution equilibrated against a 50 ml reservoir at
293 K for 48 days prior to harvest. The crystals used for the
seed stock were obtained using a precipitating reagent
consisting of 0.2 M MgCl2, 30% PEG 400, 0.1 M HEPES pH
7.5. The entire crystallization drop (400 nl) containing the seed
crystals was aspirated using a pipette and placed in a Seed
Bead tube (Hampton Research) stored on ice. To ensure that
all crystals were transferred to the Seed Bead tube, the empty
shelf was rinsed with 50 ml mother liquor. The Seed Bead tube
containing the seed stock was vortexed vigorously for three
intervals of 30 s, keeping the tube on ice between each vortex.
Final MMS crystallization plates were set up on the Oryx8 as
sitting drops composed of 150 nl protein, 100 nl crystallization
solution and 50 nl seed stock. The final crystals used for
structure determination were obtained from a crystallization
reagent consisting of 43.1% polyethylene glycol 400, 0.2 M
sodium chloride, 0.1 M sodium/potassium phosphate pH 6.41
at 293 K for 21 d prior to harvest. 6 mM ZnCl2 was added
to the protein prior to setup. No additional cryoprotectant
was added to the crystal. Initial screening for diffraction was
carried out using the Stanford Automated Mounting system
(SAM; Cohen et al., 2002) at the Stanford Synchrotron
Radiation Lightsource (SSRL; Menlo Park, California,
USA).
2.2. X-ray data collection, processing, structure validationand deposition
MAD data were collected on beamline 9-2 at the SSRL at
wavelengths corresponding to the high-energy remote (�1),
inflection point (�2) and peak (�3) wavelengths of a selenium
MAD experiment using the Blu-Ice (McPhillips et al., 2002)
data-collection environment. The data sets were collected at
100 K using a MAR Mosaic 325 CCD detector (Rayonix,
USA). The MAD data were integrated and reduced using
XDS (Kabsch, 2010) and scaled with XSCALE (Kabsch,
2010). Diffraction data and refinement statistics are summar-
ized in Table 1. The quality of the crystal structure was
analyzed using the JCSG Quality Control server (http://
smb.slac.stanford.edu/jcsg/QC), which verifies the stereo-
chemical quality of the model using AutoDepInputTool (Yang
et al., 2004), MolProbity (Chen et al., 2010) and WHAT IF v.5.0
(Vriend, 1990); the agreement between the atomic model and
the data using SFCHECK v.4.0 (Vaguine et al., 1999) and
RESOLVE (Terwilliger, 2000); the protein sequence using
ClustalW (Thompson et al., 1994); atom occupancies using
MOLEMAN2 (Kleywegt, 2000) and the consistency of NCS
pairs; and evaluates Rfree/Rcryst and the maximum/minimum
B factors. Atomic coordinates and experimental data for
research papers
Acta Cryst. (2012). D68, 391–403 Brunger et al. � Succinyl-diaminopimelate desuccinylase 393

Cgl1109 from C. glutamicum to 2.97 A resolution (PDB entry
3tx8) have been deposited in the Protein Data Bank (http://
www.wwpdb.org).
2.3. Homology modeling, structure determination andrefinement
PROMALS3D (Pei et al., 2008) was used for primary-
sequence alignment, MODELLER (Sali & Blundell, 1993)
was used for profile generation and homology modeling,
Sculptor (Bunkoczi & Read, 2011) and Phaser (McCoy et al.,
2007) were used for molecular-replacement phasing, CNS v.1.3
was used for DEN refinement (Schroder et al., 2010), Auto-
Build (Terwilliger et al., 2008) was used for automated model
building, Coot (Emsley et al., 2010) was used for manual
rebuilding and structure validation, CNS was used for MAD
phasing and density modification (Brunger et al., 1998),
phenix.refine (Adams et al., 2010) was used for final refinement
cycles and PyMOL (DeLano, 2002) was used for molecular
illustrations and structure and electron-density map super-
position.
3. Results and discussion
3.1. Search for similar structures,primary-sequence alignment andhomology modeling
A profile of structures related to the
genomic sequence of Cgl1109 (Fig. 1)
was generated using the MODELLER
build_profile.py script (http://
www.salilab.org/modeller/tutorial/basic.
html) and the current protein database
file pdb_95.pir (updated 24 February
2011) available in the supplementary
file download section of the
MODELLER website. This produced a
list of eight homologous structures
(PDB entries 1cg2, 3ct9, 2f7v, 3gb0, 3isz,
3pfo, 2rb7 and 1vgy) with sequence
identities that varied between 24
and 28%. A cluster analysis of these
structures using the MODELLER
compare.py script revealed that they
are all relatively equidistant from each
other, with the exception of PDB
entries 3isz and 1vgy, which are closer to
each other than to the other structures.
Since there is no significant difference
in terms of sequence identity to the
target structure among these candidate
models, the one with the highest reso-
lution and best Rfree value was chosen
for all further calculations (PDB entry
1vgy chain A, referred to as 1vgy-A in
the following), which was also the
template used for Rosetta-based mole-
cular replacement (DiMaio et al., 2011).
The success of molecular replacement depends on optimal
sequence alignment between homologous structure and target
sequence (Schwarzenbacher et al., 2004; Bunkoczi & Read,
2011). To make some use of the structural information in
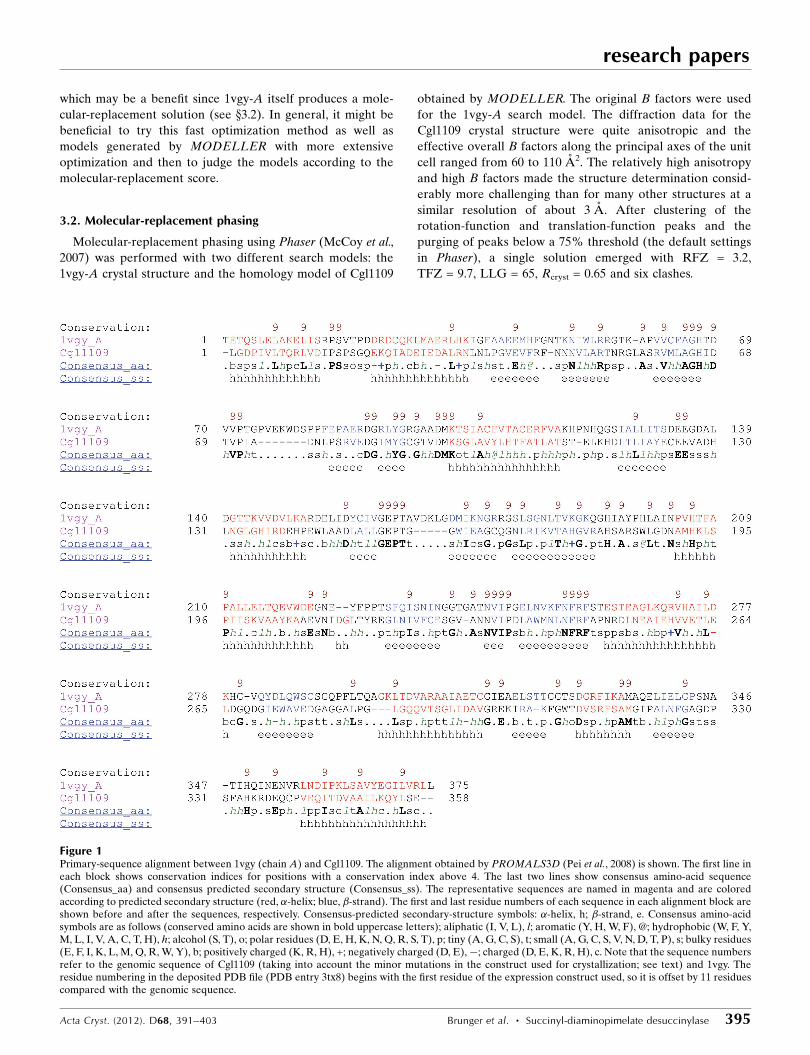
the primary-sequence alignment we used the PROMALS3D
program (Pei et al., 2008), resulting in the alignment shown in
Fig. 1. PROMALS3D can produce more accurate sequence
alignments compared with methods that do not make use of
secondary-structure information for sequence pairs with at
least 20% identity (Pei et al., 2008). Other methods such as
HHpred (Soding, 2005) that include secondary-structure
information may provide alternative alignments (see x4).
The primary-sequence alignment obtained with
PROMALS3D and the structure of 1vgy-A were used as input
for the generation of a homology model using the
model-single.py script of MODELLER. All default para-
meters were used except that the a.very_fast() option was
specified to perform a limited amount of target-function
optimization with conjugate-gradient minimization. This
limited amount of energy minimization keeps the resulting
homology model closer to the crystal structure of 1vgy-A,
research papers
394 Brunger et al. � Succinyl-diaminopimelate desuccinylase Acta Cryst. (2012). D68, 391–403
Table 1Crystallographic data and refinement statistics for Cgl1109.
Values in parentheses are for the highest resolution shell.
�1 MAD-Se(remote)
�2 MAD-Se(inflection point)
�3 MAD-Se(peak)
Space group P6522Unit-cell parameters (A) a = 82.90, b = 82.90, c = 364.18Data collection
Wavelength (A) 0.9116 0.9794 0.9792Resolution range (A) 29.5–2.97 (3.05–2.97) 29.5–3.17 (3.26–3.17) 29.5–2.97 (3.05–2.97)No. of observations 73623 60577 111259No. of unique reflections 16179 13404 16192Completeness (%) 99.1 (98.5) 99.1 (99.0) 99.2 (98.4)Mean I/�(I) 13.1 (1.5) 14.9 (2.8) 17.2 (1.7)Rmerge on I† (%) 9.5 (124.8) 9.1 (64.7) 10.6 (150.6)Rmeas on I‡ (%) 10.1 (140.6) 10.4 (72.9) 11.4 (162.5)
Model and refinement statisticsResolution range (A) 29.5–2.97No. of reflections (total) 16098§No. of reflections (test set) 1649Completeness (%) 99.07Data set used in refinement �1 MAD-SeCutoff criterion |F | > 0Rcryst} 0.238Rfree} 0.257
Stereochemical parametersRestraints (r.m.s.d. observed)
Bond angles (�) 0.625Bond lengths (A) 0.003
Average protein isotropicB factor (A2)
99.7††
Maximum-likelihood-basedcoordinate error (A)
0.71
Protein residues 360Phosphates/chlorides 1/1
† Rmerge =P
hkl
Pi jIiðhklÞ � hIðhklÞij=
Phkl
Pi IiðhklÞ (Diederichs & Karplus, 1997) ‡ Rmeas (redundancy-indepen-
dent Rmerge) =P
hklfNðhklÞ=½NðhklÞ � 1�g1=2 Pi jIiðhklÞ � hIðhklÞij=
Phkl
Pi IiðhklÞ. § Typically, the number of unique
reflections used in refinement is slightly less than the total number that were integrated and scaled. Reflections areexcluded owing to negative intensities and rounding errors in the resolution limits and unit-cell parameters. } Rcryst =P
hkl
��jFobsj � jFcalcj
��=P
hkl jFobsj, where Fcalc and Fobs are the calculated and observed structure-factor amplitudes,respectively. Rfree is the same as Rcryst, but calculated using 10.24% of the total reflections that were chosen at random andomitted from refinement. †† This value represents the total B, which includes overall TLS refinement and residual Bcomponents.
which may be a benefit since 1vgy-A itself produces a mole-
cular-replacement solution (see x3.2). In general, it might be
beneficial to try this fast optimization method as well as
models generated by MODELLER with more extensive
optimization and then to judge the models according to the
molecular-replacement score.
3.2. Molecular-replacement phasing
Molecular-replacement phasing using Phaser (McCoy et al.,
2007) was performed with two different search models: the
1vgy-A crystal structure and the homology model of Cgl1109
obtained by MODELLER. The original B factors were used
for the 1vgy-A search model. The diffraction data for the
Cgl1109 crystal structure were quite anisotropic and the
effective overall B factors along the principal axes of the unit
cell ranged from 60 to 110 A2. The relatively high anisotropy
and high B factors made the structure determination consid-
erably more challenging than for many other structures at a
similar resolution of about 3 A. After clustering of the
rotation-function and translation-function peaks and the
purging of peaks below a 75% threshold (the default settings
in Phaser), a single solution emerged with RFZ = 3.2,
TFZ = 9.7, LLG = 65, Rcryst = 0.65 and six clashes.
research papers
Acta Cryst. (2012). D68, 391–403 Brunger et al. � Succinyl-diaminopimelate desuccinylase 395
Figure 1Primary-sequence alignment between 1vgy (chain A) and Cgl1109. The alignment obtained by PROMALS3D (Pei et al., 2008) is shown. The first line ineach block shows conservation indices for positions with a conservation index above 4. The last two lines show consensus amino-acid sequence(Consensus_aa) and consensus predicted secondary structure (Consensus_ss). The representative sequences are named in magenta and are coloredaccording to predicted secondary structure (red, �-helix; blue, �-strand). The first and last residue numbers of each sequence in each alignment block areshown before and after the sequences, respectively. Consensus-predicted secondary-structure symbols: �-helix, h; �-strand, e. Consensus amino-acidsymbols are as follows (conserved amino acids are shown in bold uppercase letters); aliphatic (I, V, L), l; aromatic (Y, H, W, F), @; hydrophobic (W, F, Y,M, L, I, V, A, C, T, H), h; alcohol (S, T), o; polar residues (D, E, H, K, N, Q, R, S, T), p; tiny (A, G, C, S), t; small (A, G, C, S, V, N, D, T, P), s; bulky residues(E, F, I, K, L, M, Q, R, W, Y), b; positively charged (K, R, H), +; negatively charged (D, E),�; charged (D, E, K, R, H), c. Note that the sequence numbersrefer to the genomic sequence of Cgl1109 (taking into account the minor mutations in the construct used for crystallization; see text) and 1vgy. Theresidue numbering in the deposited PDB file (PDB entry 3tx8) begins with the first residue of the expression construct used, so it is offset by 11 residuescompared with the genomic sequence.

The MODELLER search model (with B factors set to a
uniform value of 50 A2) was first edited using Sculptor
(Bunkoczi & Read, 2011) with the PROMALS3D alignment
(Fig. 1) in order to trim surface side chains (as suggested by
Schwarzenbacher et al., 2004) and to modify the B factors of
the search model according to sequence similarity between
Cgl1109 and 1vgy-A (the similarity score was used for the
B-factor modeling and the Schwarzenbacher score was used
for the pruning). After clustering of the rotation-function and
translation-function peaks and purging peaks below a 75%
threshold (default settings in Phaser), a single solution
emerged with RFZ = 3.2, TFZ = 9.9, LLG = 75, Rcryst = 0.65
and 11 clashes. The position and orientation of this solution
was very similar to that obtained with molecular replacement
using the 1vgy-A search model, lending credence to the
correctness of the solution. Furthermore, the solution was
determined to be identical to that found by molecular
replacement with the Rosetta search model (DiMaio et al.,
2011) apart from application of symmetry and lattice opera-
tors. However, Phaser was unable to produce the correct
solution when using a fully optimized model obtained with
the default settings in MODELLER [as opposed to the
minimal a.very_fast() setting]; inspection of the optimized
MODELLER model revealed that it had significantly moved
away from the 1vgy-A template and thus was apparently
too distant from the true structure of Cgl1109 to produce a
molecular-replacement solution. This example shows that it is
useful to try different homology models and to score them
according to the criteria provided by the particular molecular-
replacement method used, e.g. rotation-function and
translation-function Z scores and log-likelihood gain in
Phaser. In general, it is advisable to try additional searches in
which the search model is broken up into subdomains that
may exhibit different relative orientations and translations.
However, this was unnecessary for Cgl1109 as the subdomain
placements were very similar between Cgl1109 and 1vgy-A
(see below).
A further validation of a molecular-replacement solution
is provided by the overall crystal-packing arrangement and
connectivity of the arrangement, i.e. no empty spaces should
be left between the layers of molecules. Fig. 2 illustrates the
connectivity of the arrangement and the three different
interfaces that are created by symmetry and lattice operators.
3.3. DEN refinement
DEN refinement generally requires a starting model that
matches the primary sequence of the target structure. There-
research papers
396 Brunger et al. � Succinyl-diaminopimelate desuccinylase Acta Cryst. (2012). D68, 391–403
Figure 2Interaction between symmetry-related molecules. A primary molecule(orange) and the nearest symmetry-related molecules (blue) obtained byapplying the symmetry operators of the space group of the crystal (P6522)to the primary molecule are shown, as well as lattice translations. Takentogether, all these molecules form a network of interactions which isconnected throughout the crystal in all three dimensions. The moleculesinteract through three interfaces, labelled 1, 2 and 3. Interface 20 is relatedby crystallographic symmetry to interface 2. Of the three interfaces,interface 1 involves the most extensive interactions, with a buried sufacearea of 1569 A2 (compared with 541 A2 for interface 2 and 276 A2 forinterface 3; the buried surface areas were computed with the PDBePISAserver). Considering the extensive interactions, interface 1 is likely topromote dimerization of the molecule, as is also suggested by thePDBePISA server.
Figure 3DEN refinement starting from molecular-replacement solution. The bestRfree value for each parameter pair (�, wDEN) among 20 repeats is shown;for each parameter pair we performed 20 repeats of the DEN-refinementprotocol consisting of ten macrocycles of torsion-angle refinement andrestrained individual B-factor refinement (for details, see text). The Rfree
value is contoured using values calculated on a 6 � 6 grid (marked bysmall + signs) where the parameter � is (0.0, 0.2, 0.4, 0.6, 0.8, 1.0) andwDEN is (0, 3, 10, 30, 100, 300); the results for wDEN = 0 (i.e. torsion-anglerefinement without DEN restraints) are independent of � and the samevalue was used for all grid points with wDEN = 0. The value of Rfree variesfrom 0.444 to 0.479. The contour plot shows two pronounced minima inthe range 300 � wDEN � 100, with the absolute minimum at wDEN = 300,� = 0.2.
fore, the molecular-replacement solution obtained from the
minimally optimized MODELLER model was used as the
starting point for DEN refinement. Side chains that were
pruned by Sculptor were added back to the model by super-
imposing the complete model obtained by MODELLER on
the Phaser molecular-replacement solution. All B factors were
reset to a uniform value (50 A2). The resulting coordinates
were used as both the starting and reference model for DEN
refinement (Schroder et al., 2010). The refinement protocol
was similar to that used in previous work (Schroder et al., 2010;
as also described in the tutorial for DEN refinement in
CNS v.1.3; http://cns-online.org/v1.3/) except that isotropic
restrained individual B-factor refinement was carried out
instead of restrained group B-factor refinement as appropriate
for the resolution of Cgl1109. Specifi-
cally, ten macrocycles of torsion-angle
refinement and restrained individual B-
factor refinement were performed in
which the first cycle always used � = 0,
the following seven cycles used a
specified value for � (see below) and
the last two cycles were performed
without DEN restraints. The MLF
target function (Pannu & Read, 1996)
was used for the refinement against the
diffraction data at the inflection point
(the same diffraction data that were
used in the work by DiMaio et al., 2011).
In the final stages of refinement, the
diffraction data at the high-energy
remote wavelength were used (see
below).
DEN distance restraints were gener-
ated from N randomly selected pairs of
atoms in the reference model that were
separated by not more than ten residues
along the polypeptide sequence and
were separated by 3–15 A in space
(default settings for DEN refinement in
CNS). The value of N was chosen to be
equal to the number of atoms, so the
set of distance restraints was relatively
sparse, with an average of one restraint
per atom.
We determined the optimum values
of the � and wDEN parameters of DEN
refinement by a global two-dimensional
grid search (Fig. 3). At each grid point,
20 refinement repeats were performed
with different random initial velocities
and different randomly selected DEN
distances. We used 30 combinations of
six � values (0.0, 0.2, 0.4, 0.6, 0.8 and
1.0) and five wDEN values (3, 10, 30, 100
and 300); we also included 20 repeats
with wDEN = 0 (corresponding to using
the refinement protocol without DEN
restraints, with the results being inde-
pendent of �). Of all the resulting
models, the one with the lowest Rfree
value (0.444; Fig. 3 and Table 1) was
used for subsequent model building and
refinement. Generally, if there are
multiple models with similar low Rfree
research papers
Acta Cryst. (2012). D68, 391–403 Brunger et al. � Succinyl-diaminopimelate desuccinylase 397
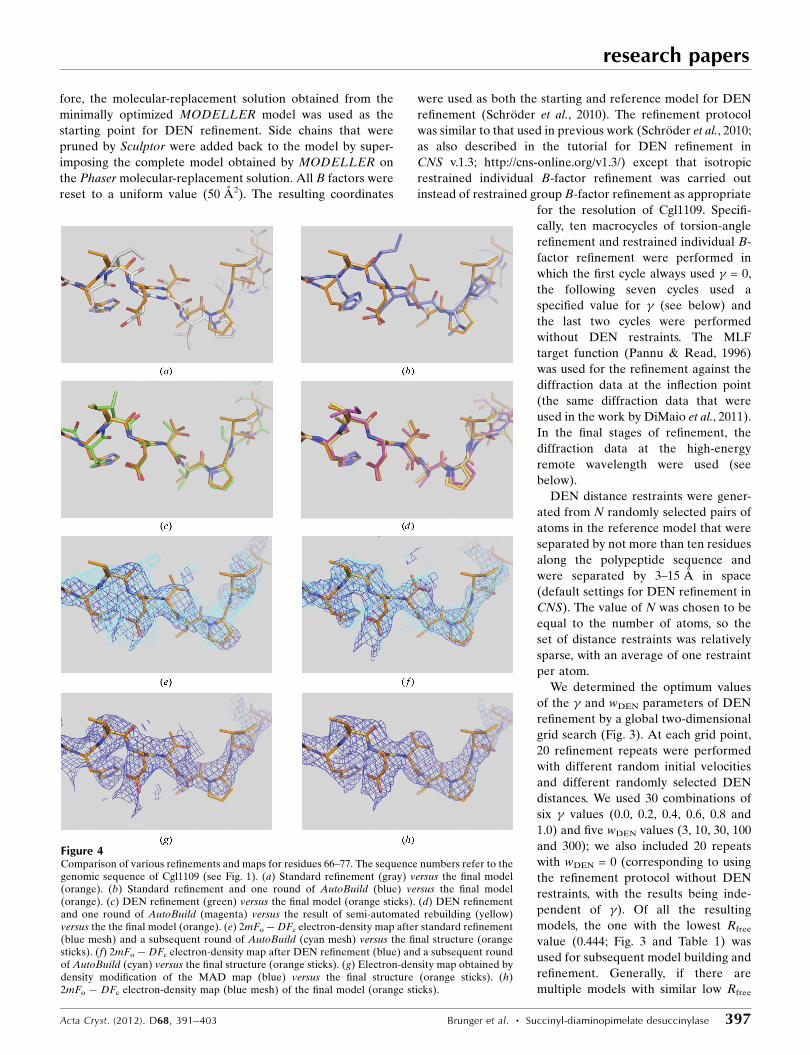
Figure 4Comparison of various refinements and maps for residues 66–77. The sequence numbers refer to thegenomic sequence of Cgl1109 (see Fig. 1). (a) Standard refinement (gray) versus the final model(orange). (b) Standard refinement and one round of AutoBuild (blue) versus the final model(orange). (c) DEN refinement (green) versus the final model (orange sticks). (d) DEN refinementand one round of AutoBuild (magenta) versus the result of semi-automated rebuilding (yellow)versus the the final model (orange). (e) 2mFo�DFc electron-density map after standard refinement(blue mesh) and a subsequent round of AutoBuild (cyan mesh) versus the final structure (orangesticks). (f) 2mFo � DFc electron-density map after DEN refinement (blue) and a subsequent roundof AutoBuild (cyan) versus the final structure (orange sticks). (g) Electron-density map obtained bydensity modification of the MAD map (blue) versus the final structure (orange sticks). (h)2mFo � DFc electron-density map (blue mesh) of the final model (orange sticks).

values, one could choose the one with the better geometry.
The resulting model was substantially better in many places
than what could be achieved using a standard refinement
protocol (for a representative example, compare Figs. 4a and
4b and see below).
3.4. First round of automated modelbuilding with AutoBuild
Starting from the best DEN-refined
structure, automated model building
with AutoBuild (Terwilliger et al., 2008)
was performed. The default settings for
rebuilding the model without the
addition or deletion of residues (the
rebuild_in_place=true option in
AutoBuild) were used except that
‘morphing’ was enabled and the reso-
lution for multiple model building was
set to the limiting resolution of the
diffraction data at the inflection-point
wavelength (3.17 A). The morphing
process in AutoBuild consists of identi-
fying a coordinate shift to apply to each
backbone N atom that maximizes the
local density correlation between the
model and the map (Terwilliger et al.,
submitted). These coordinate shifts are
smoothed and applied to the structure
to generate a morphed structure. An
initial map was used for AutoBuild
consisting of the average of the
2mFo � DFc electron-density maps
corresponding to the top 20 models (in
terms of Rfree) obtained from DEN
refinement. Such map averaging can be
beneficial (Rice et al., 1998), although in
this particular case using the average
map was similar to using the map
obtained from the top solution. This
round of automatic model building
produced further improvements in the
model (Figs. 4d and 5d) and lowered the
R values (Rfree = 0.418, Rcryst = 0.327;
Table 2).
At this point, it became clear from
the electron-density maps produced by
DEN refinement (2mFo � DFc map)
and AutoBuild (both 2mFo � DFc and
density-modified maps) that the model
contained several incorrect sequence
registers, resulting in distorted �-helices
and bulging loops that had no electron
density associated with them (a striking
example is shown in Fig. 6). DEN
refinement and AutoBuild are currently
unable to automatically correct such
sequence-register shifts and deformed
�-helices. In particular, AutoBuild has
research papers
398 Brunger et al. � Succinyl-diaminopimelate desuccinylase Acta Cryst. (2012). D68, 391–403
Figure 5Comparison of various refinements and maps for residues 251–276. Residues 251–263 comprising an�-helix, residues 264–271 comprising a loop and residues 272–276 comprising a �-strand are shown(the sequence numbers refer to the genomic sequence; see Fig. 1). (a) Standard refinement (gray)versus the final model (orange). Standard refinement produces fragmented or incorrectly connectedelectron density (marked by arrows). (b) Standard refinement and one round of AutoBuild (blue)versus the final model (orange). Electron density is still fragmented or shows incorrect connectivity.(c) DEN refinement (green) versus the final model (orange). (d) DEN refinement and one round ofAutoBuild (magenta) versus the result of semi-automated rebuilding (yellow). (e) 2mFo � DFc
electron-density map after standard refinement (blue mesh) and a subsequent round of AutoBuild(cyan mesh) versus the final structure (orange sticks). (f) 2mFo � DFc electron-density map afterDEN refinement (blue) and a subsequent round of AutoBuild (cyan) versus the final structure(orange sticks). (g) Electron-density map obtained by density modification of the MAD map (blue)versus the final structure (orange sticks). (h) 2mFo � DFc electron-density map (blue mesh) of thefinal model (orange sticks).

no facility for automatic adjustment of sequence register or
missing residues when building with the rebuild_in_
place approach. Still, it was possible to correct these errors by
semi-automated rebuilding and manual model building as
outlined below. In principle, completely automated rebuilding
of the model can be performed for structures at 3 A resolution
(e.g. starting from an experimental electron-density map or a
density modified map of a molecular-replacement solution),
but for Cgl1109 this approach was not successful, presumably
owing to the relatively high anisotropy and B values of the
crystal structure. It should be noted that no experimental
MAD phase information had been used up to this stage of the
refinement process, so it is likely that the structure could have
been completed without experimental phase information
(Fig. 6).
3.5. Comparison with standard refinement
For comparison, we performed ‘standard refinement’
consisting of three macrocycles of 200 steps of positional (xyz)
minimization and 200 steps of restrained individual B-factor
refinement using CNS starting from the same model that was
used for DEN refinement. One round of automated model
building starting from this standard refined model was
performed using the same options for AutoBuild as for the
DEN-refined model (see above).
The R values that were achieved by DEN refinement were
significantly lower than those obtained by standard refinement
(e.g. Rfree = 0.444 versus 0.517; see Table 2). Moreover, the
DEN-refined structure was significantly closer to the final
model of Cgl1109 (representative examples are shown in
Figs. 4a, 4c, 5a and 5c). Automated model building did not
significantly improve the model after standard refinement
(Figs. 4b and 5b; Table 2), resulting in Rfree = 0.483 compared
with Rfree = 0.418 for the DEN-refined model. This example
demonstrates that DEN refinement produces significantly
better models than standard refinement for starting models
that are far from the true structure, enabling further
improvements by automated model building with AutoBuild.
In most places there was reasonable agreement between
the final model and the 2mFo � DFc electron-density maps
computed after DEN refinement or subsequent automated
model building (Figs. 4f and 5f). In contrast, the electron-
density maps obtained by standard refinement with and
without subsequent automated model building were frag-
mented and exhibited incorrect connectivity in several places
(Figs. 4e and 5e). Thus, structure completion would have been
very difficult to achieve with manual model building and
standard refinement.
3.6. Determination of selenium sites and MAD phasing
The model obtained from the first round of DEN refine-
ment and automated model building was used to calculate
anomalous difference Fourier maps at the peak wavelength
(�3). These difference maps produced difference peaks for the
six selenium sites of the SeMet residues in the protein. The
positions of these six sites closely matched the positions of the
Se atoms in the model obtained after DEN refinement and
automated model building. Fig. 7 shows the standard devia-
tions from the mean of the map (�) of these six sites and the
highest noise peak. The standard deviations of the peaks are
compared with those obtained from standard refinement with
and without subsequent automated model building. The
combination of DEN refinement and automated model
building produced the most significant difference peaks, all of
which were well separated from noise. Standard refinement
produced the poorest results, with three of the sites close to
noise peaks. For both standard refinement and DEN refine-
ment automated model building with AutoBuild improved the
significance of the sites, although DEN refinement alone still
produced more significant peaks for some of the sites than
standard refinement and automated model building. In
retrospect, it may have been possible to obtain the positions of
the six sites by ab initio search, for example by using the HySS
submodule (Grosse-Kunstleve & Adams, 2003), although
careful choice of the high-resolution limit is required (trun-
cation to 4.5 A resolution) since a search against all diffraction
research papers
Acta Cryst. (2012). D68, 391–403 Brunger et al. � Succinyl-diaminopimelate desuccinylase 399
Table 2R values for different refinement stages and, for comparison, for standardrefinement.
Structure Rfree Rcryst
Phaser solution — 0.649Standard refinement 0.517 0.432Standard refinement + AutoBuild 0.483 0.374DEN refinement 0.444 0.399DEN refinement + AutoBuild 0.418 0.327Second DEN refinement (MLHL) 0.397 0.366Second DEN refinement + AutoBuild (MLHL) 0.372 0.325Final refined 0.257 0.238
Figure 6Comparison of various refinements and maps for residues 251–276. Aclose-up view of the loop consisting of residues 264–271, which is also partof Fig. 5, is shown. The final model is colored orange (sticks and cartoonrepresentation). The structure after the first round of DEN refinementand AutoBuild is colored magenta (sticks and cartoon representation)and the corresponding 2mFo � DFc electron-density map (with modelphases calculated from this structure, but without experimental phaseinformation, and contoured at 1.4�) is colored marine blue. The electron-density map clearly shows that the loop needed to be corrected.

data produced only one site that matched one of the six
selenium sites.
We next calculated MAD phase probability distributions to
2.97 A resolution and refined the six selenium sites using a
maximum-likelihood method (Burling et al., 1996) as
implemented in CNS (Brunger et al., 1998) using the
mad_phase.inp task file. The diffraction data collected at the
three wavelengths were used (Table 1), anisotropic scale
factors between the three data sets were refined, individual B
factors for the anomalous sites were refined, occupancies were
set to 1 and anomalous form factors were constrained to be
identical for all sites at a particular wavelength. The phasing
calculations resulted in an overall figure of merit of 0.55 with
reasonable overall scale factors, B factors and anomalous form
factors of f 0 = �6.14 (�6.95), f 00 = 4.73 (3.15) at the peak,
f 0 = �11, f 00 = 5.27 at the inflection point and f 0 = �3.32
(�3.59), f 00 = 3.66 (1.05) at the remote wavelength, where the
numbers refer to the results from the Friedel mate F to
Freference lack-of-closure expressions and the numbers in
parentheses refer to the F to Freference lack-of-closure expres-
sions (Burling et al., 1996). For comparison, the predicted
values obtained from a fluorescence scan of the crystal are
f 0 = �8.65, f 00 = 6.21 at the peak, f 0 = �11.11, f 00 = 3.64 at the
inflection point and f 0= �1.70, f 00 = 3.30 at the remote wave-
length. In our experience, the differences between the refined
values of f 0 and f 00 for the two lack-of-closure expressions and
from the predicted values are not uncommon for SeMet MAD
data.
The resulting MAD electron-density map was subjected to
density modification as implemented in CNS (Brunger et al.,
1998) using the density_modify.inp task file. The default
settings were used, which include solvent flipping with
generation of the mask based on root-mean-square electron-
density fluctuations assuming 70% solvent content. No atomic
model was used for the generation of the mask and no prior
phase information was used for the refinement of anomalous
sites in order to avoid model bias. The resulting figure of merit
was 0.81 and the density-modified MAD electron-density map
was connected but did not allow unambiguous identification of
side chains for many residues (Figs. 4g and 5g). Although this
map may be of sufficient quality such that manual building
could have been attempted, it would have been challenging at
this resolution. Indeed, automated model building using the
same map resulted in a very incomplete model: only 76 side
chains were fitted out of 360, with several false backbone
connections.
3.7. Semi-automated completion of the refinement
A second round of DEN refinement (using the current
model obtained from the first round of DEN refinement and
automated model building as both the starting and the refer-
ence model) and automated model building was performed
using the MLHL target function (Pannu et al., 1998) that
included the experimental MAD phase information, resulting
in relatively small localized changes in coordinates with some
more significant corrections of side-chain positions, improve-
ments in R values and a reduction of the Rfree � Rcryst
difference (Table 2).
As mentioned above, there were several regions that
required correction of register shifts and rebuilding of
�-helices (a particular example is shown in Fig. 6) that were
not corrected even in the second round of DEN refinement
and automated model building. To correct these regions,
selected regions were deleted from the model and another
round of automated rebuilding with AutoBuild was performed,
again using the electron-density map from the previous model
as the initial map, using the experimental MAD phase infor-
mation and the primary sequence, with morphing enabled and
the rebuild-in-place option set to false. Interestingly, we found
that using a 2mFo � DFc electron-density map as the initial
electron-density map for AutoBuild produced somewhat
better results for rebuilding in this particular case than using
the density-modified map generated by AutoBuild. The
resulting models (using models with different deletions as
starting models for automated model building) were inspected
using Coot (Emsley et al., 2010) and the portions that best
fitted the electron-density maps were combined to generate a
hybrid model. Missing loops were fitted with the ‘Fit Loops’
feature of PHENIX. This procedure of selected rebuilding by
deletion of the problematic regions and automated rebuilding
was repeated several times. This semi-automated method
corrected the majority of cases of incorrectly fitted �-helices
and loops arising from register errors (Figs. 4d and 5d, yellow
versus orange models).
The remaining misfitted regions were manually corrected
with Coot (Emsley et al., 2010) interspersed with refinement
with phenix.refine (Adams et al., 2010). The final refinement
(Table 1) employed residues 10–369 of Cgl1109 (a 369-residue
protein) and other solvent molecules (one phosphate ion and
research papers
400 Brunger et al. � Succinyl-diaminopimelate desuccinylase Acta Cryst. (2012). D68, 391–403
Figure 7Significance of selenium sites. The standard deviation above the mean (�)in anomalous difference Fourier maps is shown for the six selenium sitesof the SeMet variant of Cgl1109. For comparison, the standard deviationof the highest noise peak is also shown. The amplitudes for the calculationof the anomalous difference Fourier map were obtained from thediffraction data at the peak wavelength (Table 1). The phases wereobtained from the atomic model after standard refinement (bluediamonds), standard refinement followed by automated building withAutoBuild (green triangles), DEN refinement (yellow squares) and DENrefinement followed by automated model building with AutoBuild (redcircles).

one chloride ion). It was performed against diffraction data
collected at the high-energy remote wavelength (Table 1).
3.8. Biological implications and comparison between 1vgyand Cgl1109
C. glutamicum is a Gram-positive bacterium that finds
industrial use in the production of vitamins and amino acids,
including glutamic acid, which is used in the production of
the flavoring agent monosodium glutamate. Cgl1109 (NCBI
reference sequence identifier NP_600337; UniProt identifier
Q59284) is a putative succinyl-diaminopimelate desuccinylase
(DapE) from C. glutamicum consisting of two domains: a
peptidase domain belonging to family PF01546 (Peptidase_
M20) in clan CL0035 of zinc metallopeptidases (�30 000
proteins in 12 families) in v.25 of the Pfam database (Finn et
al., 2010) and a dimerization domain belonging to PF07687
(M20_dimer). These proteins have a broad phylogenetic
spread across all kingdoms of life, show substantial sequence
divergence and are essential for numerous biological
processes (for example, recombinant bacterial carboxy-
peptidase G2 is used in cancer therapy to hydrolyze metho-
trexate and is being tested in prodrug therapy, and human
aspartoacylase is implicated in Canavan’s disease in the brain),
but structural coverage exists for only a small fraction
(�0.3%) of the proteins in this clan. Cgl1109 was selected by
the JCSG to increase the structural coverage of these families
and is one of �20 structures determined to date (see http://
www.topsan.org/Groups/Zinc_Peptidase). DapE is involved in
producing l-lysine and l,l-2,6-diaminopimelate and its cata-
lytic mechanism is likely to involve two zinc ions.
The crystal structure of Cgl1109 reveals a dimeric structure
from crystal-packing considerations and as also suggested
by the PDBePISA server (Fig. 2). The dimeric assembly is
promoted by the smaller of the two domains of the molecule
(Fig. 8), while the larger domain is the putative catalytic
domain. The dimeric assembly is consistent with proteins from
this family that contain a similar dimerization domain. Elec-
tron density in 2mFo � DFc and mFo � DFc maps initially
suggested the possible presence of two zinc ions in the puta-
tive catalytic site, which would be expected owing to the
addition of 6 mM ZnCl2 during cocrystallization (which was
added based on putative functional annotation and ligand
screening in a fluorescence-based thermal shift assay).
However, we did not model zinc ions in the final model owing
to the uncertainty associated with high B factors and the
absence of significant peaks in the anomalous difference
Fourier maps, including from diffraction data collected at the
zinc absorption edge.
Fig. 8 shows a superposition of Cgl1109 with the template
used for homology modeling (PDB entry 1vgy, chain A),
a putative succinyl-diaminopimelate desuccinylase from
N. meningitidis. The superposition shows that the overall fold
is identical, but that there are large differences in secondary-
structural element placement and length, as perhaps expected
considering the low sequence identity (25%) between the
proteins and the resulting difficulties with molecular-
replacement phasing.
4. Conclusions
Successful structure determination of the difficult molecular-
replacement example Cgl1109 illustrates the synergism
between DEN refinement and automated model building with
AutoBuild. DEN refinement is most beneficial at the early
stage of the refinement process, immediately after molecular-
replacement phasing, when the model is still relatively crude
and distant from the true structure. For Cgl1109, DEN
refinement resulted in a model that is closer to the true
structure, producing improved model phases that in turn
provide a better starting point for automated model building.
The improved model phases also provided more significant
peaks in anomalous difference Fourier maps to better locate
the six selenium sites of the protein. In contrast, standard
refinement (i.e. positional and B-factor refinement) produced
fragmented electron density with incorrect connectivity
(marked by arrows in Fig. 5e). The R values that we obtained
after the initial round of DEN refinement and automated
model building with AutoBuild are better than those reported
in Table 1 of DiMaio et al. (2011) (Rfree = 0.418 versus
Rfree = 0.460). This difference is most likely to arise from
performing a full (�, wDEN) grid search with multiple repeats
with different initial velocities and random selection of DEN
restraints at each grid point in the present work as opposed
to a single DEN refinement as was performed previously
(DiMaio et al., 2011). Our success in fully refining the Cgl1109
structure also demonstrates that the combination of DEN
refinement and automated model building is a viable alter-
native to the Rosetta molecular-replacement approach
(DiMaio et al., 2011). However, further analysis is required to
determine the optimal application and potential limitations of
both methods.
research papers
Acta Cryst. (2012). D68, 391–403 Brunger et al. � Succinyl-diaminopimelate desuccinylase 401
Figure 8Comparison of Cgl1109 with 1vgy-A. A superposition of the final modelof Cgl1109 (orange cartoon) and chain A of PDB entry 1vgy (bluecartoon) is shown. The superposition was performed with PyMOL(DeLano, 2002).
Poorly fitted portions of the model after DEN refinement
and automated model building were readily identified
by inspection of the electron-density maps (Fig. 6). These
electron-density maps unambiguously suggested how to
correct the model. It turned out that most of these regions
were related to local sequence misalignments. We generated a
structure-based alignment between the template 1vgy-A and
Cgl1109 using MUSTANG (Konagurthu et al., 2006) and
compared it with predicted alignments. PROMALS3D and
HHpred correctly assigned 282 and 291 positions (of a total of
360 residues visible in the Cgl1109 structure), respectively. The
difference between the PROMALS3D and HHpred align-
ments is caused by a one-register shift involving an �-helix
(residues 132–140). This one-residue shift required manual
rebuilding when using the PROMALS3D alignment for the
molecular-replacement search model. In retrospect, it might
have been beneficial to use models generated by both the
PROMALS3D and HHpred alignments as starting points for
DEN refinement and automated model building and then to
generate a composite model keeping the best-fitting parts of
both models.
Sequence-register errors that arise from local misalign-
ments between the target protein and the homology model
can be difficult to correct using automated model-building
methods when working with electron-density maps at low
resolution or those based on highly anisotropic diffraction
data. Overinterpretation or misinterpretation of such low-
resolution maps is a real danger when they are manually
interpreted without assistance from more objective computa-
tional methods. Indeed, we were able to partially automate
the process by deleting the incorrectly aligned regions and
rebuilding the parts with automated methods; some remaining
regions had to be manually corrected. In particular, AutoBuild
will sometimes misfit �-helices at low resolution, tracing the
chain through the center of the �-helix (Fig. 5d, magenta). It
should be noted, however, that in this case the method of
deleting the �-helix from the current model and rebuilding it
from scratch produced the correct fit (Fig. 5d, yellow).
However, in two other instances this approach was not
successful and the �-helices had to be manually rebuilt. It
seems possible that this process could be fully automated. This
would be especially important for low-resolution structures, in
which interpretation of the electron-density map by inspection
can be subjective and can lead to local misfitting (DeLaBarre
& Brunger, 2005; Davies et al., 2008). It is conceivable that
a systematic method to probe the fit with different local
sequence alignments in problematic regions might produce
the best possible model for such low-resolution structures.
Genomic DNA from C. glutamicum 534 (ATCC No.
13032D) was obtained from the American Type Culture
Collection (ATCC). We thank all members of the JCSG for
their contribution to the development and operation of our
HTP structural biology pipeline and for bioinformatics
analysis, protein production and structure determination. The
JCSG is supported by the NIH, National Institutes of General
Medical Sciences, Protein Structure Initiative (U54 GM094586
and GM074898). Portions of this research were performed
at the Stanford Synchrotron Radiation Lightsource (SSRL),
SLAC National Accelerator Laboratory. The SSRL is a
national user facility operated by Stanford University on
behalf of the United States Department of Energy, Office
of Basic Energy Sciences. The SSRL Structural Molecular
Biology Program is supported by the Department of Energy,
Office of Biological and Environmental Research and by the
National Institutes of Health (National Center for Research
Resources, Biomedical Technology Program and the National
Institute of General Medical Sciences). ATB acknowledges
funding by the Howard Hughes Medical Institute. RJR is
supported by the Wellcome Trust. ML acknowledges NIH
grant GM063817. This work was supported in part by the
US Department of Energy under contract No. DE-AC03-
76SF00098 at Lawrence Berkeley National Laboratory and
NIH/NIGMS grant 1P01GM063210 to PDA, RJR and TCT.
The content is solely the responsibility of the authors and does
not necessarily represent the official views of the National
Institute of General Medical Sciences or the National Insti-
tutes of Health.
References
Adams, P. D. et al. (2010). Acta Cryst. D66, 213–221.Afonine, P. V., Grosse-Kunstleve, R. W. & Adams, P. D. (2005). CCP4
Newsl. Protein Crystallogr. 41, contribution 8.Badger, J. et al. (2005). Proteins, 60, 787–796.Brunger, A. T., Adams, P. D., Clore, G. M., DeLano, W. L., Gros, P.,
Grosse-Kunstleve, R. W., Jiang, J.-S., Kuszewski, J., Nilges, M.,Pannu, N. S., Read, R. J., Rice, L. M., Simonson, T. & Warren, G. L.(1998). Acta Cryst. D54, 905–921.
Bunkoczi, G. & Read, R. J. (2011). Acta Cryst. D67, 303–312.Burling, F. T., Weis, W. I., Flaherty, K. M. & Brunger, A. T. (1996).
Science, 271, 72–77.Chen, V. B., Arendall, W. B., Headd, J. J., Keedy, D. A., Immormino,
R. M., Kapral, G. J., Murray, L. W., Richardson, J. S. & Richardson,D. C. (2010). Acta Cryst. D66, 12–21.
Cohen, A. E., Ellis, P. J., Miller, M. D., Deacon, A. M. & Phizackerley,R. P. (2002). J. Appl. Cryst. 35, 720–726.
Cowtan, K. (2006). Acta Cryst. D62, 1002–1011.D’Arcy, A., Villard, F. & Marsh, M. (2007). Acta Cryst. D63, 550–554.Davies, J. M., Brunger, A. T. & Weis, W. I. (2008). Structure, 16,
715–726.DeLaBarre, B. & Brunger, A. T. (2005). J. Mol. Biol. 347, 437–452.DeLano, W. L. (2002). PyMOL. http://www.pymol.org.DePristo, M. A., de Bakker, P. I., Johnson, R. J. & Blundell, T. L.
(2005). Structure, 13, 1311–1319.Diederichs, K. & Karplus, P. A. (1997). Nature Struct. Biol. 4, 269–275.DiMaio, F., Terwilliger, T. C., Read, R. J., Wlodawer, A., Oberdorfer,
G., Wagner, U., Valkov, E., Alon, A., Fass, D., Axelrod, H. L., Das,D., Vorobiev, S. M., Iwaı, H., Pokkuluri, P. R. & Baker, D. (2011).Nature (London), 473, 540–543.
Elsliger, M.-A., Deacon, A. M., Godzik, A., Lesley, S. A., Wooley, J.,Wuthrich, K. & Wilson, I. A. (2010). Acta Cryst. F66, 1137–1142.
Emsley, P., Lohkamp, B., Scott, W. G. & Cowtan, K. (2010). ActaCryst. D66, 486–501.
Finn, R. D., Mistry, J., Tate, J., Coggill, P., Heger, A., Pollington, J. E.,Gavin, O. L., Gunasekaran, P., Ceric, G., Forslund, K., Holm, L.,Sonnhammer, E. L., Eddy, S. R. & Bateman, A. (2010). NucleicAcids Res. 38, 211–222.
Grosse-Kunstleve, R. W. & Adams, P. D. (2003). Acta Cryst. D59,1966–1973.
research papers
402 Brunger et al. � Succinyl-diaminopimelate desuccinylase Acta Cryst. (2012). D68, 391–403
Ioerger, T. R. & Sacchettini, J. C. (2003). Methods Enzymol. 374,244–270.
Ireton, G. C. & Stoddard, B. L. (2004). Acta Cryst. D60, 601–605.Kabsch, W. (2010). Acta Cryst. D66, 125–132.Kleywegt, G. J. (2000). Acta Cryst. D56, 249–265.Klock, H. E., Koesema, E. J., Knuth, M. W. & Lesley, S. A. (2008).
Proteins, 71, 982–994.Konagurthu, A. S., Whisstock, J. C., Stuckey, P. J. & Lesk, A. M.
(2006). Proteins, 64, 559–574.Langer, G., Cohen, S. X., Lamzin, V. S. & Perrakis, A. (2008). Nature
Protoc. 3, 1171–1179.Levitt, D. G. (2001). Acta Cryst. D57, 1013–1019.McCoy, A. J., Grosse-Kunstleve, R. W., Adams, P. D., Winn, M. D.,
Storoni, L. C. & Read, R. J. (2007). J. Appl. Cryst. 40, 658–674.McPhillips, T. M., McPhillips, S. E., Chiu, H.-J., Cohen, A. E., Deacon,
A. M., Ellis, P. J., Garman, E., Gonzalez, A., Sauter, N. K.,Phizackerley, R. P., Soltis, S. M. & Kuhn, P. (2002). J. SynchrotronRad. 9, 401–406.
Murshudov, G. N., Skubak, P., Lebedev, A. A., Pannu, N. S., Steiner,R. A., Nicholls, R. A., Winn, M. D., Long, F. & Vagin, A. A. (2011).Acta Cryst. D67, 355–367.
Oldfield, T. J. (2002). Acta Cryst. D58, 487–493.Oldfield, T. (2003). Acta Cryst. D59, 483–491.Pannu, N. S., Murshudov, G. N., Dodson, E. J. & Read, R. J. (1998).
Acta Cryst. D54, 1285–1294.
Pannu, N. S. & Read, R. J. (1996). Acta Cryst. A52, 659–668.
Pei, J., Kim, B.-H. & Grishin, N. V. (2008). Nucleic Acids Res. 36,2295–2300.
Rice, L. M., Shamoo, Y. & Brunger, A. T. (1998). J. Appl. Cryst. 31,798–805.
Sali, A. & Blundell, T. L. (1993). J. Mol. Biol. 234, 779–815.Schroder, G. F., Levitt, M. & Brunger, A. T. (2010). Nature (London),
464, 1218–1222.Schwarzenbacher, R., Godzik, A., Grzechnik, S. K. & Jaroszewski, L.
(2004). Acta Cryst. D60, 1229–1236.Soding, J. (2005). Bioinformatics, 21, 951–960.Terwilliger, T. C. (2000). Acta Cryst. D56, 965–972.Terwilliger, T. C., Grosse-Kunstleve, R. W., Afonine, P. V., Moriarty,
N. W., Zwart, P. H., Hung, L.-W., Read, R. J. & Adams, P. D. (2008).Acta Cryst. D64, 61–69.
Thompson, J. D., Higgins, D. G. & Gibson, T. J. (1994). Nucleic AcidsRes. 22, 4673–4680.
Vaguine, A. A., Richelle, J. & Wodak, S. J. (1999). Acta Cryst. D55,191–205.
Van Duyne, G. D., Standaert, R. F., Karplus, P. A., Schreiber, S. L. &Clardy, J. (1993). J. Mol. Biol. 229, 105–124.
Vriend, G. (1990). J. Mol. Graph. 8, 52–56.Yang, H., Guranovic, V., Dutta, S., Feng, Z., Berman, H. M. &
Westbrook, J. D. (2004). Acta Cryst. D60, 1833–1839.
research papers
Acta Cryst. (2012). D68, 391–403 Brunger et al. � Succinyl-diaminopimelate desuccinylase 403