Embed Size (px)
Citation preview
Houjiang ZhouRuijun TianMingliang YeSongyun XuShun FengChensong PanXiaogang JiangXin LiHanfa Zou
National ChromatographicR & A Center,Dalian Institute of ChemicalPhysics,Chinese Academy of Sciences,Dalian, P. R. China
Received November 4, 2006Revised December 6, 2006Accepted December 6, 2006
Research Article
Highly specific enrichment ofphosphopeptides by zirconium dioxidenanoparticles for phosphoproteome analysis
Large-scale characterization of phosphoproteins requires highly specific methods for thepurification of phosphopeptides because of the low abundance of phosphoproteins andsubstoichiometry of phosphorylation. A phosphopeptide enrichment method using ZrO2
nanoparticles is presented. The high specificity of this approach was demonstrated by theisolation of phosphopeptides from the digests of model phosphoproteins. The strong af-finity of ZrO2 nanoparticles to phosphopeptides enables the specific enrichment of phos-phopeptides from a complex peptide mixture in which the abundance of phosphopeptidesis two orders of magnitude lower than that of nonphosphopeptides. Superior selectivity ofZrO2 nanoparticles for the enrichment of phosphorylated peptides than that of conven-tional immobilized metal affinity chromatography was observed. Femtomole phosphopep-tides from digestion products could be enriched by ZrO2 nanoparticles and can be welldetected by MALDI mass spectrometric analysis. ZrO2 nanoparticles were further appliedto selectively isolate phosphopeptides from the tryptic digestion of mouse liver lysate forphosphoproteome analysis by nanoliter LC MS/MS (nano-LC-MS/MS) and MS/MS/MS. Atotal of 248 defining phosphorylation sites and 140 phosphorylated peptides were identifiedby manual validation using a series of rigid criteria.
Keywords:
MALDI-TOF MS / Nano-LC MS/MS / Phosphopeptides / Phosphoproteome analy-sis / Zirconium dioxide nanoparticles DOI 10.1002/elps.200600718
Electrophoresis 2007, 28, 2201–2215 2201
1 Introduction
Post-translational modifications (PTMs) are covalent proces-sing events that change the properties of a protein by pro-teolytic cleavage or by the addition of a modifying group toone or more amino acids [1]. Protein phosphorylation, areversible modification of protein, is an important PTMwhich adjusts the folding and function of proteins, and reg-ulates protein localization, degradation, and complex forma-tion. Therefore, it has a major influence on various cellfunctions such as signal transduction, metabolic main-
tenance, cell division, etc. [2, 3]. In recent years, MS hasbecome one of the most powerful tools for the analysis ofprotein phosphorylation due to its reliability, speed, andsensitivity [4–8]. However, global analysis of protein phos-phorylations in a proteome sample is still a great challengebecause phosphorylation is often substoichiometric. There-fore, the phosphopeptides are typically present in lowerabundance than other peptides. The presence of the hugeamount of nonphosphopeptides will seriously suppress theionization of phosphopeptides which results in the poordetection sensitivity of phosphopeptides by MS. Therefore,the highly specific isolation and enrichment of phosphopep-tides is essential for sensitive detection and accurate identi-fication of phosphopeptides [9–11].
So far, several strategies have been developed for the pu-rification and enrichment of phosphopeptides prior to massspectrometric analysis. Immobilized metal (usually Fe31,Ga31) affinity chromatography (IMAC) is the most widelyused technology for the isolation of phosphopeptides frompeptide mixtures based on the affinity of the metal ion for thephosphate group [12–15]. Disadvantages of IMAC enrich-
Correspondence: Professor Hanfa Zou, National Chromatograph-ic R&A Center, Dalian Institute of Chemical Physics, ChineseAcademy of Sciences, Dalian 116023, P. R. ChinaE-mail: [email protected]: 186-411-84379620
Abbreviations: DHB, 2,5-dihydroxybenzoic acid; HAC, acetic acid;IAA, iodoacetamide; IMAC, immoblized metal affinity chroma-tography; nano-LC-MS/MS, nanoliter LC-MS/MS; SCX, strongcation exchange
© 2007 WILEY-VCH Verlag GmbH & Co. KGaA, Weinheim www.electrophoresis-journal.com
2202 H. Zhou et al. Electrophoresis 2007, 28, 2201–2215
ment method include possible loss of phosphopeptides andnonspecific adsorption of acidic peptides. Methyl esterifica-tion of carboxyl groups has been demonstrated to decreasethe nonspecific adsorption of acidic peptides on IMAC [16–18]. This method has been successfully applied to large-scaleanalysis of phosphorylation in the proteome of yeast [16], ratliver [17], and HT-29 human carcinoma cell line [18]. Specificenrichment of phosphopeptide was also demonstrated by b-elimination of the phosphate group and subsequent intro-duction of an affinity tag [19] or followed by a covalent cap-ture and release method [20]. All of these methods generallysuffer from side reaction, which result in the increasedsample complexity and possible loss of phosphopeptides. Onthe other hand, immunopurification through phosphopro-tein antibody [21–23] and strong cation chromatographywere also demonstrated to be a good strategy for the enrich-ment of phosphopeptides [24–25]. Recently, the micro-columns or microtips with metal oxides microparticles, suchas titanium oxide (TiO2) [26], zirconium dioxide (ZrO2) [27],and aluminum hydroxide (Al(OH)3) [28] have also beenproved to have higher selectivity for the trapping of phos-phopeptides than the conventional IMAC beads. Addition-ally, Fe3O4/TiO2 cores/shell nanoparticles [29] and Fe31-immobilized zeolite nanoparticles [30] with high specificsurface area have been shown to have higher capacities thanthe microsized particles to trap phosphopeptides.
ZrO2 nanoparticles have attracted considerable attentionrecently as catalyst or catalyst support because of its highstability and the amphoteric properties of Lewis acid andbase [31–33]. Electrochemical sensor with immobilized ZrO2
nanoparticles on the surface was successfully used to detectthe organophosphate pesticide and nerve agents based onthe strong affinity of ZrO2 nanoparticles for the phosphategroup [34]. We speculated that the strong and specific biden-tate-bridging coordination of phosphate group to ZrO2
nanoparticles could further improve the enrichment effi-ciency of phosphopeptides. Herein, we demonstrated theselectivity and specificity of ZrO2 nanoparticles for the isola-tion of phosphopeptides from tryptic digest of model phos-phoproteins of a-casein, b-casein, and ovalbumin. The ZrO2
nanoparticles-based enrichment strategy was further appliedfor phosphoproteome analysis of mouse liver. The isolatedphosphopeptides from the tryptic digest of mouse liver lysatewas subjected to nano-LC-MS/MS and MS/MS/MS analysis.After database searching and manual validation, total of 248defining phosphorylation sites and 140 phosphopeptideswere identified using a series of rigid criteria.
2 Materials and methods
2.1 Chemicals and materials
Proteins of a-casein, b-casein, BSA, and trypsin (E.G2.4.21.4) and chemicals of TFA, 2,5-dihydroxybenzoic acid(DHB), zirconium oxychloride (ZrOCl2?8H2O), Tris, guani-
dine hydrochloride, sodium orthovanadate (Na3VO4), andsodium fluoride (NaF) were purchased from Sigma (St.Louis, MO, USA). POROS 20 MC beads were purchasedfrom PerSeptive Biosystems (Framingham, MA, USA). Urea,ammonium bicarbonate, DTT, iodoacetamide (IAA),CHAPS, were all purchased from BioRad (Hercules, CA,USA). All chemicals were of analytical grade except TFA andACN which were of HPLC grade. Adult female C57 mice werepurchased from Dalian Medical University (Dalian, China).Water was prepared using a Milli-Q system (Millipore, Bed-ford, MA, USA).
2.2 Preparation of ZrO2 nanoparticles
ZrO2 nanoparticles were prepared according to the followingprocedure. The precursor of Zr(OH)4 was obtained by slowlyadding 25 wt.% aqueous ammonia to the solution of zirco-nium oxychloride (ZrOCl2?8H2O) at room temperature withstirring at the constant pH of 10. The precipitate obtainedwas washed thoroughly with distilled water until a negativetest for chloride ions was obtained, and was then dried at1107C for 12 h. After calcining for 4 h at 5507C, the precursorwas decomposed into ZrO2 particles of nanometer size. Theobtained ZrO2 nanoparticles were dispersed in ethanol(1 mL) by sonication for 5 min, and then the mixture wascentrifuged at 30 0006g for 5 min. After the supernatantwas removed, 1 mL of distilled water, 0.1% acetic acid(HAC), and 0.5% HAC v/v solutions were used to clean thenanoparticle in turn to remove contaminants. The ZrO2
nanoparticles (20–30 nm) were stored at room temperaturefor usage. The ZrO2 nanoparticles (30 mg) were resus-pended in 1 mL of distilled water prior to use.
2.3 Preparation of tryptic digests
a- and b-casein (1 mg) were dissolved in 1 mL of ammoniumbicarbonate (50 mM, pH 8.2) and digested for 16 h at 377Cwith an enzyme-to-protein ratio of 1:40 w/w. BSA and oval-bumin (4 mg) were, respectively, dissolved in 1 mL of dena-turing buffer containing 8 M urea and 50 mM ammoniumbicarbonate and incubated for 3 h. The obtained protein so-lution was mixed with 20 mL of 50 mM DTT. The disulfidebond of protein was reduced by incubation for 2 h at 377C.Then 40 mL of 50 mM IAA was added and the obtained so-lution was incubated for an additional 30 min at room tem-perature in the dark. After that, the mixture was diluted with50 mM ammonium bicarbonate by 10-fold and incubated for16 h at 377C with trypsin at an enzyme/substrate ratio of 1:40w/w to produce proteolytic digest. All of the resulting peptidesolution was then stored in the freezer under 2307C for fur-ther usage.
The preparation of mouse liver lysate was performedfollowing our previous work [35]. Briefly, mice were killedand the livers were promptly removed and placed in an ice-cold homogenization buffer consisting of 8 M urea, 4%CHAPS w/v, 65 mM DTT, 1 mM EDTA, 0.5 mM EGTA, and
© 2007 WILEY-VCH Verlag GmbH & Co. KGaA, Weinheim www.electrophoresis-journal.com
Electrophoresis 2007, 28, 2201–2215 CE and CEC 2203
a mixture of protease inhibitor (1 mM PMSF) and phosphateinhibitors (0.2 mM Na3VO4, 1 mM NaF) in 40 mM Tris-HClat pH 7.4. After mincing with scissors and washing toremove blood, the livers were homogenized in 10 mL of ho-mogenization buffer per 2 g of tissue. The suspension washomogenized for approximately 1 min, sonicated for 30 s at100 W, and centrifuged at 25 0006g for 1 h. The supernatantcontained the total liver proteins. Appropriate volume ofsupernatant was precipitated, and the precipitate was redis-solved in the denaturing solution (8 M urea, 100 mMammonium bicarbonate, pH 8.3) with the protein con-centration determined to be around l.0 mg/mL. Then thetrypsin digestion was performed for the digestion of aboveprotein samples. Finally, the trypsin digest was stored in therefrigerator under 2307C for proteome analysis.
2.4 Procedures for the enrichment of
phosphopeptides by ZrO2 nanoparticles
Protein digests were diluted with loading buffer containing10% HAC and 50% ACN v/v (pH 3–4). The sample solution(2.5 mL, 1026 M) was mixed with 2.5 mL of ZrO2 nano-particles suspension (30 mg/mL). The resulting solution wasincubated for 30 min at room temperature, and it was thencentrifuged at 30 0006g for 5 min. The ZrO2 nanoparticleswith trapped phosphopeptides were deposited at the bottomof the tube, and the supernatant was removed by Eppendorfpipet. Subsequently, the isolated nanoparticles were rinsedwith 100 mL solution of 10% HAC containing 50% ACN toremove nonspecifically adsorbed peptides. The ZrO2 nano-particles were again isolated by centrifugation at 30 0006gfor 5 min. The supernatant was once again removed withpipet. The trapped phosphopeptides on ZrO2 nanoparticleswere eluted using 30 mL of NH4OH (pH 11.5) under thesonication for 10 min. After centrifugation, the supernatantwas collected and lyophilized to dryness. DHB solution(2 mL, 25 mg/mL) containing 1% H3PO4 v/v [36] was intro-duced into the tube and 0.5 mL of mixture was deposited onthe MALDI target for MALDI MS analysis. The enrichmentof phosphopeptides by IMAC beads (POROS 20 MC beads)was performed according to the recommended manualmanipulation. After loading of Fe31, the IMAC beads weresuspended in loading buffer of 0.1% HAC at a concentrationof 30 mg/mL. An aliquot of IMAC solution (10 mL) wasmixed with 10 mL of protein digest solution and the resultingsolution was incubated for 30 min with constant rotation.After incubation, the IMAC beads were washed with ACN/water/HAC (25:74:1 v/v/v) twice to remove nonspecificallyadsorbed peptides. The bound peptides were eluted using10 mL of NH4OH (pH 11.5) into a tube, lyophilized to dry-ness. To the tube 2 mL of DHB solution containing 1%H3PO4 was added and 0.5 mL of solution was deposited onthe target for MALDI-TOF MS analysis. Phosphopeptidesfrom 50 mL digest of mouse liver lysate (1 mg/mL) was trap-ped and enriched using 50 mL of ZrO2 nanoparticles’ sus-pension. After thoroughly washing, 30 mL of NH4OH
(pH 11.5) was introduced to elute phosphopeptides fromZrO2 nanoparticles and the supernatant was collected aftercentrifugation at 30 0006g for 5 min. The obtained solutionwas lyophilized and dissolved in 5 mL of 0.1% formic acid fornano-LC-MS/MS and MS/MS/MS analysis.
2.5 Mass spectrometry analysis
MALDI-TOF MS experiments were performed on a BrukerAutoflex TOF mass spectrometer (Bruker, Bremen, Ger-many). This instrument was equipped with a delayed ion-extraction device and a pulsed nitrogen laser operated at337 nm. The MALDI uses a ground-steel sample target with384 spots. The range of laser energy was adjusted to slightlyabove the threshold to obtain good resolution and S/N. Allmass spectra reported were obtained in the positive ion lin-ear mode with delayed extraction for 90 ns and calibratedusing an external calibration equation generated from theion signal of angiotension II and insulin chain B. Each massspectrum was typically summed with 30 laser shots.
Nano-LC-MS/MS and MS/MS/MS were performed on amRPLC-MS/MS system. A Finnigan surveyor MS pump(ThermoFinnigan, San Jose, CA, USA) was used to delivermobile phase. The pump flow rate was split by a cross toachieve the flow rate of 200 nL/min. For the capillaryseparation column, one end of the fused-silica capillary(75 mm id6120 mm length) was manually pulled to a finepoint ,5 mm with a flame torch. The columns were packedin-house with C18 AQ particles (5 mm, 120 Å) from MichromBioResources (Auburn, CA, USA) using a pneumatic pump.The mRPLC column was directly coupled to an LTQ linear ITmass spectrometer from ThermoFinnigan with a nanospraysource. The mobile phase consisted of mobile phase A, 0.1%formic acid in H2O v/v, and mobile phase B, 0.1% formicacid in ACN. The LTQ instrument was operated at positiveion mode. A voltage of 1.8 kV was applied to the cross.
The separation of phosphopeptides trapped from thetryptic digest of mouse liver lysate was performed using75 min linear gradient elution from 5 to 35%. The detectionof phosphopeptides was performed in which the mass spec-trometer was set as a full scan MS followed by three data-dependant MS/MS. Subsequently, MS/MS/MS spectrumwas automatically triggered when the most intense peakfrom the MS/MS spectrum corresponded to a neutral lossevent of 98 m/z and 49 m/z and 33 6 1 Da for the precursorion with 11, 21, 31 charge states, respectively.
2.6 Database searching and analysis
All MS/MS and MS/MS/MS spectra were searched againstthe nonredundant mouse protein database from the Inter-national Protein Index (ipi.MOUSE.V.3.0.8) by using theSEQUEST program included in Bioworks v 3.2. For thesearch using MS/MS data, static modification was set forcarboxyamidomethylated Cys (157) and dynamic modifica-tions were set for oxidized Met (116) and phosphorylated
© 2007 WILEY-VCH Verlag GmbH & Co. KGaA, Weinheim www.electrophoresis-journal.com
2204 H. Zhou et al. Electrophoresis 2007, 28, 2201–2215
Ser, Thr, and Tyr (180). For the search using MS/MS/MSdata, besides the above set, dynamic modifications were alsoset for water loss on Ser, Thr (218). Criteria used for filteringwere: cross-correlation value (Xcorr) larger than 1.9, 2.2, and3.75 used for singly, doubly, and triply charged ions, respec-tively; Delta Cn values (the difference with in Xcorr with thenext highest value) are not less than 0.1. Manual validationwas further carried out for peptides passing the above twocriteria. Criteria used for manual validation included (i) thephosphoric acid neutral loss peak to phosphoserine andphosphothreonine must be the dominant peak; (ii) the spec-trum must be of good quality with fragment ion clearly abovethe baseline noise; (iii) sequential members of the b- or y-se-ries were observable in the mass spectra; (iv) for multiphos-phopeptides, the neutral loss peak must be observable andthe relative intensity must be above 10%. The MS/MS andMS/MS/MS spectra for the identified phosphopeptides areavailable upon request.
3 Results
3.1 Performance of ZrO2 nanoparticles for the
isolation of phosphopeptides
Nanoparticles were generally prepared in heterogeneousmedia, such as emulsion and microemulsion, using theinterior dispersed aqueous phase as isolated nanoreactors toobtain nonagglomerated nanoparticles. In our case, ZrO2
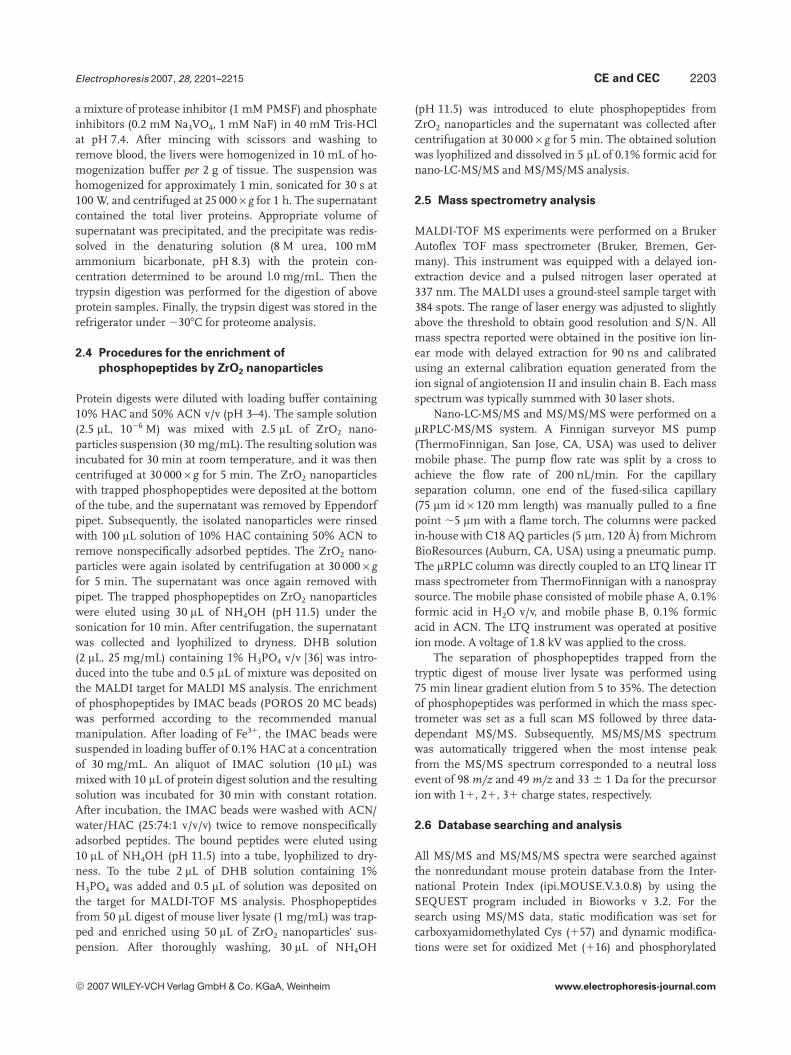
nanoparticles were obtained by the precipitation from anaqueous solution of zirconyl chloride under alkali conditions(pH 10). A high-resolution TEM image at a high magnifica-tion (scale bar, 50 nm; 150 0006) of the ZrO2 nanoparticleswith the average of size of 20–30 nm is shown in Fig. 1. It isobservable that a lot of nanoparticles were aggregated intoclusters. The obtained nanoparticles were uniform andamorphous with surface area of 64.4 m2/g and the averagepore diameter of 8 nm derived from nitrogen adsorption/desorption according to the BET method. The chemicalcomposition at several regions of a sample, randomly cho-sen, was found to be consistent with the overall morphology,which indicated that the uniform nanoparticles were due to acomposite sample structure on the nanometer scale. Someadvanced methods for the preparation of ZrO2 nanoparticlesare available to further improve the surface properties ofZrO2 nanoparticles and the enrichment of phosphopeptides.
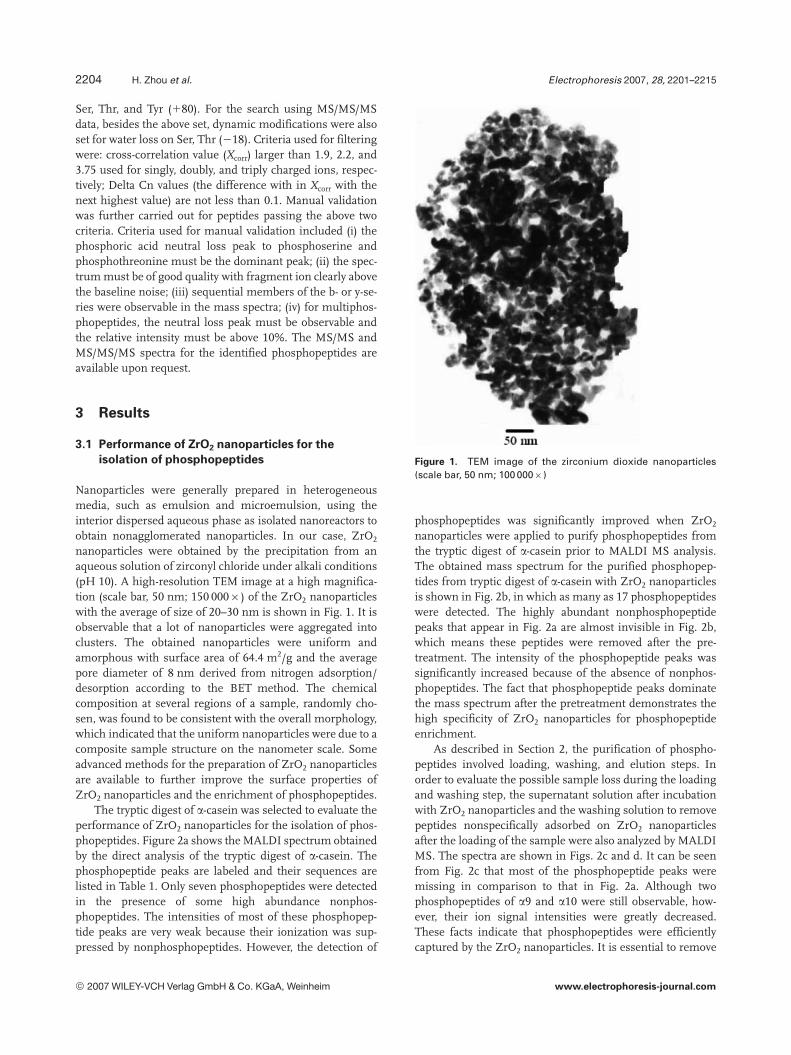
The tryptic digest of a-casein was selected to evaluate theperformance of ZrO2 nanoparticles for the isolation of phos-phopeptides. Figure 2a shows the MALDI spectrum obtainedby the direct analysis of the tryptic digest of a-casein. Thephosphopeptide peaks are labeled and their sequences arelisted in Table 1. Only seven phosphopeptides were detectedin the presence of some high abundance nonphos-phopeptides. The intensities of most of these phosphopep-tide peaks are very weak because their ionization was sup-pressed by nonphosphopeptides. However, the detection of
Figure 1. TEM image of the zirconium dioxide nanoparticles(scale bar, 50 nm; 100 0006)
phosphopeptides was significantly improved when ZrO2
nanoparticles were applied to purify phosphopeptides fromthe tryptic digest of a-casein prior to MALDI MS analysis.The obtained mass spectrum for the purified phosphopep-tides from tryptic digest of a-casein with ZrO2 nanoparticlesis shown in Fig. 2b, in which as many as 17 phosphopeptideswere detected. The highly abundant nonphosphopeptidepeaks that appear in Fig. 2a are almost invisible in Fig. 2b,which means these peptides were removed after the pre-treatment. The intensity of the phosphopeptide peaks wassignificantly increased because of the absence of nonphos-phopeptides. The fact that phosphopeptide peaks dominatethe mass spectrum after the pretreatment demonstrates thehigh specificity of ZrO2 nanoparticles for phosphopeptideenrichment.
As described in Section 2, the purification of phospho-peptides involved loading, washing, and elution steps. Inorder to evaluate the possible sample loss during the loadingand washing step, the supernatant solution after incubationwith ZrO2 nanoparticles and the washing solution to removepeptides nonspecifically adsorbed on ZrO2 nanoparticlesafter the loading of the sample were also analyzed by MALDIMS. The spectra are shown in Figs. 2c and d. It can be seenfrom Fig. 2c that most of the phosphopeptide peaks weremissing in comparison to that in Fig. 2a. Although twophosphopeptides of a9 and a10 were still observable, how-ever, their ion signal intensities were greatly decreased.These facts indicate that phosphopeptides were efficientlycaptured by the ZrO2 nanoparticles. It is essential to remove
© 2007 WILEY-VCH Verlag GmbH & Co. KGaA, Weinheim www.electrophoresis-journal.com
Electrophoresis 2007, 28, 2201–2215 CE and CEC 2205
Figure 2. MALDI mass spectra for the purification of phosphopeptides from a-casein digest by ZrO2 nanoparticles. (a) Direct analysistryptic digest of a-casein (1026 M, 2.5 mL); (b) analysis of the eluted phosphopeptides from ZrO2 nanoparticles; (c) analysis of the remainingsolutions after phosphopeptides trapped by ZrO2 nanoparticles; (d) analysis of the supernatant solutions to wash with the peptides non-specifically adsorbed on ZrO2 nanoparticles; and (e) analysis of the residual ZrO2 nanoparticles after the trapped phosphopeptides wereeluted by 30 mL of NH4OH (pH 11.5). The sequences for the phosphopeptides are listed in Table 1.
nonspecifically bound peptides and in the mean time keepthe specifically retained phosphopeptides during the wash-ing step. In this work, solution of 10% HAC containing 50%ACN was used to remove nonspecifically bound peptides. Itcan be seen from Fig. 2d that many nonphosphopeptidepeaks together with a weak phosphopeptide a9 peak wereobserved. Other phosphopeptides were not detected in thewashing solution which means that the washing step doesnot result in the significant loss of phosphopeptides. Toachieve the maximum recovery of bound phosphopeptidesfrom ZrO2 nanoparticles, NH4OH (pH 11.5) was used toelute phosphopeptides from ZrO2 nanoparticles. In order totest if there were still some remaining phosphopeptides onthe ZrO2 nanoparticles after elution, the ZrO2 nanoparticleswere resuspended in 2 mL matrix solution of DHB contain-ing 1% H3PO4, and 0.5 mL of the resuspended solution wasdeposited on the target for MALDI MS analysis. The
obtained mass spectrum is shown in Fig. 2e. No ion signalwas observed which indicated that the elution buffer wasstrong enough to remove all phosphopeptides from the ZrO2
nanoparticles. All the above results further demonstrate thatthe ZrO2 nanoparticles could specifically and selectivelyenrich phosphopeptides from complex tryptic peptides.
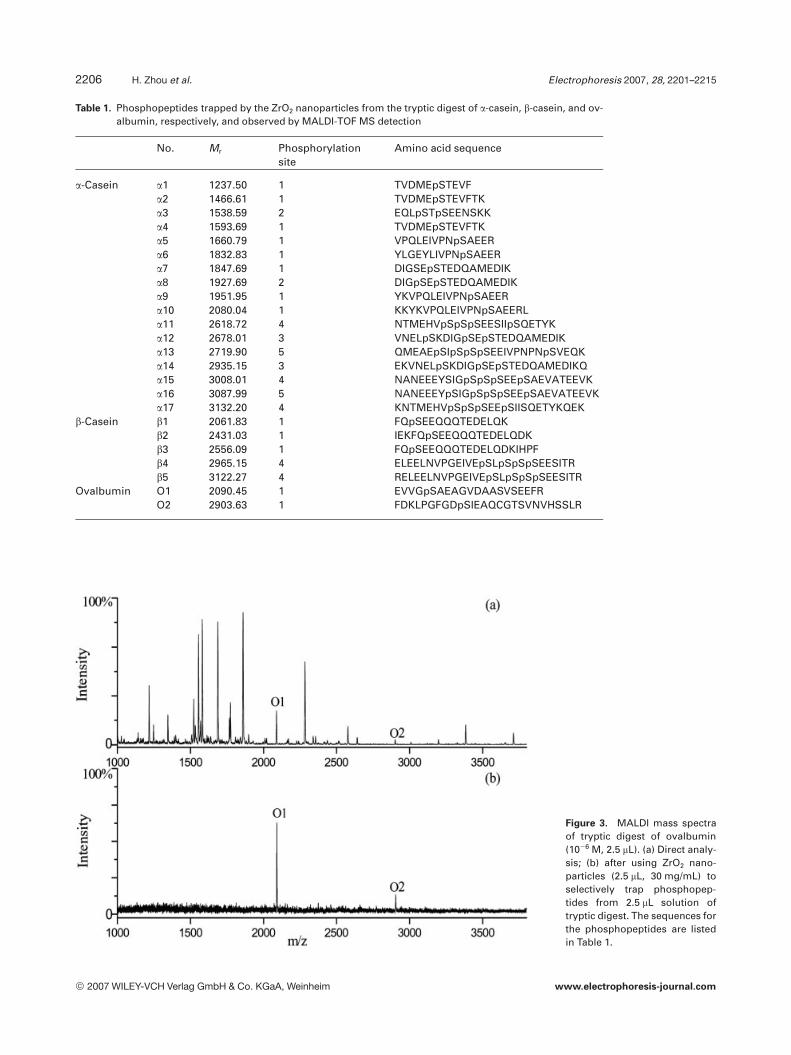
Ovalbumin is a diphosphorylated protein that contains adisulfide bond. Use of a denaturant like urea was essentialfor denaturing ovalbumin in comparison to the digestion ofa-casein. Meanwhile, DTT was added to open the disulfidebond and IAA was added to carbamidomethylate, the result-ing cysteine residues. In order to test if the presence of urea,DTT, and IAA in the sample interferes with the trapping ofthe phosphopeptides by ZrO2 nanoparticles, the resultingovalbumin digest was subjected to phosphopeptide analysisby MALDI following the same protocol for a-casein digest.As shown in Fig. 3, two weak phosphopeptide peaks were
© 2007 WILEY-VCH Verlag GmbH & Co. KGaA, Weinheim www.electrophoresis-journal.com
2206 H. Zhou et al. Electrophoresis 2007, 28, 2201–2215
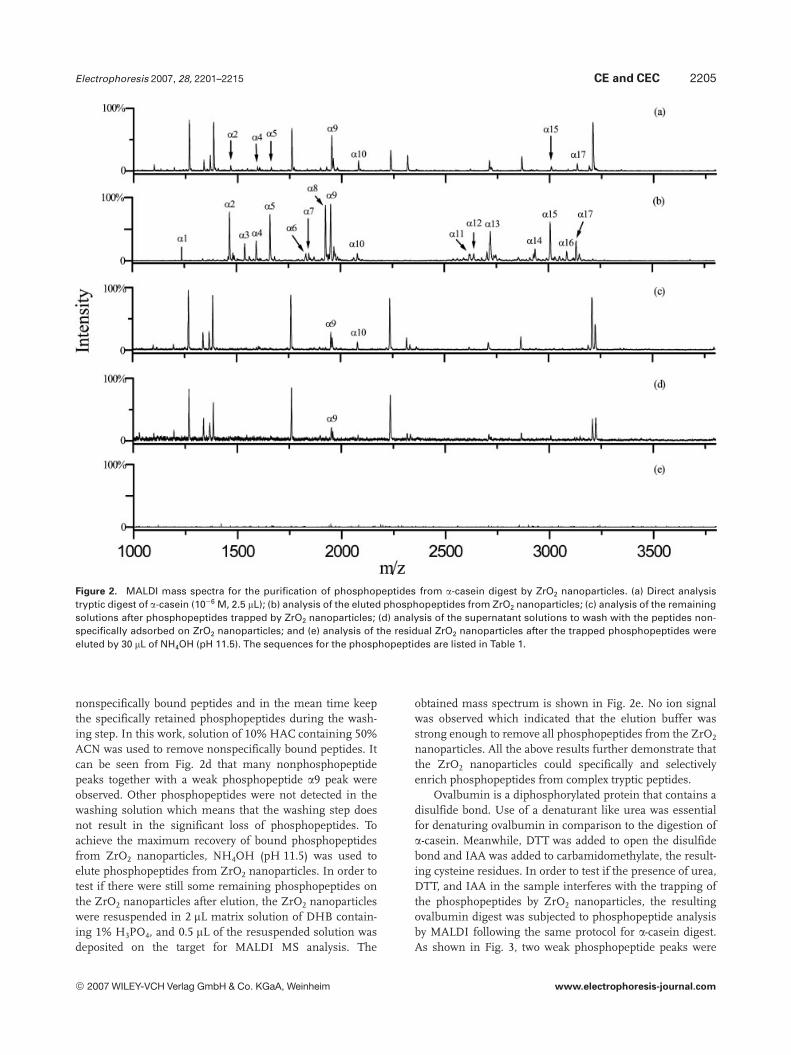
Table 1. Phosphopeptides trapped by the ZrO2 nanoparticles from the tryptic digest of a-casein, b-casein, and ov-albumin, respectively, and observed by MALDI-TOF MS detection
No. Mr Phosphorylationsite
Amino acid sequence
a-Casein a1 1237.50 1 TVDMEpSTEVFa2 1466.61 1 TVDMEpSTEVFTKa3 1538.59 2 EQLpSTpSEENSKKa4 1593.69 1 TVDMEpSTEVFTKa5 1660.79 1 VPQLEIVPNpSAEERa6 1832.83 1 YLGEYLIVPNpSAEERa7 1847.69 1 DIGSEpSTEDQAMEDIKa8 1927.69 2 DIGpSEpSTEDQAMEDIKa9 1951.95 1 YKVPQLEIVPNpSAEERa10 2080.04 1 KKYKVPQLEIVPNpSAEERLa11 2618.72 4 NTMEHVpSpSpSEESIIpSQETYKa12 2678.01 3 VNELpSKDIGpSEpSTEDQAMEDIKa13 2719.90 5 QMEAEpSIpSpSpSEEIVPNPNpSVEQKa14 2935.15 3 EKVNELpSKDIGpSEpSTEDQAMEDIKQa15 3008.01 4 NANEEEYSIGpSpSpSEEpSAEVATEEVKa16 3087.99 5 NANEEEYpSIGpSpSpSEEpSAEVATEEVKa17 3132.20 4 KNTMEHVpSpSpSEEpSIISQETYKQEK
b-Casein b1 2061.83 1 FQpSEEQQQTEDELQKb2 2431.03 1 IEKFQpSEEQQQTEDELQDKb3 2556.09 1 FQpSEEQQQTEDELQDKIHPFb4 2965.15 4 ELEELNVPGEIVEpSLpSpSpSEESITRb5 3122.27 4 RELEELNVPGEIVEpSLpSpSpSEESITR
Ovalbumin O1 2090.45 1 EVVGpSAEAGVDAASVSEEFRO2 2903.63 1 FDKLPGFGDpSIEAQCGTSVNVHSSLR
Figure 3. MALDI mass spectraof tryptic digest of ovalbumin(1026 M, 2.5 mL). (a) Direct analy-sis; (b) after using ZrO2 nano-particles (2.5 mL, 30 mg/mL) toselectively trap phosphopep-tides from 2.5 mL solution oftryptic digest. The sequences forthe phosphopeptides are listedin Table 1.
© 2007 WILEY-VCH Verlag GmbH & Co. KGaA, Weinheim www.electrophoresis-journal.com
Electrophoresis 2007, 28, 2201–2215 CE and CEC 2207
observed with a strong background of nonphosphopeptideswithout pretreatment as shown in Fig. 3a. However, only twopeaks of phosphopeptides were observed after the purifica-tion by the nanoparticles as shown in Fig. 3b. The amino acidsequence and phosphorylation sites are shown in Table 1.These results mean that the presence of urea, DTT, and IAAin the sample does not compromise the specificity of ZrO2
nanoparticles to capture the phosphopeptides. This feature isvery important since the denaturants are always present inthe real proteome samples.
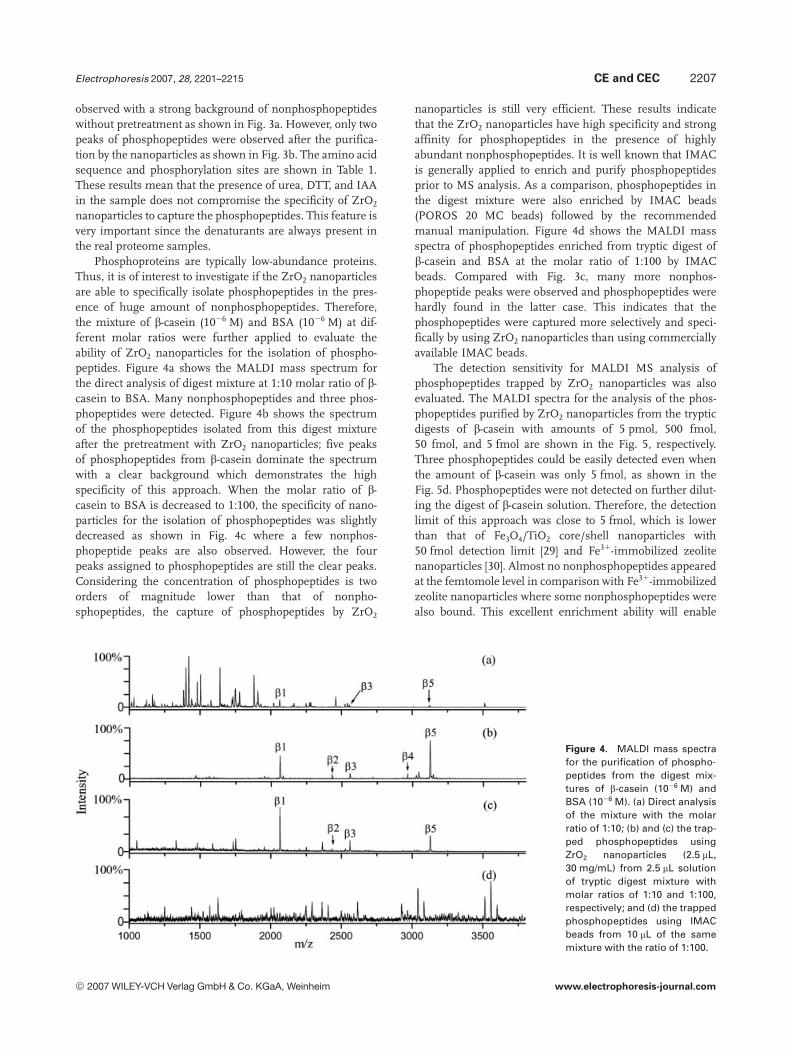
Phosphoproteins are typically low-abundance proteins.Thus, it is of interest to investigate if the ZrO2 nanoparticlesare able to specifically isolate phosphopeptides in the pres-ence of huge amount of nonphosphopeptides. Therefore,the mixture of b-casein (1026 M) and BSA (1026 M) at dif-ferent molar ratios were further applied to evaluate theability of ZrO2 nanoparticles for the isolation of phospho-peptides. Figure 4a shows the MALDI mass spectrum forthe direct analysis of digest mixture at 1:10 molar ratio of b-casein to BSA. Many nonphosphopeptides and three phos-phopeptides were detected. Figure 4b shows the spectrumof the phosphopeptides isolated from this digest mixtureafter the pretreatment with ZrO2 nanoparticles; five peaksof phosphopeptides from b-casein dominate the spectrumwith a clear background which demonstrates the highspecificity of this approach. When the molar ratio of b-casein to BSA is decreased to 1:100, the specificity of nano-particles for the isolation of phosphopeptides was slightlydecreased as shown in Fig. 4c where a few nonphos-phopeptide peaks are also observed. However, the fourpeaks assigned to phosphopeptides are still the clear peaks.Considering the concentration of phosphopeptides is twoorders of magnitude lower than that of nonpho-sphopeptides, the capture of phosphopeptides by ZrO2
nanoparticles is still very efficient. These results indicatethat the ZrO2 nanoparticles have high specificity and strongaffinity for phosphopeptides in the presence of highlyabundant nonphosphopeptides. It is well known that IMACis generally applied to enrich and purify phosphopeptidesprior to MS analysis. As a comparison, phosphopeptides inthe digest mixture were also enriched by IMAC beads(POROS 20 MC beads) followed by the recommendedmanual manipulation. Figure 4d shows the MALDI massspectra of phosphopeptides enriched from tryptic digest ofb-casein and BSA at the molar ratio of 1:100 by IMACbeads. Compared with Fig. 3c, many more nonphos-phopeptide peaks were observed and phosphopeptides werehardly found in the latter case. This indicates that thephosphopeptides were captured more selectively and speci-fically by using ZrO2 nanoparticles than using commerciallyavailable IMAC beads.
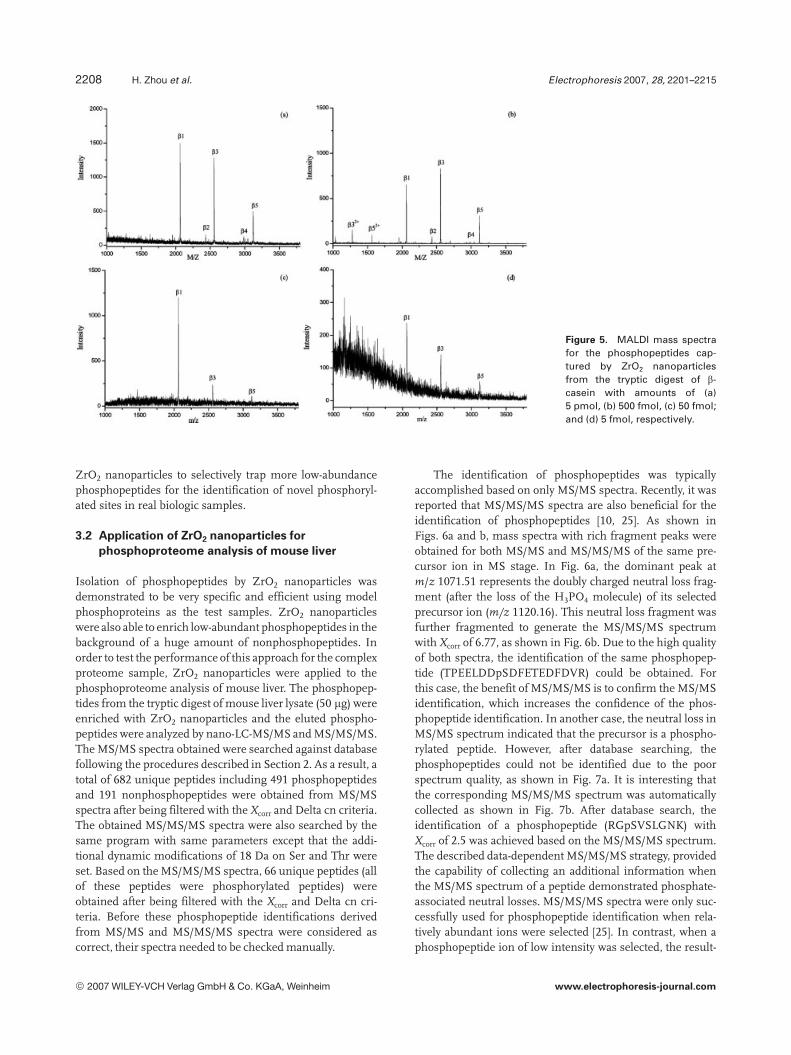
The detection sensitivity for MALDI MS analysis ofphosphopeptides trapped by ZrO2 nanoparticles was alsoevaluated. The MALDI spectra for the analysis of the phos-phopeptides purified by ZrO2 nanoparticles from the trypticdigests of b-casein with amounts of 5 pmol, 500 fmol,50 fmol, and 5 fmol are shown in the Fig. 5, respectively.Three phosphopeptides could be easily detected even whenthe amount of b-casein was only 5 fmol, as shown in theFig. 5d. Phosphopeptides were not detected on further dilut-ing the digest of b-casein solution. Therefore, the detectionlimit of this approach was close to 5 fmol, which is lowerthan that of Fe3O4/TiO2 core/shell nanoparticles with50 fmol detection limit [29] and Fe31-immobilized zeolitenanoparticles [30]. Almost no nonphosphopeptides appearedat the femtomole level in comparison with Fe31-immobilizedzeolite nanoparticles where some nonphosphopeptides werealso bound. This excellent enrichment ability will enable
Figure 4. MALDI mass spectrafor the purification of phospho-peptides from the digest mix-tures of b-casein (1026 M) andBSA (1026 M). (a) Direct analysisof the mixture with the molarratio of 1:10; (b) and (c) the trap-ped phosphopeptides usingZrO2 nanoparticles (2.5 mL,30 mg/mL) from 2.5 mL solutionof tryptic digest mixture withmolar ratios of 1:10 and 1:100,respectively; and (d) the trappedphosphopeptides using IMACbeads from 10 mL of the samemixture with the ratio of 1:100.
© 2007 WILEY-VCH Verlag GmbH & Co. KGaA, Weinheim www.electrophoresis-journal.com
2208 H. Zhou et al. Electrophoresis 2007, 28, 2201–2215
Figure 5. MALDI mass spectrafor the phosphopeptides cap-tured by ZrO2 nanoparticlesfrom the tryptic digest of b-casein with amounts of (a)5 pmol, (b) 500 fmol, (c) 50 fmol;and (d) 5 fmol, respectively.
ZrO2 nanoparticles to selectively trap more low-abundancephosphopeptides for the identification of novel phosphoryl-ated sites in real biologic samples.
3.2 Application of ZrO2 nanoparticles for
phosphoproteome analysis of mouse liver
Isolation of phosphopeptides by ZrO2 nanoparticles wasdemonstrated to be very specific and efficient using modelphosphoproteins as the test samples. ZrO2 nanoparticleswere also able to enrich low-abundant phosphopeptides in thebackground of a huge amount of nonphosphopeptides. Inorder to test the performance of this approach for the complexproteome sample, ZrO2 nanoparticles were applied to thephosphoproteome analysis of mouse liver. The phosphopep-tides from the tryptic digest of mouse liver lysate (50 mg) wereenriched with ZrO2 nanoparticles and the eluted phospho-peptides were analyzed by nano-LC-MS/MS and MS/MS/MS.The MS/MS spectra obtained were searched against databasefollowing the procedures described in Section 2. As a result, atotal of 682 unique peptides including 491 phosphopeptidesand 191 nonphosphopeptides were obtained from MS/MSspectra after being filtered with the Xcorr and Delta cn criteria.The obtained MS/MS/MS spectra were also searched by thesame program with same parameters except that the addi-tional dynamic modifications of 18 Da on Ser and Thr wereset. Based on the MS/MS/MS spectra, 66 unique peptides (allof these peptides were phosphorylated peptides) wereobtained after being filtered with the Xcorr and Delta cn cri-teria. Before these phosphopeptide identifications derivedfrom MS/MS and MS/MS/MS spectra were considered ascorrect, their spectra needed to be checked manually.
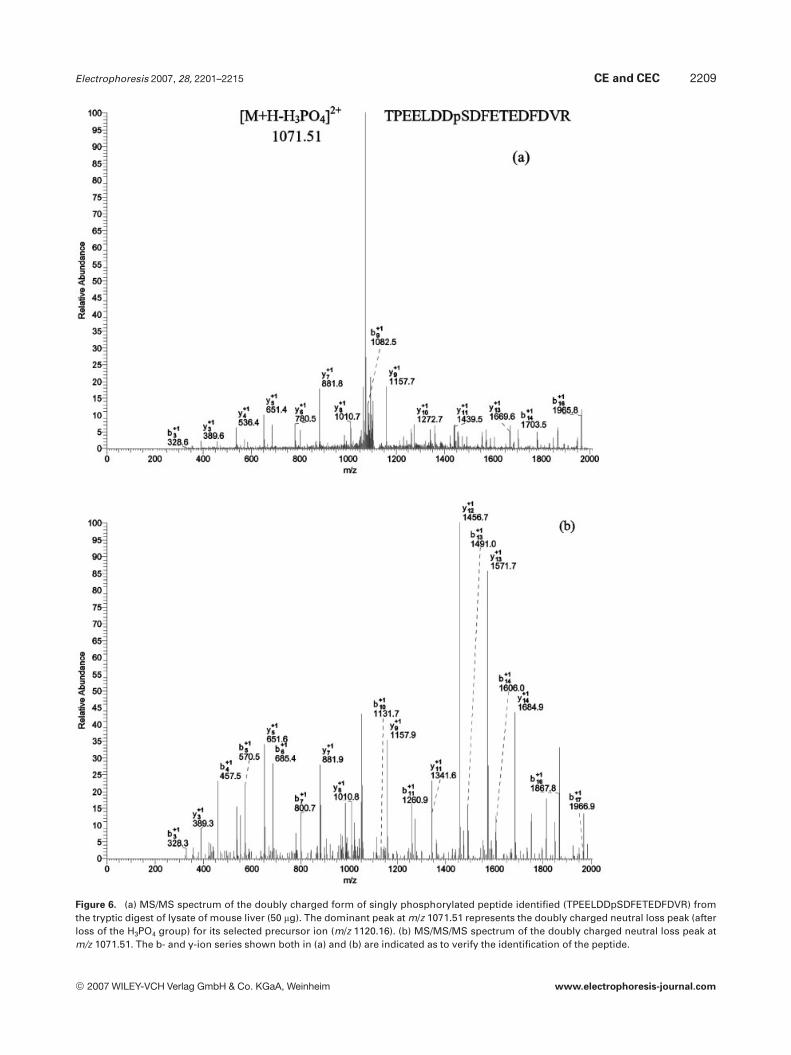
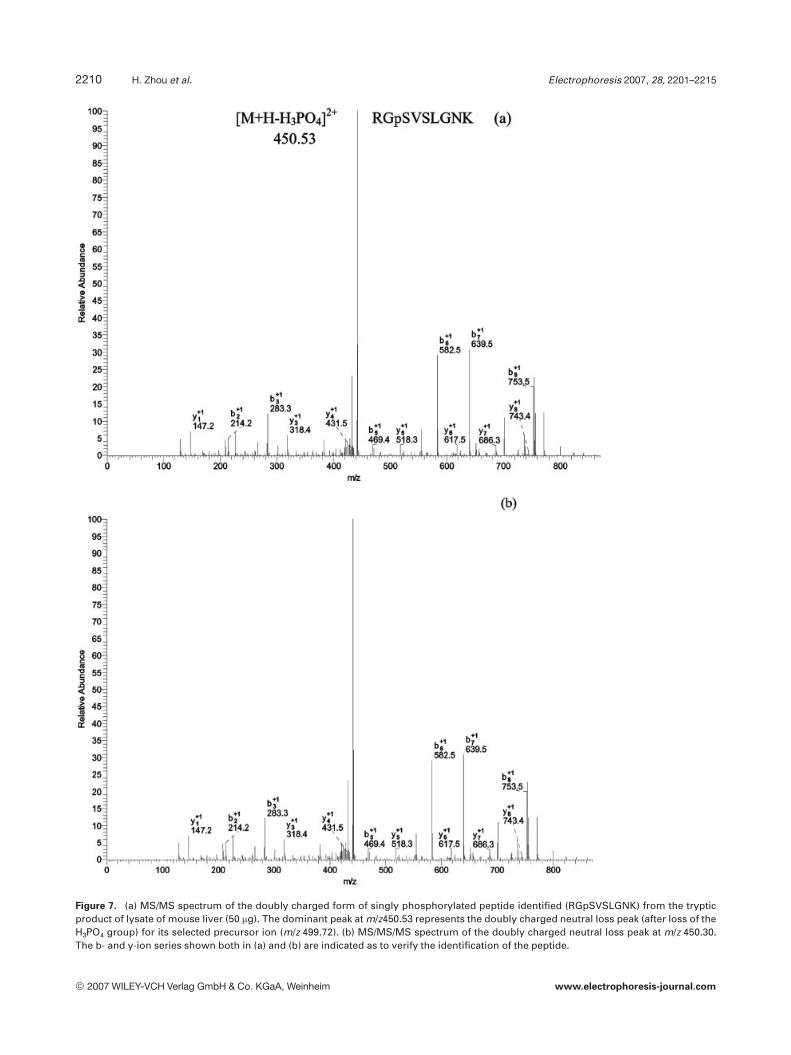
The identification of phosphopeptides was typicallyaccomplished based on only MS/MS spectra. Recently, it wasreported that MS/MS/MS spectra are also beneficial for theidentification of phosphopeptides [10, 25]. As shown inFigs. 6a and b, mass spectra with rich fragment peaks wereobtained for both MS/MS and MS/MS/MS of the same pre-cursor ion in MS stage. In Fig. 6a, the dominant peak atm/z 1071.51 represents the doubly charged neutral loss frag-ment (after the loss of the H3PO4 molecule) of its selectedprecursor ion (m/z 1120.16). This neutral loss fragment wasfurther fragmented to generate the MS/MS/MS spectrumwith Xcorr of 6.77, as shown in Fig. 6b. Due to the high qualityof both spectra, the identification of the same phosphopep-tide (TPEELDDpSDFETEDFDVR) could be obtained. Forthis case, the benefit of MS/MS/MS is to confirm the MS/MSidentification, which increases the confidence of the phos-phopeptide identification. In another case, the neutral loss inMS/MS spectrum indicated that the precursor is a phospho-rylated peptide. However, after database searching, thephosphopeptides could not be identified due to the poorspectrum quality, as shown in Fig. 7a. It is interesting thatthe corresponding MS/MS/MS spectrum was automaticallycollected as shown in Fig. 7b. After database search, theidentification of a phosphopeptide (RGpSVSLGNK) withXcorr of 2.5 was achieved based on the MS/MS/MS spectrum.The described data-dependent MS/MS/MS strategy, providedthe capability of collecting an additional information whenthe MS/MS spectrum of a peptide demonstrated phosphate-associated neutral losses. MS/MS/MS spectra were only suc-cessfully used for phosphopeptide identification when rela-tively abundant ions were selected [25]. In contrast, when aphosphopeptide ion of low intensity was selected, the result-
© 2007 WILEY-VCH Verlag GmbH & Co. KGaA, Weinheim www.electrophoresis-journal.com
Electrophoresis 2007, 28, 2201–2215 CE and CEC 2209
Figure 6. (a) MS/MS spectrum of the doubly charged form of singly phosphorylated peptide identified (TPEELDDpSDFETEDFDVR) fromthe tryptic digest of lysate of mouse liver (50 mg). The dominant peak at m/z 1071.51 represents the doubly charged neutral loss peak (afterloss of the H3PO4 group) for its selected precursor ion (m/z 1120.16). (b) MS/MS/MS spectrum of the doubly charged neutral loss peak atm/z 1071.51. The b- and y-ion series shown both in (a) and (b) are indicated as to verify the identification of the peptide.
© 2007 WILEY-VCH Verlag GmbH & Co. KGaA, Weinheim www.electrophoresis-journal.com
2210 H. Zhou et al. Electrophoresis 2007, 28, 2201–2215
Figure 7. (a) MS/MS spectrum of the doubly charged form of singly phosphorylated peptide identified (RGpSVSLGNK) from the trypticproduct of lysate of mouse liver (50 mg). The dominant peak at m/z450.53 represents the doubly charged neutral loss peak (after loss of theH3PO4 group) for its selected precursor ion (m/z 499.72). (b) MS/MS/MS spectrum of the doubly charged neutral loss peak at m/z 450.30.The b- and y-ion series shown both in (a) and (b) are indicated as to verify the identification of the peptide.
© 2007 WILEY-VCH Verlag GmbH & Co. KGaA, Weinheim www.electrophoresis-journal.com
Electrophoresis 2007, 28, 2201–2215 CE and CEC 2211
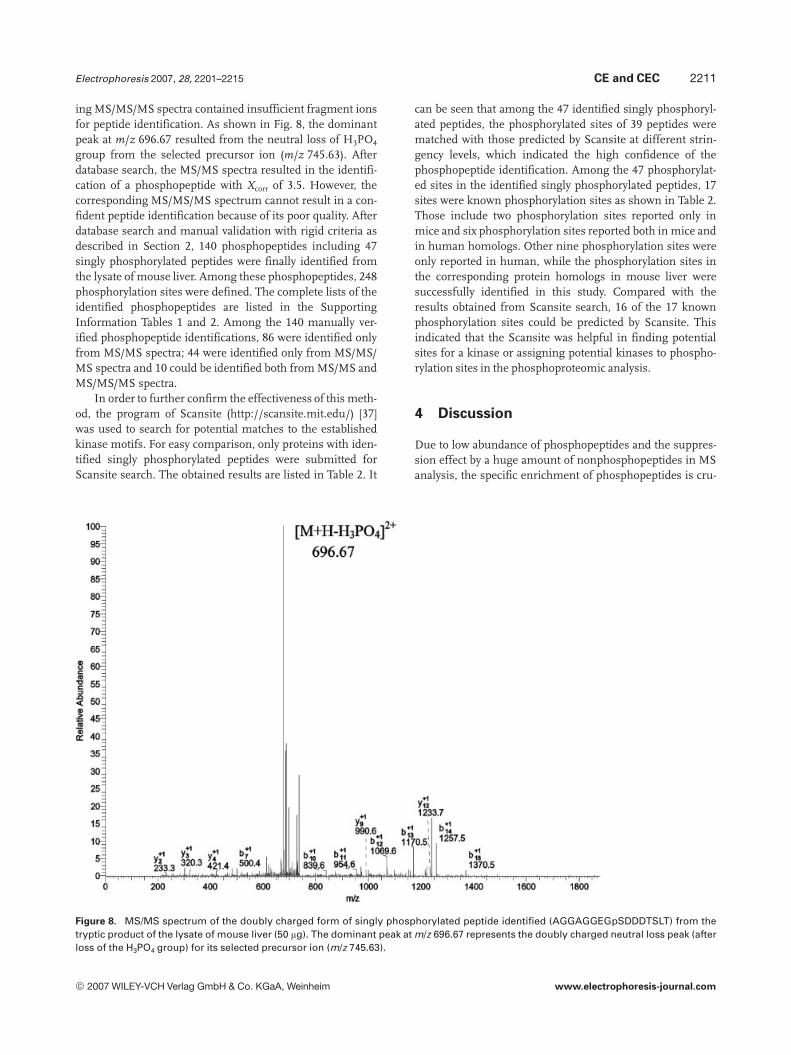
ing MS/MS/MS spectra contained insufficient fragment ionsfor peptide identification. As shown in Fig. 8, the dominantpeak at m/z 696.67 resulted from the neutral loss of H3PO4
group from the selected precursor ion (m/z 745.63). Afterdatabase search, the MS/MS spectra resulted in the identifi-cation of a phosphopeptide with Xcorr of 3.5. However, thecorresponding MS/MS/MS spectrum cannot result in a con-fident peptide identification because of its poor quality. Afterdatabase search and manual validation with rigid criteria asdescribed in Section 2, 140 phosphopeptides including 47singly phosphorylated peptides were finally identified fromthe lysate of mouse liver. Among these phosphopeptides, 248phosphorylation sites were defined. The complete lists of theidentified phosphopeptides are listed in the SupportingInformation Tables 1 and 2. Among the 140 manually ver-ified phosphopeptide identifications, 86 were identified onlyfrom MS/MS spectra; 44 were identified only from MS/MS/MS spectra and 10 could be identified both from MS/MS andMS/MS/MS spectra.
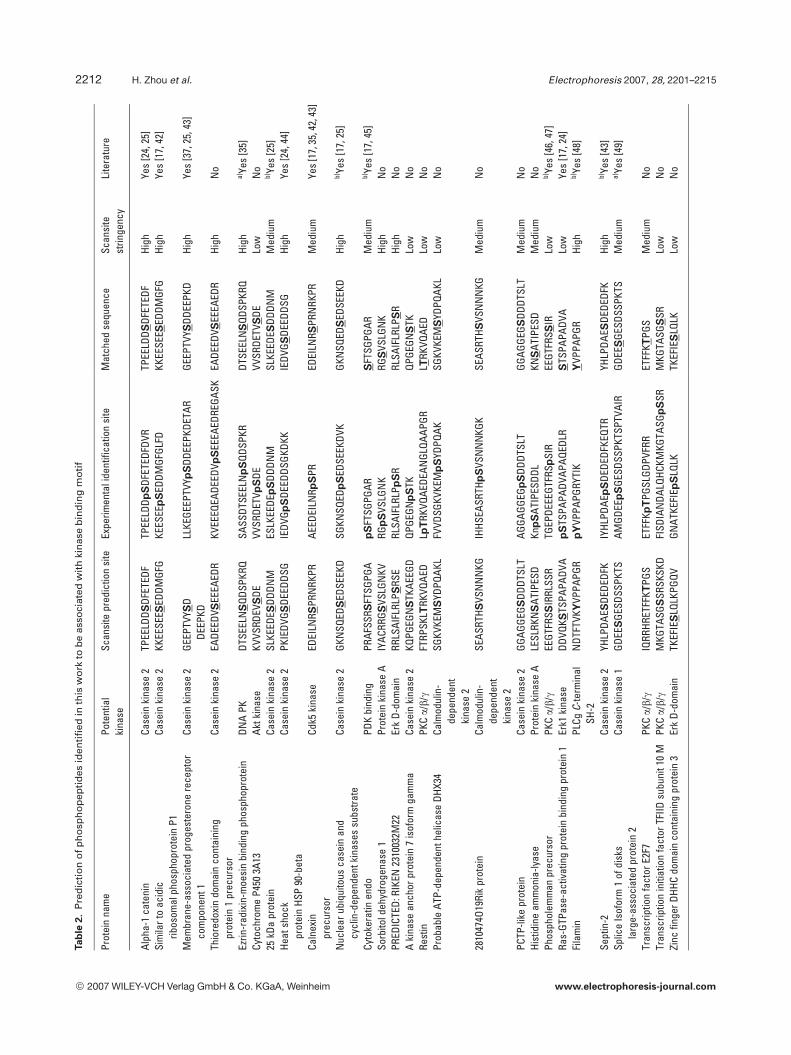
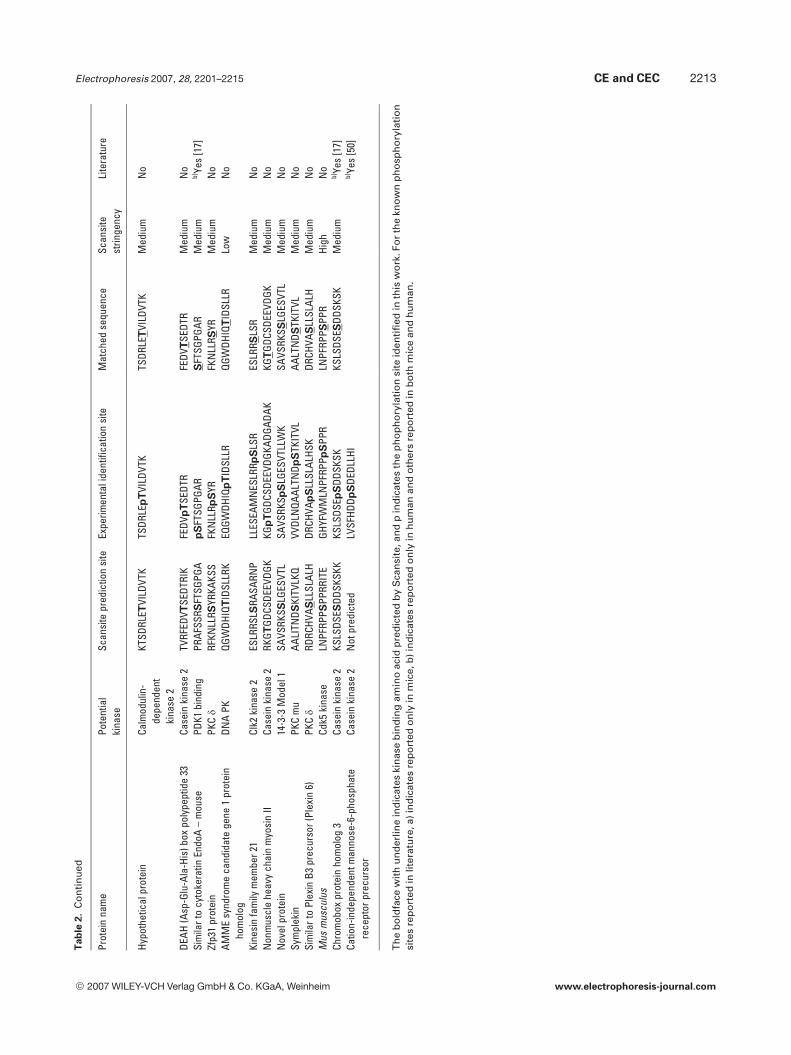
In order to further confirm the effectiveness of this meth-od, the program of Scansite (http://scansite.mit.edu/) [37]was used to search for potential matches to the establishedkinase motifs. For easy comparison, only proteins with iden-tified singly phosphorylated peptides were submitted forScansite search. The obtained results are listed in Table 2. It
can be seen that among the 47 identified singly phosphoryl-ated peptides, the phosphorylated sites of 39 peptides werematched with those predicted by Scansite at different strin-gency levels, which indicated the high confidence of thephosphopeptide identification. Among the 47 phosphorylat-ed sites in the identified singly phosphorylated peptides, 17sites were known phosphorylation sites as shown in Table 2.Those include two phosphorylation sites reported only inmice and six phosphorylation sites reported both in mice andin human homologs. Other nine phosphorylation sites wereonly reported in human, while the phosphorylation sites inthe corresponding protein homologs in mouse liver weresuccessfully identified in this study. Compared with theresults obtained from Scansite search, 16 of the 17 knownphosphorylation sites could be predicted by Scansite. Thisindicated that the Scansite was helpful in finding potentialsites for a kinase or assigning potential kinases to phospho-rylation sites in the phosphoproteomic analysis.
4 Discussion
Due to low abundance of phosphopeptides and the suppres-sion effect by a huge amount of nonphosphopeptides in MSanalysis, the specific enrichment of phosphopeptides is cru-
Figure 8. MS/MS spectrum of the doubly charged form of singly phosphorylated peptide identified (AGGAGGEGpSDDDTSLT) from thetryptic product of the lysate of mouse liver (50 mg). The dominant peak at m/z 696.67 represents the doubly charged neutral loss peak (afterloss of the H3PO4 group) for its selected precursor ion (m/z 745.63).
© 2007 WILEY-VCH Verlag GmbH & Co. KGaA, Weinheim www.electrophoresis-journal.com
2212 H. Zhou et al. Electrophoresis 2007, 28, 2201–2215Ta
ble
2.
Pre
dic
tio
no
fph
osp
ho
pep
tid
esid
enti
fied
inth
isw
ork
tob
eas
soci
ated
wit
hki
nas
eb
ind
ing
mo
tif
Prot
ein
nam
ePo
tent
ial
kina
seSc
ansi
tepr
edic
tion
site
Expe
rimen
tali
dent
ifica
tion
site
Mat
ched
sequ
ence
Scan
site
strin
genc
yLi
tera
ture
Alph
a-1
cate
nin
Case
inki
nase
2TP
EELD
D SDF
ETED
FTP
EELD
DpS
DFET
EDFD
VRTP
EELD
DSDF
ETED
FHi
ghYe
s[2
4,25
]Si
mila
rto
acid
icrib
osom
alph
osph
opro
tein
P1Ca
sein
kina
se2
KKEE
SEE S
EDDM
GFG
KEES
EEp
SED
DMGF
GLFD
KKEE
SEES
EDDM
GFG
High
Yes
[17,
42]
Mem
bran
e-as
soci
ated
prog
este
rone
rece
ptor
com
pone
nt1
Case
inki
nase
2GE
EPTV
Y SD
DEEP
KDLL
KEGE
EPTV
YpS
DDEE
PKDE
TAR
GEEP
TVYS
DDEE
PKD
High
Yes
[37,
25,4
3]
Thio
redo
xin
dom
ain
cont
aini
ngpr
otei
n1
prec
urso
rCa
sein
kina
se2
EADE
EDV S
EEEA
EDR
KVEE
EQEA
DEED
VpS
EEEA
EDRE
GASK
EADE
EDVS
EEEA
EDR
High
No
Ezrin
-rad
ixin
-moe
sin
bind
ing
phos
phop
rote
inDN
APK
DTSE
ELN
SQD
SPKR
QSA
SSDT
SEEL
Np
SQD
SPKR
DTSE
ELN
SQD
SPKR
QHi
gha)
Yes
[35]
Cyto
chro
me
P450
3A13
Aktk
inas
eKV
VSRD
EVS
DEVV
SRDE
TVp
SDE
VVSR
DETV
SDE
Low
No
25kD
apr
otei
nCa
sein
kina
se2
SLKE
EDE S
DDDN
MES
LKEE
DEp
SDD
DNM
SLKE
EDES
DDDN
MM
ediu
mb)
Yes
[25]
Heat
shoc
kpr
otei
nHS
P90
-bet
aCa
sein
kina
se2
PKIE
DVG S
DEED
DSG
IEDV
GpS
DEED
DSGK
DKK
IEDV
GSDE
EDDS
GHi
ghYe
s[2
4,44
]
Caln
exin
prec
urso
rCd
k5ki
nase
EDEI
LNR S
PRN
RKPR
AEED
EILN
RpS
PRED
EILN
RSPR
NRK
PRM
ediu
mYe
s[1
7,35
,42,
43]
Nuc
lear
ubiq
uito
usca
sein
and
cycl
in-d
epen
dent
kina
ses
subs
trate
Case
inki
nase
2GK
NSQ
EDS
EDSE
EKD
SGKN
SQED
pS
EDSE
EKDV
KGK
NSQ
EDS
EDSE
EKD
High
b)Ye
s[1
7,25
]
Cyto
kera
tinen
doPD
Kbi
ndin
gPR
AFSS
RSFT
SGPG
Ap
SFT
SGPG
ARS
FTSG
PGAR
Med
ium
b)Ye
s[1
7,45
]So
rbito
ldeh
ydro
gena
se1
Prot
ein
kina
seA
IYAC
RRG S
VSLG
NKV
RGp
SVS
LGN
KRG
SVS
LGN
KHi
ghN
oPR
EDIC
TED:
RIKE
N23
1003
2M22
Erk
D-do
mai
nRR
LSAI
FLRL
P SRS
ERL
SAIF
LRLP
pS
RRL
SAIF
LRLP
SR
High
No
Aki
nase
anch
orpr
otei
n7
isof
orm
gam
ma
Case
inki
nase
2KQ
PGEG
NS
TKAE
EGD
QPGE
GNp
STK
QPGE
GNS
TKLo
wN
oRe
stin
PKCa/b/g
FTRP
SKLT
RKVQ
AED
LpT
RKVQ
AEDE
ANGL
QAAP
GRL T
RKVQ
AED
Low
No
Prob
able
ATP-
depe
nden
thel
icas
eDH
X34
Calm
odul
in-
depe
nden
tki
nase
2
SGKV
KEM
SYD
PQAK
LFV
VDSG
KVKE
Mp
SYD
PQAK
SGKV
KEM
SYD
PQAK
LLo
wN
o
2810
474O
19Ri
kpr
otei
nCa
lmod
ulin
-de
pend
ent
kina
se2
SEAS
RTHS
VSN
NN
KGIH
HSEA
SRTH
pS
VSN
NN
KGK
SEAS
RTHS
VSN
NN
KGM
ediu
mN
o
PCTP
-like
prot
ein
Case
inki
nase
2GG
AGG
EGS
DDDT
SLT
AGGA
GGE
GpS
DDDT
SLT
GGAG
GEG
SDD
DTSL
TM
ediu
mN
oHi
stid
ine
amm
onia
-lyas
ePr
otei
nki
nase
ALE
SLRK
NS
ATIP
ESD
Knp
SAT
IPES
DDL
KNS
ATIP
ESD
Med
ium
No
Phos
phol
emm
anpr
ecur
sor
PKCa/b/g
EEGT
FRSS
IRRL
SSR
TGEP
DEEE
GTFR
SpSI
REE
GTFR
S SIR
Low
b)Ye
s[4
6,47
]Ra
s-GT
Pase
-act
ivat
ing
prot
ein
bind
ing
prot
ein
1Er
k1ki
nase
DDVQ
K STS
PAPA
DVA
pS
TSPA
PADV
APAQ
EDLR
STS
PAPA
DVA
Low
Yes
[17,
24]
Fila
min
PLCg
C-te
rmin
alSH
-2N
DTFT
VKY
VPPA
PGR
pY
VPPA
PGRY
TIK
YVP
PAPG
RHi
ghb)
Yes
[48]
Sept
in-2
Case
inki
nase
2YH
LPDA
ESDE
DEDF
KIY
HLPD
AEp
SDE
DEDF
KEQT
RYH
LPDA
ESDE
DEDF
KHi
ghb)
Yes
[43]
Splic
eIs
ofor
m1
ofdi
sks
larg
e-as
soci
ated
prot
ein
2Ca
sein
kina
se1
GDEE
SGE
SDSS
PKTS
AMGD
EEp
SGE
SDSS
PKTS
PTVA
IRGD
EES
GESD
SSPK
TSM
ediu
ma)
Yes
[49]
Tran
scrip
tion
fact
orE2
F7PK
Ca/b/g
IQRR
HRET
FFKT
PGS
ETFF
KpT
PGSL
GDPV
FRR
ETFF
K TPG
SM
ediu
mN
oTr
ansc
riptio
nin
itiat
ion
fact
orTF
IIDsu
buni
t10
MPK
Ca/b/g
MKG
TASG
SSR
SKSK
DFI
SDIA
NDA
LQHC
KMKG
TASG
pS
SRM
KGTA
SGS
SRLo
wN
oZi
ncfin
gerD
HHC
dom
ain
cont
aini
ngpr
otei
n3
Erk
D-do
mai
nTK
EFIE
SLQ
LKPG
QVGN
ATKE
FIEp
SLQ
LKTK
EFIE
SLQ
LKLo
wN
o
© 2007 WILEY-VCH Verlag GmbH & Co. KGaA, Weinheim www.electrophoresis-journal.com
Electrophoresis 2007, 28, 2201–2215 CE and CEC 2213T
ab
le2
.C
on
tin
ued
Prot
ein
nam
ePo
tent
ial
kina
seSc
ansi
tepr
edic
tion
site
Expe
rimen
tali
dent
ifica
tion
site
Mat
ched
sequ
ence
Scan
site
strin
genc
yLi
tera
ture
Hypo
thet
ical
prot
ein
Calm
odul
in-
depe
nden
tki
nase
2
KTSD
RLET
VILD
VTK
TSDR
LEp
TVI
LDVT
KTS
DRLE
TVI
LDVT
KM
ediu
mN
o
DEAH
(Asp
-Glu
-Ala
-His
)box
poly
pept
ide
33Ca
sein
kina
se2
TVRF
EDVT
SEDT
RIK
FEDV
pT
SEDT
RFE
DVT
SEDT
RM
ediu
mN
oSi
mila
rto
cyto
kera
tinEn
doA
–m
ouse
PDK1
bind
ing
PRAF
SSRS
FTSG
PGA
pS
FTSG
PGAR
SFT
SGPG
ARM
ediu
mb)
Yes
[17]
Zfp3
1pr
otei
nPK
Cd
RFKN
LLRS
YRKA
KSS
FKN
LLRp
SYR
FKN
LLR S
YRM
ediu
mN
oAM
ME
synd
rom
eca
ndid
ate
gene
1pr
otei
nho
mol
ogDN
APK
QGW
DHIQ
TID
SLLR
KEQ
GWDH
IQp
TID
SLLR
QGW
DHIQ
TID
SLLR
Low
No
Kine
sin
fam
ilym
embe
r21
Clk2
kina
se2
ESLR
RSLS
RASA
RNP
LLES
EAM
NES
LRRp
SLS
RES
LRR S
LSR
Med
ium
No
Non
mus
cle
heav
ych
ain
myo
sin
IICa
sein
kina
se2
RKGT
GDCS
DEEV
DGK
KGp
TGD
CSDE
EVDG
KADG
ADAK
KGT
GDCS
DEEV
DGK
Med
ium
No
Nov
elpr
otei
n14
-3-3
Mod
el1
SAVS
RKSS
LGES
VTL
SAVS
RKSp
SLG
ESVT
LLW
KSA
VSRK
S SLG
ESVT
LM
ediu
mN
oSy
mpl
ekin
PKC
mu
AALI
TNDS
KITV
LKQ
VVDL
NQA
ALTN
DpS
TKIT
VLAA
LTN
DSTK
ITVL
Med
ium
No
Sim
ilart
oPl
exin
B3pr
ecur
sor(
Plex
in6)
PKCd
RDRC
HVA S
LLSL
ALH
DRCH
VAp
SLL
SLAL
HSK
DRCH
VAS
LLSL
ALH
Med
ium
No
Mus
mus
culu
sCd
k5ki
nase
LNPF
RPPS
PPRR
ITE
GHYF
WM
LNPF
RPPp
SPP
RLN
PFRP
P SPP
RHi
ghN
oCh
rom
obox
prot
ein
hom
olog
3Ca
sein
kina
se2
KSLS
DSES
DDSK
SKK
KSLS
DSEp
SDD
SKSK
KSLS
DSE S
DDSK
SKM
ediu
mb)
Yes
[17]
Catio
n-in
depe
nden
tman
nose
-6-p
hosp
hate
rece
ptor
prec
urso
rCa
sein
kina
se2
Not
pred
icte
dLV
SFHD
DpS
DEDL
LHI
b)Ye
s[5
0]
Th
eb
old
face
wit
hu
nd
erlin
ein
dic
ates
kin
ase
bin
din
gam
ino
acid
pre
dic
ted
by
Sca
nsi
te,a
nd
pin
dic
ates
the
ph
op
ho
ryla
tio
nsi
teid
enti
fied
inth
isw
ork
.Fo
rth
ekn
ow
np
ho
sph
ory
lati
on
site
sre
po
rted
inlit
erat
ure
,a)i
nd
icat
esre
po
rted
on
lyin
mic
e,b
)in
dic
ates
rep
ort
edo
nly
inh
um
anan
do
ther
sre
po
rted
inb
oth
mic
ean
dh
um
an.
© 2007 WILEY-VCH Verlag GmbH & Co. KGaA, Weinheim www.electrophoresis-journal.com
2214 H. Zhou et al. Electrophoresis 2007, 28, 2201–2215
cial for large-scale phosphoproteome analysis. IMAC is stillthe most frequently applied method for the enrichment ofphosphopeptides. Besides, a series of new methods includ-ing the use of strong-cation-exchange (SCX) column [25],metal oxide particles such as TiO2 [26] and ZrO2 [27] havebeen developed to enrich phosphopeptides. Most of thesemethods use a column or tip packed with particles of micro-scale. It is of interest to test the nanoscale materials for theisolation of phosphopeptides due to its specific physicalcharacteristics. Promising results were obtained whennanoparticles of Fe3O4/TiO2 cores/shell nanoparticles [29],Fe31-immobilized zeolite nanoparticles [30], and Fe31
immobilized mesoporous MCM-41 nanoparticles [38] wereapplied to enrich phosphopeptides. In this study, wedemonstrated the highly specific enrichment capacity ofZrO2 nanoparticles for phosphopeptides using a series ofsamples of model phosphoproteins and complex mixtures.The high specificity of this approach may have resulted fromthe strong and specific bidentate-bridging coordination ofthe phosphate group to ZrO2 particles. Additionally, the spe-cific surface area and nanoscale effect may also improve theenrichment specificity and selectivity. It was reported thatZrO2 microparticles packed with microtips had a preferencefor singly phosphorylated peptides and TiO2 microcolumnshad a preference for multiple-phosphorylated peptides [27].However, no obvious affinity difference of ZrO2 nano-particles toward singly and multiple-phosphorylated peptideswas observed for the capture of phosphopeptides froma-casein in this study. It seems that phosphopeptides with sin-gle or multiple phosphorylation sites could be equally en-riched with ZrO2 nanoparticles. Compared with ZrO2 micro-particles, ZrO2 nanoparticles have a higher specific surfacearea and so have a higher sample capacity which representsan important advantage for nanomaterials as chromato-graphic absorbents. Recently, we also found that zirconiumphosphonate-modified surfaces have specific affinity forphosphopeptides [39]. The zirconium phosphonate-modifiedporous silicon wafer was successfully applied to capturephosphopeptides from minute samples followed by directMALDI MS analysis. Zr41 is involved in both cases. Biden-tate-bridging coordination of phosphate group is responsiblefor the specific binding of phosphopeptides.
Phosphoproteome analysis of biologic samples involvesseveral steps including protein extract preparation, proteindigestion, phosphopeptides enrichment, LC-MS/MS analy-sis of purified phosphopeptides, database search, and vali-dation of search results. Any variation in the above steps willresult in changing the analysis results. For example, a slightdecrease in criteria for the filtering of database results willlead to a significant increase in identified phosphopeptides.Therefore, in order to compare the efficiency of a phospho-peptide enrichment method, the procedures for other stepsshould be kept as identical as possible. However, this isalways not the case for the data obtained from differentlaboratories. In order to demonstrate the excellent perfor-mance of using ZrO2 nanoparticles for phosphopeptides’
enrichment, the comparison with IMAC was made based onthe results obtained in our laboratory. We have applied Fe31-IMAC-based methods with three methods for phosphopro-teome analysis of mouse liver, i.e., capillary column packedwith commercial IMAC beads (POROS 20 MC beads) [35],self-prepared Fe31-IMAC silica monolithic capillary column[40], and self-prepared IMAC mesoporous molecular sievesMCM-41 [38]. Correspondingly, a total of 26, 29, and 33 sin-gly phosphorylated peptides were identified after manualvalidation, respectively. However, a total of 47 singly phos-phorylated peptides were identified by using the presentmethod, which means that the ZrO2 nanoparticles are moreeffective for the capture of phosphopeptides than that ofFe31-IMAC materials.
In order to reduce the nonspecific adsorption, methylesterification of acidic residues of peptides prior to IMACwas conducted. This approach was applied to phosphopro-teome analysis of Saccharomyces cerevisiae, rat liver, and thetumor necrosis factor pathway which resulted in the identi-fication of 216 phosphopeptides defining 383 phosphoryla-tion sites [16], more than 300 phosphorylation sites [17] and145 phosphorylation sites [15], respectively. It should benoted that the reaction of methyl esterification may not becomplete and may have some side reactions. Thus, theresulting peptide samples become even more complex andmake the LC-MS/MS analysis of phosphopeptides more dif-ficult. A better solution is to improve the specificity of thephosphopeptides enrichment without chemical modificationof peptides. ZrO2 nanoparticles may be a good substitute ofusing IMAC. Phosphoproteome analysis of mouse liver byZrO2 nanoparticles resulted in the identification of 249phosphorylation sites. The number of identified phospho-peptides is limited if only one fraction of purified phospho-peptides is analyzed by LC-MS/MS. IMAC combined withSCX was introduced to analyze the phosphoproteome in theyeast pheromone signaling pathway leading to the identifi-cation of more than 700 phosphopeptides [41]. Similarly,large-scale phosphoproteome analysis of complex biologicsamples could be probably improved by the combination ofthe ZrO2 nanoparticles method with the other separationtechniques. Tryptic digest could be prefractioned prior toZrO2 nanoparticles enrichment or the ZrO2 nanoparticlespurified phosphopeptides could be further fractionated.Comprehensive phosphoproteome coverage could beachieved after LC-MS/MS analysis of the resulting multiplefractions. Global phosphoproteome analysis by combiningthe ZrO2 nanoparticle enrichment method with otherseparation techniques is still under study in our laboratory.
In conclusion, ZrO2 nanoparticles, for the first time,were demonstrated to have a strong and specific affinity forphosphopeptides present in complex tryptic peptides be-cause of the unique coordination property to phosphategroups, higher specific surface area, and nanoscale effect.ZrO2 nanoparticles were also applied to phosphoproteomeanalysis of mouse liver resulting in the identification of 140phosphopeptides and 248 phosphorylation sites. In compar-
© 2007 WILEY-VCH Verlag GmbH & Co. KGaA, Weinheim www.electrophoresis-journal.com
Electrophoresis 2007, 28, 2201–2215 CE and CEC 2215
ison with IMAC, our method using ZrO2 nanoparticlesproved superior in terms of selectivity and sensitivity for theanalysis of phosphorylated in digestion solutions of phos-phoproteins’ peptide binding. Enrichment of phosphopep-tides by ZrO2 nanoparticles is a good alternative of usingIMAC and is promising for large-scale phosphoproteomeanalysis of complex biologic samples.
The present work was supported by National Natural Sci-ences Foundation of China (No. 20327002), the China State KeyBasic Research Program Grant (2005 CB522701), and theKnowledge Innovation Program of DICP to H. Zou.
5 References
[1] Mann, M., Jesen, O. N., Nat. Biotechnol. 2003, 21, 255–261.
[2] Reinders, J., Sickmann, A., Proteomics 2005, 5, 4052–4061.
[3] Hunt, T., Cell 2000, 100, 113–127.
[4] Jensen, O. N., Curr. Opin. Chem. Biol. 2004, 8, 33–41.
[5] Salomon, A. R., Ficarro., S. B., Brill, L. M., Brinker, A. et al.,Proc. Natl. Acad. Sci. USA 2003, 100, 443–448.
[6] Annan, R. S., Carr, S. A., Anal. Chem. 1996, 68, 3413–3421.
[7] Vener, A. V., Harms, A., Sussman, M. R., J. Biol. Chem. 2001,276, 6959–6966.
[8] Oda, Y., Huang, K., Cross, F. R., Cowburn, D. et al., Proc. Natl.Acad. Sci. USA 1999, 96, 6591–6596.
[9] McLachlin, D. T., Chait, B. T., Curr. Opin. Chem. Biol. 2001, 5,591–602.
[10] Kokubu, M., Ishihama, Y, Sato, T., Nagasu, T. et al., Anal.Chem. 2005, 77, 5144–5154.
[11] Chalmers, M. J., Kolch, W., Emmett, M. R., Marshall, A. G. etal., J. Chromatogr. B 2004, 803, 111–120.
[12] Nushe, T. S., Stensballe, A., Jensen, O. N., Peck, S. C., Mol.Cell. Proteomics 2003, 2, 1234–1243.
[13] Posewitz, M. C., Tempst, P., Anal. Chem. 1999, 71, 2883–2892.
[14] Raska, C. S., Parker, C. E., Dominski, A., Marzluff, W. F. et al.,Anal. Chem. 2002, 74, 3429–3433.
[15] Hynek, R., Vankova, H., Tesarova, M., Kas, J., J. Liq. Chro-matogr. Relat. Technol. 2001, 24, 2801–2814.
[16] Ficarro, S. B., McCleland, M. L., Stukenberg, P. T., Burke, D. J.et al., Nat. Biotechnol. 2002, 20, 301–305.
[17] Kim, J. E., Tannenbaum, S. R., White, F. M., J. Proteome Res.2005, 4, 1339–1346.
[18] Moser, K., White, F. M., J. Proteome Res. 2006, 5, 98–104.
[19] Oda, Y., Nagasu, T., Chait, B. T., Nat. Biotechnol. 2001, 19,379–382.
[20] Zhou, H., Watts, J. D., Aebersold, R., Nat. Biotechnol. 2001,19, 375–378.
[21] Pandey, A., Podtelejnikov, A. V., Blagoev, B., Bustelo, X. R. etal., Proc. Natl. Acad. Sci. USA 2000, 97, 179–184.
[22] Grønborg, M., Kristiansen, T. Z., Stensballe, A., Andersen, J.S. et al., Mol. Cell. Proteomics 2002, 1, 517–527.
[23] Ficarro, S. B., Chertihin, O. A., Westbrook, V. A., White, F. etal., J. Biol. Chem. 2003, 278, 11579–11589.
[24] Ballif, B. A.,Villen, J., Beausoleil, S. A., Schwartz, D. et al.,Mol. Cell. Proteomics 2004, 3, 1093–1101.
[25] Beausoleil, S. A., Jedrychowski, M., Schwartz, D., Elias, J. E.et al., Proc. Natl. Acad. Sci. USA 2004, 101, 12130–12135.
[26] Larsen, M. R., Thingholm, T. E., Jensen, O. N., Roepstorff, P.et al., Mol. Cell. Proteomics 2005, 4, 873–886.
[27] Kweon, H. K., Håkansson, K., Anal. Chem. 2006, 78, 1743–1749.
[28] Wolschin, F., Wienkoop, S., Weckwerth, W., Proteomics2005, 5, 4389–4397.
[29] Chen, C. T., Chen, Y. C., Anal. Chem. 2005, 77, 5912–5919.
[30] Zhang, Y., Yu, X., Wang, X., Shan, W. et al., Chem. Commun.2004, 2882–2883.
[31] Jung, K. T., Bell, A. T., J. Mol. Catal. A 2000, 163, 27–42.
[32] Benfer, S., Knözinger, E., J. Mater. Chem. 1999, 9, 1203–1209.
[33] Zhu, H. Y., Hao, Z. P., Barry, J. C., Chem. Commun. 2002,2858–2859.
[34] Liu, G. L., Lin, Y., Anal. Chem. 2005, 77, 5894–5901.
[35] Jin, W., Dai, J., Zhou, H., Xia, Q. et al., Rapid Commun. MassSpectrom. 2004, 18, 2169–2176.
[36] Kjellström, S., Jensen, O. N., Anal. Chem. 2004, 76, 5109–5117.
[37] Obenauer, J. C., Cantley, L. C.,Yaffe, M. B., Nucleic Acids Res.2003, 31, 3635–3641.
[38] Pan, C., Ye, M., Liu, Y., Feng, S. et al., J. Proteome Res. 2006,5, 3114–3124.
[39] Zhou, H., Xu, S., Ye, M., Feng, S. et al., J. Proteome Res.2006, 5, 2431–2437.
[40] Feng, S., Pan, C., Jiang, X., Xu, S. et al., Proteomics, 2007, 7,351–360.
[41] Gruhler, A., Olsen, J. V., Mohammed, S., Mortensen, P. et al.,Mol. Cell. Proteomics 2005, 4, 310–327.
[42] Shu, H., Chen, S., Bi, Q., Mumby, M. et al., Mol. Cell. Prote-omics 2004, 3, 279–286.
[43] Nousiainen, M., Sillje, H. H. W., Sauer, G., Nigg, E. A. et al.,Proc. Natl. Acad. Sci. USA 2006, 103, 5391–5396.
[44] Ogiso, H., Kagi, N., Matsumoto, E., Nishimoto, M. et al.,Biochemistry 2004, 43, 15110–15119.
[45] Ku, N. O., Liao, J., Omary, M. B., EMBO J. 1998, 17, 1892–1906.
[46] Rembold, C. M., Ripley, M. L., Meeks, M., Geddis, L. M. et al.,J. Vasc. Res. 2005, 42, 483–491.
[47] Silverman, B. D., Fuller, W., Eaton, P., Deng, J. et al., Cardio-vasc. Res. 2005, 65, 93–103.
[48] Rush, J., Mortiz, A., Lee, K. A., Guo, A. et al., Nat. Biotechnol.2005, 23, 94–101.
[49] Collins, M. O., Yu, L., Coba, M. P., Husi, H. et al., J. Biol.Chem. 2005, 280, 5972–5982.
[50] Rosorius, O., Mieskes, G., Issinger, O. G., Korner, C. et al.,Biochem. J. 1993, 292, 833–838.
© 2007 WILEY-VCH Verlag GmbH & Co. KGaA, Weinheim www.electrophoresis-journal.com