Embed Size (px)
Citation preview

NEA Higher EducationAdvocateVOL. 30, NO. 2 MARCH 2013
The Salary Issue+More students, less funding: No, it doesn’t make sense
The gender gap shows no sign of shrinking
No surprise here: Unionized contingents earn more
Compare your salary to campus averages
NEA HIGHER EDUCATION ADVOCATE2
MORE STUDENTS, LESS MONEY? 3Recent years have seen recordnumbers of college students butdiminished state funding to publicinstitutions of higher education.How does that make sense? Thisyear’s special salary coverage alsotakes note of the increasing num-bers of contingent faculty, thecontinuing salary gap betweenmen and women, and the overallstagnant salaries.
2013 SALARY REVIEW 11Get the scoop on states andschools that pay faculty what theydeserve.
Advocate (ISSN: 1522-3183) is publishedfive times a year, in September, November, January, March, and Juneby the National Education Association,1201 16th St., N.W., Washington, D.C.20036. Periodicals postage paid atWashington, D.C., and additional mail-ing offices. The Advocate is mailed toNEA Higher Education members as abenefit of membership. Postmaster:Send change of address to Advocate,1201 16th St., N.W., Washington, D.C.20036. Copyright © 2013 by the National Education Assoc.
National Education Association
Dennis Van RoekleNEA PRESIDENT
Lily EskelsenVICE PRESIDENT
Rebecca S.PringleSECRETARY-TREASURER
John C. StocksEXECUTIVE DIRECTOR
NEA Center forCommunications
Ramona OliverSENIOR DIRECTOR
Steven Grant ASSOCIATE DIRECTOR
Mary Ellen FlanneryEDITOR
Alice TruedPRODUCTION
Groff Creative GRAPHIC DESIGN
Prepared withthe assistance ofNEA staff:Nancy O’BrienSara RobertsonMark F. Smith Valerie Wilkand Phadra Williams-Tuitt
State support for higher ed: Thefacts to bring to your legislator
STATE BUDGETS are likely tobe written this spring incapitols around the country.But before you walk intoyour lawmaker’s office tomake the case for morefunding for public institu-
tions of higher ed, take a look at the most recent issue of the NEA Almanac, specifically the article that provides thelatest research around state funding for higher education.Here is the proof that public colleges and universities aregetting shortchanged. From 2008 to 2012, state support forhigher education fell by $8.7 billion, or 10.8 percent acrossthe 50 states. Some decreases were even larger: 23.9 percentin California; 24.9 percent in Florida; 22.1 percent in Massa-chusetts. But 44 states foresee revenue growth this year,which points to the possibility of a catch-up in spending.The 2013 issue of the Almanac also includes the latest re-search on additional subjects including trends in for-profitcollege employment, faculty salaries, and employee benefits.Check it out at nea.org/almanac.
Why can’t college be free? IS HIGH-QUALITY, LOW-COST HIGHER EDUCATION an impossibledream? The authors of three working papers, published last
month by the Campaign for the Futureof Higher Education, don’t think so.The three papers, written by unionizedfaculty members, outline strategies forincreasing funds to public institutionsof higher ed. Their approaches includethe better use of existing funds, as wellas a proposed tax on some Wall Streettransactions. “We know the costs of a
college education have been shifted from states onto poorand middle-class Americans, and far too many families areeither drowning in debt or putting off their education alto-gether,” said NEA’s Mark F. Smith, higher-education policyanalyst. “Common-sense solutions to the funding crisis arewelcome.” Check them out and join the conversation at futureofhighered.com
Nominate a colleague!NOMINATIONS FOR THE U.S. PROFESSORS OF THE YEAR AWARDS
are being accepted at www.usprofessorsoftheyear.com. Inrecent years, many NEA Higher Ed members have wonrecognition (and $5,000 each!) for their excellent undergrad-uate teaching and mentoring.
MISSED SOMETHING?READ PREVIOUS ARTICLES ONOUR WEBSITE
STATE OF THE UNION President Obama’s Feb-ruary speech remindedthe nation of the link between high-qualityhigher education and astrong economy. It alsotouted his new “CollegeScore Cards.”http://neatoday.org/2013/02/13/
ARE GUNS PAYING FORYOUR RETIREMENT?The largest educator-only pension fund in theworld, California’s Cal-STRS, which includescommunity college faculty, said it will sellits shares in arms manu-facturing companies.http://neatoday.org/2013/02/12/
EXTREMIST AGENDASAFOOT IN STATES A national network ofextremist lawmakersand wealthy donors isworking hard to limitunion rights in stateslike Maine and Pennsyl-vania. Find out how youcan stay informed.http://educationvotes.nea.org/2013/02/07/
IMMIGRATION REFORMFOR STUDENTSA plan to carve out afaster path to citizenshipfor “DREAMERS —thestudents and young immigrants who camehere as children—hasbeen introduced to Congress. Find out howyou can support it.http://educationvotes.nea.org/2013/01/30/
Headline News

NEA HIGHER EDUCATION ADVOCATEIllustration: Steve McCracken 3
Even as students have flocked to public colleges and univer-
sities in recent years, seeking degrees or certificates that could mean good
jobs during lean economic years, state funding for higher education has not
followed. Institutions are still struggling financially — and likely you know this when you look into your wallet.
Moreover, more institutions are relying on poorly paid contingent faculty instead of full-time tenure-track faculty.
These are dangerous trends for anybody who cares about high-quality education, and they must be answered.
At the state and federal level, faculty and staff must hold their elected officials accountable for their support
(or lack of) for public education and students. At the local level, the answers can be found in a strong, unified
union. Get involved!
THE 2013 SALARY ISSUE
Less MoneySTUDENTS,?MORE
NEA HIGHER EDUCATION ADVOCATE4
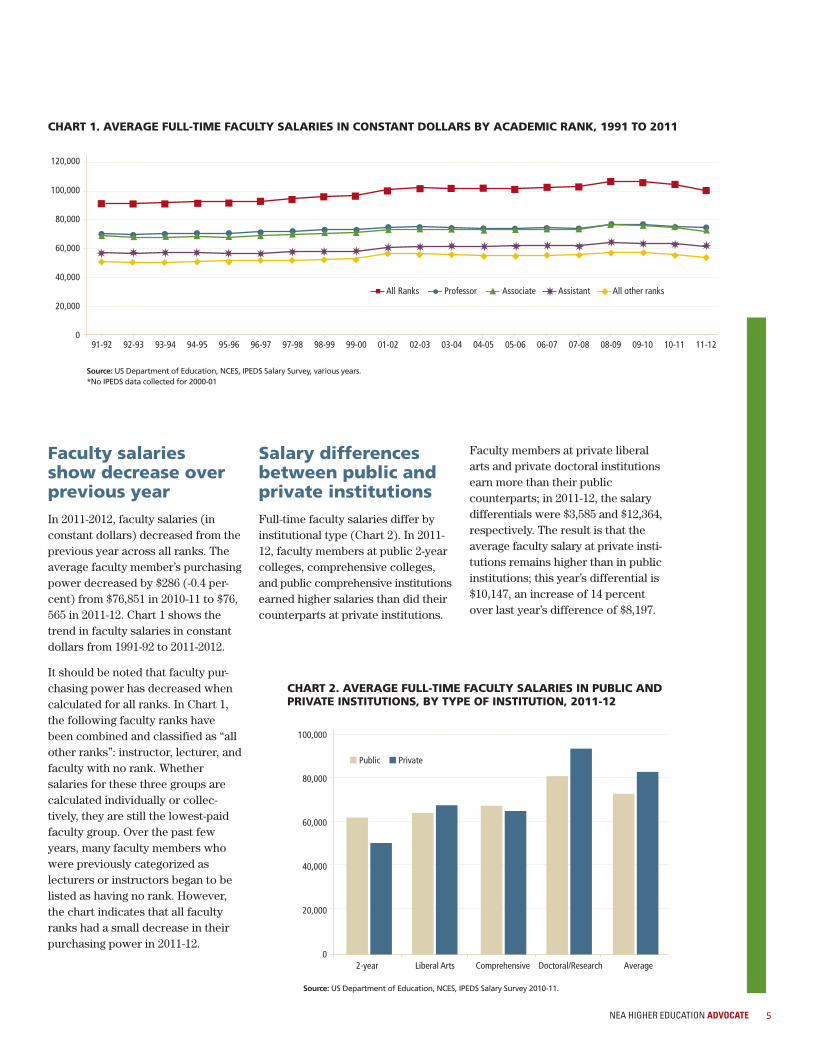
The annual Grapevine study1
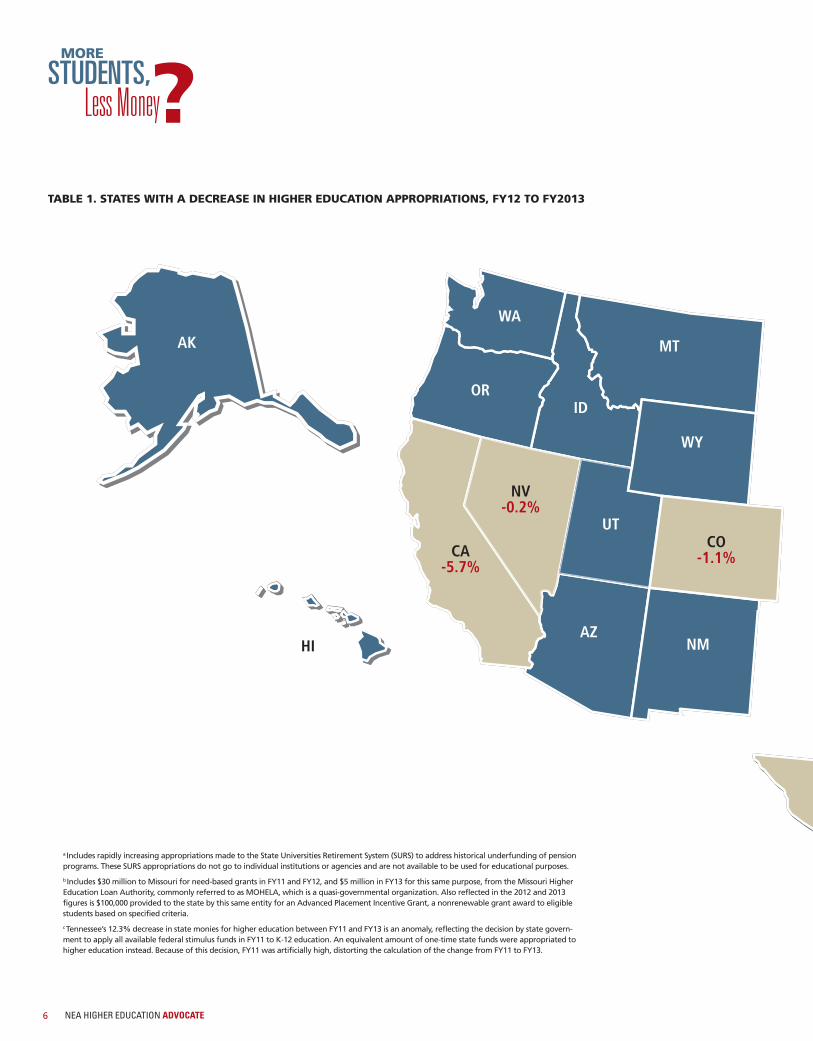
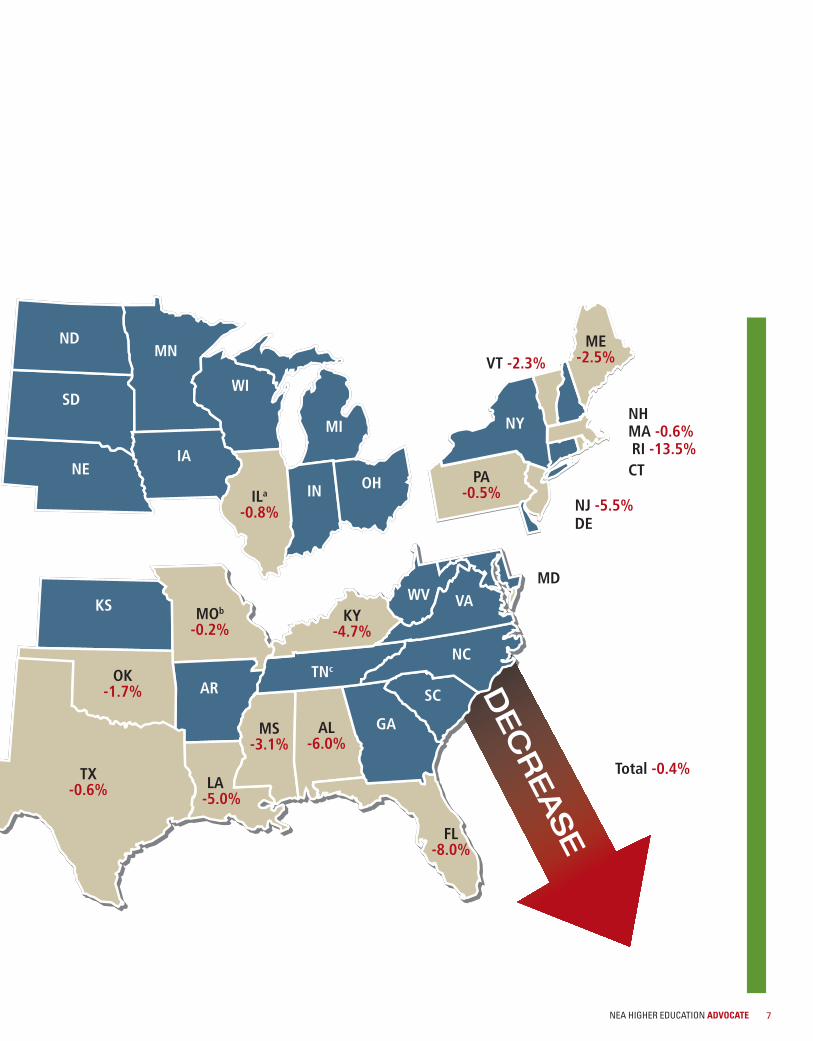
conducted by the Center for theStudy of Education Policy at IllinoisState University indicates that statespending on higher education has decreased over the past several years.Between FY2011 and FY2012, a totalof 41 states reported a decline instate support for higher education.The declines varied drastically, andranged between 41 percent in NewHampshire and a little less than 1 percent in Utah and Nebraska.State budget data for FY2013 indicatesa continued decline in education ap-propriations; eighteen states showeda decrease in the percentage of stateappropriations for higher educationbetween FY2012 and FY20132, and anadditional ten states had increases of less than 1 percent (Table 1). Nationally, the percentage of totalstate appropriations for higher edu-cation (including ARRA funds)
almost remained the same over thepast fiscal year (Table 1); the decreasewas less than 1 percent.
Last year’s Advocate noted that insti-tutions of higher education, especiallycommunity colleges, experience anincrease in student enrollment in atime of economic uncertainty. Unem-ployed workers want to learn newskills in high-demand industries, andthose with marginal jobs want to upgrade their skills to keep up withemerging technology and changingworkforce. Since the recession beginning in 2008, the number of full-time equivalent (FTE) studentsenrolled at public institutions roseby 7.23 percent. In fact, the numberof FTE students in higher educationhas been trending upward for morethan a decade, representing both demographic trends and the increas-ing importance of a postsecondary
degree in the job market. Despite increases in FTE enrollment, thenumber of full-time faculty membershas not kept pace; the number offull-time faculty at public institutionsincreased by only 1 percent duringthe same three-year time period.4
The continued decline in state supportfor higher education, coupled withthe surge in the number of enrolledstudents, has negative consequencesfor higher education institutions.Many public institutions will continueto see short-term declines in statefunding, based on the decreases (orminimal increases) in state supportover the last few years. Even if theeconomy improves there will be a lagbetween increased state revenue andmeaningful increases in state supportfor higher education. In addition tocontinuing downward pressure onfull-time faculty salaries, these pres-sures will lead to a continuation ofthe shift to low-cost part-time facultyand increased teaching loads. Theother fear is that the salary gap between faculty in public and privateuniversities will continue to increase.
his 2013 special salary issue of the Advocate continues to track the effects of the recession on state support for higher education and on faculty salaries, examining 10-year trends in public sector faculty salaries and stateappropriations for community colleges and public univer-sities. Although faculty purchasing power has increasedover the past ten years, there have been some fluctuations.Declines in purchasing power were seen following the recessions of the late 1990s, between 2001-02 and 2004-05,and again starting in 2008. These declines coincided with
reductions in state tax support for higher education.
T
Less MoneySTUDENTS,?MORE
1 Grapevine: An Annual Compilation of Data on State Fiscal Support for Higher Education. Illinois State University. http://www.grapevine.ilstu.edu/index.shtml, retrieved onJanuary 22, 2013.
2 Note: the FY2012-13 data are preliminary, and may be adjusted at a later date.
3 U.S. Department of Education, National Center for Education Statistics, Integrated Postsecondary Education Data System (IPEDS), Fall Enrollment Survey, 2008 and 2011.
4 U.S. Department of Education, National Center for Education Statistics, Integrated Postsecondary Education Data System (IPEDS), Staffing Survey, 2010-11.
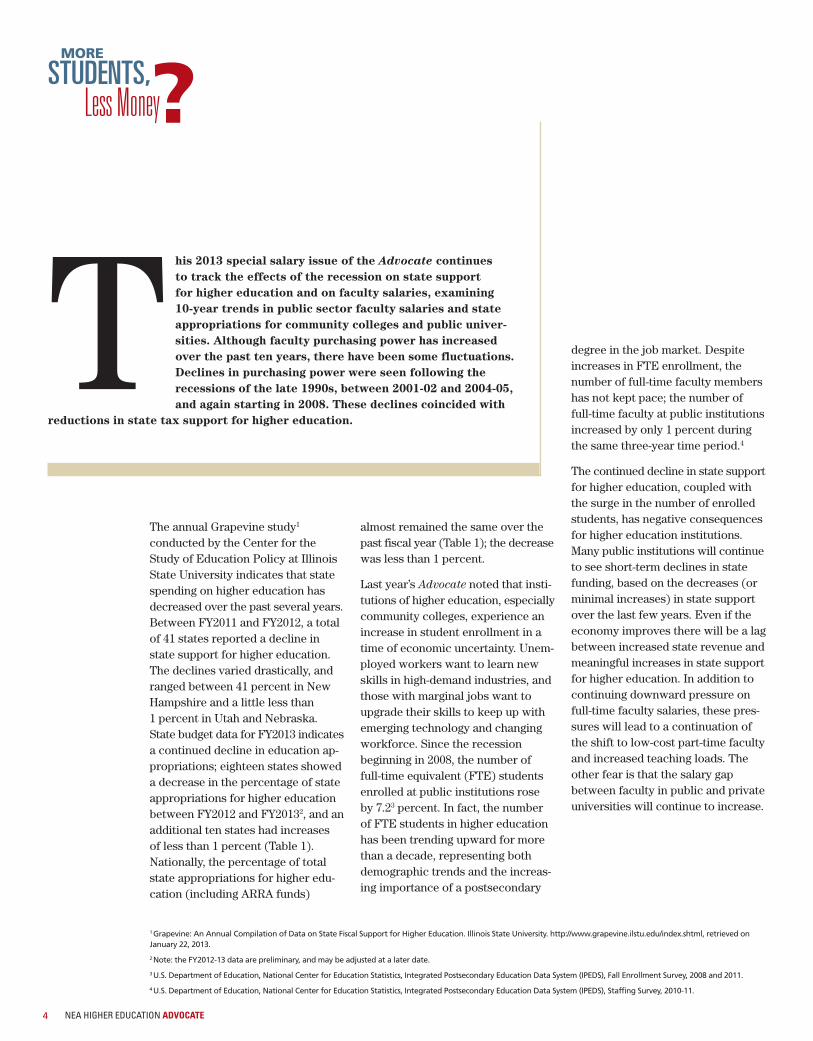
Faculty salaries show decrease overprevious yearIn 2011-2012, faculty salaries (in constant dollars) decreased from theprevious year across all ranks. Theaverage faculty member’s purchasingpower decreased by $286 (-0.4 per-cent) from $76,851 in 2010-11 to $76,565 in 2011-12. Chart 1 shows thetrend in faculty salaries in constantdollars from 1991-92 to 2011-2012.
It should be noted that faculty pur-chasing power has decreased whencalculated for all ranks. In Chart 1,the following faculty ranks havebeen combined and classified as “allother ranks”: instructor, lecturer, andfaculty with no rank. Whethersalaries for these three groups arecalculated individually or collec-tively, they are still the lowest-paidfaculty group. Over the past fewyears, many faculty members whowere previously categorized as lecturers or instructors began to belisted as having no rank. However,the chart indicates that all facultyranks had a small decrease in theirpurchasing power in 2011-12.
Salary differences between public and private institutionsFull-time faculty salaries differ by institutional type (Chart 2). In 2011-12, faculty members at public 2-yearcolleges, comprehensive colleges,and public comprehensive institutionsearned higher salaries than did theircounterparts at private institutions.
Faculty members at private liberalarts and private doctoral institutionsearn more than their public counterparts; in 2011-12, the salarydifferentials were $3,585 and $12,364,respectively. The result is that the average faculty salary at private insti-tutions remains higher than in publicinstitutions; this year’s differential is$10,147, an increase of 14 percentover last year’s difference of $8,197.
CHART 1. AVERAGE FULL-TIME FACULTY SALARIES IN CONSTANT DOLLARS BY ACADEMIC RANK, 1991 TO 2011
CHART 2. AVERAGE FULL-TIME FACULTY SALARIES IN PUBLIC ANDPRIVATE INSTITUTIONS, BY TYPE OF INSTITUTION, 2011-12
NEA HIGHER EDUCATION ADVOCATE 5
120,000
100,000
80,000
60,000
40,000
20,000
091-92 92-93 93-94 94-95 95-96 96-97 97-98 98-99 99-00 01-02 02-03 03-04 04-05 05-06 06-07 07-08 08-09 09-10 10-11 11-12
Source: US Department of Education, NCES, IPEDS Salary Survey, various years.*No IPEDS data collected for 2000-01
—– All Ranks —– Professor —– Associate —– Assistant —– All other ranks
100,000
80,000
60,000
40,000
20,000
02-year Liberal Arts Comprehensive Doctoral/Research Average
n Public n Private
Source: US Department of Education, NCES, IPEDS Salary Survey 2010-11.
AK
AZNM
ID
MT
CO-1.1%
WY
UT
WA
OR
NV-0.2%
CA-5.7%
HI
NEA HIGHER EDUCATION ADVOCATE6
TABLE 1. STATES WITH A DECREASE IN HIGHER EDUCATION APPROPRIATIONS, FY12 TO FY2013
a Includes rapidly increasing appropriations made to the State Universities Retirement System (SURS) to address historical underfunding of pensionprograms. These SURS appropriations do not go to individual institutions or agencies and are not available to be used for educational purposes.
b Includes $30 million to Missouri for need-based grants in FY11 and FY12, and $5 million in FY13 for this same purpose, from the Missouri HigherEducation Loan Authority, commonly referred to as MOHELA, which is a quasi-governmental organization. Also reflected in the 2012 and 2013figures is $100,000 provided to the state by this same entity for an Advanced Placement Incentive Grant, a nonrenewable grant award to eligiblestudents based on specified criteria.
c Tennessee’s 12.3% decrease in state monies for higher education between FY11 and FY13 is an anomaly, reflecting the decision by state govern-ment to apply all available federal stimulus funds in FY11 to K-12 education. An equivalent amount of one-time state funds were appropriated tohigher education instead. Because of this decision, FY11 was artificially high, distorting the calculation of the change from FY11 to FY13.
Less MoneySTUDENTS,?MORE
MD
TX-0.6%
WV
Total -0.4%
GA
SC
NC
MOb
-0.2%
AR
MS-3.1%
AL-6.0%
KY-4.7%
KS
FL-8.0%
LA -5.0%
VA
NH
VT -2.3%
MA -0.6%
CTRI -13.5%
DENJ -5.5%
NY
ME-2.5%
PA-0.5%
ND
ILa
-0.8%
MN
WI
IA
MI
SD
NEOHIN
OK-1.7%
TNc
NEA HIGHER EDUCATION ADVOCATE 7
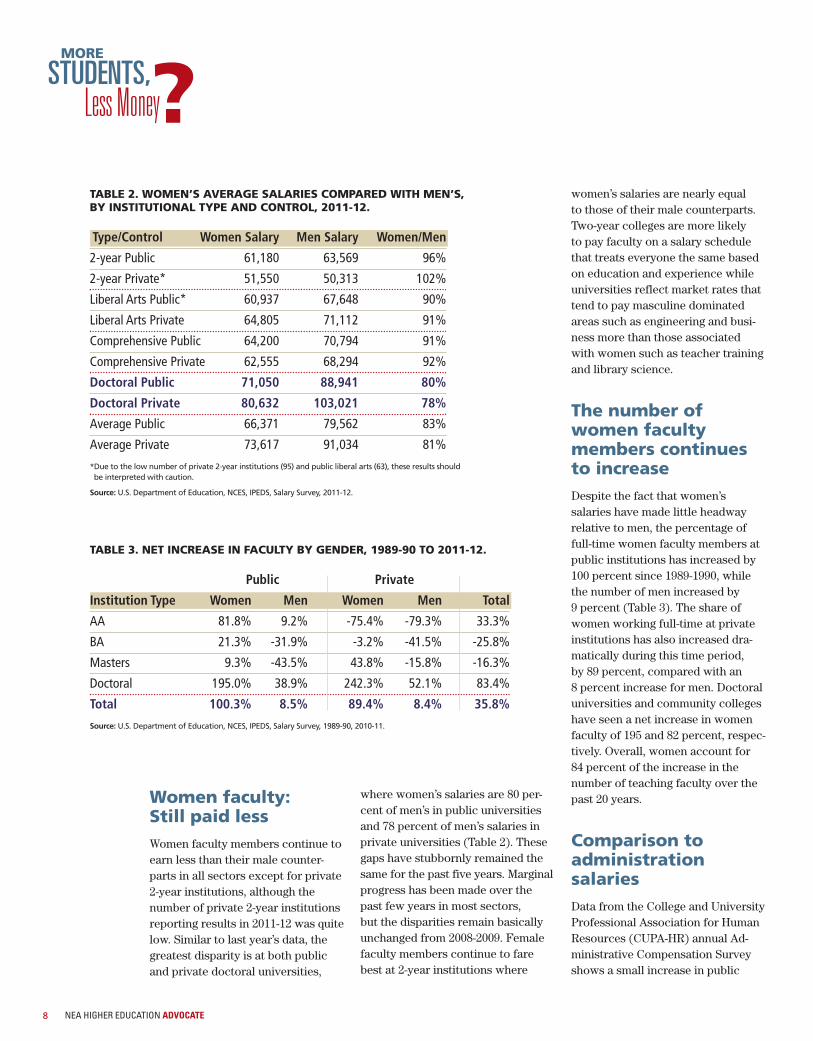
Women faculty: Still paid lessWomen faculty members continue toearn less than their male counter-parts in all sectors except for private2-year institutions, although thenumber of private 2-year institutionsreporting results in 2011-12 was quitelow. Similar to last year’s data, thegreatest disparity is at both publicand private doctoral universities,
where women’s salaries are 80 per-cent of men’s in public universitiesand 78 percent of men’s salaries inprivate universities (Table 2). Thesegaps have stubbornly remained thesame for the past five years. Marginalprogress has been made over thepast few years in most sectors, but the disparities remain basically unchanged from 2008-2009. Female faculty members continue to farebest at 2-year institutions where
women’s salaries are nearly equal to those of their male counterparts.Two-year colleges are more likely to pay faculty on a salary schedulethat treats everyone the same basedon education and experience while universities reflect market rates thattend to pay masculine dominatedareas such as engineering and busi-ness more than those associatedwith women such as teacher trainingand library science.
The number ofwomen faculty members continuesto increaseDespite the fact that women’ssalaries have made little headwayrelative to men, the percentage offull-time women faculty members atpublic institutions has increased by100 percent since 1989-1990, whilethe number of men increased by 9 percent (Table 3). The share ofwomen working full-time at privateinstitutions has also increased dra-matically during this time period, by 89 percent, compared with an 8 percent increase for men. Doctoraluniversities and community collegeshave seen a net increase in womenfaculty of 195 and 82 percent, respec-tively. Overall, women account for 84 percent of the increase in thenumber of teaching faculty over thepast 20 years.
Comparison to administrationsalariesData from the College and UniversityProfessional Association for HumanResources (CUPA-HR) annual Ad-ministrative Compensation Surveyshows a small increase in public
NEA HIGHER EDUCATION ADVOCATE8
TABLE 3. NET INCREASE IN FACULTY BY GENDER, 1989-90 TO 2011-12.
Public Private
Institution Type Women Men Women Men Total
AA 81.8% 9.2% -75.4% -79.3% 33.3%
BA 21.3% -31.9% -3.2% -41.5% -25.8%
Masters 9.3% -43.5% 43.8% -15.8% -16.3%
Doctoral 195.0% 38.9% 242.3% 52.1% 83.4%
Total 100.3% 8.5% 89.4% 8.4% 35.8%
Source: U.S. Department of Education, NCES, IPEDS, Salary Survey, 1989-90, 2010-11.
TABLE 2. WOMEN’S AVERAGE SALARIES COMPARED WITH MEN’S, BY INSTITUTIONAL TYPE AND CONTROL, 2011-12.
Type/Control Women Salary Men Salary Women/Men
2-year Public 61,180 63,569 96%
2-year Private* 51,550 50,313 102%
Liberal Arts Public* 60,937 67,648 90%
Liberal Arts Private 64,805 71,112 91%
Comprehensive Public 64,200 70,794 91%
Comprehensive Private 62,555 68,294 92%
Doctoral Public 71,050 88,941 80%
Doctoral Private 80,632 103,021 78%
Average Public 66,371 79,562 83%
Average Private 73,617 91,034 81%
*Due to the low number of private 2-year institutions (95) and public liberal arts (63), these results should be interpreted with caution.
Source: U.S. Department of Education, NCES, IPEDS, Salary Survey, 2011-12.
Less MoneySTUDENTS,?MORE
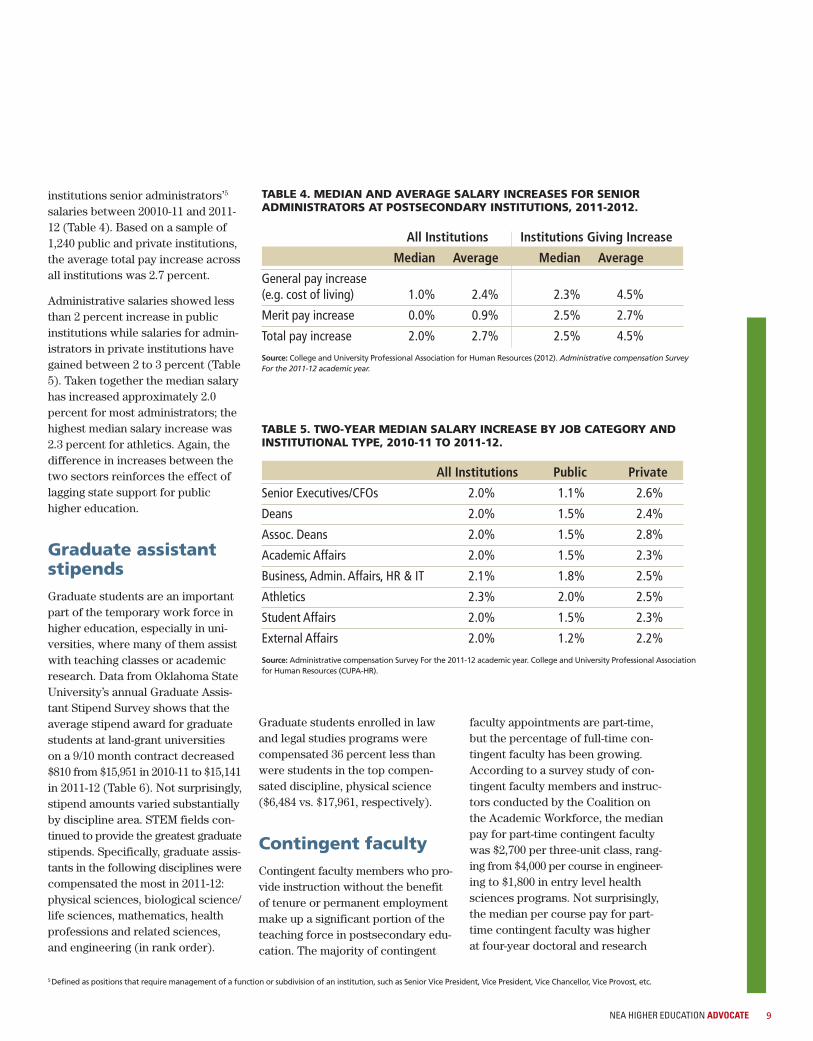
institutions senior administrators’5
salaries between 20010-11 and 2011-12 (Table 4). Based on a sample of1,240 public and private institutions,the average total pay increase acrossall institutions was 2.7 percent.
Administrative salaries showed lessthan 2 percent increase in public institutions while salaries for admin-istrators in private institutions havegained between 2 to 3 percent (Table5). Taken together the median salaryhas increased approximately 2.0 percent for most administrators; thehighest median salary increase was2.3 percent for athletics. Again, thedifference in increases between thetwo sectors reinforces the effect oflagging state support for publichigher education.
Graduate assistantstipendsGraduate students are an importantpart of the temporary work force inhigher education, especially in uni-versities, where many of them assistwith teaching classes or academicresearch. Data from Oklahoma StateUniversity’s annual Graduate Assis-tant Stipend Survey shows that theaverage stipend award for graduatestudents at land-grant universities on a 9/10 month contract decreased$810 from $15,951 in 2010-11 to $15,141in 2011-12 (Table 6). Not surprisingly,stipend amounts varied substantiallyby discipline area. STEM fields con-tinued to provide the greatest graduatestipends. Specifically, graduate assis-tants in the following disciplines werecompensated the most in 2011-12:physical sciences, biological science/life sciences, mathematics, healthprofessions and related sciences,and engineering (in rank order).
Graduate students enrolled in lawand legal studies programs werecompensated 36 percent less thanwere students in the top compen-sated discipline, physical science($6,484 vs. $17,961, respectively).
Contingent facultyContingent faculty members who pro-vide instruction without the benefitof tenure or permanent employmentmake up a significant portion of theteaching force in postsecondary edu-cation. The majority of contingent
faculty appointments are part-time,but the percentage of full-time con-tingent faculty has been growing. According to a survey study of con-tingent faculty members and instruc-tors conducted by the Coalition onthe Academic Workforce, the medianpay for part-time contingent facultywas $2,700 per three-unit class, rang-ing from $4,000 per course in engineer-ing to $1,800 in entry level healthsciences programs. Not surprisingly,the median per course pay for part-time contingent faculty was higher at four-year doctoral and research
9NEA HIGHER EDUCATION ADVOCATE
TABLE 4. MEDIAN AND AVERAGE SALARY INCREASES FOR SENIOR ADMINISTRATORS AT POSTSECONDARY INSTITUTIONS, 2011-2012.
All Institutions Institutions Giving Increase
Median Average Median Average
General pay increase(e.g. cost of living) 1.0% 2.4% 2.3% 4.5%
Merit pay increase 0.0% 0.9% 2.5% 2.7%
Total pay increase 2.0% 2.7% 2.5% 4.5%
Source: College and University Professional Association for Human Resources (2012). Administrative compensation Survey For the 2011-12 academic year.
TABLE 5. TWO-YEAR MEDIAN SALARY INCREASE BY JOB CATEGORY AND INSTITUTIONAL TYPE, 2010-11 TO 2011-12.
All Institutions Public Private
Senior Executives/CFOs 2.0% 1.1% 2.6%
Deans 2.0% 1.5% 2.4%
Assoc. Deans 2.0% 1.5% 2.8%
Academic Affairs 2.0% 1.5% 2.3%
Business, Admin. Affairs, HR & IT 2.1% 1.8% 2.5%
Athletics 2.3% 2.0% 2.5%
Student Affairs 2.0% 1.5% 2.3%
External Affairs 2.0% 1.2% 2.2%
Source: Administrative compensation Survey For the 2011-12 academic year. College and University Professional Associationfor Human Resources (CUPA-HR).
5 Defined as positions that require management of a function or subdivision of an institution, such as Senior Vice President, Vice President, Vice Chancellor, Vice Provost, etc.
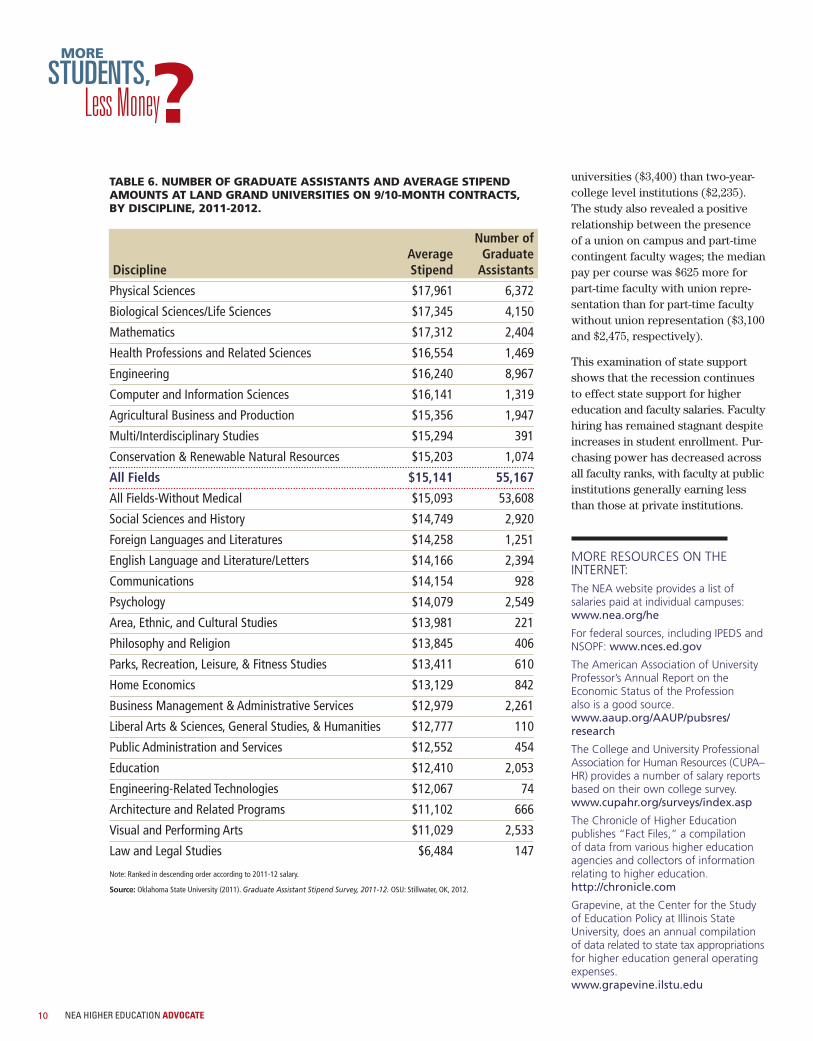
universities ($3,400) than two-year-college level institutions ($2,235).The study also revealed a positive relationship between the presence of a union on campus and part-timecontingent faculty wages; the medianpay per course was $625 more forpart-time faculty with union repre-sentation than for part-time facultywithout union representation ($3,100and $2,475, respectively).
This examination of state supportshows that the recession continuesto effect state support for higher education and faculty salaries. Facultyhiring has remained stagnant despiteincreases in student enrollment. Pur-chasing power has decreased acrossall faculty ranks, with faculty at publicinstitutions generally earning lessthan those at private institutions.
MORE RESOURCES ON THE INTERNET:The NEA website provides a list ofsalaries paid at individual campuses:www.nea.org/he
For federal sources, including IPEDS andNSOPF: www.nces.ed.gov
The American Association of University Professor’s Annual Report on the Economic Status of the Profession also is a good source.www.aaup.org/AAUP/pubsres/research
The College and University ProfessionalAssociation for Human Resources (CUPA–HR) provides a number of salary reportsbased on their own college survey.www.cupahr.org/surveys/index.asp
The Chronicle of Higher Education publishes “Fact Files,” a compilation of data from various higher educationagencies and collectors of informationrelating to higher education.http://chronicle.com
Grapevine, at the Center for the Studyof Education Policy at Illinois State University, does an annual compilationof data related to state tax appropriationsfor higher education general operatingexpenses.www.grapevine.ilstu.edu
NEA HIGHER EDUCATION ADVOCATE10
TABLE 6. NUMBER OF GRADUATE ASSISTANTS AND AVERAGE STIPENDAMOUNTS AT LAND GRAND UNIVERSITIES ON 9/10-MONTH CONTRACTS, BY DISCIPLINE, 2011-2012.
Number ofAverage Graduate
Discipline Stipend Assistants
Physical Sciences $17,961 6,372
Biological Sciences/Life Sciences $17,345 4,150
Mathematics $17,312 2,404
Health Professions and Related Sciences $16,554 1,469
Engineering $16,240 8,967
Computer and Information Sciences $16,141 1,319
Agricultural Business and Production $15,356 1,947
Multi/Interdisciplinary Studies $15,294 391
Conservation & Renewable Natural Resources $15,203 1,074
All Fields $15,141 55,167
All Fields-Without Medical $15,093 53,608
Social Sciences and History $14,749 2,920
Foreign Languages and Literatures $14,258 1,251
English Language and Literature/Letters $14,166 2,394
Communications $14,154 928
Psychology $14,079 2,549
Area, Ethnic, and Cultural Studies $13,981 221
Philosophy and Religion $13,845 406
Parks, Recreation, Leisure, & Fitness Studies $13,411 610
Home Economics $13,129 842
Business Management & Administrative Services $12,979 2,261
Liberal Arts & Sciences, General Studies, & Humanities $12,777 110
Public Administration and Services $12,552 454
Education $12,410 2,053
Engineering-Related Technologies $12,067 74
Architecture and Related Programs $11,102 666
Visual and Performing Arts $11,029 2,533
Law and Legal Studies $6,484 147
Note: Ranked in descending order according to 2011-12 salary.
Source: Oklahoma State University (2011). Graduate Assistant Stipend Survey, 2011-12. OSU: Stillwater, OK, 2012.
Less MoneySTUDENTS,?MORE
NEA HIGHER EDUCATION ADVOCATE 11
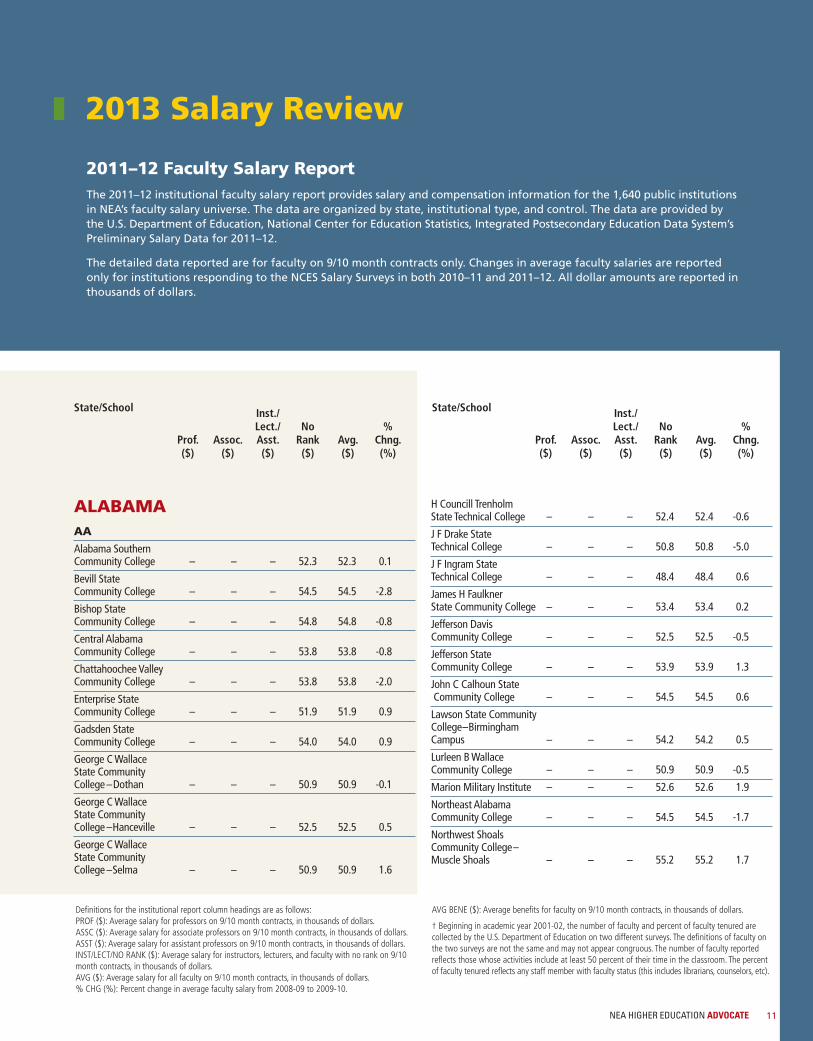
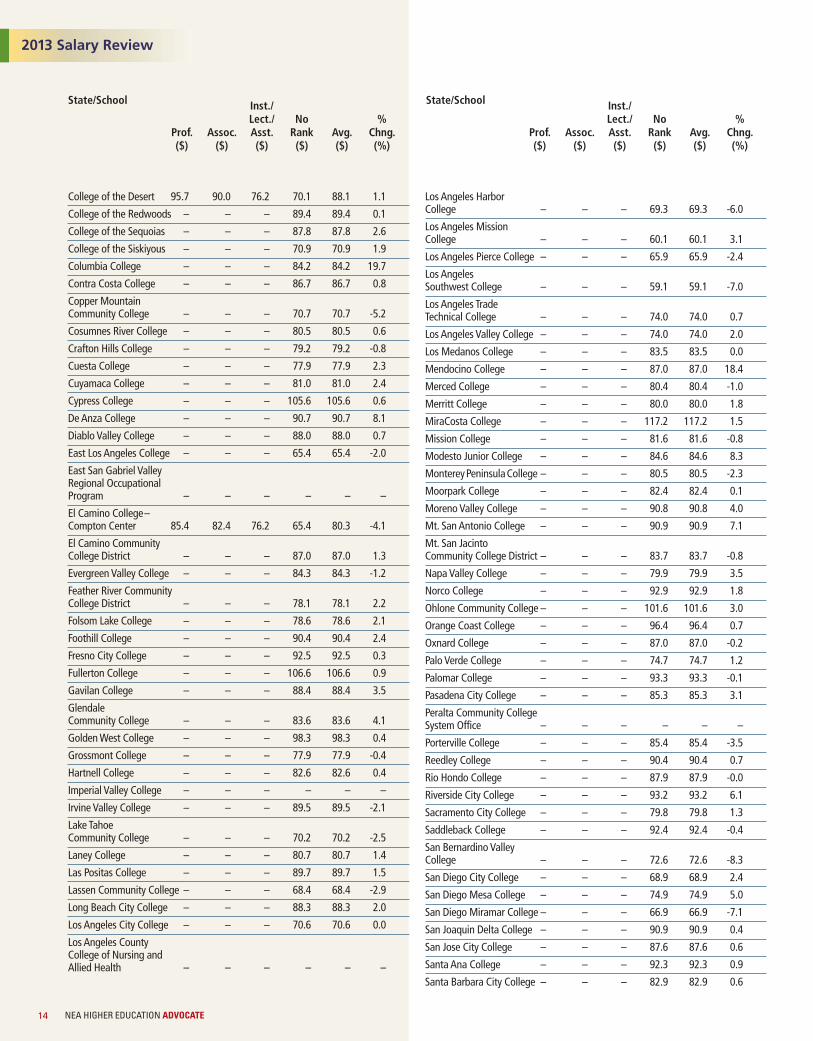
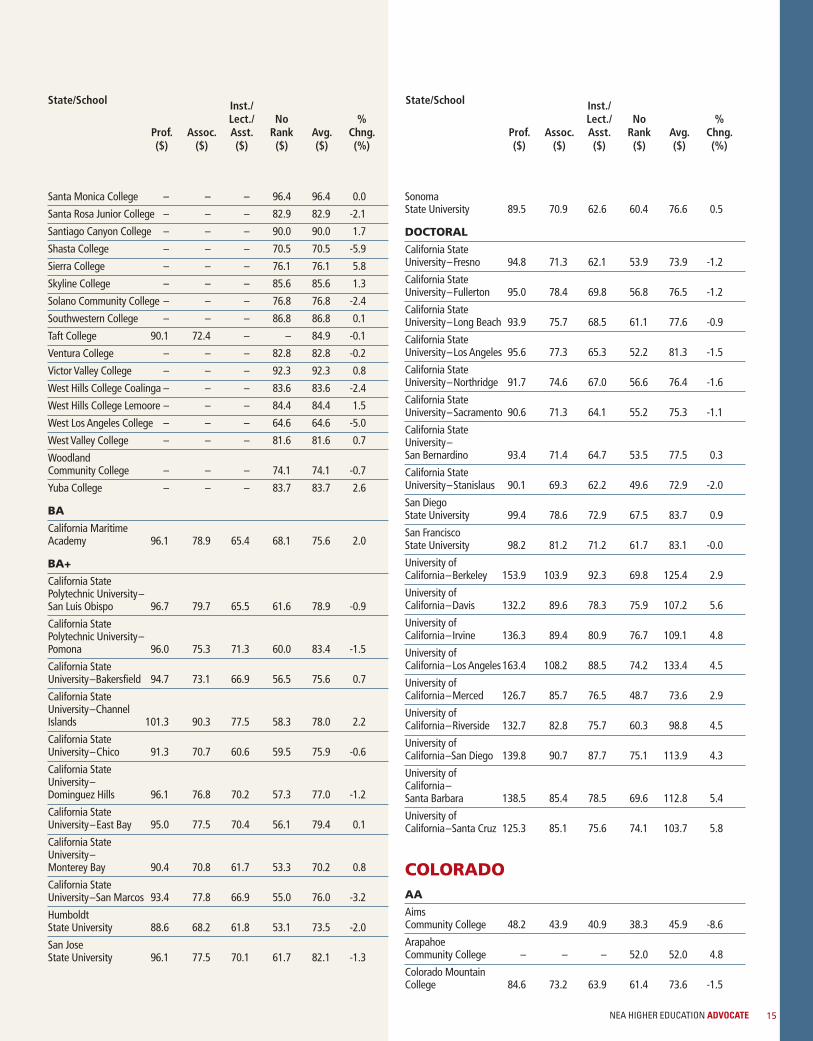
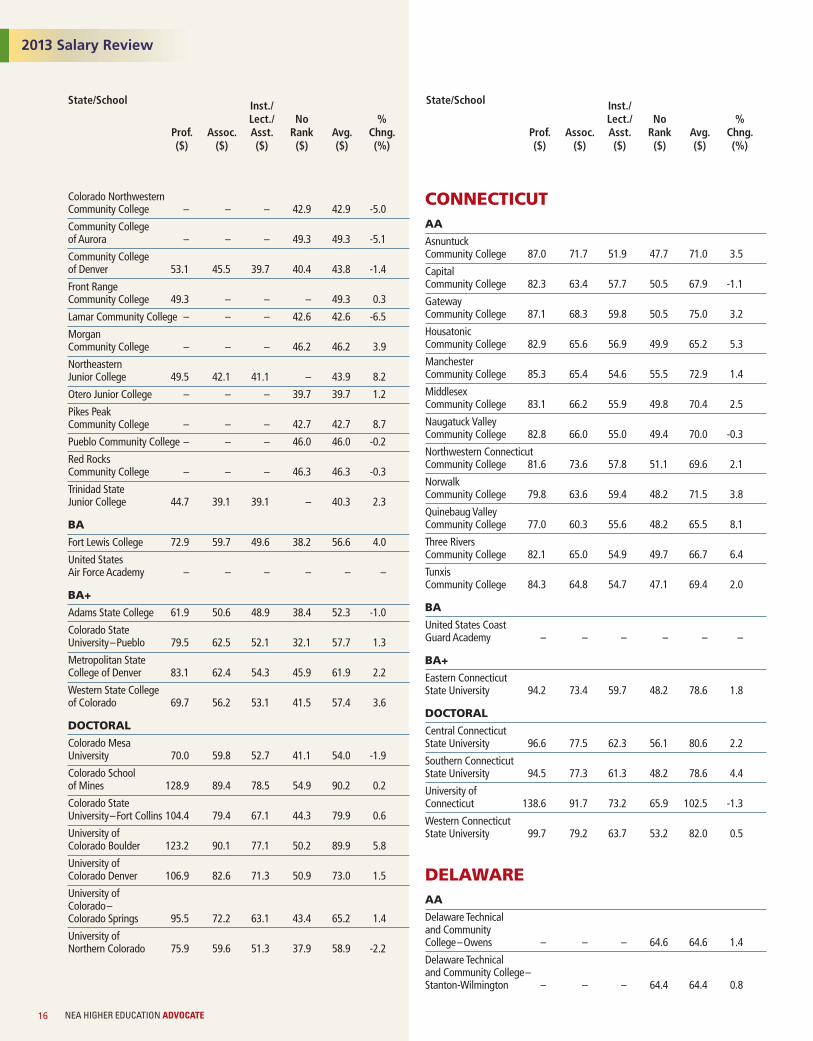
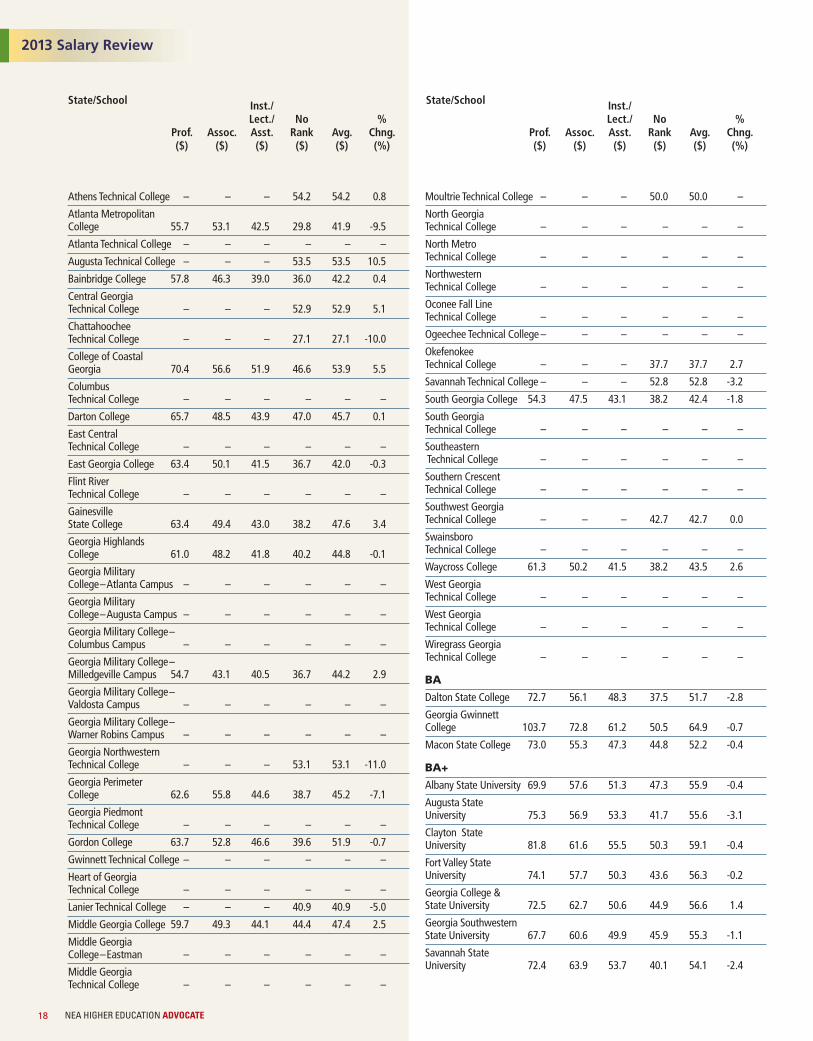
2013 Salary Review
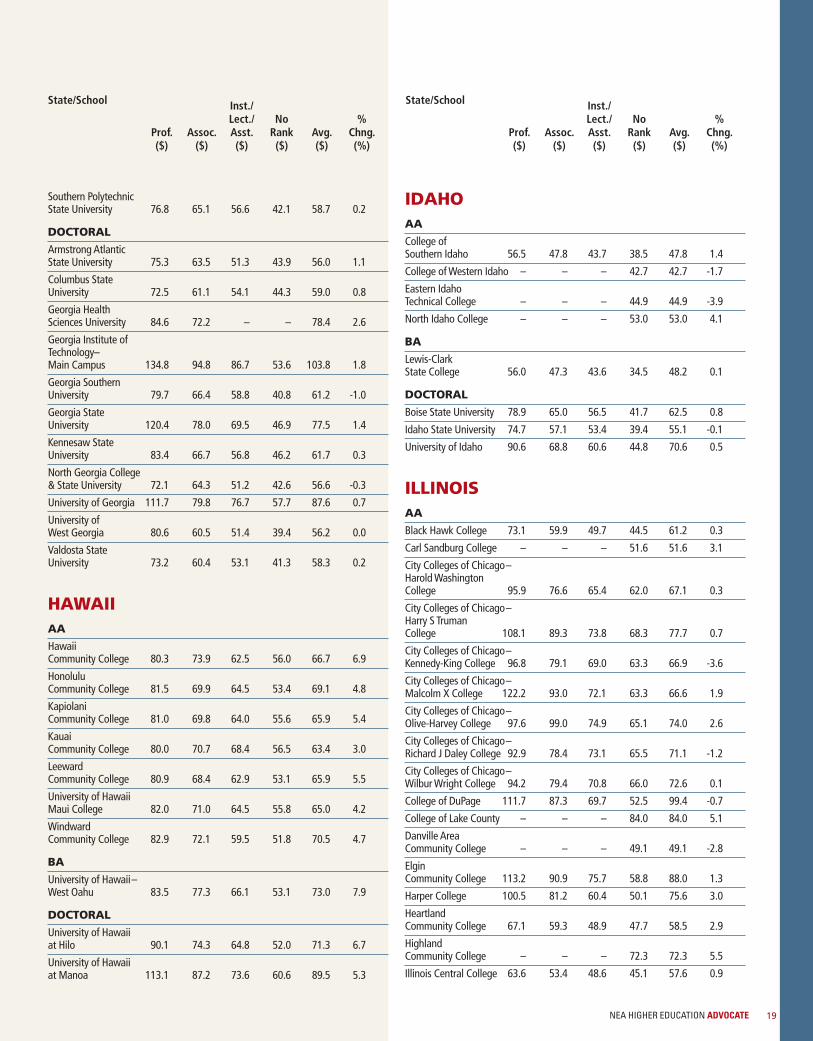
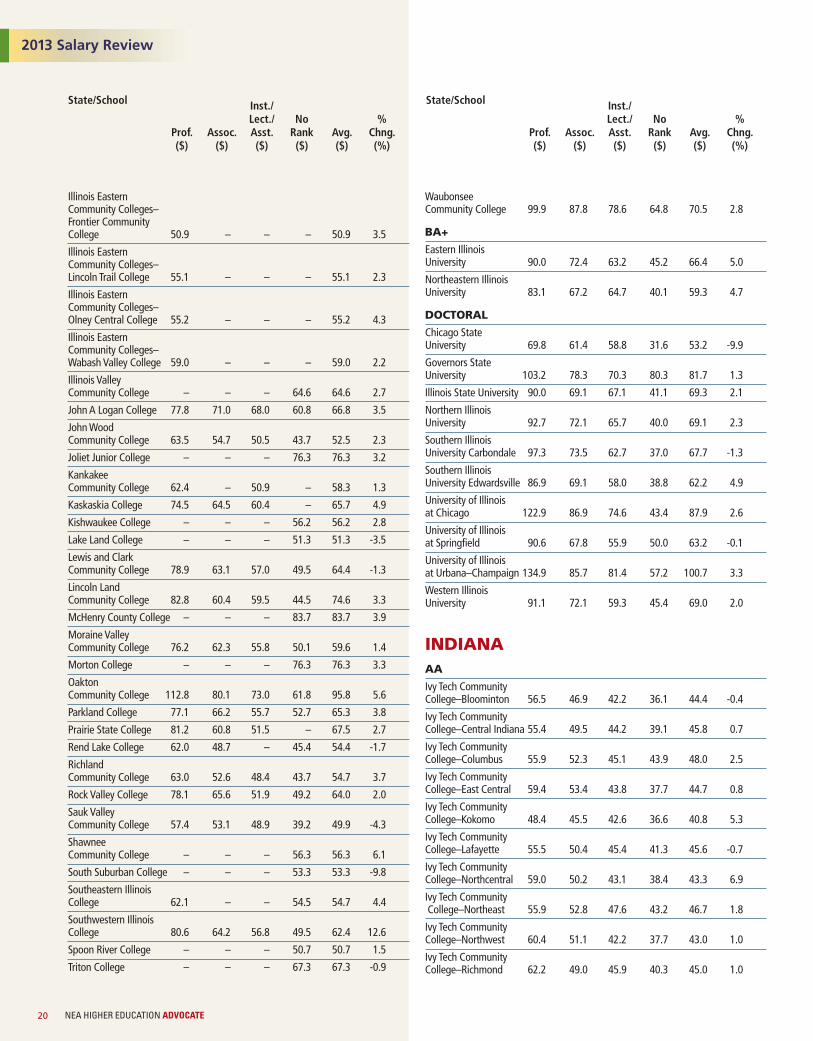
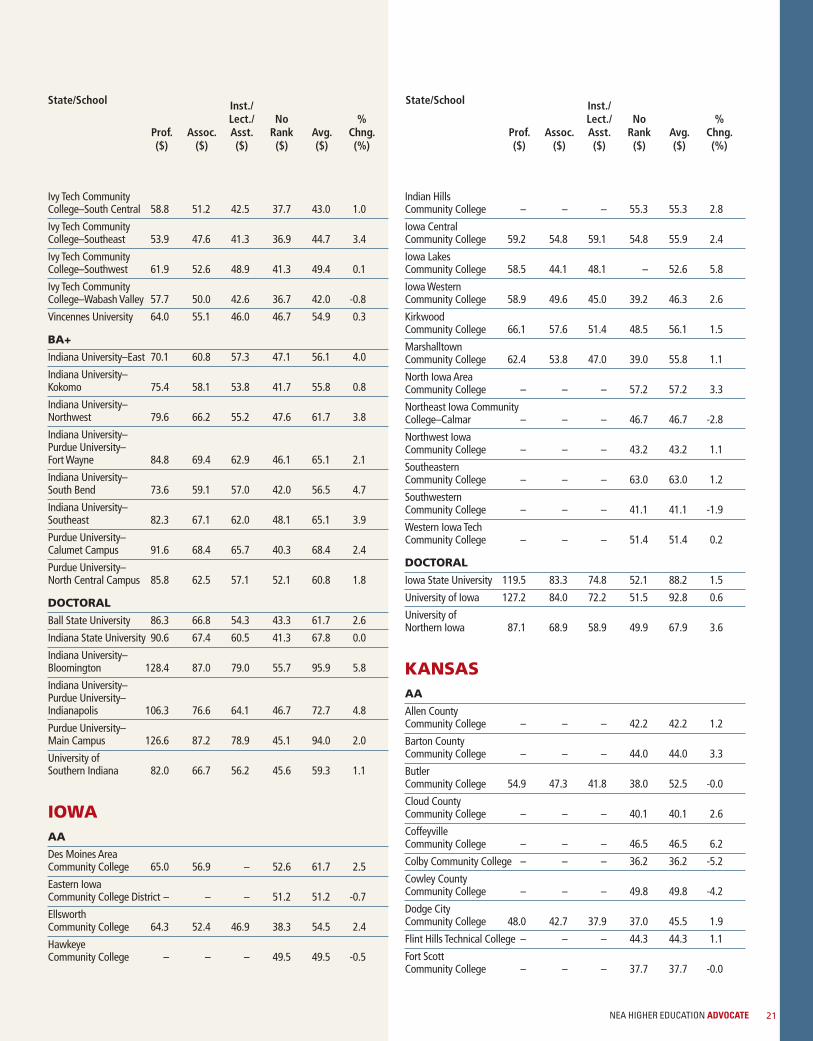
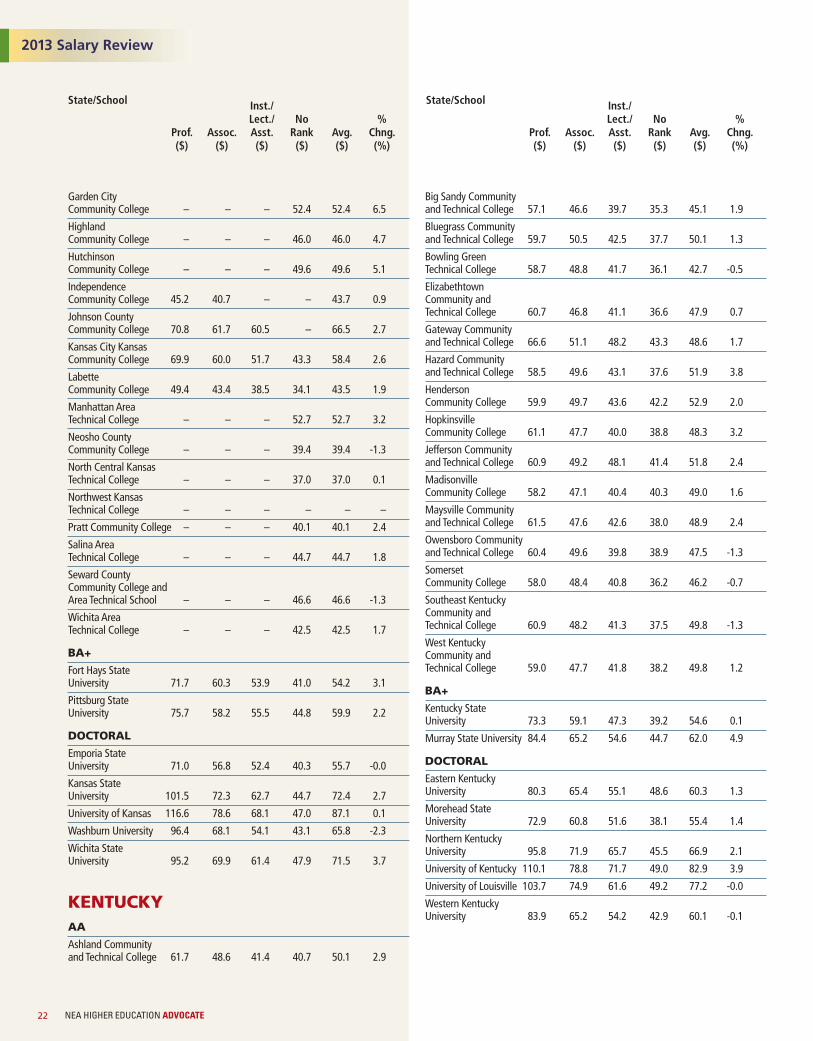
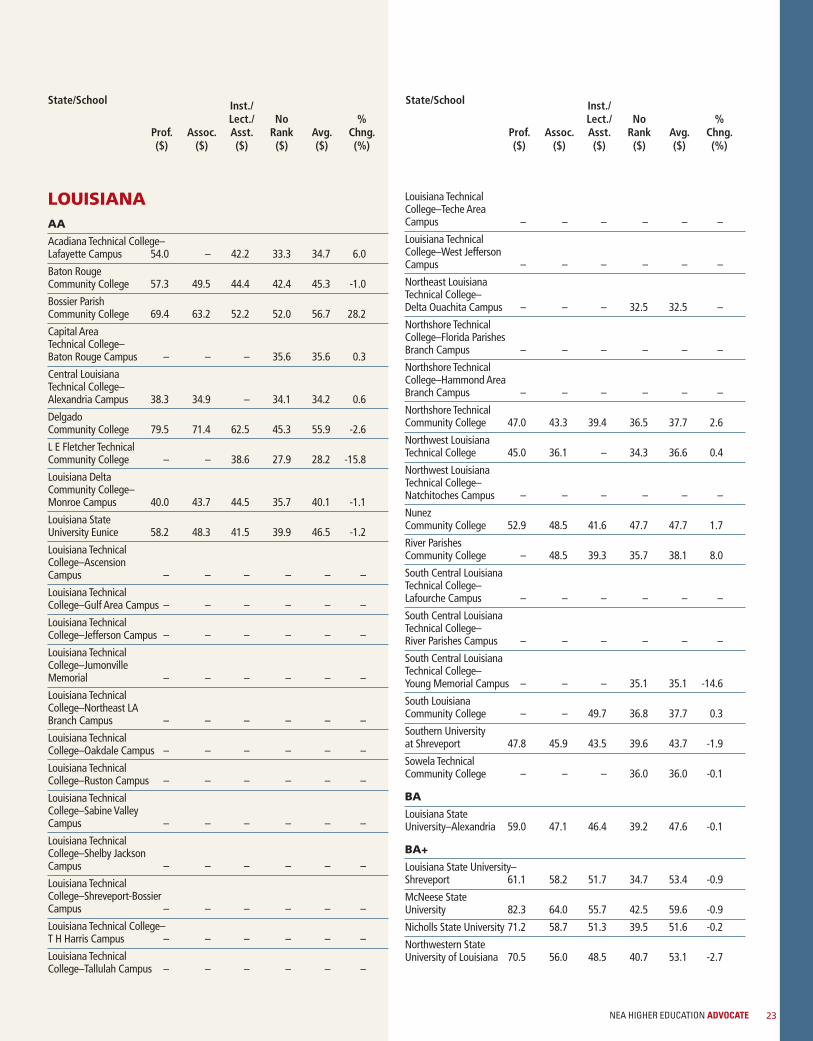
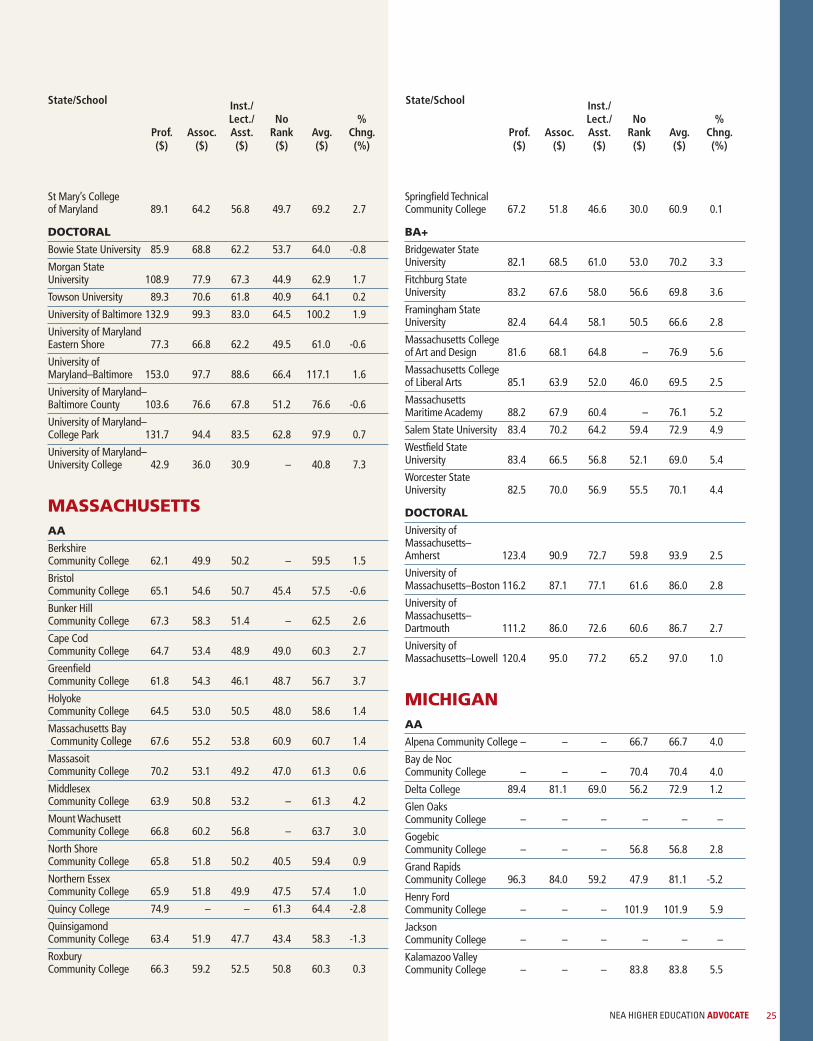
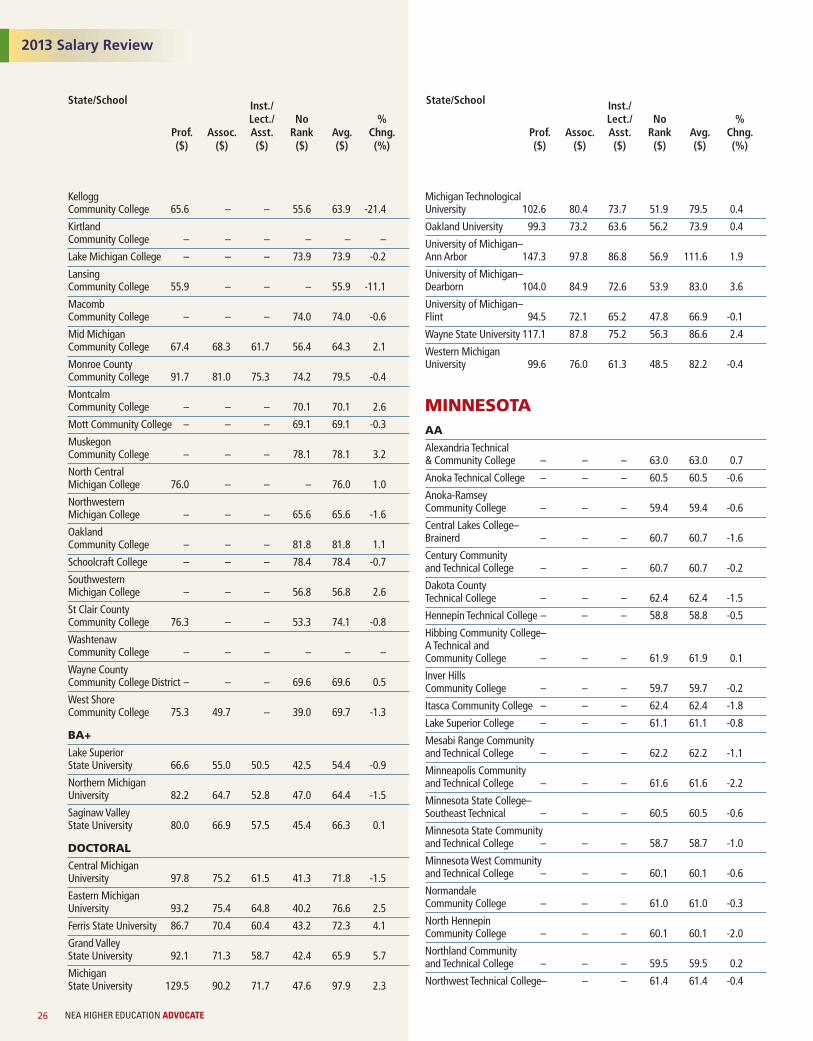
2011–12 Faculty Salary ReportThe 2011–12 institutional faculty salary report provides salary and compensation information for the 1,640 public institutionsin NEA’s faculty salary universe. The data are organized by state, institutional type, and control. The data are provided bythe U.S. Department of Education, National Center for Education Statistics, Integrated Postsecondary Education Data System’sPreliminary Salary Data for 2011–12.
The detailed data reported are for faculty on 9/10 month contracts only. Changes in average faculty salaries are reportedonly for institutions responding to the NCES Salary Surveys in both 2010–11 and 2011–12. All dollar amounts are reported inthousands of dollars.
Definitions for the institutional report column headings are as follows:PROF ($): Average salary for professors on 9/10 month contracts, in thousands of dollars.ASSC ($): Average salary for associate professors on 9/10 month contracts, in thousands of dollars.ASST ($): Average salary for assistant professors on 9/10 month contracts, in thousands of dollars.INST/LECT/NO RANK ($): Average salary for instructors, lecturers, and faculty with no rank on 9/10month contracts, in thousands of dollars.AVG ($): Average salary for all faculty on 9/10 month contracts, in thousands of dollars.% CHG (%): Percent change in average faculty salary from 2008-09 to 2009-10.
AVG BENE ($): Average benefits for faculty on 9/10 month contracts, in thousands of dollars.
† Beginning in academic year 2001-02, the number of faculty and percent of faculty tenured are collected by the U.S. Department of Education on two different surveys. The definitions of faculty onthe two surveys are not the same and may not appear congruous. The number of faculty reported reflects those whose activities include at least 50 percent of their time in the classroom. The percentof faculty tenured reflects any staff member with faculty status (this includes librarians, counselors, etc).
ALABAMAAA
Alabama Southern Community College – – – 52.3 52.3 0.1
Bevill State Community College – – – 54.5 54.5 -2.8
Bishop State Community College – – – 54.8 54.8 -0.8
Central Alabama Community College – – – 53.8 53.8 -0.8
Chattahoochee Valley Community College – – – 53.8 53.8 -2.0
Enterprise State Community College – – – 51.9 51.9 0.9
Gadsden State Community College – – – 54.0 54.0 0.9
George C Wallace State Community College–Dothan – – – 50.9 50.9 -0.1
George C Wallace State Community College–Hanceville – – – 52.5 52.5 0.5
George C Wallace State Community College–Selma – – – 50.9 50.9 1.6
H Councill Trenholm State Technical College – – – 52.4 52.4 -0.6
J F Drake State Technical College – – – 50.8 50.8 -5.0
J F Ingram State Technical College – – – 48.4 48.4 0.6
James H Faulkner State Community College – – – 53.4 53.4 0.2
Jefferson Davis Community College – – – 52.5 52.5 -0.5
Jefferson State Community College – – – 53.9 53.9 1.3
John C Calhoun StateCommunity College – – – 54.5 54.5 0.6
Lawson State Community College–Birmingham Campus – – – 54.2 54.2 0.5
Lurleen B Wallace Community College – – – 50.9 50.9 -0.5
Marion Military Institute – – – 52.6 52.6 1.9
Northeast Alabama Community College – – – 54.5 54.5 -1.7
Northwest Shoals Community College–Muscle Shoals – – – 55.2 55.2 1.7
State/School
Prof.($)
Assoc.($)
Inst./Lect./Asst.($)
NoRank($)
Avg.($)
%Chng.(%)
State/School
Prof.($)
Assoc.($)
Inst./Lect./Asst.($)
NoRank($)
Avg.($)
%Chng.(%)
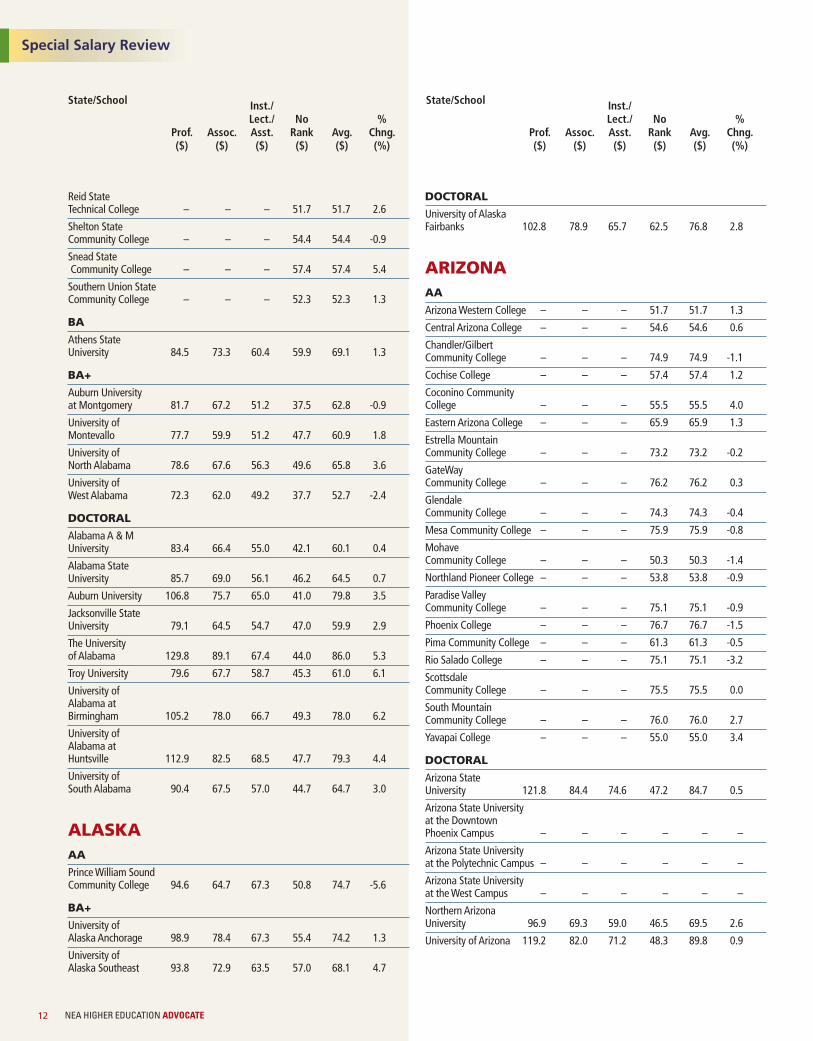
2013 Salary Review
NEA HIGHER EDUCATION ADVOCATE12
Reid State Technical College – – – 51.7 51.7 2.6
Shelton State Community College – – – 54.4 54.4 -0.9
Snead StateCommunity College – – – 57.4 57.4 5.4
Southern Union State Community College – – – 52.3 52.3 1.3
BA
Athens State University 84.5 73.3 60.4 59.9 69.1 1.3
BA+
Auburn University at Montgomery 81.7 67.2 51.2 37.5 62.8 -0.9
University of Montevallo 77.7 59.9 51.2 47.7 60.9 1.8
University of North Alabama 78.6 67.6 56.3 49.6 65.8 3.6
University of West Alabama 72.3 62.0 49.2 37.7 52.7 -2.4
DOCTORAL
Alabama A & M University 83.4 66.4 55.0 42.1 60.1 0.4
Alabama State University 85.7 69.0 56.1 46.2 64.5 0.7
Auburn University 106.8 75.7 65.0 41.0 79.8 3.5
Jacksonville State University 79.1 64.5 54.7 47.0 59.9 2.9
The University of Alabama 129.8 89.1 67.4 44.0 86.0 5.3
Troy University 79.6 67.7 58.7 45.3 61.0 6.1
University of Alabama at Birmingham 105.2 78.0 66.7 49.3 78.0 6.2
University of Alabama at Huntsville 112.9 82.5 68.5 47.7 79.3 4.4
University of South Alabama 90.4 67.5 57.0 44.7 64.7 3.0
ALASKAAA
Prince William Sound Community College 94.6 64.7 67.3 50.8 74.7 -5.6
BA+
University of Alaska Anchorage 98.9 78.4 67.3 55.4 74.2 1.3
University of Alaska Southeast 93.8 72.9 63.5 57.0 68.1 4.7
DOCTORAL
University of Alaska Fairbanks 102.8 78.9 65.7 62.5 76.8 2.8
ARIZONAAA
Arizona Western College – – – 51.7 51.7 1.3
Central Arizona College – – – 54.6 54.6 0.6
Chandler/Gilbert Community College – – – 74.9 74.9 -1.1
Cochise College – – – 57.4 57.4 1.2
Coconino Community College – – – 55.5 55.5 4.0
Eastern Arizona College – – – 65.9 65.9 1.3
Estrella Mountain Community College – – – 73.2 73.2 -0.2
GateWay Community College – – – 76.2 76.2 0.3
Glendale Community College – – – 74.3 74.3 -0.4
Mesa Community College – – – 75.9 75.9 -0.8
Mohave Community College – – – 50.3 50.3 -1.4
Northland Pioneer College – – – 53.8 53.8 -0.9
Paradise Valley Community College – – – 75.1 75.1 -0.9
Phoenix College – – – 76.7 76.7 -1.5
Pima Community College – – – 61.3 61.3 -0.5
Rio Salado College – – – 75.1 75.1 -3.2
Scottsdale Community College – – – 75.5 75.5 0.0
South Mountain Community College – – – 76.0 76.0 2.7
Yavapai College – – – 55.0 55.0 3.4
DOCTORAL
Arizona State University 121.8 84.4 74.6 47.2 84.7 0.5
Arizona State University at the Downtown Phoenix Campus – – – – – –
Arizona State University at the Polytechnic Campus – – – – – –
Arizona State University at the West Campus – – – – – –
Northern Arizona University 96.9 69.3 59.0 46.5 69.5 2.6
University of Arizona 119.2 82.0 71.2 48.3 89.8 0.9
Special Salary Review
State/School
Prof.($)
Assoc.($)
Inst./Lect./Asst.($)
NoRank($)
Avg.($)
%Chng.(%)
State/School
Prof.($)
Assoc.($)
Inst./Lect./Asst.($)
NoRank($)
Avg.($)
%Chng.(%)
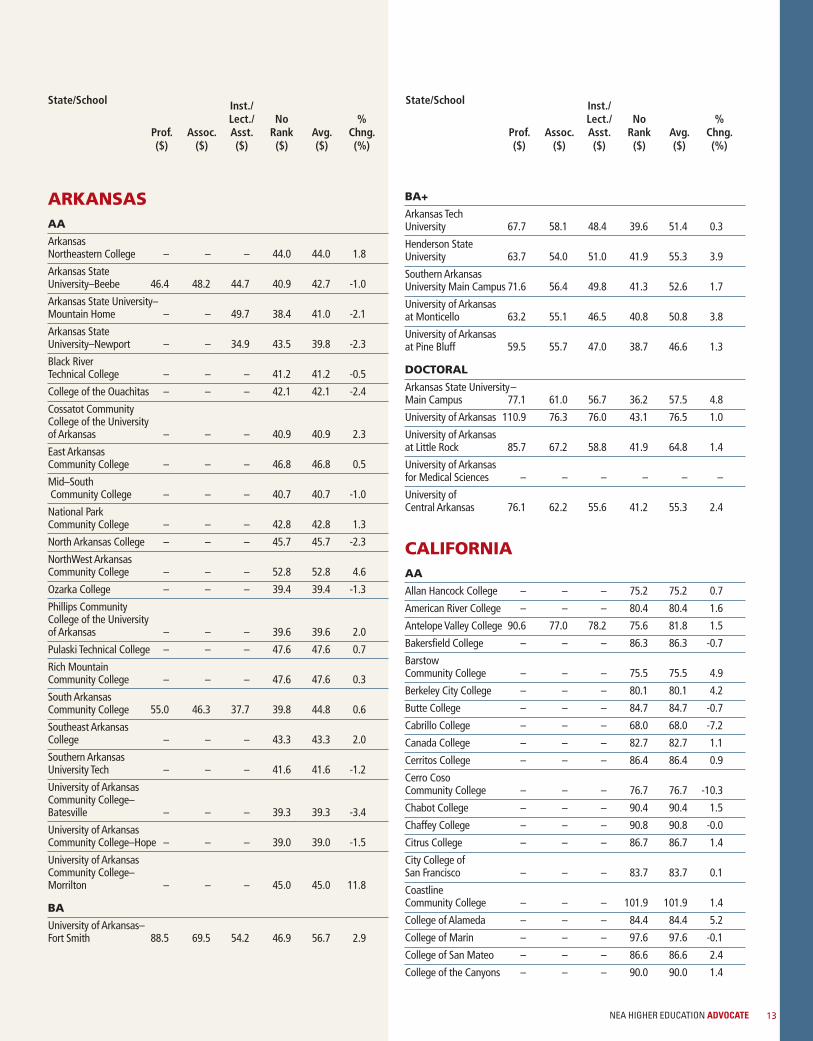
NEA HIGHER EDUCATION ADVOCATE 13
ARKANSASAA
Arkansas Northeastern College – – – 44.0 44.0 1.8
Arkansas State University–Beebe 46.4 48.2 44.7 40.9 42.7 -1.0
Arkansas State University–Mountain Home – – 49.7 38.4 41.0 -2.1
Arkansas State University–Newport – – 34.9 43.5 39.8 -2.3
Black River Technical College – – – 41.2 41.2 -0.5
College of the Ouachitas – – – 42.1 42.1 -2.4
Cossatot Community College of the University of Arkansas – – – 40.9 40.9 2.3
East Arkansas Community College – – – 46.8 46.8 0.5
Mid–SouthCommunity College – – – 40.7 40.7 -1.0
National Park Community College – – – 42.8 42.8 1.3
North Arkansas College – – – 45.7 45.7 -2.3
NorthWest Arkansas Community College – – – 52.8 52.8 4.6
Ozarka College – – – 39.4 39.4 -1.3
Phillips Community College of the University of Arkansas – – – 39.6 39.6 2.0
Pulaski Technical College – – – 47.6 47.6 0.7
Rich Mountain Community College – – – 47.6 47.6 0.3
South Arkansas Community College 55.0 46.3 37.7 39.8 44.8 0.6
Southeast Arkansas College – – – 43.3 43.3 2.0
Southern Arkansas University Tech – – – 41.6 41.6 -1.2
University of Arkansas Community College–Batesville – – – 39.3 39.3 -3.4
University of Arkansas Community College–Hope – – – 39.0 39.0 -1.5
University of Arkansas Community College–Morrilton – – – 45.0 45.0 11.8
BA
University of Arkansas–Fort Smith 88.5 69.5 54.2 46.9 56.7 2.9
BA+
Arkansas Tech University 67.7 58.1 48.4 39.6 51.4 0.3
Henderson State University 63.7 54.0 51.0 41.9 55.3 3.9
Southern Arkansas University Main Campus 71.6 56.4 49.8 41.3 52.6 1.7
University of Arkansas at Monticello 63.2 55.1 46.5 40.8 50.8 3.8
University of Arkansas at Pine Bluff 59.5 55.7 47.0 38.7 46.6 1.3
DOCTORAL
Arkansas State University–Main Campus 77.1 61.0 56.7 36.2 57.5 4.8
University of Arkansas 110.9 76.3 76.0 43.1 76.5 1.0
University of Arkansas at Little Rock 85.7 67.2 58.8 41.9 64.8 1.4
University of Arkansas for Medical Sciences – – – – – –
University of Central Arkansas 76.1 62.2 55.6 41.2 55.3 2.4
CALIFORNIAAA
Allan Hancock College – – – 75.2 75.2 0.7
American River College – – – 80.4 80.4 1.6
Antelope Valley College 90.6 77.0 78.2 75.6 81.8 1.5
Bakersfield College – – – 86.3 86.3 -0.7
Barstow Community College – – – 75.5 75.5 4.9
Berkeley City College – – – 80.1 80.1 4.2
Butte College – – – 84.7 84.7 -0.7
Cabrillo College – – – 68.0 68.0 -7.2
Canada College – – – 82.7 82.7 1.1
Cerritos College – – – 86.4 86.4 0.9
Cerro Coso Community College – – – 76.7 76.7 -10.3
Chabot College – – – 90.4 90.4 1.5
Chaffey College – – – 90.8 90.8 -0.0
Citrus College – – – 86.7 86.7 1.4
City College of San Francisco – – – 83.7 83.7 0.1
Coastline Community College – – – 101.9 101.9 1.4
College of Alameda – – – 84.4 84.4 5.2
College of Marin – – – 97.6 97.6 -0.1
College of San Mateo – – – 86.6 86.6 2.4
College of the Canyons – – – 90.0 90.0 1.4
State/School
Prof.($)
Assoc.($)
Inst./Lect./Asst.($)
NoRank($)
Avg.($)
%Chng.(%)
State/School
Prof.($)
Assoc.($)
Inst./Lect./Asst.($)
NoRank($)
Avg.($)
%Chng.(%)
College of the Desert 95.7 90.0 76.2 70.1 88.1 1.1
College of the Redwoods – – – 89.4 89.4 0.1
College of the Sequoias – – – 87.8 87.8 2.6
College of the Siskiyous – – – 70.9 70.9 1.9
Columbia College – – – 84.2 84.2 19.7
Contra Costa College – – – 86.7 86.7 0.8
Copper Mountain Community College – – – 70.7 70.7 -5.2
Cosumnes River College – – – 80.5 80.5 0.6
Crafton Hills College – – – 79.2 79.2 -0.8
Cuesta College – – – 77.9 77.9 2.3
Cuyamaca College – – – 81.0 81.0 2.4
Cypress College – – – 105.6 105.6 0.6
De Anza College – – – 90.7 90.7 8.1
Diablo Valley College – – – 88.0 88.0 0.7
East Los Angeles College – – – 65.4 65.4 -2.0
East San Gabriel Valley Regional Occupational Program – – – – – –
El Camino College–Compton Center 85.4 82.4 76.2 65.4 80.3 -4.1
El Camino Community College District – – – 87.0 87.0 1.3
Evergreen Valley College – – – 84.3 84.3 -1.2
Feather River Community College District – – – 78.1 78.1 2.2
Folsom Lake College – – – 78.6 78.6 2.1
Foothill College – – – 90.4 90.4 2.4
Fresno City College – – – 92.5 92.5 0.3
Fullerton College – – – 106.6 106.6 0.9
Gavilan College – – – 88.4 88.4 3.5
Glendale Community College – – – 83.6 83.6 4.1
Golden West College – – – 98.3 98.3 0.4
Grossmont College – – – 77.9 77.9 -0.4
Hartnell College – – – 82.6 82.6 0.4
Imperial Valley College – – – – – –
Irvine Valley College – – – 89.5 89.5 -2.1
Lake Tahoe Community College – – – 70.2 70.2 -2.5
Laney College – – – 80.7 80.7 1.4
Las Positas College – – – 89.7 89.7 1.5
Lassen Community College – – – 68.4 68.4 -2.9
Long Beach City College – – – 88.3 88.3 2.0
Los Angeles City College – – – 70.6 70.6 0.0
Los Angeles County College of Nursing and Allied Health – – – – – –
Los Angeles Harbor College – – – 69.3 69.3 -6.0
Los Angeles Mission College – – – 60.1 60.1 3.1
Los Angeles Pierce College – – – 65.9 65.9 -2.4
Los Angeles Southwest College – – – 59.1 59.1 -7.0
Los Angeles Trade Technical College – – – 74.0 74.0 0.7
Los Angeles Valley College – – – 74.0 74.0 2.0
Los Medanos College – – – 83.5 83.5 0.0
Mendocino College – – – 87.0 87.0 18.4
Merced College – – – 80.4 80.4 -1.0
Merritt College – – – 80.0 80.0 1.8
MiraCosta College – – – 117.2 117.2 1.5
Mission College – – – 81.6 81.6 -0.8
Modesto Junior College – – – 84.6 84.6 8.3
MontereyPeninsulaCollege – – – 80.5 80.5 -2.3
Moorpark College – – – 82.4 82.4 0.1
Moreno Valley College – – – 90.8 90.8 4.0
Mt. San Antonio College – – – 90.9 90.9 7.1
Mt. San Jacinto Community College District – – – 83.7 83.7 -0.8
Napa Valley College – – – 79.9 79.9 3.5
Norco College – – – 92.9 92.9 1.8
Ohlone Community College – – – 101.6 101.6 3.0
Orange Coast College – – – 96.4 96.4 0.7
Oxnard College – – – 87.0 87.0 -0.2
Palo Verde College – – – 74.7 74.7 1.2
Palomar College – – – 93.3 93.3 -0.1
Pasadena City College – – – 85.3 85.3 3.1
Peralta Community College System Office – – – – – –
Porterville College – – – 85.4 85.4 -3.5
Reedley College – – – 90.4 90.4 0.7
Rio Hondo College – – – 87.9 87.9 -0.0
Riverside City College – – – 93.2 93.2 6.1
Sacramento City College – – – 79.8 79.8 1.3
Saddleback College – – – 92.4 92.4 -0.4
San Bernardino Valley College – – – 72.6 72.6 -8.3
San Diego City College – – – 68.9 68.9 2.4
San Diego Mesa College – – – 74.9 74.9 5.0
San Diego Miramar College – – – 66.9 66.9 -7.1
San Joaquin Delta College – – – 90.9 90.9 0.4
San Jose City College – – – 87.6 87.6 0.6
Santa Ana College – – – 92.3 92.3 0.9
Santa Barbara City College – – – 82.9 82.9 0.6
2013 Salary Review
State/School
NEA HIGHER EDUCATION ADVOCATE14
Prof.($)
Assoc.($)
Inst./Lect./Asst.($)
NoRank($)
Avg.($)
%Chng.(%)
State/School
Prof.($)
Assoc.($)
Inst./Lect./Asst.($)
NoRank($)
Avg.($)
%Chng.(%)
NEA HIGHER EDUCATION ADVOCATE 15
Santa Monica College – – – 96.4 96.4 0.0
Santa Rosa Junior College – – – 82.9 82.9 -2.1
Santiago Canyon College – – – 90.0 90.0 1.7
Shasta College – – – 70.5 70.5 -5.9
Sierra College – – – 76.1 76.1 5.8
Skyline College – – – 85.6 85.6 1.3
Solano Community College – – – 76.8 76.8 -2.4
Southwestern College – – – 86.8 86.8 0.1
Taft College 90.1 72.4 – – 84.9 -0.1
Ventura College – – – 82.8 82.8 -0.2
Victor Valley College – – – 92.3 92.3 0.8
West Hills College Coalinga – – – 83.6 83.6 -2.4
West Hills College Lemoore – – – 84.4 84.4 1.5
West Los Angeles College – – – 64.6 64.6 -5.0
West Valley College – – – 81.6 81.6 0.7
Woodland Community College – – – 74.1 74.1 -0.7
Yuba College – – – 83.7 83.7 2.6
BA
California Maritime Academy 96.1 78.9 65.4 68.1 75.6 2.0
BA+
California State Polytechnic University–San Luis Obispo 96.7 79.7 65.5 61.6 78.9 -0.9
California State Polytechnic University–Pomona 96.0 75.3 71.3 60.0 83.4 -1.5
California State University–Bakersfield 94.7 73.1 66.9 56.5 75.6 0.7
California State University–Channel Islands 101.3 90.3 77.5 58.3 78.0 2.2
California State University–Chico 91.3 70.7 60.6 59.5 75.9 -0.6
California State University–Dominguez Hills 96.1 76.8 70.2 57.3 77.0 -1.2
California State University–East Bay 95.0 77.5 70.4 56.1 79.4 0.1
California State University–Monterey Bay 90.4 70.8 61.7 53.3 70.2 0.8
California State University–San Marcos 93.4 77.8 66.9 55.0 76.0 -3.2
Humboldt State University 88.6 68.2 61.8 53.1 73.5 -2.0
San Jose State University 96.1 77.5 70.1 61.7 82.1 -1.3
Sonoma State University 89.5 70.9 62.6 60.4 76.6 0.5
DOCTORAL
California State University–Fresno 94.8 71.3 62.1 53.9 73.9 -1.2
California State University–Fullerton 95.0 78.4 69.8 56.8 76.5 -1.2
California State University–Long Beach 93.9 75.7 68.5 61.1 77.6 -0.9
California State University–Los Angeles 95.6 77.3 65.3 52.2 81.3 -1.5
California State University–Northridge 91.7 74.6 67.0 56.6 76.4 -1.6
California State University–Sacramento 90.6 71.3 64.1 55.2 75.3 -1.1
California State University–San Bernardino 93.4 71.4 64.7 53.5 77.5 0.3
California State University–Stanislaus 90.1 69.3 62.2 49.6 72.9 -2.0
San Diego State University 99.4 78.6 72.9 67.5 83.7 0.9
San Francisco State University 98.2 81.2 71.2 61.7 83.1 -0.0
University of California–Berkeley 153.9 103.9 92.3 69.8 125.4 2.9
University of California–Davis 132.2 89.6 78.3 75.9 107.2 5.6
University of California–Irvine 136.3 89.4 80.9 76.7 109.1 4.8
University of California–Los Angeles163.4 108.2 88.5 74.2 133.4 4.5
University of California–Merced 126.7 85.7 76.5 48.7 73.6 2.9
University of California–Riverside 132.7 82.8 75.7 60.3 98.8 4.5
University of California–San Diego 139.8 90.7 87.7 75.1 113.9 4.3
University of California–Santa Barbara 138.5 85.4 78.5 69.6 112.8 5.4
University of California–Santa Cruz 125.3 85.1 75.6 74.1 103.7 5.8
COLORADOAA
Aims Community College 48.2 43.9 40.9 38.3 45.9 -8.6
Arapahoe Community College – – – 52.0 52.0 4.8
Colorado Mountain College 84.6 73.2 63.9 61.4 73.6 -1.5
State/School
Prof.($)
Assoc.($)
Inst./Lect./Asst.($)
NoRank($)
Avg.($)
%Chng.(%)
State/School
Prof.($)
Assoc.($)
Inst./Lect./Asst.($)
NoRank($)
Avg.($)
%Chng.(%)
2013 Salary Review
NEA HIGHER EDUCATION ADVOCATE16
Colorado Northwestern Community College – – – 42.9 42.9 -5.0
Community College of Aurora – – – 49.3 49.3 -5.1
Community College of Denver 53.1 45.5 39.7 40.4 43.8 -1.4
Front Range Community College 49.3 – – – 49.3 0.3
Lamar Community College – – – 42.6 42.6 -6.5
Morgan Community College – – – 46.2 46.2 3.9
Northeastern Junior College 49.5 42.1 41.1 – 43.9 8.2
Otero Junior College – – – 39.7 39.7 1.2
Pikes Peak Community College – – – 42.7 42.7 8.7
Pueblo Community College – – – 46.0 46.0 -0.2
Red Rocks Community College – – – 46.3 46.3 -0.3
Trinidad State Junior College 44.7 39.1 39.1 – 40.3 2.3
BA
Fort Lewis College 72.9 59.7 49.6 38.2 56.6 4.0
United States Air Force Academy – – – – – –
BA+
Adams State College 61.9 50.6 48.9 38.4 52.3 -1.0
Colorado State University–Pueblo 79.5 62.5 52.1 32.1 57.7 1.3
Metropolitan State College of Denver 83.1 62.4 54.3 45.9 61.9 2.2
Western State College of Colorado 69.7 56.2 53.1 41.5 57.4 3.6
DOCTORAL
Colorado Mesa University 70.0 59.8 52.7 41.1 54.0 -1.9
Colorado School of Mines 128.9 89.4 78.5 54.9 90.2 0.2
Colorado State University–Fort Collins 104.4 79.4 67.1 44.3 79.9 0.6
University of Colorado Boulder 123.2 90.1 77.1 50.2 89.9 5.8
University of Colorado Denver 106.9 82.6 71.3 50.9 73.0 1.5
University of Colorado–Colorado Springs 95.5 72.2 63.1 43.4 65.2 1.4
University of Northern Colorado 75.9 59.6 51.3 37.9 58.9 -2.2
CONNECTICUTAA
Asnuntuck Community College 87.0 71.7 51.9 47.7 71.0 3.5
Capital Community College 82.3 63.4 57.7 50.5 67.9 -1.1
Gateway Community College 87.1 68.3 59.8 50.5 75.0 3.2
Housatonic Community College 82.9 65.6 56.9 49.9 65.2 5.3
Manchester Community College 85.3 65.4 54.6 55.5 72.9 1.4
Middlesex Community College 83.1 66.2 55.9 49.8 70.4 2.5
Naugatuck Valley Community College 82.8 66.0 55.0 49.4 70.0 -0.3
Northwestern Connecticut Community College 81.6 73.6 57.8 51.1 69.6 2.1
Norwalk Community College 79.8 63.6 59.4 48.2 71.5 3.8
Quinebaug Valley Community College 77.0 60.3 55.6 48.2 65.5 8.1
Three Rivers Community College 82.1 65.0 54.9 49.7 66.7 6.4
Tunxis Community College 84.3 64.8 54.7 47.1 69.4 2.0
BA
United States Coast Guard Academy – – – – – –
BA+
Eastern Connecticut State University 94.2 73.4 59.7 48.2 78.6 1.8
DOCTORAL
Central Connecticut State University 96.6 77.5 62.3 56.1 80.6 2.2
Southern Connecticut State University 94.5 77.3 61.3 48.2 78.6 4.4
University of Connecticut 138.6 91.7 73.2 65.9 102.5 -1.3
Western Connecticut State University 99.7 79.2 63.7 53.2 82.0 0.5
DELAWAREAA
Delaware Technical and Community College–Owens – – – 64.6 64.6 1.4
Delaware Technical and Community College–Stanton-Wilmington – – – 64.4 64.4 0.8
State/School
Prof.($)
Assoc.($)
Inst./Lect./Asst.($)
NoRank($)
Avg.($)
%Chng.(%)
State/School
Prof.($)
Assoc.($)
Inst./Lect./Asst.($)
NoRank($)
Avg.($)
%Chng.(%)

NEA HIGHER EDUCATION ADVOCATE 17
Delaware Technical and Community College–Terry – – – 63.5 63.5 -0.2
DOCTORAL
Delaware State University 78.6 64.3 59.1 47.2 63.6 -3.6
University of Delaware 139.2 94.7 82.0 66.1 104.0 4.0
DISTRICT OF COLUMBIABA+
University of the District of Columbia 101.1 79.5 61.9 57.0 83.2 4.0
FLORIDAAA
Brevard Community College 63.6 60.0 51.0 42.5 53.2 -0.9
Broward College 71.4 63.2 54.9 41.5 56.3 -0.5
Chipola College 55.2 49.4 47.7 42.7 48.6 0.5
College of Central Florida 60.6 49.8 43.2 38.1 49.2 3.9
Daytona State College 58.5 55.3 52.0 60.6 55.8 -15.0
Edison State College – – – 54.2 54.2 -2.0
Florida Gateway College – – – 47.9 47.9 3.3
Florida Keys Community College 65.9 65.9 62.3 59.6 62.9 0.4
Florida State College at Jacksonville 48.9 45.6 44.4 42.1 48.0 -0.8
Gulf Coast State College 65.2 53.1 44.4 41.8 47.3 2.4
Hillsborough Community College 65.2 55.5 56.6 49.1 52.1 0.1
Indian River State College 92.9 86.4 74.1 71.3 75.4 2.3
Lake–Sumter Community College 58.7 50.8 46.0 41.4 45.2 3.5
Miami Dade College 81.4 65.1 57.0 51.4 65.5 -1.1
North Florida Community College – – – 44.6 44.6 -0.6
Northwest Florida State College – – – 55.8 55.8 2.8
Palm Beach State College 67.2 59.7 55.3 55.1 56.7 0.4
Pasco–Hernando Community College 68.4 55.5 49.9 47.8 54.8 5.4
Pensacola State College 54.4 46.2 42.3 38.1 47.7 -2.1
Polk State College – – – 53.5 53.5 6.3
Saint Johns River State College 53.4 – – 51.0 51.0 3.5
Santa Fe College – – – 50.8 50.8 3.9
Seminole State College of Florida – – – 58.1 58.1 -0.3
South Florida Community College – – – 52.3 52.3 3.0
St Petersburg College – – – 65.3 65.3 5.3
State College of Florida–Manatee-Sarasota 69.6 58.2 48.6 45.9 53.8 2.3
Tallahassee Community College 67.0 – 59.5 47.0 58.5 1.0
Valencia College – – – 59.8 59.8 1.0
BA
New College of Florida 81.9 66.6 54.5 42.0 67.8 -0.4
BA+
University of South Florida Sarasota-Manatee 93.1 88.0 76.3 61.5 75.1 -0.6
University of South Florida–Polytechnic 124.4 89.1 76.3 66.4 79.7 0.4
University of South Florida–St. Petersburg Campus 111.8 79.8 60.4 57.1 75.6 2.1
DOCTORAL
Florida Agricultural and Mechanical University 90.4 74.3 60.4 46.0 68.4 1.7
Florida Atlantic University 96.0 72.2 65.1 46.7 71.5 0.3
Florida Gulf Coast University 87.3 70.3 59.2 41.8 62.0 2.0
Florida International University 113.5 82.6 75.5 56.0 81.8 -0.2
Florida State University 108.2 75.5 74.6 55.5 85.9 4.0
The University of West Florida 86.0 63.3 57.4 45.3 64.1 -1.3
University of Central Florida 117.0 79.8 65.4 49.6 74.0 3.0
University of Florida 125.6 81.7 76.8 52.0 91.8 1.3
University of North Florida 95.3 67.1 57.6 46.1 64.4 4.7
University of South Florida–Main Campus 111.0 79.3 70.0 49.6 82.1 2.5
GEORGIAAA
Abraham Baldwin Agricultural College 51.8 49.2 45.0 42.2 45.8 2.4
Albany Technical College – – – – – –
Altamaha Technical College – – – – – –
Appalachian Technical College – – – – – –
State/School
Prof.($)
Assoc.($)
Inst./Lect./Asst.($)
NoRank($)
Avg.($)
%Chng.(%)
State/School
Prof.($)
Assoc.($)
Inst./Lect./Asst.($)
NoRank($)
Avg.($)
%Chng.(%)
Athens Technical College – – – 54.2 54.2 0.8
Atlanta Metropolitan College 55.7 53.1 42.5 29.8 41.9 -9.5
Atlanta Technical College – – – – – –
Augusta Technical College – – – 53.5 53.5 10.5
Bainbridge College 57.8 46.3 39.0 36.0 42.2 0.4
Central Georgia Technical College – – – 52.9 52.9 5.1
Chattahoochee Technical College – – – 27.1 27.1 -10.0
College of Coastal Georgia 70.4 56.6 51.9 46.6 53.9 5.5
Columbus Technical College – – – – – –
Darton College 65.7 48.5 43.9 47.0 45.7 0.1
East Central Technical College – – – – – –
East Georgia College 63.4 50.1 41.5 36.7 42.0 -0.3
Flint River Technical College – – – – – –
Gainesville State College 63.4 49.4 43.0 38.2 47.6 3.4
Georgia Highlands College 61.0 48.2 41.8 40.2 44.8 -0.1
Georgia Military College–Atlanta Campus – – – – – –
Georgia Military College–Augusta Campus – – – – – –
Georgia Military College–Columbus Campus – – – – – –
Georgia Military College–Milledgeville Campus 54.7 43.1 40.5 36.7 44.2 2.9
Georgia Military College–Valdosta Campus – – – – – –
Georgia Military College–Warner Robins Campus – – – – – –
Georgia Northwestern Technical College – – – 53.1 53.1 -11.0
Georgia Perimeter College 62.6 55.8 44.6 38.7 45.2 -7.1
Georgia Piedmont Technical College – – – – – –
Gordon College 63.7 52.8 46.6 39.6 51.9 -0.7
Gwinnett Technical College – – – – – –
Heart of Georgia Technical College – – – – – –
Lanier Technical College – – – 40.9 40.9 -5.0
Middle Georgia College 59.7 49.3 44.1 44.4 47.4 2.5
Middle Georgia College–Eastman – – – – – –
Middle Georgia Technical College – – – – – –
Moultrie Technical College – – – 50.0 50.0 –
North Georgia Technical College – – – – – –
North Metro Technical College – – – – – –
Northwestern Technical College – – – – – –
Oconee Fall Line Technical College – – – – – –
Ogeechee Technical College– – – – – –
Okefenokee Technical College – – – 37.7 37.7 2.7
Savannah Technical College – – – 52.8 52.8 -3.2
South Georgia College 54.3 47.5 43.1 38.2 42.4 -1.8
South Georgia Technical College – – – – – –
SoutheasternTechnical College – – – – – –
Southern Crescent Technical College – – – – – –
Southwest Georgia Technical College – – – 42.7 42.7 0.0
Swainsboro Technical College – – – – – –
Waycross College 61.3 50.2 41.5 38.2 43.5 2.6
West Georgia Technical College – – – – – –
West Georgia Technical College – – – – – –
Wiregrass Georgia Technical College – – – – – –
BA
Dalton State College 72.7 56.1 48.3 37.5 51.7 -2.8
Georgia Gwinnett College 103.7 72.8 61.2 50.5 64.9 -0.7
Macon State College 73.0 55.3 47.3 44.8 52.2 -0.4
BA+
Albany State University 69.9 57.6 51.3 47.3 55.9 -0.4
Augusta State University 75.3 56.9 53.3 41.7 55.6 -3.1
Clayton State University 81.8 61.6 55.5 50.3 59.1 -0.4
Fort Valley State University 74.1 57.7 50.3 43.6 56.3 -0.2
Georgia College & State University 72.5 62.7 50.6 44.9 56.6 1.4
Georgia Southwestern State University 67.7 60.6 49.9 45.9 55.3 -1.1
Savannah State University 72.4 63.9 53.7 40.1 54.1 -2.4
2013 Salary Review
State/School
NEA HIGHER EDUCATION ADVOCATE18
Prof.($)
Assoc.($)
Inst./Lect./Asst.($)
NoRank($)
Avg.($)
%Chng.(%)
State/School
Prof.($)
Assoc.($)
Inst./Lect./Asst.($)
NoRank($)
Avg.($)
%Chng.(%)
NEA HIGHER EDUCATION ADVOCATE 19
Southern Polytechnic State University 76.8 65.1 56.6 42.1 58.7 0.2
DOCTORAL
Armstrong Atlantic State University 75.3 63.5 51.3 43.9 56.0 1.1
Columbus State University 72.5 61.1 54.1 44.3 59.0 0.8
Georgia Health Sciences University 84.6 72.2 – – 78.4 2.6
Georgia Institute of Technology–Main Campus 134.8 94.8 86.7 53.6 103.8 1.8
Georgia Southern University 79.7 66.4 58.8 40.8 61.2 -1.0
Georgia State University 120.4 78.0 69.5 46.9 77.5 1.4
Kennesaw State University 83.4 66.7 56.8 46.2 61.7 0.3
North Georgia College & State University 72.1 64.3 51.2 42.6 56.6 -0.3
University of Georgia 111.7 79.8 76.7 57.7 87.6 0.7
University of West Georgia 80.6 60.5 51.4 39.4 56.2 0.0
Valdosta State University 73.2 60.4 53.1 41.3 58.3 0.2
HAWAIIAA
Hawaii Community College 80.3 73.9 62.5 56.0 66.7 6.9
Honolulu Community College 81.5 69.9 64.5 53.4 69.1 4.8
Kapiolani Community College 81.0 69.8 64.0 55.6 65.9 5.4
Kauai Community College 80.0 70.7 68.4 56.5 63.4 3.0
Leeward Community College 80.9 68.4 62.9 53.1 65.9 5.5
University of Hawaii Maui College 82.0 71.0 64.5 55.8 65.0 4.2
Windward Community College 82.9 72.1 59.5 51.8 70.5 4.7
BA
University of Hawaii–West Oahu 83.5 77.3 66.1 53.1 73.0 7.9
DOCTORAL
University of Hawaii at Hilo 90.1 74.3 64.8 52.0 71.3 6.7
University of Hawaii at Manoa 113.1 87.2 73.6 60.6 89.5 5.3
IDAHOAA
College of Southern Idaho 56.5 47.8 43.7 38.5 47.8 1.4
College of Western Idaho – – – 42.7 42.7 -1.7
Eastern Idaho Technical College – – – 44.9 44.9 -3.9
North Idaho College – – – 53.0 53.0 4.1
BA
Lewis-Clark State College 56.0 47.3 43.6 34.5 48.2 0.1
DOCTORAL
Boise State University 78.9 65.0 56.5 41.7 62.5 0.8
Idaho State University 74.7 57.1 53.4 39.4 55.1 -0.1
University of Idaho 90.6 68.8 60.6 44.8 70.6 0.5
ILLINOISAA
Black Hawk College 73.1 59.9 49.7 44.5 61.2 0.3
Carl Sandburg College – – – 51.6 51.6 3.1
City Colleges of Chicago–Harold Washington College 95.9 76.6 65.4 62.0 67.1 0.3
City Colleges of Chicago–Harry S Truman College 108.1 89.3 73.8 68.3 77.7 0.7
City Colleges of Chicago–Kennedy-King College 96.8 79.1 69.0 63.3 66.9 -3.6
City Colleges of Chicago–Malcolm X College 122.2 93.0 72.1 63.3 66.6 1.9
City Colleges of Chicago–Olive-Harvey College 97.6 99.0 74.9 65.1 74.0 2.6
City Colleges of Chicago–Richard J Daley College 92.9 78.4 73.1 65.5 71.1 -1.2
City Colleges of Chicago–Wilbur Wright College 94.2 79.4 70.8 66.0 72.6 0.1
College of DuPage 111.7 87.3 69.7 52.5 99.4 -0.7
College of Lake County – – – 84.0 84.0 5.1
Danville Area Community College – – – 49.1 49.1 -2.8
Elgin Community College 113.2 90.9 75.7 58.8 88.0 1.3
Harper College 100.5 81.2 60.4 50.1 75.6 3.0
Heartland Community College 67.1 59.3 48.9 47.7 58.5 2.9
Highland Community College – – – 72.3 72.3 5.5
Illinois Central College 63.6 53.4 48.6 45.1 57.6 0.9
State/School
Prof.($)
Assoc.($)
Inst./Lect./Asst.($)
NoRank($)
Avg.($)
%Chng.(%)
State/School
Prof.($)
Assoc.($)
Inst./Lect./Asst.($)
NoRank($)
Avg.($)
%Chng.(%)
Illinois Eastern Community Colleges–Frontier Community College 50.9 – – – 50.9 3.5
Illinois Eastern Community Colleges–Lincoln Trail College 55.1 – – – 55.1 2.3
Illinois Eastern Community Colleges–Olney Central College 55.2 – – – 55.2 4.3
Illinois Eastern Community Colleges–Wabash Valley College 59.0 – – – 59.0 2.2
Illinois Valley Community College – – – 64.6 64.6 2.7
John A Logan College 77.8 71.0 68.0 60.8 66.8 3.5
John Wood Community College 63.5 54.7 50.5 43.7 52.5 2.3
Joliet Junior College – – – 76.3 76.3 3.2
Kankakee Community College 62.4 – 50.9 – 58.3 1.3
Kaskaskia College 74.5 64.5 60.4 – 65.7 4.9
Kishwaukee College – – – 56.2 56.2 2.8
Lake Land College – – – 51.3 51.3 -3.5
Lewis and Clark Community College 78.9 63.1 57.0 49.5 64.4 -1.3
Lincoln Land Community College 82.8 60.4 59.5 44.5 74.6 3.3
McHenry County College – – – 83.7 83.7 3.9
Moraine Valley Community College 76.2 62.3 55.8 50.1 59.6 1.4
Morton College – – – 76.3 76.3 3.3
Oakton Community College 112.8 80.1 73.0 61.8 95.8 5.6
Parkland College 77.1 66.2 55.7 52.7 65.3 3.8
Prairie State College 81.2 60.8 51.5 – 67.5 2.7
Rend Lake College 62.0 48.7 – 45.4 54.4 -1.7
Richland Community College 63.0 52.6 48.4 43.7 54.7 3.7
Rock Valley College 78.1 65.6 51.9 49.2 64.0 2.0
Sauk Valley Community College 57.4 53.1 48.9 39.2 49.9 -4.3
Shawnee Community College – – – 56.3 56.3 6.1
South Suburban College – – – 53.3 53.3 -9.8
Southeastern Illinois College 62.1 – – 54.5 54.7 4.4
Southwestern Illinois College 80.6 64.2 56.8 49.5 62.4 12.6
Spoon River College – – – 50.7 50.7 1.5
Triton College – – – 67.3 67.3 -0.9
Waubonsee Community College 99.9 87.8 78.6 64.8 70.5 2.8
BA+
Eastern Illinois University 90.0 72.4 63.2 45.2 66.4 5.0
Northeastern Illinois University 83.1 67.2 64.7 40.1 59.3 4.7
DOCTORAL
Chicago State University 69.8 61.4 58.8 31.6 53.2 -9.9
Governors State University 103.2 78.3 70.3 80.3 81.7 1.3
Illinois State University 90.0 69.1 67.1 41.1 69.3 2.1
Northern Illinois University 92.7 72.1 65.7 40.0 69.1 2.3
Southern Illinois University Carbondale 97.3 73.5 62.7 37.0 67.7 -1.3
Southern Illinois University Edwardsville 86.9 69.1 58.0 38.8 62.2 4.9
University of Illinois at Chicago 122.9 86.9 74.6 43.4 87.9 2.6
University of Illinois at Springfield 90.6 67.8 55.9 50.0 63.2 -0.1
University of Illinois at Urbana–Champaign 134.9 85.7 81.4 57.2 100.7 3.3
Western Illinois University 91.1 72.1 59.3 45.4 69.0 2.0
INDIANAAA
Ivy Tech Community College–Bloominton 56.5 46.9 42.2 36.1 44.4 -0.4
Ivy Tech Community College–Central Indiana 55.4 49.5 44.2 39.1 45.8 0.7
Ivy Tech Community College–Columbus 55.9 52.3 45.1 43.9 48.0 2.5
Ivy Tech Community College–East Central 59.4 53.4 43.8 37.7 44.7 0.8
Ivy Tech Community College–Kokomo 48.4 45.5 42.6 36.6 40.8 5.3
Ivy Tech Community College–Lafayette 55.5 50.4 45.4 41.3 45.6 -0.7
Ivy Tech Community College–Northcentral 59.0 50.2 43.1 38.4 43.3 6.9
Ivy Tech CommunityCollege–Northeast 55.9 52.8 47.6 43.2 46.7 1.8
Ivy Tech Community College–Northwest 60.4 51.1 42.2 37.7 43.0 1.0
Ivy Tech Community College–Richmond 62.2 49.0 45.9 40.3 45.0 1.0
2013 Salary Review
State/School
NEA HIGHER EDUCATION ADVOCATE20
Prof.($)
Assoc.($)
Inst./Lect./Asst.($)
NoRank($)
Avg.($)
%Chng.(%)
State/School
Prof.($)
Assoc.($)
Inst./Lect./Asst.($)
NoRank($)
Avg.($)
%Chng.(%)
NEA HIGHER EDUCATION ADVOCATE 21
Ivy Tech Community College–South Central 58.8 51.2 42.5 37.7 43.0 1.0
Ivy Tech Community College–Southeast 53.9 47.6 41.3 36.9 44.7 3.4
Ivy Tech Community College–Southwest 61.9 52.6 48.9 41.3 49.4 0.1
Ivy Tech Community College–Wabash Valley 57.7 50.0 42.6 36.7 42.0 -0.8
Vincennes University 64.0 55.1 46.0 46.7 54.9 0.3
BA+
Indiana University–East 70.1 60.8 57.3 47.1 56.1 4.0
Indiana University–Kokomo 75.4 58.1 53.8 41.7 55.8 0.8
Indiana University–Northwest 79.6 66.2 55.2 47.6 61.7 3.8
Indiana University–Purdue University–Fort Wayne 84.8 69.4 62.9 46.1 65.1 2.1
Indiana University–South Bend 73.6 59.1 57.0 42.0 56.5 4.7
Indiana University–Southeast 82.3 67.1 62.0 48.1 65.1 3.9
Purdue University–Calumet Campus 91.6 68.4 65.7 40.3 68.4 2.4
Purdue University–North Central Campus 85.8 62.5 57.1 52.1 60.8 1.8
DOCTORAL
Ball State University 86.3 66.8 54.3 43.3 61.7 2.6
Indiana State University 90.6 67.4 60.5 41.3 67.8 0.0
Indiana University–Bloomington 128.4 87.0 79.0 55.7 95.9 5.8
Indiana University–Purdue University–Indianapolis 106.3 76.6 64.1 46.7 72.7 4.8
Purdue University–Main Campus 126.6 87.2 78.9 45.1 94.0 2.0
University of Southern Indiana 82.0 66.7 56.2 45.6 59.3 1.1
IOWAAA
Des Moines Area Community College 65.0 56.9 – 52.6 61.7 2.5
Eastern Iowa Community College District – – – 51.2 51.2 -0.7
Ellsworth Community College 64.3 52.4 46.9 38.3 54.5 2.4
Hawkeye Community College – – – 49.5 49.5 -0.5
Indian Hills Community College – – – 55.3 55.3 2.8
Iowa Central Community College 59.2 54.8 59.1 54.8 55.9 2.4
Iowa Lakes Community College 58.5 44.1 48.1 – 52.6 5.8
Iowa Western Community College 58.9 49.6 45.0 39.2 46.3 2.6
Kirkwood Community College 66.1 57.6 51.4 48.5 56.1 1.5
Marshalltown Community College 62.4 53.8 47.0 39.0 55.8 1.1
North Iowa Area Community College – – – 57.2 57.2 3.3
Northeast Iowa Community College–Calmar – – – 46.7 46.7 -2.8
Northwest Iowa Community College – – – 43.2 43.2 1.1
Southeastern Community College – – – 63.0 63.0 1.2
Southwestern Community College – – – 41.1 41.1 -1.9
Western Iowa Tech Community College – – – 51.4 51.4 0.2
DOCTORAL
Iowa State University 119.5 83.3 74.8 52.1 88.2 1.5
University of Iowa 127.2 84.0 72.2 51.5 92.8 0.6
University of Northern Iowa 87.1 68.9 58.9 49.9 67.9 3.6
KANSASAA
Allen County Community College – – – 42.2 42.2 1.2
Barton County Community College – – – 44.0 44.0 3.3
Butler Community College 54.9 47.3 41.8 38.0 52.5 -0.0
Cloud County Community College – – – 40.1 40.1 2.6
Coffeyville Community College – – – 46.5 46.5 6.2
Colby Community College – – – 36.2 36.2 -5.2
Cowley County Community College – – – 49.8 49.8 -4.2
Dodge City Community College 48.0 42.7 37.9 37.0 45.5 1.9
Flint Hills Technical College – – – 44.3 44.3 1.1
Fort Scott Community College – – – 37.7 37.7 -0.0
State/School
Prof.($)
Assoc.($)
Inst./Lect./Asst.($)
NoRank($)
Avg.($)
%Chng.(%)
State/School
Prof.($)
Assoc.($)
Inst./Lect./Asst.($)
NoRank($)
Avg.($)
%Chng.(%)
Garden City Community College – – – 52.4 52.4 6.5
Highland Community College – – – 46.0 46.0 4.7
Hutchinson Community College – – – 49.6 49.6 5.1
Independence Community College 45.2 40.7 – – 43.7 0.9
Johnson County Community College 70.8 61.7 60.5 – 66.5 2.7
Kansas City Kansas Community College 69.9 60.0 51.7 43.3 58.4 2.6
Labette Community College 49.4 43.4 38.5 34.1 43.5 1.9
Manhattan Area Technical College – – – 52.7 52.7 3.2
Neosho County Community College – – – 39.4 39.4 -1.3
North Central Kansas Technical College – – – 37.0 37.0 0.1
Northwest Kansas Technical College – – – – – –
Pratt Community College – – – 40.1 40.1 2.4
Salina Area Technical College – – – 44.7 44.7 1.8
Seward County Community College and Area Technical School – – – 46.6 46.6 -1.3
Wichita Area Technical College – – – 42.5 42.5 1.7
BA+
Fort Hays State University 71.7 60.3 53.9 41.0 54.2 3.1
Pittsburg State University 75.7 58.2 55.5 44.8 59.9 2.2
DOCTORAL
Emporia State University 71.0 56.8 52.4 40.3 55.7 -0.0
Kansas State University 101.5 72.3 62.7 44.7 72.4 2.7
University of Kansas 116.6 78.6 68.1 47.0 87.1 0.1
Washburn University 96.4 68.1 54.1 43.1 65.8 -2.3
Wichita State University 95.2 69.9 61.4 47.9 71.5 3.7
KENTUCKYAA
Ashland Community and Technical College 61.7 48.6 41.4 40.7 50.1 2.9
Big Sandy Community and Technical College 57.1 46.6 39.7 35.3 45.1 1.9
Bluegrass Community and Technical College 59.7 50.5 42.5 37.7 50.1 1.3
Bowling Green Technical College 58.7 48.8 41.7 36.1 42.7 -0.5
Elizabethtown Community and Technical College 60.7 46.8 41.1 36.6 47.9 0.7
Gateway Community and Technical College 66.6 51.1 48.2 43.3 48.6 1.7
Hazard Community and Technical College 58.5 49.6 43.1 37.6 51.9 3.8
Henderson Community College 59.9 49.7 43.6 42.2 52.9 2.0
Hopkinsville Community College 61.1 47.7 40.0 38.8 48.3 3.2
Jefferson Community and Technical College 60.9 49.2 48.1 41.4 51.8 2.4
Madisonville Community College 58.2 47.1 40.4 40.3 49.0 1.6
Maysville Community and Technical College 61.5 47.6 42.6 38.0 48.9 2.4
Owensboro Community and Technical College 60.4 49.6 39.8 38.9 47.5 -1.3
Somerset Community College 58.0 48.4 40.8 36.2 46.2 -0.7
Southeast Kentucky Community and Technical College 60.9 48.2 41.3 37.5 49.8 -1.3
West Kentucky Community and Technical College 59.0 47.7 41.8 38.2 49.8 1.2
BA+
Kentucky State University 73.3 59.1 47.3 39.2 54.6 0.1
Murray State University 84.4 65.2 54.6 44.7 62.0 4.9
DOCTORAL
Eastern Kentucky University 80.3 65.4 55.1 48.6 60.3 1.3
Morehead State University 72.9 60.8 51.6 38.1 55.4 1.4
Northern Kentucky University 95.8 71.9 65.7 45.5 66.9 2.1
University of Kentucky 110.1 78.8 71.7 49.0 82.9 3.9
University of Louisville 103.7 74.9 61.6 49.2 77.2 -0.0
Western Kentucky University 83.9 65.2 54.2 42.9 60.1 -0.1
2013 Salary Review
State/School
NEA HIGHER EDUCATION ADVOCATE22
Prof.($)
Assoc.($)
Inst./Lect./Asst.($)
NoRank($)
Avg.($)
%Chng.(%)
State/School
Prof.($)
Assoc.($)
Inst./Lect./Asst.($)
NoRank($)
Avg.($)
%Chng.(%)
NEA HIGHER EDUCATION ADVOCATE 23
LOUISIANAAA
Acadiana Technical College–Lafayette Campus 54.0 – 42.2 33.3 34.7 6.0
Baton Rouge Community College 57.3 49.5 44.4 42.4 45.3 -1.0
Bossier Parish Community College 69.4 63.2 52.2 52.0 56.7 28.2
Capital Area Technical College–Baton Rouge Campus – – – 35.6 35.6 0.3
Central Louisiana Technical College–Alexandria Campus 38.3 34.9 – 34.1 34.2 0.6
Delgado Community College 79.5 71.4 62.5 45.3 55.9 -2.6
L E Fletcher Technical Community College – – 38.6 27.9 28.2 -15.8
Louisiana Delta Community College–Monroe Campus 40.0 43.7 44.5 35.7 40.1 -1.1
Louisiana State University Eunice 58.2 48.3 41.5 39.9 46.5 -1.2
Louisiana Technical College–Ascension Campus – – – – – –
Louisiana Technical College–Gulf Area Campus – – – – – –
Louisiana Technical College–Jefferson Campus – – – – – –
Louisiana Technical College–Jumonville Memorial – – – – – –
Louisiana Technical College–Northeast LA Branch Campus – – – – – –
Louisiana Technical College–Oakdale Campus – – – – – –
Louisiana Technical College–Ruston Campus – – – – – –
Louisiana Technical College–Sabine Valley Campus – – – – – –
Louisiana Technical College–Shelby Jackson Campus – – – – – –
Louisiana Technical College–Shreveport-Bossier Campus – – – – – –
Louisiana Technical College–T H Harris Campus – – – – – –
Louisiana Technical College–Tallulah Campus – – – – – –
Louisiana Technical College–Teche Area Campus – – – – – –
Louisiana Technical College–West Jefferson Campus – – – – – –
Northeast Louisiana Technical College–Delta Ouachita Campus – – – 32.5 32.5 –
Northshore Technical College–Florida Parishes Branch Campus – – – – – –
Northshore Technical College–Hammond Area Branch Campus – – – – – –
Northshore Technical Community College 47.0 43.3 39.4 36.5 37.7 2.6
Northwest Louisiana Technical College 45.0 36.1 – 34.3 36.6 0.4
Northwest Louisiana Technical College–Natchitoches Campus – – – – – –
Nunez Community College 52.9 48.5 41.6 47.7 47.7 1.7
River Parishes Community College – 48.5 39.3 35.7 38.1 8.0
South Central Louisiana Technical College–Lafourche Campus – – – – – –
South Central Louisiana Technical College–River Parishes Campus – – – – – –
South Central Louisiana Technical College–Young Memorial Campus – – – 35.1 35.1 -14.6
South Louisiana Community College – – 49.7 36.8 37.7 0.3
Southern University at Shreveport 47.8 45.9 43.5 39.6 43.7 -1.9
Sowela Technical Community College – – – 36.0 36.0 -0.1
BA
Louisiana State University–Alexandria 59.0 47.1 46.4 39.2 47.6 -0.1
BA+
Louisiana State University–Shreveport 61.1 58.2 51.7 34.7 53.4 -0.9
McNeese State University 82.3 64.0 55.7 42.5 59.6 -0.9
Nicholls State University 71.2 58.7 51.3 39.5 51.6 -0.2
Northwestern State University of Louisiana 70.5 56.0 48.5 40.7 53.1 -2.7
State/School
Prof.($)
Assoc.($)
Inst./Lect./Asst.($)
NoRank($)
Avg.($)
%Chng.(%)
State/School
Prof.($)
Assoc.($)
Inst./Lect./Asst.($)
NoRank($)
Avg.($)
%Chng.(%)

Southern University at New Orleans 61.0 53.9 49.9 41.6 51.8 0.6
DOCTORAL
Grambling State University 70.8 60.0 54.2 41.5 56.4 -1.1
Louisiana State University Health Sciences Center–New Orleans – – – – – –
Louisiana State University Health Sciences Center–Shreveport – – – – – –
Louisiana State University and Agricultural & Mechanical College 110.5 79.4 67.2 44.9 81.1 0.4
Louisiana Tech University 78.6 68.4 59.2 45.1 61.7 -1.3
Southeastern Louisiana University 76.8 65.3 57.6 44.7 57.1 -1.7
Southern University and A & M College 75.2 60.7 50.8 51.5 61.6 7.5
University of Louisiana at Lafayette 101.6 74.4 59.7 44.7 69.2 -0.8
University of Louisiana–Monroe 77.9 68.2 61.1 40.3 62.1 6.7
University of New Orleans 88.3 64.6 61.4 39.0 67.3 0.8
MAINEAA
Central Maine Community College – – – 52.4 52.4 -1.9
Eastern Maine Community College – – – 55.1 55.1 -2.2
Kennebec Valley Community College – – – 54.8 54.8 -0.9
Northern Maine Community College – – – 56.1 56.1 -1.0
Southern Maine Community College 61.9 49.3 50.7 47.9 52.8 0.6
Washington County Community College – – – 49.2 49.2 -3.9
York County Community College – – – 48.2 48.2 0.8
BA
University of Maine at Fort Kent 71.0 55.0 47.5 44.1 56.5 2.4
University of Maine at Machias 66.6 56.2 44.3 37.4 53.7 -3.7
University of Maine at Presque Isle 67.5 56.3 47.2 49.5 56.2 0.6
BA+
University of Maine at Augusta 75.0 59.8 49.9 47.2 60.3 -0.6
University of Maine at Farmington 72.8 55.7 49.0 44.3 57.1 0.1
DOCTORAL
University of Maine 97.3 75.4 60.5 52.1 78.7 -1.6
University of Southern Maine 96.5 73.8 61.3 45.9 75.7 1.4
MARYLANDAA
Allegany College of Maryland 62.0 48.4 44.5 39.6 51.1 -0.5
Anne Arundel Community College 82.4 65.8 57.6 49.9 67.2 -0.1
Baltimore City Community College 77.8 64.4 55.2 58.3 60.9 1.5
Carroll Community College 62.8 59.5 49.3 49.9 53.4 -1.9
Cecil College 70.6 59.2 47.9 42.1 56.3 -0.1
Chesapeake College 74.6 67.7 57.5 53.9 64.0 -0.6
College of Southern Maryland 81.7 65.4 61.8 – 75.9 0.4
Frederick Community College 83.1 72.8 58.2 – 66.6 0.4
Garrett College 65.7 53.3 – 43.9 60.3 -2.8
Hagerstown Community College 74.7 57.6 53.3 47.4 57.3 2.7
Harford Community College 83.6 65.9 52.4 44.9 58.4 0.9
Howard Community College 82.4 67.0 57.9 52.1 65.2 0.7
Montgomery College 86.9 70.4 59.9 58.4 77.4 0.0
Prince George’s Community College 70.7 58.7 50.4 49.0 61.7 -2.4
The Community College of Baltimore County 85.4 67.0 57.6 51.4 63.6 0.9
Wor-Wic Community College 78.8 60.9 53.0 44.8 53.6 -1.1
BA
United States Naval Academy 128.2 103.9 82.0 73.8 107.1 -0.1
BA+
Coppin State University 84.9 67.7 59.8 43.8 62.8 -0.4
Frostburg State University 81.9 67.5 58.8 43.6 67.4 2.0
Salisbury University 84.1 66.3 63.6 44.7 65.1 0.0
2013 Salary Review
State/School
NEA HIGHER EDUCATION ADVOCATE24
Prof.($)
Assoc.($)
Inst./Lect./Asst.($)
NoRank($)
Avg.($)
%Chng.(%)
State/School
Prof.($)
Assoc.($)
Inst./Lect./Asst.($)
NoRank($)
Avg.($)
%Chng.(%)
NEA HIGHER EDUCATION ADVOCATE 25
St Mary’s College of Maryland 89.1 64.2 56.8 49.7 69.2 2.7
DOCTORAL
Bowie State University 85.9 68.8 62.2 53.7 64.0 -0.8
Morgan State University 108.9 77.9 67.3 44.9 62.9 1.7
Towson University 89.3 70.6 61.8 40.9 64.1 0.2
University of Baltimore 132.9 99.3 83.0 64.5 100.2 1.9
University of Maryland Eastern Shore 77.3 66.8 62.2 49.5 61.0 -0.6
University of Maryland–Baltimore 153.0 97.7 88.6 66.4 117.1 1.6
University of Maryland–Baltimore County 103.6 76.6 67.8 51.2 76.6 -0.6
University of Maryland–College Park 131.7 94.4 83.5 62.8 97.9 0.7
University of Maryland–University College 42.9 36.0 30.9 – 40.8 7.3
MASSACHUSETTSAA
Berkshire Community College 62.1 49.9 50.2 – 59.5 1.5
Bristol Community College 65.1 54.6 50.7 45.4 57.5 -0.6
Bunker Hill Community College 67.3 58.3 51.4 – 62.5 2.6
Cape Cod Community College 64.7 53.4 48.9 49.0 60.3 2.7
Greenfield Community College 61.8 54.3 46.1 48.7 56.7 3.7
Holyoke Community College 64.5 53.0 50.5 48.0 58.6 1.4
Massachusetts BayCommunity College 67.6 55.2 53.8 60.9 60.7 1.4
Massasoit Community College 70.2 53.1 49.2 47.0 61.3 0.6
Middlesex Community College 63.9 50.8 53.2 – 61.3 4.2
Mount Wachusett Community College 66.8 60.2 56.8 – 63.7 3.0
North Shore Community College 65.8 51.8 50.2 40.5 59.4 0.9
Northern Essex Community College 65.9 51.8 49.9 47.5 57.4 1.0
Quincy College 74.9 – – 61.3 64.4 -2.8
Quinsigamond Community College 63.4 51.9 47.7 43.4 58.3 -1.3
Roxbury Community College 66.3 59.2 52.5 50.8 60.3 0.3
Springfield Technical Community College 67.2 51.8 46.6 30.0 60.9 0.1
BA+
Bridgewater State University 82.1 68.5 61.0 53.0 70.2 3.3
Fitchburg State University 83.2 67.6 58.0 56.6 69.8 3.6
Framingham State University 82.4 64.4 58.1 50.5 66.6 2.8
Massachusetts College of Art and Design 81.6 68.1 64.8 – 76.9 5.6
Massachusetts College of Liberal Arts 85.1 63.9 52.0 46.0 69.5 2.5
Massachusetts Maritime Academy 88.2 67.9 60.4 – 76.1 5.2
Salem State University 83.4 70.2 64.2 59.4 72.9 4.9
Westfield State University 83.4 66.5 56.8 52.1 69.0 5.4
Worcester State University 82.5 70.0 56.9 55.5 70.1 4.4
DOCTORAL
University of Massachusetts–Amherst 123.4 90.9 72.7 59.8 93.9 2.5
University of Massachusetts–Boston 116.2 87.1 77.1 61.6 86.0 2.8
University of Massachusetts–Dartmouth 111.2 86.0 72.6 60.6 86.7 2.7
University of Massachusetts–Lowell 120.4 95.0 77.2 65.2 97.0 1.0
MICHIGANAA
Alpena Community College – – – 66.7 66.7 4.0
Bay de Noc Community College – – – 70.4 70.4 4.0
Delta College 89.4 81.1 69.0 56.2 72.9 1.2
Glen Oaks Community College – – – – – –
Gogebic Community College – – – 56.8 56.8 2.8
Grand Rapids Community College 96.3 84.0 59.2 47.9 81.1 -5.2
Henry Ford Community College – – – 101.9 101.9 5.9
Jackson Community College – – – – – –
Kalamazoo Valley Community College – – – 83.8 83.8 5.5
State/School
Prof.($)
Assoc.($)
Inst./Lect./Asst.($)
NoRank($)
Avg.($)
%Chng.(%)
State/School
Prof.($)
Assoc.($)
Inst./Lect./Asst.($)
NoRank($)
Avg.($)
%Chng.(%)
Kellogg Community College 65.6 – – 55.6 63.9 -21.4
Kirtland Community College – – – – – –
Lake Michigan College – – – 73.9 73.9 -0.2
Lansing Community College 55.9 – – – 55.9 -11.1
Macomb Community College – – – 74.0 74.0 -0.6
Mid Michigan Community College 67.4 68.3 61.7 56.4 64.3 2.1
Monroe County Community College 91.7 81.0 75.3 74.2 79.5 -0.4
Montcalm Community College – – – 70.1 70.1 2.6
Mott Community College – – – 69.1 69.1 -0.3
Muskegon Community College – – – 78.1 78.1 3.2
North Central Michigan College 76.0 – – – 76.0 1.0
Northwestern Michigan College – – – 65.6 65.6 -1.6
Oakland Community College – – – 81.8 81.8 1.1
Schoolcraft College – – – 78.4 78.4 -0.7
Southwestern Michigan College – – – 56.8 56.8 2.6
St Clair County Community College 76.3 – – 53.3 74.1 -0.8
Washtenaw Community College – – – – – –
Wayne County Community College District – – – 69.6 69.6 0.5
West Shore Community College 75.3 49.7 – 39.0 69.7 -1.3
BA+
Lake Superior State University 66.6 55.0 50.5 42.5 54.4 -0.9
Northern Michigan University 82.2 64.7 52.8 47.0 64.4 -1.5
Saginaw Valley State University 80.0 66.9 57.5 45.4 66.3 0.1
DOCTORAL
Central Michigan University 97.8 75.2 61.5 41.3 71.8 -1.5
Eastern Michigan University 93.2 75.4 64.8 40.2 76.6 2.5
Ferris State University 86.7 70.4 60.4 43.2 72.3 4.1
Grand Valley State University 92.1 71.3 58.7 42.4 65.9 5.7
Michigan State University 129.5 90.2 71.7 47.6 97.9 2.3
Michigan Technological University 102.6 80.4 73.7 51.9 79.5 0.4
Oakland University 99.3 73.2 63.6 56.2 73.9 0.4
University of Michigan–Ann Arbor 147.3 97.8 86.8 56.9 111.6 1.9
University of Michigan–Dearborn 104.0 84.9 72.6 53.9 83.0 3.6
University of Michigan–Flint 94.5 72.1 65.2 47.8 66.9 -0.1
Wayne State University 117.1 87.8 75.2 56.3 86.6 2.4
Western Michigan University 99.6 76.0 61.3 48.5 82.2 -0.4
MINNESOTAAA
Alexandria Technical & Community College – – – 63.0 63.0 0.7
Anoka Technical College – – – 60.5 60.5 -0.6
Anoka-Ramsey Community College – – – 59.4 59.4 -0.6
Central Lakes College–Brainerd – – – 60.7 60.7 -1.6
Century Community and Technical College – – – 60.7 60.7 -0.2
Dakota County Technical College – – – 62.4 62.4 -1.5
Hennepin Technical College – – – 58.8 58.8 -0.5
Hibbing Community College–A Technical and Community College – – – 61.9 61.9 0.1
Inver Hills Community College – – – 59.7 59.7 -0.2
Itasca Community College – – – 62.4 62.4 -1.8
Lake Superior College – – – 61.1 61.1 -0.8
Mesabi Range Community and Technical College – – – 62.2 62.2 -1.1
Minneapolis Community and Technical College – – – 61.6 61.6 -2.2
Minnesota State College–Southeast Technical – – – 60.5 60.5 -0.6
Minnesota State Community and Technical College – – – 58.7 58.7 -1.0
Minnesota West Community and Technical College – – – 60.1 60.1 -0.6
Normandale Community College – – – 61.0 61.0 -0.3
North Hennepin Community College – – – 60.1 60.1 -2.0
Northland Community and Technical College – – – 59.5 59.5 0.2
Northwest Technical College– – – 61.4 61.4 -0.4
2013 Salary Review
State/School
NEA HIGHER EDUCATION ADVOCATE26
Prof.($)
Assoc.($)
Inst./Lect./Asst.($)
NoRank($)
Avg.($)
%Chng.(%)
State/School
Prof.($)
Assoc.($)
Inst./Lect./Asst.($)
NoRank($)
Avg.($)
%Chng.(%)
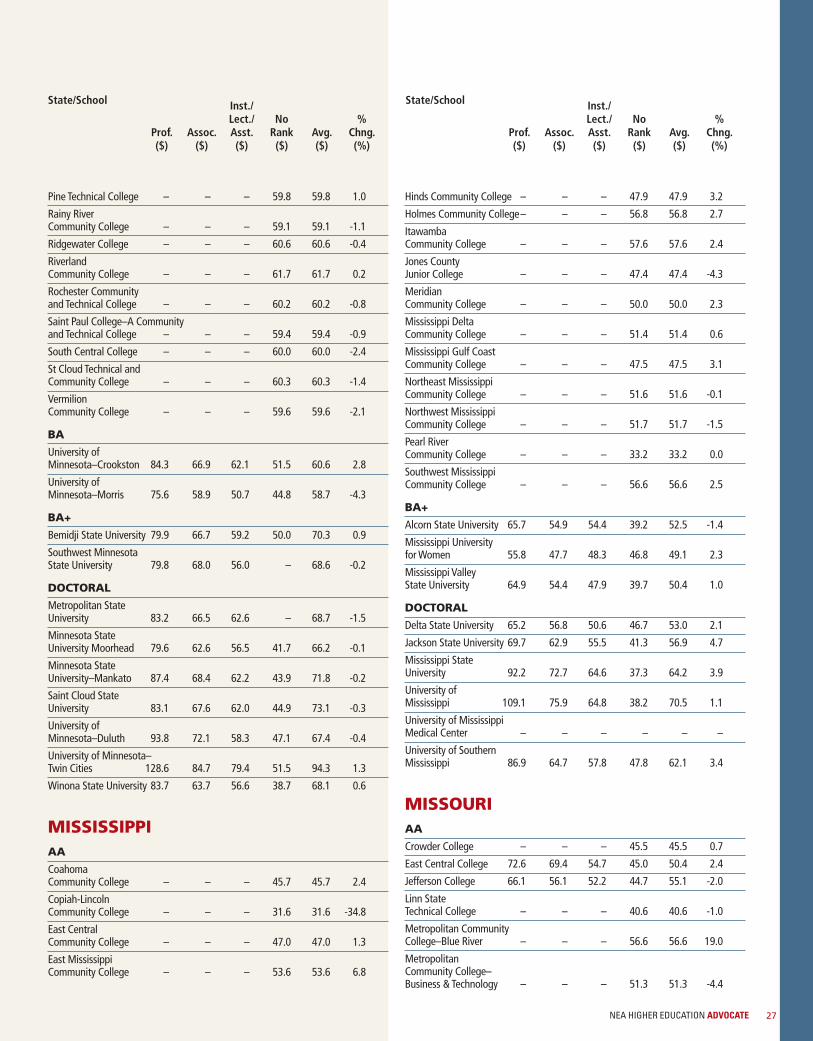
NEA HIGHER EDUCATION ADVOCATE 27
Pine Technical College – – – 59.8 59.8 1.0
Rainy River Community College – – – 59.1 59.1 -1.1
Ridgewater College – – – 60.6 60.6 -0.4
Riverland Community College – – – 61.7 61.7 0.2
Rochester Community and Technical College – – – 60.2 60.2 -0.8
Saint Paul College–A Community and Technical College – – – 59.4 59.4 -0.9
South Central College – – – 60.0 60.0 -2.4
St Cloud Technical and Community College – – – 60.3 60.3 -1.4
Vermilion Community College – – – 59.6 59.6 -2.1
BA
University of Minnesota–Crookston 84.3 66.9 62.1 51.5 60.6 2.8
University of Minnesota–Morris 75.6 58.9 50.7 44.8 58.7 -4.3
BA+
Bemidji State University 79.9 66.7 59.2 50.0 70.3 0.9
Southwest Minnesota State University 79.8 68.0 56.0 – 68.6 -0.2
DOCTORAL
Metropolitan State University 83.2 66.5 62.6 – 68.7 -1.5
Minnesota State University Moorhead 79.6 62.6 56.5 41.7 66.2 -0.1
Minnesota State University–Mankato 87.4 68.4 62.2 43.9 71.8 -0.2
Saint Cloud State University 83.1 67.6 62.0 44.9 73.1 -0.3
University of Minnesota–Duluth 93.8 72.1 58.3 47.1 67.4 -0.4
University of Minnesota–Twin Cities 128.6 84.7 79.4 51.5 94.3 1.3
Winona State University 83.7 63.7 56.6 38.7 68.1 0.6
MISSISSIPPIAA
Coahoma Community College – – – 45.7 45.7 2.4
Copiah-Lincoln Community College – – – 31.6 31.6 -34.8
East Central Community College – – – 47.0 47.0 1.3
East Mississippi Community College – – – 53.6 53.6 6.8
Hinds Community College – – – 47.9 47.9 3.2
Holmes Community College– – – 56.8 56.8 2.7
Itawamba Community College – – – 57.6 57.6 2.4
Jones County Junior College – – – 47.4 47.4 -4.3
Meridian Community College – – – 50.0 50.0 2.3
Mississippi Delta Community College – – – 51.4 51.4 0.6
Mississippi Gulf Coast Community College – – – 47.5 47.5 3.1
Northeast Mississippi Community College – – – 51.6 51.6 -0.1
Northwest Mississippi Community College – – – 51.7 51.7 -1.5
Pearl River Community College – – – 33.2 33.2 0.0
Southwest Mississippi Community College – – – 56.6 56.6 2.5
BA+
Alcorn State University 65.7 54.9 54.4 39.2 52.5 -1.4
Mississippi University for Women 55.8 47.7 48.3 46.8 49.1 2.3
Mississippi Valley State University 64.9 54.4 47.9 39.7 50.4 1.0
DOCTORAL
Delta State University 65.2 56.8 50.6 46.7 53.0 2.1
Jackson State University 69.7 62.9 55.5 41.3 56.9 4.7
Mississippi State University 92.2 72.7 64.6 37.3 64.2 3.9
University of Mississippi 109.1 75.9 64.8 38.2 70.5 1.1
University of Mississippi Medical Center – – – – – –
University of Southern Mississippi 86.9 64.7 57.8 47.8 62.1 3.4
MISSOURIAA
Crowder College – – – 45.5 45.5 0.7
East Central College 72.6 69.4 54.7 45.0 50.4 2.4
Jefferson College 66.1 56.1 52.2 44.7 55.1 -2.0
Linn State Technical College – – – 40.6 40.6 -1.0
Metropolitan Community College–Blue River – – – 56.6 56.6 19.0
Metropolitan Community College–Business & Technology – – – 51.3 51.3 -4.4
State/School
Prof.($)
Assoc.($)
Inst./Lect./Asst.($)
NoRank($)
Avg.($)
%Chng.(%)
State/School
Prof.($)
Assoc.($)
Inst./Lect./Asst.($)
NoRank($)
Avg.($)
%Chng.(%)

Metropolitan Community College–Longview – – – 59.9 59.9 0.4
Metropolitan Community College–Maple Woods – – – 58.0 58.0 3.3
Metropolitan Community College–Penn Valley – – – 58.3 58.3 0.7
Mineral Area College 52.0 50.6 47.6 46.5 48.8 0.0
Missouri State University–West Plains 55.3 47.5 42.6 39.0 43.0 4.3
Moberly Area Community College 48.6 47.5 40.0 39.5 42.8 0.9
North Central Missouri College – – – 41.8 41.8 -0.2
Ozarks Technical Community College – – – 46.7 46.7 -1.1
Saint Louis Community College 76.6 65.1 59.7 52.9 65.6 2.3
Saint Louis Community College–Florissant Valley – – – – – –
Saint Louis Community College–Meramec – – – – – –
Saint Louis Community College–Wildwood – – – – – –
St Charles Community College 67.3 49.5 45.1 39.5 57.1 -1.2
State Fair Community College – – – 46.3 46.3 1.7
Three Rivers Community College – – – 45.7 45.7 -1.2
BA
Harris-Stowe State University 63.7 53.6 47.5 43.5 47.7 -1.1
BA+
Lincoln University 61.7 50.6 45.0 35.4 49.5 -1.2
Missouri Southern State University 72.6 56.7 44.5 42.4 57.3 0.0
Missouri Western State University 75.5 61.3 52.2 38.1 59.4 1.3
Northwest Missouri State University 76.1 60.9 53.0 44.3 56.1 -0.1
Southeast Missouri State University 75.8 57.7 57.4 42.4 58.8 2.1
Truman State University 70.4 56.6 49.1 41.1 62.1 2.4
University of Central Missouri 80.4 65.5 51.8 41.6 61.8 0.6
DOCTORAL
Missouri State University–Springfield 76.9 62.3 57.5 38.7 61.3 3.4
Missouri University of Science and Technology 115.2 79.5 69.9 43.1 87.6 3.2
University of Missouri–Columbia 113.7 76.8 62.6 46.5 82.3 3.5
University of Missouri–Kansas City 111.7 76.3 61.3 40.7 78.2 0.6
University of Missouri–St Louis 93.0 67.6 58.8 42.8 70.0 1.8
University of Missouri–Systems Office – – – – – –
MONTANAAA
Dawson Community College – – – 44.5 44.5 -1.9
Flathead Valley Community College – – – 48.6 48.6 -2.7
Miles Community College – – – 42.3 42.3 3.1
Montana State University–Great Falls College of Technology – – – 45.2 45.2 2.2
University of Montana–Helena College of Technology – – – 42.3 42.3 0.7
BA
The University of Montana–Western 59.7 52.7 44.7 36.3 47.3 -1.2
BA+
Montana State University–Billings 65.8 59.5 50.1 42.1 53.1 1.5
Montana State University–Northern 58.6 51.0 43.5 35.6 48.4 3.0
Montana Tech of the University of Montana 74.8 62.2 57.3 48.2 61.2 2.6
DOCTORAL
Montana State University 84.8 65.0 60.3 42.8 65.0 2.6
The University of Montana 78.7 63.2 56.1 41.8 63.4 -1.8
NEBRASKAAA
Central Community College – – – 51.4 51.4 1.4
Metropolitan Community College Area – – – 57.3 57.3 1.9
Mid-PlainsCommunity College – – – 52.8 52.8 1.2
Nebraska College of Technical Agriculture 57.5 57.2 43.1 – 46.4 9.7
Northeast Community College – – – 49.9 49.9 2.1
2013 Salary Review
State/School
NEA HIGHER EDUCATION ADVOCATE28
Prof.($)
Assoc.($)
Inst./Lect./Asst.($)
NoRank($)
Avg.($)
%Chng.(%)
State/School
Prof.($)
Assoc.($)
Inst./Lect./Asst.($)
NoRank($)
Avg.($)
%Chng.(%)
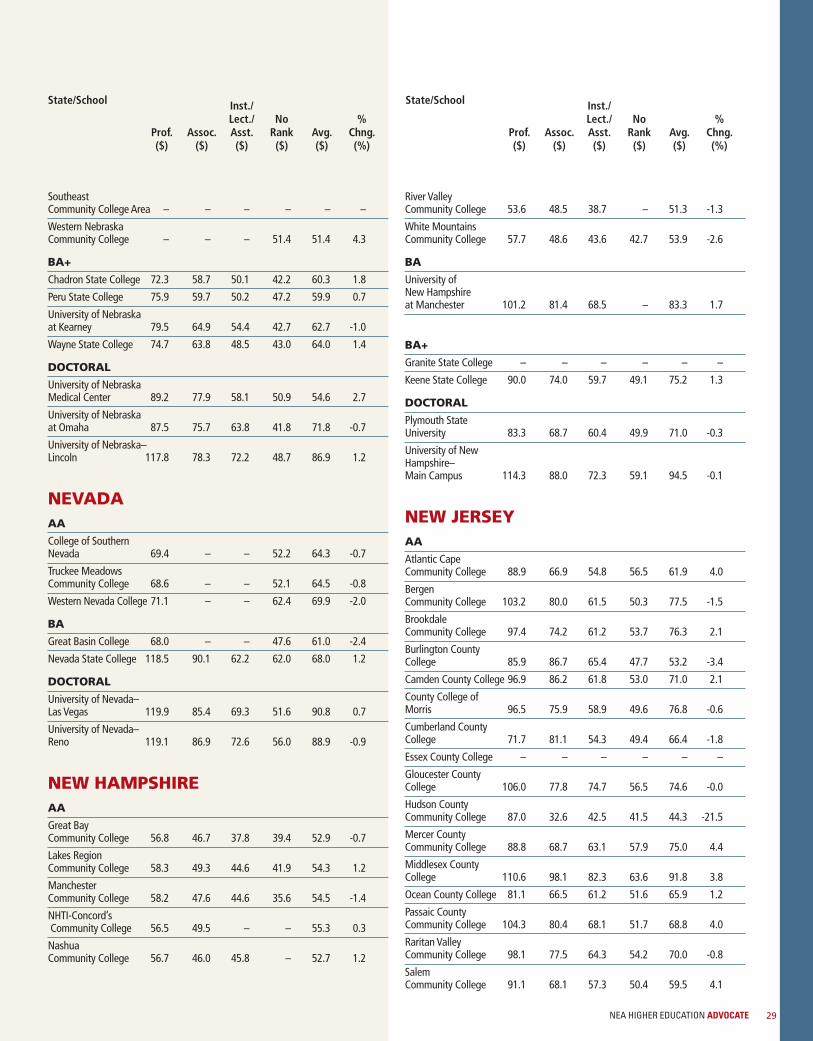
NEA HIGHER EDUCATION ADVOCATE 29
Southeast Community College Area – – – – – –
Western Nebraska Community College – – – 51.4 51.4 4.3
BA+
Chadron State College 72.3 58.7 50.1 42.2 60.3 1.8
Peru State College 75.9 59.7 50.2 47.2 59.9 0.7
University of Nebraska at Kearney 79.5 64.9 54.4 42.7 62.7 -1.0
Wayne State College 74.7 63.8 48.5 43.0 64.0 1.4
DOCTORAL
University of Nebraska Medical Center 89.2 77.9 58.1 50.9 54.6 2.7
University of Nebraska at Omaha 87.5 75.7 63.8 41.8 71.8 -0.7
University of Nebraska–Lincoln 117.8 78.3 72.2 48.7 86.9 1.2
NEVADAAA
College of Southern Nevada 69.4 – – 52.2 64.3 -0.7
Truckee Meadows Community College 68.6 – – 52.1 64.5 -0.8
Western Nevada College 71.1 – – 62.4 69.9 -2.0
BA
Great Basin College 68.0 – – 47.6 61.0 -2.4
Nevada State College 118.5 90.1 62.2 62.0 68.0 1.2
DOCTORAL
University of Nevada–Las Vegas 119.9 85.4 69.3 51.6 90.8 0.7
University of Nevada–Reno 119.1 86.9 72.6 56.0 88.9 -0.9
NEW HAMPSHIREAA
Great Bay Community College 56.8 46.7 37.8 39.4 52.9 -0.7
Lakes Region Community College 58.3 49.3 44.6 41.9 54.3 1.2
Manchester Community College 58.2 47.6 44.6 35.6 54.5 -1.4
NHTI-Concord’sCommunity College 56.5 49.5 – – 55.3 0.3
Nashua Community College 56.7 46.0 45.8 – 52.7 1.2
River Valley Community College 53.6 48.5 38.7 – 51.3 -1.3
White Mountains Community College 57.7 48.6 43.6 42.7 53.9 -2.6
BA
University of New Hampshire at Manchester 101.2 81.4 68.5 – 83.3 1.7
BA+
Granite State College – – – – – –
Keene State College 90.0 74.0 59.7 49.1 75.2 1.3
DOCTORAL
Plymouth State University 83.3 68.7 60.4 49.9 71.0 -0.3
University of New Hampshire–Main Campus 114.3 88.0 72.3 59.1 94.5 -0.1
NEW JERSEYAA
Atlantic Cape Community College 88.9 66.9 54.8 56.5 61.9 4.0
Bergen Community College 103.2 80.0 61.5 50.3 77.5 -1.5
Brookdale Community College 97.4 74.2 61.2 53.7 76.3 2.1
Burlington County College 85.9 86.7 65.4 47.7 53.2 -3.4
Camden County College 96.9 86.2 61.8 53.0 71.0 2.1
County College of Morris 96.5 75.9 58.9 49.6 76.8 -0.6
Cumberland County College 71.7 81.1 54.3 49.4 66.4 -1.8
Essex County College – – – – – –
Gloucester County College 106.0 77.8 74.7 56.5 74.6 -0.0
Hudson County Community College 87.0 32.6 42.5 41.5 44.3 -21.5
Mercer County Community College 88.8 68.7 63.1 57.9 75.0 4.4
Middlesex County College 110.6 98.1 82.3 63.6 91.8 3.8
Ocean County College 81.1 66.5 61.2 51.6 65.9 1.2
Passaic County Community College 104.3 80.4 68.1 51.7 68.8 4.0
Raritan Valley Community College 98.1 77.5 64.3 54.2 70.0 -0.8
Salem Community College 91.1 68.1 57.3 50.4 59.5 4.1
State/School
Prof.($)
Assoc.($)
Inst./Lect./Asst.($)
NoRank($)
Avg.($)
%Chng.(%)
State/School
Prof.($)
Assoc.($)
Inst./Lect./Asst.($)
NoRank($)
Avg.($)
%Chng.(%)
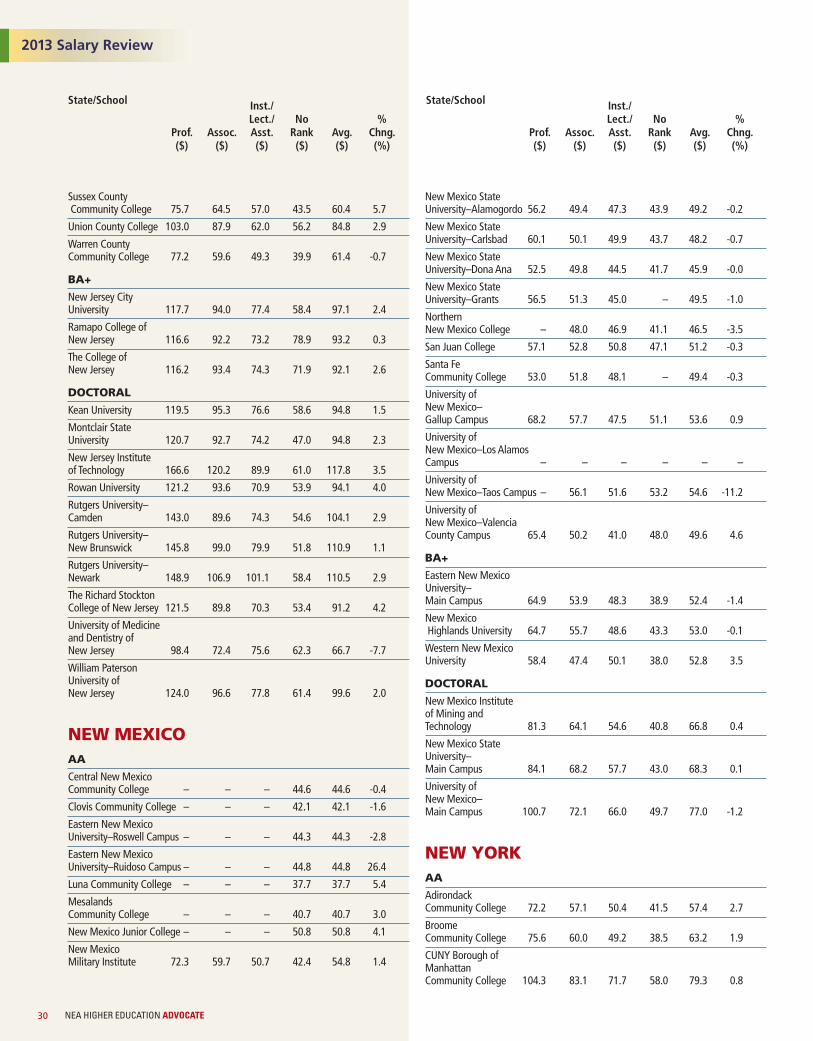
Sussex CountyCommunity College 75.7 64.5 57.0 43.5 60.4 5.7
Union County College 103.0 87.9 62.0 56.2 84.8 2.9
Warren County Community College 77.2 59.6 49.3 39.9 61.4 -0.7
BA+
New Jersey City University 117.7 94.0 77.4 58.4 97.1 2.4
Ramapo College of New Jersey 116.6 92.2 73.2 78.9 93.2 0.3
The College of New Jersey 116.2 93.4 74.3 71.9 92.1 2.6
DOCTORAL
Kean University 119.5 95.3 76.6 58.6 94.8 1.5
Montclair State University 120.7 92.7 74.2 47.0 94.8 2.3
New Jersey Institute of Technology 166.6 120.2 89.9 61.0 117.8 3.5
Rowan University 121.2 93.6 70.9 53.9 94.1 4.0
Rutgers University–Camden 143.0 89.6 74.3 54.6 104.1 2.9
Rutgers University–New Brunswick 145.8 99.0 79.9 51.8 110.9 1.1
Rutgers University–Newark 148.9 106.9 101.1 58.4 110.5 2.9
The Richard Stockton College of New Jersey 121.5 89.8 70.3 53.4 91.2 4.2
University of Medicine and Dentistry of New Jersey 98.4 72.4 75.6 62.3 66.7 -7.7
William Paterson University of New Jersey 124.0 96.6 77.8 61.4 99.6 2.0
NEW MEXICOAA
Central New Mexico Community College – – – 44.6 44.6 -0.4
Clovis Community College – – – 42.1 42.1 -1.6
Eastern New Mexico University–Roswell Campus – – – 44.3 44.3 -2.8
Eastern New Mexico University–Ruidoso Campus – – – 44.8 44.8 26.4
Luna Community College – – – 37.7 37.7 5.4
Mesalands Community College – – – 40.7 40.7 3.0
New Mexico Junior College – – – 50.8 50.8 4.1
New Mexico Military Institute 72.3 59.7 50.7 42.4 54.8 1.4
New Mexico State University–Alamogordo 56.2 49.4 47.3 43.9 49.2 -0.2
New Mexico State University–Carlsbad 60.1 50.1 49.9 43.7 48.2 -0.7
New Mexico State University–Dona Ana 52.5 49.8 44.5 41.7 45.9 -0.0
New Mexico State University–Grants 56.5 51.3 45.0 – 49.5 -1.0
Northern New Mexico College – 48.0 46.9 41.1 46.5 -3.5
San Juan College 57.1 52.8 50.8 47.1 51.2 -0.3
Santa Fe Community College 53.0 51.8 48.1 – 49.4 -0.3
University of New Mexico–Gallup Campus 68.2 57.7 47.5 51.1 53.6 0.9
University of New Mexico–Los Alamos Campus – – – – – –
University of New Mexico–Taos Campus – 56.1 51.6 53.2 54.6 -11.2
University of New Mexico–Valencia County Campus 65.4 50.2 41.0 48.0 49.6 4.6
BA+
Eastern New Mexico University–Main Campus 64.9 53.9 48.3 38.9 52.4 -1.4
New MexicoHighlands University 64.7 55.7 48.6 43.3 53.0 -0.1
Western New Mexico University 58.4 47.4 50.1 38.0 52.8 3.5
DOCTORAL
New Mexico Institute of Mining and Technology 81.3 64.1 54.6 40.8 66.8 0.4
New Mexico State University–Main Campus 84.1 68.2 57.7 43.0 68.3 0.1
University of New Mexico–Main Campus 100.7 72.1 66.0 49.7 77.0 -1.2
NEW YORKAA
Adirondack Community College 72.2 57.1 50.4 41.5 57.4 2.7
Broome Community College 75.6 60.0 49.2 38.5 63.2 1.9
CUNY Borough of Manhattan Community College 104.3 83.1 71.7 58.0 79.3 0.8
2013 Salary Review
State/School
NEA HIGHER EDUCATION ADVOCATE30
Prof.($)
Assoc.($)
Inst./Lect./Asst.($)
NoRank($)
Avg.($)
%Chng.(%)
State/School
Prof.($)
Assoc.($)
Inst./Lect./Asst.($)
NoRank($)
Avg.($)
%Chng.(%)
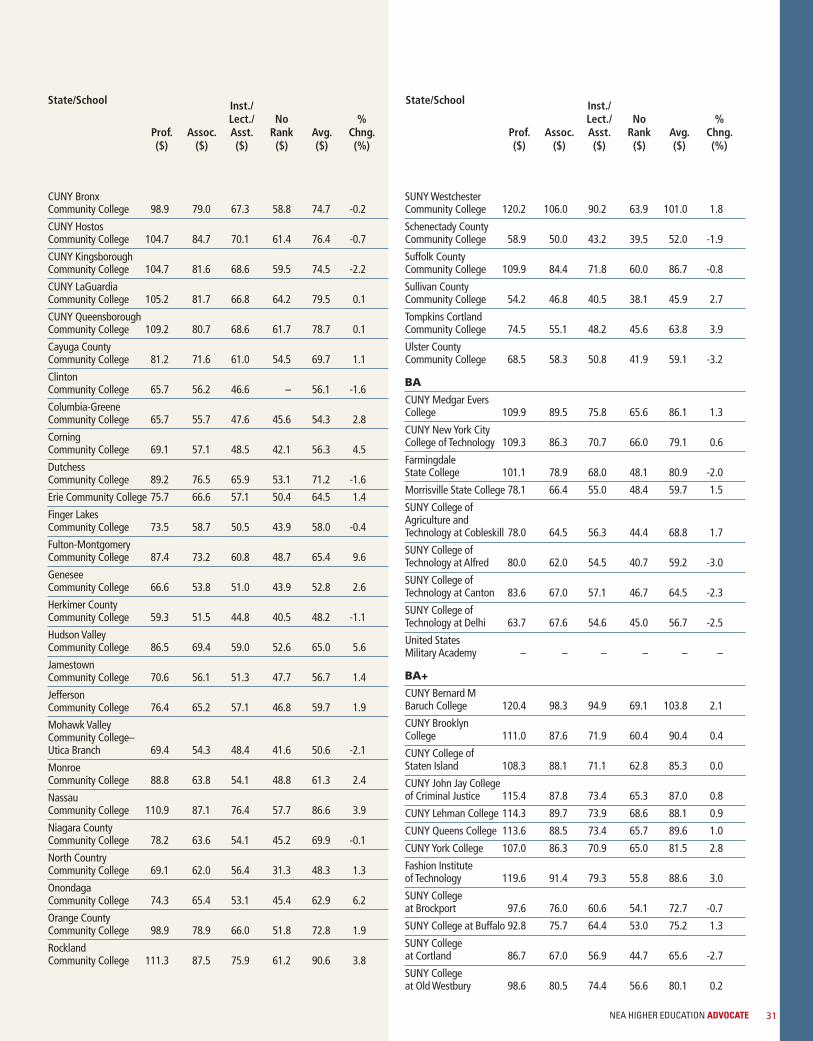
NEA HIGHER EDUCATION ADVOCATE 31
CUNY Bronx Community College 98.9 79.0 67.3 58.8 74.7 -0.2
CUNY Hostos Community College 104.7 84.7 70.1 61.4 76.4 -0.7
CUNY Kingsborough Community College 104.7 81.6 68.6 59.5 74.5 -2.2
CUNY LaGuardia Community College 105.2 81.7 66.8 64.2 79.5 0.1
CUNY Queensborough Community College 109.2 80.7 68.6 61.7 78.7 0.1
Cayuga County Community College 81.2 71.6 61.0 54.5 69.7 1.1
Clinton Community College 65.7 56.2 46.6 – 56.1 -1.6
Columbia-Greene Community College 65.7 55.7 47.6 45.6 54.3 2.8
Corning Community College 69.1 57.1 48.5 42.1 56.3 4.5
Dutchess Community College 89.2 76.5 65.9 53.1 71.2 -1.6
Erie Community College 75.7 66.6 57.1 50.4 64.5 1.4
Finger Lakes Community College 73.5 58.7 50.5 43.9 58.0 -0.4
Fulton-Montgomery Community College 87.4 73.2 60.8 48.7 65.4 9.6
Genesee Community College 66.6 53.8 51.0 43.9 52.8 2.6
Herkimer County Community College 59.3 51.5 44.8 40.5 48.2 -1.1
Hudson Valley Community College 86.5 69.4 59.0 52.6 65.0 5.6
Jamestown Community College 70.6 56.1 51.3 47.7 56.7 1.4
Jefferson Community College 76.4 65.2 57.1 46.8 59.7 1.9
Mohawk Valley Community College–Utica Branch 69.4 54.3 48.4 41.6 50.6 -2.1
Monroe Community College 88.8 63.8 54.1 48.8 61.3 2.4
Nassau Community College 110.9 87.1 76.4 57.7 86.6 3.9
Niagara County Community College 78.2 63.6 54.1 45.2 69.9 -0.1
North Country Community College 69.1 62.0 56.4 31.3 48.3 1.3
Onondaga Community College 74.3 65.4 53.1 45.4 62.9 6.2
Orange County Community College 98.9 78.9 66.0 51.8 72.8 1.9
Rockland Community College 111.3 87.5 75.9 61.2 90.6 3.8
SUNY Westchester Community College 120.2 106.0 90.2 63.9 101.0 1.8
Schenectady County Community College 58.9 50.0 43.2 39.5 52.0 -1.9
Suffolk County Community College 109.9 84.4 71.8 60.0 86.7 -0.8
Sullivan County Community College 54.2 46.8 40.5 38.1 45.9 2.7
Tompkins Cortland Community College 74.5 55.1 48.2 45.6 63.8 3.9
Ulster County Community College 68.5 58.3 50.8 41.9 59.1 -3.2
BA
CUNY Medgar Evers College 109.9 89.5 75.8 65.6 86.1 1.3
CUNY New York City College of Technology 109.3 86.3 70.7 66.0 79.1 0.6
Farmingdale State College 101.1 78.9 68.0 48.1 80.9 -2.0
Morrisville State College 78.1 66.4 55.0 48.4 59.7 1.5
SUNY College of Agriculture and Technology at Cobleskill 78.0 64.5 56.3 44.4 68.8 1.7
SUNY College of Technology at Alfred 80.0 62.0 54.5 40.7 59.2 -3.0
SUNY College of Technology at Canton 83.6 67.0 57.1 46.7 64.5 -2.3
SUNY College of Technology at Delhi 63.7 67.6 54.6 45.0 56.7 -2.5
United States Military Academy – – – – – –
BA+
CUNY Bernard M Baruch College 120.4 98.3 94.9 69.1 103.8 2.1
CUNY Brooklyn College 111.0 87.6 71.9 60.4 90.4 0.4
CUNY College of Staten Island 108.3 88.1 71.1 62.8 85.3 0.0
CUNY John Jay College of Criminal Justice 115.4 87.8 73.4 65.3 87.0 0.8
CUNY Lehman College 114.3 89.7 73.9 68.6 88.1 0.9
CUNY Queens College 113.6 88.5 73.4 65.7 89.6 1.0
CUNY York College 107.0 86.3 70.9 65.0 81.5 2.8
Fashion Institute of Technology 119.6 91.4 79.3 55.8 88.6 3.0
SUNY College at Brockport 97.6 76.0 60.6 54.1 72.7 -0.7
SUNY College at Buffalo 92.8 75.7 64.4 53.0 75.2 1.3
SUNY College at Cortland 86.7 67.0 56.9 44.7 65.6 -2.7
SUNY College at Old Westbury 98.6 80.5 74.4 56.6 80.1 0.2
State/School
Prof.($)
Assoc.($)
Inst./Lect./Asst.($)
NoRank($)
Avg.($)
%Chng.(%)
State/School
Prof.($)
Assoc.($)
Inst./Lect./Asst.($)
NoRank($)
Avg.($)
%Chng.(%)
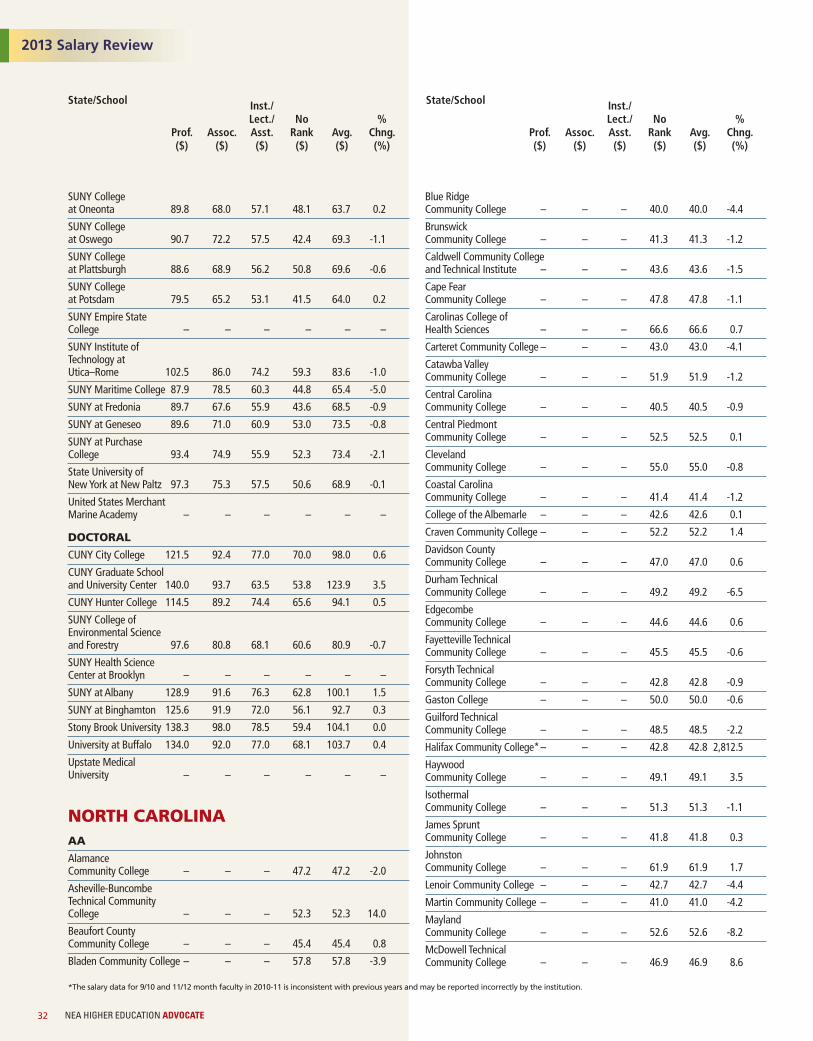
SUNY College at Oneonta 89.8 68.0 57.1 48.1 63.7 0.2
SUNY College at Oswego 90.7 72.2 57.5 42.4 69.3 -1.1
SUNY College at Plattsburgh 88.6 68.9 56.2 50.8 69.6 -0.6
SUNY College at Potsdam 79.5 65.2 53.1 41.5 64.0 0.2
SUNY Empire State College – – – – – –
SUNY Institute of Technology at Utica–Rome 102.5 86.0 74.2 59.3 83.6 -1.0
SUNY Maritime College 87.9 78.5 60.3 44.8 65.4 -5.0
SUNY at Fredonia 89.7 67.6 55.9 43.6 68.5 -0.9
SUNY at Geneseo 89.6 71.0 60.9 53.0 73.5 -0.8
SUNY at Purchase College 93.4 74.9 55.9 52.3 73.4 -2.1
State University of New York at New Paltz 97.3 75.3 57.5 50.6 68.9 -0.1
United States Merchant Marine Academy – – – – – –
DOCTORAL
CUNY City College 121.5 92.4 77.0 70.0 98.0 0.6
CUNY Graduate School and University Center 140.0 93.7 63.5 53.8 123.9 3.5
CUNY Hunter College 114.5 89.2 74.4 65.6 94.1 0.5
SUNY College of Environmental Science and Forestry 97.6 80.8 68.1 60.6 80.9 -0.7
SUNY Health Science Center at Brooklyn – – – – – –
SUNY at Albany 128.9 91.6 76.3 62.8 100.1 1.5
SUNY at Binghamton 125.6 91.9 72.0 56.1 92.7 0.3
Stony Brook University 138.3 98.0 78.5 59.4 104.1 0.0
University at Buffalo 134.0 92.0 77.0 68.1 103.7 0.4
Upstate Medical University – – – – – –
NORTH CAROLINAAA
Alamance Community College – – – 47.2 47.2 -2.0
Asheville-Buncombe Technical Community College – – – 52.3 52.3 14.0
Beaufort County Community College – – – 45.4 45.4 0.8
Bladen Community College – – – 57.8 57.8 -3.9
Blue Ridge Community College – – – 40.0 40.0 -4.4
Brunswick Community College – – – 41.3 41.3 -1.2
Caldwell Community College and Technical Institute – – – 43.6 43.6 -1.5
Cape Fear Community College – – – 47.8 47.8 -1.1
Carolinas College of Health Sciences – – – 66.6 66.6 0.7
Carteret Community College – – – 43.0 43.0 -4.1
Catawba Valley Community College – – – 51.9 51.9 -1.2
Central Carolina Community College – – – 40.5 40.5 -0.9
Central Piedmont Community College – – – 52.5 52.5 0.1
Cleveland Community College – – – 55.0 55.0 -0.8
Coastal Carolina Community College – – – 41.4 41.4 -1.2
College of the Albemarle – – – 42.6 42.6 0.1
Craven Community College – – – 52.2 52.2 1.4
Davidson County Community College – – – 47.0 47.0 0.6
Durham Technical Community College – – – 49.2 49.2 -6.5
Edgecombe Community College – – – 44.6 44.6 0.6
Fayetteville Technical Community College – – – 45.5 45.5 -0.6
Forsyth Technical Community College – – – 42.8 42.8 -0.9
Gaston College – – – 50.0 50.0 -0.6
Guilford Technical Community College – – – 48.5 48.5 -2.2
Halifax Community College*– – – 42.8 42.8 2,812.5
Haywood Community College – – – 49.1 49.1 3.5
Isothermal Community College – – – 51.3 51.3 -1.1
James Sprunt Community College – – – 41.8 41.8 0.3
Johnston Community College – – – 61.9 61.9 1.7
Lenoir Community College – – – 42.7 42.7 -4.4
Martin Community College – – – 41.0 41.0 -4.2
Mayland Community College – – – 52.6 52.6 -8.2
McDowell Technical Community College – – – 46.9 46.9 8.6
2013 Salary Review
State/School
NEA HIGHER EDUCATION ADVOCATE32
Prof.($)
Assoc.($)
Inst./Lect./Asst.($)
NoRank($)
Avg.($)
%Chng.(%)
State/School
Prof.($)
Assoc.($)
Inst./Lect./Asst.($)
NoRank($)
Avg.($)
%Chng.(%)
*The salary data for 9/10 and 11/12 month faculty in 2010-11 is inconsistent with previous years and may be reported incorrectly by the institution.
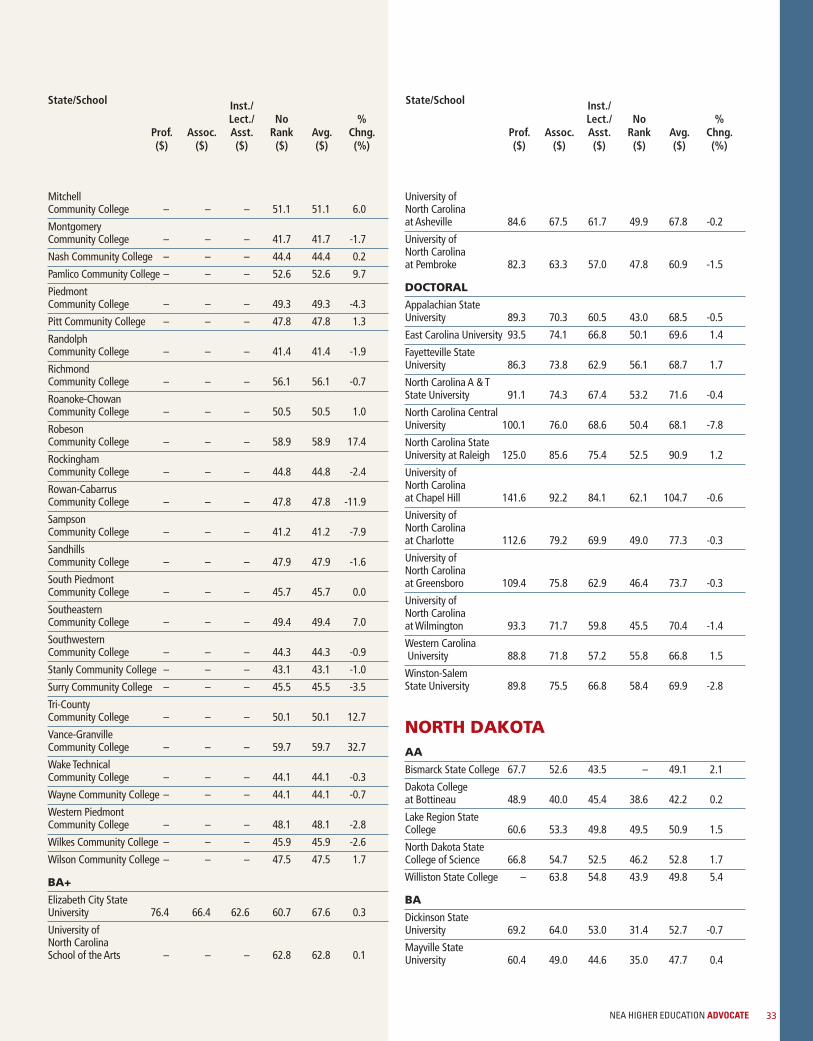
NEA HIGHER EDUCATION ADVOCATE 33
Mitchell Community College – – – 51.1 51.1 6.0
Montgomery Community College – – – 41.7 41.7 -1.7
Nash Community College – – – 44.4 44.4 0.2
Pamlico Community College – – – 52.6 52.6 9.7
Piedmont Community College – – – 49.3 49.3 -4.3
Pitt Community College – – – 47.8 47.8 1.3
Randolph Community College – – – 41.4 41.4 -1.9
Richmond Community College – – – 56.1 56.1 -0.7
Roanoke-Chowan Community College – – – 50.5 50.5 1.0
Robeson Community College – – – 58.9 58.9 17.4
Rockingham Community College – – – 44.8 44.8 -2.4
Rowan-Cabarrus Community College – – – 47.8 47.8 -11.9
Sampson Community College – – – 41.2 41.2 -7.9
Sandhills Community College – – – 47.9 47.9 -1.6
South Piedmont Community College – – – 45.7 45.7 0.0
Southeastern Community College – – – 49.4 49.4 7.0
Southwestern Community College – – – 44.3 44.3 -0.9
Stanly Community College – – – 43.1 43.1 -1.0
Surry Community College – – – 45.5 45.5 -3.5
Tri-County Community College – – – 50.1 50.1 12.7
Vance-Granville Community College – – – 59.7 59.7 32.7
Wake Technical Community College – – – 44.1 44.1 -0.3
Wayne Community College – – – 44.1 44.1 -0.7
Western Piedmont Community College – – – 48.1 48.1 -2.8
Wilkes Community College – – – 45.9 45.9 -2.6
Wilson Community College – – – 47.5 47.5 1.7
BA+
Elizabeth City State University 76.4 66.4 62.6 60.7 67.6 0.3
University of North Carolina School of the Arts – – – 62.8 62.8 0.1
University of North Carolina at Asheville 84.6 67.5 61.7 49.9 67.8 -0.2
University of North Carolina at Pembroke 82.3 63.3 57.0 47.8 60.9 -1.5
DOCTORAL
Appalachian State University 89.3 70.3 60.5 43.0 68.5 -0.5
East Carolina University 93.5 74.1 66.8 50.1 69.6 1.4
Fayetteville State University 86.3 73.8 62.9 56.1 68.7 1.7
North Carolina A & T State University 91.1 74.3 67.4 53.2 71.6 -0.4
North Carolina Central University 100.1 76.0 68.6 50.4 68.1 -7.8
North Carolina State University at Raleigh 125.0 85.6 75.4 52.5 90.9 1.2
University of North Carolina at Chapel Hill 141.6 92.2 84.1 62.1 104.7 -0.6
University of North Carolina at Charlotte 112.6 79.2 69.9 49.0 77.3 -0.3
University of North Carolina at Greensboro 109.4 75.8 62.9 46.4 73.7 -0.3
University of North Carolina at Wilmington 93.3 71.7 59.8 45.5 70.4 -1.4
Western CarolinaUniversity 88.8 71.8 57.2 55.8 66.8 1.5
Winston-Salem State University 89.8 75.5 66.8 58.4 69.9 -2.8
NORTH DAKOTAAA
Bismarck State College 67.7 52.6 43.5 – 49.1 2.1
Dakota College at Bottineau 48.9 40.0 45.4 38.6 42.2 0.2
Lake Region State College 60.6 53.3 49.8 49.5 50.9 1.5
North Dakota State College of Science 66.8 54.7 52.5 46.2 52.8 1.7
Williston State College – 63.8 54.8 43.9 49.8 5.4
BA
Dickinson State University 69.2 64.0 53.0 31.4 52.7 -0.7
Mayville State University 60.4 49.0 44.6 35.0 47.7 0.4
State/School
Prof.($)
Assoc.($)
Inst./Lect./Asst.($)
NoRank($)
Avg.($)
%Chng.(%)
State/School
Prof.($)
Assoc.($)
Inst./Lect./Asst.($)
NoRank($)
Avg.($)
%Chng.(%)
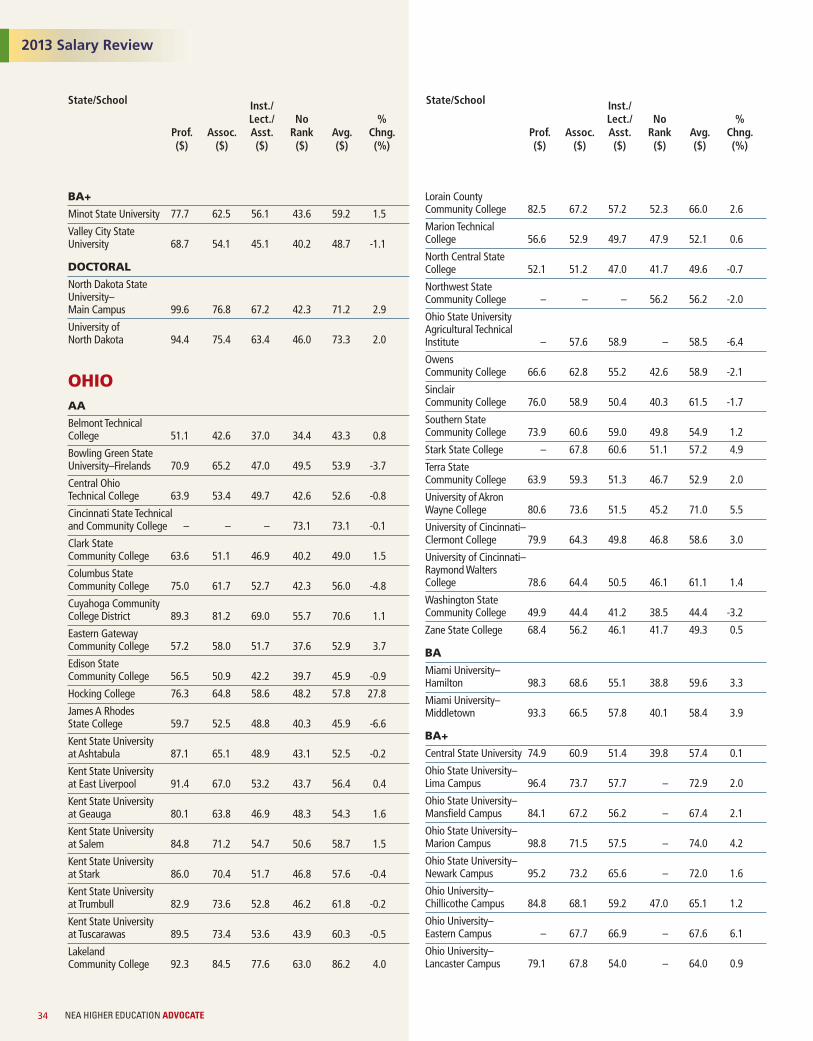
BA+
Minot State University 77.7 62.5 56.1 43.6 59.2 1.5
Valley City State University 68.7 54.1 45.1 40.2 48.7 -1.1
DOCTORAL
North Dakota State University–Main Campus 99.6 76.8 67.2 42.3 71.2 2.9
University of North Dakota 94.4 75.4 63.4 46.0 73.3 2.0
OHIOAA
Belmont Technical College 51.1 42.6 37.0 34.4 43.3 0.8
Bowling Green State University–Firelands 70.9 65.2 47.0 49.5 53.9 -3.7
Central Ohio Technical College 63.9 53.4 49.7 42.6 52.6 -0.8
Cincinnati State Technical and Community College – – – 73.1 73.1 -0.1
Clark State Community College 63.6 51.1 46.9 40.2 49.0 1.5
Columbus State Community College 75.0 61.7 52.7 42.3 56.0 -4.8
Cuyahoga Community College District 89.3 81.2 69.0 55.7 70.6 1.1
Eastern Gateway Community College 57.2 58.0 51.7 37.6 52.9 3.7
Edison State Community College 56.5 50.9 42.2 39.7 45.9 -0.9
Hocking College 76.3 64.8 58.6 48.2 57.8 27.8
James A Rhodes State College 59.7 52.5 48.8 40.3 45.9 -6.6
Kent State University at Ashtabula 87.1 65.1 48.9 43.1 52.5 -0.2
Kent State University at East Liverpool 91.4 67.0 53.2 43.7 56.4 0.4
Kent State University at Geauga 80.1 63.8 46.9 48.3 54.3 1.6
Kent State University at Salem 84.8 71.2 54.7 50.6 58.7 1.5
Kent State University at Stark 86.0 70.4 51.7 46.8 57.6 -0.4
Kent State University at Trumbull 82.9 73.6 52.8 46.2 61.8 -0.2
Kent State University at Tuscarawas 89.5 73.4 53.6 43.9 60.3 -0.5
Lakeland Community College 92.3 84.5 77.6 63.0 86.2 4.0
Lorain County Community College 82.5 67.2 57.2 52.3 66.0 2.6
Marion Technical College 56.6 52.9 49.7 47.9 52.1 0.6
North Central State College 52.1 51.2 47.0 41.7 49.6 -0.7
Northwest State Community College – – – 56.2 56.2 -2.0
Ohio State University Agricultural Technical Institute – 57.6 58.9 – 58.5 -6.4
Owens Community College 66.6 62.8 55.2 42.6 58.9 -2.1
Sinclair Community College 76.0 58.9 50.4 40.3 61.5 -1.7
Southern State Community College 73.9 60.6 59.0 49.8 54.9 1.2
Stark State College – 67.8 60.6 51.1 57.2 4.9
Terra State Community College 63.9 59.3 51.3 46.7 52.9 2.0
University of Akron Wayne College 80.6 73.6 51.5 45.2 71.0 5.5
University of Cincinnati–Clermont College 79.9 64.3 49.8 46.8 58.6 3.0
University of Cincinnati–Raymond Walters College 78.6 64.4 50.5 46.1 61.1 1.4
Washington State Community College 49.9 44.4 41.2 38.5 44.4 -3.2
Zane State College 68.4 56.2 46.1 41.7 49.3 0.5
BA
Miami University–Hamilton 98.3 68.6 55.1 38.8 59.6 3.3
Miami University–Middletown 93.3 66.5 57.8 40.1 58.4 3.9
BA+
Central State University 74.9 60.9 51.4 39.8 57.4 0.1
Ohio State University–Lima Campus 96.4 73.7 57.7 – 72.9 2.0
Ohio State University–Mansfield Campus 84.1 67.2 56.2 – 67.4 2.1
Ohio State University–Marion Campus 98.8 71.5 57.5 – 74.0 4.2
Ohio State University–Newark Campus 95.2 73.2 65.6 – 72.0 1.6
Ohio University–Chillicothe Campus 84.8 68.1 59.2 47.0 65.1 1.2
Ohio University–Eastern Campus – 67.7 66.9 – 67.6 6.1
Ohio University–Lancaster Campus 79.1 67.8 54.0 – 64.0 0.9
2013 Salary Review
State/School
NEA HIGHER EDUCATION ADVOCATE34
Prof.($)
Assoc.($)
Inst./Lect./Asst.($)
NoRank($)
Avg.($)
%Chng.(%)
State/School
Prof.($)
Assoc.($)
Inst./Lect./Asst.($)
NoRank($)
Avg.($)
%Chng.(%)
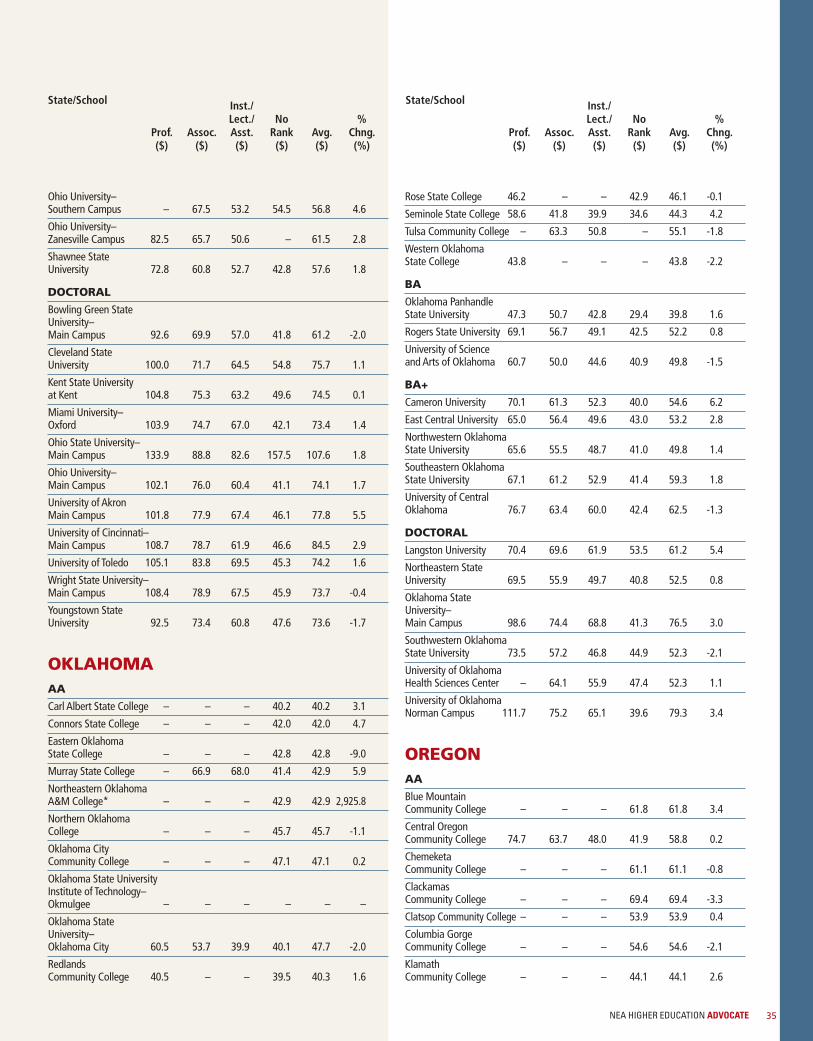
NEA HIGHER EDUCATION ADVOCATE 35
Ohio University–Southern Campus – 67.5 53.2 54.5 56.8 4.6
Ohio University–Zanesville Campus 82.5 65.7 50.6 – 61.5 2.8
Shawnee State University 72.8 60.8 52.7 42.8 57.6 1.8
DOCTORAL
Bowling Green State University–Main Campus 92.6 69.9 57.0 41.8 61.2 -2.0
Cleveland State University 100.0 71.7 64.5 54.8 75.7 1.1
Kent State University at Kent 104.8 75.3 63.2 49.6 74.5 0.1
Miami University–Oxford 103.9 74.7 67.0 42.1 73.4 1.4
Ohio State University–Main Campus 133.9 88.8 82.6 157.5 107.6 1.8
Ohio University–Main Campus 102.1 76.0 60.4 41.1 74.1 1.7
University of Akron Main Campus 101.8 77.9 67.4 46.1 77.8 5.5
University of Cincinnati–Main Campus 108.7 78.7 61.9 46.6 84.5 2.9
University of Toledo 105.1 83.8 69.5 45.3 74.2 1.6
Wright State University–Main Campus 108.4 78.9 67.5 45.9 73.7 -0.4
Youngstown State University 92.5 73.4 60.8 47.6 73.6 -1.7
OKLAHOMAAA
Carl Albert State College – – – 40.2 40.2 3.1
Connors State College – – – 42.0 42.0 4.7
Eastern Oklahoma State College – – – 42.8 42.8 -9.0
Murray State College – 66.9 68.0 41.4 42.9 5.9
Northeastern Oklahoma A&M College* – – – 42.9 42.9 2,925.8
Northern Oklahoma College – – – 45.7 45.7 -1.1
Oklahoma City Community College – – – 47.1 47.1 0.2
Oklahoma State University Institute of Technology–Okmulgee – – – – – –
Oklahoma State University–Oklahoma City 60.5 53.7 39.9 40.1 47.7 -2.0
Redlands Community College 40.5 – – 39.5 40.3 1.6
Rose State College 46.2 – – 42.9 46.1 -0.1
Seminole State College 58.6 41.8 39.9 34.6 44.3 4.2
Tulsa Community College – 63.3 50.8 – 55.1 -1.8
Western Oklahoma State College 43.8 – – – 43.8 -2.2
BA
Oklahoma Panhandle State University 47.3 50.7 42.8 29.4 39.8 1.6
Rogers State University 69.1 56.7 49.1 42.5 52.2 0.8
University of Science and Arts of Oklahoma 60.7 50.0 44.6 40.9 49.8 -1.5
BA+
Cameron University 70.1 61.3 52.3 40.0 54.6 6.2
East Central University 65.0 56.4 49.6 43.0 53.2 2.8
Northwestern Oklahoma State University 65.6 55.5 48.7 41.0 49.8 1.4
Southeastern Oklahoma State University 67.1 61.2 52.9 41.4 59.3 1.8
University of Central Oklahoma 76.7 63.4 60.0 42.4 62.5 -1.3
DOCTORAL
Langston University 70.4 69.6 61.9 53.5 61.2 5.4
Northeastern State University 69.5 55.9 49.7 40.8 52.5 0.8
Oklahoma State University–Main Campus 98.6 74.4 68.8 41.3 76.5 3.0
Southwestern Oklahoma State University 73.5 57.2 46.8 44.9 52.3 -2.1
University of Oklahoma Health Sciences Center – 64.1 55.9 47.4 52.3 1.1
University of Oklahoma Norman Campus 111.7 75.2 65.1 39.6 79.3 3.4
OREGONAA
Blue Mountain Community College – – – 61.8 61.8 3.4
Central Oregon Community College 74.7 63.7 48.0 41.9 58.8 0.2
Chemeketa Community College – – – 61.1 61.1 -0.8
Clackamas Community College – – – 69.4 69.4 -3.3
Clatsop Community College – – – 53.9 53.9 0.4
Columbia Gorge Community College – – – 54.6 54.6 -2.1
Klamath Community College – – – 44.1 44.1 2.6
State/School
Prof.($)
Assoc.($)
Inst./Lect./Asst.($)
NoRank($)
Avg.($)
%Chng.(%)
State/School
Prof.($)
Assoc.($)
Inst./Lect./Asst.($)
NoRank($)
Avg.($)
%Chng.(%)
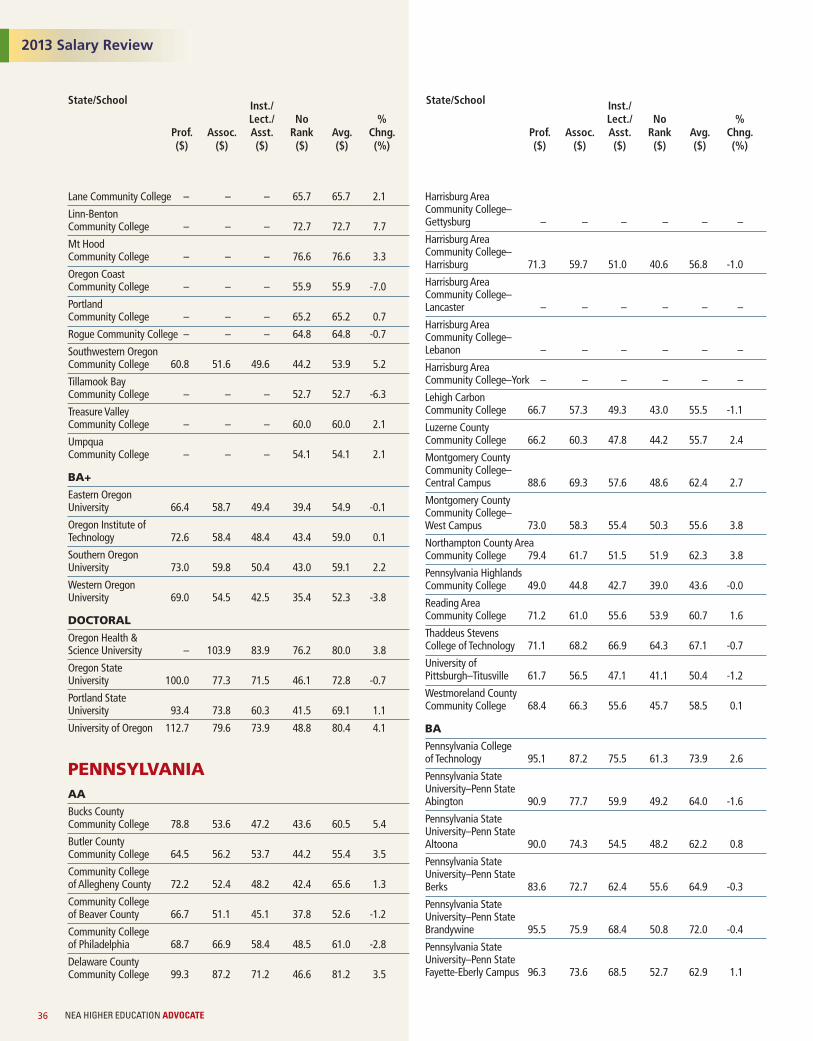
Lane Community College – – – 65.7 65.7 2.1
Linn-Benton Community College – – – 72.7 72.7 7.7
Mt Hood Community College – – – 76.6 76.6 3.3
Oregon Coast Community College – – – 55.9 55.9 -7.0
Portland Community College – – – 65.2 65.2 0.7
Rogue Community College – – – 64.8 64.8 -0.7
Southwestern Oregon Community College 60.8 51.6 49.6 44.2 53.9 5.2
Tillamook Bay Community College – – – 52.7 52.7 -6.3
Treasure Valley Community College – – – 60.0 60.0 2.1
Umpqua Community College – – – 54.1 54.1 2.1
BA+
Eastern Oregon University 66.4 58.7 49.4 39.4 54.9 -0.1
Oregon Institute of Technology 72.6 58.4 48.4 43.4 59.0 0.1
Southern Oregon University 73.0 59.8 50.4 43.0 59.1 2.2
Western Oregon University 69.0 54.5 42.5 35.4 52.3 -3.8
DOCTORAL
Oregon Health & Science University – 103.9 83.9 76.2 80.0 3.8
Oregon State University 100.0 77.3 71.5 46.1 72.8 -0.7
Portland State University 93.4 73.8 60.3 41.5 69.1 1.1
University of Oregon 112.7 79.6 73.9 48.8 80.4 4.1
PENNSYLVANIAAA
Bucks County Community College 78.8 53.6 47.2 43.6 60.5 5.4
Butler County Community College 64.5 56.2 53.7 44.2 55.4 3.5
Community College of Allegheny County 72.2 52.4 48.2 42.4 65.6 1.3
Community College of Beaver County 66.7 51.1 45.1 37.8 52.6 -1.2
Community College of Philadelphia 68.7 66.9 58.4 48.5 61.0 -2.8
Delaware County Community College 99.3 87.2 71.2 46.6 81.2 3.5
Harrisburg Area Community College–Gettysburg – – – – – –
Harrisburg Area Community College–Harrisburg 71.3 59.7 51.0 40.6 56.8 -1.0
Harrisburg Area Community College–Lancaster – – – – – –
Harrisburg Area Community College–Lebanon – – – – – –
Harrisburg Area Community College–York – – – – – –
Lehigh Carbon Community College 66.7 57.3 49.3 43.0 55.5 -1.1
Luzerne County Community College 66.2 60.3 47.8 44.2 55.7 2.4
Montgomery County Community College–Central Campus 88.6 69.3 57.6 48.6 62.4 2.7
Montgomery County Community College–West Campus 73.0 58.3 55.4 50.3 55.6 3.8
Northampton County Area Community College 79.4 61.7 51.5 51.9 62.3 3.8
Pennsylvania Highlands Community College 49.0 44.8 42.7 39.0 43.6 -0.0
Reading Area Community College 71.2 61.0 55.6 53.9 60.7 1.6
Thaddeus Stevens College of Technology 71.1 68.2 66.9 64.3 67.1 -0.7
University of Pittsburgh–Titusville 61.7 56.5 47.1 41.1 50.4 -1.2
Westmoreland County Community College 68.4 66.3 55.6 45.7 58.5 0.1
BA
Pennsylvania College of Technology 95.1 87.2 75.5 61.3 73.9 2.6
Pennsylvania State University–Penn State Abington 90.9 77.7 59.9 49.2 64.0 -1.6
Pennsylvania State University–Penn State Altoona 90.0 74.3 54.5 48.2 62.2 0.8
Pennsylvania State University–Penn State Berks 83.6 72.7 62.4 55.6 64.9 -0.3
Pennsylvania State University–Penn State Brandywine 95.5 75.9 68.4 50.8 72.0 -0.4
Pennsylvania State University–Penn State Fayette-Eberly Campus 96.3 73.6 68.5 52.7 62.9 1.1
2013 Salary Review
State/School
NEA HIGHER EDUCATION ADVOCATE36
Prof.($)
Assoc.($)
Inst./Lect./Asst.($)
NoRank($)
Avg.($)
%Chng.(%)
State/School
Prof.($)
Assoc.($)
Inst./Lect./Asst.($)
NoRank($)
Avg.($)
%Chng.(%)

NEA HIGHER EDUCATION ADVOCATE 37
Pennsylvania State University–Penn State Hazleton 83.7 75.5 66.3 51.6 62.8 -0.1
Pennsylvania State University–Penn State Lehigh Valley 95.0 71.3 67.9 50.8 64.4 -1.0
Pennsylvania State University–Penn State Mont Alto 103.6 69.6 68.8 55.5 62.0 -0.9
Pennsylvania State University–Penn State Schuylkill 102.0 76.5 63.1 46.9 63.6 -1.4
Pennsylvania State University–Penn State Shenango 127.5 75.8 62.3 51.5 62.6 -4.8
Pennsylvania State University–Penn State Wilkes-Barre 89.1 75.4 60.7 52.2 67.5 -0.2
Pennsylvania State University–Penn State Worthington Scranton 92.5 77.3 68.5 58.9 68.5 1.6
University of Pittsburgh–Bradford 81.7 67.1 55.9 47.9 61.3 1.1
University of Pittsburgh–Greensburg 77.8 62.9 51.5 43.5 56.4 1.2
University of Pittsburgh–Johnstown 73.5 62.4 51.0 46.2 55.7 -1.3
BA+
California University of Pennsylvania 103.0 83.0 68.0 50.3 82.3 -0.8
Cheyney University of Pennsylvania 103.2 80.9 66.6 48.5 80.0 3.9
Clarion University of Pennsylvania 103.5 81.8 65.9 50.3 83.5 -0.2
East Stroudsburg University of Pennsylvania 104.5 81.6 65.8 47.9 80.8 2.6
Edinboro University of Pennsylvania 102.4 81.9 67.0 46.6 79.1 -0.9
Kutztown University of Pennsylvania 102.7 81.7 60.8 45.6 74.9 -2.3
Lincoln University of Pennsylvania 96.3 72.8 56.3 47.6 71.2 -0.5
Lock Haven University 98.6 79.0 65.3 49.6 79.5 -0.7
Mansfield University of Pennsylvania 103.5 82.2 63.3 50.5 82.7 1.2
Millersville University of Pennsylvania 103.8 83.0 64.6 – 83.7 0.0
Pennsylvania State University–Penn State Beaver 84.0 72.9 63.1 54.9 64.7 0.3
Pennsylvania State University–Penn State Dubois 90.6 72.3 65.5 55.2 65.6 0.1
Pennsylvania State University–Penn State Erie-Behrend College 117.2 85.6 70.8 57.1 74.3 -1.0
Pennsylvania State University–Penn State Greater Allegheny 90.4 75.3 62.4 56.8 67.8 0.2
Pennsylvania State University–Penn State New Kensington 96.7 82.3 67.0 61.3 72.4 0.6
Pennsylvania State University–Penn State York 95.0 73.5 62.3 56.6 66.8 -1.0
Shippensburg University of Pennsylvania 103.5 82.1 67.0 45.5 82.6 0.9
West Chester University of Pennsylvania 103.9 83.9 67.5 47.2 78.7 0.0
DOCTORAL
Bloomsburg University of Pennsylvania 104.4 82.1 64.5 48.7 77.8 -2.4
Indiana University of Pennsylvania–Main Campus 103.7 83.2 63.3 47.0 80.7 -1.6
Pennsylvania State University–Main Campus 130.3 89.4 75.8 50.7 93.4 0.3
Pennsylvania State University–Penn State Harrisburg 107.7 86.3 72.6 56.2 78.6 -2.0
Slippery Rock University of Pennsylvania 105.2 84.7 70.4 48.2 80.3 -0.5
Temple University 133.2 93.5 69.5 55.6 93.1 2.8
University of Pittsburgh–Pittsburgh Campus 130.5 87.9 75.2 43.8 89.8 2.8
RHODE ISLANDAA
Community College of Rhode Island 74.9 56.8 49.0 – 61.1 -1.2
DOCTORAL
Rhode Island College 75.9 64.1 56.1 47.0 65.2 -0.6
University of Rhode Island 105.2 79.6 65.8 45.1 82.5 -0.8
SOUTH CAROLINAAA
Aiken Technical College – – – 47.3 47.3 -0.6
Central Carolina Technical College – – – 45.4 45.4 1.4
Denmark Technical College – – – 39.1 39.1 1.2
State/School
Prof.($)
Assoc.($)
Inst./Lect./Asst.($)
NoRank($)
Avg.($)
%Chng.(%)
State/School
Prof.($)
Assoc.($)
Inst./Lect./Asst.($)
NoRank($)
Avg.($)
%Chng.(%)
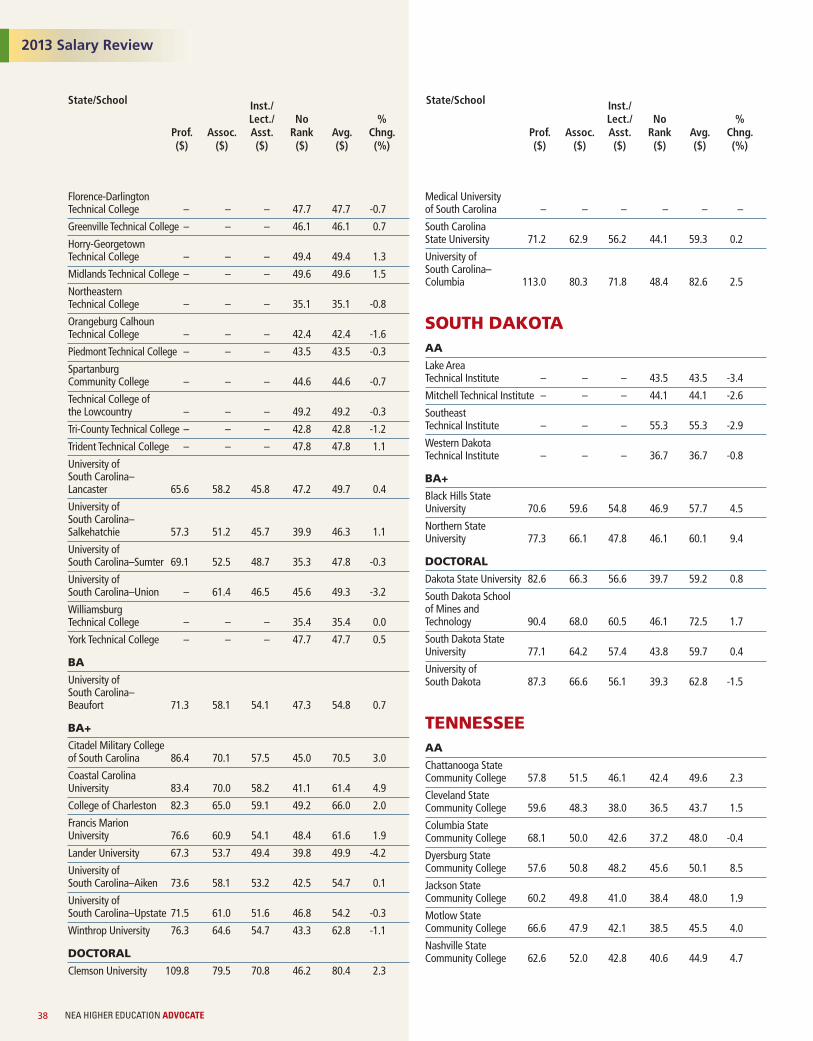
Florence-Darlington Technical College – – – 47.7 47.7 -0.7
Greenville Technical College – – – 46.1 46.1 0.7
Horry-Georgetown Technical College – – – 49.4 49.4 1.3
Midlands Technical College – – – 49.6 49.6 1.5
Northeastern Technical College – – – 35.1 35.1 -0.8
Orangeburg Calhoun Technical College – – – 42.4 42.4 -1.6
Piedmont Technical College – – – 43.5 43.5 -0.3
Spartanburg Community College – – – 44.6 44.6 -0.7
Technical College of the Lowcountry – – – 49.2 49.2 -0.3
Tri-County Technical College – – – 42.8 42.8 -1.2
Trident Technical College – – – 47.8 47.8 1.1
University of South Carolina–Lancaster 65.6 58.2 45.8 47.2 49.7 0.4
University of South Carolina–Salkehatchie 57.3 51.2 45.7 39.9 46.3 1.1
University of South Carolina–Sumter 69.1 52.5 48.7 35.3 47.8 -0.3
University of South Carolina–Union – 61.4 46.5 45.6 49.3 -3.2
Williamsburg Technical College – – – 35.4 35.4 0.0
York Technical College – – – 47.7 47.7 0.5
BA
University of South Carolina–Beaufort 71.3 58.1 54.1 47.3 54.8 0.7
BA+
Citadel Military College of South Carolina 86.4 70.1 57.5 45.0 70.5 3.0
Coastal Carolina University 83.4 70.0 58.2 41.1 61.4 4.9
College of Charleston 82.3 65.0 59.1 49.2 66.0 2.0
Francis Marion University 76.6 60.9 54.1 48.4 61.6 1.9
Lander University 67.3 53.7 49.4 39.8 49.9 -4.2
University of South Carolina–Aiken 73.6 58.1 53.2 42.5 54.7 0.1
University of South Carolina–Upstate 71.5 61.0 51.6 46.8 54.2 -0.3
Winthrop University 76.3 64.6 54.7 43.3 62.8 -1.1
DOCTORAL
Clemson University 109.8 79.5 70.8 46.2 80.4 2.3
Medical University of South Carolina – – – – – –
South Carolina State University 71.2 62.9 56.2 44.1 59.3 0.2
University of South Carolina–Columbia 113.0 80.3 71.8 48.4 82.6 2.5
SOUTH DAKOTAAA
Lake Area Technical Institute – – – 43.5 43.5 -3.4
Mitchell Technical Institute – – – 44.1 44.1 -2.6
Southeast Technical Institute – – – 55.3 55.3 -2.9
Western Dakota Technical Institute – – – 36.7 36.7 -0.8
BA+
Black Hills State University 70.6 59.6 54.8 46.9 57.7 4.5
Northern State University 77.3 66.1 47.8 46.1 60.1 9.4
DOCTORAL
Dakota State University 82.6 66.3 56.6 39.7 59.2 0.8
South Dakota School of Mines and Technology 90.4 68.0 60.5 46.1 72.5 1.7
South Dakota State University 77.1 64.2 57.4 43.8 59.7 0.4
University of South Dakota 87.3 66.6 56.1 39.3 62.8 -1.5
TENNESSEEAA
Chattanooga State Community College 57.8 51.5 46.1 42.4 49.6 2.3
Cleveland State Community College 59.6 48.3 38.0 36.5 43.7 1.5
Columbia State Community College 68.1 50.0 42.6 37.2 48.0 -0.4
Dyersburg State Community College 57.6 50.8 48.2 45.6 50.1 8.5
Jackson State Community College 60.2 49.8 41.0 38.4 48.0 1.9
Motlow State Community College 66.6 47.9 42.1 38.5 45.5 4.0
Nashville State Community College 62.6 52.0 42.8 40.6 44.9 4.7
2013 Salary Review
State/School
NEA HIGHER EDUCATION ADVOCATE38
Prof.($)
Assoc.($)
Inst./Lect./Asst.($)
NoRank($)
Avg.($)
%Chng.(%)
State/School
Prof.($)
Assoc.($)
Inst./Lect./Asst.($)
NoRank($)
Avg.($)
%Chng.(%)
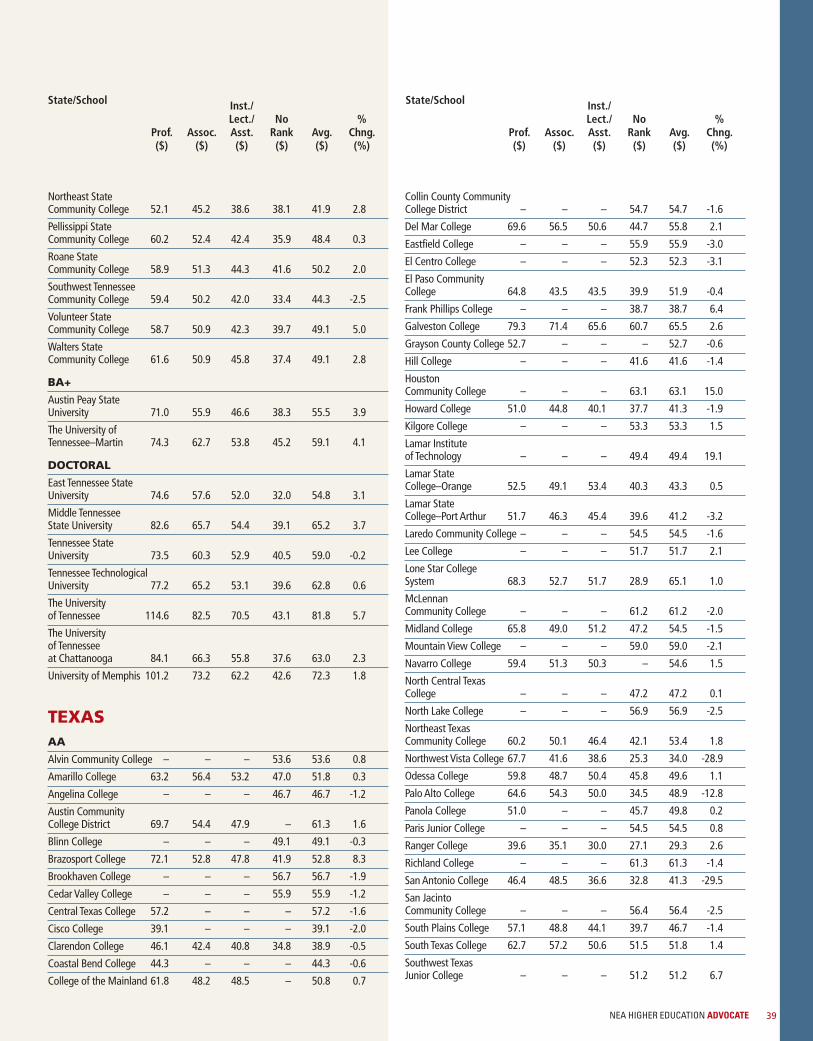
NEA HIGHER EDUCATION ADVOCATE 39
Northeast State Community College 52.1 45.2 38.6 38.1 41.9 2.8
Pellissippi State Community College 60.2 52.4 42.4 35.9 48.4 0.3
Roane State Community College 58.9 51.3 44.3 41.6 50.2 2.0
Southwest Tennessee Community College 59.4 50.2 42.0 33.4 44.3 -2.5
Volunteer State Community College 58.7 50.9 42.3 39.7 49.1 5.0
Walters State Community College 61.6 50.9 45.8 37.4 49.1 2.8
BA+
Austin Peay State University 71.0 55.9 46.6 38.3 55.5 3.9
The University of Tennessee–Martin 74.3 62.7 53.8 45.2 59.1 4.1
DOCTORAL
East Tennessee State University 74.6 57.6 52.0 32.0 54.8 3.1
Middle Tennessee State University 82.6 65.7 54.4 39.1 65.2 3.7
Tennessee State University 73.5 60.3 52.9 40.5 59.0 -0.2
Tennessee Technological University 77.2 65.2 53.1 39.6 62.8 0.6
The University of Tennessee 114.6 82.5 70.5 43.1 81.8 5.7
The University of Tennessee at Chattanooga 84.1 66.3 55.8 37.6 63.0 2.3
University of Memphis 101.2 73.2 62.2 42.6 72.3 1.8
TEXASAA
Alvin Community College – – – 53.6 53.6 0.8
Amarillo College 63.2 56.4 53.2 47.0 51.8 0.3
Angelina College – – – 46.7 46.7 -1.2
Austin Community College District 69.7 54.4 47.9 – 61.3 1.6
Blinn College – – – 49.1 49.1 -0.3
Brazosport College 72.1 52.8 47.8 41.9 52.8 8.3
Brookhaven College – – – 56.7 56.7 -1.9
Cedar Valley College – – – 55.9 55.9 -1.2
Central Texas College 57.2 – – – 57.2 -1.6
Cisco College 39.1 – – – 39.1 -2.0
Clarendon College 46.1 42.4 40.8 34.8 38.9 -0.5
Coastal Bend College 44.3 – – – 44.3 -0.6
College of the Mainland 61.8 48.2 48.5 – 50.8 0.7
Collin County Community College District – – – 54.7 54.7 -1.6
Del Mar College 69.6 56.5 50.6 44.7 55.8 2.1
Eastfield College – – – 55.9 55.9 -3.0
El Centro College – – – 52.3 52.3 -3.1
El Paso Community College 64.8 43.5 43.5 39.9 51.9 -0.4
Frank Phillips College – – – 38.7 38.7 6.4
Galveston College 79.3 71.4 65.6 60.7 65.5 2.6
Grayson County College 52.7 – – – 52.7 -0.6
Hill College – – – 41.6 41.6 -1.4
Houston Community College – – – 63.1 63.1 15.0
Howard College 51.0 44.8 40.1 37.7 41.3 -1.9
Kilgore College – – – 53.3 53.3 1.5
Lamar Institute of Technology – – – 49.4 49.4 19.1
Lamar State College–Orange 52.5 49.1 53.4 40.3 43.3 0.5
Lamar State College–Port Arthur 51.7 46.3 45.4 39.6 41.2 -3.2
Laredo Community College – – – 54.5 54.5 -1.6
Lee College – – – 51.7 51.7 2.1
Lone Star College System 68.3 52.7 51.7 28.9 65.1 1.0
McLennan Community College – – – 61.2 61.2 -2.0
Midland College 65.8 49.0 51.2 47.2 54.5 -1.5
Mountain View College – – – 59.0 59.0 -2.1
Navarro College 59.4 51.3 50.3 – 54.6 1.5
North Central Texas College – – – 47.2 47.2 0.1
North Lake College – – – 56.9 56.9 -2.5
Northeast Texas Community College 60.2 50.1 46.4 42.1 53.4 1.8
Northwest Vista College 67.7 41.6 38.6 25.3 34.0 -28.9
Odessa College 59.8 48.7 50.4 45.8 49.6 1.1
Palo Alto College 64.6 54.3 50.0 34.5 48.9 -12.8
Panola College 51.0 – – 45.7 49.8 0.2
Paris Junior College – – – 54.5 54.5 0.8
Ranger College 39.6 35.1 30.0 27.1 29.3 2.6
Richland College – – – 61.3 61.3 -1.4
San Antonio College 46.4 48.5 36.6 32.8 41.3 -29.5
San Jacinto Community College – – – 56.4 56.4 -2.5
South Plains College 57.1 48.8 44.1 39.7 46.7 -1.4
South Texas College 62.7 57.2 50.6 51.5 51.8 1.4
Southwest Texas Junior College – – – 51.2 51.2 6.7
State/School
Prof.($)
Assoc.($)
Inst./Lect./Asst.($)
NoRank($)
Avg.($)
%Chng.(%)
State/School
Prof.($)
Assoc.($)
Inst./Lect./Asst.($)
NoRank($)
Avg.($)
%Chng.(%)
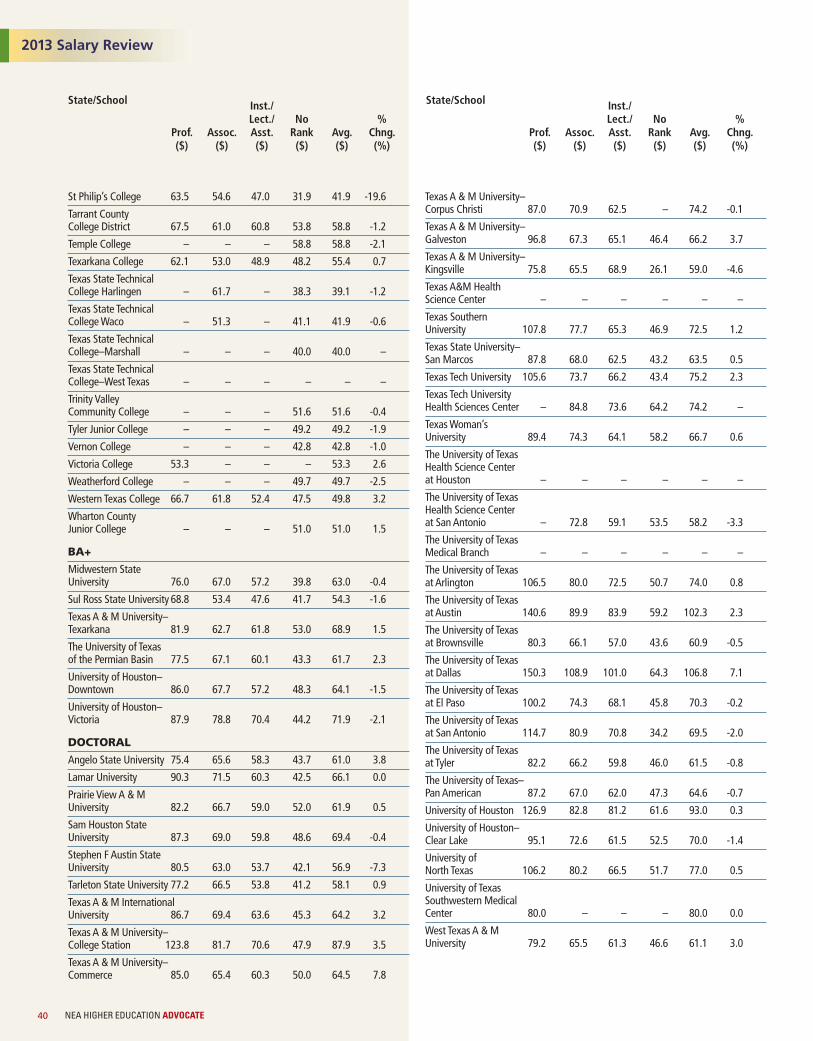
St Philip’s College 63.5 54.6 47.0 31.9 41.9 -19.6
Tarrant County College District 67.5 61.0 60.8 53.8 58.8 -1.2
Temple College – – – 58.8 58.8 -2.1
Texarkana College 62.1 53.0 48.9 48.2 55.4 0.7
Texas State Technical College Harlingen – 61.7 – 38.3 39.1 -1.2
Texas State Technical College Waco – 51.3 – 41.1 41.9 -0.6
Texas State Technical College–Marshall – – – 40.0 40.0 –
Texas State Technical College–West Texas – – – – – –
Trinity Valley Community College – – – 51.6 51.6 -0.4
Tyler Junior College – – – 49.2 49.2 -1.9
Vernon College – – – 42.8 42.8 -1.0
Victoria College 53.3 – – – 53.3 2.6
Weatherford College – – – 49.7 49.7 -2.5
Western Texas College 66.7 61.8 52.4 47.5 49.8 3.2
Wharton County Junior College – – – 51.0 51.0 1.5
BA+
Midwestern State University 76.0 67.0 57.2 39.8 63.0 -0.4
Sul Ross State University 68.8 53.4 47.6 41.7 54.3 -1.6
Texas A & M University–Texarkana 81.9 62.7 61.8 53.0 68.9 1.5
The University of Texas of the Permian Basin 77.5 67.1 60.1 43.3 61.7 2.3
University of Houston–Downtown 86.0 67.7 57.2 48.3 64.1 -1.5
University of Houston–Victoria 87.9 78.8 70.4 44.2 71.9 -2.1
DOCTORAL
Angelo State University 75.4 65.6 58.3 43.7 61.0 3.8
Lamar University 90.3 71.5 60.3 42.5 66.1 0.0
Prairie View A & M University 82.2 66.7 59.0 52.0 61.9 0.5
Sam Houston State University 87.3 69.0 59.8 48.6 69.4 -0.4
Stephen F Austin State University 80.5 63.0 53.7 42.1 56.9 -7.3
Tarleton State University 77.2 66.5 53.8 41.2 58.1 0.9
Texas A & M International University 86.7 69.4 63.6 45.3 64.2 3.2
Texas A & M University–College Station 123.8 81.7 70.6 47.9 87.9 3.5
Texas A & M University–Commerce 85.0 65.4 60.3 50.0 64.5 7.8
Texas A & M University–Corpus Christi 87.0 70.9 62.5 – 74.2 -0.1
Texas A & M University–Galveston 96.8 67.3 65.1 46.4 66.2 3.7
Texas A & M University–Kingsville 75.8 65.5 68.9 26.1 59.0 -4.6
Texas A&M Health Science Center – – – – – –
Texas Southern University 107.8 77.7 65.3 46.9 72.5 1.2
Texas State University–San Marcos 87.8 68.0 62.5 43.2 63.5 0.5
Texas Tech University 105.6 73.7 66.2 43.4 75.2 2.3
Texas Tech University Health Sciences Center – 84.8 73.6 64.2 74.2 –
Texas Woman’s University 89.4 74.3 64.1 58.2 66.7 0.6
The University of Texas Health Science Center at Houston – – – – – –
The University of Texas Health Science Center at San Antonio – 72.8 59.1 53.5 58.2 -3.3
The University of Texas Medical Branch – – – – – –
The University of Texas at Arlington 106.5 80.0 72.5 50.7 74.0 0.8
The University of Texas at Austin 140.6 89.9 83.9 59.2 102.3 2.3
The University of Texas at Brownsville 80.3 66.1 57.0 43.6 60.9 -0.5
The University of Texas at Dallas 150.3 108.9 101.0 64.3 106.8 7.1
The University of Texas at El Paso 100.2 74.3 68.1 45.8 70.3 -0.2
The University of Texas at San Antonio 114.7 80.9 70.8 34.2 69.5 -2.0
The University of Texas at Tyler 82.2 66.2 59.8 46.0 61.5 -0.8
The University of Texas–Pan American 87.2 67.0 62.0 47.3 64.6 -0.7
University of Houston 126.9 82.8 81.2 61.6 93.0 0.3
University of Houston–Clear Lake 95.1 72.6 61.5 52.5 70.0 -1.4
University of North Texas 106.2 80.2 66.5 51.7 77.0 0.5
University of Texas Southwestern Medical Center 80.0 – – – 80.0 0.0
West Texas A & M University 79.2 65.5 61.3 46.6 61.1 3.0
2013 Salary Review
State/School
NEA HIGHER EDUCATION ADVOCATE40
Prof.($)
Assoc.($)
Inst./Lect./Asst.($)
NoRank($)
Avg.($)
%Chng.(%)
State/School
Prof.($)
Assoc.($)
Inst./Lect./Asst.($)
NoRank($)
Avg.($)
%Chng.(%)
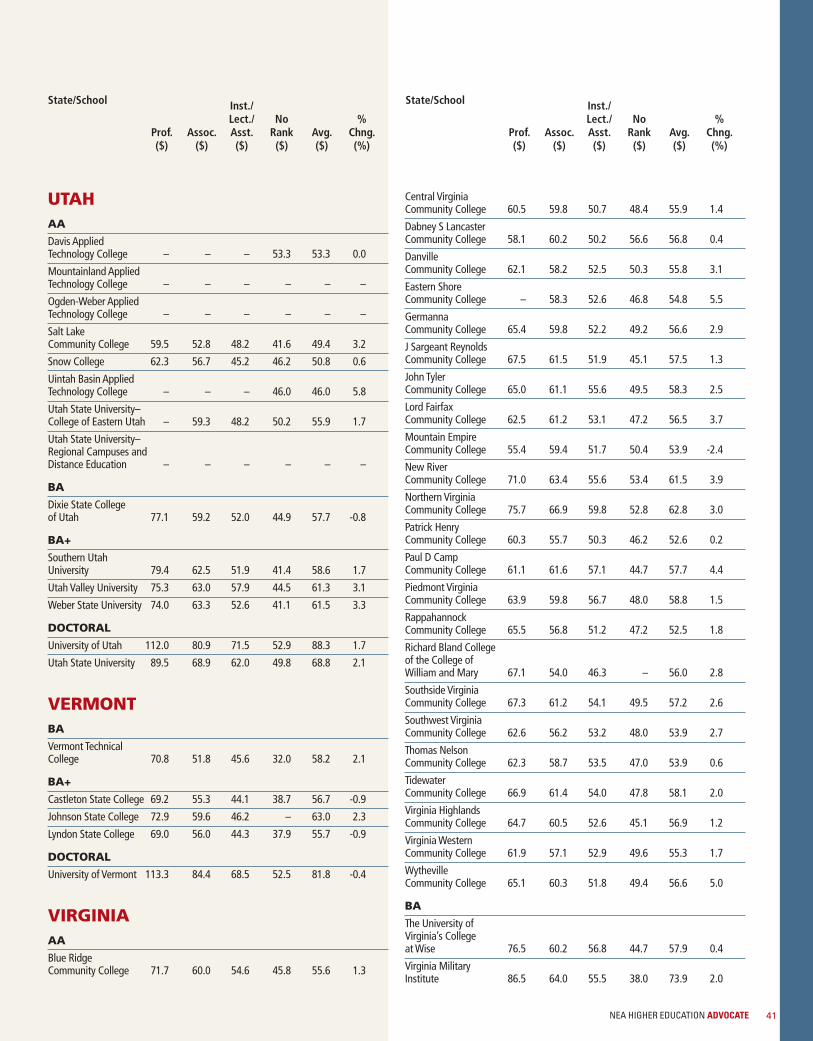
NEA HIGHER EDUCATION ADVOCATE 41
UTAHAA
Davis Applied Technology College – – – 53.3 53.3 0.0
Mountainland Applied Technology College – – – – – –
Ogden-Weber Applied Technology College – – – – – –
Salt Lake Community College 59.5 52.8 48.2 41.6 49.4 3.2
Snow College 62.3 56.7 45.2 46.2 50.8 0.6
Uintah Basin Applied Technology College – – – 46.0 46.0 5.8
Utah State University–College of Eastern Utah – 59.3 48.2 50.2 55.9 1.7
Utah State University–Regional Campuses and Distance Education – – – – – –
BA
Dixie State College of Utah 77.1 59.2 52.0 44.9 57.7 -0.8
BA+
Southern Utah University 79.4 62.5 51.9 41.4 58.6 1.7
Utah Valley University 75.3 63.0 57.9 44.5 61.3 3.1
Weber State University 74.0 63.3 52.6 41.1 61.5 3.3
DOCTORAL
University of Utah 112.0 80.9 71.5 52.9 88.3 1.7
Utah State University 89.5 68.9 62.0 49.8 68.8 2.1
VERMONTBA
Vermont Technical College 70.8 51.8 45.6 32.0 58.2 2.1
BA+
Castleton State College 69.2 55.3 44.1 38.7 56.7 -0.9
Johnson State College 72.9 59.6 46.2 – 63.0 2.3
Lyndon State College 69.0 56.0 44.3 37.9 55.7 -0.9
DOCTORAL
University of Vermont 113.3 84.4 68.5 52.5 81.8 -0.4
VIRGINIAAA
Blue Ridge Community College 71.7 60.0 54.6 45.8 55.6 1.3
Central Virginia Community College 60.5 59.8 50.7 48.4 55.9 1.4
Dabney S Lancaster Community College 58.1 60.2 50.2 56.6 56.8 0.4
Danville Community College 62.1 58.2 52.5 50.3 55.8 3.1
Eastern Shore Community College – 58.3 52.6 46.8 54.8 5.5
Germanna Community College 65.4 59.8 52.2 49.2 56.6 2.9
J Sargeant Reynolds Community College 67.5 61.5 51.9 45.1 57.5 1.3
John Tyler Community College 65.0 61.1 55.6 49.5 58.3 2.5
Lord Fairfax Community College 62.5 61.2 53.1 47.2 56.5 3.7
Mountain Empire Community College 55.4 59.4 51.7 50.4 53.9 -2.4
New River Community College 71.0 63.4 55.6 53.4 61.5 3.9
Northern Virginia Community College 75.7 66.9 59.8 52.8 62.8 3.0
Patrick Henry Community College 60.3 55.7 50.3 46.2 52.6 0.2
Paul D Camp Community College 61.1 61.6 57.1 44.7 57.7 4.4
Piedmont Virginia Community College 63.9 59.8 56.7 48.0 58.8 1.5
Rappahannock Community College 65.5 56.8 51.2 47.2 52.5 1.8
Richard Bland College of the College of William and Mary 67.1 54.0 46.3 – 56.0 2.8
Southside Virginia Community College 67.3 61.2 54.1 49.5 57.2 2.6
Southwest Virginia Community College 62.6 56.2 53.2 48.0 53.9 2.7
Thomas Nelson Community College 62.3 58.7 53.5 47.0 53.9 0.6
Tidewater Community College 66.9 61.4 54.0 47.8 58.1 2.0
Virginia Highlands Community College 64.7 60.5 52.6 45.1 56.9 1.2
Virginia Western Community College 61.9 57.1 52.9 49.6 55.3 1.7
Wytheville Community College 65.1 60.3 51.8 49.4 56.6 5.0
BA
The University of Virginia’s College at Wise 76.5 60.2 56.8 44.7 57.9 0.4
Virginia Military Institute 86.5 64.0 55.5 38.0 73.9 2.0
State/School
Prof.($)
Assoc.($)
Inst./Lect./Asst.($)
NoRank($)
Avg.($)
%Chng.(%)
State/School
Prof.($)
Assoc.($)
Inst./Lect./Asst.($)
NoRank($)
Avg.($)
%Chng.(%)
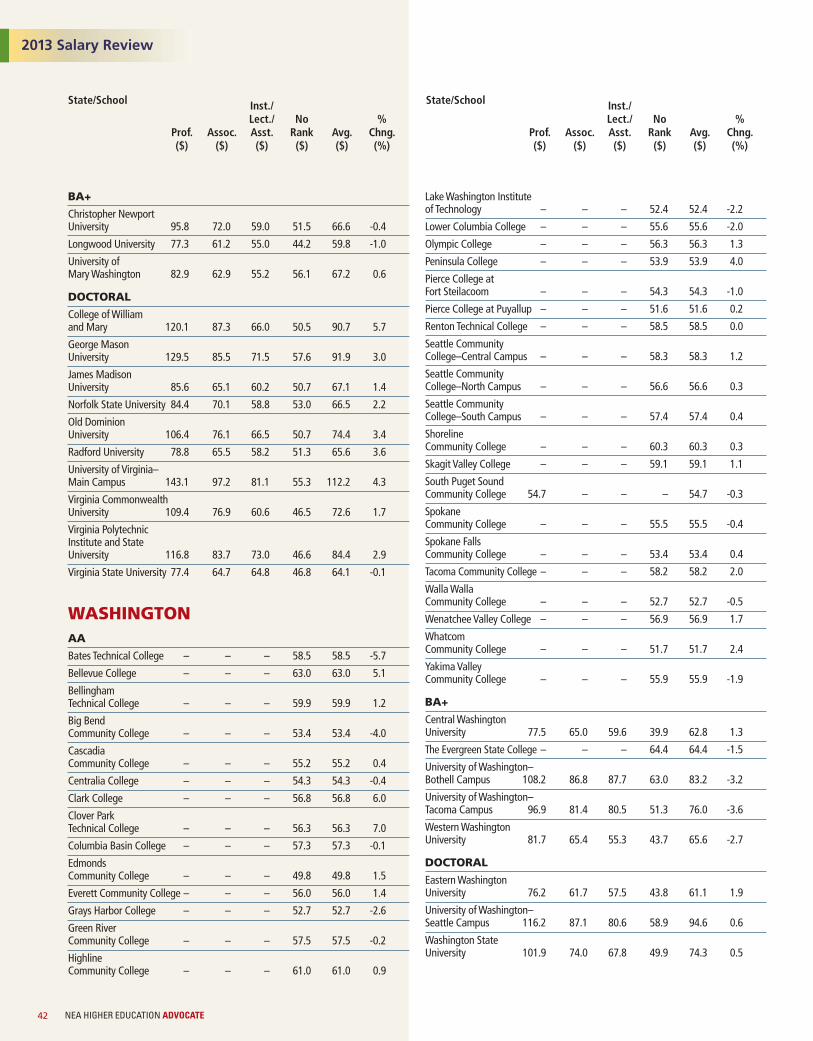
BA+
Christopher Newport University 95.8 72.0 59.0 51.5 66.6 -0.4
Longwood University 77.3 61.2 55.0 44.2 59.8 -1.0
University of Mary Washington 82.9 62.9 55.2 56.1 67.2 0.6
DOCTORAL
College of William and Mary 120.1 87.3 66.0 50.5 90.7 5.7
George Mason University 129.5 85.5 71.5 57.6 91.9 3.0
James Madison University 85.6 65.1 60.2 50.7 67.1 1.4
Norfolk State University 84.4 70.1 58.8 53.0 66.5 2.2
Old Dominion University 106.4 76.1 66.5 50.7 74.4 3.4
Radford University 78.8 65.5 58.2 51.3 65.6 3.6
University of Virginia–Main Campus 143.1 97.2 81.1 55.3 112.2 4.3
Virginia Commonwealth University 109.4 76.9 60.6 46.5 72.6 1.7
Virginia Polytechnic Institute and State University 116.8 83.7 73.0 46.6 84.4 2.9
Virginia State University 77.4 64.7 64.8 46.8 64.1 -0.1
WASHINGTONAA
Bates Technical College – – – 58.5 58.5 -5.7
Bellevue College – – – 63.0 63.0 5.1
Bellingham Technical College – – – 59.9 59.9 1.2
Big Bend Community College – – – 53.4 53.4 -4.0
Cascadia Community College – – – 55.2 55.2 0.4
Centralia College – – – 54.3 54.3 -0.4
Clark College – – – 56.8 56.8 6.0
Clover Park Technical College – – – 56.3 56.3 7.0
Columbia Basin College – – – 57.3 57.3 -0.1
Edmonds Community College – – – 49.8 49.8 1.5
Everett Community College – – – 56.0 56.0 1.4
Grays Harbor College – – – 52.7 52.7 -2.6
Green River Community College – – – 57.5 57.5 -0.2
Highline Community College – – – 61.0 61.0 0.9
Lake Washington Institute of Technology – – – 52.4 52.4 -2.2
Lower Columbia College – – – 55.6 55.6 -2.0
Olympic College – – – 56.3 56.3 1.3
Peninsula College – – – 53.9 53.9 4.0
Pierce College at Fort Steilacoom – – – 54.3 54.3 -1.0
Pierce College at Puyallup – – – 51.6 51.6 0.2
Renton Technical College – – – 58.5 58.5 0.0
Seattle Community College–Central Campus – – – 58.3 58.3 1.2
Seattle Community College–North Campus – – – 56.6 56.6 0.3
Seattle Community College–South Campus – – – 57.4 57.4 0.4
Shoreline Community College – – – 60.3 60.3 0.3
Skagit Valley College – – – 59.1 59.1 1.1
South Puget Sound Community College 54.7 – – – 54.7 -0.3
Spokane Community College – – – 55.5 55.5 -0.4
Spokane Falls Community College – – – 53.4 53.4 0.4
Tacoma Community College – – – 58.2 58.2 2.0
Walla Walla Community College – – – 52.7 52.7 -0.5
Wenatchee Valley College – – – 56.9 56.9 1.7
Whatcom Community College – – – 51.7 51.7 2.4
Yakima Valley Community College – – – 55.9 55.9 -1.9
BA+
Central Washington University 77.5 65.0 59.6 39.9 62.8 1.3
The Evergreen State College – – – 64.4 64.4 -1.5
University of Washington–Bothell Campus 108.2 86.8 87.7 63.0 83.2 -3.2
University of Washington–Tacoma Campus 96.9 81.4 80.5 51.3 76.0 -3.6
Western Washington University 81.7 65.4 55.3 43.7 65.6 -2.7
DOCTORAL
Eastern Washington University 76.2 61.7 57.5 43.8 61.1 1.9
University of Washington–Seattle Campus 116.2 87.1 80.6 58.9 94.6 0.6
Washington State University 101.9 74.0 67.8 49.9 74.3 0.5
2013 Salary Review
State/School
NEA HIGHER EDUCATION ADVOCATE42
Prof.($)
Assoc.($)
Inst./Lect./Asst.($)
NoRank($)
Avg.($)
%Chng.(%)
State/School
Prof.($)
Assoc.($)
Inst./Lect./Asst.($)
NoRank($)
Avg.($)
%Chng.(%)
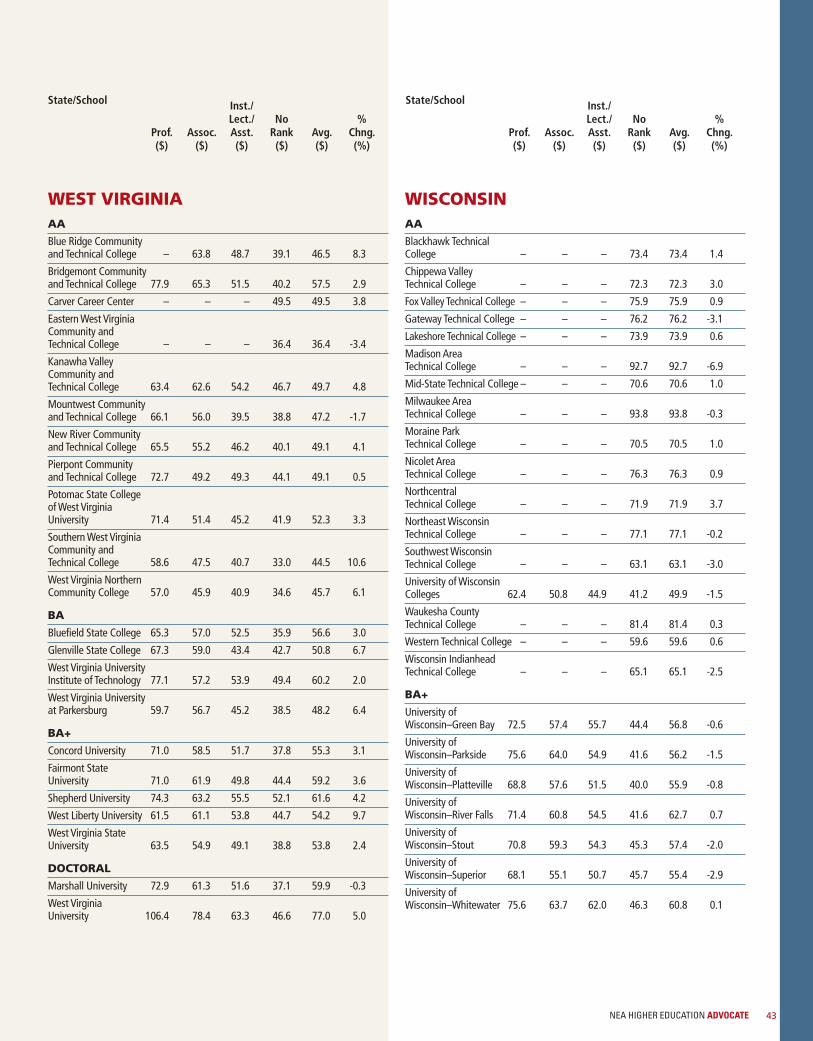
NEA HIGHER EDUCATION ADVOCATE 43
WEST VIRGINIAAA
Blue Ridge Community and Technical College – 63.8 48.7 39.1 46.5 8.3
Bridgemont Community and Technical College 77.9 65.3 51.5 40.2 57.5 2.9
Carver Career Center – – – 49.5 49.5 3.8
Eastern West Virginia Community and Technical College – – – 36.4 36.4 -3.4
Kanawha Valley Community and Technical College 63.4 62.6 54.2 46.7 49.7 4.8
Mountwest Community and Technical College 66.1 56.0 39.5 38.8 47.2 -1.7
New River Community and Technical College 65.5 55.2 46.2 40.1 49.1 4.1
Pierpont Community and Technical College 72.7 49.2 49.3 44.1 49.1 0.5
Potomac State College of West Virginia University 71.4 51.4 45.2 41.9 52.3 3.3
Southern West Virginia Community and Technical College 58.6 47.5 40.7 33.0 44.5 10.6
West Virginia Northern Community College 57.0 45.9 40.9 34.6 45.7 6.1
BA
Bluefield State College 65.3 57.0 52.5 35.9 56.6 3.0
Glenville State College 67.3 59.0 43.4 42.7 50.8 6.7
West Virginia University Institute of Technology 77.1 57.2 53.9 49.4 60.2 2.0
West Virginia University at Parkersburg 59.7 56.7 45.2 38.5 48.2 6.4
BA+
Concord University 71.0 58.5 51.7 37.8 55.3 3.1
Fairmont State University 71.0 61.9 49.8 44.4 59.2 3.6
Shepherd University 74.3 63.2 55.5 52.1 61.6 4.2
West Liberty University 61.5 61.1 53.8 44.7 54.2 9.7
West Virginia State University 63.5 54.9 49.1 38.8 53.8 2.4
DOCTORAL
Marshall University 72.9 61.3 51.6 37.1 59.9 -0.3
West Virginia University 106.4 78.4 63.3 46.6 77.0 5.0
WISCONSINAA
Blackhawk Technical College – – – 73.4 73.4 1.4
Chippewa Valley Technical College – – – 72.3 72.3 3.0
Fox Valley Technical College – – – 75.9 75.9 0.9
Gateway Technical College – – – 76.2 76.2 -3.1
Lakeshore Technical College – – – 73.9 73.9 0.6
Madison Area Technical College – – – 92.7 92.7 -6.9
Mid-State Technical College – – – 70.6 70.6 1.0
Milwaukee Area Technical College – – – 93.8 93.8 -0.3
Moraine Park Technical College – – – 70.5 70.5 1.0
Nicolet Area Technical College – – – 76.3 76.3 0.9
Northcentral Technical College – – – 71.9 71.9 3.7
Northeast Wisconsin Technical College – – – 77.1 77.1 -0.2
Southwest Wisconsin Technical College – – – 63.1 63.1 -3.0
University of Wisconsin Colleges 62.4 50.8 44.9 41.2 49.9 -1.5
Waukesha County Technical College – – – 81.4 81.4 0.3
Western Technical College – – – 59.6 59.6 0.6
Wisconsin Indianhead Technical College – – – 65.1 65.1 -2.5
BA+
University of Wisconsin–Green Bay 72.5 57.4 55.7 44.4 56.8 -0.6
University of Wisconsin–Parkside 75.6 64.0 54.9 41.6 56.2 -1.5
University of Wisconsin–Platteville 68.8 57.6 51.5 40.0 55.9 -0.8
University of Wisconsin–River Falls 71.4 60.8 54.5 41.6 62.7 0.7
University of Wisconsin–Stout 70.8 59.3 54.3 45.3 57.4 -2.0
University of Wisconsin–Superior 68.1 55.1 50.7 45.7 55.4 -2.9
University of Wisconsin–Whitewater 75.6 63.7 62.0 46.3 60.8 0.1
State/School
Prof.($)
Assoc.($)
Inst./Lect./Asst.($)
NoRank($)
Avg.($)
%Chng.(%)
State/School
Prof.($)
Assoc.($)
Inst./Lect./Asst.($)
NoRank($)
Avg.($)
%Chng.(%)
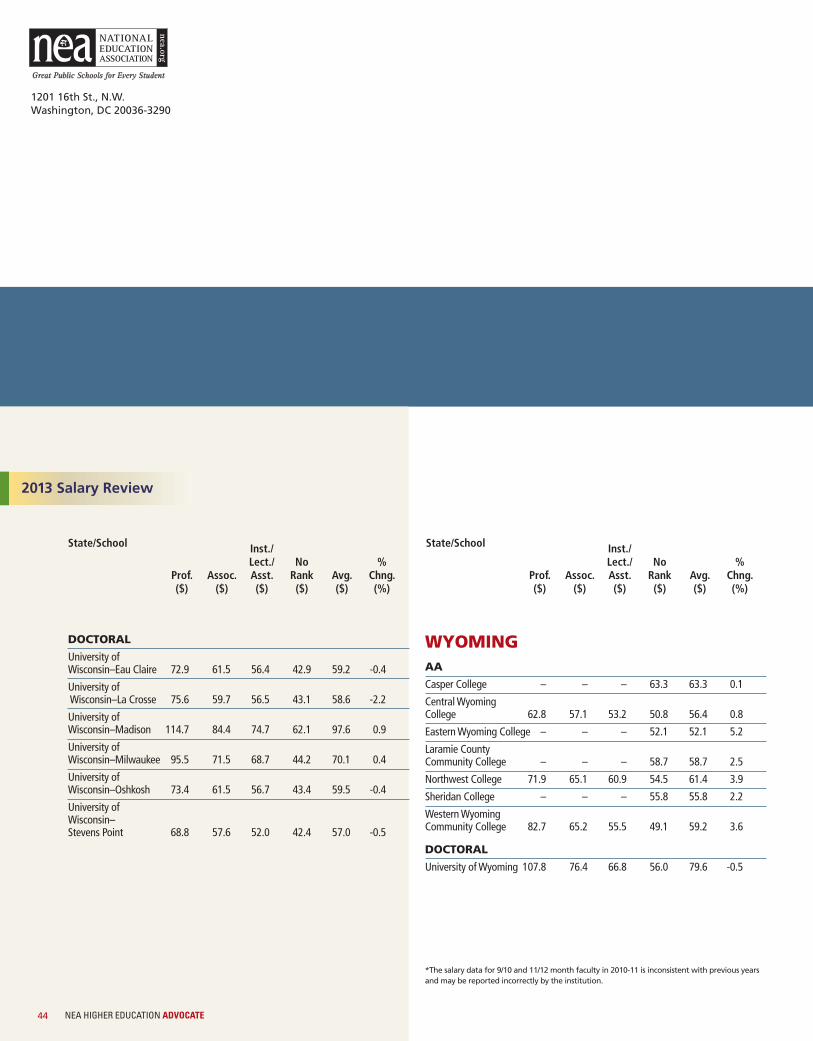
DOCTORAL
University of Wisconsin–Eau Claire 72.9 61.5 56.4 42.9 59.2 -0.4
University ofWisconsin–La Crosse 75.6 59.7 56.5 43.1 58.6 -2.2
University of Wisconsin–Madison 114.7 84.4 74.7 62.1 97.6 0.9
University of Wisconsin–Milwaukee 95.5 71.5 68.7 44.2 70.1 0.4
University of Wisconsin–Oshkosh 73.4 61.5 56.7 43.4 59.5 -0.4
University of Wisconsin–Stevens Point 68.8 57.6 52.0 42.4 57.0 -0.5
WYOMINGAA
Casper College – – – 63.3 63.3 0.1
Central Wyoming College 62.8 57.1 53.2 50.8 56.4 0.8
Eastern Wyoming College – – – 52.1 52.1 5.2
Laramie County Community College – – – 58.7 58.7 2.5
Northwest College 71.9 65.1 60.9 54.5 61.4 3.9
Sheridan College – – – 55.8 55.8 2.2
Western Wyoming Community College 82.7 65.2 55.5 49.1 59.2 3.6
DOCTORAL
University of Wyoming 107.8 76.4 66.8 56.0 79.6 -0.5
2013 Salary Review
State/School
NEA HIGHER EDUCATION ADVOCATE44
Prof.($)
Assoc.($)
Inst./Lect./Asst.($)
NoRank($)
Avg.($)
%Chng.(%)
State/School
Prof.($)
Assoc.($)
Inst./Lect./Asst.($)
NoRank($)
Avg.($)
%Chng.(%)
1201 16th St., N.W.Washington, DC 20036-3290
*The salary data for 9/10 and 11/12 month faculty in 2010-11 is inconsistent with previous yearsand may be reported incorrectly by the institution.