Embed Size (px)
Citation preview
1
Higher Education in South Africa Data 2008
The South African higher education system includes 23 public higher education institutions:
11 universities
6 comprehensive universities
6 universities of technology
As of 15 October 2010, there were also 84 registered and 25 provisionally registered private higher education institutions.* In 2008**:
the public higher education institutions employed 41 738 academic staff and 116 113 staff in total
the public higher education institutions enrolled: o 799 490 students in total o 653 398 undergraduate students o 118 622 postgraduate students
the public higher education institutions awarded: o 133 241 qualifications at all levels o 31 872 qualifications in business and commerce o 37 772 qualifications in science and technology o 63 525 qualifications in the human and social sciences
the public higher education institutions produced: o 7 514 master's degrees o 1 182 doctoral degrees
*These figures for the private higher education institutions were obtained from the "Register of Private Higher Education Institutions" produced by the Department of Higher Education and Training on 2 February 2010. **This information is collected from higher education institutions during and at the end of each academic year. Once it has been collected, it is verified and audited and discrepancies are resolved. For this reason, the audited figures for 2009 will only become available in the second half of 2010.
2
Who Participates in Higher Education?
Participation in higher education has increased steadily, but there are ongoing inequities in who participates. This page examines participation by race, gender and nationality.
Participation by race
Participation by gender
Participation by nationality
Further resources on participation
Participation by race
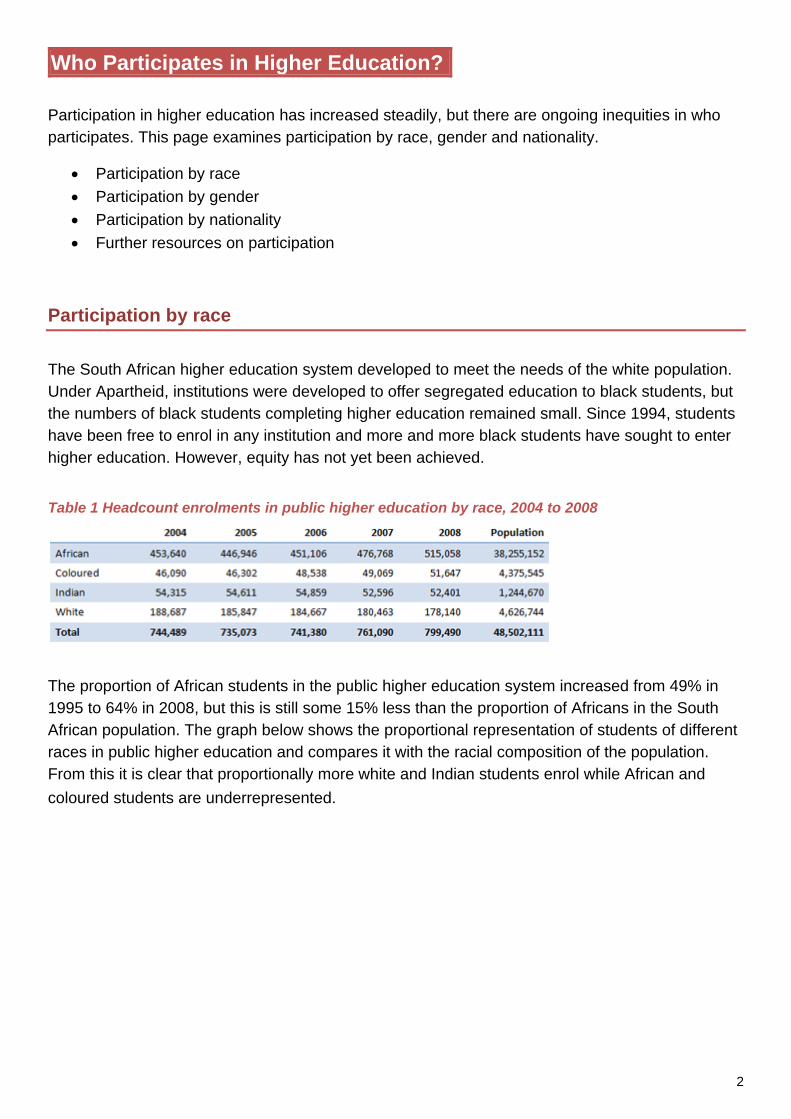
The South African higher education system developed to meet the needs of the white population. Under Apartheid, institutions were developed to offer segregated education to black students, but the numbers of black students completing higher education remained small. Since 1994, students have been free to enrol in any institution and more and more black students have sought to enter higher education. However, equity has not yet been achieved. Table 1 Headcount enrolments in public higher education by race, 2004 to 2008
The proportion of African students in the public higher education system increased from 49% in 1995 to 64% in 2008, but this is still some 15% less than the proportion of Africans in the South African population. The graph below shows the proportional representation of students of different races in public higher education and compares it with the racial composition of the population. From this it is clear that proportionally more white and Indian students enrol while African and
coloured students are underrepresented.
3
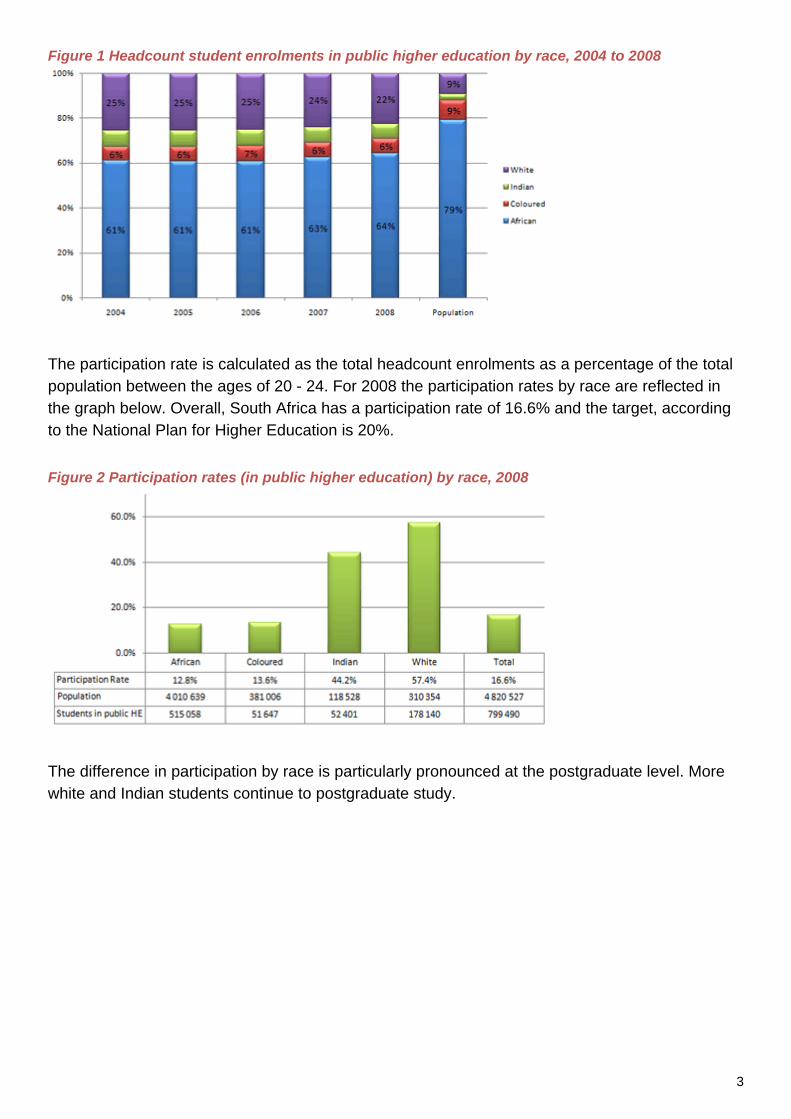
Figure 1 Headcount student enrolments in public higher education by race, 2004 to 2008
The participation rate is calculated as the total headcount enrolments as a percentage of the total population between the ages of 20 - 24. For 2008 the participation rates by race are reflected in the graph below. Overall, South Africa has a participation rate of 16.6% and the target, according to the National Plan for Higher Education is 20%. Figure 2 Participation rates (in public higher education) by race, 2008
The difference in participation by race is particularly pronounced at the postgraduate level. More white and Indian students continue to postgraduate study.

4
Figure 3 Proportional enrolments in public higher education by race and level of study, 2008
Participation by gender
During the last five years the gender distribution in South African higher education has not changed significantly. In 2008 there were 450 651 women enrolled in the public higher education section, which constituted 56% of the total headcounts enrolment for that year. According the population estimates provided by Statistics South Africa, women constituted around 52% of the
South African population in 2008. Figure 4 Headcount student enrolments in public higher education by gender, 1998 and 2008
At the undergraduate and honours levels, more women enrol than men, but at the postgraduate level there are more men than women. The small numbers of master's and doctoral students mean that, overall, there are more women enrolled than men.
5
Figure 5 Proportion of men and women enrolling in public higher education by qualification level,
2008
Participation by nationality
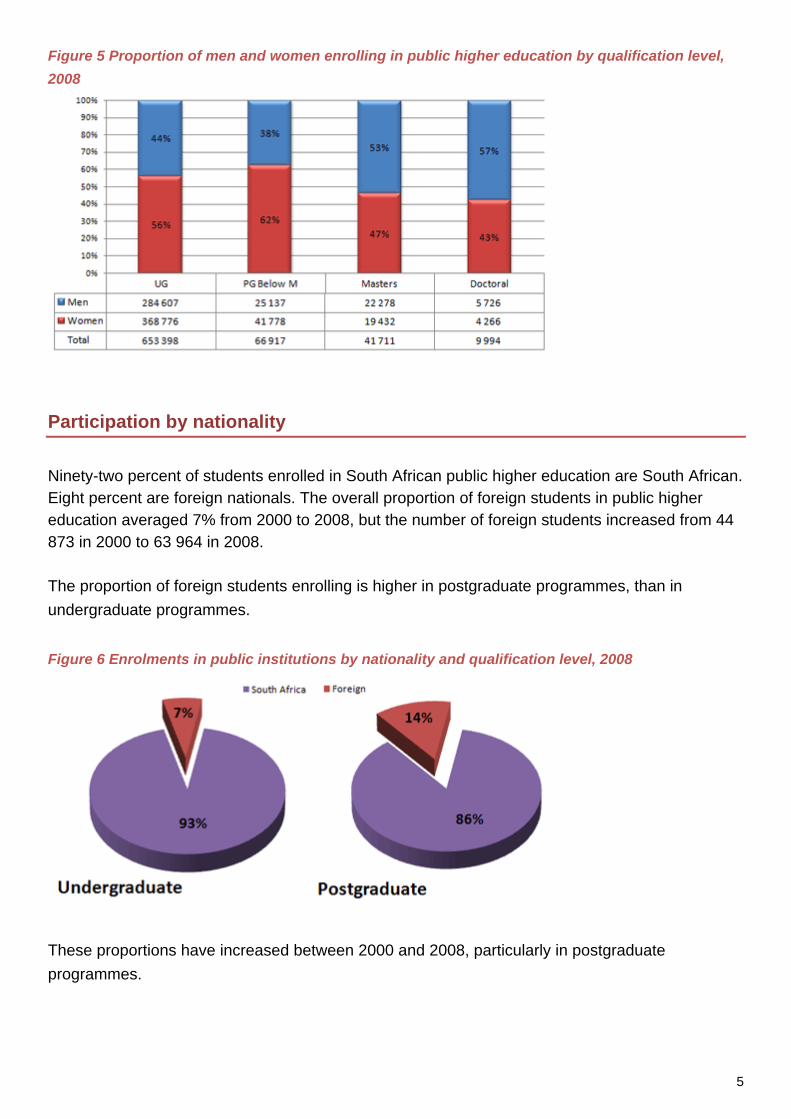
Ninety-two percent of students enrolled in South African public higher education are South African. Eight percent are foreign nationals. The overall proportion of foreign students in public higher education averaged 7% from 2000 to 2008, but the number of foreign students increased from 44 873 in 2000 to 63 964 in 2008. The proportion of foreign students enrolling is higher in postgraduate programmes, than in
undergraduate programmes. Figure 6 Enrolments in public institutions by nationality and qualification level, 2008
These proportions have increased between 2000 and 2008, particularly in postgraduate
programmes.
6
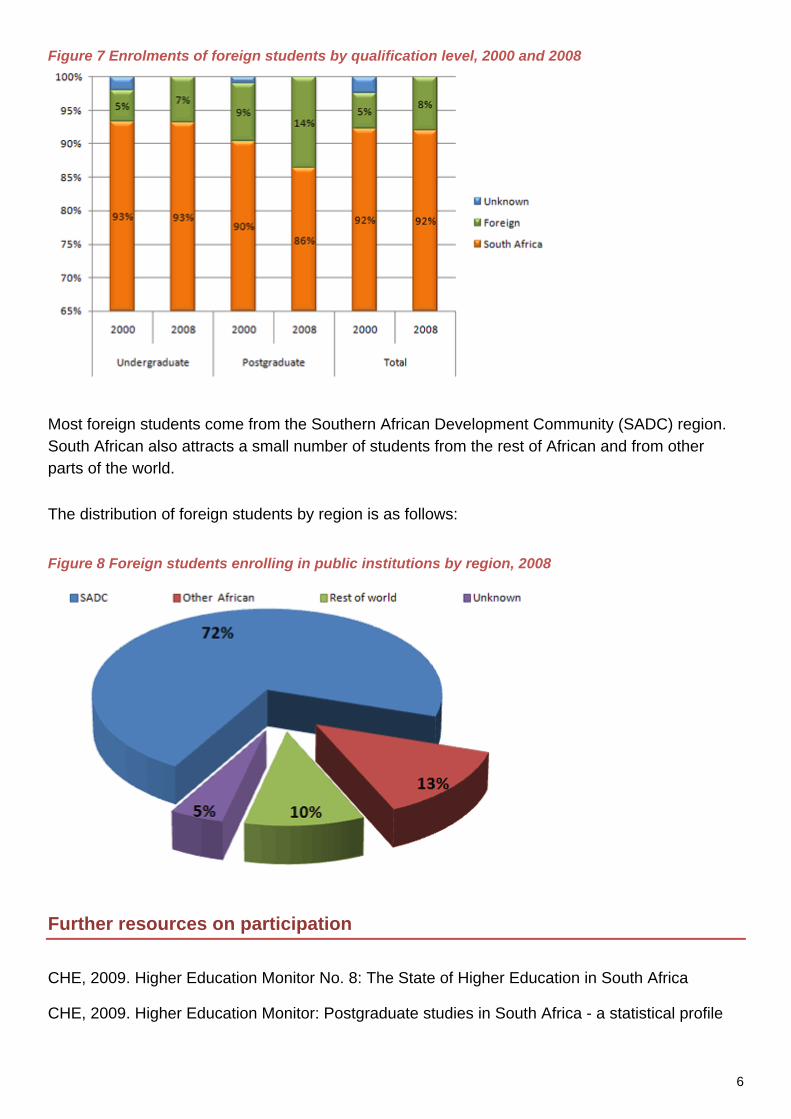
Figure 7 Enrolments of foreign students by qualification level, 2000 and 2008
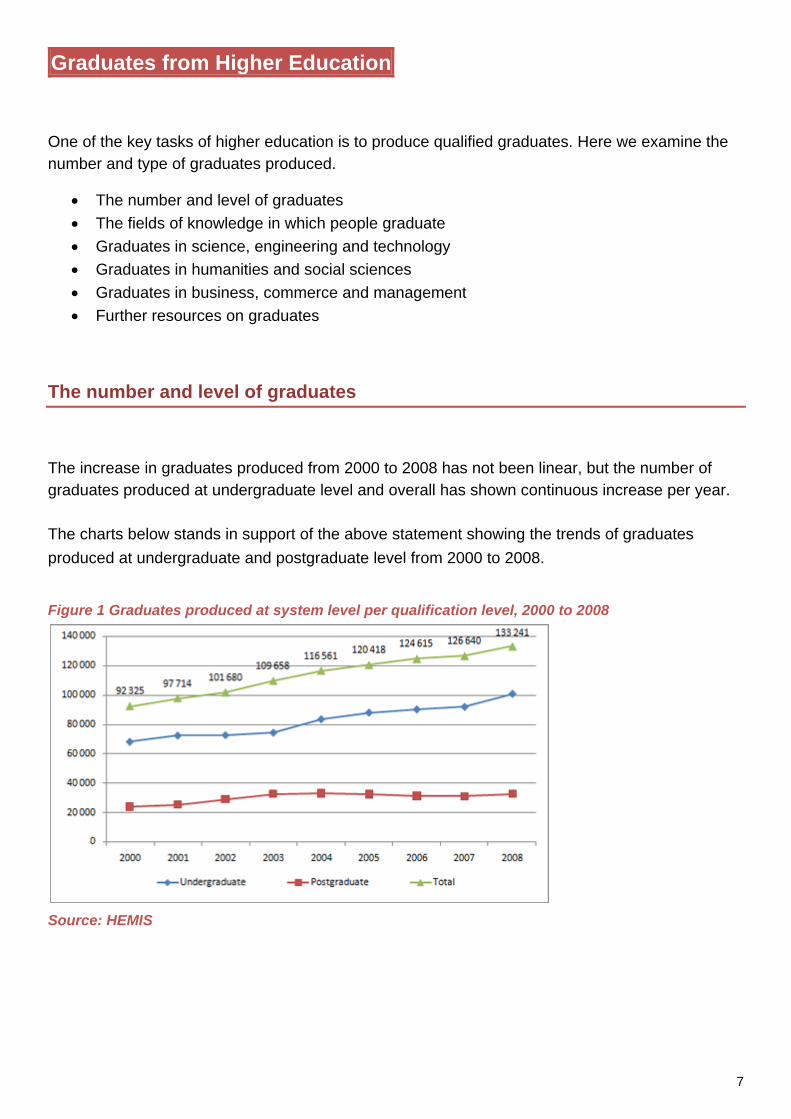
Most foreign students come from the Southern African Development Community (SADC) region. South African also attracts a small number of students from the rest of African and from other parts of the world.
The distribution of foreign students by region is as follows: Figure 8 Foreign students enrolling in public institutions by region, 2008
Further resources on participation
CHE, 2009. Higher Education Monitor No. 8: The State of Higher Education in South Africa
CHE, 2009. Higher Education Monitor: Postgraduate studies in South Africa - a statistical profile
7
Graduates from Higher Education
One of the key tasks of higher education is to produce qualified graduates. Here we examine the number and type of graduates produced.
The number and level of graduates
The fields of knowledge in which people graduate
Graduates in science, engineering and technology
Graduates in humanities and social sciences
Graduates in business, commerce and management
Further resources on graduates
The number and level of graduates
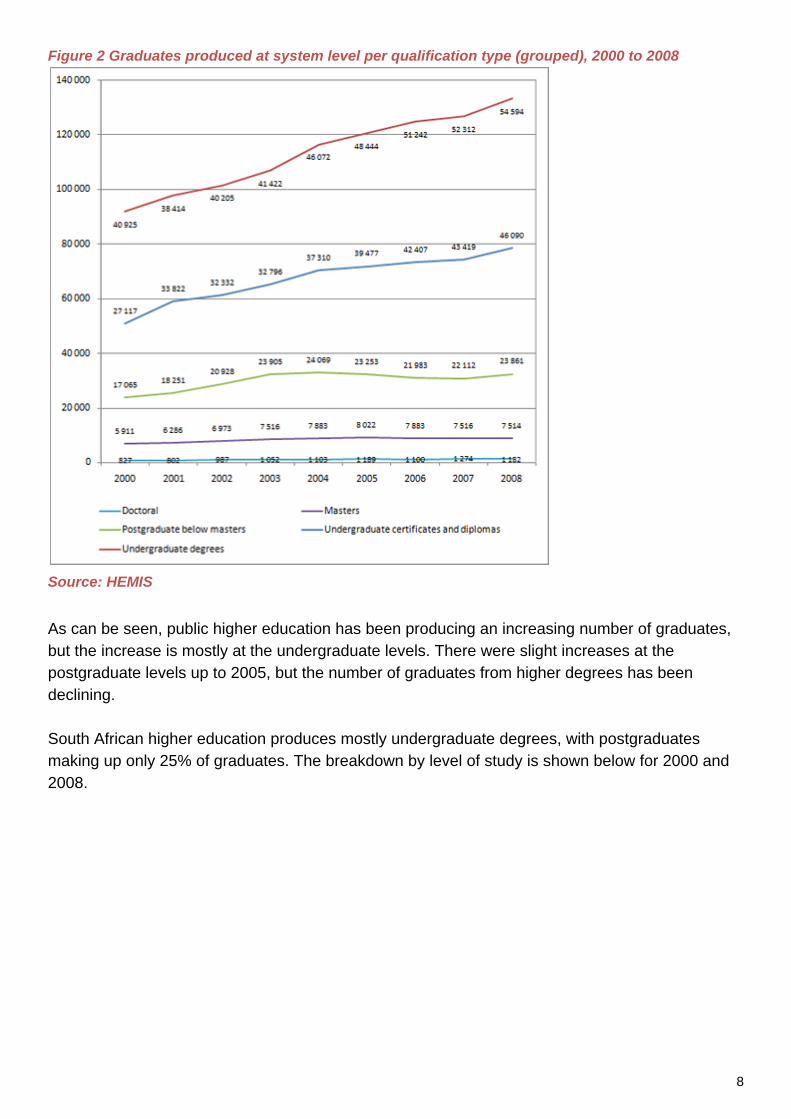
The increase in graduates produced from 2000 to 2008 has not been linear, but the number of graduates produced at undergraduate level and overall has shown continuous increase per year. The charts below stands in support of the above statement showing the trends of graduates
produced at undergraduate and postgraduate level from 2000 to 2008. Figure 1 Graduates produced at system level per qualification level, 2000 to 2008
Source: HEMIS
8
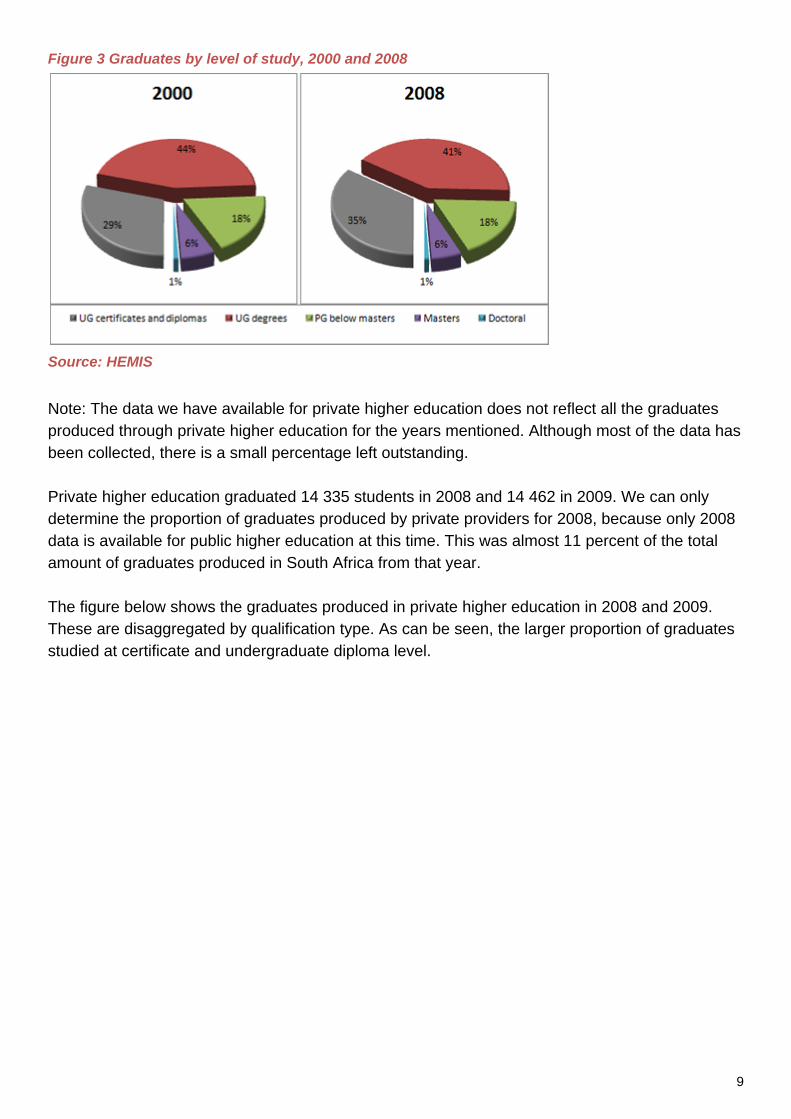
Figure 2 Graduates produced at system level per qualification type (grouped), 2000 to 2008
Source: HEMIS As can be seen, public higher education has been producing an increasing number of graduates, but the increase is mostly at the undergraduate levels. There were slight increases at the postgraduate levels up to 2005, but the number of graduates from higher degrees has been declining. South African higher education produces mostly undergraduate degrees, with postgraduates making up only 25% of graduates. The breakdown by level of study is shown below for 2000 and 2008.
9
Figure 3 Graduates by level of study, 2000 and 2008
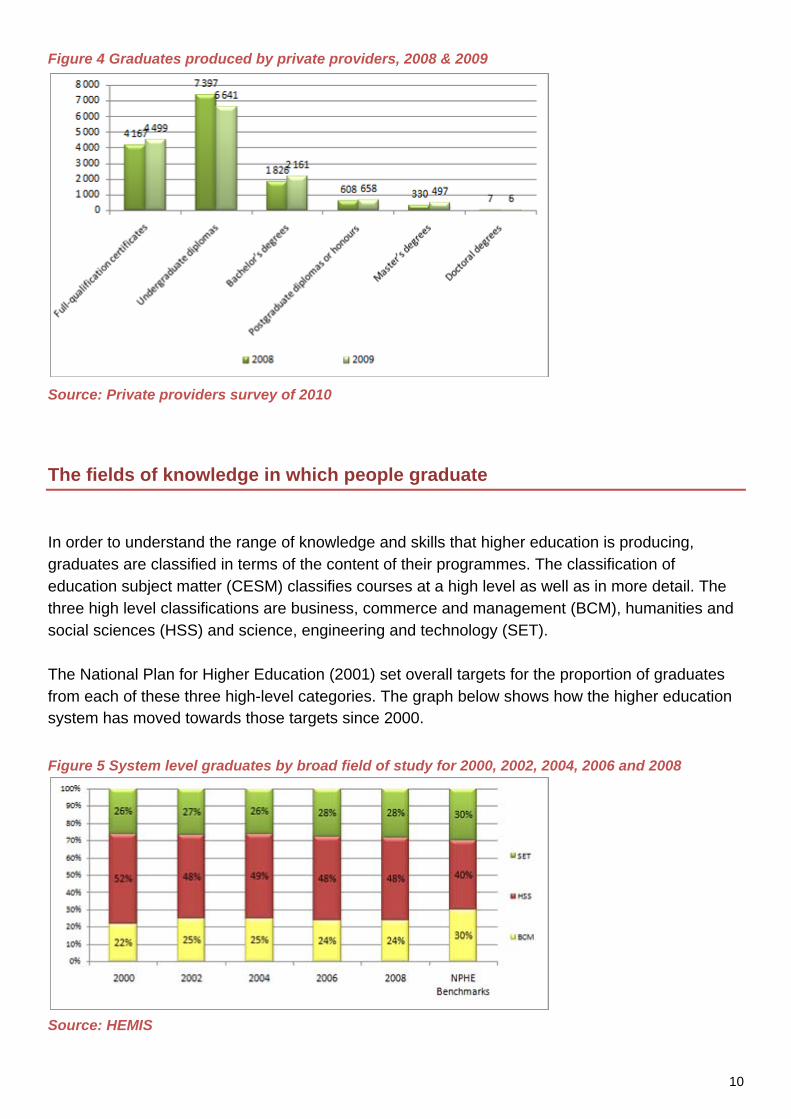
Source: HEMIS Note: The data we have available for private higher education does not reflect all the graduates produced through private higher education for the years mentioned. Although most of the data has been collected, there is a small percentage left outstanding. Private higher education graduated 14 335 students in 2008 and 14 462 in 2009. We can only determine the proportion of graduates produced by private providers for 2008, because only 2008 data is available for public higher education at this time. This was almost 11 percent of the total amount of graduates produced in South Africa from that year. The figure below shows the graduates produced in private higher education in 2008 and 2009. These are disaggregated by qualification type. As can be seen, the larger proportion of graduates studied at certificate and undergraduate diploma level.
10
Figure 4 Graduates produced by private providers, 2008 & 2009
Source: Private providers survey of 2010
The fields of knowledge in which people graduate
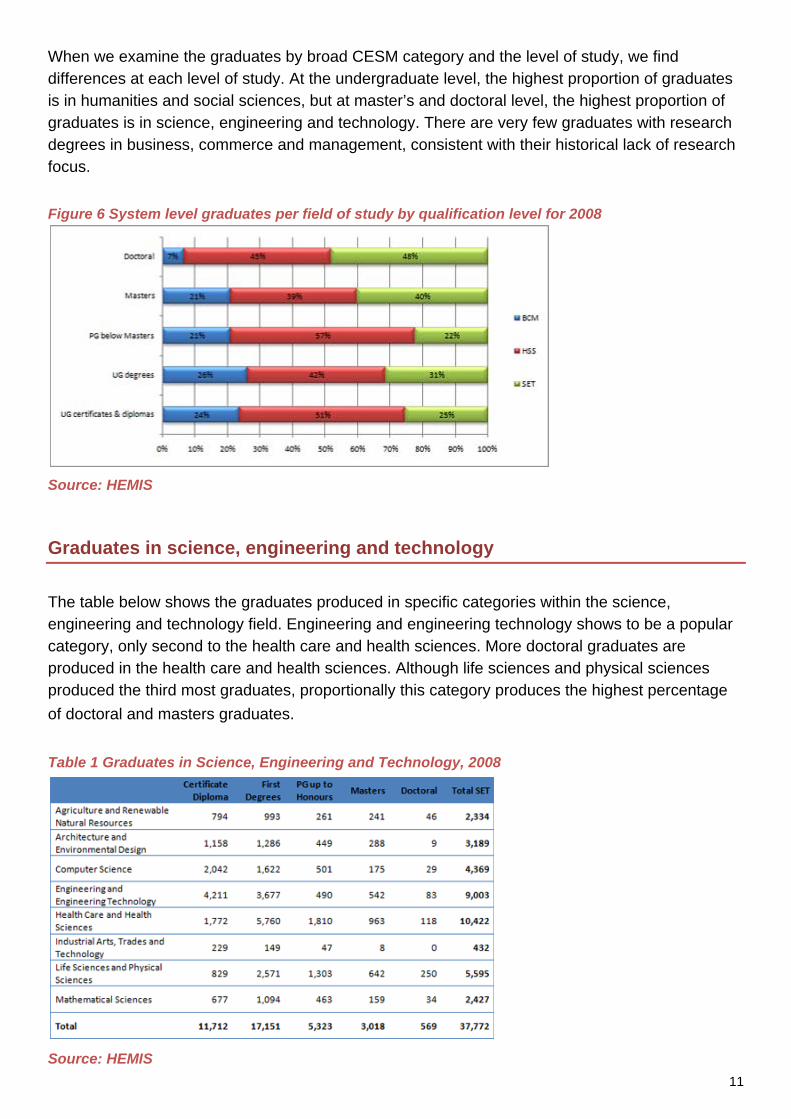
In order to understand the range of knowledge and skills that higher education is producing, graduates are classified in terms of the content of their programmes. The classification of education subject matter (CESM) classifies courses at a high level as well as in more detail. The three high level classifications are business, commerce and management (BCM), humanities and social sciences (HSS) and science, engineering and technology (SET). The National Plan for Higher Education (2001) set overall targets for the proportion of graduates from each of these three high-level categories. The graph below shows how the higher education system has moved towards those targets since 2000. Figure 5 System level graduates by broad field of study for 2000, 2002, 2004, 2006 and 2008
Source: HEMIS
11
When we examine the graduates by broad CESM category and the level of study, we find differences at each level of study. At the undergraduate level, the highest proportion of graduates is in humanities and social sciences, but at master’s and doctoral level, the highest proportion of graduates is in science, engineering and technology. There are very few graduates with research degrees in business, commerce and management, consistent with their historical lack of research focus.
Figure 6 System level graduates per field of study by qualification level for 2008
Source: HEMIS
Graduates in science, engineering and technology
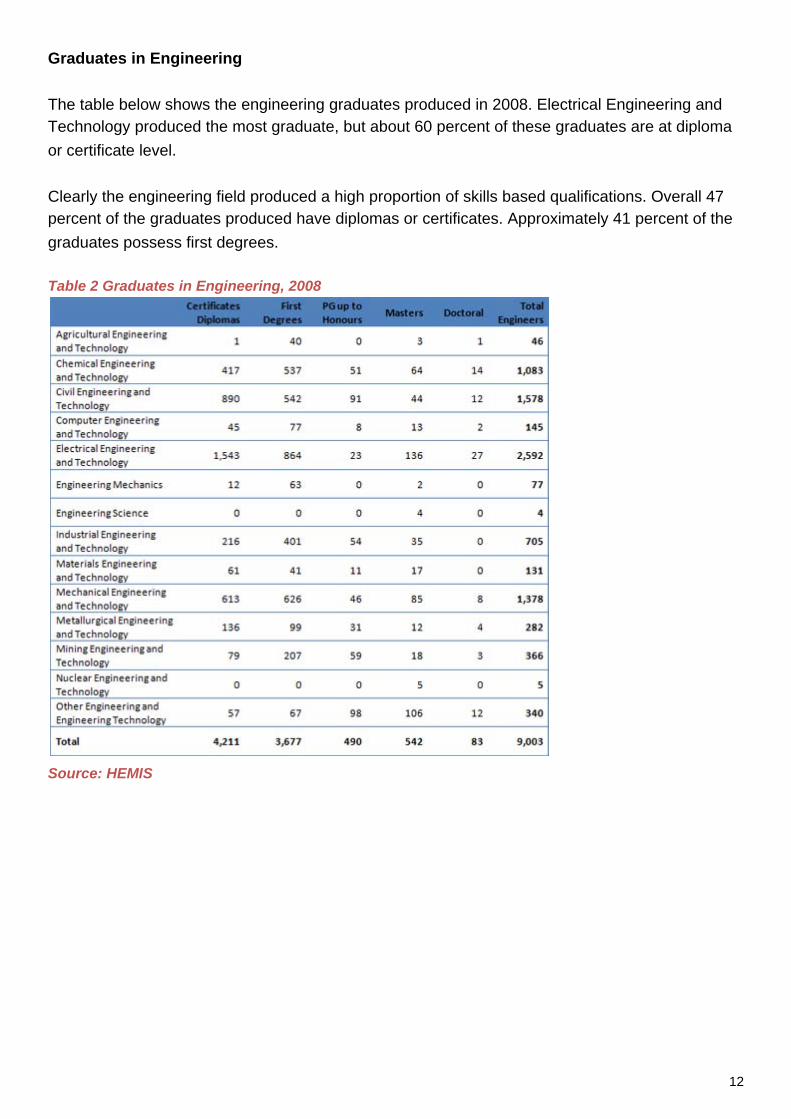
The table below shows the graduates produced in specific categories within the science, engineering and technology field. Engineering and engineering technology shows to be a popular category, only second to the health care and health sciences. More doctoral graduates are produced in the health care and health sciences. Although life sciences and physical sciences produced the third most graduates, proportionally this category produces the highest percentage
of doctoral and masters graduates.
Table 1 Graduates in Science, Engineering and Technology, 2008
Source: HEMIS
12
Graduates in Engineering The table below shows the engineering graduates produced in 2008. Electrical Engineering and Technology produced the most graduate, but about 60 percent of these graduates are at diploma
or certificate level. Clearly the engineering field produced a high proportion of skills based qualifications. Overall 47 percent of the graduates produced have diplomas or certificates. Approximately 41 percent of the
graduates possess first degrees. Table 2 Graduates in Engineering, 2008
Source: HEMIS
13
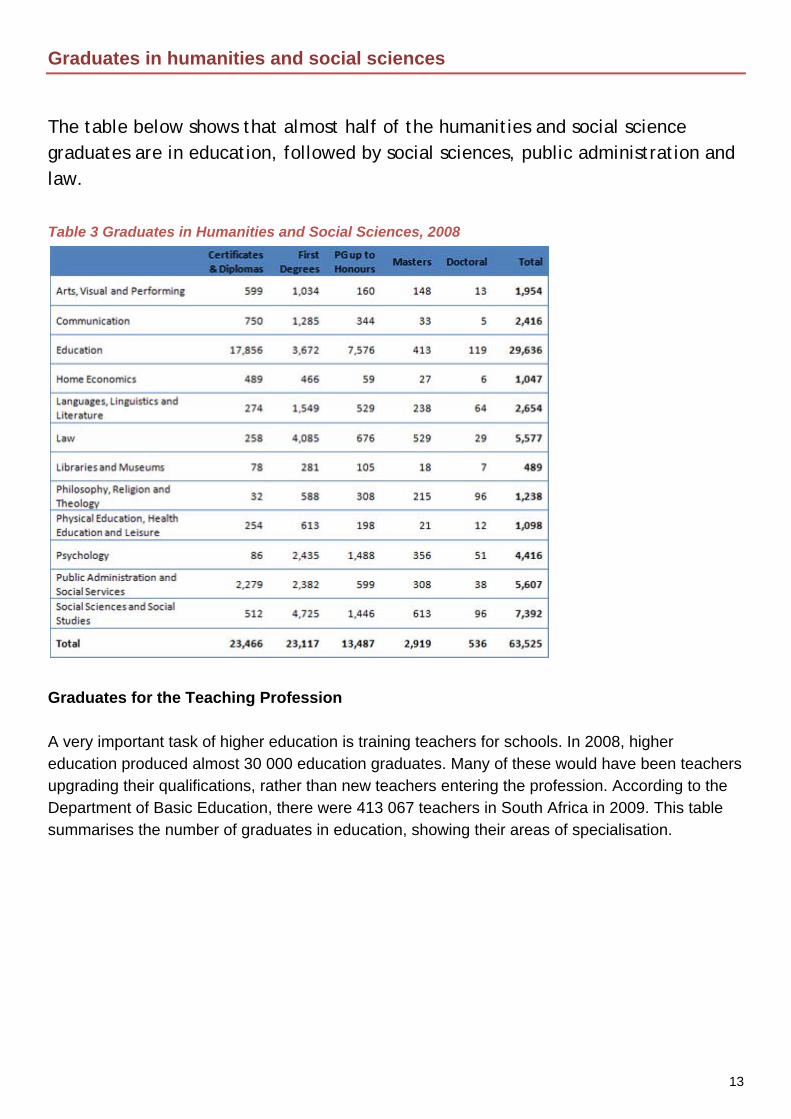
Graduates in humanities and social sciences
The table below shows that almost half of the humanities and social science graduates are in education, followed by social sciences, public administration and law. Table 3 Graduates in Humanities and Social Sciences, 2008
Graduates for the Teaching Profession A very important task of higher education is training teachers for schools. In 2008, higher education produced almost 30 000 education graduates. Many of these would have been teachers upgrading their qualifications, rather than new teachers entering the profession. According to the Department of Basic Education, there were 413 067 teachers in South Africa in 2009. This table summarises the number of graduates in education, showing their areas of specialisation.
14
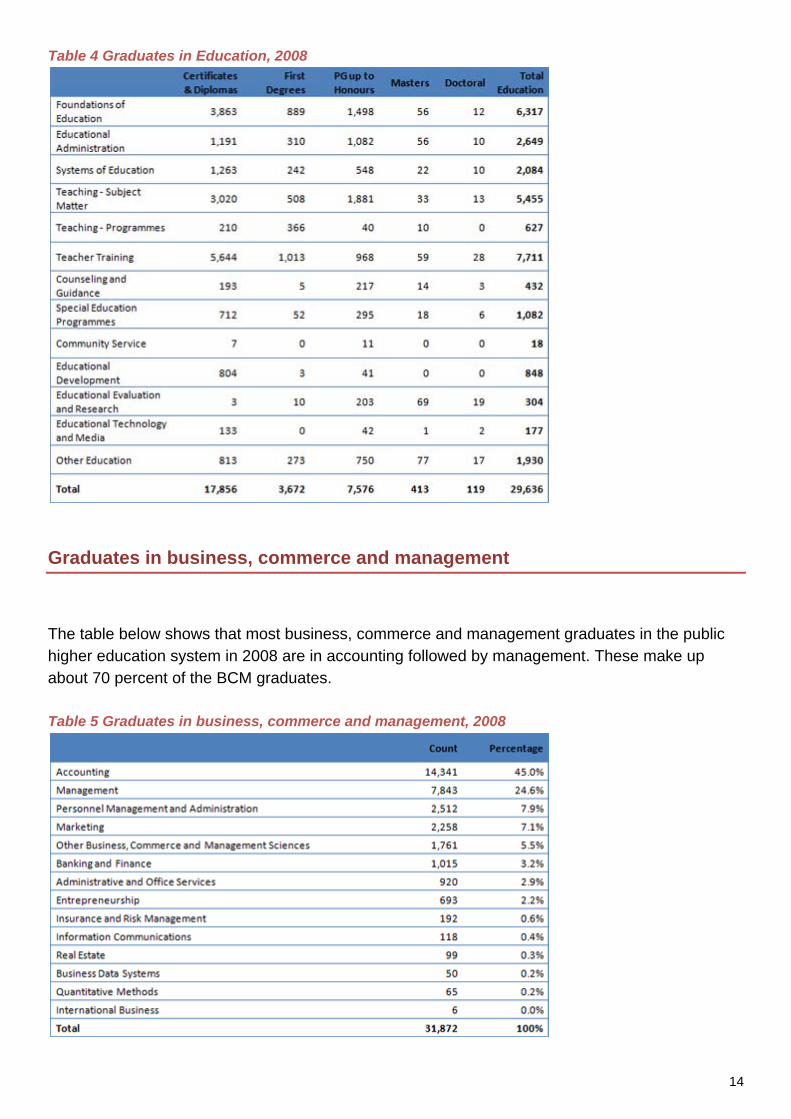
Table 4 Graduates in Education, 2008
Graduates in business, commerce and management
The table below shows that most business, commerce and management graduates in the public higher education system in 2008 are in accounting followed by management. These make up about 70 percent of the BCM graduates. Table 5 Graduates in business, commerce and management, 2008
15
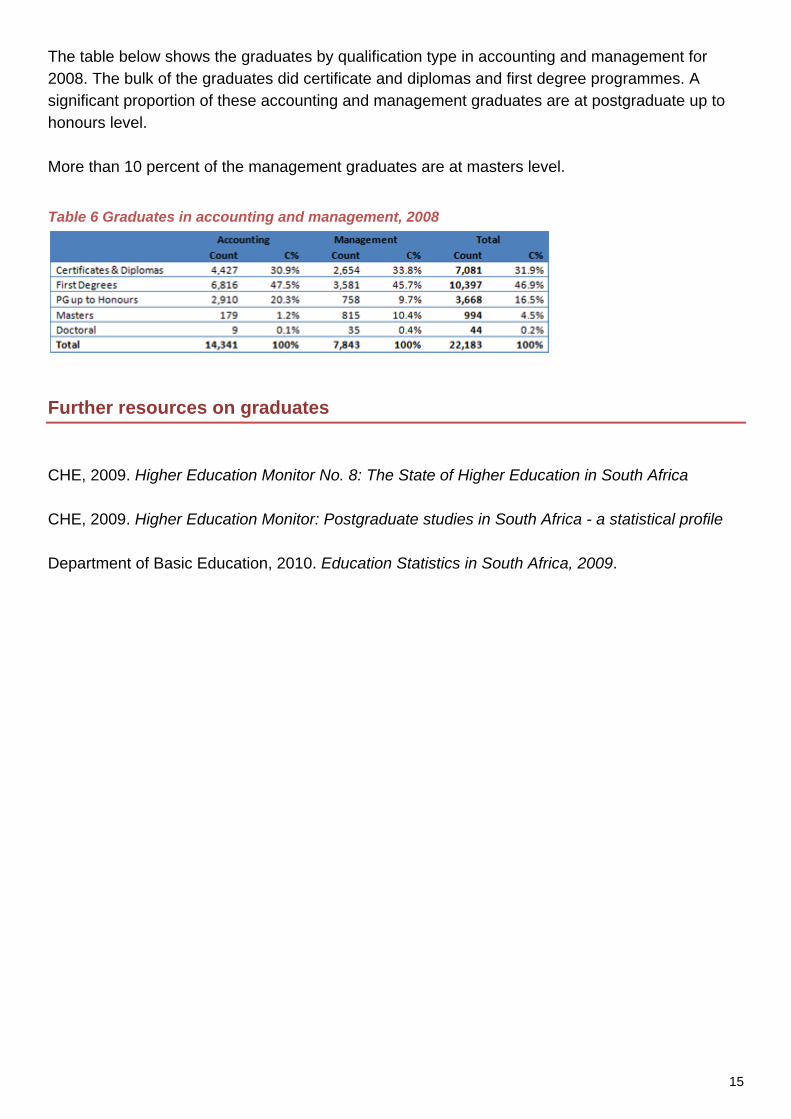
The table below shows the graduates by qualification type in accounting and management for 2008. The bulk of the graduates did certificate and diplomas and first degree programmes. A significant proportion of these accounting and management graduates are at postgraduate up to honours level. More than 10 percent of the management graduates are at masters level. Table 6 Graduates in accounting and management, 2008
Further resources on graduates
CHE, 2009. Higher Education Monitor No. 8: The State of Higher Education in South Africa CHE, 2009. Higher Education Monitor: Postgraduate studies in South Africa - a statistical profile Department of Basic Education, 2010. Education Statistics in South Africa, 2009.