Embed Size (px)
Citation preview
HIGHER EDUCATION DEFERRED MAINTENANCE SUBCOMMITTEE
Bridgeport Conference Center, Suites 3 & 4
September 7, 2008 2:00 PM
ITEMS Deferred Maintenance Questions/Answers and Proposed Recommendations 2
Rich Donovan, Co-Interim Director of Finance and Facilities HEFIS (Higher Education Facilities Information System) Demonstration 6
Rich Donovan, Co-Interim Director of Finance and Facilities Daniel Shaw, Web Developer
Classroom and Classlab Utilization Report – Fall 2006 30

David Tyson Chairman
Brian Noland Chancellor
West Virginia Higher Education Policy Commission West Virginia Community and Technical College System
1018 Kanawha Boulevard East, Suite 700 Charleston, WV 25301
(304) 558-4016 www.hepc.wvnet.edu
www.wvctcs.org
MEMORANDUM TO: Members of the Higher Education Deferred Maintenance Subcommittee FROM: Dennis Taylor, Vice Chancellor for Administration Rich Donovan, Acting Co-Director of Finance and Facilities Daniel Shaw, Web Developer and Programmer DATE: 7 September 2008 RE: Deferred Maintenance Questions/Answers, Proposed Recommendations and
HEFIS Demonstration On August 24th, the Higher Education Deferred Maintenance Subcommittee requested that staff for the Higher Education Policy Commission (Commission) and the Council for Community and Technical College Education (Council) answer several questions and begin developing a more detailed set of proposed recommendations related to deferred maintenance for the Subcommittee’s consideration. The answer to questions and preliminary recommendations that appear below are offered for your consideration. Before any of the recommendations are finalized, we propose to: (1) prepare a “business case” or justification to support each recommendation; (2) indicate what statutory and/or regulatory changes may need to be made if these recommendations are adopted; and (3) consult with higher education administrators; particularly Presidents, Chief Financial Officers and Physical Plant Directors about these recommendations. In addition, a brief presentation will be made on HEFIS (the Higher Education Facilities Information System) to acquaint the Subcommittee with this application and how it may be used as a management tool to provide the data/information needed to manage deferred maintenance, building renewal and new capital projects.
Questions/Comments from Previous Meeting Q: Which institutions are struggling with deferred maintenance issues? What are we doing
about it and how will what is being proposed affect them? (Senator McCabe)
Nelson
Robinson Chairman
James Skidmore
Chancellor
1
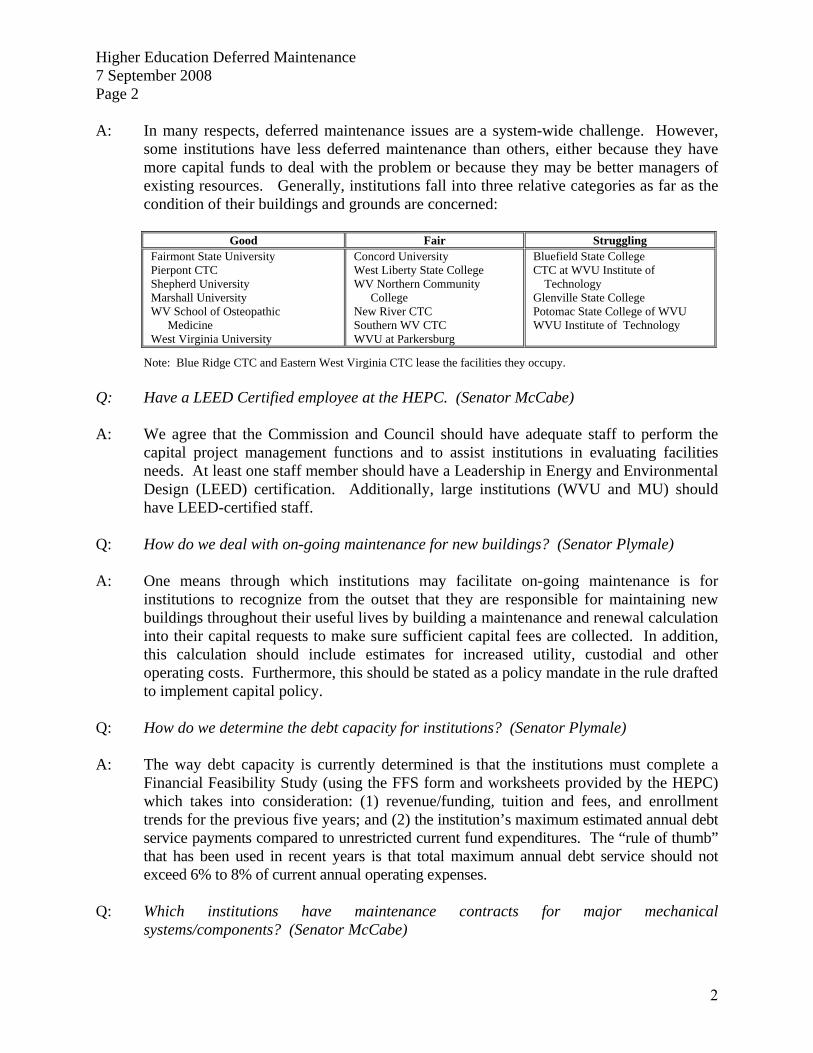
Higher Education Deferred Maintenance 7 September 2008 Page 2 A: In many respects, deferred maintenance issues are a system-wide challenge. However,
some institutions have less deferred maintenance than others, either because they have more capital funds to deal with the problem or because they may be better managers of existing resources. Generally, institutions fall into three relative categories as far as the condition of their buildings and grounds are concerned:
Good Fair Struggling
Fairmont State University Pierpont CTC Shepherd University Marshall University WV School of Osteopathic Medicine West Virginia University
Concord University West Liberty State College WV Northern Community College New River CTC Southern WV CTC WVU at Parkersburg
Bluefield State College CTC at WVU Institute of Technology Glenville State College Potomac State College of WVU WVU Institute of Technology
Note: Blue Ridge CTC and Eastern West Virginia CTC lease the facilities they occupy.
Q: Have a LEED Certified employee at the HEPC. (Senator McCabe) A: We agree that the Commission and Council should have adequate staff to perform the
capital project management functions and to assist institutions in evaluating facilities needs. At least one staff member should have a Leadership in Energy and Environmental Design (LEED) certification. Additionally, large institutions (WVU and MU) should have LEED-certified staff.
Q: How do we deal with on-going maintenance for new buildings? (Senator Plymale) A: One means through which institutions may facilitate on-going maintenance is for
institutions to recognize from the outset that they are responsible for maintaining new buildings throughout their useful lives by building a maintenance and renewal calculation into their capital requests to make sure sufficient capital fees are collected. In addition, this calculation should include estimates for increased utility, custodial and other operating costs. Furthermore, this should be stated as a policy mandate in the rule drafted to implement capital policy.
Q: How do we determine the debt capacity for institutions? (Senator Plymale) A: The way debt capacity is currently determined is that the institutions must complete a
Financial Feasibility Study (using the FFS form and worksheets provided by the HEPC) which takes into consideration: (1) revenue/funding, tuition and fees, and enrollment trends for the previous five years; and (2) the institution’s maximum estimated annual debt service payments compared to unrestricted current fund expenditures. The “rule of thumb” that has been used in recent years is that total maximum annual debt service should not exceed 6% to 8% of current annual operating expenses.
Q: Which institutions have maintenance contracts for major mechanical
systems/components? (Senator McCabe)
2
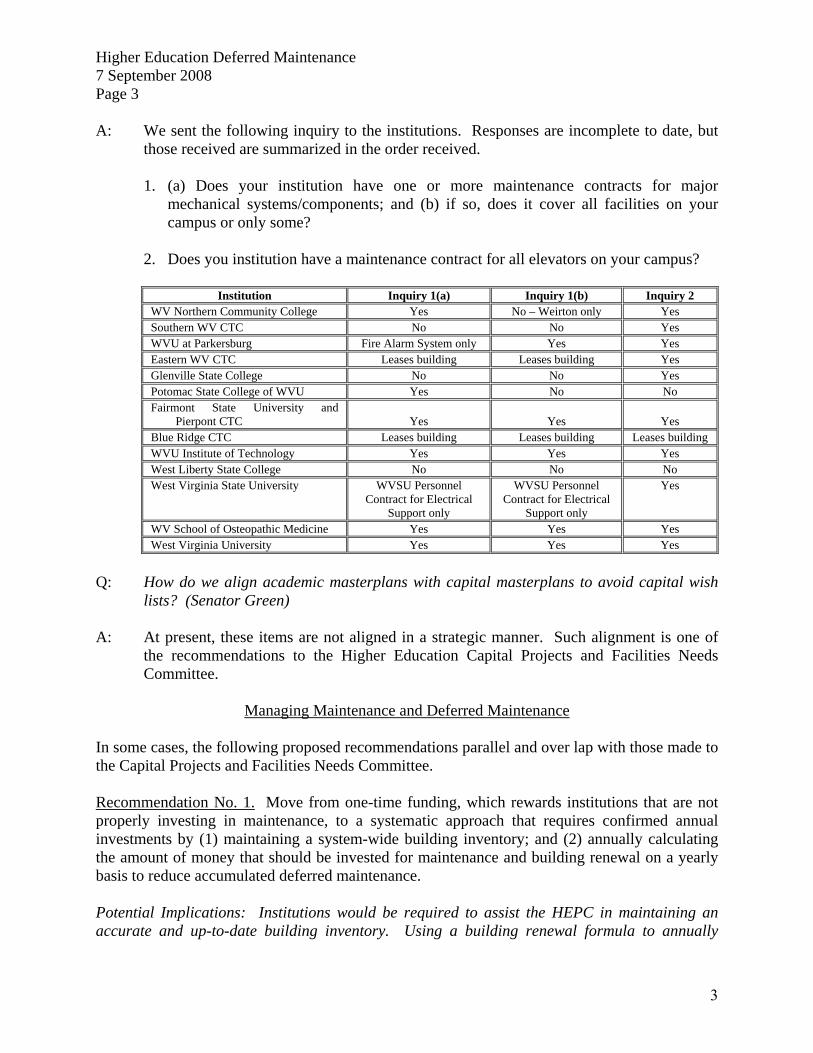
Higher Education Deferred Maintenance 7 September 2008 Page 3 A: We sent the following inquiry to the institutions. Responses are incomplete to date, but
those received are summarized in the order received.
1. (a) Does your institution have one or more maintenance contracts for major mechanical systems/components; and (b) if so, does it cover all facilities on your campus or only some?
2. Does you institution have a maintenance contract for all elevators on your campus?
Institution Inquiry 1(a) Inquiry 1(b) Inquiry 2 WV Northern Community College Yes No – Weirton only Yes Southern WV CTC No No Yes WVU at Parkersburg Fire Alarm System only Yes Yes Eastern WV CTC Leases building Leases building Yes Glenville State College No No Yes Potomac State College of WVU Yes No No Fairmont State University and Pierpont CTC
Yes
Yes
Yes
Blue Ridge CTC Leases building Leases building Leases building WVU Institute of Technology Yes Yes Yes West Liberty State College No No No West Virginia State University WVSU Personnel
Contract for Electrical Support only
WVSU Personnel Contract for Electrical
Support only
Yes
WV School of Osteopathic Medicine Yes Yes Yes West Virginia University Yes Yes Yes
Q: How do we align academic masterplans with capital masterplans to avoid capital wish
lists? (Senator Green) A: At present, these items are not aligned in a strategic manner. Such alignment is one of
the recommendations to the Higher Education Capital Projects and Facilities Needs Committee.
Managing Maintenance and Deferred Maintenance
In some cases, the following proposed recommendations parallel and over lap with those made to the Capital Projects and Facilities Needs Committee. Recommendation No. 1. Move from one-time funding, which rewards institutions that are not properly investing in maintenance, to a systematic approach that requires confirmed annual investments by (1) maintaining a system-wide building inventory; and (2) annually calculating the amount of money that should be invested for maintenance and building renewal on a yearly basis to reduce accumulated deferred maintenance. Potential Implications: Institutions would be required to assist the HEPC in maintaining an accurate and up-to-date building inventory. Using a building renewal formula to annually
3
Higher Education Deferred Maintenance 7 September 2008 Page 4 calculate a dollar benchmark that should be invested in buildings to minimize deferred maintenance would provide the Commission with information to determine where under-investments are being made. Recommendation No. 2. The Legislature should take primary responsibility for financing most educational and general (excluding research?) new capital projects and major renovations. To accomplish this, the Legislature will need to identify a dedicated state revenue source or sources to support higher education capital financing from which bonding can be taken periodically. It is probably not reasonable to expect the Legislature to generate sufficient funding for this purpose during any one year. Potential Implications: If the Legislature takes the responsibility to fund new E&G capital projects and major renovations, and possibly buy down some of the existing E&G debt, this would free up institution E&G capital fees to pay the remaining debt service and concentrate on taking care of maintenance and deferred maintenance needs. Recommendation No. 3. Guarantee that sufficient capital revenues are available for maintenance. For E&G facilities, require institutions to spend E&G Capital Fees up to the amount the maintenance formula requires annually for E&G facility maintenance, after meeting debt service requirements and before spending the funds for other purposes. For Auxiliary facilities, which are required to be self supporting operations, ensure that fees are sufficient not only to operate the auxiliary operation, but also are sufficient to meet the annual maintenance formula requirement and to build a reserve for major renovation or replacement. Also, the Auxiliary Operating Fees should be separated for Auxiliary Maintenance and Capital Fees to facilitate tracking of fee collections. The Legislature should create separate funds for auxiliary operations and auxiliary capital revenue so that maintenance revenue and expenditures can be tracked more easily. Potential Implications: A phase-in period may be required at some institutions since a portion of E&G Capital Fees, after meeting debt service obligations, are possibly being used for non-capital or maintenance purposes. For Auxiliary facilities, a significant Auxiliary Fee increase may be needed at some institutions due to the fact that insufficient fees are currently being charged to meet the needs for operations, maintenance, and to build a capital improvements reserve. Recommendation No. 4. Guarantee that institutions utilize E&G and Auxiliary Capital funds properly (which are special revenue accounts) by (1) requiring that an appropriate amount be line itemed in the budget bill for maintenance from both E&G and Auxiliary Capital Accounts; (2) in a separate list apart from the budget bill, have the institutions identify the deferred maintenance projects they intend to fund from their line item appropriations in the budget bill for the upcoming fiscal year; (3) establishing a maintenance and capital project tracking module in HEFIS to track institution progress in completing projects and require the institutions to update project information periodically; and (4) supplementing deficient institution funds, or just Council institution funds, with state appropriations.
4
Higher Education Deferred Maintenance 7 September 2008 Page 5 Potential Implications: Institution flexibility and autonomy would be reduced. Requiring that an appropriate line item amount be identified in the budget bill for E&G and Auxiliary maintenance would (1) require (accurate) revenue estimates from the institutions; (2) set a maximum amount that could be spent in any given fiscal year; (3) bring a degree of discipline to the process of planning maintenance and deferred maintenance projects; (4) in order to deal with an emergency, an institution may have to adjust its project list submitted to the Commission or Council by placing the emergency project on the list and possibly deferring one or two listed projects to the next year; (4) require periodic reporting on the status of projects; and (5) the state would probably need to supplement funding, particularly at the CTC institution, if it wishes to keep tuition and fees low. Recommendation No. 5. Consider one-time funding to remove obsolete facilities from institution inventories. Potential Implications: It would be advantageous to remove obsolete buildings from campus inventories. Institutions would be required to identify obsolete facilities, identify any hazardous materials in the buildings and provide estimates of the cost of demolition. State funding would need to be provided. Recommendation No. 6. An alternative to Recommendation No. 4 would be to define in the Code what E&G and Auxiliary Capital Fees may be used for and to ensure they are being used for these purposes, require institution reporting and monitoring and audits by Commission and Council monitoring and audits. Potential Implications: This approach would provide somewhat greater institution flexibility than Recommendation No. 4 in being able to use these special revenue fees for changing circumstances, such as emergencies, while maintaining the mandate to use the balance after debt service obligations are met for maintenance and building renewal. It does place an additional reporting and auditing burden on the institutions and the Commission and Council staff.
Demonstration of HEFIS (Higher Education Facilities Management System) A brief presentation will be made on HEFIS (the Higher Education Facilities Information System) to acquaint the Subcommittee with this application and how it may be used as a management tool to provide the data/information needed to manage deferred maintenance, building renewal and new capital projects.
5
HEFIS
Higher Education Facilities Information system
6

HEFIS
“In order to solve a problem, you have to be able to measure it.” (Daniel Patrick Moynihan)
7
HEFIS History
• Started in 2003.
• Began as a cooperative effort between the Commission and WVU’s Department of Facilities and Service.
• Created statewide inventory of all buildings and facilities.
8
HEFIS History
• HEFIS is West Virginia’s “Higher Education Facilities Information System”
• 23 institutions/campuses use HEFIS in some fashion to manage their facilities and provide data.
• The Higher Education Policy Commission and the Community and Technical College System use HEFIS to facilitate annual reporting functions.
• Some institutions use HEFIS to manage internal projects and track equipment inventories.
9
HEFIS History
• HEFIS is a vehicle for implementing a statewide standard for space classification, utilization and data acquisition.
• Allows the Commission to report data for comparative analysis among West Virginia institutions, peer institutions and nationally.
• It can also be used as an analytical tool for facilities planning, future capital allocations and managing capital projects and deferred maintenance.
10
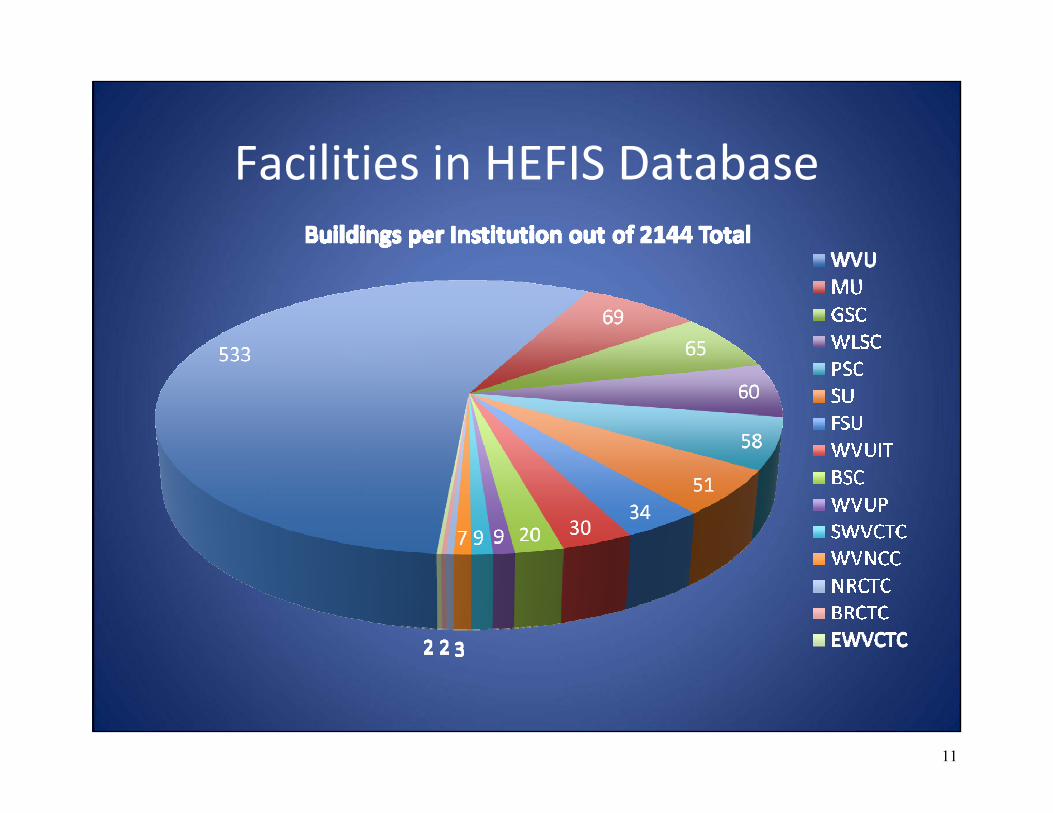
Facilities in HEFIS Database
11
HEFIS Applications
• Schirmer (BRIM) Module• Work Order Module• Equipment Module• Housing Module• Capital Appropriation Request Module• Capital Projects Module• Vehicle Module
Having an institution and campus building and room inventory has provided the opportunity to develop a number of applications:
12
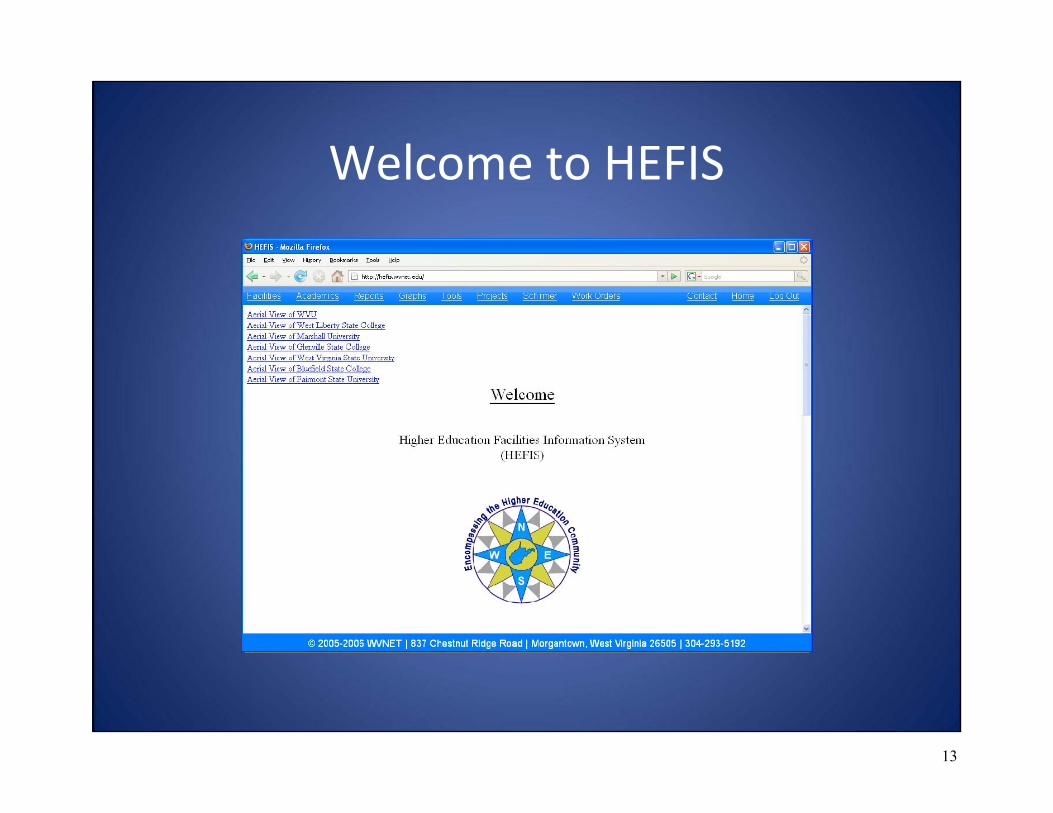
Welcome to HEFIS
13
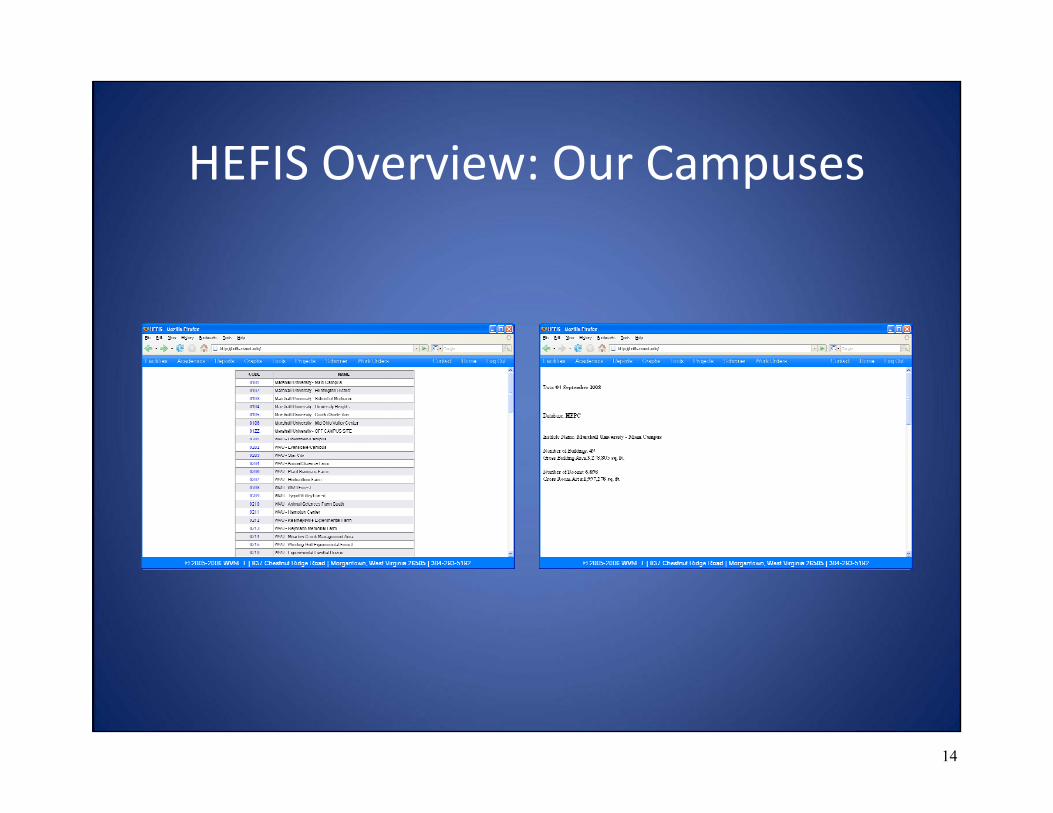
HEFIS Overview: Our Campuses
14
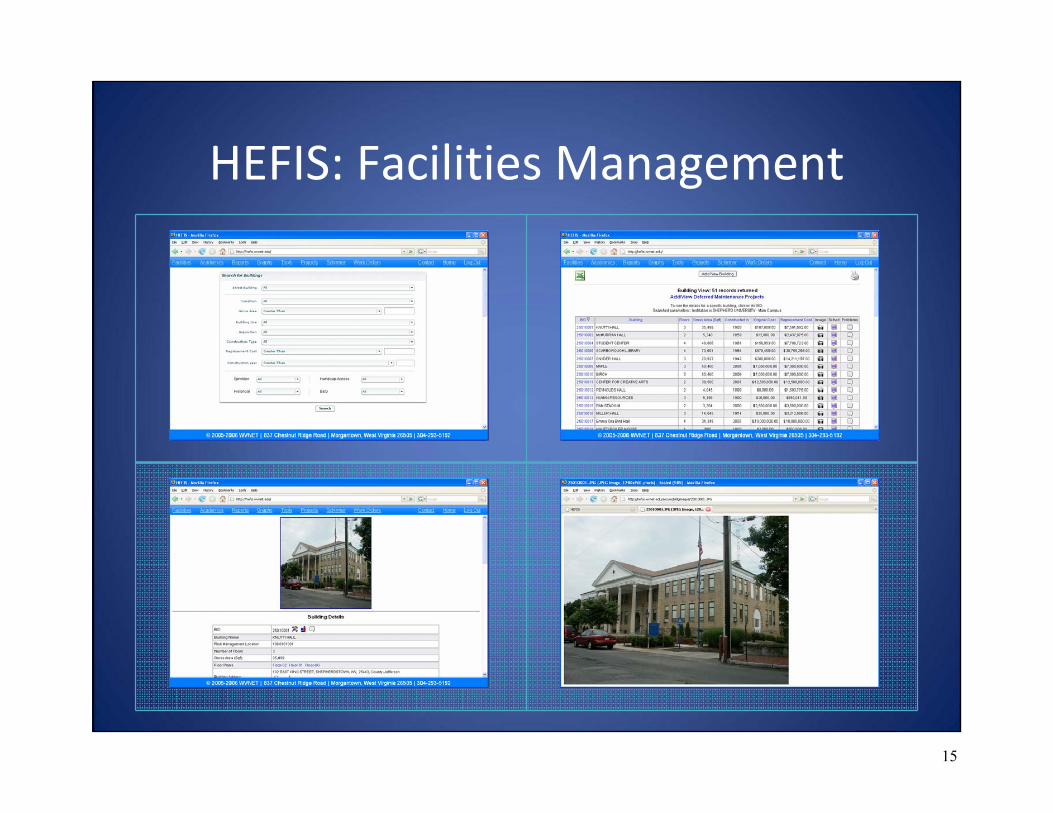
HEFIS: Facilities Management
15
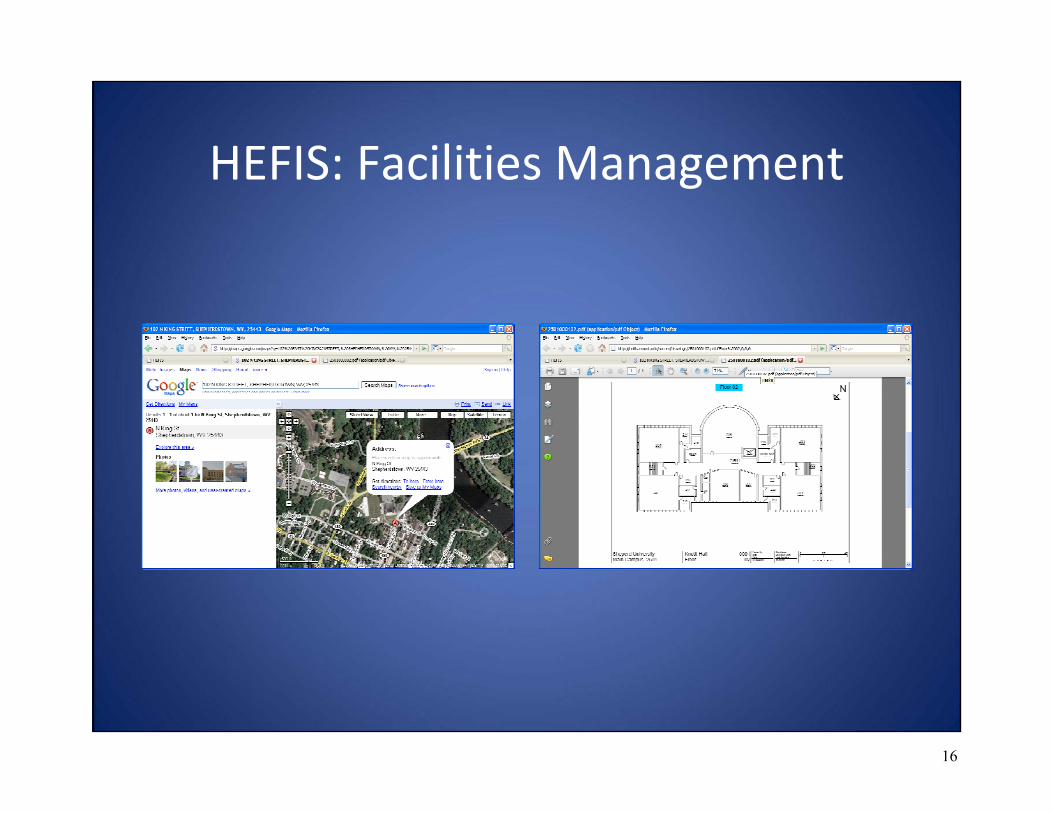
HEFIS: Facilities Management
16
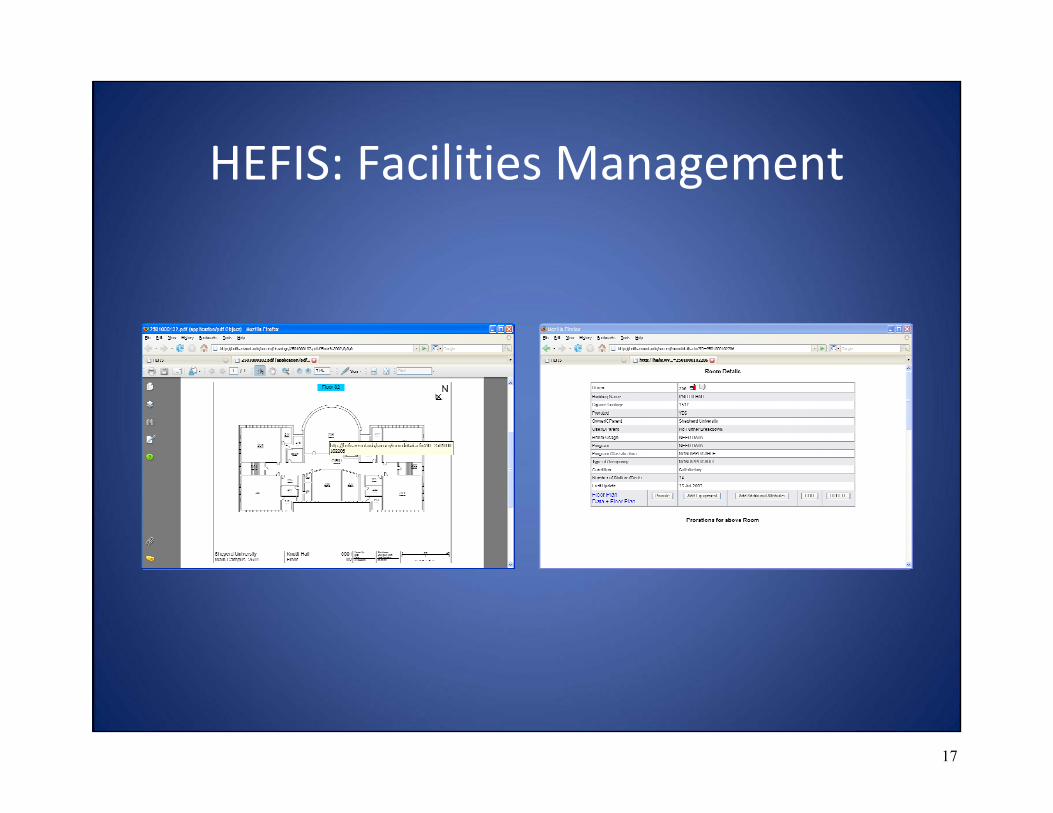
HEFIS: Facilities Management
17
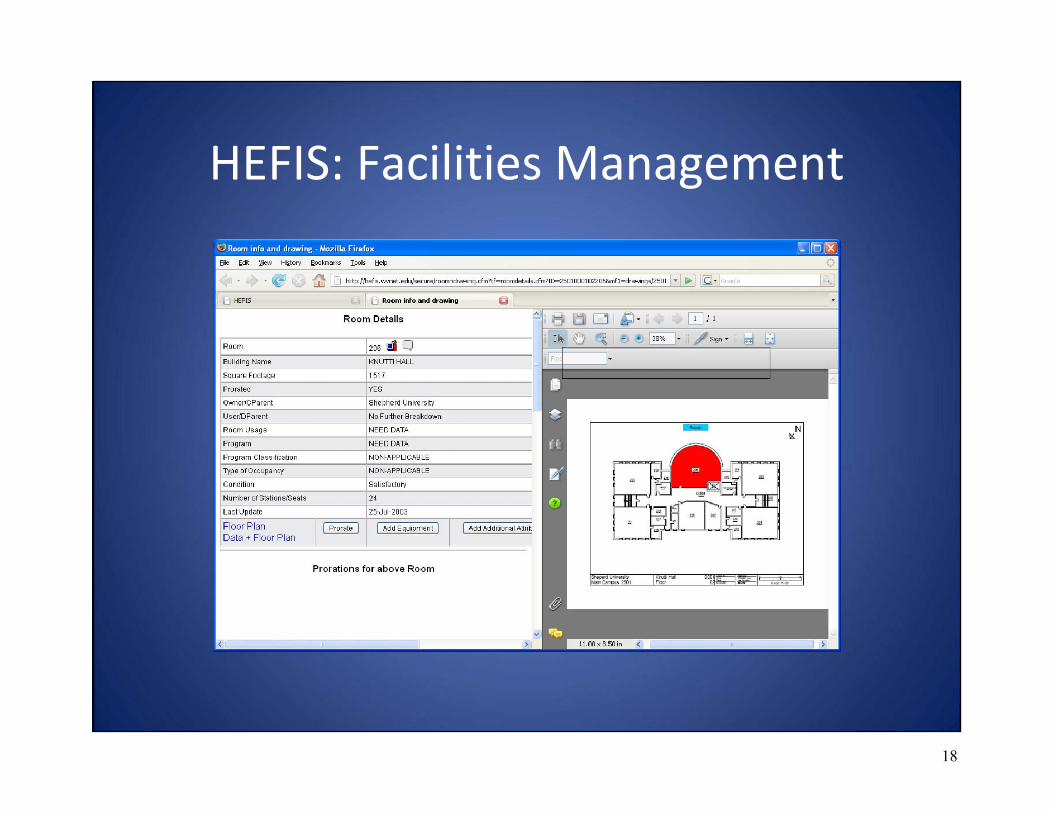
HEFIS: Facilities Management
18
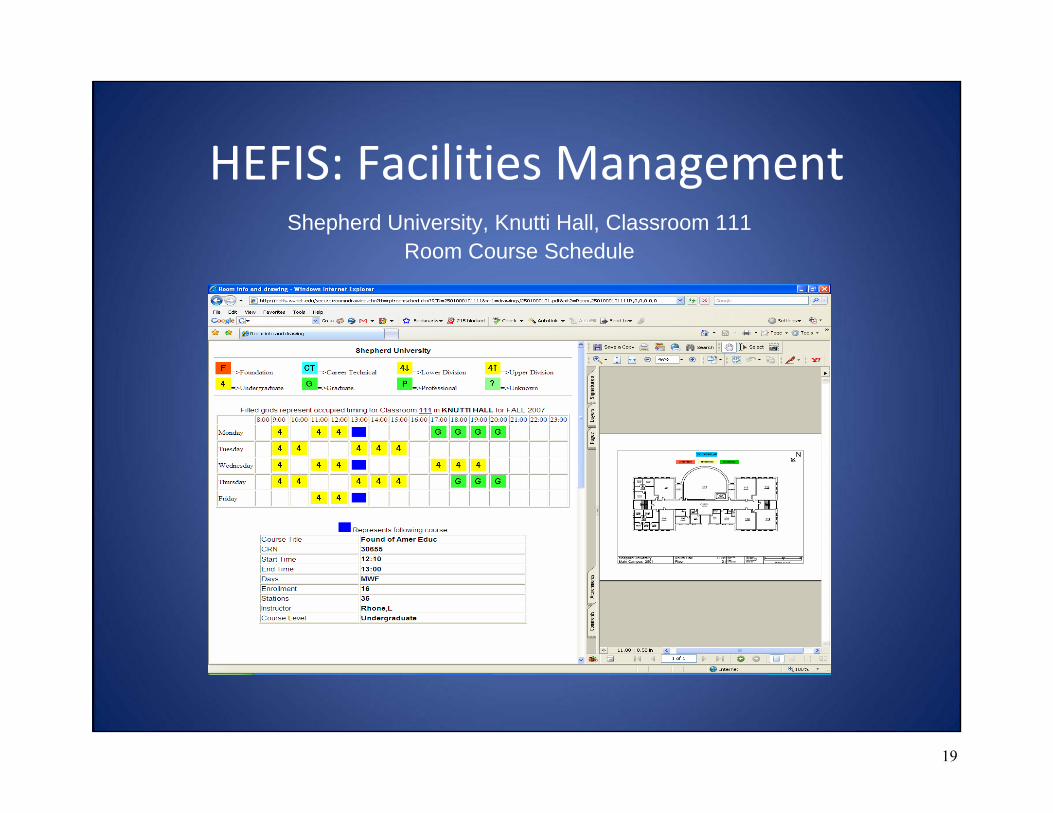
HEFIS: Facilities ManagementShepherd University, Knutti Hall, Classroom 111
Room Course Schedule
19
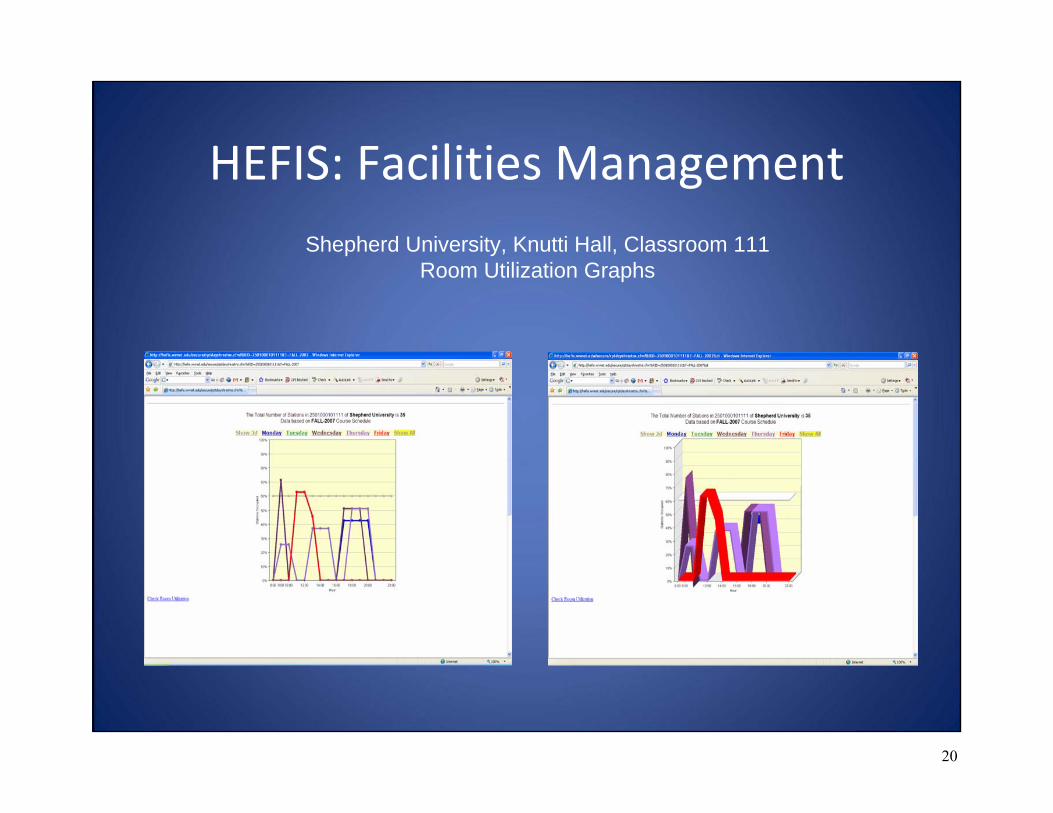
HEFIS: Facilities ManagementShepherd University, Knutti Hall, Classroom 111
Room Utilization Graphs
20
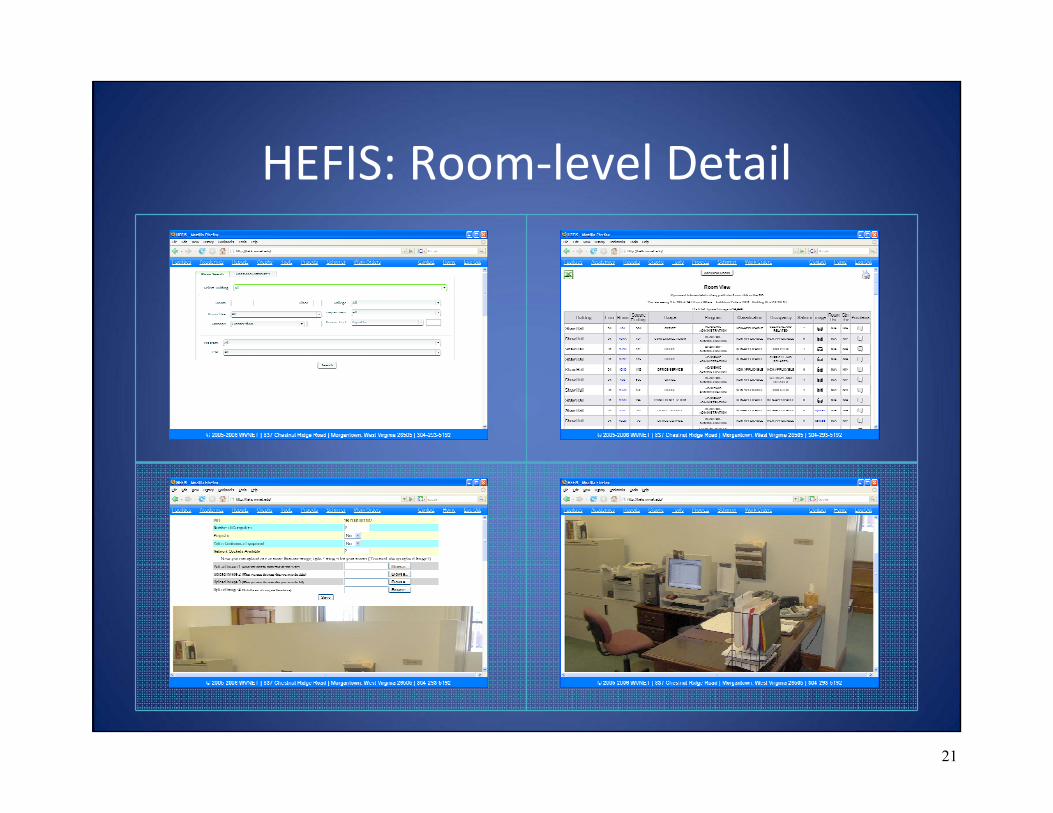
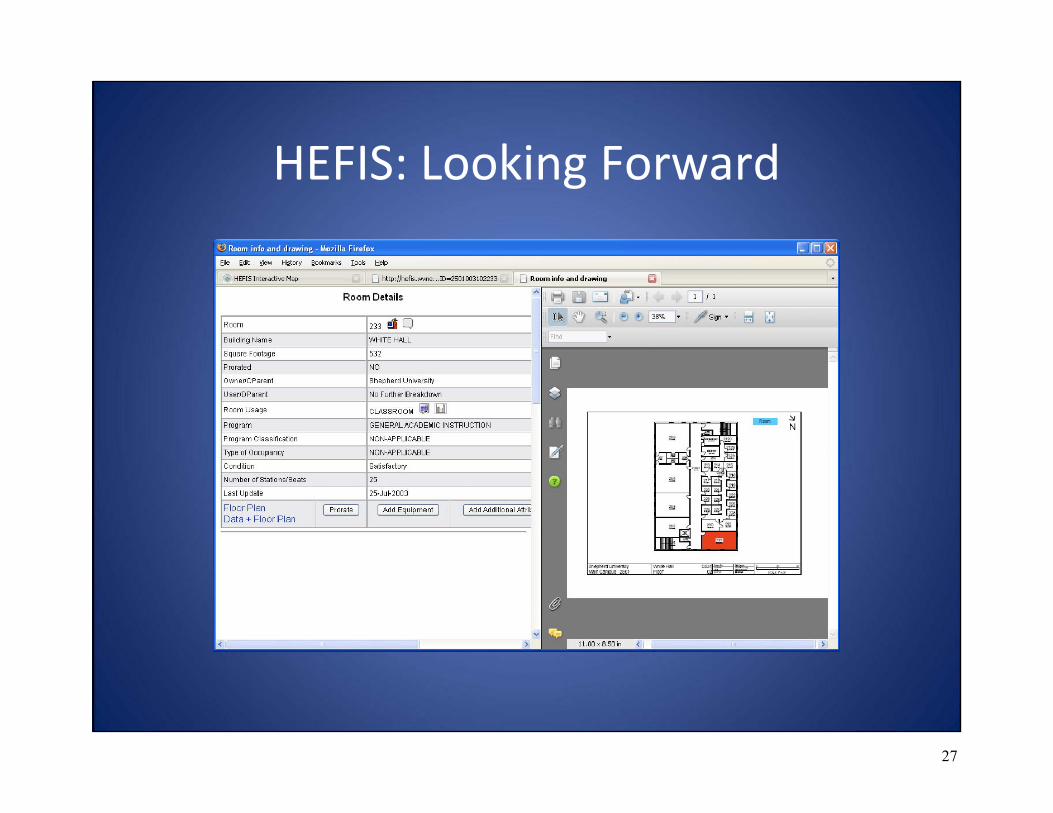
HEFIS: Room‐level Detail
21
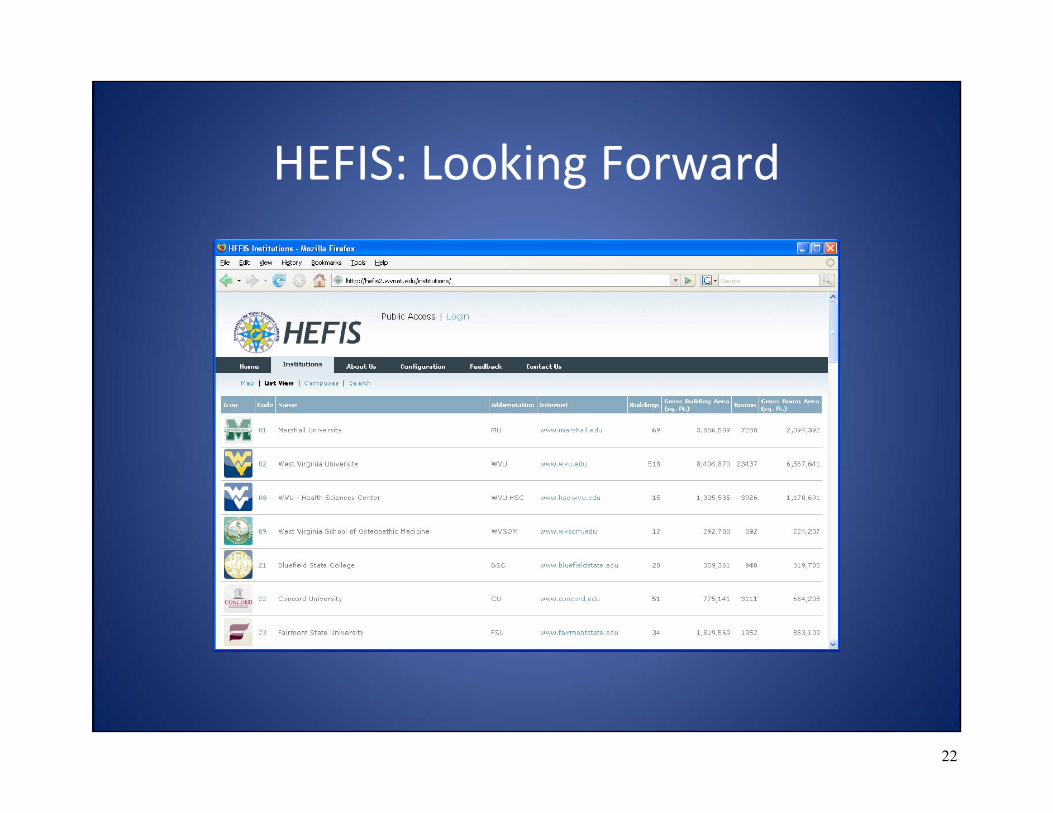
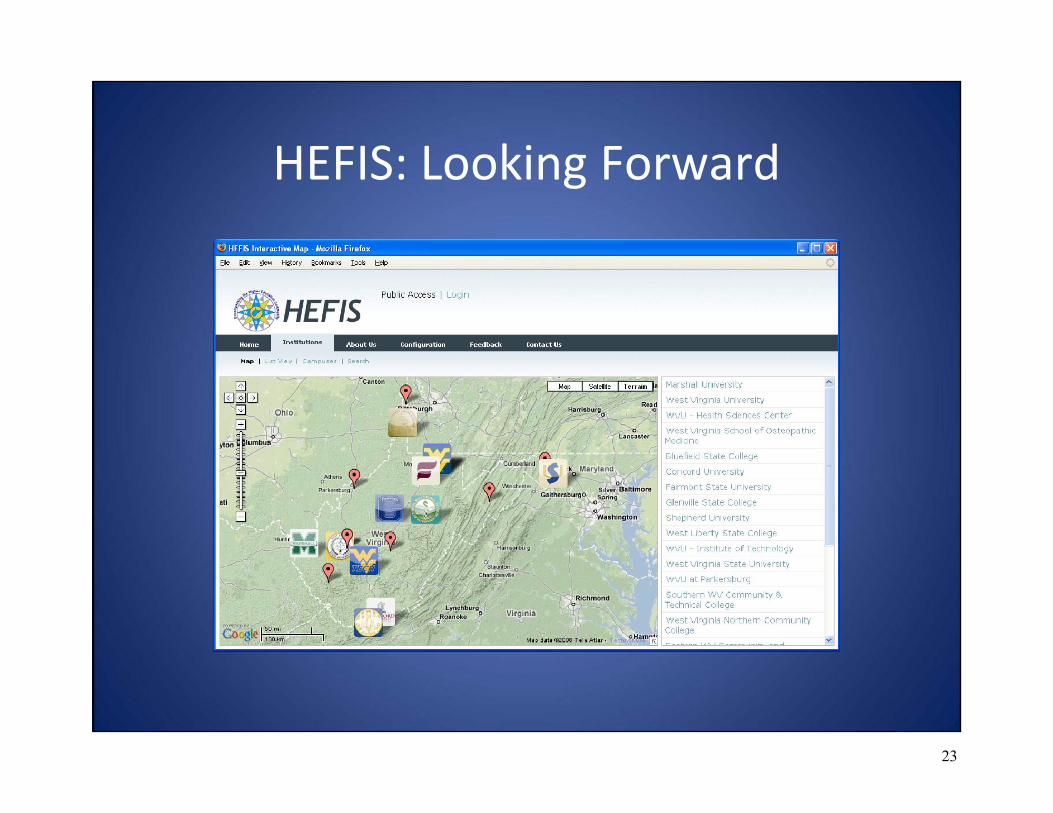
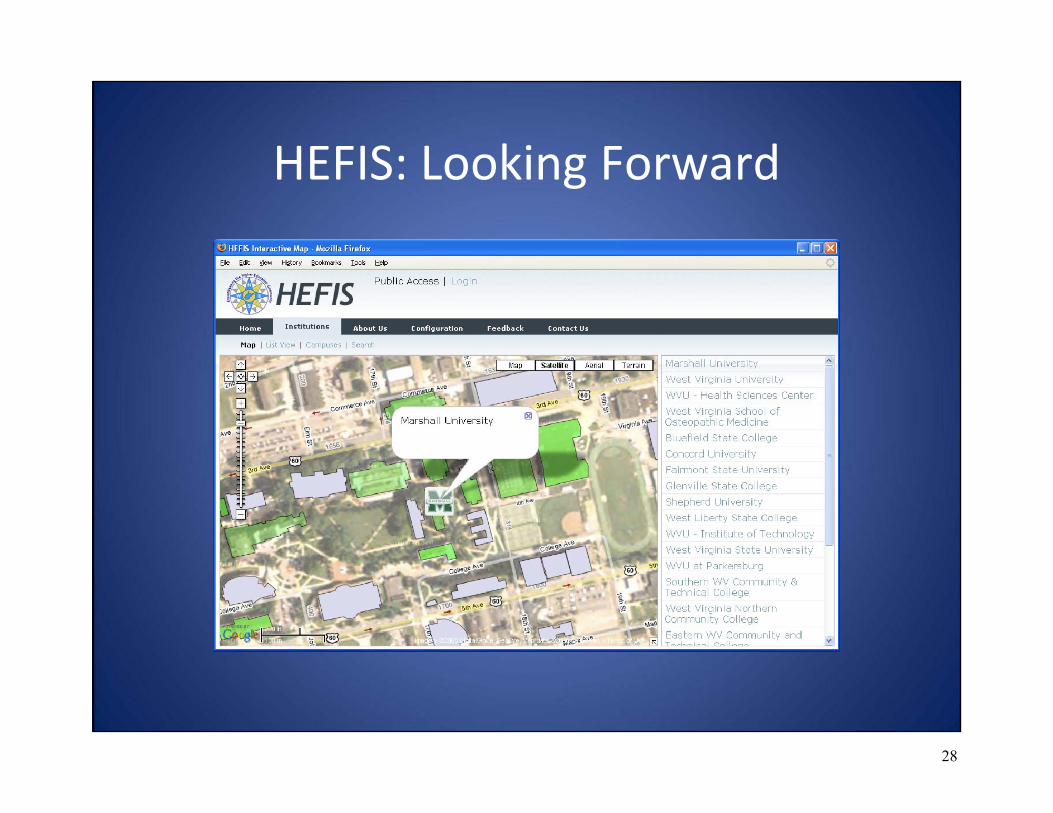
HEFIS: Looking Forward
22
HEFIS: Looking Forward
23
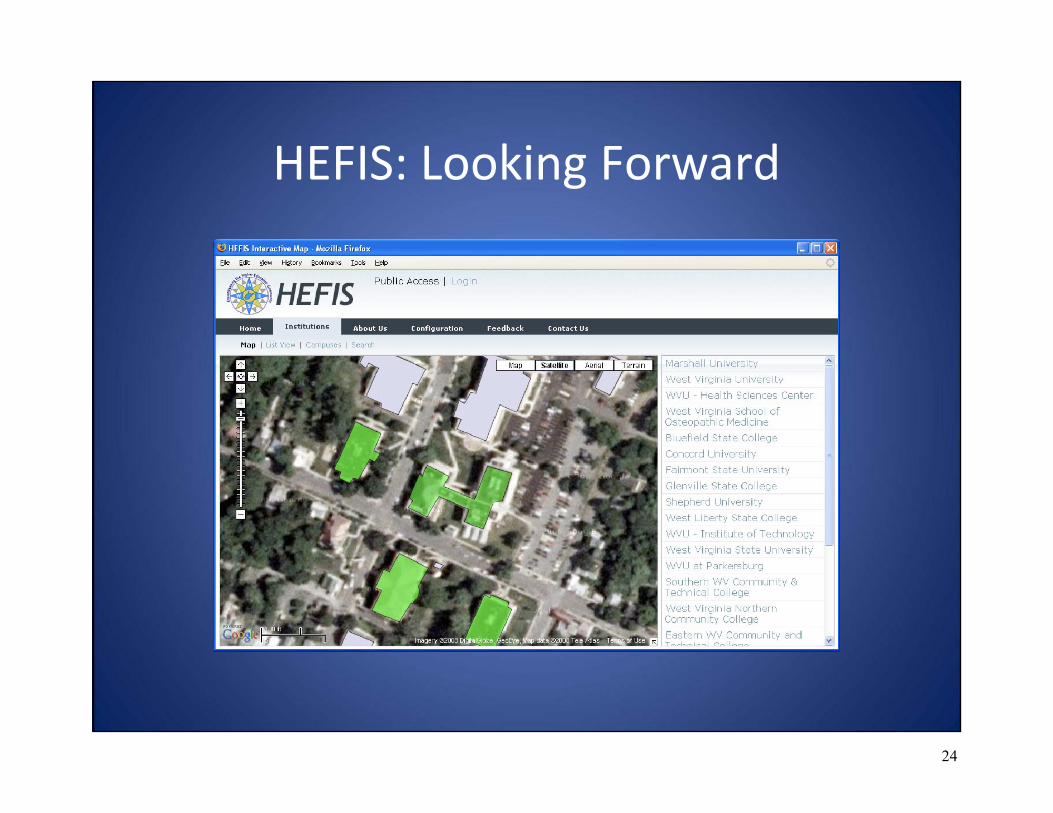
HEFIS: Looking Forward
24
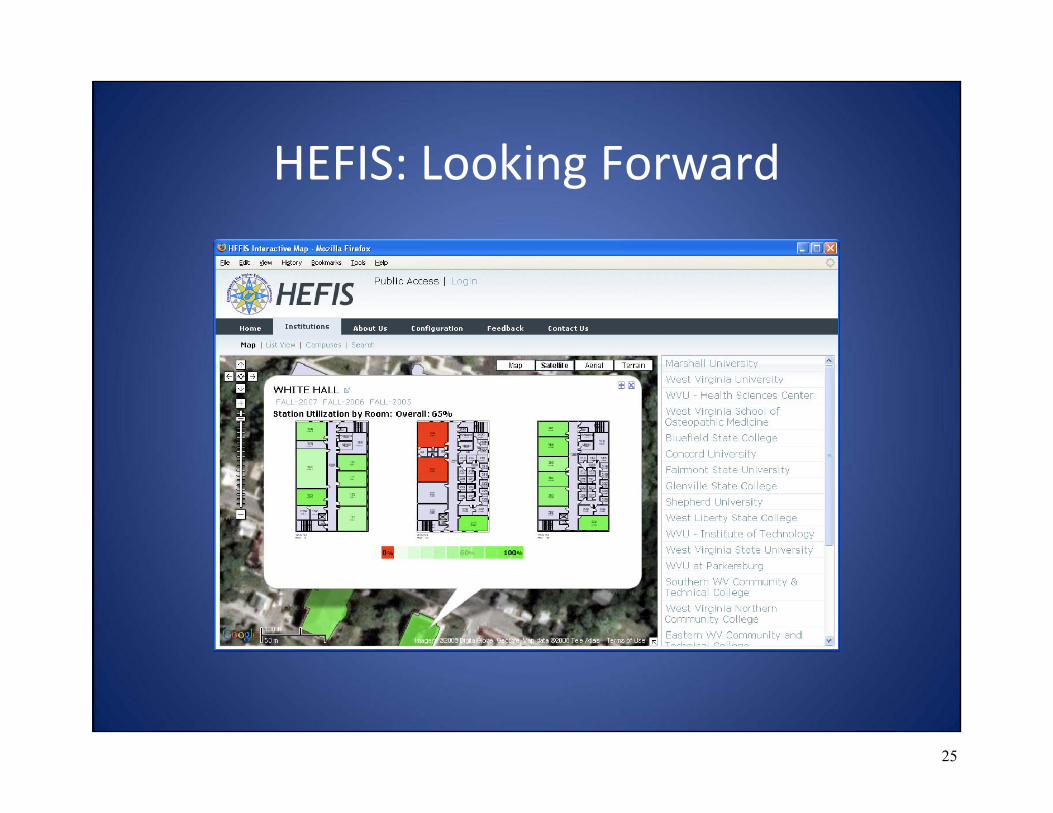
HEFIS: Looking Forward
25
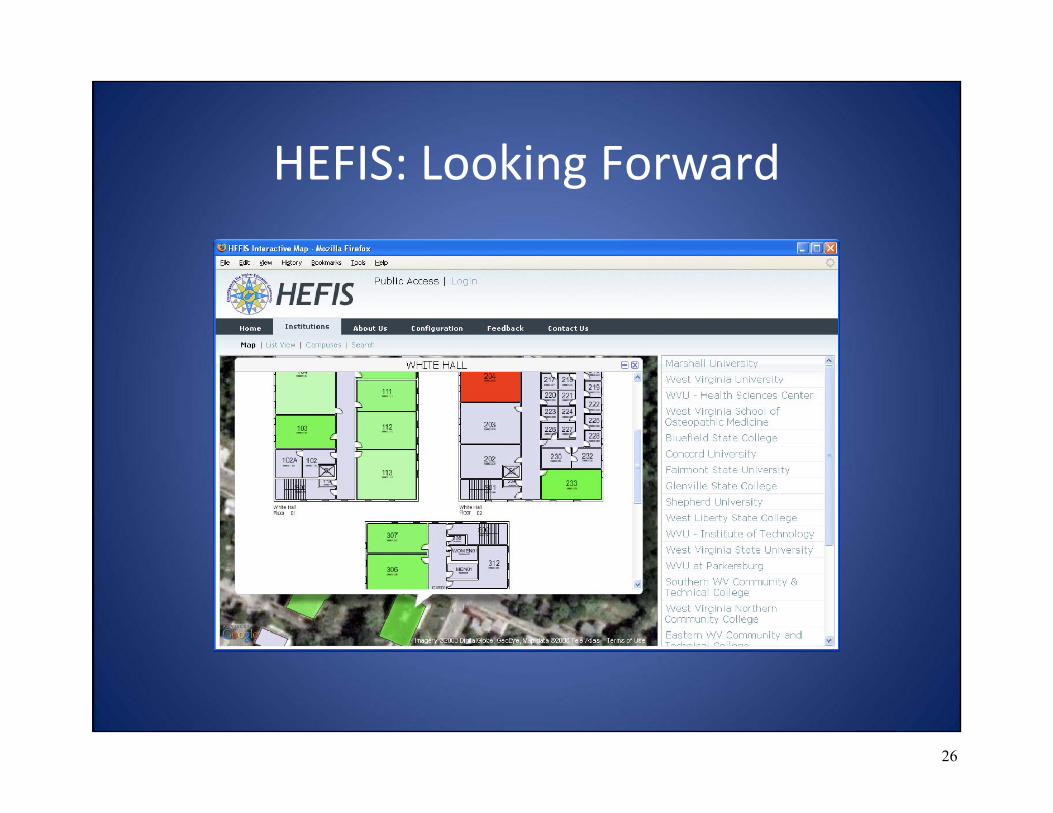
HEFIS: Looking Forward
26
HEFIS: Looking Forward
27
HEFIS: Looking Forward
28

HEFIS Closing Comments
• HEFIS is a unique system that can be used to manage major capital projects and maintenance and deferred maintenance.
• It can be used to:– Calculate current building replacement values.
– Run an annual maintenance (building renewal) formula.
– Provide a planning list of major capital projects and deferred maintenance projects awaiting funding.
– Provide a tracking and reporting system for projects that have been funded.
– Maintain a database of completed projects.
29
Classroom and Classlab Utilization Report Fall 2006
30
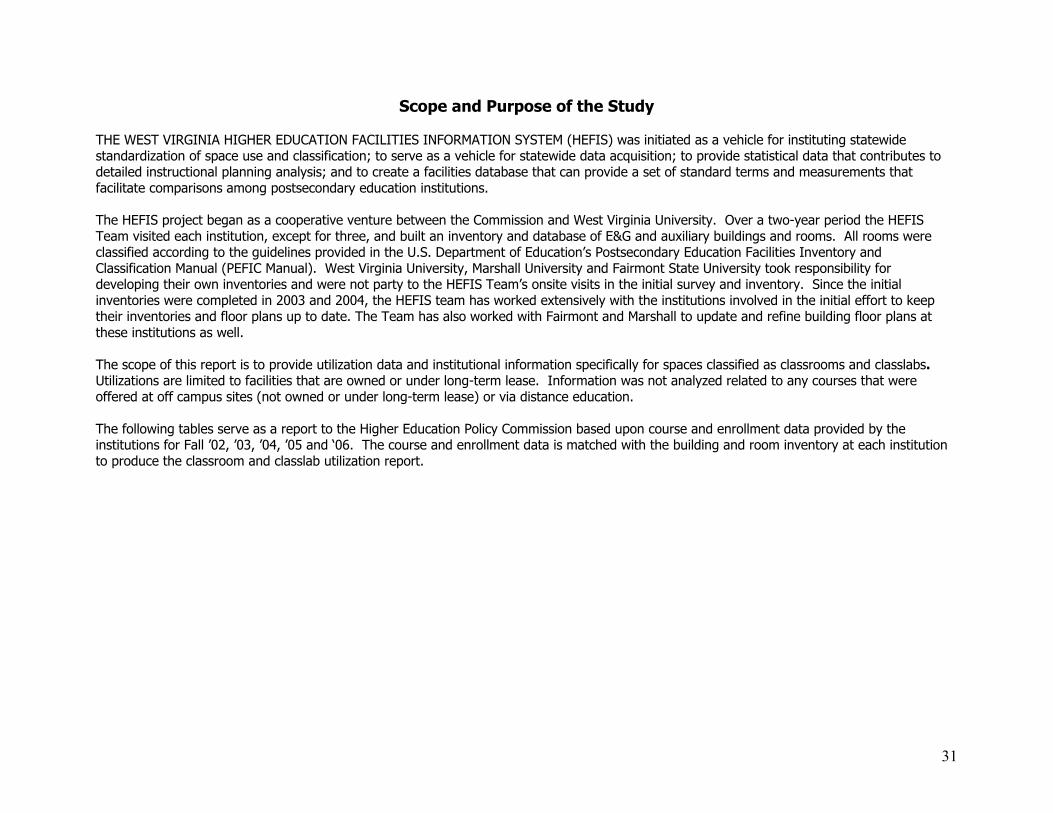
Scope and Purpose of the Study THE WEST VIRGINIA HIGHER EDUCATION FACILITIES INFORMATION SYSTEM (HEFIS) was initiated as a vehicle for instituting statewide standardization of space use and classification; to serve as a vehicle for statewide data acquisition; to provide statistical data that contributes to detailed instructional planning analysis; and to create a facilities database that can provide a set of standard terms and measurements that facilitate comparisons among postsecondary education institutions. The HEFIS project began as a cooperative venture between the Commission and West Virginia University. Over a two-year period the HEFIS Team visited each institution, except for three, and built an inventory and database of E&G and auxiliary buildings and rooms. All rooms were classified according to the guidelines provided in the U.S. Department of Education’s Postsecondary Education Facilities Inventory and Classification Manual (PEFIC Manual). West Virginia University, Marshall University and Fairmont State University took responsibility for developing their own inventories and were not party to the HEFIS Team’s onsite visits in the initial survey and inventory. Since the initial inventories were completed in 2003 and 2004, the HEFIS team has worked extensively with the institutions involved in the initial effort to keep their inventories and floor plans up to date. The Team has also worked with Fairmont and Marshall to update and refine building floor plans at these institutions as well. The scope of this report is to provide utilization data and institutional information specifically for spaces classified as classrooms and classlabs. Utilizations are limited to facilities that are owned or under long-term lease. Information was not analyzed related to any courses that were offered at off campus sites (not owned or under long-term lease) or via distance education. The following tables serve as a report to the Higher Education Policy Commission based upon course and enrollment data provided by the institutions for Fall ’02, ’03, ’04, ’05 and ‘06. The course and enrollment data is matched with the building and room inventory at each institution to produce the classroom and classlab utilization report.
31

Institutional Classroom Utilization Report (Report Table 1)
This report details specific information for institutional classroom utilization. The room utilization shows how many hours per week that the classrooms are in use. The station utilization shows how well the number of students matches the size of the room and how many seats are filled when classes meet. Parameters:
● Total available Room Hours is 70 counted Monday through Friday from 8:00 A.M. – 10:00 P.M. ● Total available Day Hours is 45 counted Monday through Friday from 8:00 A.M. – 5:00 P.M. ● Total available Evening Hours is 25 counted Monday through Friday from 5:00 P.M. – 10:00 P.M.
Guidelines: ● Recommended Room Utilization for Classrooms is 42 hours per week or 60%. ● Recommended Station Utilization for Classrooms is 60% of seats occupied during class.
Utilization: ● The Total Number of Rooms shows the total number of classrooms at the institution. ● The Total SqFt is the total room square footage classified as classroom space at the institution. ● The Total Course Enrollment shows the total number of students enrolled in courses scheduled in classrooms at the institution.
This counts all enrollments in that if a single student is enrolled in three different classes, the student is counted once for each course in which they are enrolled. This does not reflect FTE enrollment at the institution. This number is computed in the underlying database and inserted into this report.
• The Room Hours of Instruction is the cumulative total number of hours that all classes in classrooms are scheduled to meet in one week. This number is computed in the underlying database and inserted into this report.
o Day Hours shows the total number of room hours that fall between 8:00 A.M. and 5:00 P.M. o Evening Hours shows the total number of room hours that fall between 5:00 P.M. and 10:00 P.M. o Total is the total for all hours that rooms are in use. The maximum assumed number of hours that one classroom could
be in use in one week is 70. Scheduled times that fall outside those hours are added to the evening total; for example, Saturday classes.
• Room Utilization heading is broken down to show: o The Average Weekly Hours is total room hours divided by the number of rooms. o The Percent Weekly Utilization is the average weekly hours divided by 70 x 100 for percentage
• The Student Stations heading covers the following: o Total Number of student stations that are available in classrooms at the institution, pulled from database. o The Percent Utilization shows the average percentage of student stations that are in use for all courses. It is the
number of stations in use divided by the total number of stations available and multiplied by 100 to create a percentage. Total student clock hours are divided by potential student clock hours X 100 for a percentage.
o The Average Weekly Hours of Use is the average number of hours each week that each station is in use. • The Student Clock Hours section shows two pieces of information:
32
o The Total Number is arrived at in the database by multiplying for each course, the number of hours that it meets in a week by the number of students enrolled and then totaling for all courses.
o Potential Student Clock Hours is determined in the database by multiplying the number of hours that a course meets each week by the number of stations contained in the room and then totaling for all courses. This number shows how many student clock hours could be generated if all the seats were filled in each course.
33
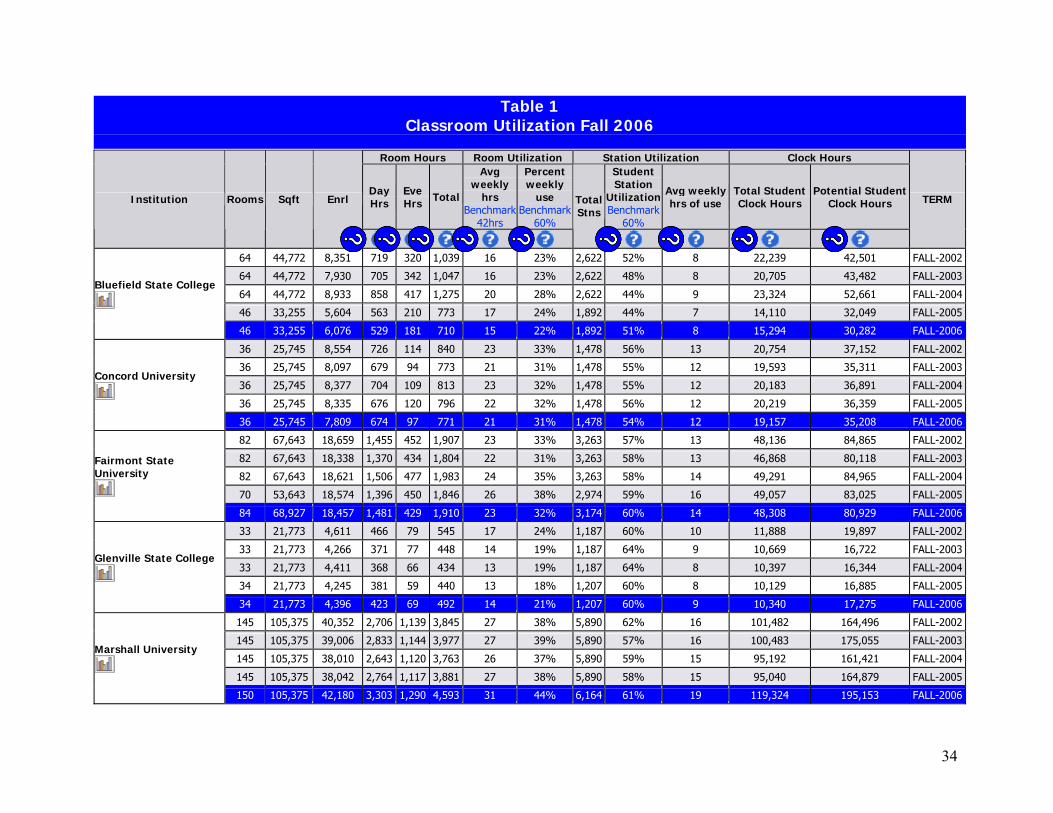
Table 1 Classroom Utilization Fall 2006
Room Hours Room Utilization Station Utilization Clock Hours
Day Hrs
Eve Hrs Total
Avg weekly
hrs Benchmark
42hrs
Percent weekly
use Benchmark
60%
Student Station
UtilizationBenchmark
60%
Avg weekly hrs of use
Total Student Clock Hours
Potential Student Clock Hours Institution Rooms Sqft Enrl
Total Stns
TERM
64 44,772 8,351 719 320 1,039 16 23% 2,622 52% 8 22,239 42,501 FALL-2002
64 44,772 7,930 705 342 1,047 16 23% 2,622 48% 8 20,705 43,482 FALL-2003
64 44,772 8,933 858 417 1,275 20 28% 2,622 44% 9 23,324 52,661 FALL-2004
46 33,255 5,604 563 210 773 17 24% 1,892 44% 7 14,110 32,049 FALL-2005
Bluefield State College
46 33,255 6,076 529 181 710 15 22% 1,892 51% 8 15,294 30,282 FALL-2006
36 25,745 8,554 726 114 840 23 33% 1,478 56% 13 20,754 37,152 FALL-2002
36 25,745 8,097 679 94 773 21 31% 1,478 55% 12 19,593 35,311 FALL-2003
36 25,745 8,377 704 109 813 23 32% 1,478 55% 12 20,183 36,891 FALL-2004
36 25,745 8,335 676 120 796 22 32% 1,478 56% 12 20,219 36,359 FALL-2005
Concord University
36 25,745 7,809 674 97 771 21 31% 1,478 54% 12 19,157 35,208 FALL-2006
82 67,643 18,659 1,455 452 1,907 23 33% 3,263 57% 13 48,136 84,865 FALL-2002
82 67,643 18,338 1,370 434 1,804 22 31% 3,263 58% 13 46,868 80,118 FALL-2003
82 67,643 18,621 1,506 477 1,983 24 35% 3,263 58% 14 49,291 84,965 FALL-2004
70 53,643 18,574 1,396 450 1,846 26 38% 2,974 59% 16 49,057 83,025 FALL-2005
Fairmont State University
84 68,927 18,457 1,481 429 1,910 23 32% 3,174 60% 14 48,308 80,929 FALL-2006
33 21,773 4,611 466 79 545 17 24% 1,187 60% 10 11,888 19,897 FALL-2002
33 21,773 4,266 371 77 448 14 19% 1,187 64% 9 10,669 16,722 FALL-2003
33 21,773 4,411 368 66 434 13 19% 1,187 64% 8 10,397 16,344 FALL-2004
34 21,773 4,245 381 59 440 13 18% 1,207 60% 8 10,129 16,885 FALL-2005
Glenville State College
34 21,773 4,396 423 69 492 14 21% 1,207 60% 9 10,340 17,275 FALL-2006
145 105,375 40,352 2,706 1,139 3,845 27 38% 5,890 62% 16 101,482 164,496 FALL-2002
145 105,375 39,006 2,833 1,144 3,977 27 39% 5,890 57% 16 100,483 175,055 FALL-2003
145 105,375 38,010 2,643 1,120 3,763 26 37% 5,890 59% 15 95,192 161,421 FALL-2004
145 105,375 38,042 2,764 1,117 3,881 27 38% 5,890 58% 15 95,040 164,879 FALL-2005
Marshall University
150 105,375 42,180 3,303 1,290 4,593 31 44% 6,164 61% 19 119,324 195,153 FALL-2006
34
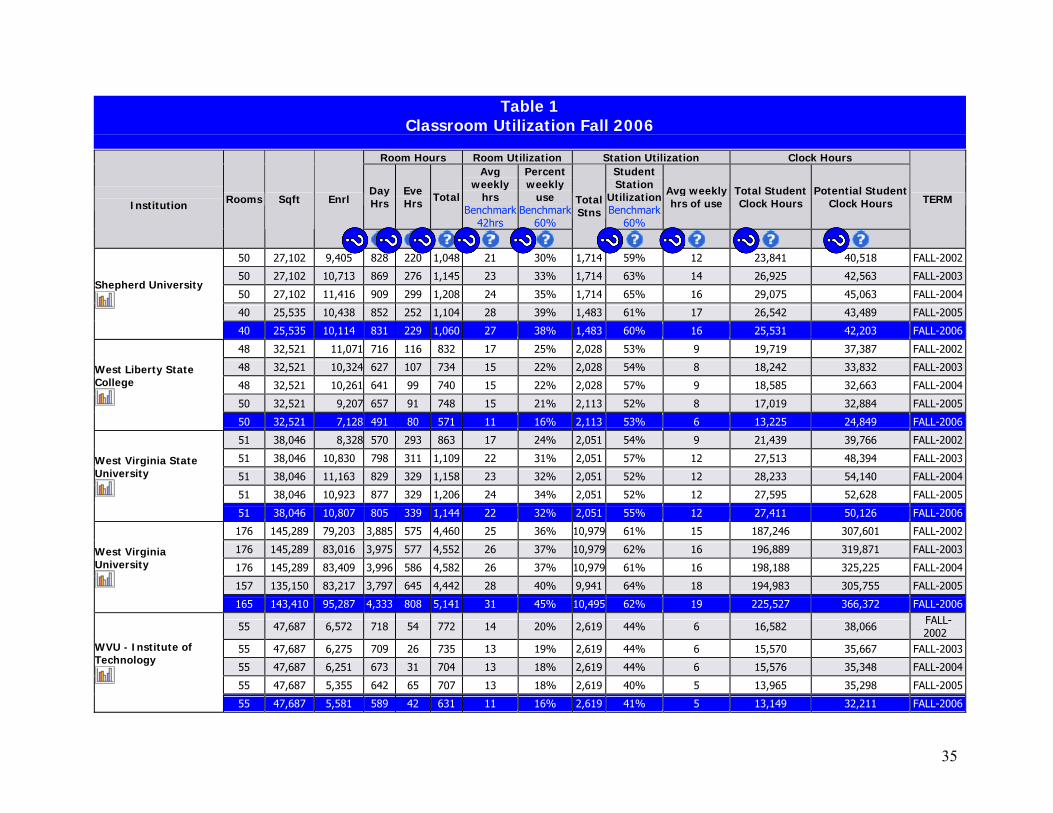
Table 1 Classroom Utilization Fall 2006
Room Hours Room Utilization Station Utilization Clock Hours
Day Hrs
Eve Hrs Total
Avg weekly
hrs Benchmark
42hrs
Percent weekly
use Benchmark
60%
Student Station
UtilizationBenchmark
60%
Avg weekly hrs of use
Total Student Clock Hours
Potential Student Clock Hours
Institution Rooms Sqft Enrl
Total Stns
TERM
50 27,102 9,405 828 220 1,048 21 30% 1,714 59% 12 23,841 40,518 FALL-2002
50 27,102 10,713 869 276 1,145 23 33% 1,714 63% 14 26,925 42,563 FALL-2003
50 27,102 11,416 909 299 1,208 24 35% 1,714 65% 16 29,075 45,063 FALL-2004
40 25,535 10,438 852 252 1,104 28 39% 1,483 61% 17 26,542 43,489 FALL-2005
Shepherd University
40 25,535 10,114 831 229 1,060 27 38% 1,483 60% 16 25,531 42,203 FALL-2006
48 32,521 11,071 716 116 832 17 25% 2,028 53% 9 19,719 37,387 FALL-2002
48 32,521 10,324 627 107 734 15 22% 2,028 54% 8 18,242 33,832 FALL-2003
48 32,521 10,261 641 99 740 15 22% 2,028 57% 9 18,585 32,663 FALL-2004
50 32,521 9,207 657 91 748 15 21% 2,113 52% 8 17,019 32,884 FALL-2005
West Liberty State College
50 32,521 7,128 491 80 571 11 16% 2,113 53% 6 13,225 24,849 FALL-2006
51 38,046 8,328 570 293 863 17 24% 2,051 54% 9 21,439 39,766 FALL-2002
51 38,046 10,830 798 311 1,109 22 31% 2,051 57% 12 27,513 48,394 FALL-2003
51 38,046 11,163 829 329 1,158 23 32% 2,051 52% 12 28,233 54,140 FALL-2004
51 38,046 10,923 877 329 1,206 24 34% 2,051 52% 12 27,595 52,628 FALL-2005
West Virginia State University
51 38,046 10,807 805 339 1,144 22 32% 2,051 55% 12 27,411 50,126 FALL-2006
176 145,289 79,203 3,885 575 4,460 25 36% 10,979 61% 15 187,246 307,601 FALL-2002
176 145,289 83,016 3,975 577 4,552 26 37% 10,979 62% 16 196,889 319,871 FALL-2003
176 145,289 83,409 3,996 586 4,582 26 37% 10,979 61% 16 198,188 325,225 FALL-2004
157 135,150 83,217 3,797 645 4,442 28 40% 9,941 64% 18 194,983 305,755 FALL-2005
West Virginia University
165 143,410 95,287 4,333 808 5,141 31 45% 10,495 62% 19 225,527 366,372 FALL-2006
55 47,687 6,572 718 54 772 14 20% 2,619 44% 6 16,582 38,066 FALL-2002
55 47,687 6,275 709 26 735 13 19% 2,619 44% 6 15,570 35,667 FALL-2003
55 47,687 6,251 673 31 704 13 18% 2,619 44% 6 15,576 35,348 FALL-2004
55 47,687 5,355 642 65 707 13 18% 2,619 40% 5 13,965 35,298 FALL-2005
WVU - Institute of Technology
55 47,687 5,581 589 42 631 11 16% 2,619 41% 5 13,149 32,211 FALL-2006
35
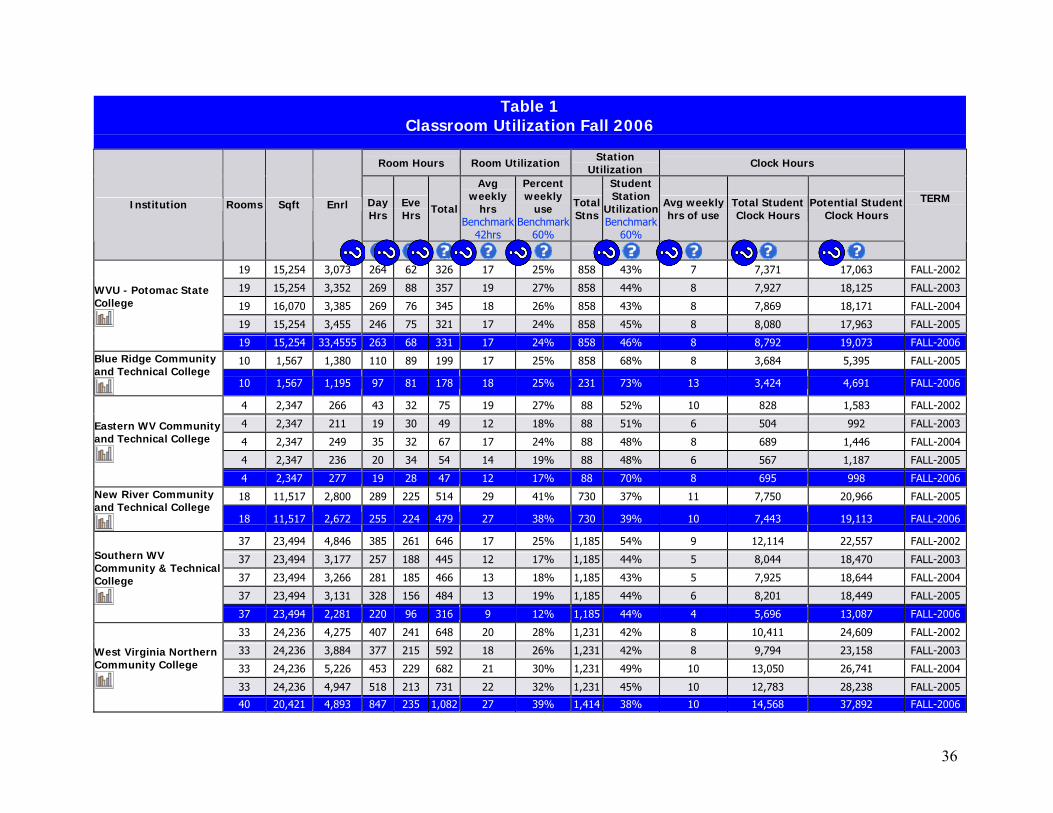
Table 1 Classroom Utilization Fall 2006
Room Hours Room Utilization Station Utilization Clock Hours
Day Hrs
Eve Hrs Total
Avg weekly
hrs Benchmark
42hrs
Percent weekly
use Benchmark
60%
Total Stns
Student Station
UtilizationBenchmark
60%
Avg weekly hrs of use
Total Student Clock Hours
Potential Student Clock Hours
Institution Rooms Sqft Enrl
TERM
19 15,254 3,073 264 62 326 17 25% 858 43% 7 7,371 17,063 FALL-2002
19 15,254 3,352 269 88 357 19 27% 858 44% 8 7,927 18,125 FALL-2003
19 16,070 3,385 269 76 345 18 26% 858 43% 8 7,869 18,171 FALL-2004
19 15,254 3,455 246 75 321 17 24% 858 45% 8 8,080 17,963 FALL-2005
WVU - Potomac State College
19 15,254 33,4555 263 68 331 17 24% 858 46% 8 8,792 19,073 FALL-2006
10 1,567 1,380 110 89 199 17 25% 858 68% 8 3,684 5,395 FALL-2005Blue Ridge Community and Technical College
10 1,567 1,195 97 81 178 18 25% 231 73% 13 3,424 4,691 FALL-2006
4 2,347 266 43 32 75 19 27% 88 52% 10 828 1,583 FALL-2002
4 2,347 211 19 30 49 12 18% 88 51% 6 504 992 FALL-2003
4 2,347 249 35 32 67 17 24% 88 48% 8 689 1,446 FALL-2004
4 2,347 236 20 34 54 14 19% 88 48% 6 567 1,187 FALL-2005
Eastern WV Community and Technical College
4 2,347 277 19 28 47 12 17% 88 70% 8 695 998 FALL-2006
18 11,517 2,800 289 225 514 29 41% 730 37% 11 7,750 20,966 FALL-2005New River Community and Technical College
18 11,517 2,672 255 224 479 27 38% 730 39% 10 7,443 19,113 FALL-2006
37 23,494 4,846 385 261 646 17 25% 1,185 54% 9 12,114 22,557 FALL-2002
37 23,494 3,177 257 188 445 12 17% 1,185 44% 5 8,044 18,470 FALL-2003
37 23,494 3,266 281 185 466 13 18% 1,185 43% 5 7,925 18,644 FALL-2004
37 23,494 3,131 328 156 484 13 19% 1,185 44% 6 8,201 18,449 FALL-2005
Southern WV Community & Technical College
37 23,494 2,281 220 96 316 9 12% 1,185 44% 4 5,696 13,087 FALL-2006
33 24,236 4,275 407 241 648 20 28% 1,231 42% 8 10,411 24,609 FALL-2002
33 24,236 3,884 377 215 592 18 26% 1,231 42% 8 9,794 23,158 FALL-2003
33 24,236 5,226 453 229 682 21 30% 1,231 49% 10 13,050 26,741 FALL-2004
33 24,236 4,947 518 213 731 22 32% 1,231 45% 10 12,783 28,238 FALL-2005
West Virginia Northern Community College
40 20,421 4,893 847 235 1,082 27 39% 1,414 38% 10 14,568 37,892 FALL-2006
36
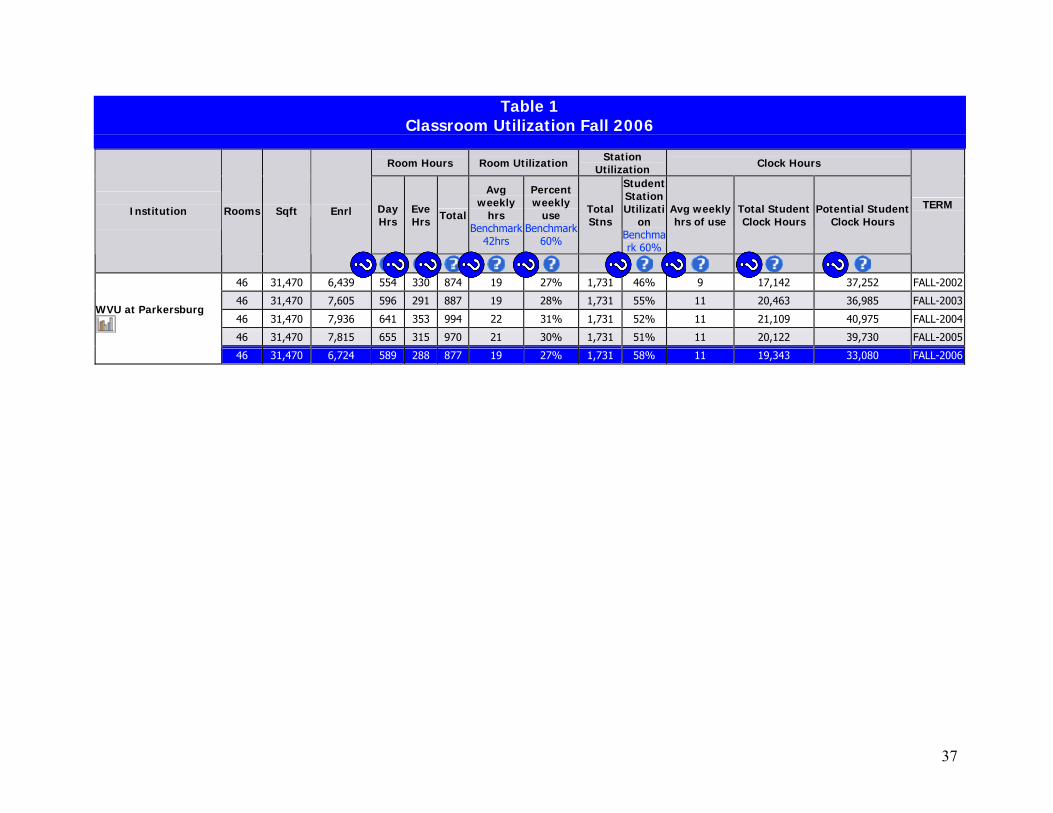
Table 1 Classroom Utilization Fall 2006
Room Hours Room Utilization Station Utilization Clock Hours
Day Hrs
Eve Hrs Total
Avg weekly
hrs Benchmark
42hrs
Percent weekly
use Benchmark
60%
Total Stns
Student Station Utilizati
on Benchmark 60%
Avg weekly hrs of use
Total Student Clock Hours
Potential Student Clock Hours
Institution
Rooms Sqft Enrl
TERM
46 31,470 6,439 554 330 874 19 27% 1,731 46% 9 17,142 37,252 FALL-2002
46 31,470 7,605 596 291 887 19 28% 1,731 55% 11 20,463 36,985 FALL-2003
46 31,470 7,936 641 353 994 22 31% 1,731 52% 11 21,109 40,975 FALL-2004
46 31,470 7,815 655 315 970 21 30% 1,731 51% 11 20,122 39,730 FALL-2005
WVU at Parkersburg
46 31,470 6,724 589 288 877 19 27% 1,731 58% 11 19,343 33,080 FALL-2006
37
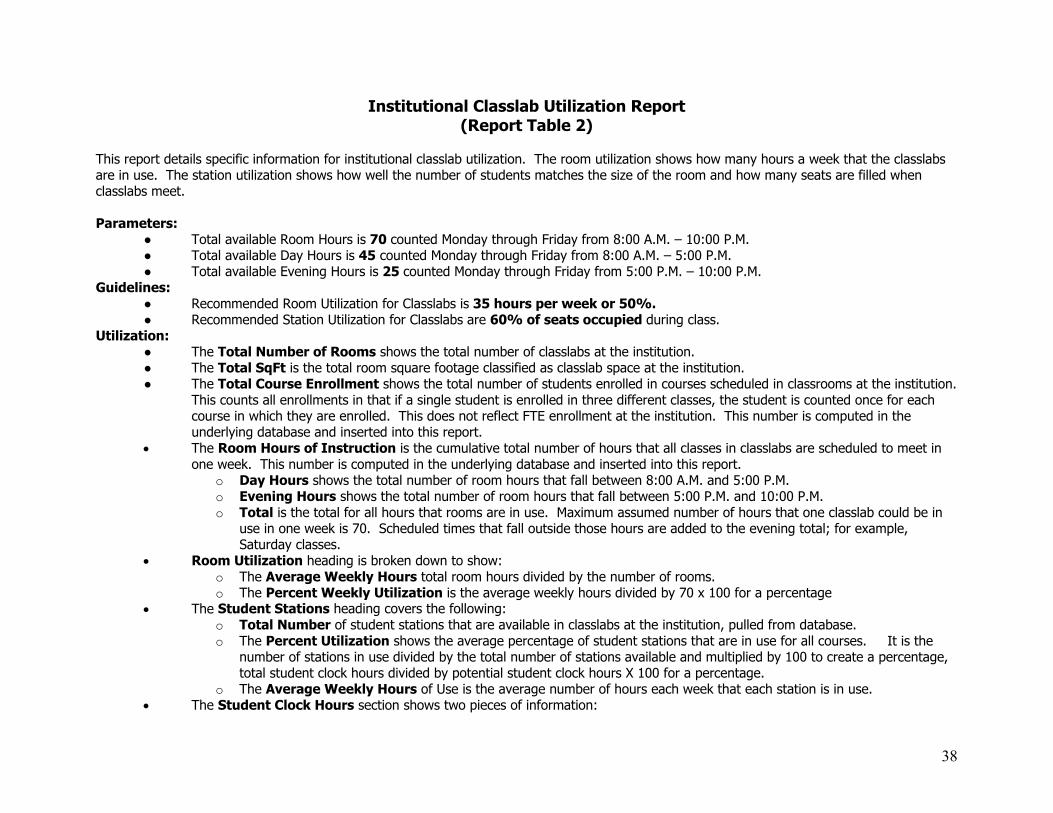
Institutional Classlab Utilization Report (Report Table 2)
This report details specific information for institutional classlab utilization. The room utilization shows how many hours a week that the classlabs are in use. The station utilization shows how well the number of students matches the size of the room and how many seats are filled when classlabs meet. Parameters:
● Total available Room Hours is 70 counted Monday through Friday from 8:00 A.M. – 10:00 P.M. ● Total available Day Hours is 45 counted Monday through Friday from 8:00 A.M. – 5:00 P.M. ● Total available Evening Hours is 25 counted Monday through Friday from 5:00 P.M. – 10:00 P.M.
Guidelines: ● Recommended Room Utilization for Classlabs is 35 hours per week or 50%. ● Recommended Station Utilization for Classlabs are 60% of seats occupied during class.
Utilization: ● The Total Number of Rooms shows the total number of classlabs at the institution. ● The Total SqFt is the total room square footage classified as classlab space at the institution. ● The Total Course Enrollment shows the total number of students enrolled in courses scheduled in classrooms at the institution.
This counts all enrollments in that if a single student is enrolled in three different classes, the student is counted once for each course in which they are enrolled. This does not reflect FTE enrollment at the institution. This number is computed in the underlying database and inserted into this report.
• The Room Hours of Instruction is the cumulative total number of hours that all classes in classlabs are scheduled to meet in one week. This number is computed in the underlying database and inserted into this report.
o Day Hours shows the total number of room hours that fall between 8:00 A.M. and 5:00 P.M. o Evening Hours shows the total number of room hours that fall between 5:00 P.M. and 10:00 P.M. o Total is the total for all hours that rooms are in use. Maximum assumed number of hours that one classlab could be in
use in one week is 70. Scheduled times that fall outside those hours are added to the evening total; for example, Saturday classes.
• Room Utilization heading is broken down to show: o The Average Weekly Hours total room hours divided by the number of rooms. o The Percent Weekly Utilization is the average weekly hours divided by 70 x 100 for a percentage
• The Student Stations heading covers the following: o Total Number of student stations that are available in classlabs at the institution, pulled from database. o The Percent Utilization shows the average percentage of student stations that are in use for all courses. It is the
number of stations in use divided by the total number of stations available and multiplied by 100 to create a percentage, total student clock hours divided by potential student clock hours X 100 for a percentage.
o The Average Weekly Hours of Use is the average number of hours each week that each station is in use. • The Student Clock Hours section shows two pieces of information:
38

o The Total Number is arrived at in the database by multiplying each course by the number of hours that it meets in a week by the number of students enrolled and then totaling for all courses.
o Potential Student Clock Hours is determined in the database by multiplying the number of hours that a course meets each week by the number of stations contained in the room and then totaling for all courses. This number shows how many student clock hours could be generated if all the seats were filled in each course.
39
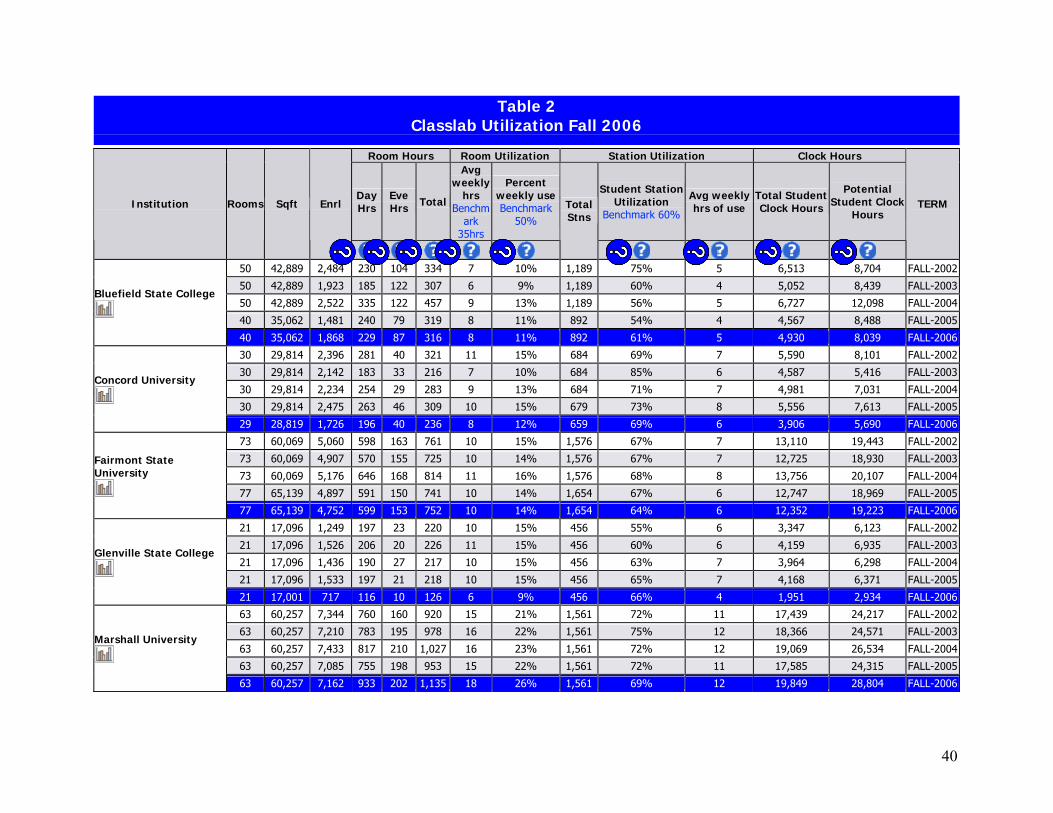
Table 2 Classlab Utilization Fall 2006
Room Hours Room Utilization Station Utilization Clock Hours
Day Hrs
Eve Hrs Total
Avg weekly
hrsBenchm
ark 35hrs
Percent weekly useBenchmark
50%
Student Station Utilization
Benchmark 60%
Avg weekly hrs of use
Total Student Clock Hours
Potential Student Clock
Hours Institution Rooms Sqft Enrl
Total Stns
TERM
50 42,889 2,484 230 104 334 7 10% 1,189 75% 5 6,513 8,704 FALL-2002
50 42,889 1,923 185 122 307 6 9% 1,189 60% 4 5,052 8,439 FALL-2003
50 42,889 2,522 335 122 457 9 13% 1,189 56% 5 6,727 12,098 FALL-2004
40 35,062 1,481 240 79 319 8 11% 892 54% 4 4,567 8,488 FALL-2005
Bluefield State College
40 35,062 1,868 229 87 316 8 11% 892 61% 5 4,930 8,039 FALL-2006
30 29,814 2,396 281 40 321 11 15% 684 69% 7 5,590 8,101 FALL-2002
30 29,814 2,142 183 33 216 7 10% 684 85% 6 4,587 5,416 FALL-2003
30 29,814 2,234 254 29 283 9 13% 684 71% 7 4,981 7,031 FALL-2004
30 29,814 2,475 263 46 309 10 15% 679 73% 8 5,556 7,613 FALL-2005
Concord University
29 28,819 1,726 196 40 236 8 12% 659 69% 6 3,906 5,690 FALL-2006
73 60,069 5,060 598 163 761 10 15% 1,576 67% 7 13,110 19,443 FALL-2002
73 60,069 4,907 570 155 725 10 14% 1,576 67% 7 12,725 18,930 FALL-2003
73 60,069 5,176 646 168 814 11 16% 1,576 68% 8 13,756 20,107 FALL-2004
77 65,139 4,897 591 150 741 10 14% 1,654 67% 6 12,747 18,969 FALL-2005
Fairmont State University
77 65,139 4,752 599 153 752 10 14% 1,654 64% 6 12,352 19,223 FALL-2006
21 17,096 1,249 197 23 220 10 15% 456 55% 6 3,347 6,123 FALL-2002
21 17,096 1,526 206 20 226 11 15% 456 60% 6 4,159 6,935 FALL-2003
21 17,096 1,436 190 27 217 10 15% 456 63% 7 3,964 6,298 FALL-2004
21 17,096 1,533 197 21 218 10 15% 456 65% 7 4,168 6,371 FALL-2005
Glenville State College
21 17,001 717 116 10 126 6 9% 456 66% 4 1,951 2,934 FALL-2006
63 60,257 7,344 760 160 920 15 21% 1,561 72% 11 17,439 24,217 FALL-2002
63 60,257 7,210 783 195 978 16 22% 1,561 75% 12 18,366 24,571 FALL-2003
63 60,257 7,433 817 210 1,027 16 23% 1,561 72% 12 19,069 26,534 FALL-2004
63 60,257 7,085 755 198 953 15 22% 1,561 72% 11 17,585 24,315 FALL-2005
Marshall University
63 60,257 7,162 933 202 1,135 18 26% 1,561 69% 12 19,849 28,804 FALL-2006
40
Table 2 Classlab Utilization Fall 2006
Room Hours Room Utilization Station Utilization Clock Hours
Day Hrs
Eve Hrs Total
Avg weekly
hrsBenchm
ark 35hrs
Percent weekly useBenchmark
50%
Student Station Utilization
Benchmark 60%
Avg weekly hrs of use
Total Student Clock Hours
Potential Student Clock
Hours Institution Rooms Sqft Enrl
Total Stns
TERM
45 35,408 2,722 291 75 366 8 12% 1,122 58% 5 6,726 11,682 FALL-2002
45 35,408 2,853 353 68 421 9 13% 1,122 53% 5 6,491 12,360 FALL-2003
45 35,408 3,015 335 57 392 9 12% 1,122 62% 5 6,835 11,027 FALL-2004
38 34,361 2,758 326 44 370 10 14% 1,037 59% 6 6,508 11,009 FALL-2005
Shepherd University
38 34,361 2,998 315 83 398 10 15% 1,037 60% 6 7,069 11,752 FALL-2006
50 39,989 5,283 513 31 544 11 16% 1,228 53% 6 9,960 18,837 FALL-2002
50 39,989 4,270 429 14 443 9 13% 1,228 53% 5 8,107 15,407 FALL-2003
50 39,989 3,265 334 9 343 7 10% 1,228 59% 4 6,104 10,349 FALL-2004
54 42,463 3,762 439 35 474 9 13% 3,239 48% 4 7,833 16,222 FALL-2005
West Liberty State College
52 41,714 3,098 299 23 322 6 9% 3,177 60% 4 6,194 10,366 FALL-2006
40 34,302 2,662 323 162 485 12 17% 925 61% 7 8,112 13,404 FALL-2002
40 34,302 3,359 357 190 547 14 20% 925 64% 9 9,637 14,982 FALL-2003
40 34,302 2,936 320 187 507 13 18% 925 61% 8 8,495 13,979 FALL-2004
40 34,302 2,917 360 198 558 14 20% 925 55% 8 8,379 15,141 FALL-2005
West Virginia State University
40 34,302 2,671 339 141 480 12 17% 925 56% 7 7,403 13,120 FALL-2006
122 126,187 18,200 1,590 241 1,831 15 21% 3,009 80% 12 42,179 52,510 FALL-2002
122 126,187 18,627 1,479 259 1,738 14 20% 3,009 79% 11 41,930 52,789 FALL-2003
122 126,187 17,730 1,430 254 1,684 14 20% 3,009 78% 11 37,909 48,449 FALL-2004
118 122,963 16,685 1,178 287 1,465 12 18% 2,829 89% 11 35,511 39,796 FALL-2005
West Virginia University
140 140,882 17,537 1,592 366 1,958 14 20% 3,601 68% 10 37,221 54,526 FALL-2006
87 75,969 1,480 228 40 268 3 4% 1,252 69% 2 4,227 6,088 FALL-2002
87 75,969 1,715 276 51 327 4 5% 1,252 74% 3 5,102 6,925 FALL-2003
87 75,969 1,837 291 45 336 4 6% 1,252 73% 3 5,332 7,321 FALL-2004
87 75,969 2,035 332 36 368 4 6% 1,252 68% 3 5,396 7,925 FALL-2005
WVU - Institute of Technology
87 75,969 2,094 305 48 353 4 6% 1,252 74% 3 5,516 7,424 FALL-2006
41

Table 2 Classlab Utilization Fall 2006
Room Hours Room Utilization Station Utilization Clock Hours
Day Hrs
Eve Hrs Total
Avg weekly
hrsBenchm
ark 35hrs
Percent weekly useBenchmark
50%
Student Station Utilization
Benchmark 60%
Avg weekly hrs of use
Total Student Clock Hours
Potential Student
Clock HoursInstitution Rooms Sqft Enrl
Total Stns
TERM
19 22,130 1,059 173 22 195 10 15% 466 57% 6 2,817 4,969 FALL-2002
19 22,130 1,121 166 23 189 10 14% 466 54% 5 2,756 5,145 FALL-2003
19 22,130 1,237 161 27 188 10 14% 466 55% 5 2,856 5,168 FALL-2004
19 22,130 968 133 16 149 8 11% 466 60% 5 2,335 3,862 FALL-2005
WVU - Potomac State College
19 22,130 1,429 177 14 191 10 14% 466 63% 6 3,306 5,247 FALL-2006
10 1,567 1,380 110 89 199 20 28% 231 68% 14 3,684 5,395 FALL-2005Blue Ridge Community and Technical Colleges
10 1,567 1,195 97 81 178 18 25% 231 73% 13 3,424 4,691 FALL-2006
2 1,414 83 15 3 18 9 13% 24 58% 5 248 428 FALL-2002
2 1,414 118 19 4 23 12 16% 24 47% 5 265 568 FALL-2003
2 1,414 78 6 5 11 6 8% 24 70% 4 192 276 FALL-2004
2 1,414 128 18 11 29 15 21% 24 46% 7 331 714 FALL-2005
Eastern WV Community and Technical College
2 1,414 113 12 8 20 10 14% 24 65% 7 318 488 FALL-2006
10 7,827 602 62 58 120 12 17% 297 42% 5 1,546 3,708 FALL-2005New River Community and Technical College
10 7,827 740 82 71 153 15 22% 297 41% 6 1,891 4,597 FALL-2006
24 19,954 1,463 142 93 235 10 14% 483 79% 8 3,650 4,632 FALL-2002
24 19,954 1,432 125 83 208 9 12% 483 72% 6 3,344 4,642 FALL-2003
24 19,954 1,486 168 75 243 10 14% 483 64% 7 3,619 5,627 FALL-2004
24 19,954 1,816 187 73 260 11 15% 483 78% 8 4,621 5,917 FALL-2005
Southern WV Community & Technical College
24 19,954 1,290 145 67 212 9 13% 483 62% 5 3,262 5,294 FALL-2006
33 29,658 1,937 320 215 535 16 23% 664 47% 8 5,538 11,778 FALL-2002
33 29,658 1,818 252 149 401 12 17% 664 57% 7 5,098 8,984 FALL-2003
33 29,658 1,937 314 121 435 13 19% 664 61% 8 5,554 9,097 FALL-2004
33 29,658 1,993 319 131 450 14 19% 664 57% 8 5,710 10,022 FALL-2005
West Virginia Northern Community College
27 17,616 1,371 362 88 450 17 24% 657 56% 9 5,896 10,575 FALL-2006
42

Table 2 Classlab Utilization Fall 2006
Room Hours Room Utilization Station Utilization Clock Hours
Day Hrs
Eve Hrs Total
Avg weekly
hrsBenchm
ark 35hrs
Percent weekly useBenchmark
50%
Student Station Utilization
Benchmark 60%
Avg weekly hrs of use
Total Student Clock Hours
Potential Student
Clock HoursInstitution Rooms Sqft Enrl
Total Stns
TERM
36 56,965 2,699 325 169 494 14 20% 835 51% 7 6,980 13,567 FALL-2002
36 56,965 2,972 388 150 538 15 21% 835 47% 7 7,048 15,082 FALL-2003
36 56,965 2,663 387 155 542 15 22% 835 49% 7 7,323 15,014 FALL-2004
36 56,965 2,484 326 149 475 13 19% 835 50% 7 6,362 12,835 FALL-2005
WVU at Parkersburg
36 56,965 2,603 335 128 463 13 18% 835 59% 8 7,064 12,021 FALL-2006
43
Institutional Academic Overview (Report Table 3)
This report gives an overview of all institutions included in the study for the Fall semester of ’02, ’03,’04, ’05 and ‘06.
● The Average Weekly Hours for Classrooms or Classlabs is calculated by dividing the total room hours of instruction in classrooms or classlabs (in Tables 1 and 2) by the total number of classrooms or classlabs at the institution (in Tables 1 and 2). This is then the average number of hours that a classroom or classlab is used at the institution.
● The Average Percent Weekly Room Utilization is computed by dividing the Average Weekly Hours by 70 (the available hours per week) and multiplying by 100 to get the percentage.
● The Total Course Enrollment is the total number of students enrolled in courses taught in classrooms and classlabs at the institution (Tables 1 and 2). This counts all enrollments in that if a single student is enrolled in four different classes, the student is counted once for each course in which they are enrolled. This figure does not reflect FTE enrollment at the institution.
● The Average Student Station Utilization is computed at the individual course level, by dividing the number of stations in use during the course by the station count for the room and then multiplying by 100 to get the percentage (from Tables 1 and 2). The institutional average is derived from these two numbers.
● The Average Weekly Percent Room Utilization for the Overall Institution is the average of the Average Weekly Percent Room Utilization for Classrooms and Classlabs.
Related Documents: ● For detailed information on Classrooms, refer to Table 1. ● For detailed information on Classlabs, refer to Table 2.
Parameters: ● Total available Room Hours is 70 counted Monday through Friday from 8:00 A.M. – 10:00 P.M. ● Total available Day Hours is 45 counted Monday through Friday from 8:00 A.M. – 5:00 P.M. ● Total available Evening Hours is 25 counted Monday through Friday from 5:00 P.M. – 10:00 P.M.
Guidelines: ● Recommended Room Utilization for Classrooms is 42 hours per week or 60%. ● Recommended Station Utilization for Classrooms is 60% of seats occupied during class. ● Recommended Room Utilization for Classlabs is 35 hours per week or 50%. ● Recommended Station Utilization for Classlabs are 60% of seats occupied during class.
44
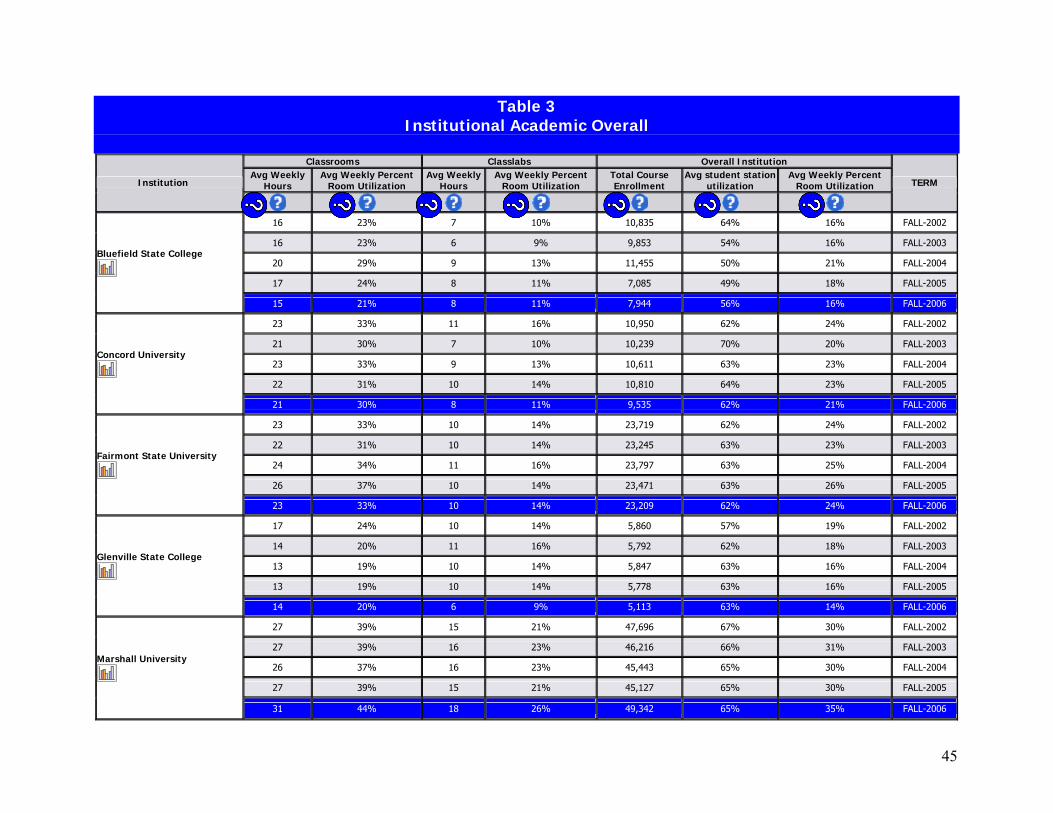
Table 3 Institutional Academic Overall
Classrooms Classlabs Overall Institution
Avg Weekly Hours
Avg Weekly Percent Room Utilization
Avg Weekly Hours
Avg Weekly Percent Room Utilization
Total Course Enrollment
Avg student station utilization
Avg Weekly Percent Room Utilization Institution
TERM
16 23% 7 10% 10,835 64% 16% FALL-2002
16 23% 6 9% 9,853 54% 16% FALL-2003
20 29% 9 13% 11,455 50% 21% FALL-2004
17 24% 8 11% 7,085 49% 18% FALL-2005
Bluefield State College
15 21% 8 11% 7,944 56% 16% FALL-2006
23 33% 11 16% 10,950 62% 24% FALL-2002
21 30% 7 10% 10,239 70% 20% FALL-2003
23 33% 9 13% 10,611 63% 23% FALL-2004
22 31% 10 14% 10,810 64% 23% FALL-2005
Concord University
21 30% 8 11% 9,535 62% 21% FALL-2006
23 33% 10 14% 23,719 62% 24% FALL-2002
22 31% 10 14% 23,245 63% 23% FALL-2003
24 34% 11 16% 23,797 63% 25% FALL-2004
26 37% 10 14% 23,471 63% 26% FALL-2005
Fairmont State University
23 33% 10 14% 23,209 62% 24% FALL-2006
17 24% 10 14% 5,860 57% 19% FALL-2002
14 20% 11 16% 5,792 62% 18% FALL-2003
13 19% 10 14% 5,847 63% 16% FALL-2004
13 19% 10 14% 5,778 63% 16% FALL-2005
Glenville State College
14 20% 6 9% 5,113 63% 14% FALL-2006
27 39% 15 21% 47,696 67% 30% FALL-2002
27 39% 16 23% 46,216 66% 31% FALL-2003
26 37% 16 23% 45,443 65% 30% FALL-2004
27 39% 15 21% 45,127 65% 30% FALL-2005
Marshall University
31 44% 18 26% 49,342 65% 35% FALL-2006
45

Table 3 Institutional Academic Overall
Classrooms Classlabs Overall Institution
Avg Weekly Hours
Avg Weekly Percent Room Utilization
Avg Weekly Hours
Avg Weekly Percent Room Utilization
Total Course Enrollment
Avg student station utilization
Avg Weekly Percent Room Utilization Institution
TERM
21 30% 8 11% 12,127 58% 21% FALL-2002
23 33% 9 13% 13,566 58% 23% FALL-2003
24 34% 9 13% 14,431 63% 24% FALL-2004
28 40% 10 14% 13,196 60% 27% FALL-2005
Shepherd University
27 39% 10 14% 13,112 60% 26% FALL-2006
17 24% 11 16% 16,354 53% 20% FALL-2002
15 21% 9 13% 14,594 53% 17% FALL-2003
15 21% 7 10% 13,526 58% 16% FALL-2004
15 21% 9 13% 12,969 50% 17% FALL-2005
West Liberty State College
11 16% 6 9% 10,226 56% 12% FALL-2006
17 24% 12 17% 10,990 57% 21% FALL-2002
22 31% 14 20% 14,189 61% 26% FALL-2003
23 33% 13 19% 14,099 56% 26% FALL-2004
24 34% 14 20% 13,840 54% 27% FALL-2005
West Virginia State University
22 31% 12 17% 13,478 56% 24% FALL-2006
25 36% 15 21% 97,403 71% 29% FALL-2002
26 37% 14 20% 101,643 70% 29% FALL-2003
26 37% 14 20% 101,139 70% 29% FALL-2004
28 40% 12 17% 99,902 77% 29% FALL-2005
West Virginia University
31 44% 14 20% 112,824 65% 32% FALL-2006
14 20% 3 4% 8,052 56% 12% FALL-2002
13 19% 4 6% 7,990 59% 12% FALL-2003
13 19% 4 6% 8,088 58% 12% FALL-2004
13 19% 4 6% 7,390 54% 12% FALL-2005
WVU - Institute of Technology
11 16% 4 6% 7,675 58% 11% FALL-2006
46
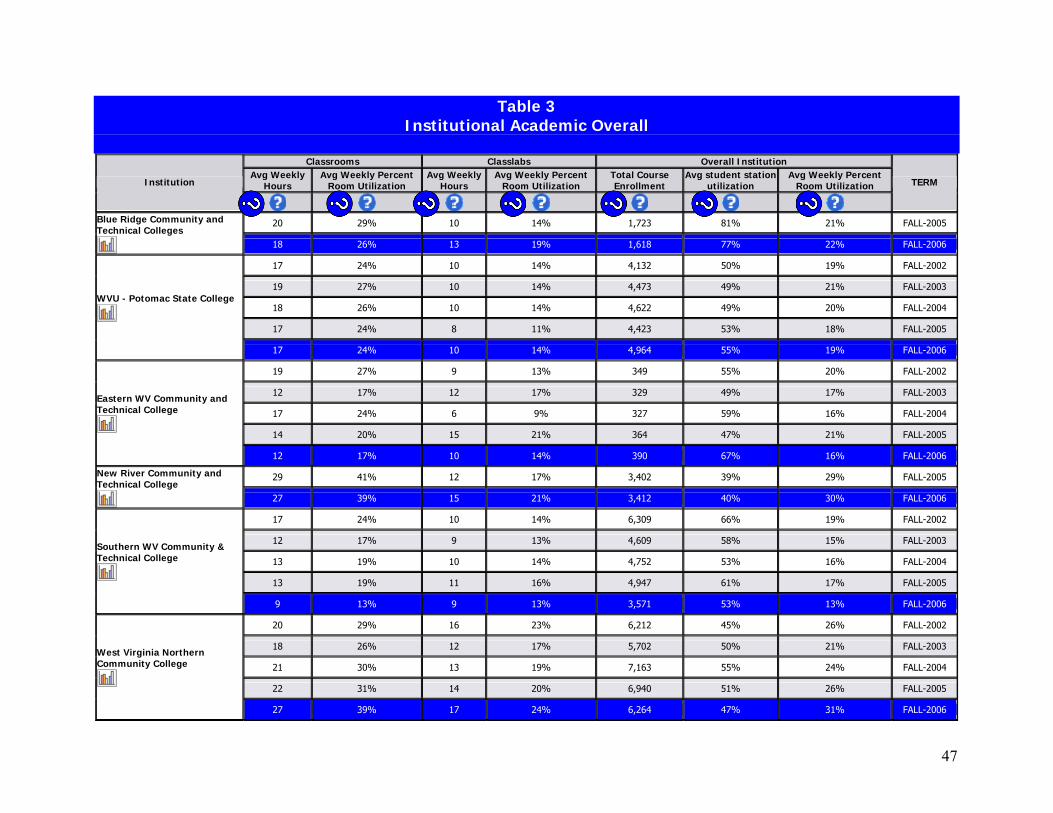
Table 3 Institutional Academic Overall
Classrooms Classlabs Overall Institution
Avg Weekly Hours
Avg Weekly Percent Room Utilization
Avg Weekly Hours
Avg Weekly Percent Room Utilization
Total Course Enrollment
Avg student station utilization
Avg Weekly Percent Room Utilization Institution
TERM
20 29% 10 14% 1,723 81% 21% FALL-2005 Blue Ridge Community and Technical Colleges
18 26% 13 19% 1,618 77% 22% FALL-2006
17 24% 10 14% 4,132 50% 19% FALL-2002
19 27% 10 14% 4,473 49% 21% FALL-2003
18 26% 10 14% 4,622 49% 20% FALL-2004
17 24% 8 11% 4,423 53% 18% FALL-2005
WVU - Potomac State College
17 24% 10 14% 4,964 55% 19% FALL-2006
19 27% 9 13% 349 55% 20% FALL-2002
12 17% 12 17% 329 49% 17% FALL-2003
17 24% 6 9% 327 59% 16% FALL-2004
14 20% 15 21% 364 47% 21% FALL-2005
Eastern WV Community and Technical College
12 17% 10 14% 390 67% 16% FALL-2006
29 41% 12 17% 3,402 39% 29% FALL-2005 New River Community and Technical College
27 39% 15 21% 3,412 40% 30% FALL-2006
17 24% 10 14% 6,309 66% 19% FALL-2002
12 17% 9 13% 4,609 58% 15% FALL-2003
13 19% 10 14% 4,752 53% 16% FALL-2004
13 19% 11 16% 4,947 61% 17% FALL-2005
Southern WV Community & Technical College
9 13% 9 13% 3,571 53% 13% FALL-2006
20 29% 16 23% 6,212 45% 26% FALL-2002
18 26% 12 17% 5,702 50% 21% FALL-2003
21 30% 13 19% 7,163 55% 24% FALL-2004
22 31% 14 20% 6,940 51% 26% FALL-2005
West Virginia Northern Community College
27 39% 17 24% 6,264 47% 31% FALL-2006
47
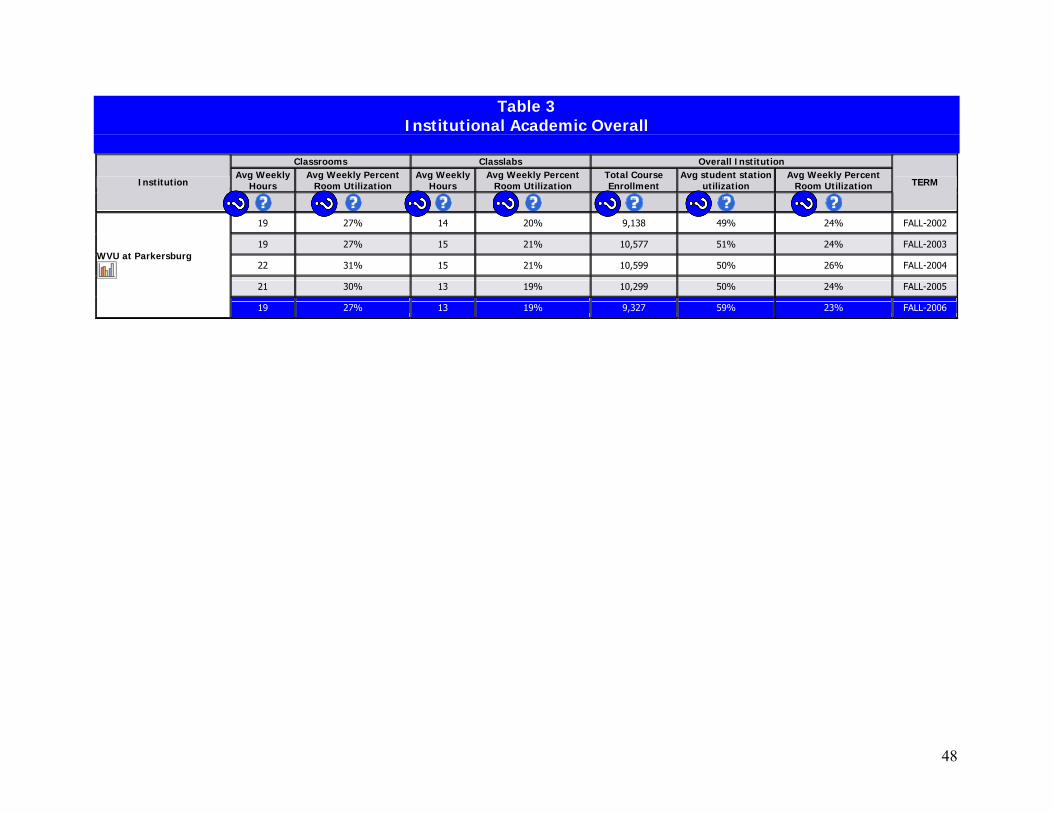
Table 3 Institutional Academic Overall
Classrooms Classlabs Overall Institution
Avg Weekly Hours
Avg Weekly Percent Room Utilization
Avg Weekly Hours
Avg Weekly Percent Room Utilization
Total Course Enrollment
Avg student station utilization
Avg Weekly Percent Room Utilization Institution
TERM
19 27% 14 20% 9,138 49% 24% FALL-2002
19 27% 15 21% 10,577 51% 24% FALL-2003
22 31% 15 21% 10,599 50% 26% FALL-2004
21 30% 13 19% 10,299 50% 24% FALL-2005
WVU at Parkersburg
19 27% 13 19% 9,327 59% 23% FALL-2006
48
Institutional Comparison by Classroom Size (Report Table 4)
This report shows an easy comparison across individual institutions or between institutions of the size classrooms they have at the institutions and how much they are in use.
• The first column under each heading shows the count of classrooms that fall into that size range at the institution. • The second column titled SF is the total area in Square Feet of all the classrooms at the institution.
49

Table 4 Institutional Comparison by Classroom Size
0-19 Stations 20-39 Stations 40-59 Stations 60-79 Stations 80-99 Stations 100-149 Stations 150-199 Stations 200 and above
Rooms Utln Stn Utln Rooms Utln Stn
Utln Rooms Utln Stn Utln Rooms Utln Stn
Utln Rooms Utln Stn Utln Rooms Utln Stn
Utln Rooms Utln Stn Utln Rooms Utln Stn
UtlnInstitution
Graph
Bluefield State College 3 18% 65% 14 21% 50% 27 28% 46% 0 0% 0% 2 7% 27% 0 0% 0% 0 0% 0% 0 0% 0%
Concord University 3 8% 69% 18 29% 57% 8 40% 56% 5 39% 59% 2 41% 38% 0 0% 0% 0 0% 0% 0 0% 0%
Fairmont State University 14 2% 80% 34 31% 70% 27 45% 58% 5 42% 56% 0 0% 0% 4 36% 43% 0 0% 0% 0 0% 0%
Glenville State College 0 0% 0% 23 15% 62% 10 27% 60% 0 0% 0% 0 0% 0% 1 20% 39% 0 0% 0% 0 0% 0%
Marshall University 9 21% 69% 79 36% 64% 42 43% 59% 12 33% 49% 3 51% 35% 3 28% 38% 2 41% 27% 0 0% 0%
Shepherd University 2 6% 49% 25 38% 70% 9 47% 62% 3 49% 44% 1 54% 35% 0 0% 0% 0 0% 0% 0 0% 0%
West Liberty State College 1 4% 72% 19 19% 56% 25 24% 51% 3 30% 46% 2 7% 36% 0 0% 0% 0 0% 0% 0 0% 0%
WVU - Health Sciences Center 13 0% 0% 16 0% 0% 5 0% 0% 6 0% 0% 3 0% 0% 1 0% 0% 1 0% 0% 2 0% 0%
West Virginia State University 5 1% 65% 15 30% 64% 27 42% 51% 2 36% 36% 1 56% 58% 1 0% 0% 0 0% 0% 0 0% 0%
West Virginia University 2 8% 72% 52 32% 59% 58 40% 58% 18 43% 56% 10 40% 53% 16 44% 60% 1 54% 61% 8 49% 77%
West Virginia School of Osteopathic Medicine 0 0% 0% 0 0% 0% 1 0% 0% 0 0% 0% 2 0% 0% 0 0% 0% 0 0% 0% 0 0% 0%
WVU - Institute of Technology 4 0% 0% 23 15% 49% 17 23% 41% 8 28% 38% 0 0% 0% 1 39% 31% 1 0% 0% 1 0% 0%
50
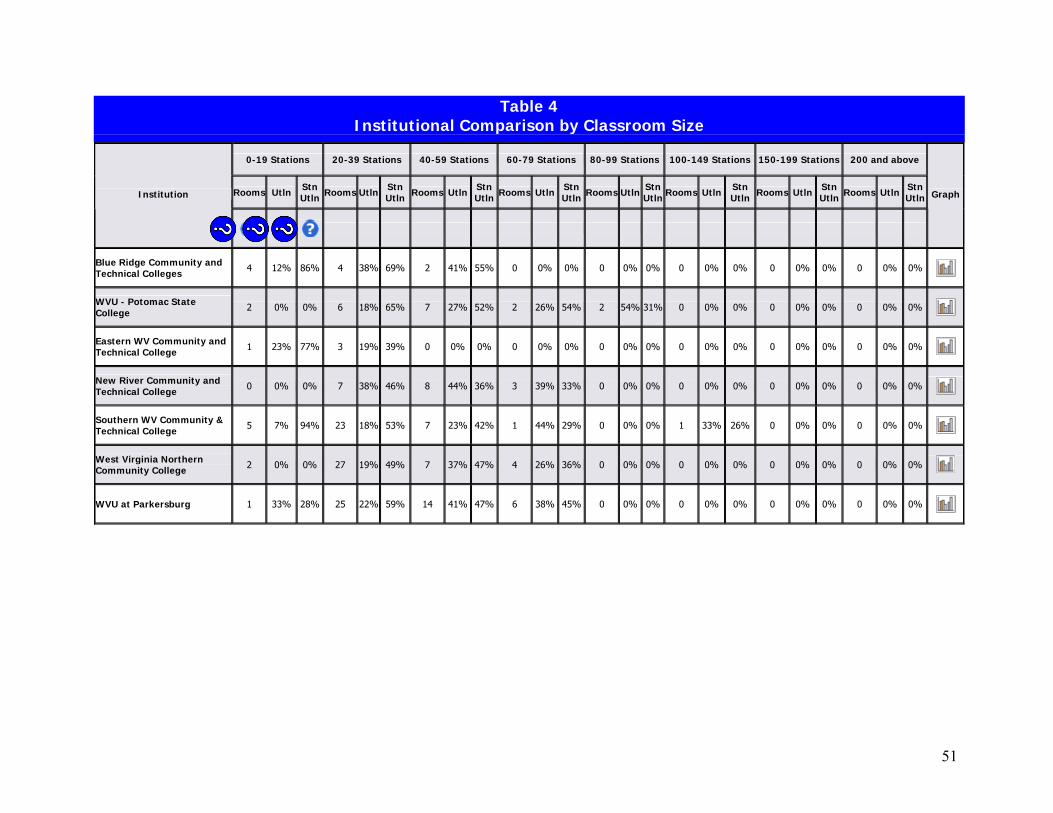
Table 4 Institutional Comparison by Classroom Size
0-19 Stations 20-39 Stations 40-59 Stations 60-79 Stations 80-99 Stations 100-149 Stations 150-199 Stations 200 and above
Rooms Utln Stn Utln Rooms Utln Stn
Utln Rooms Utln Stn Utln Rooms Utln Stn
Utln Rooms Utln Stn Utln Rooms Utln Stn
Utln Rooms Utln Stn Utln Rooms Utln Stn
UtlnInstitution
Graph
Blue Ridge Community and Technical Colleges 4 12% 86% 4 38% 69% 2 41% 55% 0 0% 0% 0 0% 0% 0 0% 0% 0 0% 0% 0 0% 0%
WVU - Potomac State College 2 0% 0% 6 18% 65% 7 27% 52% 2 26% 54% 2 54% 31% 0 0% 0% 0 0% 0% 0 0% 0%
Eastern WV Community and Technical College 1 23% 77% 3 19% 39% 0 0% 0% 0 0% 0% 0 0% 0% 0 0% 0% 0 0% 0% 0 0% 0%
New River Community and Technical College 0 0% 0% 7 38% 46% 8 44% 36% 3 39% 33% 0 0% 0% 0 0% 0% 0 0% 0% 0 0% 0%
Southern WV Community & Technical College 5 7% 94% 23 18% 53% 7 23% 42% 1 44% 29% 0 0% 0% 1 33% 26% 0 0% 0% 0 0% 0%
West Virginia Northern Community College 2 0% 0% 27 19% 49% 7 37% 47% 4 26% 36% 0 0% 0% 0 0% 0% 0 0% 0% 0 0% 0%
WVU at Parkersburg 1 33% 28% 25 22% 59% 14 41% 47% 6 38% 45% 0 0% 0% 0 0% 0% 0 0% 0% 0 0% 0%
51
Institutional Breakdown by Room Usage (Report Table 5)
This report shows the total square footage at each institution broken down into groups by the federal room use code. The table shows the breakdown for the room use classifications of 100’s – Classroom Facilities and 200’s – Laboratory Facilities. The report shows the total number of rooms in each room use grouping and then gives the total area of those rooms in square feet. The room use codes are broken down as follows:
100 Classroom Facilities ● 110 Classroom ● 115 Classroom Service 200 Laboratory Facilities ● 210 Class Laboratory ● 215 Class Laboratory Service ● 220 Open Laboratory ● 225 Open Laboratory Service ● 250 Research/Nonclass Laboratory ● 255 Research/Nonclass Laboratory Service
52
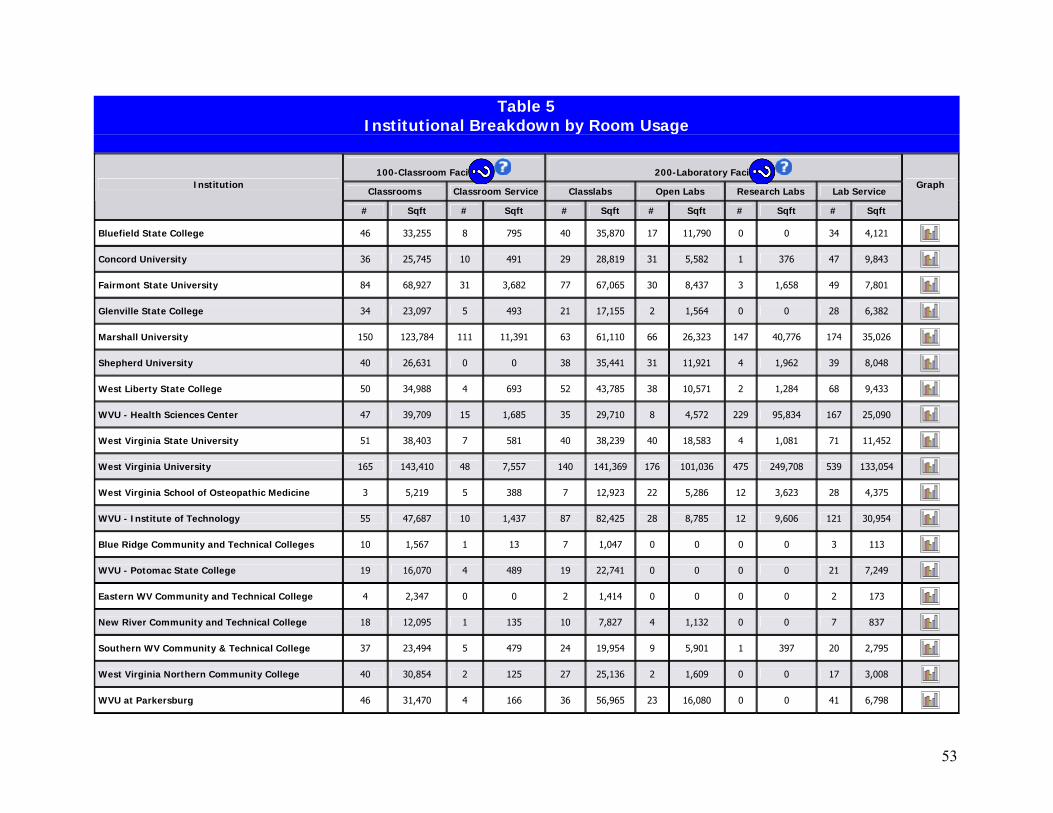
Table 5 Institutional Breakdown by Room Usage
100-Classroom Facilities 200-Laboratory Facilities
Classrooms Classroom Service Classlabs Open Labs Research Labs Lab Service Institution
# Sqft # Sqft # Sqft # Sqft # Sqft # Sqft
Graph
Bluefield State College 46 33,255 8 795 40 35,870 17 11,790 0 0 34 4,121
Concord University 36 25,745 10 491 29 28,819 31 5,582 1 376 47 9,843
Fairmont State University 84 68,927 31 3,682 77 67,065 30 8,437 3 1,658 49 7,801
Glenville State College 34 23,097 5 493 21 17,155 2 1,564 0 0 28 6,382
Marshall University 150 123,784 111 11,391 63 61,110 66 26,323 147 40,776 174 35,026
Shepherd University 40 26,631 0 0 38 35,441 31 11,921 4 1,962 39 8,048
West Liberty State College 50 34,988 4 693 52 43,785 38 10,571 2 1,284 68 9,433
WVU - Health Sciences Center 47 39,709 15 1,685 35 29,710 8 4,572 229 95,834 167 25,090
West Virginia State University 51 38,403 7 581 40 38,239 40 18,583 4 1,081 71 11,452
West Virginia University 165 143,410 48 7,557 140 141,369 176 101,036 475 249,708 539 133,054
West Virginia School of Osteopathic Medicine 3 5,219 5 388 7 12,923 22 5,286 12 3,623 28 4,375
WVU - Institute of Technology 55 47,687 10 1,437 87 82,425 28 8,785 12 9,606 121 30,954
Blue Ridge Community and Technical Colleges 10 1,567 1 13 7 1,047 0 0 0 0 3 113
WVU - Potomac State College 19 16,070 4 489 19 22,741 0 0 0 0 21 7,249
Eastern WV Community and Technical College 4 2,347 0 0 2 1,414 0 0 0 0 2 173
New River Community and Technical College 18 12,095 1 135 10 7,827 4 1,132 0 0 7 837
Southern WV Community & Technical College 37 23,494 5 479 24 19,954 9 5,901 1 397 20 2,795
West Virginia Northern Community College 40 30,854 2 125 27 25,136 2 1,609 0 0 17 3,008
WVU at Parkersburg 46 31,470 4 166 36 56,965 23 16,080 0 0 41 6,798
53
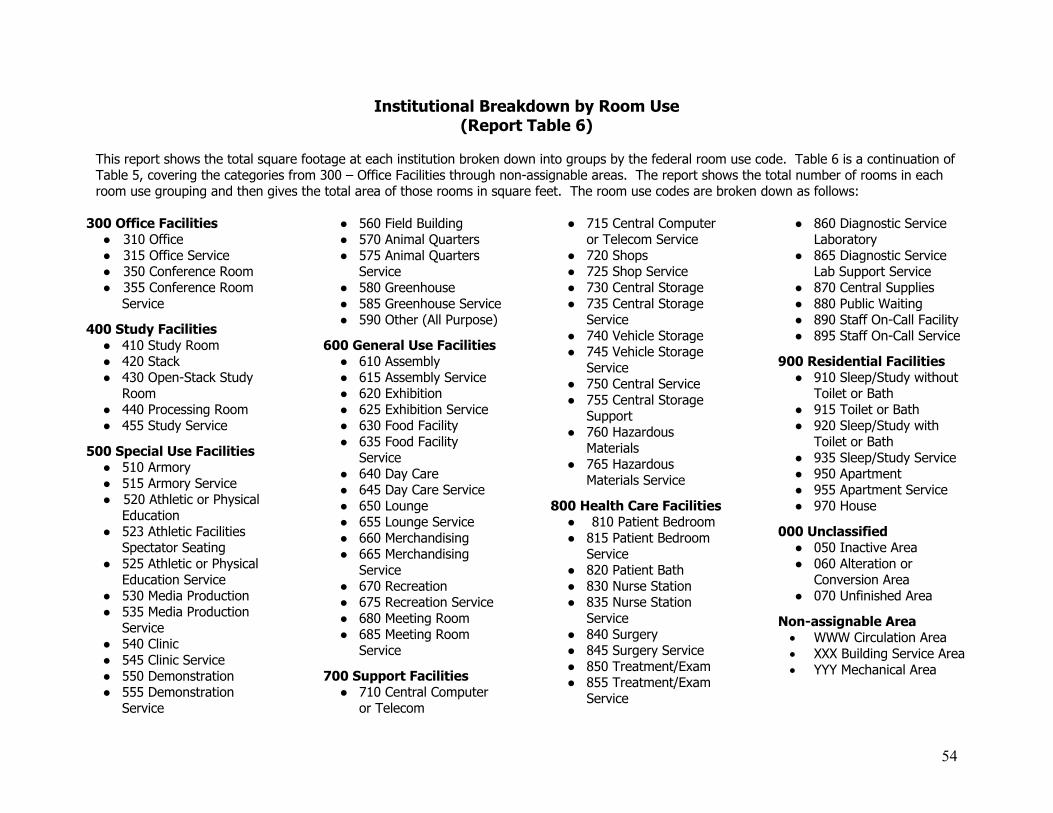
Institutional Breakdown by Room Use (Report Table 6)
This report shows the total square footage at each institution broken down into groups by the federal room use code. Table 6 is a continuation of Table 5, covering the categories from 300 – Office Facilities through non-assignable areas. The report shows the total number of rooms in each room use grouping and then gives the total area of those rooms in square feet. The room use codes are broken down as follows:
300 Office Facilities ● 310 Office ● 315 Office Service ● 350 Conference Room ● 355 Conference Room
Service
400 Study Facilities ● 410 Study Room ● 420 Stack ● 430 Open-Stack Study
Room ● 440 Processing Room ● 455 Study Service
500 Special Use Facilities ● 510 Armory ● 515 Armory Service ● 520 Athletic or Physical
Education ● 523 Athletic Facilities
Spectator Seating ● 525 Athletic or Physical
Education Service ● 530 Media Production ● 535 Media Production
Service ● 540 Clinic ● 545 Clinic Service ● 550 Demonstration ● 555 Demonstration
Service
● 560 Field Building ● 570 Animal Quarters ● 575 Animal Quarters
Service ● 580 Greenhouse ● 585 Greenhouse Service ● 590 Other (All Purpose)
600 General Use Facilities ● 610 Assembly ● 615 Assembly Service ● 620 Exhibition ● 625 Exhibition Service ● 630 Food Facility ● 635 Food Facility
Service ● 640 Day Care ● 645 Day Care Service ● 650 Lounge ● 655 Lounge Service ● 660 Merchandising ● 665 Merchandising
Service ● 670 Recreation ● 675 Recreation Service ● 680 Meeting Room ● 685 Meeting Room
Service
700 Support Facilities ● 710 Central Computer
or Telecom
● 715 Central Computer or Telecom Service
● 720 Shops ● 725 Shop Service ● 730 Central Storage ● 735 Central Storage
Service ● 740 Vehicle Storage ● 745 Vehicle Storage
Service ● 750 Central Service ● 755 Central Storage
Support ● 760 Hazardous
Materials ● 765 Hazardous
Materials Service
800 Health Care Facilities ● 810 Patient Bedroom ● 815 Patient Bedroom
Service ● 820 Patient Bath ● 830 Nurse Station ● 835 Nurse Station
Service ● 840 Surgery ● 845 Surgery Service ● 850 Treatment/Exam ● 855 Treatment/Exam
Service
● 860 Diagnostic Service Laboratory
● 865 Diagnostic Service Lab Support Service
● 870 Central Supplies ● 880 Public Waiting ● 890 Staff On-Call Facility ● 895 Staff On-Call Service
900 Residential Facilities ● 910 Sleep/Study without
Toilet or Bath ● 915 Toilet or Bath ● 920 Sleep/Study with
Toilet or Bath ● 935 Sleep/Study Service ● 950 Apartment ● 955 Apartment Service ● 970 House
000 Unclassified ● 050 Inactive Area ● 060 Alteration or
Conversion Area ● 070 Unfinished Area
Non-assignable Area • WWW Circulation Area • XXX Building Service Area • YYY Mechanical Area
54
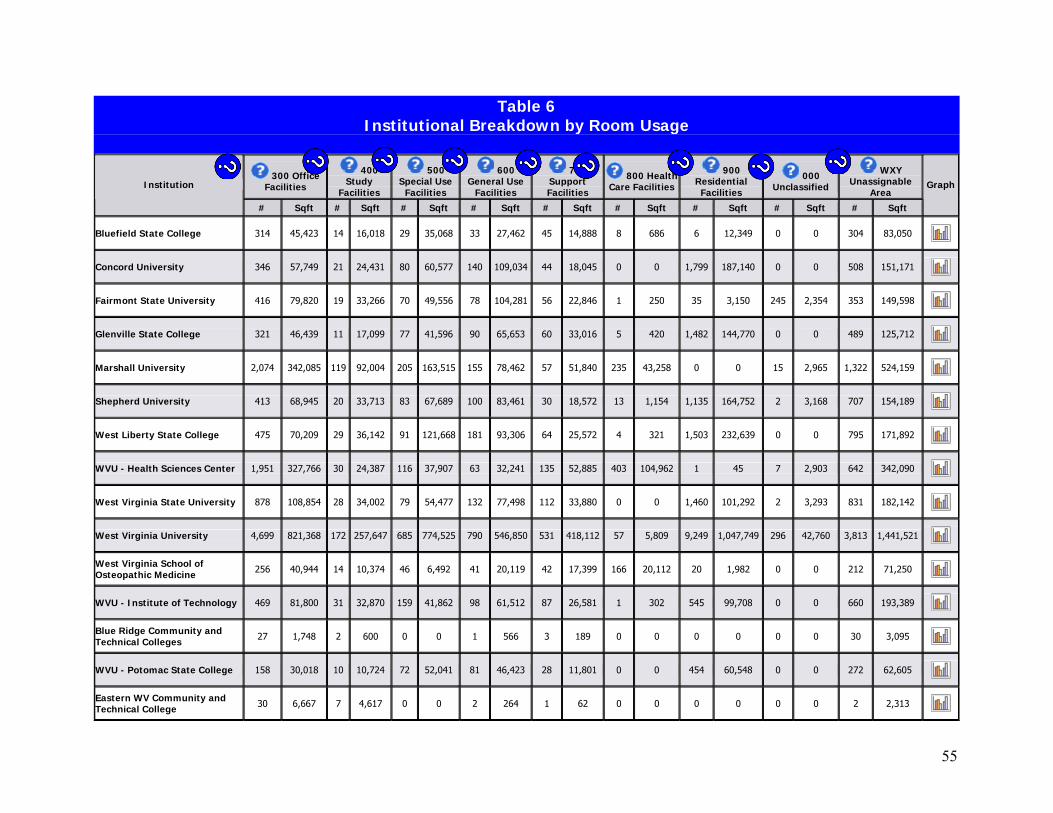
Table 6 Institutional Breakdown by Room Usage
300 Office Facilities
400 Study
Facilities
500 Special Use
Facilities
600 General Use
Facilities
700 Support Facilities
800 Health Care Facilities
900 Residential
Facilities
000 Unclassified
WXY Unassignable
Area Institution
# Sqft # Sqft # Sqft # Sqft # Sqft # Sqft # Sqft # Sqft # Sqft
Graph
Bluefield State College 314 45,423 14 16,018 29 35,068 33 27,462 45 14,888 8 686 6 12,349 0 0 304 83,050
Concord University 346 57,749 21 24,431 80 60,577 140 109,034 44 18,045 0 0 1,799 187,140 0 0 508 151,171
Fairmont State University 416 79,820 19 33,266 70 49,556 78 104,281 56 22,846 1 250 35 3,150 245 2,354 353 149,598
Glenville State College 321 46,439 11 17,099 77 41,596 90 65,653 60 33,016 5 420 1,482 144,770 0 0 489 125,712
Marshall University 2,074 342,085 119 92,004 205 163,515 155 78,462 57 51,840 235 43,258 0 0 15 2,965 1,322 524,159
Shepherd University 413 68,945 20 33,713 83 67,689 100 83,461 30 18,572 13 1,154 1,135 164,752 2 3,168 707 154,189
West Liberty State College 475 70,209 29 36,142 91 121,668 181 93,306 64 25,572 4 321 1,503 232,639 0 0 795 171,892
WVU - Health Sciences Center 1,951 327,766 30 24,387 116 37,907 63 32,241 135 52,885 403 104,962 1 45 7 2,903 642 342,090
West Virginia State University 878 108,854 28 34,002 79 54,477 132 77,498 112 33,880 0 0 1,460 101,292 2 3,293 831 182,142
West Virginia University 4,699 821,368 172 257,647 685 774,525 790 546,850 531 418,112 57 5,809 9,249 1,047,749 296 42,760 3,813 1,441,521
West Virginia School of Osteopathic Medicine 256 40,944 14 10,374 46 6,492 41 20,119 42 17,399 166 20,112 20 1,982 0 0 212 71,250
WVU - Institute of Technology 469 81,800 31 32,870 159 41,862 98 61,512 87 26,581 1 302 545 99,708 0 0 660 193,389
Blue Ridge Community and Technical Colleges 27 1,748 2 600 0 0 1 566 3 189 0 0 0 0 0 0 30 3,095
WVU - Potomac State College 158 30,018 10 10,724 72 52,041 81 46,423 28 11,801 0 0 454 60,548 0 0 272 62,605
Eastern WV Community and Technical College 30 6,667 7 4,617 0 0 2 264 1 62 0 0 0 0 0 0 2 2,313
55
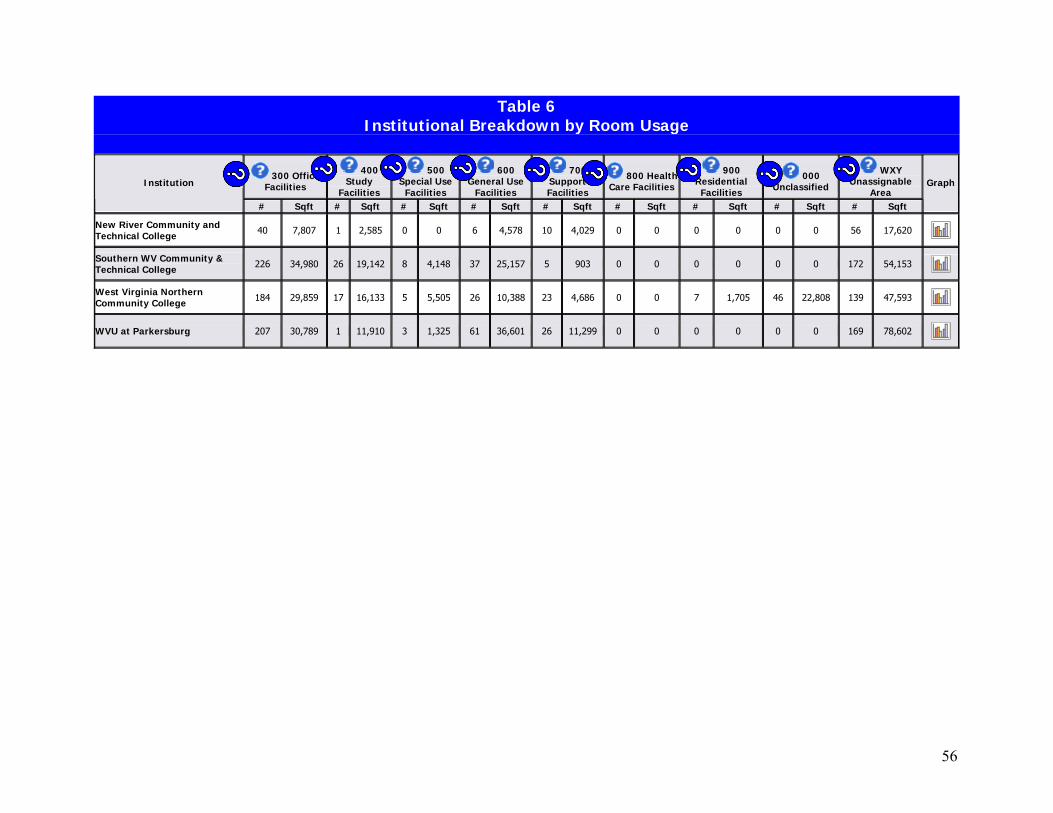
Table 6 Institutional Breakdown by Room Usage
300 Office Facilities
400 Study
Facilities
500 Special Use
Facilities
600 General Use
Facilities
700 Support Facilities
800 Health Care Facilities
900 Residential
Facilities
000 Unclassified
WXY Unassignable
Area Institution
# Sqft # Sqft # Sqft # Sqft # Sqft # Sqft # Sqft # Sqft # Sqft
Graph
New River Community and Technical College 40 7,807 1 2,585 0 0 6 4,578 10 4,029 0 0 0 0 0 0 56 17,620
Southern WV Community & Technical College 226 34,980 26 19,142 8 4,148 37 25,157 5 903 0 0 0 0 0 0 172 54,153
West Virginia Northern Community College 184 29,859 17 16,133 5 5,505 26 10,388 23 4,686 0 0 7 1,705 46 22,808 139 47,593
WVU at Parkersburg 207 30,789 1 11,910 3 1,325 61 36,601 26 11,299 0 0 0 0 0 0 169 78,602
56
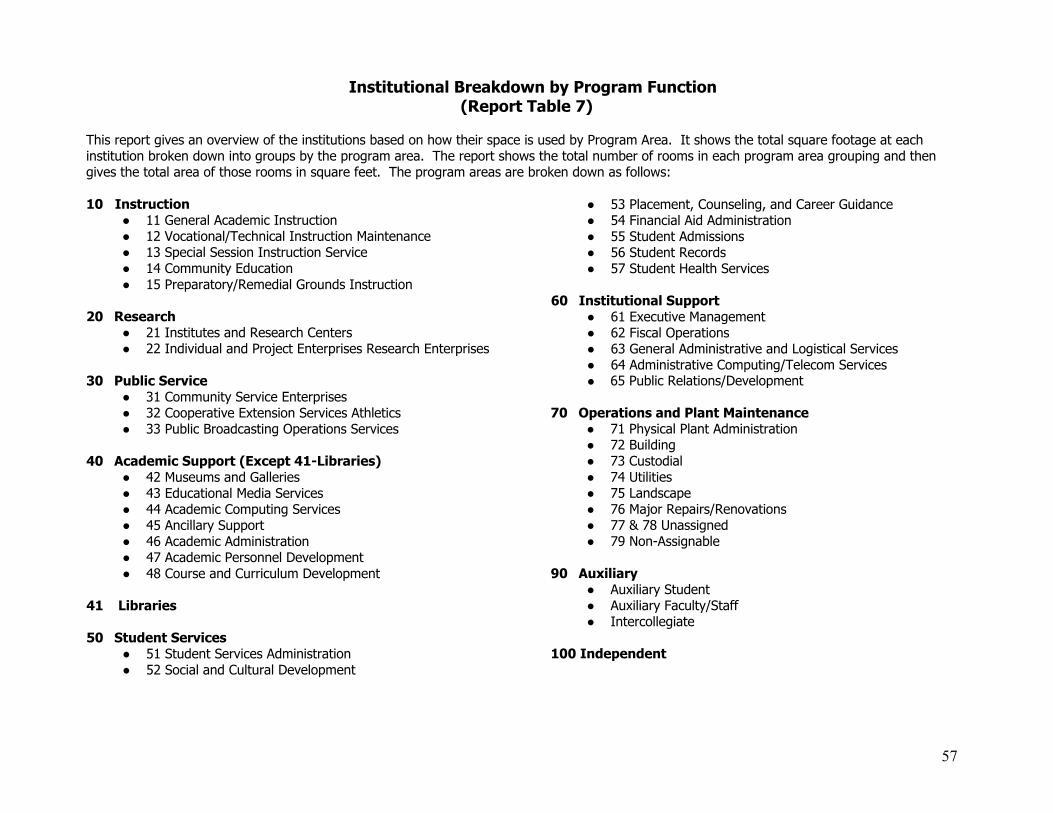
Institutional Breakdown by Program Function (Report Table 7)
This report gives an overview of the institutions based on how their space is used by Program Area. It shows the total square footage at each institution broken down into groups by the program area. The report shows the total number of rooms in each program area grouping and then gives the total area of those rooms in square feet. The program areas are broken down as follows: 10 Instruction ● 11 General Academic Instruction ● 12 Vocational/Technical Instruction Maintenance ● 13 Special Session Instruction Service ● 14 Community Education ● 15 Preparatory/Remedial Grounds Instruction 20 Research ● 21 Institutes and Research Centers ● 22 Individual and Project Enterprises Research Enterprises 30 Public Service ● 31 Community Service Enterprises ● 32 Cooperative Extension Services Athletics ● 33 Public Broadcasting Operations Services 40 Academic Support (Except 41-Libraries) ● 42 Museums and Galleries ● 43 Educational Media Services ● 44 Academic Computing Services ● 45 Ancillary Support ● 46 Academic Administration ● 47 Academic Personnel Development ● 48 Course and Curriculum Development 41 Libraries 50 Student Services ● 51 Student Services Administration ● 52 Social and Cultural Development
● 53 Placement, Counseling, and Career Guidance ● 54 Financial Aid Administration ● 55 Student Admissions ● 56 Student Records ● 57 Student Health Services 60 Institutional Support ● 61 Executive Management ● 62 Fiscal Operations ● 63 General Administrative and Logistical Services ● 64 Administrative Computing/Telecom Services ● 65 Public Relations/Development 70 Operations and Plant Maintenance ● 71 Physical Plant Administration ● 72 Building ● 73 Custodial ● 74 Utilities ● 75 Landscape ● 76 Major Repairs/Renovations ● 77 & 78 Unassigned ● 79 Non-Assignable 90 Auxiliary ● Auxiliary Student ● Auxiliary Faculty/Staff ● Intercollegiate 100 Independent
57
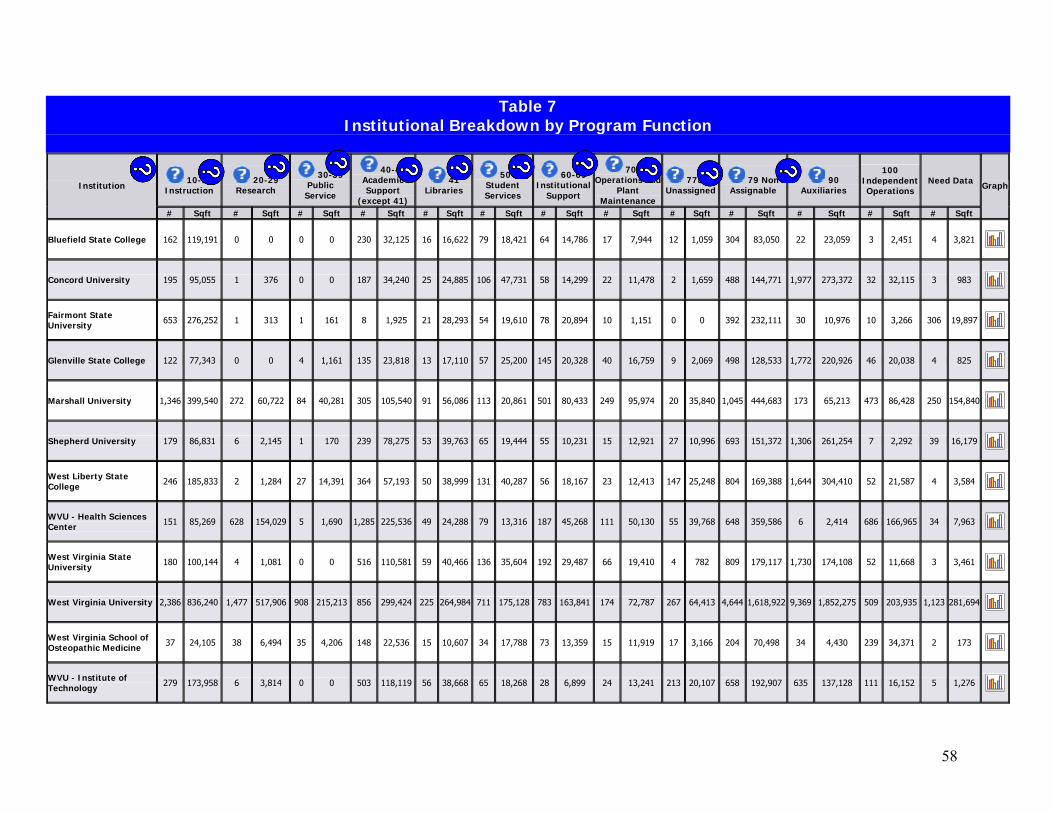
Table 7 Institutional Breakdown by Program Function
10-19 Instruction
20-29 Research
30-39 Public
Service
40-49 Academic Support
(except 41)
41 Libraries
50-59 Student Services
60-69 Institutional
Support
70-76 Operations and
Plant Maintenance
77&78 Unassigned
79 Non Assignable
90 Auxiliaries
100 Independent Operations
Need Data Institution
# Sqft # Sqft # Sqft # Sqft # Sqft # Sqft # Sqft # Sqft # Sqft # Sqft # Sqft # Sqft # Sqft
Graph
Bluefield State College 162 119,191 0 0 0 0 230 32,125 16 16,622 79 18,421 64 14,786 17 7,944 12 1,059 304 83,050 22 23,059 3 2,451 4 3,821
Concord University 195 95,055 1 376 0 0 187 34,240 25 24,885 106 47,731 58 14,299 22 11,478 2 1,659 488 144,771 1,977 273,372 32 32,115 3 983
Fairmont State University 653 276,252 1 313 1 161 8 1,925 21 28,293 54 19,610 78 20,894 10 1,151 0 0 392 232,111 30 10,976 10 3,266 306 19,897
Glenville State College 122 77,343 0 0 4 1,161 135 23,818 13 17,110 57 25,200 145 20,328 40 16,759 9 2,069 498 128,533 1,772 220,926 46 20,038 4 825
Marshall University 1,346 399,540 272 60,722 84 40,281 305 105,540 91 56,086 113 20,861 501 80,433 249 95,974 20 35,840 1,045 444,683 173 65,213 473 86,428 250 154,840
Shepherd University 179 86,831 6 2,145 1 170 239 78,275 53 39,763 65 19,444 55 10,231 15 12,921 27 10,996 693 151,372 1,306 261,254 7 2,292 39 16,179
West Liberty State College 246 185,833 2 1,284 27 14,391 364 57,193 50 38,999 131 40,287 56 18,167 23 12,413 147 25,248 804 169,388 1,644 304,410 52 21,587 4 3,584
WVU - Health Sciences Center 151 85,269 628 154,029 5 1,690 1,285 225,536 49 24,288 79 13,316 187 45,268 111 50,130 55 39,768 648 359,586 6 2,414 686 166,965 34 7,963
West Virginia State University 180 100,144 4 1,081 0 0 516 110,581 59 40,466 136 35,604 192 29,487 66 19,410 4 782 809 179,117 1,730 174,108 52 11,668 3 3,461
West Virginia University 2,386 836,240 1,477 517,906 908 215,213 856 299,424 225 264,984 711 175,128 783 163,841 174 72,787 267 64,413 4,644 1,618,922 9,369 1,852,275 509 203,935 1,123 281,694
West Virginia School of Osteopathic Medicine 37 24,105 38 6,494 35 4,206 148 22,536 15 10,607 34 17,788 73 13,359 15 11,919 17 3,166 204 70,498 34 4,430 239 34,371 2 173
WVU - Institute of Technology 279 173,958 6 3,814 0 0 503 118,119 56 38,668 65 18,268 28 6,899 24 13,241 213 20,107 658 192,907 635 137,128 111 16,152 5 1,276
58

Table 7 Institutional Breakdown by Program Function
10-19 Instruction
20-29 Research
30-39 Public
Service
40-49 Academic Support
(except 41)
41 Libraries
50-59 Student Services
60-69 Institutional
Support
70-76 Operations and
Plant Maintenance
77&78 Unassigned
79 Non Assignable
90 Auxiliaries
100 Independent Operations
Need Data
Institution
# Sqft # Sqft # Sqft # Sqft # Sqft # Sqft # Sqft # Sqft # Sqft # Sqft # Sqft # Sqft # Sqft
Graph
Blue Ridge Community and Technical College 23 3,340 0 0 0 0 21 1,714 0 0 0 0 10 789 0 0 0 0 30 3,095 0 0 0 0 0 0
WVU - Potomac State College 95 70,487 0 0 10 1,074 134 44,301 17 10,708 49 24,180 25 5,352 21 11,032 11 4,629 271 62,487 507 88,804 6 954 0 0
Eastern WV Community and Technical College 15 8,551 0 0 0 0 9 1,384 0 0 3 363 20 5,072 0 0 0 0 2 2,313 1 174 0 0 0 0
New River Community and Technical College 37 20,706 0 0 0 0 48 13,963 1 2,585 4 1,772 6 1,519 0 0 0 0 56 17,620 1 480 0 0 0 0
Southern WV Community & Technical College
116 59,930 0 0 9 3,106 123 17,658 22 16,671 58 26,803 57 11,104 2 217 20 16,746 148 46,496 2 877 17 6,550 16 4,593
West Virginia Northern Community College 77 47,533 0 0 1 102 72 11,043 18 14,057 39 12,549 47 9,376 12 2,377 0 0 94 33,858 5 1,778 16 6,517 334 108,074
WVU at Parkersburg 163 117,756 0 0 0 0 198 45,232 1 11,910 17 5,253 54 10,806 4 4,046 0 0 168 78,124 12 8,878 0 0 0 0
59