Embed Size (px)
Citation preview
HAL Id: inserm-00429145https://www.hal.inserm.fr/inserm-00429145
Submitted on 31 Oct 2009
HAL is a multi-disciplinary open accessarchive for the deposit and dissemination of sci-entific research documents, whether they are pub-lished or not. The documents may come fromteaching and research institutions in France orabroad, or from public or private research centers.
L’archive ouverte pluridisciplinaire HAL, estdestinée au dépôt et à la diffusion de documentsscientifiques de niveau recherche, publiés ou non,émanant des établissements d’enseignement et derecherche français ou étrangers, des laboratoirespublics ou privés.
High yield fabrication of fluorescent nanodiamonds.Jean-Paul Boudou, Patrick Curmi, Fedor Jelezko, Joerg Wrachtrup, Pascal
Aubert, Mohamed Sennour, Gopalakrischnan Balasubramanian, Rolf Reuter,Alain Thorel, Eric Gaffet
To cite this version:Jean-Paul Boudou, Patrick Curmi, Fedor Jelezko, Joerg Wrachtrup, Pascal Aubert, et al.. High yieldfabrication of fluorescent nanodiamonds.: fabrication of fluorescent nanodiamonds. Nanotechnology,Institute of Physics, 2009, 20 (23), pp.235602. �10.1088/0957-4484/20/23/235602�. �inserm-00429145�
Nanotechnology . Author manuscript
Page /1 11
High yield fabrication of fluorescent nanodiamondsJean-Paul Boudou 1 * , Patrick Curmi 1 * , Fedor Jelezko 2 * , Joerg Wrachtrup 2 , Pascal Aubert 3 , Mohamed Sennour 4 ,Gopalakrischnan Balasubramanian 2 , Rolf Reuter 2 , Alain Thorel 4 , Eric Gaffet 5
Structure et activit des biomol cules normales et pathologiques 1 é é INSERM : U829 , Universit d Evry-Val d Essonne é ' ' , Universit d Evry valé 'd essonne 1,rue du pere jarlan batiment maupertuis 91025 EVRY CEDEX,FR'
Physikalisches Institut 2 Universit t Stuttgart ä , FR
LMN, Laboratoire d tude des milieux nanom triques 3 'é é Universit d Evry-Val d Essonne é ' ' , B timent Maupertuis, aile ouest, 2 me tage 1 rueâ è édu p re Jarlan 91000 Evry,FRè
MAT, Centre des Mat riaux 4 é CNRS : UMR7633 , Mines ParisTech , Centre des mat riaux P. M. Fourt RN 447 - BP 87 91003 EVRYéCEDEX,FR
IRAMAT, Institut de Recherches sur les Arch omat riaux 5 é é CNRS : UMR5060 , Universit de Technologie de Belfort-Montbeliard é , Universit Michel de Montaigne - Bordeaux III é , Universit d Orl ans é ' é , FR
*Correspondence should be adressed to: Jean-Paul Boudou <[email protected] >*Correspondence should be adressed to: Patrick Curmi <[email protected] >*Correspondence should be adressed to: Fedor Jelezko <[email protected] >
Abstract
A new fabrication method to produce homogeneously fluorescent nanodiamonds with high yields is described. The powder obtained
by high energy ball milling of fluorescent high pressure, high temperature diamond microcrystals was converted in a pure
concentrated aqueous colloidal dispersion of highly crystalline ultrasmall nanoparticles with a mean size less than or equal to 10 nm.
The whole fabrication yield of colloidal quasi-spherical nanodiamonds was several orders of magnitude higher than those previously
reported starting from microdiamonds. The results open up avenues for the industrial cost-effective production of fluorescent
nanodiamonds with well-controlled properties.
MESH Keywords Carbon ; chemistry ; Colloids ; chemistry ; Diamond ; chemistry ; Fluorescence ; Microscopy, Atomic Force ; Microscopy, Electron, Transmission ;
Models, Chemical ; Nanoparticles ; chemistry ; ultrastructure ; Nanotechnology ; methods ; Nitrogen ; chemistry ; Pressure ; Temperature ; X-Ray Diffraction
Author Keywords nanotechnology ; nanoparticle ; colloidal dispersion ; fluorescence ; luminescence ; electron irradiation ; milling ; microsocopy ; HRTEM
Introduction
Diamond nanoparticles have received increasing attention owing to their outstanding prospective applications in various areas of
physics, chemistry and biology . Most of these applications are based on the unique optical and magnetic properties associated with[1 –5 ]defects in diamond. Among these, red/near-infrared fluorescent nanocrystalline diamonds are new nano-objects with several applications
in biology (biomolecule labeling/vectorization, bioanalysis) , quantum information processing (quantum cryptography and quantum[3 ]computing) , , magnetometry and novel imaging techniques . The nitrogen-vacancy (NV) defect, responsible for the diamond[6 7 ] [1 ]red/near-infrared fluorescence, is a particular type of optically active defect (color center) that deserves special consideration . First, the[8 ]fluorescence of the NV center in diamond is unconditionally stable, i.e. it does not photobleach or blink even under high excitation
intensities. . Second, NV-containing diamonds have the potential to be one of the smallest nanoparticle labels for use in biology, all[9 ]other nanoparticle labels being limited to the range of tens of nanometers. For example, even though the smallest quantum dots themselves
have a size of a few nanometers, encapsulation is needed for their chemical isolation from the cell for both optical stability and cell
toxicity issues. Blinking also remains problematic when tracking of quantum dots is required. In the case of metal nanoparticles, light
scattering scales as the inverse sixth power of the size and the detection limit is normally reached for a few tens of nanometers. In contrast,
NV color centers remain stable when localized beyond 1 2 nm of the surface of bulk diamond , and so the potential exists to create– [10 ]NV-containing nanodiamonds of a few nanometer diameters. Third, aside from the toxicity issues of nanoparticles in general, diamond is
known for its extreme chemical and biological inertness , even if nanotoxicology in general is still under investigation. The native[11 ]diamond surface can be either hydrophilic, oxygen-terminated, or hydrophobic, hydrogen-terminated . This gives a very wide range of[12 ]options for surface functionalization and grafting of biomolecules, such as proteins or DNA .[13 ]
To date, a few methods exist to produce diamond nanoparticles. Ultradispersed detonation diamond nanoparticles can be obtained with
a controllable size and a very convenient sp shell for functionalization and bioconjugation, but they do not contain any C-centers[14 ] 2 [15 ](isolated substitutional nitrogen atoms in the diamond lattice), but impurities such as surface-or lattice-aggregated nitrogen and metals in
significant amounts. More recently, dispersed nanodiamonds, just several nanometers in diameter, have been synthesized at only a
laboratory scale from carbon black by laser irradiation in water at room temperature and normal pressure . Finally, nanodiamonds have[16 ]
fabrication of fluorescent nanodiamonds
Nanotechnology . Author manuscript
Page /2 11
been made by using a microwave plasma torch technique with methane and Ar or N as catalysts . The production of diamond2 [17 ]
nanocrystals containing NV centers can be achieved by the chemical vapor deposition technique (CVD) : however, incorporation of[18 ]nitrogen in small nanocrystals by this means is very inefficient . Another option is to make NV centers by implanting nitrogen ions[19 ]
into pure diamond crystals , . Yet, the penetration depth of nitrogen ions is quite limited (approximately 1 m MeV ) and the[10 20 ] μ 1 −
production of large samples using this technique seems to be difficult. Similarly NV centers can be made in the nanodiamond itself by cold
implantation with an annealing procedure to incorporate homogeneously a large number of isolated nitrogen atoms on substitutionalin situ
sites in an undamaged diamond environment over an area of a few square centimeters. The sample depth is limited to a few nanometers in
this case.
Stable and bright fluorescent NV-rich nanodiamonds can be fabricated by irradiation and annealing in vacuum of type Ib high pressure
high temperature (HPHT) diamonds grown from metal catalysts in a few minutes. In this synthetic diamond, nitrogen comes from the
solvent metal and carbon source material, as well as from the residual gas left in the HPHT reactor. This nitrogen dissolves in the solvent
metal and is incorporated in the diamond crystal during growth as substitutional nitrogen atoms remaining isolated for thermokinetics
reasons. Such an N atom (called a C-center, single N or N ) is bound to four other diamond lattice carbon atoms. The C-defect centerS
(approximately > 50 ppm) gives a yellow color due to optical absorption. During irradiation with photons, electrons, ions or neutrons,
energetic particles knock diamond carbon atoms out of their normal lattice position by creating vacancies (V). Subsequent annealing
(typically at 800 C under vacuum) leaves single N immobile but activates the migration of V towards them leading to the formation of°fluorescent NV centers. Up to now, this HPHT route has been used as follows: a first mechanical milling step of as-grown HPHT diamond
(> 20 50 m) yields a very small and expensive fraction of nanodiamonds . Fluorescent nanoparticles are then produced by irradiation– μ [21 ]and annealing in vacuum of the nanodiamond fraction: however, just a part of this fraction can actually be rendered fluorescent due to still
debated reasons .[22 –25 ]
We describe here for the first time an industrial scalable method which allows the efficient conversion of as-grown HPHT[26 ]diamond microcrystals into spatially isolated ultrasmall quasi-spherical NV-rich diamond nanoparticles showing stable non-bleachable
fluorescence ( ). In the present state of its development, the overall yield of this method reaches about 15 (w/w) of thefigure 1 %microdiamond mass converted into 10 nm diamond nanoparticles. It opens realistic perspectives for the preparation of large samples of≤homogeneously fluorescent nanodiamonds necessary for research and development purposes.
Experimental procedureRaw material
The raw initial material was a highly crystalline synthetic micron diamond powder (Element Six PDA999) containing 80 100 mesh–(150 190 m) blocky, very uniformly cubo-octahedral shaped diamond crystals with extremely high toughness, thermal stability and– μimpact strength.
Electron irradiation and annealing
Electron irradiation was performed with a Rhodotron accelerator (Ionmed, Spain) operating at a beam power of 80 kW (10 MeV and 8
mA) distributed over around 250 cm giving a power density of 320 W cm (i.e. 7200 W cm /24 h). The sample was placed in a 3162 2 − 2 −
grade stainless steel (900 mm 20 mm 5 mm, wall thickness: 0.5 mm) vessel cooled in fresh running water. The diamond layer to be× ×penetrated was 4 mm over an area of 180 cm .≤ 2
After electron irradiation, the sample was annealed at 800 C under vacuum (? 10 Torr) during 2 h to allow migration of vacancies° 8 −
(V), created by electron irradiation. and NV color centers formed by the combination of V with isolated substitutional nitrogen atoms (N )S
occurring in the crystal lattice of Ib type diamonds , .[27 28 ]
Milling
To convert microdiamonds into smaller particles, we first used nitrogen jet milling autogeneous micronization which was preferred to
planetary milling with metallic beads because the latter resulted in severe contamination by metals. A 250 g sample of raw initial material
was first milled into a fine pure powder for 2 h in a 100 AFG fluidized bed opposed jet mill ( ) with a nitrogenHosokawa-Alpine, Germany
flow rate of 60 m h and a high grinding pressure (8 bar). After this step, we obtained a fine pure gray powder (with 97 of particles3 1 − %having sizes below 2 m).μ
A nanomilling procedure was then used to convert the jet milling product into fluorescent nanodiamonds (fND). A ten gram aliquot
was thus ball milled under argon using a planetary ball mill , , with hard(Vario-Planetary Mill, Pulverisette 4, Fritsch, Germany) [29 30 ]alloy WC 6 Co bowls and lids equipped with two valves (for milling under argon) and 30 10 mm balls made with the same WC Co+ % –cemented carbide. The powder-to-ball weight ratio was 1/35. The absolute speed of the main disc was 400 rpm and the relative rotationR
speed of the vials with respect to the supporting disc was 2.17.−
fabrication of fluorescent nanodiamonds
Nanotechnology . Author manuscript
Page /3 11
The program extended for 72 h as follows: the aliquot was ball milled for successive periods of 15 min, each separated by a 30 min
cooling period (24 h effective grinding time). The temperature measured on the outside bowl wall was about 50 C. This programed°stepwise grinding mode was found to be more convenient than flowing liquid nitrogen around the vial to control the milling temperature
between room temperature and 50 C.°
Purification and colloidal dispersion
After milling, the beads were recovered by sieving the fluorescent milled diamond (fMD). The fine tungsten carbide particles
produced by milling present in the fMD sample, and not recovered by sieving, were dissolved by harsh acid treatment: a 750 mg aliquot of
the fMD sample was placed in a 100 ml Teflon autoclave (200 ml with 30 ml of a hydrofluoric and nitric acidZeoclave-Autoclave France)
mixture (2:1 v/v) at 150 C for 48 h.°
After completion of the acid treatment, an excess of Milli-Q ultrapure water (MQW), up to 100 ml, was added to the sample which
was then mechanically dispersed before centrifugation (4000g, 30 min). The diamond sample precipitates under these acid conditions,
which allows easy recovery from the acid. To refine fND purification, this first pellet was suspended by strong shaking in a small MQW
volume to keep a strongly acid suspension. After centrifugation (4000g, 30 min) the strongly acid supernatant was discarded and the pellet
which contained precipitated nanodiamonds was then suspended in 50 ml of MQW. This new suspension was finally exactly neutralized
with aqueous ammonia solution and centrifuged again (4000 , 30 min). The resulting supernatant containing fine diamond nanoparticlesg
was stored for further processing. The residual pellet was resuspended (in 50 ml of MQW) and centrifuged (4000 , 30 min) twice more tog
complete the extraction of the diamond nanoparticles. The neutral supernatants were then pooled and desalted by tangential flow filtration
using a Millipore Pellicon XL cassette equipped with a Biomax membrane. The purified samples obtained were called the residual
fluorescent pellet (fP) and fluorescent nanodiamond fND (pooled, concentrated and desalted supernatants). fP and fND samples were dried
using a Rotavapor. An aliquot was taken for x-ray diffraction and surface group analysis. Another one was resuspended in MQW for
transmission electron microscopy observations and EDX analysis. The fP and fND masses were expressed either relative to the fMD mass
or the total mass of the dried pure diamond (fP fND).+
Transmission electron microscopy
TEM analyses were performed on an FEI F-20ST field emission gun transmission microscope equipped with super-twin(Philips)
polar pieces and operated at 200 kV. Energy-dispersive x-ray (EDX) analysis coupled with TEM was used to identify the elemental
composition of selected areas. Images were recorded at approximately Scherzer defocus on a CCD multiscan camera after astigmatism
corrections, and eventually filtered via the Digital Micrograph software. Materials for transmission electron microscopy, prepared by
ultrasonic dispersion of the samples in water for 5 min, were deposited on a copper grid coated with holey carbon. The deposited
suspensions were thereafter dried in air prior to transmission electron microscopy analyses. To avoid any electron irradiation damage that
could induce allotropic transformations of carbon materials, we used a reduced beam intensity but we did not observe any phase change,
even after long exposure, as observed for detonation nanodiamond . X-ray diffraction (XRD) was used to determine the sample[15 ]structure and composition after milling, and after milling and purification. The data were collected using an x-ray diffractometer with Cu K
( 1.540 56 ) radiation.α λ = Å
Surface group analysis
Analysis of the surface groups was done by temperature-programed desorption mass spectrometry. A small dried sample of about 5
mg of diamond nanocrystals was placed in a crucible and heated from 100 to 1450 C at 30 C min at atmospheric pressure in helium with° ° 1 −
one volume per cent of neon at a flow rate of 10 cm min . Evolved gases were continuously monitored and quantified with a mass3 1 −
spectrometer. The CO evolution profile was corrected from the 28 contribution due to molecular nitrogen. The system was calibratedml z
using gas mixtures in pure He with 1 Ne. The signal amplitude of each mass was compared to the 20 signal amplitude of Ne.% ml z
Physically desorbing water from heated samples produced a broad peak, probably due to interactions between polar water molecules and
the inner walls of the transfer line between oven and detector. The integrated water peak was used to assess sample moisture content, and
hence to correct the gas yield with respect to organic carbon or total carbon content on a dry, ash-free basis.
Results and discussionNanoparticle characterization
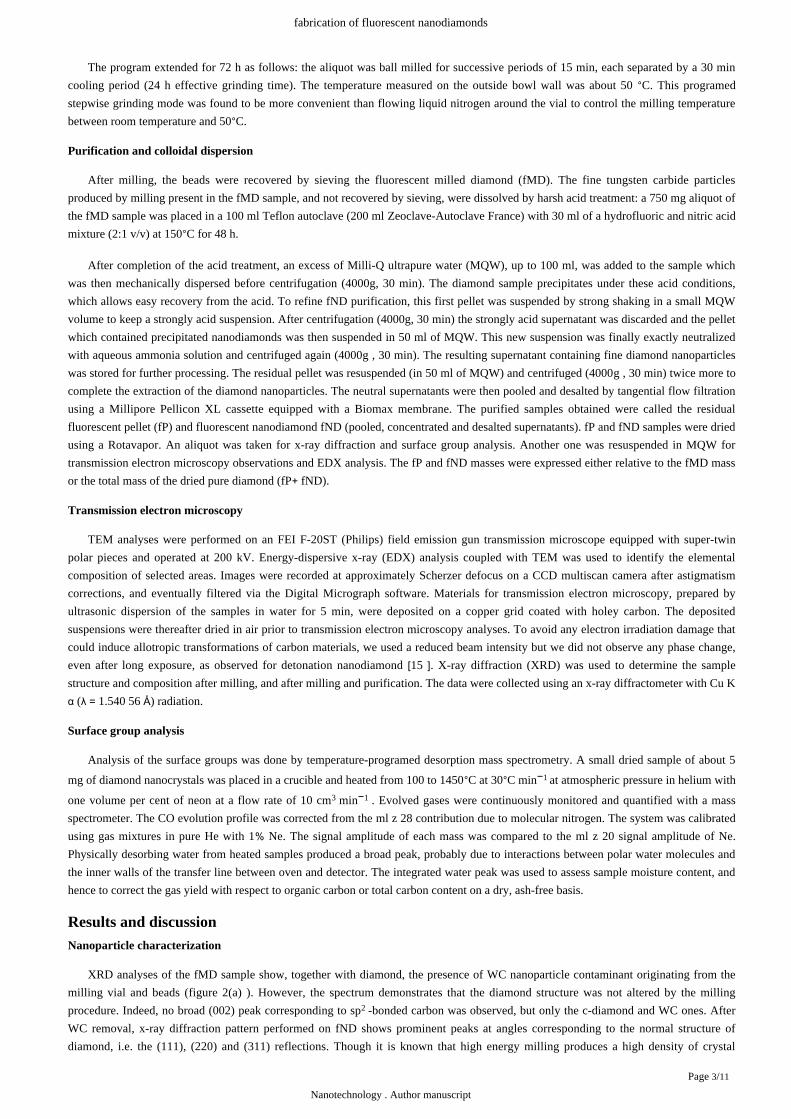
XRD analyses of the fMD sample show, together with diamond, the presence of WC nanoparticle contaminant originating from the
milling vial and beads ( ). However, the spectrum demonstrates that the diamond structure was not altered by the millingfigure 2(a)
procedure. Indeed, no broad (002) peak corresponding to sp -bonded carbon was observed, but only the c-diamond and WC ones. After2
WC removal, x-ray diffraction pattern performed on fND shows prominent peaks at angles corresponding to the normal structure of
diamond, i.e. the (111), (220) and (311) reflections. Though it is known that high energy milling produces a high density of crystal
fabrication of fluorescent nanodiamonds
Nanotechnology . Author manuscript
Page /4 11
dislocations , precise analyses processing of our XRD data did not show any significant change of the diamond lattice parameter. The[31 ]presence of wide XRD diffraction reflection is due to both microstrain isolated substitutional nitrogen and the small size of the[32 ]particles which are stated to be in the range of several nanometers: the width of the peak is inversely related to the nanoparticle dimensions
and can be approximated by the Scherrer equation . The mean fND particle size estimated by this equation applied to the Gaussian[33 ] –Lorentzian, Pearson VII or Voigt fitting curve of the (311), (220) or (111) diffraction peak is less than or equal to 10 nm, whatever the
crystallographic direction.
Energy-dispersive x-ray (EDX) spectra show that the combined HF/HNO treatment at 150 C for 48 h efficiently removes the3 °
contaminants from the fMD sample ( ). EDX analyses also reveal considerable amounts of oxygen (mean value: 1.3 wt )figure 2(c) %coming from secondary oxygen chemisorption forming surface carbon oxygen complexes as also revealed and characterized by– [34 ]temperature-programed desorption ( ). Carbon oxygen surface complexes are co-desorbed with NO-containing surface groupsfigure 2(d) –(resulting from nitration during the acid treatment) and with H-containing surface groups (CH, OH). The absence of fluorine in the
desorbed gases indicates that there is no aqueous acid oxidative fluorination of the particles during the HF/HNO treatment. This illustrates3
the fact that fluoride is a very poor nucleophile in aqueous solution and cannot cause surface oxygen group removal as previously—observed at higher temperature .[35 ]
Assuming that the surface coverage ratios of the functional groups and diamond density remain unchanged, the differences observed
between the thermal desorption profiles of the fND and the fP samples can be simply interpreted in terms of variation of specific surface
areas. Since the sphere specific surface area is 3/ (where is the sphere radius and is the density), the total surface group density (4.75r ρ r ρ
mmolg in fND and 1.45 mmol g in P) can be inversely related to the mean particle size and hence the specific surface area. As a matter1 − 1 −
of fact, the fND/fP surface group density ratio (3.27) is of the same order of magnitude as the fP/fND mean particle size ratio deduced
from HRTEM image processing (3.94). The higher C and O surface group density of nanodiamonds in the fND fraction, which represents
about 17 of the purified diamond fraction (fND fP) after a milling time of only 24 h ( ), would explain the good suspension% + figure 1(b)
stability of this fraction in pure neutral water. Surface modifications assisted by sonication are currently investigated to further improve the
dispersion of both fractions in water over wide pH and ionic strength ranges.
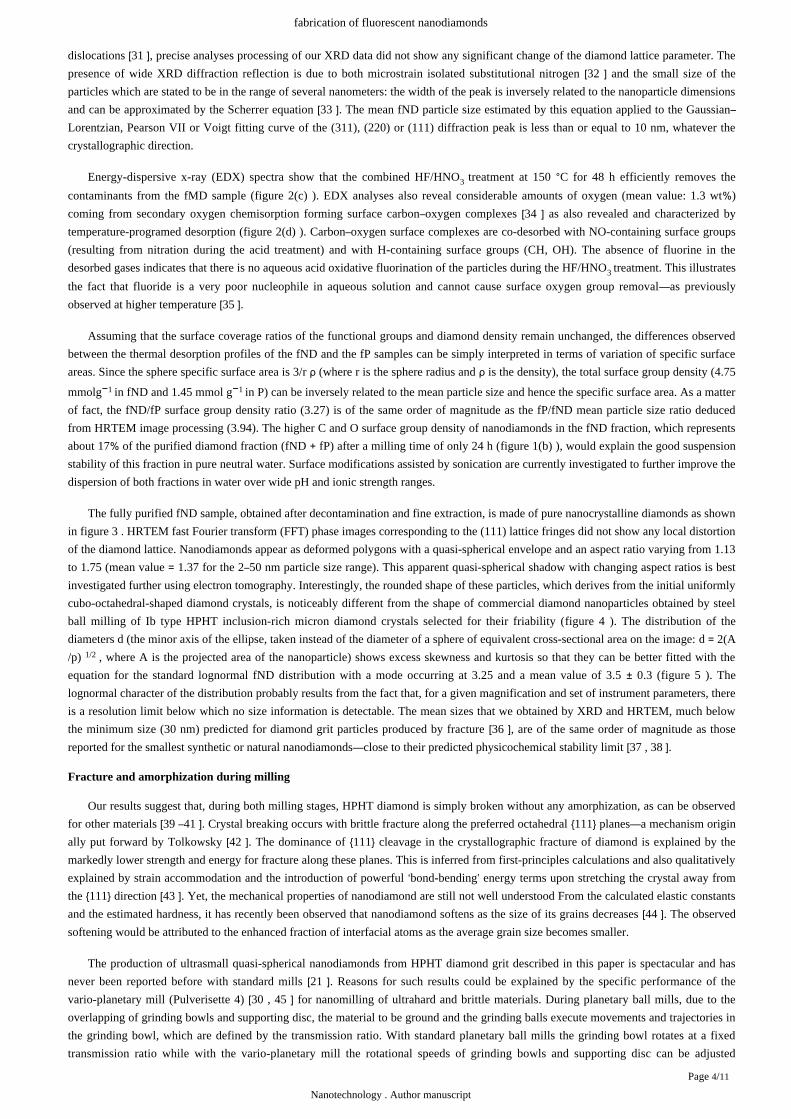
The fully purified fND sample, obtained after decontamination and fine extraction, is made of pure nanocrystalline diamonds as shown
in . HRTEM fast Fourier transform (FFT) phase images corresponding to the (111) lattice fringes did not show any local distortionfigure 3
of the diamond lattice. Nanodiamonds appear as deformed polygons with a quasi-spherical envelope and an aspect ratio varying from 1.13
to 1.75 (mean value 1.37 for the 2 50 nm particle size range). This apparent quasi-spherical shadow with changing aspect ratios is best= –investigated further using electron tomography. Interestingly, the rounded shape of these particles, which derives from the initial uniformly
cubo-octahedral-shaped diamond crystals, is noticeably different from the shape of commercial diamond nanoparticles obtained by steel
ball milling of Ib type HPHT inclusion-rich micron diamond crystals selected for their friability ( ). The distribution of thefigure 4
diameters (the minor axis of the ellipse, taken instead of the diameter of a sphere of equivalent cross-sectional area on the image: 2(d d = A
/ , where is the projected area of the nanoparticle) shows excess skewness and kurtosis so that they can be better fitted with thep) 1/2 A
equation for the standard lognormal fND distribution with a mode occurring at 3.25 and a mean value of 3.5 0.3 ( ). The± figure 5
lognormal character of the distribution probably results from the fact that, for a given magnification and set of instrument parameters, there
is a resolution limit below which no size information is detectable. The mean sizes that we obtained by XRD and HRTEM, much below
the minimum size (30 nm) predicted for diamond grit particles produced by fracture , are of the same order of magnitude as those[36 ]reported for the smallest synthetic or natural nanodiamonds close to their predicted physicochemical stability limit , .— [37 38 ]
Fracture and amorphization during milling
Our results suggest that, during both milling stages, HPHT diamond is simply broken without any amorphization, as can be observed
for other materials . Crystal breaking occurs with brittle fracture along the preferred octahedral 111 planes a mechanism origin[39 –41 ] { } —ally put forward by Tolkowsky . The dominance of 111 cleavage in the crystallographic fracture of diamond is explained by the[42 ] { }markedly lower strength and energy for fracture along these planes. This is inferred from first-principles calculations and also qualitatively
explained by strain accommodation and the introduction of powerful bond-bending energy terms upon stretching the crystal away from‘ ’the 111 direction . Yet, the mechanical properties of nanodiamond are still not well understood From the calculated elastic constants{ } [43 ]and the estimated hardness, it has recently been observed that nanodiamond softens as the size of its grains decreases . The observed[44 ]softening would be attributed to the enhanced fraction of interfacial atoms as the average grain size becomes smaller.
The production of ultrasmall quasi-spherical nanodiamonds from HPHT diamond grit described in this paper is spectacular and has
never been reported before with standard mills . Reasons for such results could be explained by the specific performance of the[21 ]vario-planetary mill (Pulverisette 4) , for nanomilling of ultrahard and brittle materials. During planetary ball mills, due to the[30 45 ]overlapping of grinding bowls and supporting disc, the material to be ground and the grinding balls execute movements and trajectories in
the grinding bowl, which are defined by the transmission ratio. With standard planetary ball mills the grinding bowl rotates at a fixed
transmission ratio while with the vario-planetary mill the rotational speeds of grinding bowls and supporting disc can be adjusted
fabrication of fluorescent nanodiamonds
Nanotechnology . Author manuscript
Page /5 11
completely independently of each other, so that by varying the transmission ratio intermediate levels and combinations of frictional and
impact pressures can be set as required. Ball milling process peak temperature and pressure, which can locally and instantly reach 300 C ° [ and 12 GPa , were not measured during our vario-planetary milling experiment but one can infer from our data that the 46 ] [47 ] p, T
parameters were below those for phase changes (amorphization, carbonization, burning) taking place during high pressure indentation [48 ], shear stress or diamond polishing . Our data suggest that the local temperature rise due to sliding/friction during diamond[49 ] [50 ]milling under argon remained low enough to avoid any thermo(chemical) diamond alteration and enabling simple crystallographic fracture
into nanodiamonds. For those small particles friction coefficient and specific wear rates would decrease with decreasing particle size [51 ]so that the smaller the particles become the more difficult it gets to reduce their size.
Fluorescence properties of diamond nanoparticles
One of the emerging applications of diamond nanocrystals is their use as fluorescent markers in microscopy. Such diamond
luminescent labels are reported to be superior to conventional chromophores owing to their unprecedented photostability.
In typical type Ib HPHT synthetic diamond, nitrogen atoms are homogeneously distributed if we consider diamonds with diameters
higher than a few nanometers. On the other hand, nitrogen may be unevenly distributed at the level of the crystal unit cell (side 0.35 nm)≈and may differ by a factor of two between the 100 and 111 growth sectors. In addition, there may also be some minor growth sectors,{ } { }such as 113 or 115 , where the nitrogen concentration is negligible . For these reasons, the initial mass of isolated substitutional{ } { } [52 ]nitrogen atoms (N , at a concentration of around 200 ppm in the raw microdiamond) is equally divided by milling in individualS
nanocrystals (which each includes a large number of crystal unit cells). The resulting nanodiamonds should have an average concentration
of 1 3 Ns per 5 nm nanocrystal potentially available for the formation of single nitrogen vacancy (NV) color defects. However, during– — –the fabrication process some initial (N ) are removed. A minor fraction of these nitrogen atoms (estimated by the ratio between theS
number of electrons dispatched per volume unit and the number of atoms in the same volume) can be knocked out of their substitutional
position by electron irradiation. One can assume that there is a negligible loss of single nitrogen atoms due to aggregation of single
nitrogen to aggregates during irradiation-annealing-milling (unlikely at this nitrogen concentration and conditions) , .A p, T [53 54 ]Another second cause of nitrogen loss is due to mechanical exhumation from the diamond core to < 10 nm nanoparticle surface during
milling. This loss can be assessed by taking into account the strong increase, below a particle size of 10 nm, of the edge-located nitrogen
atoms with respect to the total nitrogen atoms (N /N) ratio ( ) and the decrease of the correlated quaternary carbon atoms/lattice’ B figure 6(a)
carbon atoms (C /C ) ratio ( ).’ Q L figure 6(b)
An increase of the final NV density in nanodiamonds, and consequently a reduction of the predictable large statistical fluctuations of
the NV concentration in ultrasmall nanocrystals, could be achieved, either by nanomilling of fluorescent microdiamonds prepared with NS
-rich diamonds (e.g. N 2000 ppm, as shown in ), such as those recently synthesized with the BN C , Fe N C or theS = figure 6(a) – [55 ] 3 – [56 ]
Ba(N ) C systems , or by irradiation-annealing of N -rich nanodiamonds produced by milling of these nitrogen-enriched3 2 – [57 ] S
microdiamonds assuming that isolated substitutional nitrogen (N ) is stable in very small nanodiamonds and does not aggregate in— S [58 ]
too large a proportion during vacancy creation and annealing , .[53 54 ]
In our experiments diamond nanoparticles were prepared by electron irradiation (10 MeV, 5 10 electrons cm ) of type Ib HPHT× 19 2 −
micron diamond powder with a typical N concentration of around 200 ppm (Element Six PDA999) containing 8 100 mesh (150 190 m).S – – μ
The sample was annealed under vacuum (? 10 Torr, 800 C during 2 h), before milling and subsequent purification ( ). The8 − ° figure 7
resulting nanodiamonds were investigated using atomic force microscopy combined with a home-made optical microscope. Figure 8
shows a topography image of nanocrystals in fP fND fractions obtained by milling of the fluorescent microdiamond and purification of+the fMD fraction (prepared by electron irradiation and annealing of type Ib HPHT with an N concentration of around 200 ppm)S
immobilized on the glass surface. In order to examine relationships between the size of nanocrystals and their fluorescence, we recorded
confocal images of the same sample area (marked with a square frame in ). Remarkably all nanocrystals present in thefigures 8(a) and (b)
AFM picture show stable non-bleachable fluorescence. The brightness of individual spots differs significantly owing to different volumes
of nanocrystals present in the sample. This distinguishes fluorescent nanocrystals from quantum dots where a change of size shifts the
spectrum without affecting the oscillator strength of the optical transition. The fluorescence spectrum presented in shows thefigure 8(d)
characteristic shape of the negatively charged NV defect. Note that the 637 nm zero-phonon line characteristic for NV color centers in bulk
diamond is absent in nanocrystal spectra, indicating strong strain . Such strain leads to splitting of the excited state causing[59 ]inhomogeneous broadening of the zero-phonon line for nanocrystals containing many defects .[60 ]
The brightness of diamond nanocrystals is crucial for their application as fluorescent markers. For NV-doped nanodiamonds the
saturated fluorescence signal is defined by the number of NV defects. Note that estimation of brightness based on fluorescence intensity
signal is not quantitative because the detected signal can be affected by the sensitivity of the experimental set-up. Recently it was shown
that exact information on the number of color centers can be obtained by a quantum optical analysis of emitted light . A single NV[55 ]defect never emits two photons at once because the emission of a photon projects the single quantum system into the ground state (owing
to energy conservation). Hence subPoissonian photon statistics, called photon antibunching , is found as a dip in the second-order‘ ’
fabrication of fluorescent nanodiamonds
Nanotechnology . Author manuscript
Page /6 11
correlation function (for details see the reference) is a signature of a single emitter . When several defects are present in a[61 ]nanodiamond the probability of detecting two photons is not zero anymore. The contrast of antibunching dips scale as where is the1/N, N
number of color centers. shows the measured autocorrelation function for a selected nanocrystal. The contrast of theFigure 8(e)
antibunching dip is 0.08, indicating that 12 centers are present in the emission. Note that, assuming that the nanocrystal is quasi-spherical,
its diameter can be measured independently from AFM coordinates ( ), allowing approximation of the concentration of NVz figure 8(c)
defects in nanostructured diamond material.
Conclusions and prospects
We present here for the first time a high yield method to produce isolated ultrasmall quasi-spherical diamond nanoparticles with
dimensions less than or equal to 10 nm. The starting material is a highly crystalline HPHT micron-sized diamond and the production has
an overall yield of about 15 (w/w) of the initial microdiamond for a 24 h milling time. This yield is several orders of magnitude higher%than the present ones . The nanodiamonds obtained here present new features: they are made of c-diamond nanocrystals with[21 ]controlled size, shape and composition, a very high crystallinity and little impurity but selected doping heteroatoms such as isolated
substitutional nitrogen.
Ultrasmall fluorescent nanodiamonds will have outstanding potential applications, for instance in physics or biology. Owing to long
coherence time even at room temperature, spins associated with single NV defects are expected to be important for use in future
nanodevices, such as qubits for quantum computing. NV-doped nanodiamonds can also be used as magnetic field sensors reaching atomic
(sub-nm) spatial resolution and sensitivity of the order of G. Furthermore, availability of small nanocrystals with NV defects locatedμclose to the surface of diamond allows their use as sensors for external spins. In biology, the possibility to label molecules (nucleic acids,
peptides or proteins) with fluorescent nanodiamonds opens novel prospects for quantitative biology (DNA chip, quantitative PCR,
immunodetection of gene products in health and disease) since they sustain long term repetitive measurements which is not achievable
with conventional fluorophores. Ultrasmall fluorescent nanodiamonds would also be ideally tailored for single-particle tracking for
subcellular dynamics: such a small size reduces dramatically the impact on diffusion in cellular media and the absence of blinking makes
trajectory reconstruction much easier, with less need for tracking algorithms to solve the frame-to-frame correspondence problem , , [1 62
. Finally, if the nanodiamonds are produced from raw HPHT microcrystals, they should advantageously replace non-fluorescent63 ]diamond nanoparticles presently used in numerous applications, such as seeding substrates for thin film CVD diamond synthesis , ,[64 65 ]hard disc computer industry , bioelectronics or for the next generation of integrated circuits .[66 ] [67 ] [68 ]
The observations made in the present work will be useful to adjust at will nanodiamond properties with minimal loss in crystallinity
for any of these specific applications and needs (particle size, shape, composition: NV content, nanoparticle doping with selected
heteroelements, surface functionalization). The industrial scale production of ultrasmall nanodiamonds represents a breakthrough toward
these objectives.
Ackowledgements:
This research was supported by the European Commission with financial support of the project Nano4Drugs under contract
LSHC-CT-2005-019102.
References: 1 . Balasubramanian G . 2008 ; Nanoscale imaging magnetometry with diamond spins under ambient conditions . Nature . 455 : 648 - 51 2 . Barnard AS , Sternberg M . 2005 ; Substitutional nitrogen in nanodiamond and bucky-diamond particles . J Phys Chem B . 109 : 17107 - 12 3 . Chang YC . 2008 ; Mass production and dynamic imaging of fluorescent nanodiamonds . Nat Nanotechnol . 3 : 284 - 8 4 . Hartl A , Schmich E , Garrido JA , Hernando J , Catharino SCR , Walter S , Feulner P , Kromka A , Steinmuller D , Stutzmann M . 2004 ; Protein-modified nanocrystalline
diamond thin films for biosensor applications . Nat Mater . 3 : 736 - 42 5 . Wu E , Jacques V , Zeng H , Grangier P , Treussart F , Roch J-F . 2006 ; Narrow-band single-photon emission in the near infrared for quantum key distribution . Opt
Express . 14 : 1296 - 303 6 . Greentree AD , Fairchild BA , Hossain FM , Prawer S . 2008 ; Diamond integrated quantum photonics . Mater Today . 11 : 22 - 31 7 . Wrachtrup J , Jelezko F . 2006 ; Processing quantum information in diamond . J Phys: Condens Matter . 18 : S807 - 24 8 . Davies G , Collins AT . 1993 ; Vacancy complexes in diamond . Diamond Relat Mater . 2 : 80 - 6 9 . Gruber A , Dr benstedt ä A , Tietz C , Fleury L , Wrachtrup J , Borczyskowski CV . 1997 ; Scanning confocal optical microscopy and magnetic resonance on single defect
centres . Science . 276 : 2012 - 4 10 . Rabeau JR , Reichart P , Tamanyan G , Jamieson DN , Prawer S , Jelezko F , Gaebel T , Popa I , Domhan M , Wrachtrup J . 2006 ; Implantation of labelled single nitrogen
vacancy centers in diamond using 15N . Appl Phys Lett . 88 : 023113 - 11 . Schrand AM , Huang H , Carlson C , Schlager JJ , Osawa E , Hussain SM , Dai L . 2007 ; Are diamond nanoparticles cytotoxic? . J Phys Chem B . 111 : 2 - 7 12 . Zaitsev A . 2001 ; Optical Properties of Diamond: A Data Handbook . Berlin Springer ; 13 . Yang W . 2002 ; DNA-modified nanocrystalline diamond thin-films as stable, biologically active substrates . Nat Mater . 1 : 253 - 7 14 . Osswald S , Havel M , Mochalin V , Yushin G , Gogotsi Y . 2008 ; Increase of nanodiamond crystal size by selective oxidation . Diamond Relat Mater . 17 : 1122 - 6 15 . Iakoubovskii K , Mitsuishi A , Furuya A . 2008 ; High-resolution electron microscopy of detonation nanodiamond . J Nanotechnol . 108 : 55705 - 16 . Hu S , Tian F , Bai P , Cao S , Sun J , Yang J . 2009 ; Synthesis and luminescence of nanodiamonds from carbon black . Mater Sci Eng B . 157 : 11 - 4 17 . Ting CC , Young T-F , Jwo C-S . 2007 ; Fabrication of diamond nanopowder using microwave plasma torch technique . Int J Adv Manuf Technol . 34 : 316 - 22 18 . Stacey A , Aharonovich I , Prawer S , Butler JE . 2009 ; Controlled synthesis of high quality micro/nano-diamonds by microwave plasma chemical vapor deposition .
Diamond Relat Mater . 18 : 51 - 5
fabrication of fluorescent nanodiamonds
Nanotechnology . Author manuscript
Page /7 11
19 . Kennedy TA , Colton JS , Butler JE , Linares RC , Doering PJ . 2003 ; Long coherence times at 300 K for nitrogen-vacancy center spins in diamond grown by chemical vapor deposition . Appl Phys Lett . 83 : 4190 - 2
20 . Kalish R , Uzan-Saguy C , Philosoph B , Richter V , Lagrange JP , Gheeraert E , Deneuville A , Collins AT . 1997 ; Nitrogen doping of diamond by ion implantation . Diamond Relat Mater . 6 : 516 - 20
21 . Morita Y , Takimoto T , Yamanaka H , Kumekawa K , Morino S , Aonuma S , Kimura T , Komatsu N . 2008 ; A facile and scalable process for size-controllable separation of nanodiamond particles as small as 4 nm . Small . 4 : 2154 - 7
22 . Beveratos A , Brouri R , Gacoin T , Poizat JP , Grangier P . 2001 ; Nonclassical radiation from diamond nanocrystals . Phys Rev A . 64 : 061802 - 23 . Faklaris O , Garrot D , Joshi V , Druon F , Boudou J , Sauvage T , Georges P , Curmi P , Treussart F . 2008 ; Detection of single photoluminescent diamond nanoparticles
in cells and study of the internalization pathway . Small . 4 : 2236 - 9 24 . Sonnefraud Y , Cuche A , Faklaris O , Boudou JP , Sauvage T , Roch JF , Treussart F , Huant S . 2008 ; Diamond nanocrystals hosting single nitrogen-vacancy color
centers sorted by photon-correlation near-field microscopy . Opt Lett . 33 : 611 - 3 25 . Tisler J . 2009 ; Fluorescence and spin properties of defects in single digit nanodiamonds . Nana Lett . submitted 26 . Boudou JP , Curmi PA . 2008 ; Method to produce light-emitting nano-particles of diamond . EP1990313 . (A1 ) INSERM . 27 . Lawson S , Davies G , Collins AT , Mainwood A . 1992 ; Migration energy of the neutral vacancy in diamond . J Phys: Condens Matter . 4 : L125 - 31 28 . Iakoubovskii K , Kiflawi I , Johnston K , Collins A , Davies G , Stesmans A . 2003 ; Annealing of vacancies and interstitials in diamond . Physica B . 340 342 – : 67 - 75
29 . Gaffet E . 1991 ; Ball milling: an parameter phase diagram E-v-T . Mater Sci Eng A . 135 : 291 - 3 30 . Gaffet E , Bernard F , Niepce J-C , Charlot F , Gras C , Ca r ë GL , Guichard J-L , Delcroix P , Mocellin A , Tillement O . 1999 ; Some recent developments in mechanical
activation and mechanosynthesis . J Mater Chem . 9 : 305 - 14 31 . Ung r á T , Borb ly é A , Goren-Muginstein GR , Berger S , Rosen AR . 1999 ; Particle-size, size distribution and dislocations in nanocrystalline tungsten-carbide .
Nanostruct Mater . 11 : 103 - 13 32 . Maeta H , Matsumoto N , Haruna K , Saotome T , Ono F , Sugai H , Ohtsuka H , Ohashi K . 2006 ; The characterization of synthetic and natural single crystal diamonds
by x-ray diffraction . Physica B . 376/377 : 283 - 7 33 . Patterson AL . 1939 ; The Scherrer formula for x-ray particle size determination . Phys Rev . 56 : 978 - 82 34 . Loh KP , Xie XN , Lim YH , Teo EJ , Zheng JC , Ando T . 2002 ; Surface oxygenation studies on (1 0 0)-oriented diamond using an atom beam source and local anodic
oxidation . Surf Sci . 505 : 93 - 114 35 . Ando T , Yamamoto K , Matsuzawa M , Takamatsu Y , Kawasaki S , Okino F , Touhara H , Kamo M , Sato Y . 1996 ; Direct interaction of elemental fluorine with
diamond surfaces . Diamond Relat Mater . 5 : 1021 - 5 36 . Hird JR , Field JE . 2004 ; Diamond polishing . Proc R Soc A . 460 : 3547 - 68 37 . Zhao DS , Zhao M , Jiang Q . 2002 ; Size and temperature dependence of nanodiamond-nanographite transition related with surface stress . Diamond Relat Mater . 11 : 234 - 6
38 . Barnard AS . 2006 ; Theory and modeling of nanocarbon phase stability . Diamond Relat Mater . 15 : 285 - 91 39 . Gaffet E , Harmelin M . 1990 ; Crystal-amorphous phase transition induced by ball-milling in silicon . J Less-Common Met . 157 : 201 - 22 40 . Huang JY . 1999 ; HRTEM and EELS studies of defects structure and amorphous-like graphite induced by ball-milling . Acta Mater . 47 : 1801 - 8 41 . Shen TD , Zhang J , Zhao Y . 2008 ; What is the theoretical density of a nanocrystalline material? . Acta Mater . 56 : 3663 - 71 42 . Tolkowsky M . 1920 ; Research on the abrading, grinding or polishing of diamond Guilds College . University of London ; London 43 . Telling RH , Pickard CJ , Payne MC , Field JE . 2000 ; Theoretical strength and cleavage of diamond . Phys Rev Lett . 84 : 5160 - 44 . Remediakis IN , Kopidakis G , Kelires PC . 2008 ; Softening of ultra-nanocrystalline diamond at low grain sizes . Acta Mater . 56 : 5340 - 4 45 . Gaffet E . 1991 ; Phase transition induced by ball milling in germanium . Mater Sci Eng A . 136 : 161 - 9 46 . Maurice D , Courtney H . 1990 ; The physics of mechanical alloying: a first report . Metall Mater Trans A . 21 : 289 - 303 47 . Chattopadhyay PP , Manna I , Talapatra S , Pabi SK . 2001 ; A mathematical analysis of milling mechanics in a planetary ball mill . Mater Chem Phys . 68 : 85 - 94 48 . Gogotsi YG , Kailer A , Nickel KG . 1999 ; Materials: transformation of diamond to graphite . Nature . 401 : 663 - 4 49 . Chacham H , Kleinman L . 2000 ; Instabilities in diamond under high shear stress . Phys Rev Lett . 85 : 4904 - 50 . van Bouwelen FM , Field JE , Brown LM . 2003 ; Electron microscopy analysis of debris produced during diamond polishing . Phil Mag . 83 : 839 - 55 51 . Gubarevich A , Usuba S , Kakudate Y , Tanaka A , Odawara O . 2004 ; Diamond powders less than 100 nm in diameter as effective solid lubricants in vacuum . Japan J
Appl Phys . 43 : L920 - 3 52 . Burns RC , Cvetkovic V , Dodge CN , Evans DJF , Rooney M-LT , Spear PM , Welbourn CM . 1990 ; Growth-sector dependence of optical features in large synthetic
diamonds . J Cryst Growth . 104 : 257 - 79 53 . Collins AT . 1980 ; Vacancy enhanced aggregation of nitrogen in diamond . J Phys C: Solid State Phys . 13 : 2641 - 50 54 . Collins AT , Kanda H , Kitawaki H . 2000 ; Colour changes produced in natural brown diamonds by high-pressure, high-temperature treatment . Diamond Relat Mater . 9 : 113 - 22
55 . Kanda H , Akaishi M , Yamaoka S . 1999 ; Synthesis of diamond with the highest nitrogen concentration . Diamond Relat Mater . 8 : 1441 - 3 56 . Borzdov Y , Pal yanov ’ Y , Kupriyanov I , Gusev V , Khokhryakov A , Sokol A , Efremov A . 2002 ; HPHT synthesis of diamond with high nitrogen content from an Fe3
N-C system . Diamond Relat Mater . 11 : 1863 - 70 57 . Yu RZ , Ma HA , Liang ZZ , Liu WQ , Zheng YJ , Jia X . 2008 ; HPHT synthesis of diamond with high concentration nitrogen using powder catalyst with additive Ba(N3
)2 . Diamond Relat Mater . 17 : 180 - 4
58 . Barnard AS , Sternberg M . 2007 ; Mapping the location and configuration of nitrogen in diamond nanoparticles . Nanotechnology . 18 : 025702 - 59 . Tamarat P . 2008 ; Spin-flip and spin-conserving optical transitions of the nitrogen-vacancy centre in diamond . New J Phys . 10 : 045004 - 60 . Jelezko F , Tietz C , Gruber A , Popa I , Nizovtsev A , Kilin S , Wrachtrup J . 2001 ; Spectroscopy of single N-V centers in diamond . Single Mol . 2 : 255 - 60 61 . Neugart F , Zappe A , Jelezko F , Tietz C , Boudou JP , Krueger A , Wrachtrup J . 2007 ; Dynamics of diamond nanoparticles in solution and cells . Nano Lett . 7 : 3588 -
91 62 . Maze JR . 2008 ; Nanoscale magnetic sensing with an individual electronic spin in diamond . Nature . 455 : 644 - 7 63 . Saxton M . 2008 ; Single-particle tracking: connecting the dots . Nat Methods . 5 : 671 - 2 64 . Arnault JC , Saada S , Nesladek M , Williams OA , Haenen K , Bergonzo P , Osawa E . 2008 ; Diamond nanoseeding on silicon: stability under H MPCVD exposures2
and early stages of growth . Diamond Relat Mater . 17 : 1143 - 9 65 . Williams OA , Nesladek M , Daenen M , Michaelson S , Hoffman A , Osawa E , Haenen K , Jackman RB . 2008 ; Growth, electronic properties and applications of
nanodiamond . Diamond Relat Mater . 17 : 1080 - 8 66 . Kurmashev V , Timoshkov Y , Orehovskaja T , Timoshkov V . 2004 ; Nanodiamonds in magnetic recording system technologies . Phys Solid State . 46 : 696 - 702 67 . Nebel CE , Shin D , Rezek B , Tokuda N , Uetsuka H , Watanabe H . 2007 ; Diamond and biology . J R Soc Interface . 4 : 439 - 61 68 . May PW . 2008 ; The new diamond age? . Science . 319 : 1490 - 1
fabrication of fluorescent nanodiamonds
Nanotechnology . Author manuscript
Page /8 11
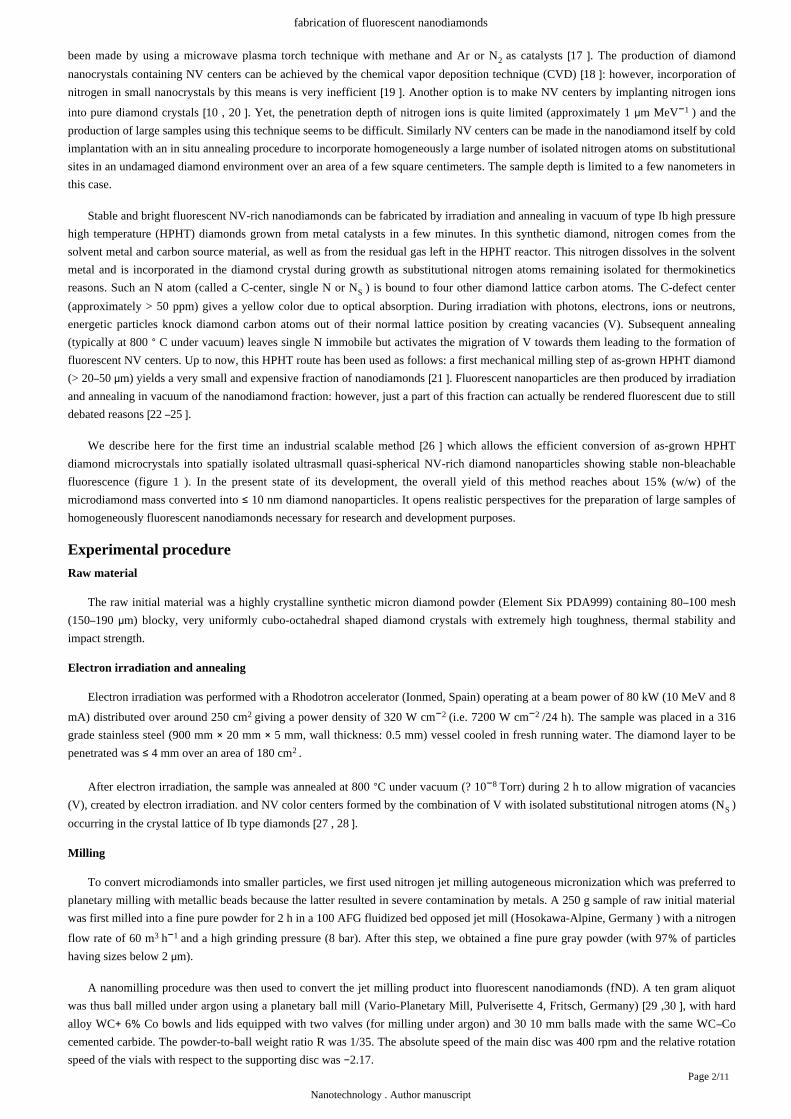
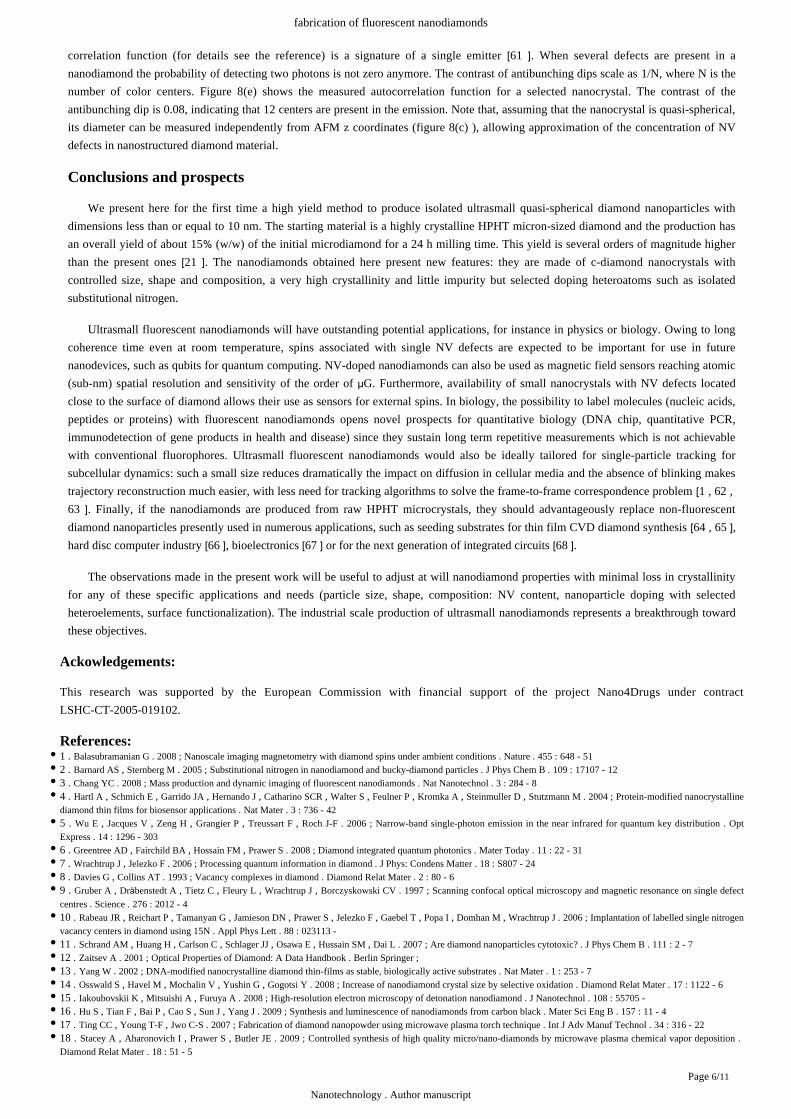
Figure 1Flow chart for fluorescent ultrasmall nanodiamond (fND) preparation. (a) NV creation is obtained by 10 MeV electron irradiation of raw
HPHT microdiamond followed by annealing at 800 C under vacuum. Milling of the fluorescent microdiamond is performed in two steps,°micronization and nanomilling. Decontamination includes a hot HF/HNO attack followed by a series of centrifugation steps. The first pellet3
is resuspended in a small MQW volume. The second pellet is resuspended in a large MQW volume and NH OH neutralized. Supernatants4
obtained by three subsequent centrifugations are pooled and desalted by ultrafiltration, (b) Mass distribution of the metal-contaminated
diamond (fMD) fractions expressed in dry weight per cent. The WC Co fraction mass was obtained by subtracting the pellet (fP) and fND+mass from the fMD mass.
fabrication of fluorescent nanodiamonds
Nanotechnology . Author manuscript
Page /9 11
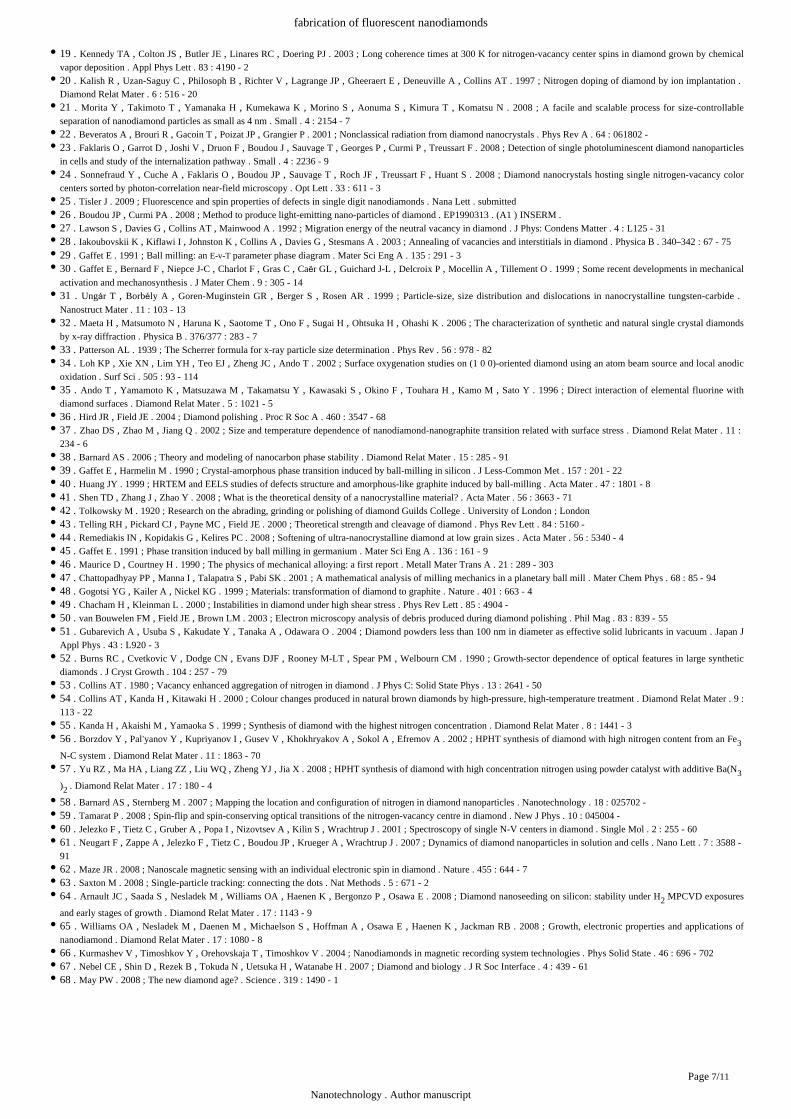
Figure 2Sample structure and composition of the fMD, fND and fP fractions from the production process. (a) XRD pattern of the fMD sample
showing a severe contamination with hexagonal WC. The WC diffraction peaks (31.48 , (001), 35.76 (100), 48.40 (101), 64.04 (110),° ° ° °65.32 (002), 73.20 (111), 75.60 (200), 76.92 (102)84.16 (201), according to JCPDS 25 1047) are indicated with values. The inset is° ° ° ° ° – (hkl)
the HRTEM image of a WC nanocrystal. Arrows show lattice fringes of the WC 100 and 101 planes, (b) XRD pattern of the fND sample{ } { }showing intense peaks indexed to the cubic diamond structure (43.97 (111), 75.37 (220), 91.59 (311); peak position and relative integrated° ° °intensities of each peak are within one standard deviation of the values given in JCPDS card no. 6 0675). (c) Energy-dispersive x-ray (EDX)–spectrum of the purified nanodiamond (fND) samples. The spectrum shows that the tungsten has been efficiently removed. The carbon Kαline remains as the only relevant peak in the spectrum, reflecting the purity of the diamond crystals. (d) Thermal desorption profiles of CO ,2
CO and H for the fND fraction and of either CO , CO or H for the fMD, fND and the centrifugation precipitate (fP) fractions.2 2 2
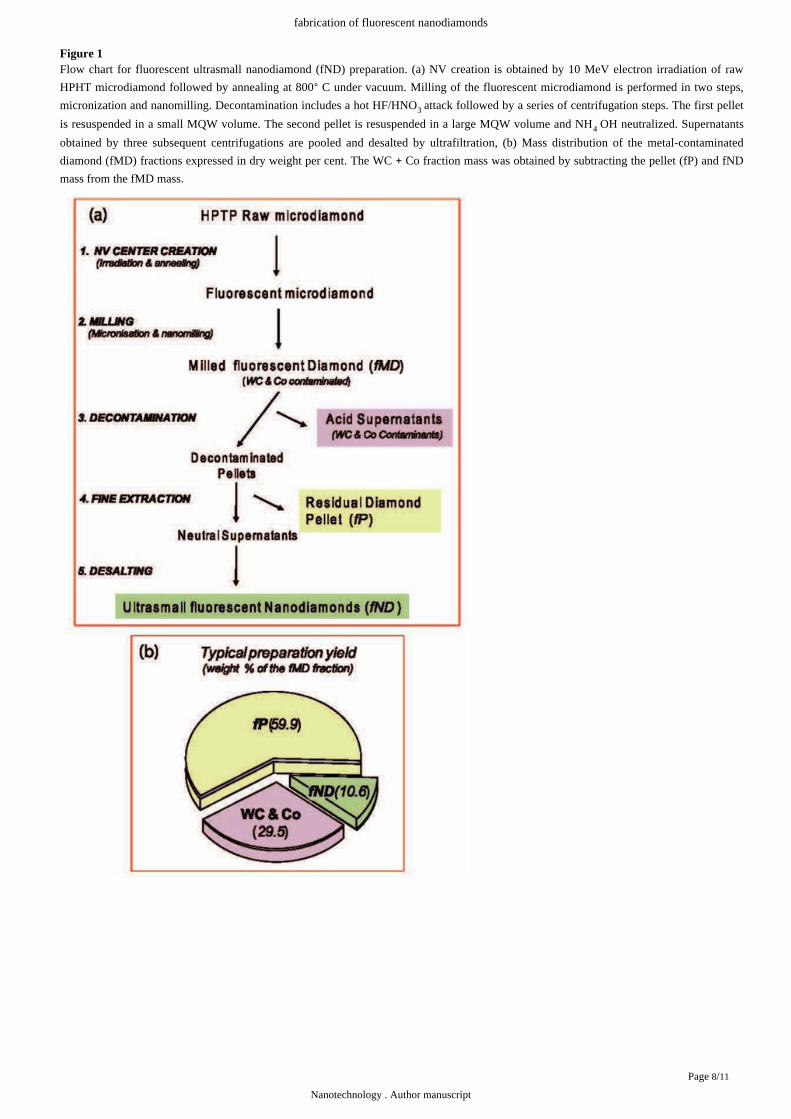
Figure 3The milling method provides a homogeneous population of ultrasmall quasi-spherical diamond nanoparticles TEM/HRTEM images from fP
(a) and fND (b) (d) as defined in . (e) HRTEM image of typical nanodiamond (f) FFT analysis of the nanodiamond crystalline– figure 1
structure where the c-diamond d 111 spacing is given by the inverse of the ring radius. The distance between the 111 planes is equal to sin { } a
2.06 , where 3.5625 is the unit cell dimension and 0.6154 rad is the angle between the 111 and the 110 planes.θ ≈ Å a = Å θ = { } { }
fabrication of fluorescent nanodiamonds
Nanotechnology . Author manuscript
Page /10 11
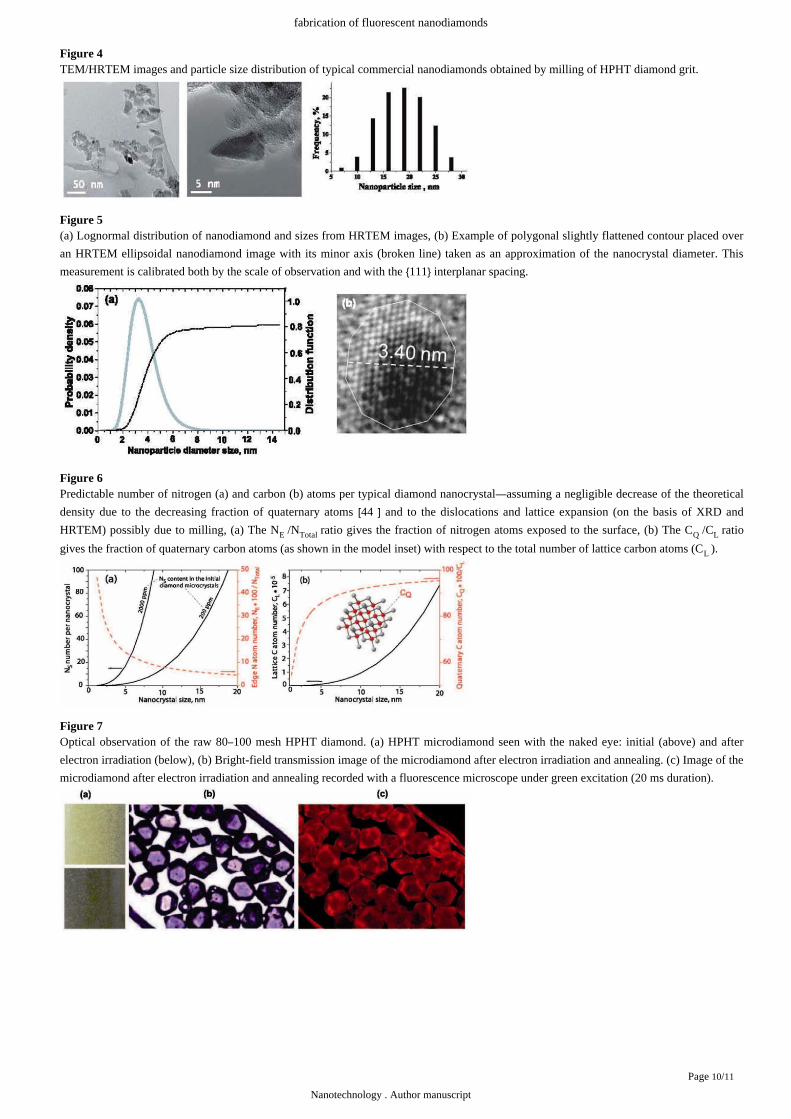
Figure 4TEM/HRTEM images and particle size distribution of typical commercial nanodiamonds obtained by milling of HPHT diamond grit.
Figure 5(a) Lognormal distribution of nanodiamond and sizes from HRTEM images, (b) Example of polygonal slightly flattened contour placed over
an HRTEM ellipsoidal nanodiamond image with its minor axis (broken line) taken as an approximation of the nanocrystal diameter. This
measurement is calibrated both by the scale of observation and with the 111 interplanar spacing.{ }
Figure 6Predictable number of nitrogen (a) and carbon (b) atoms per typical diamond nanocrystal assuming a negligible decrease of the theoretical—density due to the decreasing fraction of quaternary atoms and to the dislocations and lattice expansion (on the basis of XRD and[44 ]HRTEM) possibly due to milling, (a) The N /N ratio gives the fraction of nitrogen atoms exposed to the surface, (b) The C /C ratioE Total Q L
gives the fraction of quaternary carbon atoms (as shown in the model inset) with respect to the total number of lattice carbon atoms (C ).L
Figure 7Optical observation of the raw 80 100 mesh HPHT diamond. (a) HPHT microdiamond seen with the naked eye: initial (above) and after–electron irradiation (below), (b) Bright-field transmission image of the microdiamond after electron irradiation and annealing. (c) Image of the
microdiamond after electron irradiation and annealing recorded with a fluorescence microscope under green excitation (20 ms duration).
fabrication of fluorescent nanodiamonds
Nanotechnology . Author manuscript
Page /11 11
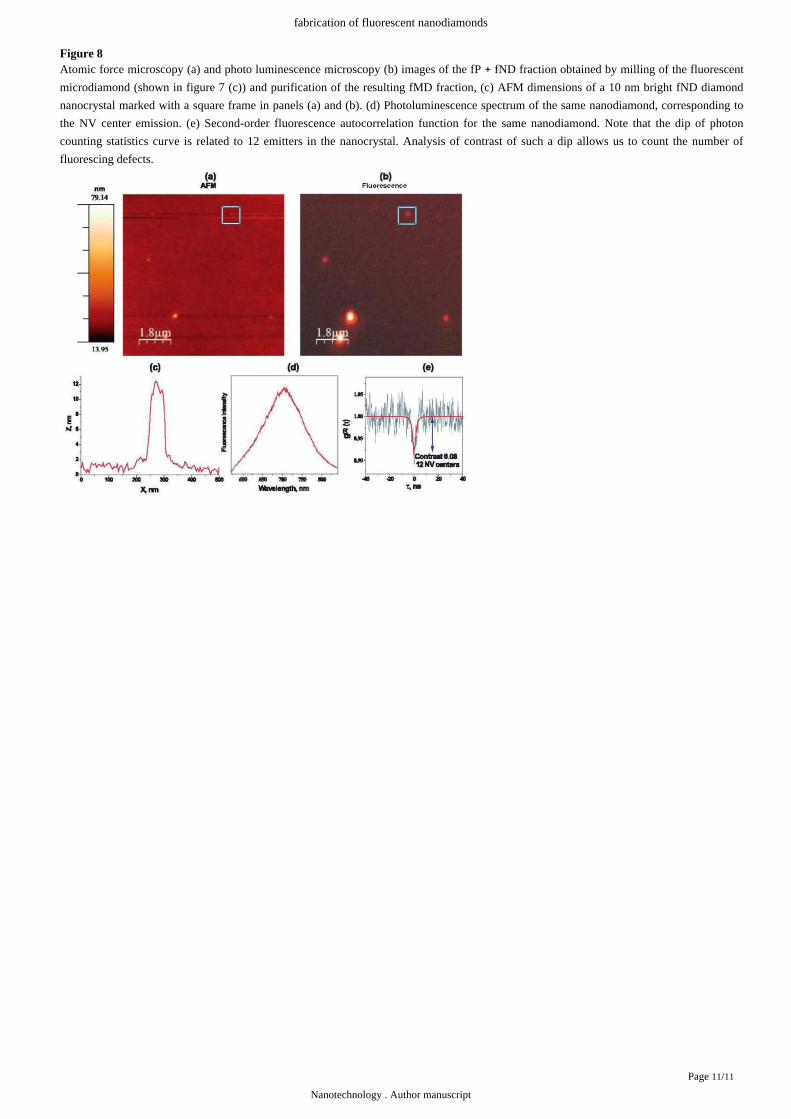
Figure 8Atomic force microscopy (a) and photo luminescence microscopy (b) images of the fP fND fraction obtained by milling of the fluorescent+microdiamond (shown in (c)) and purification of the resulting fMD fraction, (c) AFM dimensions of a 10 nm bright fND diamondfigure 7
nanocrystal marked with a square frame in panels (a) and (b). (d) Photoluminescence spectrum of the same nanodiamond, corresponding to
the NV center emission. (e) Second-order fluorescence autocorrelation function for the same nanodiamond. Note that the dip of photon
counting statistics curve is related to 12 emitters in the nanocrystal. Analysis of contrast of such a dip allows us to count the number of
fluorescing defects.
![Research Article Mechanistic Features of Nanodiamonds in ...downloads.hindawi.com/journals/tswj/2014/326427.pdfshape, and particle size distribution of nanodiamonds [ ,]. Nanodiamonds](https://img.pdfslide.us/doc/110x75/60d652e9c66bff789f39432c/research-article-mechanistic-features-of-nanodiamonds-in-shape-and-particle.jpg)